pease pfc testing program: final report · new hampshire department of health & human services...
TRANSCRIPT

New Hampshire Department of Health & Human Services
Pease PFC Testing Program: Final Report
Benjamin Chan, MD, MPH State Epidemiologist NH Department of Health & Human Services June 16, 2016

New Hampshire Department of Health & Human Services
PFOS, PFOA, and PFHxS were found in statistically higher levels in the Pease community compared to the general U.S. population
The absolute difference in mean levels is small: PFOS: 2.3 ppb difference
PFOA: 1.0 ppb difference
PFHxS: 2.8 ppb difference
There were not large differences in levels between children and adolescents/adults at Pease

New Hampshire Department of Health & Human Services
Levels of PFOS and PFOA are similar, if not lower, than levels found in the general U.S. population 10 years ago
Levels of PFOS, PFOA, and PFHxS are lower than other environmentally exposed communities and occupationally exposed workers
Other PFCs found in very low amounts

New Hampshire Department of Health & Human Services
Age, sex, and time spent on Pease were most consistently associated with serum PFC levels
Besides contaminated drinking water, likely many other unaccounted for factors contributing to serum PFC levels not evaluated in our brief questionnaire
Based on known sources of exposure, hand-to-mouth behavior is likely contributing to childhood exposure and could explain the higher levels seen in the 3-5 year old age group

New Hampshire Department of Health & Human Services
Review the final results of the Pease PFC serum testing
Provide a context to aide interpretation of individual test results
Address additional questions and concerns

New Hampshire Department of Health & Human Services
Lead: U.S. Air Force
EPA (Administrative Order)
NHDES (Waste Management Division)
Lead: NHDES (“Health Consultation” report)
Lead: ATSDR (Community Assistance Panel)
Lead: NH DHHS (PFC Serum Testing)
ATSDR (Technical Assistance)
Public
Health
Evaluation
Aquifer
Restoration
Human
Exposure
Assessment
ATSDR: Agency for Toxic Substances Disease Registry
EPA: U.S. Environmental Protection Agency
NHDES: New Hampshire Department of Environmental Services
NH DHHS: New Hampshire Department of Health & Human Services

New Hampshire Department of Health & Human Services
Assess individual exposure to PFCs at the community’s request
Not a health study and no medical information assessing health outcomes from PFC exposure was collected
PFC blood test does not tell a person where the PFCs came from, and is not able to tell someone whether there might be a health impact

New Hampshire Department of Health & Human Services
May 12 2014: Haven well was shut down after finding PFOA and PFOS levels above the EPA’s Provisional Health Advisory level.
April—October 2015: NH DHHS conducted blood sampling for PFC serum testing to assess exposure levels
Preliminary community meetings: June 2015: first 98 adult test results
Sept 2015: first 108 pediatric results

New Hampshire Department of Health & Human Services
Last individual PFC test results were mailed out in April 2016
May 2016: ATSDR formed the Community Assistance Panel (CAP) to help inform and plan for public health evaluation
June 16, 2016: Final PFC blood testing report released and community meeting held to discuss results

New Hampshire Department of Health & Human Services
Haven Well Harrison Well Smith Well
perfluorooctane sulfonic acid PFOS 2.50 0.05 0.02
perfluorooctanoic acid PFOA 0.35 0.009 0.004
perfluorohexane sulfonic acid PFHxS 0.83 0.04 0.01
perfluorononanoic acid PFNA 0.02 ND ND
perfluorodecanoic acid PFDeA 0.005 ND 0.004
perfluoroundecanoic acid PFUA ND ND 0.02
Perfluorododecanoic acid PFDoA ND ND 0.01
Perfluoropentanoic acid PFPtA 0.27 0.008 0.004
Perfluorobutane sulfonic acid PFBuS 0.05 0.002 0.0009
Perfluorohexanoic acid PFHxA 0.33 0.009 0.004
Perfluoroheptanoic acid PFHpA 0.12 0.005 0.003
PFC Levels in μg/L (ppb)PFC Name Abbreviation
2009 PFOS PHA: 0.2 μg/L
2009 PFOA PHA: 0.4 μg/L Note: 1 μg/L = 1 ng/mL = 1 ppb = 1000 ppt
ND = Not Detected
PHA = Provisional Health Advisory level (from 2009)
A full report on Pease drinking water testing can be found at:
http://www.cityofportsmouth.com/publicworks/phwn.html

New Hampshire Department of Health & Human Services
PFC Name PFC
Abbreviation CDC AXYS CA State
Perfluorooctane sulfonic acid PFOS X X X
Perfluorooctanoic acid PFOA X X X
Perfluorohexane sulfonic acid PFHxS X X X
Perfluorononanoic acid PFNA X X X
Perfluorodecanoic acid PFDeA X X X
Perfluoroundecanoic acid PFUA X X X
Perfluorooctane sulfonamide PFOSA X X X
2-(N-methyl-perfluorooctane sulfonamido) acetic acid Me-PFOSA-AcOH X X
2-(N-ethyl-perfluorooctane sulfonamido) acetic acid Et-PFOSA-AcOH X X
Perfluorobutane sulfonic acid PFBS X
Perfluoorododecanoic acid PFDoA X
Perfluoroheptanoic acid PFHpA X
CDC = Centers for Disease Control and Prevention laboratory
AXYS = AXYS Analytical Services laboratory
CA State = California State biomonitoring laboratory

New Hampshire Department of Health & Human Services
Serum PFC test results can be compared to other study populations including:
General U.S. adolescent/adult without a known exposure tested as part of the CDC’s National Health and Nutrition Examination Survey (NHANES)
Environmentally exposed communities
Occupationally exposed workers
There is not a serum PFC level at which a health problem is known or expected to occur.

New Hampshire Department of Health & Human Services
Serum PFC concentrations (reported in μg/L, or ppb)
Demographic information: age, sex
Exposure information: Time spent on Pease (cumulative years of exposure to contaminated water)
Time since last on Pease (lag time for exposure to contaminated water)
Average daily water consumption (amount of daily exposure to contaminated water)
Firefighting occupation (other source of exposure)

New Hampshire Department of Health & Human Services
Summary test statistics (geometric mean, Min/Max, 95th percentile, distribution graphs)
Assess for individual relationships between demographic (age and sex) or exposure (water consumption, time on Pease, etc) characteristics and serum PFC levels
Multivariate (multivariable) analysis (factoring in all demographic and exposure variables) simultaneously into a “linear regression model”.
New Hampshire Department of Health & Human Services
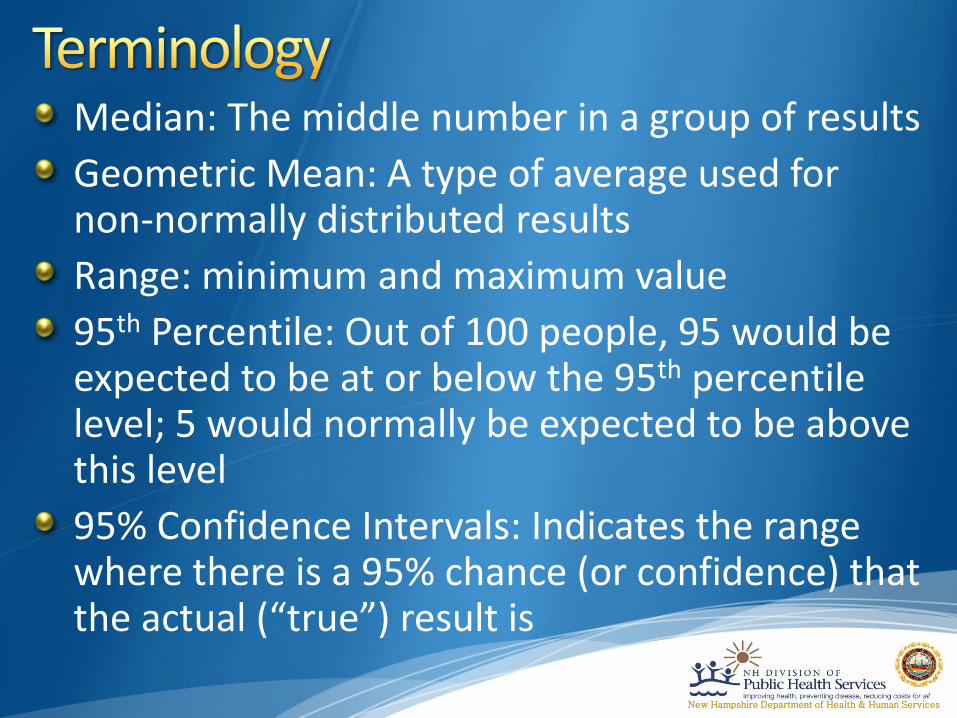
Median: The middle number in a group of results
Geometric Mean: A type of average used for non-normally distributed results
Range: minimum and maximum value
95th Percentile: Out of 100 people, 95 would be expected to be at or below the 95th percentile level; 5 would normally be expected to be above this level
95% Confidence Intervals: Indicates the range where there is a 95% chance (or confidence) that the actual (“true”) result is

New Hampshire Department of Health & Human Services
SUMMARY TEST STATISTICS

New Hampshire Department of Health & Human Services
N/A=not applicable, NT=not tested, NS= not shown to protect confidentiality, NC=Not Calculated.
* Geometric mean is significantly higher than NHANES comparison data,
¥ Geometric mean is significantly lower than NHANES comparison data.
PFC Tested Detection Frequency
%
Geometric Mean (μg/L)
Max (μg/L)
% Above NHANES 95th
Percentile
Geometric Mean (μg/L)
Max (μg/L)
95th Percentile
PFOS 99.8 8.59 * 95.6 9.1 6.31 235.0 21.7
PFOA 99.2 3.09 * 32 16.5 2.08 43.0 5.7
PFHxS 94.2 4.12 * 116 39.8 1.28 47.8 5.4
PFNA 85.2 0.73 ¥ 5.2 2.2 0.88 80.8 2.5
PFDeA 42.1 0.22 5.6 1.6 0.20 17.8 0.7
PFUA 30.0 0.19 1.6 1.2 NC 7.0 0.6
PFOSA 2.0 0.13 0.4 N/A NC 0.6 <0.1
Me-PFOSA-AcOH 36.1 0.09 1.58 2.1 NC 4.3 0.7
Et-PFOSA-AcOH 2.6 0.06 0.51 1.0 NC 0.7 0.1
PFBS 18.7 0.04 0.24 N/A NC 0.8 <0.1
PFDoA 4.7 0.08 0.31 2.8 NC 1.4 0.1
PFHpA 0.9 0.07 0.39 NS NC 1.6 0.2
PEASE TRADEPORT NHANES, 2011-2012

New Hampshire Department of Health & Human Services
Ages 12 and Older
PFC Tested Geometric Mean (μg/L)
Max (μg/L)
% Above NHANES 95th
Percentile
Geometric Mean (μg/L)
Max (μg/L)
95th Percentile
PFOS 8.74 * 95.6 10.2 6.31 235.0 21.7
PFOA 2.99 * 32.0 15.7 2.08 43.0 5.7
PFHxS 4.21 * 116.0 39.4 1.28 47.8 5.4
PFNA 0.68 ¥ 4.9 1.1 0.88 80.8 2.5
PFDeA 0.22 5.6 1.9 0.20 17.8 0.7
PFUA 0.19 1.6 1.6 NC 7.0 0.6
PFOSA 0.12 0.35 N/A NC 0.6 <0.1
Me-PFOSA-AcOH 0.09 1.58 1.3 NC 4.3 0.7
Et-PFOSA-AcOH 0.06 0.4 1.0 NC 0.7 0.1
PFBS NC NS N/A NC 0.8 <0.1
PFDoA NC NS NS NC 1.4 0.1
PFHpA NC NS NS NC 1.6 0.2
PEASE TRADEPORT NHANES, 2011-2012
N/A=not applicable, NT=not tested, NS= not shown to protect confidentiality, NC=Not Calculated.
* Geometric mean is significantly higher than NHANES comparison data,
¥ Geometric mean is significantly lower than NHANES comparison data.

New Hampshire Department of Health & Human Services
Ages 11 and Younger
PFC Tested Geometric Mean (μg/L)
Max (μg/L)
% Above NHANES 95th
Percentile
Geometric Mean (μg/L)
Max (μg/L)
95th Percentile
PFOS 8.11 * 30.8 5.2 6.31 235.0 21.7
PFOA 3.43 * 12.0 19.4 2.08 43.0 5.7
PFHxS 3.83 * 31.7 41.3 1.28 47.8 5.4
PFNA 0.92 5.2 6.0 0.88 80.8 2.5
PFDeA 0.23 0.7 0.6 0.20 17.8 0.7
PFUA 0.18 0.5 0.0 NC 7.0 0.6
PFOSA 0.17 0.4 N/A NC 0.6 <0.1
Me-PFOSA-AcOH 0.10 1.3 5.5 NC 4.3 0.7
Et-PFOSA-AcOH 0.07 0.5 1.2 NC 0.7 0.1
PFBS NC NS N/A NC 0.8 <0.1
PFDoA NC NS NS NC 1.4 0.1
PFHpA NC NS NS NC 1.6 0.2
PEASE TRADEPORT NHANES, 2011-2012
N/A=not applicable, NT=not tested, NS= not shown to protect confidentiality, NC=Not Calculated.
* Geometric mean is significantly higher than NHANES comparison data.

New Hampshire Department of Health & Human Services
NHANES=National Health and Nutrition Examination Survey, 2011-2012 data * Indicates a statistically significant difference compared to NHANES † Indicates a statistically significant difference comparing Pease children to Pease adolescents & adults

New Hampshire Department of Health & Human Services
NHANES
Geo Mean
NHANES 95th
Percentile

New Hampshire Department of Health & Human Services
NHANES
Geo Mean
NHANES 95th
Percentile

New Hampshire Department of Health & Human Services
NHANES
Geo Mean
NHANES 95th
Percentile

New Hampshire Department of Health & Human Services
NHANES
Geo Mean
NHANES 95th
Percentile

New Hampshire Department of Health & Human Services

New Hampshire Department of Health & Human Services

New Hampshire Department of Health & Human Services

New Hampshire Department of Health & Human Services

New Hampshire Department of Health & Human Services

New Hampshire Department of Health & Human Services

New Hampshire Department of Health & Human Services

New Hampshire Department of Health & Human Services

New Hampshire Department of Health & Human Services
* Reports on arithmetic mean serum concentration (instead of geometric mean). Arithmetic mean is usually higher
than the geometric mean. All other studies report geometric mean serum concentration.
Study Population Years Blood Tested # Participants Reference
3M workers(PFOS and PFOA) 2000 263 Olsen GW, et al. Epidemiologic assessment of worker serum
perfluorooctanesulfonate (PFOS) and perfluorooctanoate (PFOA)
concentrations and medical surveillance examinations. J Occup Environ Med.
2003;45(3):260-270.
3M workers (PFHxS)* 2004 26 Olsen GW, et al. Half-life of serum elimination of
perfluorooctanesulfonate,perfluorohexanesulfonate, and perfluorooctanoate
in retired fluorochemical production workers. Environ Health Perspect.
2007;115(9):1298-1305.
Dupont workers* 2004 1025 Sakr CJ, et al. Cross-sectional study of lipids and liver enzymes related to a
serum biomarker of exposure (ammonium perfluorooctanoate or APFO) as
part of a general health survey in a cohort of occupationally exposed workers.
J Occup Environ Med. Oct 2007;49(10):1086-1096.
Ohio River Valley 2005-2006 69,030 Frisbee et al. The C8 Health Project: Design, methods, and participants. Env
Health Persp 2009;117(12):1873-82.
Decatur, Alabama 2009 153 ATSDR. Exposure Investigation Report: PFC serum sampling in the vicinity of
Decatur, AL Morgan, Lawrence, and Limestone Counties. Apr 2013. Accessed
at:
http://www.atsdr.cdc.gov/HAC/pha/Decatur/Perfluorochemical_Serum%20Sa
mpling.pdfEast Metro Minnesota pilot 2008-2009 196 Minnesota Dept of Health. East Metro PFC biomonitoring pilot project. Jul
2009. Accessed at:
http://www.health.state.mn.us/divs/hpcd/tracking/biomonitoring/projects/pf
cfinalrpt2009.pdf
Red Cross donors 2006 600 Olsen GW, et al. Decline in PFOS and other PFCs in American Red Cross adult
blood donors, 2000-2006. Enciron Sci Technol. 2008;42:4989-4995.
NHANES 2005-2006
2011-2012
2120
1904CDC. Fourth National report on human exposure to environmental chemicals.
Feb 2015. Accessed at: http://www.cdc.gov/exposurereport/
Note: Compares Geometric Mean, unless otherwise noted*

New Hampshire Department of Health & Human Services
* Reports on arithmetic mean serum concentration (instead of geometric mean). Arithmetic mean is usually higher
than the geometric mean. All other studies report geometric mean serum concentration.
Study Population Years Blood Tested # Participants Reference
3M workers(PFOS and PFOA) 2000 263 Olsen GW, et al. Epidemiologic assessment of worker serum
perfluorooctanesulfonate (PFOS) and perfluorooctanoate (PFOA)
concentrations and medical surveillance examinations. J Occup Environ Med.
2003;45(3):260-270.
3M workers (PFHxS)* 2004 26 Olsen GW, et al. Half-life of serum elimination of
perfluorooctanesulfonate,perfluorohexanesulfonate, and perfluorooctanoate
in retired fluorochemical production workers. Environ Health Perspect.
2007;115(9):1298-1305.
Dupont workers* 2004 1025 Sakr CJ, et al. Cross-sectional study of lipids and liver enzymes related to a
serum biomarker of exposure (ammonium perfluorooctanoate or APFO) as
part of a general health survey in a cohort of occupationally exposed workers.
J Occup Environ Med. Oct 2007;49(10):1086-1096.
Ohio River Valley 2005-2006 69,030 Frisbee et al. The C8 Health Project: Design, methods, and participants. Env
Health Persp 2009;117(12):1873-82.
Decatur, Alabama 2009 153 ATSDR. Exposure Investigation Report: PFC serum sampling in the vicinity of
Decatur, AL Morgan, Lawrence, and Limestone Counties. Apr 2013. Accessed
at:
http://www.atsdr.cdc.gov/HAC/pha/Decatur/Perfluorochemical_Serum%20Sa
mpling.pdfEast Metro Minnesota pilot 2008-2009 196 Minnesota Dept of Health. East Metro PFC biomonitoring pilot project. Jul
2009. Accessed at:
http://www.health.state.mn.us/divs/hpcd/tracking/biomonitoring/projects/pf
cfinalrpt2009.pdf
Red Cross donors 2006 600 Olsen GW, et al. Decline in PFOS and other PFCs in American Red Cross adult
blood donors, 2000-2006. Enciron Sci Technol. 2008;42:4989-4995.
NHANES 2005-2006
2011-2012
2120
1904CDC. Fourth National report on human exposure to environmental chemicals.
Feb 2015. Accessed at: http://www.cdc.gov/exposurereport/
Occupationally
Exposed
Environmentally
Exposed
General Population
Note: Compares Geometric Mean, unless otherwise noted*

New Hampshire Department of Health & Human Services
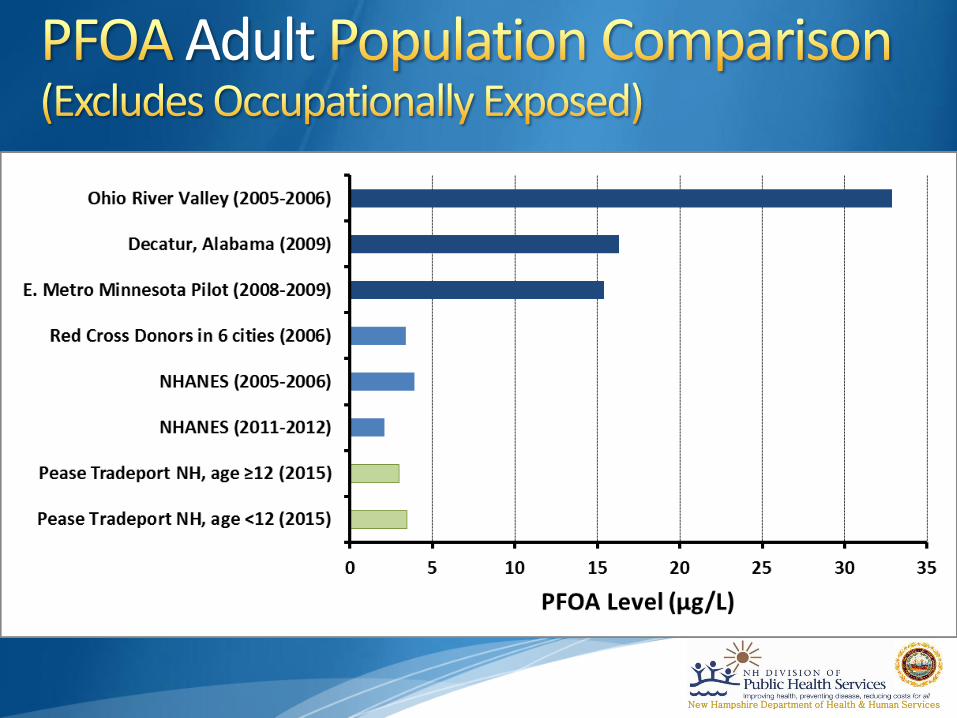
Adult

New Hampshire Department of Health & Human Services
Adult

New Hampshire Department of Health & Human Services
Adult
* Indicates Arithmetic mean reported (instead of geometric mean). Arithmetic mean is usually higher
than the geometric mean.
New Hampshire Department of Health & Human Services
Adult

New Hampshire Department of Health & Human Services
Adult
* Indicates Arithmetic mean reported (instead of geometric mean). Arithmetic mean is usually higher
than the geometric mean.

New Hampshire Department of Health & Human Services
Adult

New Hampshire Department of Health & Human Services
Adult

New Hampshire Department of Health & Human Services
Location Years Blood Tested # Participants Age Range (years) Reference
Ohio River Valley (PFOA water
contamination)
2005-2006 ? <12 Frisbee et al. The C8 Health Project: Design, methods, and
participants. Env Health Persp 2009;117(12):1873-82.
23 States + D.C. 1994-1995 598 2-12 Olsen et al. Quantitative Evaluation of
Perfluorooctanesulfonate (PFOS) and Other Fluorochemicals
in the Serum of Children. J Child Health 2004;2(1):53-76.
Greater Cincinati 2005-2007 353 6-8 Pinney SM, et al. Serum Biomarkers of Polyfluoroalkyl
Compound Exposure in Young Girls in Greater Cincinnati and
the San Francisco Bay
Area, USA. Environ Pollut 2014;184:327-34.
San Francisco Bay 2005-2009 351 6-8 Pinney SM, et al. Serum Biomarkers of Polyfluoroalkyl
Compound Exposure in Young Girls in Greater Cincinnati and
the San Francisco Bay
Area, USA. Environ Pollut 2014;184:327-34.
Northern California 2008-2009 68 2-8 Wu et al. Serum concentrations of perfluorinated compounds
(PFC) among selected populations of children and Adults in
California. Environ Res 2015; 136:264-73.
Texas* 2009 300 0-12 Schecter et al. Polyfluoroalkyl Compounds in Texas Children
from Birth through 12 Years of Age. Environ Health Perspect
2012;120:590-594.
* Reports on median serum concentration. All other studies report geometric
mean serum concentrations.
PFOA Exposed
General
Population

New Hampshire Department of Health & Human Services
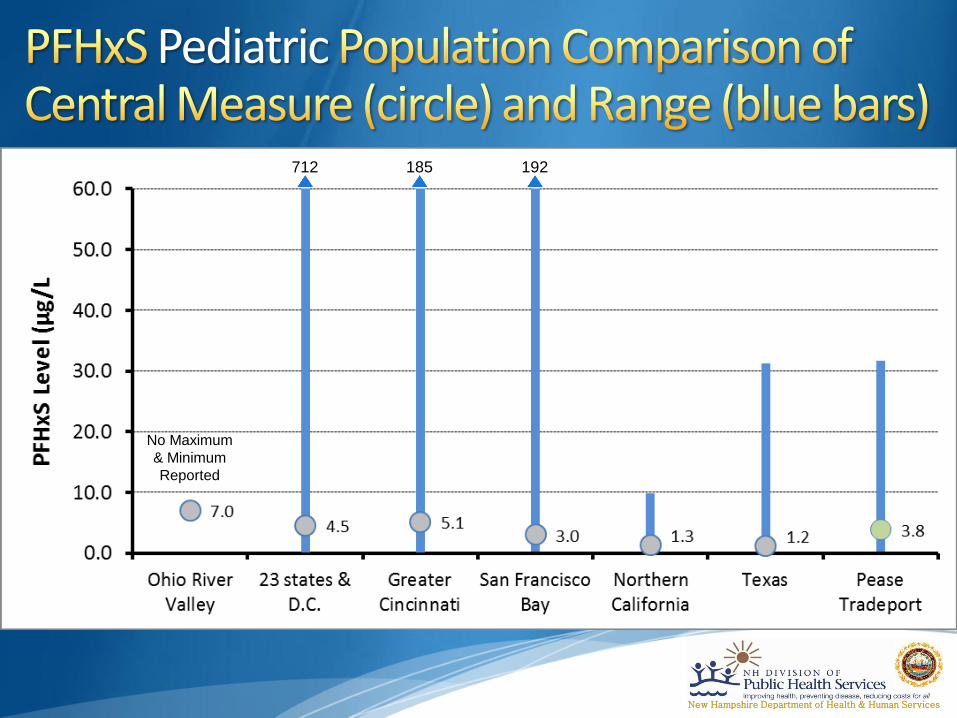
Pediatric
No Maximum
& Minimum
Reported
515 Maximum
Minimum
Mean Median

New Hampshire Department of Health & Human Services
Pediatric
No Maximum
& Minimum
Reported
515

New Hampshire Department of Health & Human Services
Pediatric
No Maximum
& Minimum
Reported
New Hampshire Department of Health & Human Services
Pediatric
712 185 192
No Maximum
& Minimum
Reported

New Hampshire Department of Health & Human Services
Pediatric
No Maximum
& Minimum
Reported

New Hampshire Department of Health & Human Services
ANALYSIS OF INDIVIDUAL DEMOGRAPHIC AND EXPOSURE CHARACTERISTICS
New Hampshire Department of Health & Human Services
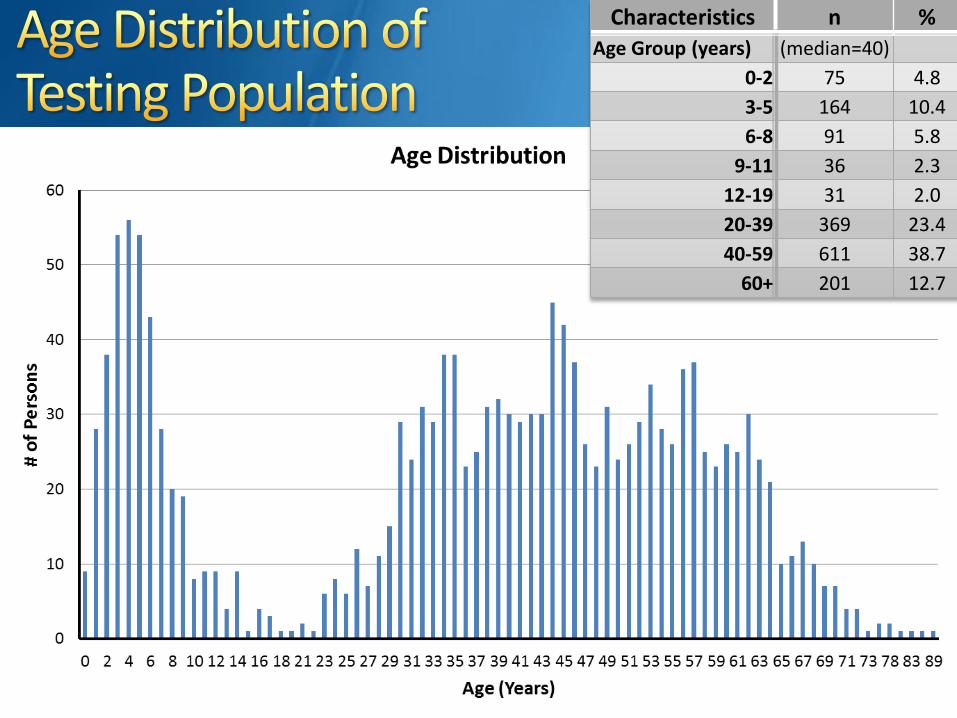
Characteristics n %
Age Group (years) (median=40)
0-2 75 4.8
3-5 164 10.4
6-8 91 5.8
9-11 36 2.3
12-19 31 2.0
20-39 369 23.4
40-59 611 38.7
60+ 201 12.7

New Hampshire Department of Health & Human Services
*
*
*
*
*
* *
* Indicates a significantly higher mean concentration compared to youngest age group (0-2 years).
Note: the age groups 9-39 for PFOA and 12-39 for PFNA are significantly lower compared to
youngest age group.
(Years Old)

New Hampshire Department of Health & Human Services

New Hampshire Department of Health & Human Services
* Indicates a significantly higher mean concentration compared to females
Characteristics n %
Sex
Male 639 40.1
Female 856 54.3
Unknown 83 5.3

New Hampshire Department of Health & Human Services
* Indicates a significantly higher mean concentration compared with
lowest water consumption group (0-3 cups/day)
Characteristics n %
Water Consumption
(cups per day)
(median=4)
<4 572 36.3
4-7 539 34.2
8+ 227 14.4
Unknown 240 15.2

New Hampshire Department of Health & Human Services
Characteristics n %
Time Spent on
Pease (years)
(median=6.5)
<1 75 4.8
1-4 429 27.2
5-9 378 24.0
10-19 318 20.2
20+ 88 5.6
Unknown 290 18.4
* *
*
* * * *
*
*
*
* Indicates a significantly higher mean concentration compared with
group with lowest number of years spent on Pease (<1 years)

New Hampshire Department of Health & Human Services

New Hampshire Department of Health & Human Services
Characteristics n %
Time Since Last on
Pease (years)
(median=0.0)
<1 948 60.1
1-4 144 9.1
5-9 88 5.6
10-19 74 4.7
20+ 34 2.2
Unknown 290 18.4

New Hampshire Department of Health & Human Services
* Indicates a significantly higher mean concentration in firefighters
compared with those who did not report firefighting work
Characteristics n %
Firefighter (yes) 98 6.2

New Hampshire Department of Health & Human Services
MULTIVARIATE (MULTIPLE VARIABLE) ANALYSIS USING LINEAR REGRESSION MODELING

New Hampshire Department of Health & Human Services
PFOS: Age
Sex (male)
Time spent on Pease
PFOA: (stratified by age due to “interaction”) Sex (significant for age groups 20-39 and 40-59)
Time spent on Pease (significant for age groups 20-39 and 40-59)

New Hampshire Department of Health & Human Services
PFHxS: (stratified by age due to “interaction”) Sex (significant for age groups 20-39 and 40-59)
Time spent on Pease (significant for age groups 20-39, 40-59, and 60+)
Water consumption (significant for age groups 0-19, 20-39, and 40-59)
Time since last on Pease (significant for age groups 0-19, 20-39)
PFNA: Sex (male)

New Hampshire Department of Health & Human Services
Age, sex, and Time Spent on Pease seem to be most consistently associated with serum PFC levels
Data quality is a limitation
Multiple other exposures and factors related to PFC level that are unaccounted for in our analysis

New Hampshire Department of Health & Human Services
Association between male sex and PFC levels is well described in the scientific literature (not unique to Pease)
Association with age (especially in children), may indicate age-related behaviors that predispose children to PFC exposure (i.e. hand-to-mouth behavior)

New Hampshire Department of Health & Human Services List Produced by CDC/ATSDR
Commercial Products Industrial Uses
Cookware (Teflon®, Nonstick)
Fast Food Containers
Candy Wrappers
Microwave Popcorn Bags
Personal Care Products (Shampoo, Dental Floss)
Cosmetics (Nail Polish, Eye Makeup)
Paints and Varnishes
Stain Resistant Carpet
Stain Resistant Chemicals (Scotchgard®)
Water Resistant Apparel (Gore-Tex®)
Cleaning Products
Electronics
Ski Wax
Photo Imaging
Metal Plating
Semiconductor Coatings
Aviation Hydraulic Fluids
Medical Devices
Firefighting Aqueous Film-Forming Foam
Insect Baits
Printer and Copy Machine Parts
Chemically Driven Oil Production
Textiles, Upholstery, Apparel and Carpets
Paper and Packaging
Rubber and Plastics

New Hampshire Department of Health & Human Services
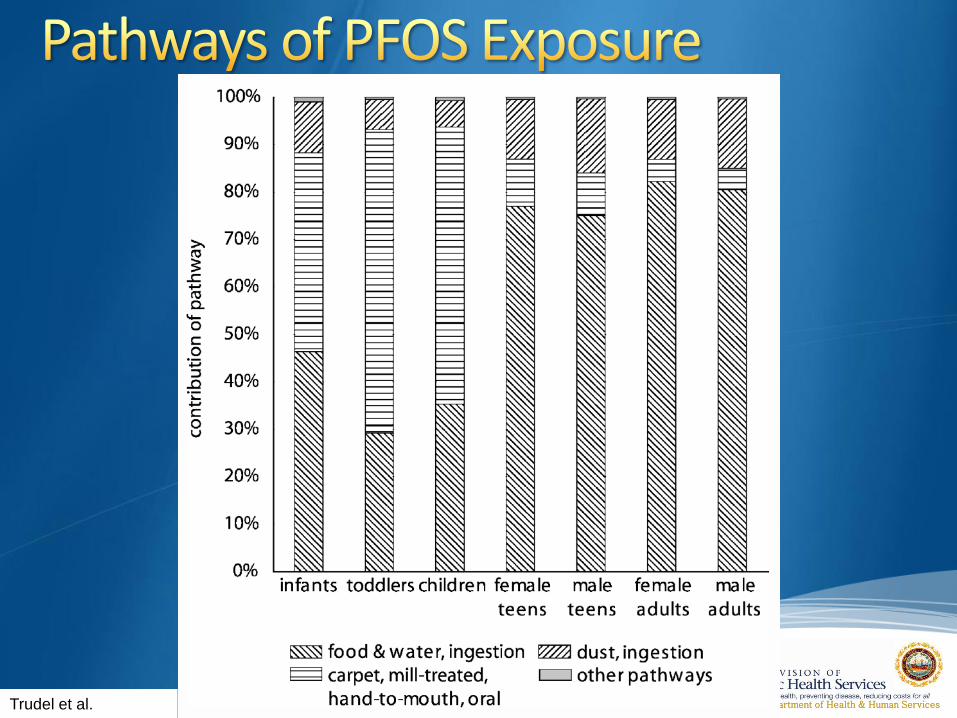
Assess the total daily exposure to PFOS and PFOA via various pathways
7 age groups Infants (age 0-1)
Toddlers (age 1-4)
Children (age 5-11)
Teenagers, male & female (age 12-20)
Adults, male & female (age >20)
Trudel et al. Estimating Consumer Exposure to PFOS and PFOA. Risk Analysis.
2008;28(2):251-69.
New Hampshire Department of Health & Human Services
Trudel et al.

New Hampshire Department of Health & Human Services
Trudel et al.

New Hampshire Department of Health & Human Services
Consumption of food is the most important pathway for exposure to PFOA/PFOS (includes migration of PFCs into food from boxes and packaging)
Ingestion of contaminated dust is a significant source of exposure (carpets, upholstery, clothing)
In infants, toddlers, and children, hand-to-mouth contact with treated carpets is a significant exposure
Trudel et al. Estimating Consumer Exposure to PFOS and PFOA. Risk Analysis.
2008;28(2):251-69.

New Hampshire Department of Health & Human Services
PFOS, PFOA, and PFHxS were found in statistically higher levels in the Pease community compared to the general U.S. population
The absolute difference in mean levels is small: PFOS: 2.3 ppb difference
PFOA: 1.0 ppb difference
PFHxS: 2.8 ppb difference
There were not large differences in levels between children and adolescents/adults at Pease

New Hampshire Department of Health & Human Services
Levels of PFOS and PFOA are similar, if not lower, than levels found in the general U.S. population 10 years ago
Levels of PFOS, PFOA, and PFHxS are lower than other environmentally exposed communities and occupationally exposed workers
Other PFCs found in very low amounts

New Hampshire Department of Health & Human Services
Age, sex, and time spent on Pease were most consistently associated with serum PFC levels
Besides contaminated drinking water, likely many other unaccounted for factors contributing to serum PFC levels not evaluated in our brief questionnaire
Based on known sources of exposure, hand-to-mouth behavior is likely contributing to childhood exposure and could explain the higher levels seen in the 3-5 year old age group

New Hampshire Department of Health & Human Services
ADDITIONAL COMMENTS

New Hampshire Department of Health & Human Services
The purpose of the PFC testing was to provide individuals more information about their level of exposure
ATSDR has formed a Community Assistance Panel (CAP) to help address health concerns
We have shared serum PFC test results with ATSDR as they plan for further health evaluation
We will continue to work with ATSDR to support and be involved in their efforts

New Hampshire Department of Health & Human Services
Talk to your healthcare provider about any health concerns you have
Monitoring of your health should be conducted through your healthcare provider
Healthcare providers are the most appropriate person to decide whether additional steps should be taken to monitor your health
We are in the process of engaging healthcare providers further to support them

New Hampshire Department of Health & Human Services
There is no medically approved or appropriate way to remove PFCs faster from your body
Your body will remove PFCs slowly over time after exposure is stopped
There is no recommendation to re-test blood for PFCs in the future because of the limited health information obtained from PFC blood testing and the expectation that levels should slowly decline over time

New Hampshire Department of Health & Human Services
Questions or concerns can be directed to the NH DHHS Inquiry Line: 603-271-9461
Questions specific to individuals’ test results can be directed to the Northern New England Poison Center: 1-800-562-8236
Frequently Asked Questions (FAQs) about PFCs can be found on the NH DHHS website: http://www.dhhs.nh.gov/dphs/investigation-pease.htm
The full final Pease PFC blood testing report can be downloaded on our website: http://www.dhhs.nh.gov/dphs/documents/pease-pfc-blood-testing.pdf

New Hampshire Department of Health & Human Services