pebble flow experiments for pebble bed reactors - mitweb.mit.edu/pebble-bed/papers1_files/beijing...
TRANSCRIPT

Pebble Flow Experiments for Pebble Bed Reactors
Andrew C. KadakMartin Z. Bazant (mathematics)
Massachusetts Institute of TechnologyNuclear Engineering Department
2nd International Topical Meeting on High Temperature Reactor Technology
Beijing, ChinaSeptember 22-24, 2004

Determination of Pebble Bed Reactor Dynamics through Experimentation and
Modeling
22.033/22.33 Spring 2002May 16, 2002

Basis of The ProjectBasis of The Project
•• Modeling the path of granular flow Modeling the path of granular flow through a Pebblethrough a Pebble--Bed Reactor.Bed Reactor.
•• PBMR: Pebble Bed Modular Reactor, an PBMR: Pebble Bed Modular Reactor, an experimental commercial nuclear reactor experimental commercial nuclear reactor design.design.
•• A PBMR operates using 360,000 small A PBMR operates using 360,000 small spheres of graphitespheres of graphite--coated uranium or coated uranium or pure graphite, instead of traditional fuel pure graphite, instead of traditional fuel rod assemblies.rod assemblies.


““The ProblemThe Problem””
•• The PBMR has two types of pebbles that flow The PBMR has two types of pebbles that flow through the core: graphite reflector pebbles through the core: graphite reflector pebbles and Uand U--235 fuel pebbles.235 fuel pebbles.
•• In order to prevent power peaking in the fuel In order to prevent power peaking in the fuel pebbles, a fixed radial distribution of these pebbles, a fixed radial distribution of these two pebble columns must be maintained two pebble columns must be maintained throughout the height of the core as the throughout the height of the core as the pebbles cycle through.pebbles cycle through.

Radial Fuel DistributionRadial Fuel Distribution
•• A central core of A central core of pure graphite pure graphite reflector pebbles is reflector pebbles is surrounded by an surrounded by an annulus of a 50/50 annulus of a 50/50 fuelfuel--andand--reflector reflector mix, and a larger mix, and a larger annulus of pure fuel annulus of pure fuel pebbles.pebbles.

Flow DiffusionFlow Diffusion
•• Several mathematical Several mathematical models for granular models for granular flow exist, with different flow exist, with different amounts of diffusion amounts of diffusion and different velocity and different velocity profiles.profiles.
•• The neutron physics of The neutron physics of the core relies on the the core relies on the assumption of laminar assumption of laminar flow and low diffusion flow and low diffusion levels during flow down.levels during flow down.

Dropping DiffusionDropping Diffusion
•• The radial spread of The radial spread of pebbles dropped pebbles dropped into the core is also into the core is also an important factor an important factor in keeping the fixed in keeping the fixed radial distribution of radial distribution of the pebbles, as the pebbles, as refueling is onrefueling is on--line line during reactor during reactor operation.operation.

The ProjectThe Project
•• To identify key variables in both core flow To identify key variables in both core flow and pebble dropping in the PBMRand pebble dropping in the PBMR
•• To formulate mathematical models which To formulate mathematical models which accurately describe the motion of the accurately describe the motion of the pebbles as a function of those key pebbles as a function of those key variablesvariables
•• To design, build and run scaled test rigsTo design, build and run scaled test rigs•• To use experimental data to further To use experimental data to further
develop modeling and understanding of develop modeling and understanding of granular flow in the PBMRgranular flow in the PBMR

Key Objectives
• To investigate whether pebble flow in the core is characterized by well-defined streamlines or by random mixing
• To study the factors which determine the formation of graphite annulus and the degree of mixing.

MultiMulti--Faceted ApproachFaceted Approach
•• To model pebble flow To model pebble flow through the core, we through the core, we wanted a 2wanted a 2--D, halfD, half--core core model with a flat model with a flat viewing window to viewing window to obtain visual obtain visual confirmation of data. confirmation of data. However, we couldnHowever, we couldn’’t t be sure the boundary be sure the boundary effects of the viewing effects of the viewing window would not window would not change flow from real, change flow from real, 33--D conditions.D conditions.
•• Therefore we pursued Therefore we pursued in parallel a 3in parallel a 3--D, fullD, full--core model using core model using gamma ray imaging to gamma ray imaging to track the paths of tracer track the paths of tracer balls in real 3balls in real 3--D D conditions. These paths conditions. These paths would be compared to would be compared to the 2the 2--D data to D data to determine if the halfdetermine if the half--core model gave results core model gave results indicative of true flow in indicative of true flow in 33--D conditions.D conditions.

MultiMulti--Faceted ApproachFaceted Approach
•• In addition, detailed In addition, detailed separate experiments separate experiments were conducted on were conducted on pebblepebble--dropping to dropping to simulate the creation of simulate the creation of a radial mixing zone a radial mixing zone during the onduring the on--line line refueling process. This refueling process. This determined if the determined if the required radial required radial distribution could be distribution could be formed at the top of the formed at the top of the core during operation.core during operation.
•• In sum, three In sum, three separate experiments separate experiments were conducted to were conducted to obtain a complete set obtain a complete set of data:of data:
•• 22--D Visual HalfD Visual Half--ModelModel•• 33--D FullD Full--Model with Model with
Gamma Ray ImagingGamma Ray Imaging•• PebblePebble--Dropping Dropping
DispersionDispersion

Key Parameters of InterestKey Parameters of Interest
Core FlowCore Flow::•• Geometrical ParametersGeometrical Parameters
–– Drain Hole DiameterDrain Hole Diameter–– Cone AngleCone Angle–– Pebble DiameterPebble Diameter–– Height of the Fuel ColumnHeight of the Fuel Column
•• Refueling EffectsRefueling Effects•• Material PropertiesMaterial Properties
–– DensityDensity–– YoungYoung’’s Moduluss Modulus–– PoissonPoisson’’s Ratios Ratio–– FrictionFriction
PebblePebble--DroppingDropping::•• Material PropertiesMaterial Properties
–– DensityDensity–– YoungYoung’’s Moduluss Modulus–– PoissonPoisson’’s Ratios Ratio–– FrictionFriction–– Coefficient of RestitutionCoefficient of Restitution
•• Height of DropHeight of Drop•• Angle of ReposeAngle of Repose•• Pebble SizePebble Size

Outline of PresentationOutline of Presentation
•• Mathematical Modeling (not discussed)Mathematical Modeling (not discussed)•• Experimental ScalingExperimental Scaling•• Fast Vs Slow FlowFast Vs Slow Flow•• Shaping Ring for Central ColumnShaping Ring for Central Column•• ResultsResults•• Summary: Conclusions and the FutureSummary: Conclusions and the Future

MD Simulation

Relaxed Scaling for Pebble Dispersion, Pebble Bouncing on a Hard Floor
Crh
RH
=⎟⎠⎞
⎜⎝⎛=⎟
⎠⎞
⎜⎝⎛
It can be shown that the Only Condition Needed To Meet the AboveRequirement, is to have the Same Coefficient of Restitution (e0 = es ) in Both Systems
Primary Objective:
H
eoU0
R
h
r
esu0
Original System
Scaled System
eo2 U0
es2u0
Experimental Results
• Preliminary Findings (Coke Bottle Model)• One-Tenth Scaled Half Model with Visual
Analysis• One-Tenth Scaled Full Model with
Gamma Imaging Analysis• Ball-Dropping and Pebble Pile Formation

Preliminary Experimentation
Coke Bottle Model:
-Feasibility of Half Model
- Preliminary streamline data concerning central graphite column
- Frictional Effects

Half Model Design
81
28.5
12
Measurements in centimeters

Pebble Specifications
• AirSoft® Air Rifle Pellets
• Composed of ASB plastic, very regular
• 6 mm diameter• 1.2 g• Full Model: ~470,000• Half Model: ~175,000

Half Model Runs (9 Total)• 60° Cone Angle
– 3.6 cm exit diameter• 2 runs, 1 with and 1 without refilling• 2 runs, 1 with and 1 without refilling, equal time steps
• 30° Cone Angle– 4 cm exit diameter
• 2 runs, 1 with and 1 without refilling, equal time steps– 7 cm exit diameter
• 1 run with refilling, equal time steps• 1 run with graphite column, no refilling, no stopping
– 3 cm exit diameter• 1 run with refilling

Half Model Data Collection

0
10
20
30
40
50
60
70
80
90
0 5 10 15 20 25 30Width (cm)
Hei
ght (
cm)
0
10
20
30
40
50
60
70
80
90
0 5 10 15 20 25 30Width (cm)
Hei
ght (
cm)
0
10
20
30
40
50
60
70
80
90
0 5 10 15 20 25 30Width (cm)
Hei
ght (
cm)
0
10
20
30
40
50
60
70
80
90
0 5 10 15 20 25 30Width (cm)
Hei
ght (
cm)
0
10
20
30
40
50
60
70
80
90
0 5 10 15 20 25 30Width (cm)
Hei
ght (
cm)
0
10
20
30
40
50
60
70
80
90
0 5 10 15 20 25 30Width (cm)
Hei
ght (
cm)
0
10
20
30
40
50
60
70
80
90
0 5 10 15 20 25 30Width (cm)
Hei
ght (
cm)
0
10
20
30
40
50
60
70
80
90
0 5 10 15 20 25 30Width (cm)
Hei
ght (
cm)
0
10
20
30
40
50
60
70
80
90
0 5 10 15 20 25 30Width (cm)
Hei
ght (
cm)
0
10
20
30
40
50
60
70
80
90
0 5 10 15 20 25 30Width (cm)
Hei
ght (
cm)
0
10
20
30
40
50
60
70
80
90
0 5 10 15 20 25 30Width (cm)
Hei
ght (
cm)
0
10
20
30
40
50
60
70
80
90
0 5 10 15 20 25 30Width (cm)
Hei
ght (
cm)
0
10
20
30
40
50
60
70
80
90
0 5 10 15 20 25 30Width (cm)
Hei
ght (
cm)
0
10
20
30
40
50
60
70
80
90
0 5 10 15 20 25 30Width (cm)
Hei
ght (
cm)
0
10
20
30
40
50
60
70
80
90
0 5 10 15 20 25 30Width (cm)
Hei
ght (
cm)
0
10
20
30
40
50
60
70
80
90
0 5 10 15 20 25 30Width (cm)
Hei
ght (
cm)
0
10
20
30
40
50
60
70
80
90
0 5 10 15 20 25 30Width (cm)
Hei
ght (
cm)
0
10
20
30
40
50
60
70
80
90
0 5 10 15 20 25 30Width (cm)
Hei
ght (
cm)
0
10
20
30
40
50
60
70
80
90
0 5 10 15 20 25 30Width (cm)
Hei
ght (
cm)
0
10
20
30
40
50
60
70
80
90
0 5 10 15 20 25 30Width (cm)
Hei
ght (
cm)
0
10
20
30
40
50
60
70
80
90
0 5 10 15 20 25 30Width (cm)
Hei
ght (
cm)
0
10
20
30
40
50
60
70
80
90
0 5 10 15 20 25 30Width (cm)
Hei
ght (
cm)
0
10
20
30
40
50
60
70
80
90
0 5 10 15 20 25 30Width (cm)
Hei
ght (
cm)
0
10
20
30
40
50
60
70
80
90
0 5 10 15 20 25 30Width (cm)
Hei
ght (
cm)
0
10
20
30
40
50
60
70
80
90
0 5 10 15 20 25 30Width (cm)
Hei
ght (
cm)
3.6 cm Exit, 60°, Time Step

5
10
15
20
25
30
35
40
45
50
55
60
65
70
75
80
0 10 20 30
Width (cm)
Hei
ght(
cm)
5
10
15
20
25
30
35
40
45
50
55
60
65
70
75
80
0 10 20 30
Width (cm)
Hei
ght (
cm)
Effect of Exit Diameter30°, 4 cm exit 30°, 7 cm exit To Notice:
- Same Angle, different exit diameters
- Equal time steps (5 seconds)
- As expected, a larger hole means faster flow
- Straight Streamlines

0
10
20
30
40
50
60
70
80
90
0 5 10 15 20 25 30Width (cm)
Hei
ght (
cm)
0
10
20
30
40
50
60
70
80
90
0 10 20 30
To Notice:
- Both 60°, 3.6 cm exit diameter, but 1 with refilling and 1 without refilling
-Approx. same velocities
-Straight Streamlines in both
with Refillingw/o Refilling
Effect of Refilling

0
10
20
30
40
50
60
70
80
90
0 10 20 30Width (cm)
Hei
ght (
cm)
0
10
20
30
40
50
60
70
80
90
0 10 20 30Width (cm)
Hei
ght(c
m)
60°, 3.6 cm exit
Velocity Profile and Cone AngleTo Notice:
- Both start at linear profile
- Effect of the wall
- Unpronounced velocity profile (balls seem to move together)
-Cone angle has small contribution to velocity profile shape
30°, 4 cm exit

Comparison to Design Profile
0
10
20
30
40
50
60
70
80
90
0 10 20 30Width (cm)
Hei
ght (
cm)
-Velocity Profile very similar
- Very flat until the funnel region
30°, 4 cm exit
07.mpg 09.mpg
Movie Clips

Friction Effects- Bottle lined with sand paper to increase frictional effects at the wall
- Velocity profile in central region seems to remain flat until funnel area
- Very slow movement at walls

Trial with Central Column

Video Demo 19.mpg20.mpg
21.mpg
22.mpg
23.mpg

Effect of Different Material Properties on Central Column
- Coke Bottle Model, filled with glass beads, was run with central column
- As with the plastic pebbles, the central column remained intact as the model was run
- Suggests streamlines are only weakly affected by friction and other material properties

Conclusions: Half Model• From Half Model Dynamic Flow Data:
– Laminar flow of both fuel and non-fuel pebbles
– Little or no mixing– No effect with refueling on velocity or
streamlines– Shape of velocity profile determined by
cone angle• From Half Model and Coke Bottle Model
– Frictional effects are relatively small

Full Model Data Collection

Cross Section of Tracer
ABS Plastic Sphere
Na-24 Source
Plastic Welder Epoxy Cap
Detector Resolution Schematic
Pb CollimatorNa
Detector
Pb Collimator
d
D
t SResolution = 2D-d d/t = D/(S+t) by similar triangle

Imaging Equipment Setupand Core Imaging Schematic
xy
Core
Gamma sourceparticle
Count Rate Output
Translator Controller
Macintosh(Visual Output
Translator Location) X
Y
`Translator
Detector
`

Actual Measurement Setup
34.mpg33.mpg
Movie 1 Movie 2

Determining Position
2 2.5 3 3.5 4 4.50
1000
2000
3000
4000
5000
6000
One particle
cm
5 5.5 6 6.5 7 7.5 8 8.52000
4000
6000
8000
10000
12000
14000
16000
Interpolationas a Gaussian
cm
Counting Distribution
Variation of Positions

Streamlines
-5 0 5
0
5
10
x (cm)
y (c
m)
0 5 10150
20
40
60
80
100
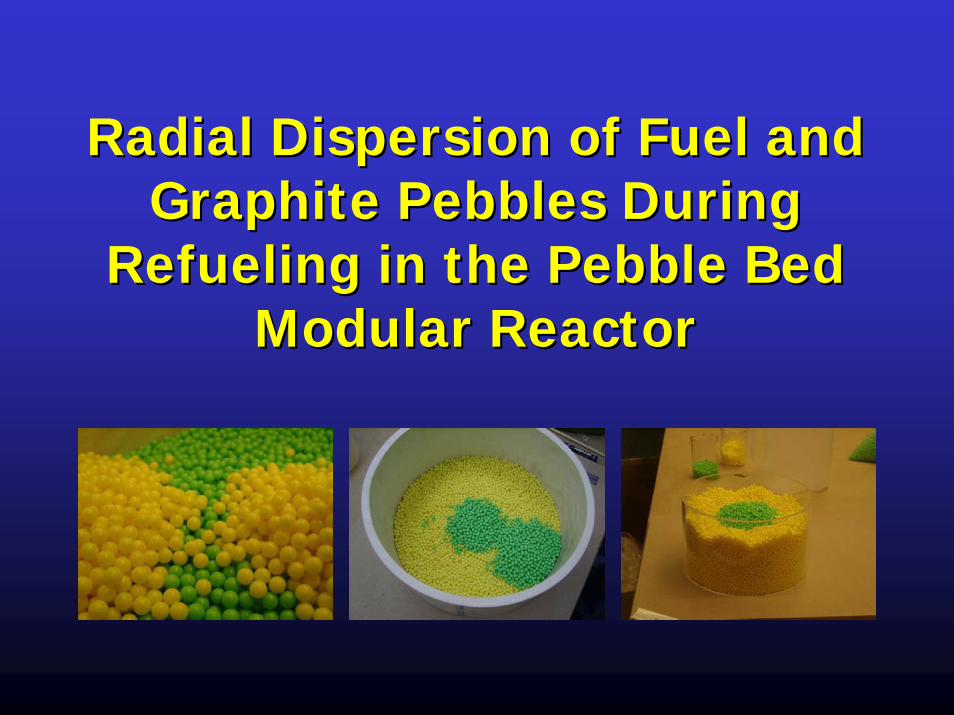
Radial Dispersion of Fuel and Radial Dispersion of Fuel and Graphite Pebbles During Graphite Pebbles During
Refueling in the Pebble Bed Refueling in the Pebble Bed Modular ReactorModular Reactor

PurposePurpose
•• Investigate how pebbles behave when Investigate how pebbles behave when dropped from various heights on the dropped from various heights on the surface of pebbles in the reactor coresurface of pebbles in the reactor core
•• Examine important issues for refuelingExamine important issues for refueling–– Uniform formation of distinct annular rings, Uniform formation of distinct annular rings,
central graphite column and outer ring of central graphite column and outer ring of fuel pebblesfuel pebbles
–– Minimal mixing of two regionsMinimal mixing of two regions

Key Parameters of InterestKey Parameters of Interest
•• Dropping rate (inner and outer locations)Dropping rate (inner and outer locations)•• Angle of reposeAngle of repose•• Height of drop (pebble probability Height of drop (pebble probability
distribution)distribution)•• Location of outer drop (radius)Location of outer drop (radius)•• Height of guide ring over the surfaceHeight of guide ring over the surface

Experimental DesignExperimental Design
•• Vessels: 24 cm and Vessels: 24 cm and 30 cm in diameter30 cm in diameter
•• Pebble diameter 6 Pebble diameter 6 mm, weight 0.12 g, mm, weight 0.12 g, and density 1.06 and density 1.06 g/cmg/cm33
d
h

Drop LocationsDrop Locations
R1 = Inner radius R1 = Inner radius = (81/175)R3= (81/175)R3
R2 = Mix zone radius R2 = Mix zone radius = (113/175)R3= (113/175)R3
R3 = Outer radiusR3 = Outer radius
R4 = Fueling radius R4 = Fueling radius = R3= R3--0.5(R30.5(R3--R1)R1)= 0.5(R3+R1)= 0.5(R3+R1)= (128/175)R3= (128/175)R3
R5 = center of mix zoneR5 = center of mix zone= (97/175)R3= (97/175)R3
R3R1
R2
R4
R5
Calculated from Calculated from PBMR Safety Analysis Report, Rev. BPBMR Safety Analysis Report, Rev. B

Dropping RateDropping Rate•• Discharged in real Discharged in real
reactor once every 30 reactor once every 30 secondsseconds
•• Experiments show that Experiments show that the rate of dropping the rate of dropping affects the mixing zoneaffects the mixing zone
•• Since pebbles on top of Since pebbles on top of reactor move down at reactor move down at same velocity, ratio is same velocity, ratio is based on area ratio:based on area ratio:
R 175 cm
R 113 cm
R 81 cm
( ) ( )( ) 169.2
812/811132/81113113175
222
2222
=⋅+−⋅−⋅+−⋅
=⋅
⋅
ππππ
g
f
D
D

Angle of ReposeAngle of Repose
•• Defined as the maximum Defined as the maximum angle a granular substance angle a granular substance can make with a surface can make with a surface before avalanching occursbefore avalanching occurs
•• Experimentally found to be Experimentally found to be approximately 21approximately 21°° for plastic for plastic pebbles and 31pebbles and 31°° for graphite for graphite pebbles (1cm diameter)pebbles (1cm diameter)
•• Angle provides some Angle provides some information about the profile information about the profile of a pile of pebblesof a pile of pebbles

Probability DistributionProbability Distribution
•• Studied by dropping pebbles Studied by dropping pebbles onto flat surface of several onto flat surface of several layers of pebbleslayers of pebbles
•• Graphite pebbles 1cm in Graphite pebbles 1cm in diameter, plastic pebbles diameter, plastic pebbles 0.6cm in diameter0.6cm in diameter
•• Pebble dropped from three Pebble dropped from three different heights: 18.5 cm, different heights: 18.5 cm, 40 cm, and 66 cm40 cm, and 66 cm
H
r

Distribution of Plastic PebblesDistribution of Plastic Pebbles
•• Decreasing height results in a higher probability Decreasing height results in a higher probability for the pebble to stop near drop location for the pebble to stop near drop location
•• As drop height increases, probability increases As drop height increases, probability increases for pebble to land further away from drop for pebble to land further away from drop location (the wider the distribution of pebble)location (the wider the distribution of pebble)
0
0.05
0.1
0.15
0.2
0.25
0.3
0.35
0 1 2 3 4 5 6 7 8 9 10 11 12 13 14
Flying Distance, cm
Pro
babi
lity
H = 18.5 cm
H = 40 cm
H = 66 cm
0
0.10.2
0.3
0.4
0.50.6
0.7
0.80.9
1
0 1 2 3 4 5 6 7 8 9 10 11 12 13 14
Flying Distance, cmP
roba
bilit
y H = 18.5 cm
H = 40 cm
H = 66 cm
Poly. (H = 18.5 cm)
Poly. (H = 40 cm)
Poly. (H = 66 cm)
Probability Distribution FunctionProbability Distribution Function Cumulative Distribution FunctionCumulative Distribution Function

Distribution of Graphite PebblesDistribution of Graphite Pebbles
•• PDF and CDF similar to plastic pebbles, but PDF and CDF similar to plastic pebbles, but higher probability for graphite pebbles to stop higher probability for graphite pebbles to stop near drop location than plastic pebblesnear drop location than plastic pebbles
0
0.05
0.1
0.15
0.2
0.25
0.3
0 1 2 3 4 5 6 7 8 9 10 11 12 13 14
Flying Distance, cm
Prob
abilit
y
H = 18.5 cm
H = 40 cm
H = 66 cm
Probability Distribution FunctionProbability Distribution Function Cumulative Distribution FunctionCumulative Distribution Function
00.10.20.30.40.50.60.70.80.9
1
0 1 2 3 4 5 6 7 8 9 10 11 12 13 14Flying Distance, cm
Pro
babi
lity H = 18.5 cm
H = 40 cm
H = 66 cm
Poly. (H = 18.5 cm)
Poly. (H = 40 cm)
Poly. (H = 66 cm)

Variation of Outer Drop LocationVariation of Outer Drop Location
•• Experiments performed in vessels 24 Experiments performed in vessels 24 cm and 30 cm in diametercm and 30 cm in diameter
•• Plastic pebbles dropped from height of Plastic pebbles dropped from height of 11 cm11 cm
•• Outer drop locations roughly 0.6Outer drop locations roughly 0.6rr, , 0.730.73rr, and 0.8, and 0.8rr ((rr is radius of vessel)is radius of vessel)
•• 0.730.73rr is the location of the real reactoris the location of the real reactor

Probability Distribution of Probability Distribution of PlasticPlasticPebbles: Pebbles: 24 cm Diameter Vessel24 cm Diameter Vessel
-0.05
0
0.05
0.1
0.15
0.2
0.25
0.3
0.35
0.4
0.45
0 1 2 3 4 5 6 7 8 9 10 11 12Distance from center (cm)
Prob
abili
ty
7 cm 0 cm
10 cm 8.8 cm
Poly. (7 cm) Poly. (0 cm)
Poly. (10 cm) Poly. (8.8 cm)
6.66.610.010.0
6.26.28.88.8
3.53.57.07.0
n/an/a00
Experimental Experimental mix zone mix zone location location (cm)(cm)
Distance Distance from from
center center (cm)(cm)
•• From equations describing specifications of real From equations describing specifications of real reactor, mix zone for vessel 24 cm in diameter, reactor, mix zone for vessel 24 cm in diameter, dropped from outer location of 8.8 cm should dropped from outer location of 8.8 cm should be be 6.65 cm6.65 cm (scaled linearly)(scaled linearly)

-0.05
0
0.05
0.1
0.15
0.2
0.25
-5 -4 -3 -2 -1 0 1 2 3 4 5 6 7 8 9 10 11 12 13 14 15
Distance from center (cm)
Prob
abili
ty
0 cm 9 cm
11 cm 12 cm
Poly. (0 cm) Poly. (9 cm)
Poly. (11 cm) Poly. (12 cm)
•• Results for 30cm diameter vessel are not conclusive Results for 30cm diameter vessel are not conclusive because many more pebbles need to be dropped to see because many more pebbles need to be dropped to see effect of mixing completely due to further distance from effect of mixing completely due to further distance from center of vessel. center of vessel.
5.35.312.012.0
5.15.111.011.0
4.854.859.09.0
n/an/a00
Experimental Experimental mix zone mix zone location location (cm)(cm)
Distance Distance from from center center (cm)(cm)
Probability Distribution of Probability Distribution of PlasticPlasticPebbles: 30Pebbles: 30 cm Diameter Vesselcm Diameter Vessel

Effects of Outer Drop LocationEffects of Outer Drop Location
•• Experiments confirm Experiments confirm intuitive hypothesis intuitive hypothesis that the location of the that the location of the outer drop is important outer drop is important to the formation of the to the formation of the mixing zonemixing zone
•• The further the outer The further the outer drop is from the center, drop is from the center, the further away the the further away the formation of the mixing formation of the mixing zonezone

Method to Avoid MixingMethod to Avoid Mixing
•• Cylindrical guide ring Cylindrical guide ring can be applied to can be applied to separate the separate the graphite and fuel graphite and fuel zones in the upper zones in the upper core to guarantee core to guarantee no mixingno mixing
Guide Ring

Cylindrical Guide RingCylindrical Guide Ring•• Energy loss factor (eEnergy loss factor (e22
= v= v2222 / v/ v11
22): found to ): found to be 0.6 for plastic be 0.6 for plastic pebble against hard pebble against hard plastic floor and 0.4 plastic floor and 0.4 against a preagainst a pre--established bed of established bed of plastic pebblesplastic pebbles
•• Maximum height of Maximum height of guide for pebble guide for pebble dropped into 24 cm dropped into 24 cm vessel from 11 cm vessel from 11 cm high at a radius of 7 high at a radius of 7 cm = 1.6 cmcm = 1.6 cm
θ
1v
0 r
H
h
HerHeh⋅
−⋅= 2
22
.max 4
PBMR: H = 100 cm, PBMR: H = 100 cm, ee22 = 0.35, = 0.35,
r = 60 cm r = 60 cm hhmaxmax..= 9.3 cm= 9.3 cm
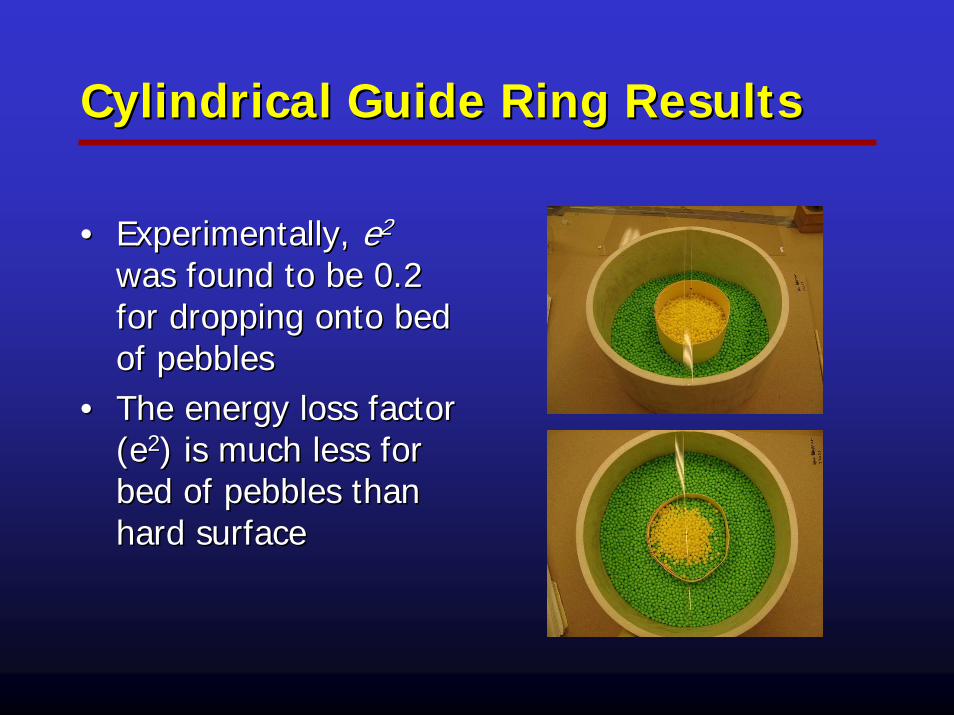
Cylindrical Guide Ring ResultsCylindrical Guide Ring Results
•• Experimentally, Experimentally, ee22
was found to be 0.2 was found to be 0.2 for dropping onto bed for dropping onto bed of pebblesof pebbles
•• The energy loss factor The energy loss factor (e(e22) is much less for ) is much less for bed of pebbles than bed of pebbles than hard surfacehard surface

Full 9Full 9--location droplocation drop

Slow Flow Experiment
• Previous Experiments were basic drain experiments - fast flow stopped.
• Need to confirm whether same behavior occurs in slower flow conditions as in pebble bed reactors

Experimental Configuration
• Added drill like device to lower discharge hole
• Pebbles discharged at about 100 pebbles per minute

Initial Conditions
• Set up similar to first series of experiments
• Track individual pebbles with time
• Lower mixture purely fill material
• Created upper pure yellow zone to track green pebbles placed at various radii.

Results
• Similar to fast flow• Linear streamlines• Vertical Velocities as
a function of radius are different than previously assumed
• Some surface friction observed

Shaping Ring Test - Slow
• Shaping ring inserted in top 5 inches
• Rest free - no ring• Slow flow
Shaping Ring
Fill
DrawnLines

Results - Shaping Ring
• Linear Behavior still observed
• Annulus maintained to within 2 to 3 pebble diameters
• Inner pebbles move faster than surface pebbles

Lower Plenum Flow
• Flow as predicted• Suggests that a
dynamic core can be created and maintained throughout reactor core.
• Peaking factors can be reduced.

Lower Plenum Discharge
• Flow shape as expected
• Need to consider rate of addition of graphite and fuel pebbles to maintain annulus based on discharge flow

Summary•• Pebble Flow ExperimentsPebble Flow Experiments
–– Vertical streamlines were observed in the Vertical streamlines were observed in the straight section with both 2D half model and straight section with both 2D half model and 3D model.3D model.
–– Lateral motion was limited to one pebble Lateral motion was limited to one pebble diameter.diameter.
–– Streamlines were not significantly affected by Streamlines were not significantly affected by changes in cone angle, refueling pattern, and changes in cone angle, refueling pattern, and exit diameter.exit diameter.
–– Material properties do not appear to strongly Material properties do not appear to strongly influence the flow pattern.influence the flow pattern.
–– 3D model data confirms the validity of the 3D model data confirms the validity of the halfhalf--model experiments. Surface effects of model experiments. Surface effects of halfhalf--model are negligible.model are negligible.

Summary
•• Pebble Flow Experiments (Cont.)Pebble Flow Experiments (Cont.)
–– Once the central column is formed, mixing in the Once the central column is formed, mixing in the straight section is determined only by refueling straight section is determined only by refueling and not through lateral diffusion of pebbles.and not through lateral diffusion of pebbles.
–– Overall, the data obtained, agree with the PBMR Overall, the data obtained, agree with the PBMR Safety Analysis Report data. Our results also Safety Analysis Report data. Our results also comply with the data from a prior Molecular comply with the data from a prior Molecular Dynamics simulationDynamics simulation

Summary
• Slow Flow Experiments consistent with Fast Flow - linear streamlines
• Shaping ring inserted in top of core can make a dynamic column to within 2 to 3 pebbles.
• Surface friction needs to be evaluated

Future Work
• Submitted Proposal to DOE to study details of pebble velocity with MIT math department - resolve velocity discrepancies as a function of height.
• Will examine central column bypass flow by using smaller graphite pebbles to increase flow resistance
• To study effect of pebble to pebble and surface friction on results

The Class
Matthew AicheleTanya BurkaJaehyuk Choi
Rhett CreightonJacob Eapen
Dandong FengCatherine Goff
Lars GronningNicolas Hernandez
Jeff HungDuke KennedyScott Mahar
Marina SavkinaDean Wang