pedestrian accessibility in grid layouts: the role of...
TRANSCRIPT

Urban Morphology (2016) 20(2), 89–106 © International Seminar on Urban Form, 2016 ISSN 1027–4278
Pedestrian accessibility in grid layouts: the role of block, plot and street dimensions
Andres Sevtsuk, Raul Kalvo and Onur EkmekciCity Form Lab, Department of Urban Planning and Design, Graduate School of Design,
Harvard University, 48 Quincy Street, Cambridge, MA 02138, USA. E- mail: [email protected]
Revised version received 8 March 2016
Abstract. Research on urban form and walkability suggests that on average smaller blocks are better for pedestrians. We explore how block sizes, plot dimensions and street widths affect pedestrian accessibility in regular grids. Pedestrian accessibility is captured by the gravity index, which is proportional to the number of neighbouring plots that can be reached within a given walking radius and inversely proportional to the travel costs involved. Pedestrian accessibility is measured for the original town plans of well- known US and Australian grids and compared with thousands of computer simulated grids, analysing how close the grids come to the theoretical maxima of pedestrian accessibility, given plot sizes and street dimensions. The findings show how dimensions of plot frontages and depths, street widths and block lengths affect pedestrian accessibility in gridiron urban environments. Block lengths have a non- linear relationship to accessibility and smaller blocks are not necessarily better for pedestrians. In many cases, larger blocks have greater pedestrian accessibility than smaller blocks, which might explain previous variable findings on the effects of blocks sizes on walkability. Though block lengths in most of the famous grids we investigate come close to achieving maximum possible pedestrian accessibility levels, some of them could provide users with as much as 12 per cent more accessibility if their lengths were optimized for pedestrians. The lengths of the Manhattan and Indianapolis blocks come closest to maximizing pedestrian access, given their original plot and street dimensions. We illustrate a few prototypical block sizes that maximize pedestrian accessibility and may be suitable for pedestrian- friendly subdivisions in contemporary urban planning.
Keywords: block size, plot size, accessibility, grids, morphological structure
Grids are among the commonest forms of spatial organization used for planned urban expansion. Orthogonal subdivisions have been adopted from Turin to Barcelona, Buenos Aires to New York, and Adelaide to Beijing.
Gridiron organizations of urban space have been shown to offer a number of benefits. They
are relatively easy and quick to survey on the ground (Chisholm, 1911); they facilitate plot amalgamations and subdivision as needs arise (Siksna, 1998); they lend themselves readily to land market speculation (Hoyt, 1933); they encourage rectangular building forms that are simpler to build than oblique ones (Steadman,

90 Pedestrian accessibility in grid layouts
2006); they are easy to navigate and remem-ber (Gell, 1985; Sadalla and Montello, 1989); they allow axial organizations of places of symbolic importance (Lynch, 1984); and they are among the most circulation efficient urban forms (Institute of Transportation Engineers, 2010). These and other benefits have with-stood the test of time under changing social and technological orders and continue to dem-onstrate the viability of grids in a number of contemporary cities (Grant, 2001).
Much has been written about the his-tory, design, and implementation of grids (Anderson, 1993; Castagnoli, 1971; Figueiredo and Amorim, 2007; Kostof, 1993; Marshall, 2005; Moughtin, 2003; Reps, 1965; Shpuza, 2007; UN- Habitat, 2013), but the issue of grid dimensions has mostly consisted of statements of fact, illustrating the plot or block sizes that were chosen. Grids in dif-ferent cities come with remarkably variable dimensions. The blocks in Portland are 60 × 60 m but those in Adelaide are 554 × 155 m. Portland’s blocks are perfectly square whereas Manhattan’s are elongated, with street sides three and a half times longer than avenue sides. Few studies have critically examined why the particular grid dimensions were picked and what the consequences of dimen-sional choices might be (Castagnoli, 1971; Hillier, 1999; Moudon, 1986; Panerai et al., 1997; Reps, 1965; Siksna, 1998).
Many urbanists have advocated smaller blocks based on their seeming benefits for walkability. Leon Krier has argued that small city blocks generate more diversity and com-plexity in the urban scenery. ‘Urban blocks should be as small in length and width as is typologically viable; they should form as many well- defined streets and squares as pos-sible in the form of a multi- directional hori-zontal pattern of urban spaces’ (Krier, 1984, p. 43). Critiquing one of the most celebrated grids in the world, Jane Jacobs suggested that the blocks of Manhattan are too long: ‘most blocks must be short; that is, streets and opportunities to turn corners must be frequent’ (Jacobs, 1961, p. 150). According to Jacobs, shorter blocks would enable more encounters and interactions between the grid’s
occupants. Allan B. Jacobs’s analysis of suc-cessful streets around the world has led him to suggest that the frequency of cross streets contributes to the diverse pedestrian qualities of a street. ‘Streets with one entry for every 300 feet (90 metres) are easy to find, and some of the best streets approach that figure ... but there are more entries on the busiest streets’ (Jacobs, 1993, p. 302). These and other asser-tions seem to have convinced the planning and urban design community that small blocks are more walkable.
A number of recent empirical studies on walkability and bikeability have used block size as a predictor, hypothesizing that smaller blocks ought to correlate with higher levels of pedestrian activity (Boaernet et al., 2011; Ewing and Cervero, 2010; Hess et al., 1999; Joh et al., 2009; Targa and Clifton, 2005). Empirical findings on the effects of block sizes on walking behaviour have been mixed, how-ever. For instance, Boarnet et al. (2011) ana-lysed over 2000 residents’ travel patterns in the South Bay area of Los Angeles and found no significant relationship between block size and walking activity. Boer et al. (2007) used 1995 National Personal Transportation Survey data in ten US cities and also found no relationship between block length and walk-ing. Hess et al. (1999), on the other hand, found that ‘controlling for population den-sity, income, and land use mix and intensity, the volume of pedestrian trips is three times higher in urban sites with small street blocks and continuous sidewalks than in suburban sites with large blocks and discontinuous side-walks’. Ewing and Cervero’s (2010) thorough review of literature on the topic summarizes empirical results on associations between the built environment and travel across 62 studies. A number of the studies they summarize point to a significant positive relationship between block sizes and walking (Hess et al., 1999; Targa and Clifton, 2005), while others found an insignificant or no relationship (Boarnet et al., 2011; Boer et al., 2007; Joh et al., 2009). Existing literature thus suggests that empirical evidence is inconclusive about the widely claimed positive relationship between urban block size and pedestrian activity.

91Pedestrian accessibility in grid layouts
This paper explores how block dimensions in orthogonal urban grids affect pedestrian accessibility. We demonstrate that the rela-tionship between block size and walkability is, in fact, not a linear one and show how and why small blocks do not always benefit walk-ability. In examining pedestrian accessibility, we do not observe actual pedestrian activity in any particular city, but focus on the theo-retical capacity of grids to generate pedes-trian activity. We rely on Hansen’s concept of gravity index in estimating accessibility on foot, and suggest that the most walkable grids are those that maximize the number of plots one can reach within a given walking radius while minimizing the travel distance required to reach them (Hansen, 1959). Our analysis keeps the density and attractiveness of land- use destinations constant in all comparisons and focuses on accessibility differences that are purely attributable to the dimensional parameters of grids, especially block sizes.
Our investigation is limited to regular orthogonal grids in which all blocks are rec-tangular and plots bi- directional, facing onto two opposing streets. This limitation narrows our focus away from some well- known grids where plots face in four directions – as found in Manhattan, Savannah, and Barcelona for instance ‒ but it allows us to simplify consider-ably the simulation framework used to gener-ate synthetic grid alternatives. Despite the limi-tation, the findings are still applicable to a large number of gridiron cities around the world.
The paper addresses four related research questions: 1. How, and how much, do block, plot and
street dimensions in grids affect pedestrian accessibility?
2. What are the maximum accessibility lev-els that can be achieved for walking using given plot and street dimensions in bi- directional rectangular grids?
3. How close do existing examples of con-temporary and historical urban grids come to the maximum possible pedestrian accessibility levels given their plot and street dimensions, and how could their block sizes be adjusted to arrive at this maximum?
4. What are the optimum dimensions for maximizing pedestrian accessibility in new prototypical gridiron subdivisions?
The paper is organized as follows. First, choice of accessibility metric and its variation in existing grids are discussed. Secondly, the effects that different grid parameters have on pedestrian accessibility and how each param-eter can be manipulated to maximize acces-sibility are considered. Thirdly, pedestrian accessibility in well- known grids is compared with computer simulations to ascertain how close existing grids come to the theoreti-cal maximum pedestrian accessibility levels achieved in simulated grids that use identical plot sizes and street dimensions, but opti-mized block lengths. Simulations are also used to illustrate how an informed choice of block sizes can contribute to higher pedestrian accessibility in newly planned urban layouts. Finally, the optimized block size results for different plot sizes are examined, making the research applicable to a range of possible grid developments for single- family housing, walk- up buildings, high- rise offices or mixed- use complexes in urban mega- blocks. For each prototypical plot, a simulation illustrates the recommended block length that achieves the biggest contribution towards pedestrian accessibility.
Measuring pedestrian accessibility
The amount of walking that occurs in the built environment depends on many factors that have been widely discussed (Ewing and Cervero, 2010; Forsyth et al., 2008; Frank and Pivo, 1994; Garbrecht, 1978; Gehl, 1987, 2010; Guo, 2009; Guy and Wrigley, 1987; Institute of Transportation Engineers, 2010; Li and Tsukaguchi, 2005; Ozbil et al., 2011; Pushakrev and Zupan, 1975; Takeuchi, 1977; Zacharias, 2001). Across studies, two critical environmental factors for walk-ability stand out. First, the number of walk-ing trips observed in an area depends on the number of pedestrian destinations available (Boarnet et al., 2011; Cervero, 1996; Cervero and Duncan, 2003; Guo, 2009). The more

92 Pedestrian accessibility in grid layouts
destination attractions there are, controlling for covariates, the more reason people have to walk. Secondly, the probability of walk-ing trips decreases with distance. People are more likely to undertake a short walk than a long walk, all else being equal (Handy and Niemeier, 1997). Other important categories of factors contributing to walkability usually include the usefulness, comfort and safety of walking routes (Speck, 2013). Our analyses assume these latter qualities to be constant over our study areas.
There is a difference between accessibility perceived by an individual who is undertaking a walk between a particular origin and a par-ticular destination, and a collective perspec-tive that considers all possible walks in a grid. Assuming that the origin and destination of an individual walk are found on opposite sides of an intermediate block, the walk could become longer if block sizes were increased, creating a lengthier detour around the intermediate block. Smaller blocks can thus only shorten distances for individual walks (the effect that Jane Jacobs (1961, p. 458) referred to when advocating smaller blocks). However, from a collective perspective, which is primarily explored here, this effect can be offset by an
increase in the number of destinations made available by larger blocks in a given ‘walk-shed’, producing an overall net increase in pedestrian accessibility.
The effect of distance on walkability is illustrated in Figure 1, which borrows findings from a study that examined walking to bus stops in different US cities and across socio- economic groups (Transportation Research Board, 2014). It shows how the proportion of people walking to bus stops in different North American cities decreases exponentially with distance, with some variation noted between cities and between respondents’ income tiers.
The number of destinations available within a given radius and the distance required to reach them are directly affected by the spa-tial layout of urban grids. Grid designs can increase walkability by maximizing the num-ber of destinations (for example, plots) while minimizing the distance covered to reach them. The two variables are also part of a widely- used gravity accessibility index pro-posed by Hansen (1959), which postulates that accessibility is proportional to the num-ber (and attractiveness) of destinations availa-ble, and inversely proportional to the distance covered to reach them. The distance decay
Figure 1. Probability of walking to bus stops at different distances in North American cities. Reproduced from Transportation Research Board (2014).

93Pedestrian accessibility in grid layouts
function may take different forms, depending on travel mode (for example, walking or driv-ing) and distance units (for example, metres, miles, minutes), and the shape of the curve can vary due to behavioural differences rooted in culture, geography, and climate. The gravity index of a parcel i in a grid G using a search radius r is shown as:
[1]
where r limits how far we go searching for destinations, d[i,j] is the distance between an origin i and a destination j, β is an exponent that controls the effect of distance decay, and the enumerator ‘1’ suggests that we treat all destinations equally. For the purposes of this study we ignore the fact that destinations found at different plots may vary in size, nature and attractiveness, which can of course have an effect on walkability and pedestrian access. All plots are treated equally so as to focus purely on how the geometry of the underly-ing grid affects walkability. Accessibility is measured to the middle of each plot’s front-age. These simplifications can be readily
relaxed by replacing the ‘1’ in the enumerator of the index with an appropriate weight that describes each destination. The same index can be specified, for instance, for building entrances or business locations, weighted by their attractiveness or size. Though plots in reality may have more than one access point, especially in corner plots and through plots, such variables that originate from site plan-ning, building form and land use go beyond the layout of the grid that is our present focus but could be added as variables in future studies.
Adjusting the value of beta allows us to con-trol the shape and scale of the distance decay curve. For instance, the average of the distance decay curves in Figure 1 can be described with Equation [1] when beta is set to ‘0.005’. This is similar to the empirically estimated beta value that Handy and Niemeier (1997) found when studying the habits of people’s walking to shops in the San Francisco Bay Area.
Variations in pedestrian accessibility in urban grids of different dimensions are sur-prisingly large. Figures 2 and 3 illustrate how many other plots can be reached within a 1000 metre (15 minute) walking range from
����������� � � 1�������������������������
Figure 2. Comparison of how many neighbouring plots can be reached from an average plot in a 15- minute walkshed in seven grid plans.

94 Pedestrian accessibility in grid layouts
an average plot in seven original grid plans of well- known American and Australian cities, measured along the street network. The y axis in Figure 2 indicates mean 15- minute reach values among all plots in a typical block. To achieve a consistent comparison, an identi-cal block structure was extended in each city for more than 1000 m in every direction of measurement.
In Brisbane, a pedestrian from a typical plot can reach 1592 neighbouring plots within a 15 minute walk, while in Manhattan a similar range gives access to 5989 plots. This almost fourfold difference between Brisbane and Manhattan can be explained by the geometric parameters of these grids. There are four essen-tial parameters that govern the dimensions of bi- directional grids: 1) plot frontages, 2) plot depths, 3) street widths, and 4) block lengths, which are determined by the number of plots
in a block frontage. Given these parameters, block depths, for instance, are calculated as twice the plot depths. The direction in which the first three parameters – plot frontages and depths, and street widths – affect the number of destinations reached in a given walk range is largely intuitive. Other things being equal, we would expect grids with smaller plots and narrower frontages to yield more destination plots within a given travel range, since larger and wider plots make reaching each destina-tion a longer walk. Indeed we see in Figure 3 that the Commissioner’s plots in Manhattan were originally 8 × 30 m while Brisbane’s plots were 20 × 45 m. Wider streets would similarly reduce the number of destinations that could be reached within a given distance due to longer crossings, all else being equal. The precise effects of these three parameters on pedestrian accessibility are considered in the next section.
Figure 3. Seven comparative grid plans represented at the same scale.
95Pedestrian accessibility in grid layouts
The effect of the fourth parameter – the number of plots per block frontage ‒ which determines the length of a block, is not obvi-ous. Brisbane’s blocks contain 20 plots and Manhattan’s blocks contain 66. How do the resulting block lengths affect the ability of a traveller to reach surrounding destinations? On the one hand, shorter blocks mean more frequent cross- streets that should make each individual trip more direct. But on the other hand, each additional cross- street imposes a travel cost. Longer blocks minimize extra street crossings, which in turn increases the number of destinations one can reach in a given walkshed. In the following analysis we demonstrate that block length can have a counter- intuitive, non- linear influence on pedestrian access in grids, which ought to be taken into account when designing subdivi-sions that aim to foster walkability.
Effects of block dimensions on pedestrian accessibility
To find out how different block lengths affect pedestrian accessibility as captured in the gravity index for particular plot sizes and street dimensions, we can estimate the grav-ity index for pedestrians with multiple differ-ent block lengths and observe the difference
in the outcome. Pedestrian accessibility is maximized when the gravity index is at its highest possible value for particular plot size and street width constraints. Since the value of the gravity index is unique to every plot in a block, we average the values across all plots in a typical block and refer to the block’s combined maximum outcome as the Mean Maximum Gravity (MMG) for the block. For instance, we can take the Portland plot sizes and street dimensions, and try to replicate iteratively its grid by arranging a different number of plots to a block in each iteration. This makes it possible to deter-mine the highest possible MMG result for Portland’s grid, keeping its plot and street dimensions fixed at their original values – a solution that we define as the most walkable block length for Portland’s plot and street dimensions.
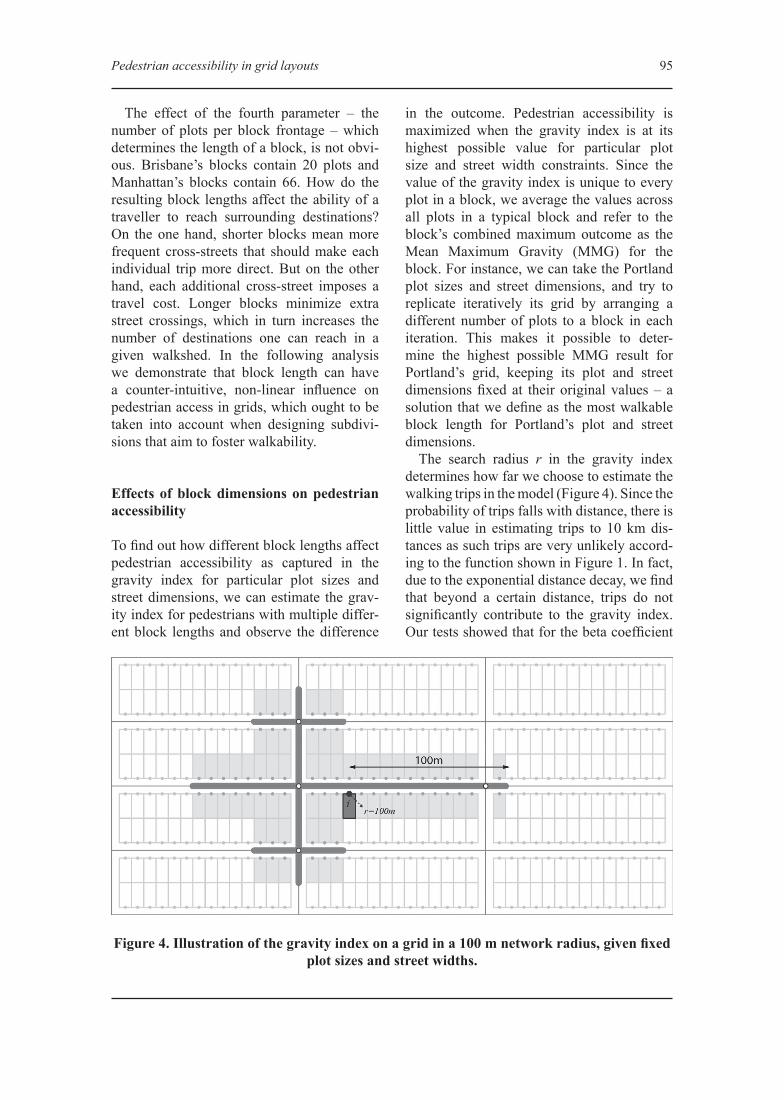
The search radius r in the gravity index determines how far we choose to estimate the walking trips in the model (Figure 4). Since the probability of trips falls with distance, there is little value in estimating trips to 10 km dis-tances as such trips are very unlikely accord-ing to the function shown in Figure 1. In fact, due to the exponential distance decay, we find that beyond a certain distance, trips do not significantly contribute to the gravity index. Our tests showed that for the beta coefficient
Figure 4. Illustration of the gravity index on a grid in a 100 m network radius, given fixed plot sizes and street widths.

96 Pedestrian accessibility in grid layouts
0.005, the distance beyond which trip contri-butions to the index become insignificant is about 1000 m, which is comfortably above the empirical distribution of walk lengths shown in Figure 1. It is thus not necessary to test an infinite number of walks on grids to find dimensions that maximize pedes-trian accessibility. Instead we can limit our estimations to walks that are up to 1 km in length.
Let us first take a typical plot size for an American city, for instance 500 m2 or 5000 ft2, and a street dimension of 18 m (60 ft). We can simulate how pedestrian accessibility changes according to different block lengths (differ-ent numbers of plots within a block frontage). These simulations were performed using cus-tomized routines developed for Rhinoceros 3D software, where the generation of sample grids was automated. The Urban Network Analysis Toolbox plugin was used to carry out the accessibility measurements on each trial.
The results, shown in Figure 5, are that the MMG index is 199.4, when each block contains 20 plots, 10 along both frontages. Assuming that all destinations within a 1 km walk range are equally attractive and taking into account the exact travel distance to each of the destinations at MMG, people are likely to walk to about 200 destinations on average. Since the gravity index estimates the propor-tion of people walking to each destination by
distance, which is the same as the probability of walking there, we can summarize the index results as the number of destinations to which people are likely to walk within a given grid. Because of the distance decay effect in the index, the result is almost always lower than the number of destinations that are actually available in a given distance range (except when a destination is at the same location as the origin). Shorter blocks than 20 plots achieve a lower level of access to neighbour-ing plots. Above 20 plots, the outcome starts gradually decreasing again. Figure 5 shows that block length has a non- linear effect on pedestrian accessibility.
Though a number of authors have assumed that smaller blocks make a better walking environment, our findings indicate that this is not necessarily the case. Smaller blocks may indeed provide a more direct route between any unique origin and destination in a grid. However, since the overall pedestrian accessi-bility of an area is increased when the number of available destinations is maximized and the travel cost of reaching them minimized, the effect of block length on pedestrian accessi-bility is non- linear and not readily arrived at intuitively. In very short blocks, for example where only two plots face each side, dou-bling block size with an additional pair of plots increases pedestrian accessibility to surrounding destinations by 37 per cent. As block length increases, this effect
Figure 5. Simulated MMG results for different block sizes with 15 × 33 m (50× 100 ft) plots, 18 m (60 ft) street widths,
and a beta value of 0.005.

97Pedestrian accessibility in grid layouts
decreases – doubling a frontage from 3 to 6 plots increases the outcome by 14 per cent but doubling it from 12 to 24 plots increases it by only 2 per cent (keeping plots and street widths constant). At an optimal block length (MMG), the effect reverses and longer blocks start reducing pedestrian accessibility. Doubling a block frontage from 24 to 48 plots reduces pedestrian accessibility by 10 per cent. At different points along the curve, a 1 per cent increase in block length creates between 0.5 per cent and - 0.4 per cent change in pedestrian accessibility. This may partly explain why previous empirical findings on the effects of block size on walking have varied (Boarnet et al., 2011; Boer et al., 2007; Hess et al., 1999).
Comparison of existing urban grids
The above simulation result suggests that if block lengths are adjusted to an optimal number of plots in each block, then substan-tial improvements to pedestrian accessibility could be gained. Gains on pedestrian acces-sibility could also result from smaller plots or streets and we shall return to these options
shortly. In this section we explore how large the gains of optimizing block lengths could have been in a sample of historical city grids referenced above. To do so, we measured the mean gravity accessibility to surrounding plots in a typical block in each grid, while also generating a number of hypothetical copies of these grids using the same plot and street dimensions, but varying the number of plots in each block frontage. As before, the same block structure was extended uniformly over 1 km in each direction. The first six rows in Table 1 show existing grid dimensions and gravity results and the last six rows show improvements to pedestrian accessibility achieved by optimizing block length. Again, all destination plots are considered equally attractive.
By and large, the designs of these grids have intuitively composed block lengths that achieve 93 per cent, on average, of the maximum possible pedestrian accessibility level, given their plot and street dimensions. Manhattan and Indianapolis achieve 97 per cent, and Brisbane and Adelaide 88 per cent. Adelaide’s grid would increase pedestrian accessibility by 12 per cent if it had three instead of eight plots per frontage. Siksna’s
Table 1. Comparison of pedestrian accessibility results in original grid layouts and altered layouts of the same grids, where block lengths are optimized to maximize pedestrian accessibility
Ade
laid
e
Bri
sban
e
Mel
bour
ne
Chi
cago
Indi
anap
olis
Man
hatt
an
Port
land
1 Plot frontage/depth (m) 65/65 20/45 20/100 24/58 21/54 8/30 15/302 Street dimensions x, y (m) 35/26 20/20 30/30 25/25 30/30 27/15 18/243 Plots in existing block frontage 8 10 10 4 6 32 44 Existing block width (m) 520 200 200 96 126 256 605 Existing block depth (m) 130 90 200 115 128 60 606 Existing mean Gravity accessibility 19.4 101.36 55.67 69.61 71.89 378.67 182.277 Total plots required in block frontage
to achieve MMG3 8 12 8 9 21 10
8 MMG block width (m) 195 160 240 192 189 168 1509 MMG block depth (m) 130 90 200 115 128 60 6010 MMG mean Gravity 21.96 114.3 57.71 73.28 74 390.4 199.411 MMG % achieved in original layout 88.3 88.7 96.5 95 97.1 97 91.412 Average MMG % achieved in
original layouts93.4

98 Pedestrian accessibility in grid layouts
historical research has shown that adjustments towards this end have indeed taken place over time in Adelaide through block and plot subdivisions (Siksna, 1998). Smaller blocks improve pedestrian accessibility in Adelaide. In Portland, however, pedestrian accessi-bility would benefit from longer blocks. If instead of the original four plots, ten were used on each frontage, pedestrian accessibil-ity to surrounding destinations would rise by 8.6 per cent. In the case of Manhattan, Indianapolis and Melbourne, existing block lengths are almost optimal for pedestrian access. Alterations in their length could only affect accessibility by about 3 per cent. However, in the Manhattan simulation plots were arranged bi- directionally, instead of in the actual four- sided arrangement. The com-parison could therefore differ if done with actual plots.
Although adjusting block lengths in these cities gives a relatively minor improvement in pedestrian accessibility (typically less than 10 per cent), it is not hard to imagine how some land subdivisions might not come this close to the maximum. Since in practice subdivid-ing blocks has historically been a simpler process than amalgamating blocks and clos-ing down streets, starting out with blocks that are large appears to be a safer strategy than starting with blocks that are too small (Siksna, 1998).
Plot and street dimension effects
When circumstances permit, the most effec-tive way of improving pedestrian access in a grid is achieved by reducing plot frontages. Since plot frontages directly determine how long it takes to travel past each plot, a larger number of narrower plots could have a posi-tive effect on pedestrian accessibility. Figure 6 shows the relationship between plot front-age and pedestrian accessibility, keeping plot frontages within a range of 9 m to 90 m, and street widths and plot depths constant at 18 m. All results are shown at MMG, using an optimal number of plots in each block (indi-cated by dashed curves on a secondary verti-cal axis) to maximize pedestrian accessibility. The relationship is exponential – narrow plots produce an exponentially larger increase in pedestrian accessibility than wide plots. This is explained by the fact that walking can occur in two directions on the grid and the distance increase caused by wider frontages grows as a square of the frontage. Showing the plots at MMG requires a variable block length in each case, so having narrower plot frontages does not necessarily imply smaller blocks. The effect varies with frontage width and its mag-nitude differs along the curve. Proportional accessibility gains are largest with the nar-rowest plots and less pronounced with wider plots. On average, a 1 per cent decrease in
0
2
4
6
8
10
12
14
16
0
100
200
300
400
500
600
9 12 15 18 21 24 27 30 33 36 39 42 45 48 51 54 57 60 63 66 69 72 75 78 81 84 87 90
# pl
ots i
nbl
ock
at M
MG
MM
G G
ravi
ty10
00 m
Plot frontage (metres)
Figure 6. Plot frontage effect on pedestrian accessibility to surrounding destinations in a 1000 m radius. Beta = 0.005,
plot depth and street widths are 18 m.

99Pedestrian accessibility in grid layouts
plot frontages produces a 1 per cent increase in pedestrian accessibility. With narrow plots, reducing frontages from 10 m to 9 m (a 10 per cent decrease) produces a 10 per cent increase in pedestrian accessibility. But with wider plots, changing frontages from 50 m to 49 m (a similar 1 m decrease) increases accessibil-ity by only 2 per cent. The frontage dimen-sion below which percentage gains in acces-sibility grow faster than percentage losses is about 18 m. This suggests that accessibility gains are especially notable if plot frontages are reduced to below 18 m. All else being equal, in improving pedestrian accessibility, reducing plot frontages is the most effective adjustment among the four grid parameters. The impressive pedestrian accessibility of narrow Manhattan plots, illustrated in Figure 1, confirms this effect. Anecdotal evidence of perceived accessibility in old city centres with narrow plots, such as Soho in London, Le Marais in Paris or the historical centre of Amsterdam, are also consistent with this. However, history has shown that plot sizes are also the most plastic of the variables, and tend to change over time in response to changes in ownership, land use, land value and building types (Mangin and Panerai, 1999; Moudon, 1986; Siksna, 1998). Manhattan plots today are much larger, on average, than the original Commissioner’s plan foresaw.
In newly- built subdivisions, developers may require certain frontage dimensions that work well for intended building types. An alternative means of improving pedestrian accessibility is to reduce plot depths. Figure 7 illustrates the relationship between plot depth and pedestrian accessibility, keeping frontages and street widths fixed at 18 m. The magnitude of the effect again varies with plot depth. A 1 per cent decrease in plot depth produces, on average, a 0.7 per cent increase in pedestrian accessibility – a smaller effect than was found with frontages. Reducing plot depths from 10 m to 9 m gives a 4.5 per cent increase in the grid’s pedestrian accessibility (compared with the previously- noted 10 per cent effect produced by shortening frontages by 1 m). This gain shrinks with deeper plots. Reducing depth from 50 m to 49 m improves pedestrian accessibility by 1.5 per cent. Reducing plot depths is therefore a second- best option for maximizing pedestrian accessibility.
A third dimensional parameter affecting pedestrian accessibility in grids is street width (Figure 8). Wide streets tend to have less pedes-trian accessibility, since they entail longer crossings between destinations. According to our simulations, a 1 per cent decrease in street width increases pedestrian accessibility by 0.4 per cent on average; or alternatively, a 1 m reduction in street width on average creates a
Figure 7. Plot depth effect on pedestrian accessibility to surrounding plots in a 1000 m walking radius on a grid. Beta = 0.005, frontages and streets are kept constant at
18 m.

100 Pedestrian accessibility in grid layouts
1.7 per cent increase in pedestrian accessibil-ity. This effect is almost linear between 10 m and 40 m street widths, all else being equal. A more substantial change from 30 m to 20 m streets (a 30 per cent reduction) improves pedestrian accessibility by 16 per cent, given the plot sizes used in Figure 8. Adjustments in street width thus only appear to be effective in improving pedestrian accessibility when they are bold – for example, reductions from eight lanes to four lanes – or involve substantial reductions in road medians or rights of way.
We have thus far explored the effects of each of the parameters on pedestrian acces-sibility separately, keeping others fixed at typical values. Urban block sizes, however, are determined by a combination of all four
parameters. The total size (area) of a block depends simultaneously on plot frontages, depths and the number of plots in the block. And for a given block size, pedestrian acces-sibility additionally depends on street widths. It is difficult to illustrate the joint variation of these four parameters on a chart. Instead, a series of additional simulations were con-ducted in which values for each of the four parameters were sampled randomly in realis-tic ranges, so as to achieve a wide variation in block sizes. Random sampling of prototypical grid parameters allows us to generate a variety of grids in which a variety of dimensional com-binations are included that may arise owing to context specific constraints in real- world situ-ations. Figure 9 illustrates the results of 1000
Figure 8. Street width effect on pedestrian accessibility to surrounding plots in a 1000 m walking radius on a grid. Beta = 0.005, plot frontages
and depths are kept constant at 15 m and 30 m respectively.
Figure 9. Relationship between block area and pedestrian accessibility in 1000 randomly generated grids. Frontage ranges 10–60 m; depths
of 15–60 m; and plot count per block frontage of 1–40.

101Pedestrian accessibility in grid layouts
simulations, showing the resulting block size in square metres on the x- axis and pedestrian accessibility on the y- axis.
The general trend in the relationship is clear – smaller blocks typically achieve higher pedestrian accessibilities, as hypothesized in previous studies. The exponential nature of the trend shows that pedestrian accessibil-ity rises sharply with very small blocks and decreases slowly with very large blocks. In districts with large blocks that contain few plots, reducing block size will not improve accessibility much. But where plots are small and numerous, shorter blocks can substan-tially improve pedestrian accessibility. To the best of our knowledge, this effect has not yet been acknowledged in the empirical walkabil-ity literature.
More importantly, a notable scatter around the trend curve in Figure 9 also shows that smaller blocks are not always more walk-able. Any diagonal movement in the scatter from bottom left towards top right (shown with an arrow on the graph) illustrates cases where larger blocks increase, rather than decrease, pedestrian accessibility. Consider, for instance, a grid, where each block frontage contains only three plots with a combined area of 7500 m2. The plots are 25 m wide, 50 m deep and the streets between them 55 m wide. Such a grid provides access to 577 plots, on average, in a 1000 m walk- range. This result can be exceeded by a number of larger blocks. Five times larger blocks, for instance, are achieved by placing 25 plots per block with 12 m frontages, 50 m depths and similar streets as above, which yields a block area of
30 000 m2. This latter grid provides pedestrian access to 1686 plots in a similar 1000 m walk range – roughly three times more than in the case of much smaller blocks. While smaller blocks usually improve pedestrian accessibil-ity, the opposite can be true, depending on the grid’s plot and street parameters.
Sample grids with different building types
In practical settings, the planning of grids often starts with some plot and street dimen-sions in mind. Different plot sizes are suitable for accommodating different building types. Likewise, different street widths are needed to accommodate the predicted traffic flow under given development densities. In this section we describe five prototypical plot sizes and associated street dimensions that may cor-respond to different developer intentions in contemporary urban planning practice. The examples shown in Table 2 and Figure 10 are intended to provide a practical guide to maxi-mizing pedestrian accessibility to surround-ing plots in gridiron subdivisions with given plot and street parameters. For each, Table 2 shows the maximum achievable pedestrian access results (MMG) and indicates the num-ber of plots that are needed in a block front-age to achieve this maximum. The table also indicates the number of destinations reached in 15 minutes on foot in the resulting grids, assuming a 1000 m walking radius.
For the smaller shop- house type plots of 8 × 16 m, we use example street dimensions of 12.5 m in both directions. Such small plots are
Table 2. Optimal block lengths for maximizing pedestrian accessibility with prototypical parcel and street dimensions.
Building type
Plot frontage and depth dimensions (m)
Street dimensions (m)
Maximum Mean Gravity (MMG)
Plot count per frontage at MMG
Plots reached in a 15-minute walkshed (1000 m) at MMG
1 Shop- houses 8×16 12.5, 12.5 718.68 15 10 0792 Walk- ups 16×32 18, 18 182.3 11 27143 Office buildings A 64×32 21, 21 42.3 3 6504 Office buildings B 32×64 21, 21 46.1 9 7325 Mixed- use complexes 64×128 36, 36 12.7 3 172

102 Pedestrian accessibility in grid layouts
found in numerous historical city centres as well as in newer terraced- house developments around the world. Given these dimensions, the optimal number of plots per frontage that maximizes pedestrian accessibility is fifteen, at which point a typical plot owner can reach over 10 000 neighbouring plots in a 15- minute walking range. Since the hump in the MMG curve (Figure 5) does not have a sharp peak, however, slight deviations from this optimal block length do not detract much from pedes-trian accessibility.
With 16 × 32 m plots that may be suitable for walk- up type structures (18 m wide streets), pedestrian accessibility is maximized with eleven plots per frontage, or 22 per block. For larger office buildings, we include an example of the same plot size (32 × 64 m) in two differ-ent orientations. With a narrow edge towards the street, nine plots per block frontage maxi-mize pedestrian accessibility; with a long edge towards the street, only three plots per front-age generate most pedestrian access. In these cases, 732 and 650 neighbouring plots respec-tively are reached in a 15- minute walking
range. As an example of a large mixed- use development plot, a 64 × 128 m plot is used that can fit various combinations of commer-cial and residential buildings in urban settings (64 m and 128 m wide streets). Pedestrian accessibility, using such plots, is maximized with three plots per frontage. Only 172 neigh-bouring plots are reached in a 15- minute walking range compared to 10 079 with the smallest plots. Some of these grid dimensions achieve higher levels of pedestrian accessibil-ity in a 15- minute walk range than any of the built examples studied above. Figure 11 illus-trates the kinds of urban fabric these example grids would generate.
Discussion
We have explored the grid as a common typology of urban layouts and studied how parameters of regular, bi- directional grids affect pedestrian accessibility to surrounding destinations for a typical plot. These param-eters include plot frontages, plot depths, street
Figure 10. Sample plots with prototypical street dimensions.

103Pedestrian accessibility in grid layouts
widths and block lengths that are described by the number of plots assembled in a sin-gle block. While the former three parameters have predictable effects on accessibility – smaller is usually better – the latter does not. Using simulations, it has been shown that the relationship between pedestrian accessibility and block lengths is non- linear and parabolic, suggesting that whether smaller or larger blocks would improve pedestrian accessibility
depends on the size of the block we start with as well as the plot and street dimensions used. When various dimensions for plot frontage and depth, and block length and street width, are combined, then typically smaller blocks do indeed tend to generate higher pedestrian accessibility than larger blocks. But this is not always the case: we have shown scenarios in which larger blocks achieve significantly higher pedestrian accessibility than smaller
Figure 11. Example grids with optimal block lengths that maximize pedestrian accessibility. Top left: Plots ‒ 16 × 32 m; Streets ‒ 18 m; Optimal number of plots per block frontage for walking ‒ 11. Top right: Plots ‒ 64 × 32 m; Streets ‒ 21 m; Optimal number of plots per block frontage for walking ‒ 3. Bottom right: Plots ‒ 64 × 128 m; Streets ‒ 36 m; Optimal number of plots in each block for 600 m walking ‒ 3. Bottom
left: Plots ‒ 32 × 64 m; Streets ‒ 21 m; Optimal number of plots per block frontage for walking ‒ 9.

104 Pedestrian accessibility in grid layouts
blocks comprised of similar plots. This is important since a number of authors have stip-ulated that walkability should increase with smaller blocks. An optimal block size exists for maximizing pedestrian access to surround-ing destinations at every combination of plot and street dimensions. Knowing this opti-mum can help planners foster walkability by adjusting the dimensions of individual block parameters.
Between the four parameters it has been shown that a reduction in plot frontages leads to the largest gains in accessibility, followed by plot depths. Block length adjustments have roughly the same magnitude of influence as street widths, albeit in a non- linear manner. While not the most significant parameter, block lengths might at times present the only lever available for adjusting urban subdivi-sions for pedestrian accessibility.
The effects of grid subdivisions on pedes-trian accessibility have been discussed purely based on a geometrical analysis of grids. No empirical measurements of pedestrian activ-ity were performed; instead the results were obtained from a simulation model. Empirical validation of the described effects of walk-ing behaviour on grids remains the subject of future research. Our accessibility analy-sis was grounded in Hansen’s accessibility index whose results we expect to hold when its two underlying assumptions hold – walk-ing activity is positively related to the number of destinations available and negatively to the travel cost of reaching the destinations. There is ample empirical evidence of these princi-ples at work in pedestrian studies (Boarnet et al., 2011). This suggests that a particular combination of grid dimensions will relate to an increase in the number of people walk-ing, controlling for such covariates as desti-nation attractiveness, the safety and comfort of walking routes, climate, time of day, socio- economic indicators of the area’s users, loca-tion in the broader urban context, and avail-able transport alternatives to walking.
The accessibility effects that result purely from the two- dimensional layout parameters of urban grids may in reality be offset and altered by variations in the built form and land
use that come to occupy a grid. Uneven plot ratios, variable household sizes and employ-ment densities can affect pedestrian acces-sibility as much as the ground layout effects that have been described. For instance, high- rise buildings in one part of the grid can tilt accessibility to floor area towards that part of the grid. The simulation tools used for this study would readily allow weights to be intro-duced for each destination point, to capture their difference in size or intensity, making the empirical specification of such variations pos-sible in future work. However, a simultane-ous parameterization of two- dimensional and three- dimensional urban form could prove challenging to achieve. Building densities do not evolve completely independently of ground conditions – heightened accessibility that results from corner locations, more central locations and optimized grid layouts produces savings in transport costs, which are captured in higher land values. Higher land values in turn tend to produce higher densities. But since built form can be legally regulated and density increases restricted, cause and effect are not always clear. Grid layouts, block sizes and plot sizes can also change over time, cre-ating a complex string of circular causalities in which both built form and ground layouts adapt to each other over time. More interdisci-plinary research between urban morphology, urban economics and planning regulations is required to untangle these interactions.
One of the shortcomings of the present research is that we have explicitly focused on pedestrian access, not vehicular, public transit or bicycle access. Each of these travel modes would generate a different beta value in the gravity index, leading to different grid dimensions that maximize accessibility for that mode. Anecdotal evidence of highway networks, for instance, suggests that there could also be an optimal highway grid size that maximizes spatial accessibility at driv-ing speeds. But for vehicular travel, it makes more sense to optimize arterial road networks and highway networks than individual block and plot subdivisions. We therefore think it is most appropriate to optimize urban street grid dimensions from a pedestrian point of view.

105Pedestrian accessibility in grid layouts
Finally, the simulations were also based on a simple bidirectional typology of grids. It would be interesting to extend the simu-lation methodology to more complex grids that come with more varied plot orientations. Future research could also extend the analysis to partially gridded or non- gridded urban sub-divisions, though some regularity in the sub-division pattern would be necessary in order to assess parameter changes. The simulation software developed for this study can be obtained from the authors by e- mail request. Regular grids analysed in this paper could also form a benchmark to compare results from any irregular subdivision patterns.
References
Anderson, S. (1993) ‘Savannah and the issue of precedent: city plan as resource’, in Bennett, R. (ed.) Settlements in the Americas: cross- cultural perspectives (University of Delaware Press, Newark, DE).
Boarnet, M. G., Joh, K., Siembab, W., Fulton, W. and Nguyen, M. T. (2011) ‘Retrofitting the sub-urbs to increase walking: evidence from a land use- travel study’, Urban Studies 48, 129–59.
Boer, R., Zheng, Y., Overton, A., Ridgeway, G. K. and Cohen, D. A. (2007) ‘Neighborhood design and walking trips in ten U.S. metro-politan areas’, American Journal of Preventive Medicine 32, 298–304.
Castagnoli, F. (1971) Orthogonal town planning in antiquity (MIT Press, Cambridge, MA).
Cervero, R. (1996) ‘Mixed land uses and com-muting: evidence from the American housing survey’, Transportation Research A 30, 361–77.
Cervero, R. and Duncan, M. (2003) ‘Walking, bicycling, and urban landscapes: evidence from the San Francisco Bay area’, American Journal of Public Health 93, 1478–83.
Chisholm, H. (1911) ‘Hyginus gromaticus’, in Encyclopædia Britannica 11th edn (Cambridge University Press, Cambridge).
Ewing, R. and Cervero, R. (2010) ‘Travel and the built environment’, Journal of the American Planning Association 76, 265–94.
Figueiredo, L and Amorim, L. (2007) ‘Decoding the urban grid: or why cities are neither trees nor perfect grids’, unpublished paper pre-sented to the Sixth International Space Syntax Symposium, Istanbul, Turkey.
Forsyth, A., Hearst, M., Oakes, J. M. and Schmitz, K. H. (2008) ‘Design and destinations: factors influencing walking and total physical activity’, Urban Studies 45, 1973–96.
Frank, L. D. and Pivo, G. (1994) ‘Impacts of mixed use and density utilization on three modes of travel: single- occupant vehicle, transit, and walking’, Transportation Research Record 1466, 44–52.
Garbrecht, D. (1978) ‘Walking: facts, assertions, propositions’, Ekistics 45(273), 408‒11.
Gehl, J. (1987) Life between buildings : using pub-lic space (Van Nostrand Reinhold, New York).
Gehl, J. (2010) Cities for people 1st edn (Island Press, Washington, DC).
Gell, A. (1985) ‘How to read a map: remarks on the practical logic of navigation’, Man 20, 271–86.
Grant, J. (2001) ‘The dark side of the grid: power and urban design’, Planning Perspectives 16, 219–41.
Guo, Z. (2009) ‘Does the pedestrian environment affect the utility of walking? A case of path choice in downtown Boston’, Transportation Research Part D 14, 343–52.
Guy, C. M. and Wrigley, N. (1987) ‘Walking trips to shops in British cities’, Town Planning Review 58, 63–79.
Handy, S. and Niemeier, A. D. (1997) ‘Measuring accessibility: an exploration of issues and alternatives’, Environment and Planning A 29, 1175–94.
Hansen, W. G. (1959) ‘How accessibility shapes land use’, Journal of the American Planning Association, 25 (2), 73–6.
Hess, P. M., Moudon, A. V., Snyder, M. C. and Stanilov, K. (1999) ‘Site design and pedestrian travel’, Transportation Research Record 1674, 9–19.
Hillier, B. (1999) ‘Centrality as a process: account-ing for attraction inequalities in deformed grids’, Urban Design 4 (3–4), 107–27.
Hoyt, H. (1933) One hundred years of land values in Chicago, 1830–1930 (University of Chicago Press, Chicago, IL).
Institute of Transportation Engineers (2010) Designing walkable urban thoroughfares: a context sensitive approach. (Institute of Transportation Engineers, Washington, DC).
Jacobs, A. B. (1993) Great streets (MIT Press, Cambridge, MA).
Jacobs, J. (1961) The death and life of great American cities (Random House, New York).
Joh, K., Boarnet, M. G. and Nguyen, M. T. (2009) ‘Interactions between race/ethnicity, attitude,

106 Pedestrian accessibility in grid layouts
and crime: analyzing walking trips in the South Bay Area’, unpublished paper presented at the 88th Annual Meeting of the Transportation Research Board, Washington, DC, January.
Kostof, S. (1993) The city shaped: urban patterns and meanings through history (Bulfinch, New York).
Krier, L. (1984) ‘Urban components’, Architectural Design 54 (7/8), 43–9.
Li, Y. and Tsukaguchi, H. (2005) ‘Relationship between network topology and pedestrian route choice behaviour’, Journal of Eastern Asia Society for Transportation Studies 6, 241–8.
Lynch, K. (1984) Good city form (MIT Press, Cambridge, MA).
Mangin, D. and Panerai, P. (1999) Projet urbain (Parenthèses, Marseille).
Marshall, S. (2005) Streets and patterns (Spon Press, London).
Moudon, A. V. (1986) Built for change : neighbor-hood architecture in San Francisco (MIT Press Cambridge, MA).
Moughtin, C. (2003) Urban design: street and square 3rd edn (Architectural Press, Oxford).
Ozbil, A., Peponis, J. and Stone, B. (2011) ‘Understanding the link between street con-nectivity, land use and pedestrian flows’, Urban Design International16, 125–41.
Panerai, P., Castex, J. and Depaule, J- C. (1997) Formes urbaines : de l’îlot à la barre (Parenthèses, Marseille).
Pushkarev, B. and Zupan, J. (1975) Urban space for pedestrians (MIT Press, Cambridge, MA).
Reps, J. W. (1965) The making of urban America: a history of city planning in the United States (Princeton University Press, Princeton, NJ).
Sadalla, E. K. and Montello, D. R. (1989) ‘Remembering changes in direction’, Environment and Behavior 21, 346–63.
Shpuza, E. (2007) ‘Urban shapes and urban grids: a comparative study of Adriatic and Ionian coastal cities’, unpublished paper pre-sented to the Sixth International Space Syntax Symposium, Istanbul, Turkey.
Siksna, A. (1998) ‘City centre blocks and their evo-lution: a comparative study of eight American and Australian CBDs’, Journal of Urban Design 3, 253–83.
Speck, J. (2013) Walkable city: how downtown can save America one step at a time (North Point Press, New York).
Steadman, P. (2006) ‘Why are most buildings rec-tangular?’, Architectural Research Quarterly 10, 119‒30.
Takeuchi, D. (1977) ‘Hokō- sha no keiro sentaku kōdō ni kansuru kenkyū’ (‘A study on pedes-trian route choice behaviour’), Doboku Gakkai no Yokou shū (Proceedings of Japanese Society of Civil Engineers) 259, 91‒101.
Targa, F. and Clifton, K. (2005) ‘The built envi-ronment and trip generation for non- motorized travel’, Journal of Transportation and Statistics 8 (3), 55–70.
Transportation Research Board (2014) Transit capacity and quality of service manual 2nd edn (Transportation Research Board, Washington, DC).
UN- Habitat (2013) Streets as public spaces and drivers of urban prosperity (UN- Habitat, Nairobi).
Zacharias, J. (2001) ‘Pedestrian behavior and perception in urban walking environments’, Journal of Planning Literature 16, 3–18.