pediatric nutrition - core
TRANSCRIPT

PEDIATRIC NUTRITION
SURVEILLANCE SYSTEM CENTERS FOR DISEASE CONTROL AND
PREVENTION (CDC) / MASSACHUSETTS
WOMEN, INFANTS AND CHILDREN (WIC) NUTRITION PROGRAM
Massachusetts Department of Public Health Bureau of Family Health and Nutrition
Nutrition Division 2009 PEDIATRIC DATA REPORT
AUGUST, 2011

2009 Massachusetts Pediatric Nutrition Surveillance Report Page i
PEDIATRIC NUTRITION
SURVEILLANCE SYSTEM CDC / MASSACHUSETTS WIC
NUTRITION PROGRAM
2009 Pediatric Data Report
Deval L. Patrick, Governor Timothy P. Murray, Lieutenant Governor
JudyAnn Bigby, MD, Secretary of Health and Human Services John Auerbach, Commissioner, Department of Public Health
Ron Benham, Bureau Director, Bureau of Family Health and Nutrition
Judy Hause, MPH, Director, Massachusetts WIC Program Hafsatou Diop, MD, MPH, Director, Office of Data Translation
Massachusetts Department of Public Health
AUGUST 2011

2009 Massachusetts Pediatric Nutrition Surveillance Report Page ii
ACKNOWLEDGEMENTS This report was prepared in the Nutrition Division and Office of Data Translation, Bureau of Family Health and Nutrition, by Stella G. Uzogara, PhD, MS. Special thanks are extended to Adeline Mega, Lindsay Neagle, Anne Pearson, Rachel Colchamiro and Ellen Tolan, of the the Massachusetts WIC Program. We also thank Elizabeth Greywolf of Office of Statistics and Evaluation and other reviewers at DPH for reviewing the report. In addition, we acknowledge the local WIC program staff for their efforts in collecting the data.
For additional copies of this report, contact: The Massachusetts WIC Program Nutrition Division, Bureau of Family Health and Nutrition Massachusetts Department of Public Health 250 Washington Street, Sixth Floor Boston, MA 02108 - 4619 Phone: (617) 624-6100 Fax: (617) 624-6179 TTY: (617) 624-5992

2009 Massachusetts Pediatric Nutrition Surveillance Report Page iii
TABLE OF CONTENTS ................................................................................................ PAGE
Acknowledgements.................................................................................................................. ii
Table of Contents.................................................................................................................... iii
Introduction............................................................................................................................... v
Limitations .............................................................................................................................. vii
Executive Summary ...............................................................................................................viii
Demographic Characteristics
Figure 1: Source of Data ....................................................................................................................... 1
Figure 2: Racial and Ethnic Distribution................................................................................................ 2
Figure 3: Age Distribution ...................................................................................................................... 3
Table 1: Race/Ethnicity and Age Distribution of Children Participating in the
Massachusetts 2008 PedNSS ................................................................................................ 4
Birth Weight Characteristics
Figure 4a: Prevalence of Low Birth Weight by Race and Ethnicity ...................................................... 5
Figure 4b: Trends in Prevalence of Low Birth Weight by Race and Ethnicity ...................................... 7
Figure 5: Prevalence of High Birth Weight by Race and Ethnicity...................................................... 8
Figure 6: Trends in Prevalence of High Birth Weight by Race and Ethnicity ...................................... 9
Indicators of Nutritional Status: Short Stature, Underweight and Obesity
Figure 7: Prevalence of Short Stature, Underweight, and Obesity in children less than
Five years ............................................................................................................................. 10
Figure 8: Prevalence of Short Stature, by Race and Ethnicity......................................................11
Figure 9: Trends in Prevalence of Short Stature by Race and Ethnicity ........................................... 13
Figure 10: Prevalence of Underweight, by Race and Ethnicity........................................................... 14
Figure 11: Prevalence of Underweight, by Age................................................................................... 16
Figure 12: Trends in Prevalence of Underweight by Race and Ethnicity ........................................... 17
Indicators of Nutritional Status: Obesity and Overweight Figure 13a: Prevalence of Obesity, by Race and Ethnicity................................................................. 18
Figure 13b: Prevalence of Obesity, by Age ......................................................................................... 20
Figure 14a: Prevalence of Obesity and Overweight, by Race and Ethnicity, in Children
Two to Less than Five Years Old............................................................................. 21
Figure 14b: Prevalence of Obesity and Overweight, by Age, in Children
Two to Less than Five Years Old............................................................................. 22
Figure 15: Trends in Prevalence of Overweight, by Race and Ethnicity, in Children
Two to Less than Five Years Old............................................................................ 24
Figure 16a: Trends in Prevalence of Obesity, by Race and Ethnicity, in Children
Two to Less than Five Years Old............................................................................. 25

2009 Massachusetts Pediatric Nutrition Surveillance Report Page iv
Figure 16b: Trends in Prevalence of Obesity, by Age, in Children
Two to Less than Five Years Old..................................................................................... 26
Anemia Characteristics
Figure 17a: Prevalence of Anemia, by Race and Ethnicity................................................................. 27
Figure 17b: Prevalence of Anemia, by Age ......................................................................................... 29
Figure 18a: Trends in Prevalence of Anemia, by Race and Ethnicity ................................................ 30
Figure 18b: Trends in Prevalence of Anemia, by Age......................................................................... 31
Infant Feeding Characteristics
Figure 19a: Percentage of Infants Ever Breastfed, by Race and Ethnicity ........................................ 32
Figure 19b: Trends in the Percentage of Infants Ever Breastfed, by Race and Ethnicity.............34
Figure 20a: Percentage of Infants Breastfed at Least Six months, by Race and Ethnicity ............... 35
Figure 20b: Trends in the Percentage of Infants Breastfed At Least Six Months,
By Race and Ethnicity ..................................................................................................... 36
Figure 21a: Percentage of Infants Breastfed at Least 12 months, by Race and Ethnicity................. 37
Figure 21b: Trends in the Percentage of Infants Breastfed At Least 12 Months,
By Race and Ethnicity...............................................................................................38
Figure 22: Trends in the Percentage of Infants Ever Breastfed, and Breastfed at
Least Six and 12 Months ...........................................................................................39
References ............................................................................................................................40
APPENDIX 1: 2009 PARTICIPATING LOCAL WIC PROGRAMS ...................................44
APPENDIX 2: STATE MAPS OF COUNTY DATA ................................................................... 45
APPENDIX 3: Trends Charts for 2009 PedNSS............................................................. 51

2009 Massachusetts Pediatric Nutrition Surveillance Report Page v
Introduction Purpose of Nutrition Monitoring Nutritional status affects every aspect of a child's health, including normal growth and development, physical activity, and response to serious illness. Nutritional assessment is an integral part of pediatric care, and all children should be screened routinely for abnormalities of growth. At the population level, child growth is an indicator of overall population health. Nutrition surveillance monitors trends and patterns of key indicators of childhood nutritional status in order to identify existing and emerging needs and to target and develop appropriate nutrition interventions. Key indicators of childhood nutritional status include height, weight, anemia, birth weight, overweight, obesity and breastfeeding history.
National Pediatric Nutrition Surveillance In 1973, the Centers for Disease Control and Prevention (CDC) began working with five United States (U.S.) states to develop a system for continuously monitoring the growth and nutritional status of low-income children in federally funded maternal and child health and nutrition programs. By 2009, the Pediatric Nutrition Surveillance System (PedNSS) had expanded to include 43 states, the District of Columbia, six Indian Tribal Organizations (ITOs) and two U.S. territories. The PedNSS collects and analyzes data on demographic characteristics, birth weight characteristics, indicators of nutritional status, and infant-feeding practices for children from birth to age 20 years. Some national PedNSS data from certain states may include not only infants and children up to age five (for example Massachusetts) but also children and adolescents up to 20 years of age. Other goals of the PedNSS include data interpretation and dissemination. Information from PedNSS is very useful in policy making, priority setting, planning, implementation and evaluation of nutrition programs. In 2009, 85.3% of national PedNSS data were obtained through the Special Supplemental Nutrition Program for Women, Infants and Children (the WIC Program), and the rest of the remaining data were obtained from the Early Periodic Screening Diagnosis and Treatment (EPSDT) program (5.2%), the Title V Maternal and Child Health (MCH) program (0.4%), and others such as Head Start (9.1%).
Pediatric Nutrition Surveillance in Massachusetts
Massachusetts (MA) has participated in the national PedNSS since 1993. All MA data are collected on infants and children up to age five, who attend WIC clinics for routine care, nutrition education, and supplemental foods. These data are aggregated at the state level and submitted to CDC as transaction files for analysis, using a Secure Data Network. The CDC then produces a national nutrition surveillance report by using PedNSS data from MA and other states. The CDC also produces a surveillance report specific for the state of MA as one of the PedNSS

2009 Massachusetts Pediatric Nutrition Surveillance Report Page vi
contributors. As WIC participation is dependent upon income eligibility, nutrition risk eligibility criteria and other requirements, these data are not representative of the population of MA children as a whole. Furthermore, income eligibility for WIC requires that applicants present income equal to or less than the federal guidelines. Adjunctive eligibility is based on participation in certain programs like Supplemental Nutrition Assistance Program (SNAP) formerly known as Food Stamps, Transitional Assistance to Needy Families (TANF) formerly known as Aid to Families with Dependent Children (AFDC), other state administered programs and Medicaid. Nutritional risk eligibility criteria include medically-based conditions (for example anemia, underweight, growth failure and poor pregnancy outcomes) and dietary-based conditions (such as nutrient deficiencies or inadequate food intake).
Purpose of the Report Starting with the 2003 report, data analysis and chart preparation were provided by the CDC and not by the Office of Data Translation (ODT) at the Massachusetts Department of Public Health (MDPH). Consequently the 2009 data analysis and graphics were also done by the CDC. This report is a summary of all Massachusetts PedNSS data collected during the 2009 calendar year. It also highlights data trends from 2000 through 2009. The report serves two purposes: (1) It provides analyses of Massachusetts-specific data, and (2) it serves as an annual summary report for the Massachusetts WIC Program.
Regarding the first purpose, the 2009 MA PedNSS data are compared with the 2008 (the prior year) national PedNSS data which was the most current national data available at the time of MA PedNSS data analysis. It should be noted that the national data are not representative of the total population of U.S. children. Comparison of the Massachusetts and national data can be informative only regarding the health and nutritional status of low to moderate-income children in Massachusetts relative to children in similar circumstances across the nation.
Regarding the second purpose, this report will assist the Massachusetts WIC Program in identifying specific risk factors and needs among the participant population. This data also supports and facilitates the planning, implementation, and evaluation of specific nutrition interventions.
The data obtained for various indicators are usually compared to the Healthy People 2010 program benchmarks or targets (USDA HP 2010 published in 2000) to see whether the MA PedNSS infants and children are meeting these national targets and to determine areas that need improvement. For example, one of the HP-2010 Objectives is to reduce prevalence of low birth weight to no more than 5% of all live births; other targets aim to reduce short stature among low income children aged less than 5 years to 5%, to reduce underweight among low income

2009 Massachusetts Pediatric Nutrition Surveillance Report Page vii
children aged less than 5 years to 5%, and to increase prevalence of breastfeeding in the early post partum period to 75%.
Limitations MA PedNSS data are exclusive to infants and children in the WIC program. Certain data on demographics, nutritional status, anemia and infant feeding practices should be interpreted with caution as they tend to be much different than the data for the general MA population published by the MA Department of Public Health. This discrepancy could occur because MA PedNSS data are based on low income infants and children participating in the WIC Program only and such data is not representative of the state of Massachusetts as a whole. There were also small number limitations. The CDC does not generate statistics based on fewer than 100 records as the data will not be statistically stable. Therefore, the rates and proportions based on fewer than 100 observations are suppressed and should be interpreted cautiously. Statistics for some variables are missing for American Indian and multiple race MA PedNSS populations aged from two years to less than five years old if the group presented fewer than 100 records. . Some data such as income, birth weight information, mother’s age and breastfeeding characteristics were not obtained from certain clients as the clients declined to report them. This lack of information will impact determination of household poverty, nutritional status, low birth weight and high birth weight as well as other factors that impact the health of the child.

2009 Massachusetts Pediatric Nutrition Surveillance Report Page viii
Executive Summary Demographic Characteristics The 2009 Massachusetts Pediatric Nutrition Surveillance System (MA PedNSS)
report includes records representing 137,376 children ages zero to 59 months
(Table1).
Fifty-six percent (55.7%) of the 2009 MA PedNSS population were children of color compared to the national PedNSS population, where 68.3% were children of color (Figure 2).
Birth Weight Characteristics The overall prevalence of low birth weight (LBW), defined as birth weight less
than 2500 grams, and was 8.7% in 2009 MA PedNSS. This rate was slightly lower than the national LBW prevalence of 9.0%.
Low birth weight in MA PedNSS was most prevalent among Black non-Hispanic (11.0%) children and least prevalent among Asian (8.0%) children, followed by Hispanic (8.2%) and White non-Hispanic (8.3%) children (Figure 4a).
The overall prevalence of LBW has remained stable in the past ten years in MA PedNSS, from 8.8% in 2000 to 8.7% in 2009. During this period, the prevalence of LBW has been higher but stable among Black non-Hispanic infants (from 11.6% in 2000 to 11.0% in 2009) compared to MA infants from other races combined (Figure 4b).
The overall prevalence of high birth weight (HBW), represented as birth weight greater than 4000g, was 7.9% in 2009 MA PedNSS. This rate was slightly higher than the HBW prevalence of 6.4% in the national PedNSS.
Indicators of Nutritional Status
Short Stature The prevalence of short stature (height-for-age < 5th percentile) was 4.5% and
6.0%, respectively, among children represented in the MA PedNSS and their national counterparts (Figures 7).
Asian and White non-Hispanic children less than five years old had the highest prevalence of short stature (4.8%) in 2009 MA PedNSS (Figure 8).

2009 Massachusetts Pediatric Nutrition Surveillance Report Page ix
Overall, the percentage of MA PedNSS children with short stature has not changed significantly in the past ten years (from 4.7% prevalence in 2000 to 4.5% prevalence in 2009) (Figure 9).
Among Hispanic children, the proportion with short stature decreased slightly
from 4.4% in 2000 to 4.2% in 2009 (Figure 9). MA WIC has met the HP 2010 goal which is to reduce growth retardation or
short stature among low income children underage five years to five percent. Underweight The prevalence of underweight (weight-for-height < 5th percentile as per CDC
Growth Charts 2000) was 5.5% among all children represented in the MA PedNSS and 4.5% among children in the national PedNSS during the same period (Figure 10).
Asian children in MA PedNSS had the highest prevalence of underweight (7.4%)
and Hispanic children had the lowest (4.5%) (Figure 10). While over ten percent (10.6%) of children zero to 11 months of age represented in
2009 MA PedNSS were considered underweight, the proportion of children in all other age groups who were categorized as underweight was 5.5% approaching the Healthy People 2010 target of five percent. This is likely due to the fact that infants who are born with low birth weight are unlikely to attain catch-up growth by the time of first data collection. Data collection is usually done in the first two months of life for children zero to 11 months (Figure 11).
The prevalence of underweight children generally decreased (though slightly) among all race/Hispanic ethnicity categories in MA PedNSS for the past ten years from 5.8% in 2000 to 5.6% in 2009, and the prevalence of underweight was consistently higher among Asian children, from 7.3% in 2000 to 7.4% in 2009, but consistently lower among Hispanic children, from 4.4% in 2000 to 4.5% in 2009 (Figure 12).
Obesity and Overweight Overall prevalence of obesity slightly increased among all racial groups in MA
PedNSS from 14.5% in 2000 to 14.7% in 2009. The overall prevalence of overweight slightly changed in the same decade from 17.0% in 2000 to 16.9% in 2009. (Figures 15 & 16a)

2009 Massachusetts Pediatric Nutrition Surveillance Report Page x
The prevalence of obesity in MA PedNSS for children less than five years old was 14.7% in 2009 while in the national PedNSS it was 14.1% (Figure 13a).
In the 2009 MA PedNSS, the prevalence of obesity varied by race and ethnicity. Over eighteen percent (18.5%) of Hispanic,14.1% of Black non-Hispanic and 13.0% of White non-Hispanic children between two and five years old were obese compared to 8.5% of Asian children between two and five years old (Figure 13a).
In the 2009 MA PedNSS, the prevalence of obesity also varied by age. About 18 percent (18.2%) of children who were one year old, 14.3% of children who were two years old, 17.5 % of children who were three years old and 19.2% of children at four years old were described as obese, compared to 9.2% of children under one year of age (Figure 13b).
The overall prevalence of obesity among MA PedNSS children between two
years and less than five years old increased slightly in the past ten years among all race/Hispanic ethnicity categories from 16.2% in 2000 to 16.8% in 2009. (Figure 16a)
Hispanic children aged two years to less than five years consistently had the
highest prevalence of obesity ranging from 19.9% in 2000 to 21.2% in 2009 while Asian children had the lowest prevalence of obesity (from 13.3% in 2000 to 10.2% in 2009) (Figure 16a).
Four-year olds also consistently had the highest prevalence of obesity over the
last ten years, from 17.1% in 2000 to 19.2% in 2009, compared to children less than 1 year old whose prevalence for obesity ranged from 9.4% in 2000 to 9.2% in 2009(Figure 13b).
One third (33.7%) of children between two years and less than five years old
represented in the 2009 MA PedNSS were overweight or obese compared to 31.3% among children in the national PedNSS (Figure 14b). The proportion of all children categorized as overweight in MA PedNSS (16.9%) is similar to the proportion of children in the national PedNSS (16.5%).
Anemia The overall prevalence of anemia in 2009 for children represented in the MA
PedNSS was 11.3%, compared to 14.9% in the national PedNSS (Figure 17a). Anemia prevalence in 2009 MA PedNSS varied by race and ethnicity and was
highest among Black non-Hispanic children (16.9%), and lowest among White non-Hispanic children (9.5%) (Figure 17a).

2009 Massachusetts Pediatric Nutrition Surveillance Report Page xi
Anemia prevalence also varied by age in MA PedNSS (Fig.17b) and was highest among children between six to 12 months of age (15.1%) and lowest in children between three years and less than 5 years (8.8%) (Figure 17b). The anemia prevalence in the national PedNSS, was highest in children between 12 and 18
months old (18.2%) but lowest in children three years and above but less than five years old (10.9%) (Figure 17b).
The overall prevalence of anemia in MA PedNSS decreased in the past ten years in all race/Hispanic ethnicity categories (from 14.4% in 2000 to 11.3% in 2009). Anemia prevalence was consistently high among Black non-Hispanic children, but decreased in the last ten years (from 19.4% in 2000 to 16.9% in 2009) (Fig.18). Anemia prevalence in Asian children fell considerably in the last ten years from 16.0% in 2000 to 10.2 % in 2009.
Infant-Feeding Practices
Seventy four percent (74.0%) of all infants in the 2009 Massachusetts PedNSS were ever breastfed (Fig.19a) compared to 62.0% of children in the national PedNSS. "Ever breastfed" includes those infants whose mother initiated breastfeeding, either by breastfeeding exclusively or breastfeeding in addition to formula feeding.
Black non-Hispanic infants (83.4%) had the highest prevalence of breastfeeding
initiation, followed by Hispanic infants (81.4%) (Figure 19a). White non-Hispanic infants had the lowest breast feeding initiation rate (66.3%)
among 2009 MA PedNSS children (Figure 19a).
In the last ten years, the percentages of infants in the MA PedNSS that were breastfed increased in all categories of breastfeeding (Figure 19b).
For infants ever breastfed, the proportion increased from 61.0% in 2000 to 74.0% in 2009.
For infants breastfed for at least 6 months, the percentage increased from 20.6% in 2000 to 28.3% in 2009.
For infants breast fed for at least 12 months, breastfeeding percent increased from 9.2% in 2000 to 14.7% in 2009.
Both Black non-Hispanic (83.4%) and Hispanic (81.4%) infants in the 2009 MA
PedNSS surpassed the HP 2010 goal of ever being breastfed (target set at 75.0%).

2009 Massachusetts Pediatric Nutrition Surveillance Report Page xii
Conclusions In 2009, 4.5% of children less than five years of age who participated in the MA PedNSS program were short for their ages, 5.5% were underweight and 14.7% were obese. The overall prevalence of short stature (4.5%) and underweight (5.5%) among the 2009 MA PedNSS children were near the HP 2010 target of five percent, suggesting that underweight and short stature may not be significant public health problems for the state of Massachusetts as a whole, although differences exist among the various ethnic groups. For example, the proportion of underweight children in MA PedNSS was highest among Asian (7.4%), but lowest among Hispanic (4.5%) and American Indian (4.8%) children. The prevalence of short stature was highest (4.8%) among Asian and White non-Hispanic children less than five years old. The prevalence of obesity was highest among Hispanic children (18.5%), followed by Black non-Hispanic (14.1%), White non-Hispanic (13.0%), American Indian (11.5%) and Asian (8.5%) children, indicating the need for effective public health interventions to reverse this trend in MA PedNSS populations, especially in the Hispanic ethnic group.
In addition, the overall prevalence of anemia was high (11.3%) for children in all racial and ethnic groups in MA PedNSS. Although lower than the national PedNSS rates, the highest prevalence of anemia in MA PedNSS was observed among Black non-Hispanic children (16.9%) while the lowest prevalence was observed among White non-Hispanic children (9.5%). Possible causes of childhood anemia include deficiencies in iron, folate or vitamin B-12 or are due to chronic infections, inflammation and hereditary hemoglobinopathies including sickle cell disease. Seventy-four percent (74.0%) of all infants in the MA PedNSS were ever breastfed. Black non-Hispanic infants (83.4%) had the highest prevalence of breastfeeding initiation, followed by Hispanic infants (81.4%), while White non-Hispanic infants had the lowest breastfeeding initiation rate (66.3%) among MA PedNSS children.
According to the US Department of Health and Human Services report for Healthy People 2010 published in 2000, the HP 2010 target is to increase the proportion of children who were ever breastfed to 75%, breastfed at six months to 50% and breast fed at 12 months to 25%. Both Black non-Hispanic and Hispanic children in the 2009 MA PedNSS surpassed the HP 2010 target for breastfeeding initiation.

2009 Massachusetts Pediatric Nutrition Surveillance Report Page 1
Demographics: Source of Data
Figure 1-Source of Dataamong Children Aged Less than Five Years
Figure 1-Source of Dataamong Children Aged Less than Five Years
2009 MA PedNSS
* Special Supplemental Nutrition Program for Women, Infants and Children. ** Early Periodic Screening, Diagnosis, and Treatment Program. + Title V Maternal and Child Health Program. ++ Includes Head Start.
0 10 20 30 40 50 60 70 80 90 100
MA
Nation
Percentage
WICEPSDT**MCH+Other++
• The 2009 MA PedNSS included records representing 137,376 children ages 0 to 59 months (Table 1).
• In the 2009 MA PedNSS, the entire (100%) dataset was derived from the
Special Supplemental Nutrition Program for Women, Infants, and Children (WIC).
• Among the national PedNSS population, 85.3% of the 2009 dataset was based on data derived from WIC. Other data sources included the Early Periodic Screening Diagnosis and Treatment or EPSDT Program (5.2%), the Title V Maternal and Child Health Program or MCH (0.4%), and other programs including Head Start (9.1%).

2009 Massachusetts Pediatric Nutrition Surveillance Report Page 2
Demographics: Race and Ethnicity
Figure 2-Racial and Ethnic Distributionamong Children Aged Less than Five Years
Figure 2-Racial and Ethnic Distributionamong Children Aged Less than Five Years
2009 MA PedNSS
0 10 20 30 40 50 60 70 80 90 100
MA
Nation
Percentage
White
Black
Hispanic
American Indian
Asian
Multiple
Other
• In 2009, the racial and ethnic distribution of the MA PedNSS population was comprised of 44.3% White non-Hispanic, 18.6% Black non-Hispanic, 31.7% Hispanic, and 5.3% Asian /Pacific Islander and 0.1% American Indian/Alaskan Native children as well as children from all other races or children with multiple races (Figure 2 and Table 1).
• In 2009, 55.7% of the MA PedNSS population consisted of children of
color.
• While the proportion of Black non-Hispanic children varied slightly only between the 2009 MA PedNSS (18.6%) and the national PedNSS(18.8%), the MA PedNSS population had a larger proportion of White non-Hispanic (44.3%) and Asian (5.3%) children than the national PedNSS population (with 31.7% White non-Hispanic and 2.7% Asian children). However, there were a greater proportion of Hispanic children nationally (41.4%) than in the MA PedNSS population (31.7%).

2009 Massachusetts Pediatric Nutrition Surveillance Report Page 3
Demographics: Age Distribution
Figure 3-Age Distribution among Children Aged Less than Five Years
Figure 3-Age Distribution among Children Aged Less than Five Years
2009 MA PedNSS
0 10 20 30 40 50 60 70 80 90 100
MA
Nation
Percentage
<1 Year1 Year2 Years3-<5 Years
• Almost a third (31.5%) of the total 2009 MA PedNSS population was under one year of age, 21.3% were one year old, 17.7% were two years old, and 29.6% were between three and less than five years old.
• The national data displays a similar picture. However a greater
proportion of children nationally (35.7%) were less than one year old (Figure 3).

2009 Massachusetts Pediatric Nutrition Surveillance Report Page 4
Demographics: Race/Ethnicity and Age Distribution of Children Table 1. Race/Ethnicity and Age Distribution of Children Participating in the Massachusetts 2009 PedNSS Race and Ethnic Distribution Number Percent
White non-Hispanic 60, 902 44.3Black non-Hispanic 25, 581 18.6Hispanic 43,486 31.7American Indian 171 0.1 Asian/Pacific Islander 7236 5.3Multiple Races 0 0.0All Other 0 0.0Total 137,376 100.0
Age Distribution 0 - 5 months 32,745 23.86 - 11 months 10,461 7.612 - 23 months 29,203 21.324 - 35 months 24,255 17.736- 59 months 40,712 29.6Total 137,376 100.0

2009 Massachusetts Pediatric Nutrition Surveillance Report Page 5
Low Birth Weight
Figure 4a-Prevalence of Low Birth Weight*by Race and Ethnicity
Figure 4a-Prevalence of Low Birth Weight*by Race and Ethnicity
0
5
10
15
White Black Hispanic AmericanIndian
Asian Multiple Total
Per
cent
age
MA Nation
2009 MA PedNSS* < 2500 grams, among infants born during the reporting period. ** Reduce low birthweight to 5% of live births.
Year 2010 target**
One of the important determinants of neonatal and post neonatal mortality is low birth weight (LBW), defined as birth weight less than 2500g (IOM 1985). Low birth weight infants are at increased risk for neonatal mortality, developmental delay, and for other medical complications during infancy, that range from neuro-developmental disabilities to respiratory problems, and such children tend to fare worse when compared to peers of normal birth weight. Low birth weight infants are also at increased risk for conditions affecting the lower respiratory tract and future cognitive and behavioral difficulties (Phillip1995, Taylor et al 2000, Hack et al 2002, Bhutta et al 2002 and Reichman 2005).
• The overall prevalence of LBW in the MA PedNSS (8.7%) was higher
than in the general MA population reported at 7.8% (according to the 2008 MA Birth Report published by MA Department of Public Health in 2010). This discrepancy may be due to the fact that the MA PedNSS data are based on children participating in the WIC Program only (from low-income and minority families).
• The overall prevalence of LBW in the 2009 MA PedNSS was 8.7% while in the national PedNSS it was 9.0%.

2009 Massachusetts Pediatric Nutrition Surveillance Report Page 6
• Among the 2009 MA PedNSS population, the prevalence of LBW was higher for Black non-Hispanic infants (11.0%) than for White non-Hispanic (8.3%), Hispanic (8.2%) and Asian (8.0%) infants.
• Similarly, in the national PedNSS, the prevalence of LBW was higher for
Black non-Hispanic infants (13.1%) than for infants with multiple races (8.9%), White non-Hispanic (8.5%), Asian (8.3%), American Indian (7.7%) and Hispanic (7.4%) infants (Figure 4a).
• The HP 2010 target is to reduce LBW to no more than five percent of all
live births. Since the prevalence of LBW was high among all PedNSS infants both in MA (8.7%) and nationally (9.0%) with Black non-Hispanic having the highest prevalence, all such infants are at increased risk for various health problems and should be targeted for appropriate interventions.
• No statistics for LBW are shown in 2009 for American Indian and multiple
race MA PedNSS populations aged from two years to less than five years old as the group had fewer than 100 records. The CDC does not generate statistics based on fewer than 100 records as the data will not be statistically stable (Figure 4a).

2009 Massachusetts Pediatric Nutrition Surveillance Report Page 7
Trends in the Prevalence of Low Birth Weight, by Race and Ethnicity
Figure 4b-Trends in Prevalence of Low Birth Weight* by Race and Ethnicity in 2009 MA PedNSS
Figure 4b-Trends in Prevalence of Low Birth Weight* by Race and Ethnicity in 2009 MA PedNSS
0
5
10
15
2000 2001 2002 2003 2004 2005 2006 2007 2008 2009
Year
Per
cent
age
White Black Hispanic Asian Total
2009 MA PedNSS* < 2500 grams, among infants born during the reporting period.
Year 2010 target: reduce low birthweight to 5% of live births.
• In the 2009 MA PedNSS, the overall prevalence of LBW for infants aged two years to under five years of age has remained stable in the past ten years across all race/ethnicity categories, from 2000 (8.8%) to 2009 (8.7%).
• A small increase (0.7%) in LBW was seen among Asian infants where the
prevalence of LBW slightly increased from 7.3% in 2000 to 8.0% in 2009. .
• The prevalence of LBW among Black non-Hispanic infants has remained consistently high compared to other races from 2000 (11.6%) to 2009 (11.0%).

2009 Massachusetts Pediatric Nutrition Surveillance Report Page 8
High Birth Weight
Figure 5-Prevalence of High Birth Weight*by Race and Ethnicity
Figure 5-Prevalence of High Birth Weight*by Race and Ethnicity
0
5
10
White Black Hispanic AmericanIndian
Asian Multiple Total
Per
cent
age
MA Nation
2009 MA PedNSS* > 4000 grams, among infants born during the reporting period.
High birth weight (HBW), defined as birth weight >4000 g, also called macrosomia, increases the risk for injury and or death during delivery. Such risks include birth injuries such as shoulder dystocia, broken clavicles, neurological damage, prolonged vaginal delivery associated with increased incidence of cesarean delivery, respiratory distress and fetal death due to asphyxia, and other medical complications including childhood asthma and inflammatory conditions. High birth weight infants are also at increased risk for conditions such as diabetes, childhood obesity, adult obesity, lower respiratory tract conditions, hypertension and future cardiovascular diseases (Jolly et al 2003).
• White non-Hispanic (9.2%) and Hispanic (7.3%) infants had the highest prevalence of HBW in the 2009 MA PedNSS. Black non-Hispanic (6.2%) and Asian (4.7%) infants in the 2009 MA PedNSS had the lowest prevalence of high birth weight.
• The prevalence of HBW for 2009 MA PedNSS was not calculated for
American Indian /Alaskan Native and multiple race children, and hence not displayed in the above graph (Figure 5) because fewer than 100 records were available for analysis for each group at this time period. The CDC does not generate statistics based on fewer than 100 records. The prevalence of HBW was 9.1% for American Indian children in
the national PedNSS.

2009 Massachusetts Pediatric Nutrition Surveillance Report Page 9
Trends in the Prevalence of HBW by Race and Ethnicity
Figure 6-Trends in Prevalence of High Birth Weightby Race and Ethnicity in MA PedNSS
Figure 6-Trends in Prevalence of High Birth Weight*by Race and Ethnicity in MA PedNSS
2009 MA PedNSS* > 4000 grams, among infants born during the reporting period.
0
5
10
15
2000 2001 2002 2003 2004 2005 2006 2007 2008 2009Year
Per
cent
age
White Black Hispanic Asian Total
• In the past ten years, the overall trend showed a slight decrease in HBW, from 8.7% in 2000 to 7.9% in 2009. Asian infants experienced a small increase in HBW from 4.1% in 2000 to 4.7% in 2009.
• Between 2000 and 2009, the prevalence of HBW for MA PedNSS was
not calculated for American Indian /Alaskan Native and multiple race infants, and hence not displayed in the above graph (Figure 6) because fewer than 100 records were available for analysis for each population group in each year at this time period. The CDC does not generate statistics based on fewer than 100 records.

2009 Massachusetts Pediatric Nutrition Surveillance Report Page 10
Prevalence of Short Stature, Underweight and Obesity, by Age
Figure 7-Prevalence of Short Stature, Underweight and Obesity*among Children Aged Less than Five Years
Figure 7-Prevalence of Short Stature, Underweight and Obesity*among Children Aged Less than Five Years
0
5
10
15
20
Short Stature Underweight Obese
Per
cent
age
MA Nation
2009 MA PedNSS
* Short stature: < 5th percentile length or height-for-age; underweight: < 5th percentile weight-for-length or BMI-for-age; obese: > 95th percentile weight-for-length or BMI-for-age, CDC Growth Charts, 2000.
• In 2009, 4.5% of children less than five years of age who participated in the MA PedNSS program were short for their age, 5.5% were underweight and 14.7% were obese.
• The prevalence of short stature (4.5%) in the 2009 MA PedNSS achieved
the Healthy People 2010 target level of five percent or less.
• The prevalence of short stature (4.5%) among 2009 MA PedNSS children less than five years of age was smaller than the prevalence among national PedNSS children (6.0%). However, the prevalence of underweight was slightly higher in MA PedNSS children (5.5%) compared to their counterparts in the national PedNSS (4.5%). The overall proportion of obese children was slightly higher among MA PedNSS children under five years of age (14.7%) than among their national counterparts (14.1%).

2009 Massachusetts Pediatric Nutrition Surveillance Report Page 11
Prevalence of Short Stature
Figure 8-Prevalence of Short Stature* among Children Aged <5 Years, by Race and Ethnicity
Figure 8-Prevalence of Short Stature* among Children Aged <5 Years, by Race and Ethnicity
* < 5th percentile length or height-for-age, CDC Growth Charts, 2000. ** Reduce growth retardation (short stature) among low-income children under age five years to 5%.
Year 2010target**
0
5
10
15
White Black Hispanic AmericanIndian
Asian Multiple Total
Per
cent
age
MA Nation
2009 MA PedNSS Table 8C
• Short stature or growth retardation is defined based on the 2000 CDC
gender specific growth chart percentiles as stature of less than the 5th percentile length-for-age (measured recumbently) for children younger than two years of age and less than the 5th percentile height-for-age (measured standing) for children two years of age or older.
• Short stature reflects the long-term health and nutritional status of a child
or a population. Short stature may reflect the normal variation of growth within a population; that is, five percent of healthy children are expected to fall below the established cutoff that defines short stature. Short stature may be associated with short parental stature or low birth weight, but it may also reflect growth retardation that results from chronic malnutrition due to inadequate food intake, recurrent illness, or both.
• Among the 2009 MA PedNSS population, American Indian/Alaskan native
children under age five years had a lowest prevalence (3.0%) of short stature compared to that for the overall state PedNSS data (4.5%) or to White non-Hispanic (4.8%), Asian (4.8%), Hispanic (4.2%) and Black non-Hispanic (4.1%) children.

2009 Massachusetts Pediatric Nutrition Surveillance Report Page 12
• While short stature prevalence varied in both 2009 MA PedNSS and the
national PedNSS by race and ethnicity, all racial, ethnic groups met the Healthy People 2010 obejctive of prevalence of short stature less than or equal to five percent.
• The prevalence of short stature was consistently lower in the 2009 MA
PedNSS children (4.5%) in all race/Hispanic ethnicity groups compared to National PedNSS data.

2009 Massachusetts Pediatric Nutrition Surveillance Report Page 13
Trends in the Prevalence of Short Stature by Race and Ethnicity in MA PedNSS
Figure 9-Trends in Prevalence of Short Stature*among MA PedNSS Children Aged Less than Five Years, by Race and Ethnicity
Figure 9-Trends in Prevalence of Short Stature*among MA PedNSS Children Aged Less than Five Years, by Race and Ethnicity
0
5
10
2000 2001 2002 2003 2004 2005 2006 2007 2008 2009Year
Per
cent
age
White Black Hispanic American Indian Asian Total
2009 MA PedNSS
* < 5th percentile length or height-for-age, CDC Growth Charts, 2000. Year 2010 target: reduce growth retardation (short stature) among low-income children under age five years to 5%.
• Overall, the percentage of children with short stature has remained steady in the last ten years among all race/Hispanic ethnicity groups (from 4.7% in 2000 to 4.5% in 2009). The proportion of short stature among American Indian children decreased from 5.7% in 2000
to 3.0% in 2009 MA PedNSS though their total population data is not stable.

2009 Massachusetts Pediatric Nutrition Surveillance Report Page 14
Underweight
Figure 10-Prevalence of Underweight*among Children Aged Less than Five Years, by Race and Ethnicity
Figure 10-Prevalence of Underweight*among Children Aged Less than Five Years, by Race and Ethnicity
0
5
10
White Black Hispanic AmericanIndian
Asian Multiple Total
Per
cent
age
MA Nation
* < 5th percentile weight-for-length or BMI-for-age, CDC Growth Charts, 2000. 5% of children are expected to fall below the 5th percentile. 2009 MA PedNSS
Underweight in children is based on the 2000 CDC gender-specific growth charts. It is defined as weight-for-length less than the 5th percentile for children younger than two years of age. It may also be defined as BMI-for-Age less than 5th percentile for children aged two years or older. Underweight is also referred to as low weight-for-height, thinness, or wasting and it is often associated with recent severe illness or acute malnutrition. About five percent of children are expected to fall below the 5th percentile according to the 2000 CDC gender-specific growth charts. Underweight in children was compared between the 2009 MA and 2008 national PedNSS.
• The overall prevalence of underweight was slightly higher in children represented in the 2009 MA PedNSS (5.5%) compared to those in the national PedNSS (4.5%).
• Asian (7.4%) followed by Black non-Hispanic (6.0%) and White non-
Hispanic (5.9%) children under five years of age had the highest prevalence of underweight in MA PedNSS.

2009 Massachusetts Pediatric Nutrition Surveillance Report Page 15
• Hispanic (4.5%) and American Indian (4.8%) children had the lowest
prevalence of underweight in MA PedNSS.
• In the national PedNSS, Black non-Hispanic (5.8%) and Asian (5.7%) children showed the highest prevalence of underweight.
• Hispanic children under five years of age had the lowest prevalence of
underweight in MA PedNSS (4.5%), while American Indian children had the lowest prevalence of underweight in the national PedNSS (2.8%).
• Because fewer than 100 records were available for analysis for multiple
race children in MA PedNSS, no data were presented at this time period. The CDC does not generate statistics based on fewer than 100 records.

2009 Massachusetts Pediatric Nutrition Surveillance Report Page 16
Prevalence of Underweight by Age
Figure 11-Prevalence of Underweight*among Children Aged Less than Five Years, by Age
Figure 11-Prevalence of Underweight*among Children Aged Less than Five Years, by Age
0
5
10
15
<1 1 2 3 4 Total
Age (years)
Per
cent
age
MA Nation
* < 5th percentile weight-for-length or BMI-for-age, CDC Growth Charts, 2000. 5% of children are expected to fall below the 5th percentile. 2009 MA PedNSS
• With the exception of the youngest age group (less than one year old) that had a prevalence of underweight of 10.6% in 2009 MA PedNSS, and 6.4% nationally, all age groups had a prevalence of underweight below five percent.
• The high prevalence of underweight among the youngest age group is
most likely attributable to infants who were born with a low birth weight, and who had not yet achieved catch-up growth in weight at the time of measurement.
• The HP-2010 goal is to reduce the prevalence of underweight among low
income children under age five years to five percent or less.

2009 Massachusetts Pediatric Nutrition Surveillance Report Page 17
Trends in Prevalence of Underweight by Race/Ethnicity
Figure 12-Trends in Prevalence of Underweight*among MA PedNSS Children Aged Less than Five Years, by Race and Ethnicity
Figure 12-Trends in Prevalence of Underweight*among MA PedNSS Children Aged Less than Five Years, by Race and Ethnicity
0
5
10
2000 2001 2002 2003 2004 2005 2006 2007 2008 2009Year
Per
cent
age
White Black Hispanic American Indian Asian Total
* < 5th percentile weight-for-length or BMI-for-age, CDC Growth Charts, 2000. 5% of children are expected to fall below the 5th percentile. 2009 MA PedNSS
• Overall, the proportion of underweight children generally decreased
(although slightly) among all racial/Hispanic ethnicity categories in MA PedNSS in the past ten years, from 5.8% in 2000 to 5.5% in 2009.
• Although a decreasing overall trend was observed, the percentage of
underweight was consistently higher among Asian MA PedNSS children (from 7.3% in 2000 to 7.4% in 2009) than the percentage for the total state PedNSS population in the same time period (from 5.8 % in 2000 to 5.5% in 2009). The prevalence of underweight was consistently low among the Hispanic MA PedNSS population (from 4.4% in 2000 to 4.5% in 2009).
2009 Massachusetts Pediatric Nutrition Surveillance Report Page 18
Prevalence of Obesity
Figure 13a-Prevalence of Obesity*among MA PedNSS Children Aged Less than Five Years, by Race and Ethnicity
Figure 13a-Prevalence of Obesity*among MA PedNSS Children Aged Less than Five Years, by Race and Ethnicity
* > 95th percentile weight-for-length or BMI-for-age, CDC Growth Charts, 2000. 5% of children are expected to fall above the 95th percentile. 2009 MA PedNSS
0
5
10
15
20
25
White Black Hispanic AmericanIndian
Asian Multiple Total
Per
cent
age
MA Nation
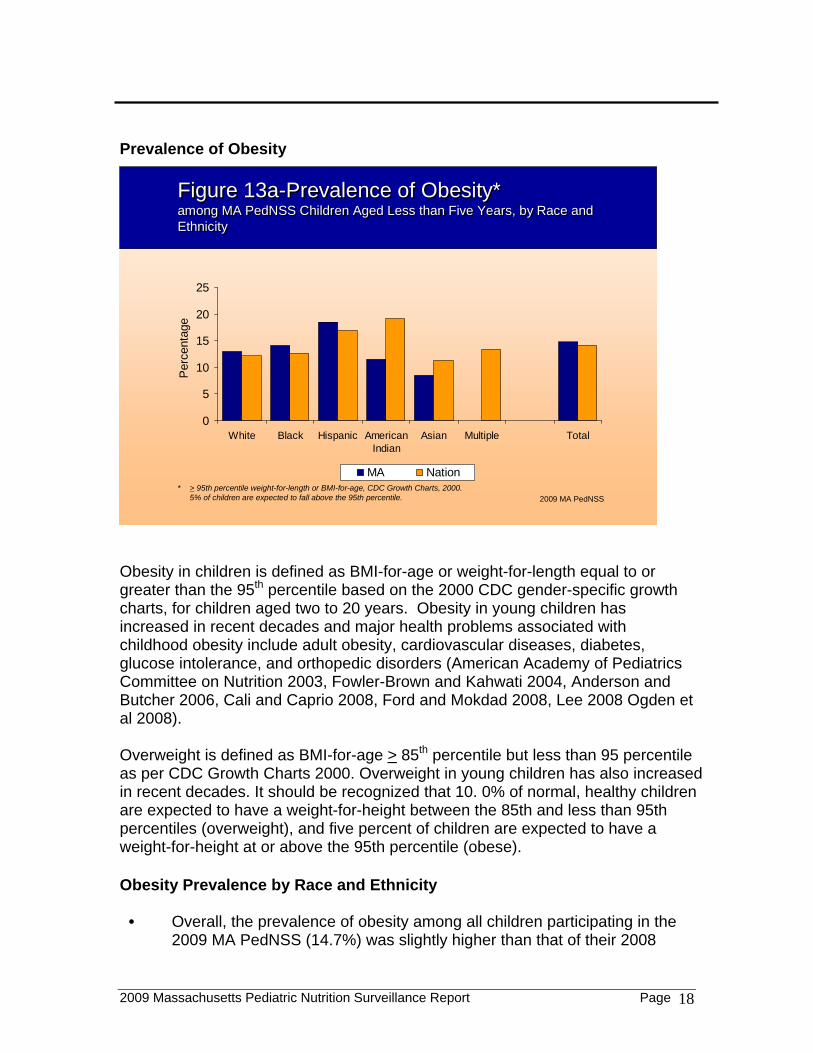
Obesity in children is defined as BMI-for-age or weight-for-length equal to or greater than the 95th percentile based on the 2000 CDC gender-specific growth charts, for children aged two to 20 years. Obesity in young children has increased in recent decades and major health problems associated with childhood obesity include adult obesity, cardiovascular diseases, diabetes, glucose intolerance, and orthopedic disorders (American Academy of Pediatrics Committee on Nutrition 2003, Fowler-Brown and Kahwati 2004, Anderson and Butcher 2006, Cali and Caprio 2008, Ford and Mokdad 2008, Lee 2008 Ogden et al 2008). Overweight is defined as BMI-for-age > 85th percentile but less than 95 percentile as per CDC Growth Charts 2000. Overweight in young children has also increased in recent decades. It should be recognized that 10. 0% of normal, healthy children are expected to have a weight-for-height between the 85th and less than 95th percentiles (overweight), and five percent of children are expected to have a weight-for-height at or above the 95th percentile (obese). Obesity Prevalence by Race and Ethnicity
• Overall, the prevalence of obesity among all children participating in the 2009 MA PedNSS (14.7%) was slightly higher than that of their 2008

2009 Massachusetts Pediatric Nutrition Surveillance Report Page 19
national PedNSS counterparts (14.1%) in all race/Hispanic ethnicity categories.
• The prevalence of obesity among the 2009 MA PedNSS children was
highest among Hispanic children (18.5%), followed by Black non-Hispanic (14.1%) and White non-Hispanic (13.0%) children.
• Asian (8.5%) and American Indian (11.5%) children had the lowest
prevalence of obesity in the 2009 MA PedNSS. • Among the national PedNSS children, the prevalence of obesity was
highest among American Indian children (19.1%), followed by Hispanic (16.9%), multiple race (13.3%) and Black non-Hispanic (12.6%) children.
• In the national PedNSS the lowest obesity rates were observed in Asian
children (11.3%) followed by White non-Hispanic children (12.1%) (Figure13a).

2009 Massachusetts Pediatric Nutrition Surveillance Report Page 20
Prevalence of Obesity by Age among Children less than Five Years Old
Figure 13b-Prevalence of Obesity* among PedNSS Children Aged Less Than Five Years, By Age
Figure 13b-Prevalence of Obesity* among PedNSS Children Aged Less Than Five Years, By Age
0
5
10
15
20
25
<1 1 2 3 4 TotalAge (years)
Per
cent
age
MA Nation
* > 95th percentile weight-for-length or BMI-for-age, CDC Growth Charts, 2000. 5% of children are expected to fall above the 95th percentile. 2009 MA PedNSS
• In the 2009 MA PedNSS, as well as the reference national PedNSS used for comparison, obesity also varied by age. The overall prevalence of obesity in children less than five years old was 14.7% among MA PedNSS while it was 14.1% among the national PedNSS children.
• The greatest proportion of children categorized as obese in 2009 MA
PedNSS was observed among the four year olds (19.2%), followed by children who were one year old (18.2%), three years old (17.5%) and two years old (14.3%). Children less than one year old had the lowest prevalence of obesity (9.2%) in the 2009 MA PedNSS (Figure 13b).
• In the national 2008 PedNSS, 16.4% of children who were four years old,
15.4% of those who were three years old, 13.1 % of those who were two years old, and 17.1% of those who were one year old were described as obese compared to eleven percent (11.3%) of children less than one year old (Figure 13b). Children in the MA PedNSS population had higher overall prevalence of obesity when compared to their counterparts in the national PedNSS population for all the sampled age groups with the exception of MA PedNSS children less than one year old whose prevalence of obesity was less (9.2%) than the national data (11.3%).

2009 Massachusetts Pediatric Nutrition Surveillance Report Page 21
Prevalence of Obesity and Overweight Combined by Race and Ethnicity among MA PedNSS Children Aged Two Years to Less Than Five Years
Figure 14a-Prevalence of Obesity and Overweight*among MA PedNSS Children Aged two to Less than Five Years, by Race and Ethnicity
Figure 14a-Prevalence of Obesity and Overweight*among MA PedNSS Children Aged two to Less than Five Years, by Race and Ethnicity
0
10
20
30
40
50
Wh
ite
Bla
ck
His
pa
nic
Am
eri
can
Ind
ian
Asi
an
Mu
ltip
le
To
tal-
MA
To
tal-
Na
tion
Per
cent
age
Obese Overweight
* Obese: > 95th percentile BMI-for-age; overweight: > 85th-<95th percentile BMI-for-age, CDC Growth Charts, 2000. 15% of children are expected to fall above the 85th percentile (5% above the 95th percentile and 10% between the 85th and 95th percentiles).
2009 MA PedNSS
Children between two and less than five years of age in the 2009 MA PedNSS had a higher prevalence of obesity and overweight combined (33.7%), compared to children of the same age represented in the national PedNSS whose prevalence of obesity and overweight combined was 31.3% (Fig 14a). In the 2009 MA PedNSS, the prevalence of obesity and overweight combined varied by race and ethnicity.
More than one in five Hispanic children (21.2%) between two and less than five years old were obese and 18.5% were overweight, with the highest combined percentage (39.7%) of both overweight and obesity among all race/Hispanic ethnicity categories reported for MA PedNSS. In comparison, 10.2% of Asian children between two and five years old were obese and 12.7% were overweight, with the lowest combined percentage (22.9%) of both overweight and obese children among all race/Hispanic ethnicity categories reported for MA PedNSS.
No statistics for obesity and overweight were shown for American Indian or multiple race PedNSS populations aged between two and less than five years old as the group had fewer than 100 records.

2009 Massachusetts Pediatric Nutrition Surveillance Report Page 22
Prevalence of Obesity and Overweight Combined, by Age, among
MA PedNSS Children Aged Two Years to Less Than Five Years
Figure 14b-Prevalence of Obesity and Overweight* among Children Aged Two to Less than Five Years, by Age
Figure 14b-Prevalence of Obesity and Overweight* among Children Aged Two to Less than Five Years, by Age
* Obese: > 95th percentile BMI-for-age; overweight: > 85th-<95th percentile BMI-for-age, CDC Growth Charts, 2000. 15% of children are expected to fall above the 85th percentile (5% above the 95th percentile and 10% between the 85th and 95th percentiles).
2009 MA PedNSS
0
10
20
30
40
2 3 4 Total-MA Total-Nation
Age (years)
Per
cent
age
Obese Overweight
Children two years to less than five years of age in the 2009 MA PedNSS had a higher prevalence of obesity and overweight combined (33.7%), compared to children of similar age group represented in the national PedNSS, with a combined prevalence of obesity and overweight at 31.3% (Figure 14b). The greatest proportion of children categorized as obese in MA PedNSS was observed among the four year olds year olds (19.2%), followed by children at three years old (17.5%) and two years old (14.3%) (Fig.14b).
Similarly, the greatest proportion of children categorized as overweight in MA PedNSS was observed among the four-year olds (17.6%), followed by children aged three years old (16.8%) and those aged two years old (16.3%).
The combined prevalence of overweight and obesity for the various age groups in 2009 MA PedNSS were as follows: 30.6% for the two year olds, 34.3% for the three olds, and 36.8% for the four year olds.
2009 Massachusetts Pediatric Nutrition Surveillance Report Page 23
The prevalence of excessive weight (obesity and overweight combined) among children appeared to increase with increasing age in MA PedNSS population according to data presented in Figure 13b above . A similar prevalence was observed in the national PedNSS population in previous studies (Barlow 2007, Krebs and Jacobson 2003).

2009 Massachusetts Pediatric Nutrition Surveillance Report Page 24
Trends in the Prevalence of Overweight by Race and Ethnicity
Figure 15-Trends in Prevalence of Overweight* among MA PedNSS Children Aged two to Less than Five Years, by Race and Ethnicity
Figure 15-Trends in Prevalence of Overweight* among MA PedNSS Children Aged two to Less than Five Years, by Race and Ethnicity
0
5
10
15
20
25
2000 2001 2002 2003 2004 2005 2006 2007 2008 2009Year
Per
cent
age
White Black Hispanic American Indian Asian Total
* > 85th-<95th percentile BMI-for-age, CDC Growth Charts, 2000. 10% of children are expected to fall between these percentiles. 2009 MA PedNSS
In the MA PedNSS, the prevalence of overweight among children aged two to less than five years old decreased in the past ten years over all by race/Hispanic ethnicity categories (from 17.0% in 2000 to 16.9% in 2009).
The highest increase in prevalence of overweight among MA PedNSS
children was observed in Hispanic children whose prevalence increased from 17.9% in 2000 to 18.5% in 2009
American Indian children generated less than 100 records between 2005 and
2009; hence the CDC did not generate data on overweight for this population group as shown in Figure 15; however the prevalence of overweight was on the rise from 11.6% in 2000 to 20.7% in 2004.

2009 Massachusetts Pediatric Nutrition Surveillance Report Page 25
Trends in Obesity by Race and Ethnicity among MA PedNSS Children Aged Two Years to Less Than Five Years
Figure 16a-Trends in Prevalence of Obesity* among MA PedNSS Children Aged Two to Less than Five Years, by Race and Ethnicity
Figure 16a-Trends in Prevalence of Obesity* among MA PedNSS Children Aged Two to Less than Five Years, by Race and Ethnicity
0
5
10
15
20
25
30
2000 2001 2002 2003 2004 2005 2006 2007 2008 2009Year
Per
cent
age
White Black Hispanic American Indian Asian Total
* > 95th percentile BMI-for-age, CDC Growth Charts, 2000. 5% of children are expected to fall above the 95th percentile. 2009 MA PedNSS
In the MA PedNSS, the overall prevalence of obesity among children
aged two to less than five years old slightly increased in the past ten years from 16.2 % in 2000 to 16.8% in 2009.
Hispanic children experienced the greatest prevalence of obesity in
each year from 19.9% in 2000 to 21.2% in 2009. White non-Hispanic children also recorded a slight increase in obesity prevalence, from 14.3% in 2000 to 14.6% in 2009.
Between 2005 and 2009, the American Indian PedNSS population also
had fewer than 100 records in each of these years, so no data were generated for them. The CDC does not generate statistical data if the available records are fewer than 100 as stated earlier. This explains the gaps in the graph presented in Figure 16a for American Indians.

2009 Massachusetts Pediatric Nutrition Surveillance Report Page 26
Trends in Obesity by Age (among MA PedNSS children aged Less than Five years).
Figure 16b-Trends in Prevalence of Obesity*among MA PedNSS Children Aged Less than Five Years, by Age
Figure 16b-Trends in Prevalence of Obesity*among MA PedNSS Children Aged Less than Five Years, by Age
0
5
10
15
20
25
2000 2001 2002 2003 2004 2005 2006 2007 2008 2009
Year
Per
cent
age
Aged <1 Yr Aged 1 Yr Aged 2 Yr Aged 3 Yr Aged 4 Yr Total
* > 95th percentile weight-for-length or BMI-for-age, CDC Growth Charts, 2000. 5% of children are expected to fall above the 95th percentile. 2009 MA PedNSS
In the MA PedNSS, the overall prevalence of obesity among children under 5 years of age increased in the past ten years from 14.5 % in 2000 to 14.7% in 2009.
The greatest increase in obesity prevalence occurred among the four
year old children in MA PedNSS (from 17.1% in 2000 to 19.2% in 2009), followed by three year olds(from 17.3% in 2000 to 17.5% in 2009).
Children less than one year old consistently experienced the lowest
prevalence in obesity in MA PedNSS during the ten year period (from 9.4% in 2000 to 9.2% in 2009).

2009 Massachusetts Pediatric Nutrition Surveillance Report Page 27
Prevalence of Anemia
Figure 17a-Prevalence of Anemia*among Children Aged Less than Five Years, by Race and Ethnicity
Figure 17a-Prevalence of Anemia*among Children Aged Less than Five Years, by Race and Ethnicity
* Hb or Hct < 5th percentile, CDC MMWR vol. 47 (No. RR-3), 1998.
0
5
10
15
20
25
White Black Hispanic AmericanIndian
Asian Multiple Total
Per
cent
age
MA Nation
2009 MA PedNSS
Anemia is a blood disorder and an indicator of iron deficiency, the most common nutrient deficiency in the world. Anemia occurs when blood has fewer red blood cells (rbcs) than normal, or when the hematocrit (percentage of red blood cells in a specific volume of blood) is low, and/or when there is a low blood concentration of hemoglobin (the iron-bearing blood protein that carries oxygen from lungs to the tissues). Anemia in children is defined as a hemoglobin level of less than the 5th percentile for age (Janus and Moeschel 2010). Iron deficiency in children is associated with developmental delays and behavioral disturbances (Polllitt 1993, Lozzoff et al 2000, Saloojee and Pettifor 2001, WU et al 2002). However, not all types of anemia are caused by iron deficiency; anemia can be caused by other nutritional deficiencies (e.g. folate or vitamin B12 deficiency, vitamin C), hereditary hemoglobinopathies (e.g., thalassemia or sickle cell disease), recent or current infection, certain medications (e.g. cancer drugs), chemical toxins and chronic inflammation. According to the CDC’s 2007 PedNSS Report, children aged six months to two years are considered anemic if their hemoglobin (Hb) is less than 11.0g/dL or their hematocrit (Hct) level is less than 32.9%; children aged two to five years

2009 Massachusetts Pediatric Nutrition Surveillance Report Page 28
are considered anemic if their Hb concentration is less than 11.1g/dL or Hct level is less than 33.0%. Values are adjusted for altitude. The Hb concentration and Hct level are not reported for children younger than six months (CDC 1998). Anemia results are based on data from low-income children attending the Massachusetts WIC program. These children may have other health and nutritional factors associated with anemia that may not be present in non-WIC children. Prevalence of Anemia by Race and ethnicity Anemia results varied in both MA and national PedNSS. Overall, 11.3 % of children in the 2009 MA PedNSS were anemic, compared
to 14.9% in the national PedNSS (Figure 17a). The prevalence of anemia varied by race/Hispanic ethnicity in MA PedNSS
population with Black non-Hispanic children having the highest prevalence (16.9%), while White non-Hispanic children had the lowest prevalence (9.5%).
A similar observation was made in the national PedNSS population with Black
non-Hispanic children having the highest prevalence of anemia (22.8%), while White non-Hispanic children had the lowest prevalence (11.5%).
No statistics for anemia were reported in MA PedNSS population among
American Indian and multiple race children aged between two and less than five years old as the group had fewer than 100 records. The CDC does not generate statistics based on fewer than 100 records as the data will not be statistically significant.

2009 Massachusetts Pediatric Nutrition Surveillance Report Page 29
Prevalence of Anemia by Age
Figure 17b-Prevalence of Anemia*among PedNSS Children Aged Less than Five Years, by Age
Figure 17b-Prevalence of Anemia*among PedNSS Children Aged Less than Five Years, by Age
0
5
10
15
20
0.5-1 1-<1.5 1.5-<2 2-<3 3-<5 Total
Age (years)
Per
cent
age
MA Nation
* Hb or Hct < 5th percentile, CDC MMWR vol. 47 (No. RR-3), 1998. 2009 MA PedNSS
Anemia prevalence varied by age in 2009 MA PedNSS (Fig.17b) and was highest among children between six and 12 months of age (15.1%) and lowest in children three years to less than five years of age (8.8%).
In the national PedNSS, the prevalence of anemia was highest in children
between 12 and 18 months old (18.2%), followed by children six to 12 months old (17.8%) but lowest in children three years to less than five years old (10.9%).

2009 Massachusetts Pediatric Nutrition Surveillance Report Page 30
Trends in Prevalence of Anemia by Race and Ethnicity
0
5
10
15
20
25
2000 2001 2002 2003 2004 2005 2006 2007 2008 2009Year
Per
cent
age
White Black Hispanic American Indian Asian Total
Figure 18a-Trends in Prevalence of Anemia* among MA PedNSS Children Aged Less than Five Years, by Race and Ethnicity
Figure 18a-Trends in Prevalence of Anemia* among MA PedNSS Children Aged Less than Five Years, by Race and Ethnicity
* Hb or Hct < 5th percentile, CDC MMWR vol. 47 (No. RR-3), 1998. 2009 MA PedNSS
In the MA PedNSS, the overall prevalence of anemia decreased in the past ten years from 14.4% in 2000 to 11.3% in 2009.
The greatest decrease in prevalence of anemia was observed among
Asian children in MA PedNSS where prevalence of anemia fell from 16.0% in 2000 to 10.2% in 2009.
White non-Hispanic children consistently had the lowest prevalence of
anemia over the past 10 years, where the prevalence decreased from 11.8% in 2000 to 9.5% in 2009.
Black non-Hispanic children consistently had the highest prevalence of
anemia but improved from 19.4% in 2000 to 16.9% in 2009.

2009 Massachusetts Pediatric Nutrition Surveillance Report Page 31
Trends in Prevalence of Anemia by Age
Figure 18b-Trends in Prevalence of Anemia*among MA PedNSS Children Aged Less than Five Years, by Age
Figure 18b-Trends in Prevalence of Anemia*among MA PedNSS Children Aged Less than Five Years, by Age
* Hb or Hct < 5th percentile, CDC MMWR vol. 47 (No. RR-3), 1998. 2009 MA PedNSS
0
5
10
15
20
25
2000 2001 2002 2003 2004 2005 2006 2007 2008 2009
Year
Per
cent
age
Aged 0.5-<1 Yr Aged 1-<1.5 Yrs Aged 1.5-<2 YrsAged 2-<3 Yrs Aged 3-<5 Yrs Total
In the MA PedNSS, the overall prevalence of anemia among children under five years of age decreased in the past ten years from 14.4% in 2000 to 11.3% in 2009.
The largest decrease in anemia prevalence in MA PedNSS occurred
among children three to less than five years old (from 11.1% in 2000 to 8.8% in 2009) and in children two years to less than three years old (from 15.7% in 2000 to 11.8% in 2009).
Although rates decreased over time, children six months to less than
one year old consistently experienced the highest prevalence in anemia in MA PedNSS during the ten year period (from 17.6% in 2000 to 15.1% in 2009).

2009 Massachusetts Pediatric Nutrition Surveillance Report Page 32
Breastfeeding
Figure 19a-Percentage of Infants Ever Breastfed* by Race and Ethnicity
Figure 19a-Percentage of Infants Ever Breastfed* by Race and Ethnicity
0102030405060708090
100
White Black Hispanic AmericanIndian
Asian Multiple Total
Pe
rce
nta
ge
MA Nation
Year 2010 target**
2009 MA PedNSS
* Among infants born during the reporting period. ** Increase the proportion of mothers who breastfeed their babies in the early postpartum period to 75%.
Breastfeeding is regarded as one of the most important contributors to infant health because human breast milk presents the most complete form of nutrition for infants. Breastfeeding is known to contribute nutritional, immunologic, developmental, allergenic, economic and psychological advantages to both the child and the mother and can also protect infants against some childhood diseases (American Academy of Pediatrics 2005). The HP 2010 targets are that the proportion of children ever breastfed be increased to 75%, and proportion of children breastfed for at least six months be increased to 50% and the proportion of children breastfed for at least one year be increased to 25% (HP 2010 in 2000). "Ever breastfed" includes those infants whose mother initiated breastfeeding, including both those who were breastfed exclusively, and those who were supplemented with formula, based on maternal self-report at the WIC certification visit. ("Initiation" is defined as having breastfed at least one time). Breastfeeding Initiation and Percentage of Infants Ever Breastfed by Race and Ethnicity Breast feeding initiation varied in both MA and national PedNSS populations.
In 2009, seventy-four percent (74.0%) of infants of all races represented in the MA PedNSS were ever breastfed. In comparison, only 62.0% of infants in the national PedNSS were ever breastfed.

2009 Massachusetts Pediatric Nutrition Surveillance Report Page 33
Black non-Hispanic infants in the MA PedNSS had the highest prevalence
of ever breastfeeding (83.4%), followed by Hispanic infants at 81.4% and Asian infants (73.7%) while White non-Hispanic infants had the lowest prevalence of ever breastfeeding (66.3%).
Both Black non-Hispanic infants (83.4%) and Hispanic infants (81.4%) in
the 2009 MA PedNSS surpassed the HP 2010 target of ever breastfeeding (set at 75.0%).

2009 Massachusetts Pediatric Nutrition Surveillance Report Page 34
Trends in Percentage of Infants Ever Breastfed by Race and Ethnicity
Figure 19b-Trends in the Percentage of MA PedNSS Infants Ever Breastfed*by Race and Ethnicity
Figure 19b-Trends in the Percentage of MA PedNSS Infants Ever Breastfed*by Race and Ethnicity
0
1020
3040
5060
7080
90
2000 2001 2002 2003 2004 2005 2006 2007 2008 2009Year
Per
cent
age
White Black Hispanic Asian Total
2009 MA PedNSS
* Among infants born during the reporting period. Year 2010 target: increase the proportion of mothers who breastfeed their babies in the early postpartum period to 75%.
In the last ten years, the overall percentage of infants in the MA PedNSS that were ever breastfed has increased from 61.0% in 2000 to 74.0% in 2009.
The prevalence for infants ever breastfed in the past ten years was
consistently high among Hispanic infants whose breastfeeding prevalence rose from 72.2% in 2000 to 81.4% in 2009.
The prevalence of ever breastfeeding in MA PedNSS infants has also
increased among Black non-Hispanic infants, whose prevalence jumped from 71.0% in 2000 to 83.4 % in 2009; this group showed the largest improvement for breastfeeding initiation.

2009 Massachusetts Pediatric Nutrition Surveillance Report Page 35
Percentage of Infants Breastfed At Least Six Months by Race and Ethnicity
Figure 20a-Percentage of Infants Breastfed at Least Six Months*by Race and Ethnicity
Figure 20a-Percentage of Infants Breastfed at Least Six Months*by Race and Ethnicity
Year 2010 target**
2009 MA PedNSS
* Among infants who turned six months of age during the reporting period. ** Year 2010 target: increase the proportion of mothers who breastfeed their babies at six months to 50%.
0
10
20
30
40
50
60
70
White Black Hispanic AmericanIndian
Asian Multiple Total
Per
cent
age
MA Nation
The overall proportion of infants in 2009 MA PedNSS that were breastfeed for at least six months was 28.3% while the proportion of such infants in the national PedNSS was 26.9%.
In the 2009 MA PedNSS, the greatest prevalence in breastfeeding for at least six months occurred among Black non-Hispanic infants (40.7%), followed by Hispanic (30.7%) and Asian (25.3%) infants while White non-Hispanic infants had the lowest proportion (22.2%) of infants that breastfed for at least six months.
In the national PedNSS, the greatest prevalence of breastfeeding for at
least six months occurred among Hispanic infants (37.9%), followed by Asian (29.8%), American Indian (26.6%), multiple race (19.5%) and White non-Hispanic (20.7%) infants while Black non-Hispanic infants (20.2%) had the lowest proportion that breastfed for at least six months.
Neither infants in the MA PedNSS in 2009 nor their national counterparts
met the HP 2010 goal of breastfeeding for at least six months set at 50%.

2009 Massachusetts Pediatric Nutrition Surveillance Report Page 36
Trends in the Percentage of MA PedNSS Infants Breastfed for At Least Six Months by Race and Ethnicity
Figure 20b-Trends in the Percentage of MA PedNSS Infants Breastfed at Least Six Months* by Race and Ethnicity
Figure 20b-Trends in the Percentage of MA PedNSS Infants Breastfed at Least Six Months* by Race and Ethnicity
0
10
20
30
40
50
2000 2001 2002 2003 2004 2005 2006 2007 2008 2009Year
Per
cent
age
White Black Hispanic Asian Total
2009 MA PedNSS* Among infants who turned six months of age during the reporting period. Year 2010 target: increase the proportion of mothers who breastfeed their babies at six months to 50%.
The percentage of all infants that were breastfed for at least six months has increased over the past ten years among infants participating in the MA PedNSS from 20.6% in 2000 to 28.3% in 2009.
The largest improvement in breastfeeding for at least six months was
observed in Black non-Hispanic infants with a prevalence of 28.8% in 2000 and a prevalence of 40.7% in 2009.
The next (or second) largest improvement in breastfeeding for at least six
months was observed among Asian infants with a prevalence of 14.5% in 2000 and a prevalence of 25.3% in 2009.

2009 Massachusetts Pediatric Nutrition Surveillance Report Page 37
Percentage of Infants Breastfed At Least 12 Months by Race and Ethnicity
Figure 21a-Percentage of Infants Breastfed at Least 12 Months* by Race and Ethnicity
Figure 21a-Percentage of Infants Breastfed at Least 12 Months* by Race and Ethnicity
Year 2010 target**
2009 MA PedNSS
* Among infants who turned twelve months of age during the reporting period. ** Increase the proportion of mothers who breastfeed their babies at one year to 25%.
0
10
20
30
40
50
60
70
White Black Hispanic AmericanIndian
Asian Multiple Total
Per
cent
age
MA Nation
The overall proportion of 2009 MA PedNSS infants that have been breastfeed for at least 12 months was 14.7% while the proportion in the national PedNSS used for comparison was 19.1%.
In the 2009 MA PedNSS, the greatest prevalence in breastfeeding for at
least 12 months was among Black non-Hispanic infants (21.8%), followed by Hispanic (16.0%) and Asian (12.5%) infants while White non-Hispanic infants (11.2%) had the lowest proportion that breastfed for at least 12 months.
In the national PedNSS, the greatest prevalence in breastfeeding for at
least 12 months occurred among Hispanic infants (29.1%), followed by Asian (20.5%), American Indian (17.9%), Black non-Hispanic infants (12.9%) and White non-Hispanic (12.4%) while multiple race (12.1%) infants had the lowest proportion that breastfed for at least 12 months.

2009 Massachusetts Pediatric Nutrition Surveillance Report Page 38
Trends in the Percentage of MA PedNSS Infants Breastfed at Least 12 Months by Race and Ethnicity
Figure 21b-Trends in the Percentage of MA PedNSS Infants Breastfed at Least 12 Months* by Race and Ethnicity
Figure 21b-Trends in the Percentage of MA PedNSS Infants Breastfed at Least 12 Months* by Race and Ethnicity
0
10
20
30
2000 2001 2002 2003 2004 2005 2006 2007 2008 2009Year
Per
cent
age
White Black Hispanic Asian Total
2009 MA PedNSS
* Among infants who turned twelve months of age during the reporting period. Year 2010 target: increase the proportion of mothers who breastfeed their babies at one year to 25%.
Since 2000, the overall proportion of MA PedNSS infants that have been breastfeed for at least 12 months has increased, from 9.2% in 2000 to 14.7% in 2009.
The greatest increase in the prevalence of breastfeeding for at least 12
months during the 10 year period 2000 through 2009 occurred among Black non-Hispanic infants, from 12.4 % in 2000 to 21.8% in 2009.
The lowest increase in prevalence of breastfeeding for at least 12 months
during the 10 year period 2000 to 2009 was observed among White non-Hispanic infants from 8.4% in 2000 to 11.2% in 2009.

2009 Massachusetts Pediatric Nutrition Surveillance Report Page 39
Overall Trends in Breastfeeding Initiation and Duration
Figure 22-Trends in the Percentage of MA PedNSS Infants Ever Breastfed, and Breastfed at Least Six and 12 Months
Figure 22-Trends in the Percentage of MA PedNSS Infants Ever Breastfed, and Breastfed at Least Six and 12 Months
01020304050607080
2000 2001 2002 2003 2004 2005 2006 2007 2008 2009
Year
Per
cent
age
Ever Breastfed Breastfed 6 Months Breastfed 12 Months
Year 2010 targets: increase the proportion of mothers who breastfeed their babies a) in the early postpartum period to 75%, b) at six months to 50%, and c) at one year to 25%. 2009 MA PedNSS
In the 2009 MA PedNSS, both the prevalence and the duration of
breastfeeding have increased in the past ten years. The ‘ever breastfed’ category increased in the last ten years from 61.0% in
2000 to 74.0% in 2009.
The category of ‘breastfed for at least six months’ increased in the last ten years from 20.6%in 2000 to 28.3% in 2009.
The category of ‘breastfed for at least 12 months’ increased in the past ten
years from 9.2% in 2000 to 14.7% in 2009.

2009 Massachusetts Pediatric Nutrition Surveillance Report Page 40
References
American Academy of Pediatrics, Committee on Nutrition Policy statement: Prevention of pediatric overweight and obesity. Pediatrics (serial on line) 2003; 112(2): 424-30. Available at: http://aappolicy.aappublications.org/cgi/content/full/pediatrics;112/2/424.
American Academy of Pediatrics Committee on Nutrition Breast feeding and the Use of Human Milk. Pediatrics 2005; 115: 496-506. Anderson PM and Butcher KF. Childhood obesity: Trends and Potential Causes. The Future of Children, vol.16, no. 1, Childhood Obesity (Spring 2006), pp19-45 Princeton university press. Barlow SE; Expert Committee. Expert Committee recommendations regarding the Prevention, assessment, and treatment of Child and adolescent overweight and obesity: Summary report. Pediatrics 2007; 120(Suppl4):S164–S192. Available at http://pediatrics. aappublications.org/cgi/
Barlow SE and the Expert Committee The expert committee recommendations regarding the prevention, assessment and treatment of child and adolescent overweight and obesity: Summary report. Pediatrics (serial on line) 2003; 112(2): 424-30. Available at: http://aappolicy.aappublications.org/cgi/content/full/120/Supplement_4/S164. Bhutta AT, Cleves MA, Casey, PH, Cradock MM, and Anand KJS. Cognitive and behavioral outcomes of school-aged children, who were born preterm. JAMA, 2002; 288:728-737.
Cali AMG and Caprio S. Obesity in Children and Adolescents The Journal of Clinical Endocrinology and Metabolism (2008) vol. 93, No.1_Supplement_1 s31-s36. Centers for Disease Control and Prevention (CDC) Recommendations to prevent and control iron deficiency in the United States. MMWR Morbidity and Mortality Weekly Report Recommendations and Report 1998; 47(RR-3):1-30.

2009 Massachusetts Pediatric Nutrition Surveillance Report Page 41
Ford ES and Mokdad AH. Epidemiology of Obesity in the Western Hemisphere. The Journal of Clinical Endocrinology and Metabolism vol. 93 No.11_Supplement_1 s1-s8; 2008 Fowler-Brown A and Kahwati LC Prevention and Treatment of Overweight in Children and Adolescents Am Fam. Physician 2004, Jun1; 69(11):2591-2599. Hack. Flannery DJ, Schluchter M, Cartar L, Barowski E and Klein N Outcomes in young adulthood for very-low-birth-weight infants. N. Engl J Med 2002; 347(2):141 Idjradinata P.and Pollitt E. Reversal of developmental delays in iron-deficient anemic infants treated with iron. Lancet 1993; 341(8836):1-4 Institute of Medicine (IOM): Preventing Low Birth Weight. Report of the Committee to Study the Prevention of Low Birth Weight Division of Health Promotion and Disease Prevention Washington DC, National Academy Press; 1985 Janus J and Moerschel SK. Evaluation of anemia in children. Am FAM Physician 2010 Jun 15; 81(12):1462-71. Jolly MC, Sebire NJ, Harris JP, Regan L, and Robinson S Risk factors for macrosomia and its clinical consequences: A study of 350,311 pregnancies. European Journal of Obstetrics & Gynecology and Reproductive Biology 2003; 11:9-14. Krebs NF, Jacobson MS; American Academy of Pediatrics Committee on Nutrition. Prevention of pediatric overweight and obesity. Pediatrics 2003; 112(2):424–430. Lee JM. Why Young Adults Hold the Key to Assessing the Obesity Epidemic in Children Archives of Pediatrics and adolescent Medicine vol. 162, No. 7 July 2008.
Lozoff B, Jimenez E, Hagen J, Mollen E and Wolf AW. Poorer behavioral and developmental outcome more than 10 years after treatment for iron deficiency in infancy. Pediatrics 2000; 105 (4):51

2009 Massachusetts Pediatric Nutrition Surveillance Report Page 42
Massachusetts Department of Public Health, Bureau of Health Information Statistics, Research and Evaluation (BHISRE) March 2010: Massachusetts Births 2008, Page 29, Table 9, Low birth weight by plurality and maternal age, Massachusetts 1998-2008.
Mei Z, Ogden CL, Flegal KM, and Grummer-Strawn LM. Comparison of the prevalence of shortness, underweight and overweight among US children aged 0 to 59 months by using the CDC 2000 and the WHO 2006 growth charts. Journal of Pediatrics 2008; 153:622-8
Ogden CL, Carroll MD and Flegal KM. High Body Mass Index for Age among US Children and Adolescents, 2003-2006 JAMA, 2008; 299(20): 2401-2405,
Phillip A.G. Neonatal mortality rate: Is further improvement possible? Journal of Pediatrics, 1995; 126:427-433.
Polhamus B, Dalenius K, Borland E, Mackintosh H, Smith B, and Grummer-Strawn L. Pediatric Nutrition Surveillance (PNSS) 2007 Report Atlanta GA, US Dept of Health and Human Services, Centers for Disease Control and Prevention; 2009.
Pollit E. Iron Deficiency and Cognitive Function Annual Review of Nutrition 1993; 13: 521-3. Taylor HG, Klein N, Minich NM, and Hack M. Middle-School-Age Outcomes in Children with Very Low Birth Weight Child Development, 2000; Vol. 71, No.6 (Nov-Dec). 2000: 1495-1511. Reichman, NE. Low birth weight and school readiness. Future of children 2005; 15(1):91-116. Saloojee H. and Pettifor J. M Iron deficiency and impaired child development BMJ, December 15, 2001; 323(7326): 1377 - 1378. US Department of Health and Human Services. Healthy People 2010

2009 Massachusetts Pediatric Nutrition Surveillance Report Page 43
Second Edition. 2 Volumes, Washington DC, US Government Printing Office; 2000. Available at http://www.healthypeople.gov/publications.
World Health Organization (WHO) Expert Committee on Physical Status The use and interpretation of anthropometry. Physical status: Report of WHO Expert Committee: WHO Technical Report Series 854. Geneva: WHO, 1996. Wu AC, Lesperance L, and Bernstein H: Screening for iron deficiency Pediatrics in Review 23(#5):171-175.

2009 Massachusetts Pediatric Nutrition Surveillance Report Page 44
APPENDIX 1: 2009 Participating WIC Programs in MA Local WIC Programs: 1. Berkshire North 2. Berkshire South 3. Blue Hill Corridor 4. Brighton/Roslindale 5. Brockton 6. Cambridge/Somerville 7. Cape Cod 8. Chelsea/Revere 9. Dorchester North 10. Dorchester South 11. East Boston 12. Fall River 13. Framingham/Waltham 14. Franklin/ Hampshire/No Quabbin 15. Holyoke/Chicopee 16. Jamaica Plain 17. Lawrence 18. Lowell 19. New Bedford 20. North Central 21. North Shore 22. North Suburban 23. Northern Essex 24. Outer Cape 25. Plymouth 26. Quincy 27. Roxbury 28. South Boston 29. South Central 30. South Cove 31. South End 32. Springfield North 33. Springfield South 34. Taunton/Attleboro 35. Worcester

2009 Massachusetts Pediatric Nutrition Surveillance Report Page 45
APPENDIX 2: STATE MAPS OF COUNTY DATA
Children Aged <5 YearsChildren Aged <5 Years
20092009
MASSACHUSETTSMASSACHUSETTS
Pediatric NutritionSurveillance System

2009 Massachusetts Pediatric Nutrition Surveillance Report Page 46
Prevalence of low birthweight* by county
Prevalence of low birthweight* by county
* < 2500 grams, among infants born during the reporting period.Year 2010 target: reduce low birthweight to 5% of live births. 2009 MA PedNSS Table 6B
0 - < 8
8 - < 9
9 - < 10
10 +
No Data
Prevalence of short stature* among children aged <5 years, by county
Prevalence of short stature* among children aged <5 years, by county
* < 5th percentile length or height-for-age, CDC Growth Charts, 2000. Year 2010 target: reduce growth retardation (short stature) among low-income children under age five years to 5%.
2009 MA PedNSS Table 6B
0 - < 4
4 - < 5
5 - < 6
6 +
No Data

2009 Massachusetts Pediatric Nutrition Surveillance Report Page 47
Prevalence of high birthweight* by county
Prevalence of high birthweight* by county
* > 4000 grams, among infants born during the reporting period. 2009 MA PedNSS Table 6B
0 - < 6
6 - < 8
8 - < 10
10 +
No Data
Prevalence of underweight* among children aged <5 years, by county
Prevalence of underweight* among children aged <5 years, by county
* < 5th percentile weight-for-length or BMI-for-age, CDC Growth Charts, 2000. 5% of children are expected to fall below the 5th percentile. 2009 MA PedNSS Table 6B
0 - < 5
5 - < 6
6 - < 7
7 +
No Data

2009 Massachusetts Pediatric Nutrition Surveillance Report Page 48
Prevalence of overweight* among children aged 2 to <5 years, by county
Prevalence of overweight* among children aged 2 to <5 years, by county
* > 85th-<95th percentile BMI-for-age, CDC Growth Charts, 2000. 10% of children are expected to fall between the 85th and 95th percentiles. 2009 MA PedNSS Table 6B
0 - < 15
15 - < 17
17 - < 19
19 +
No Data
* Hb or Hct < 5th percentile, CDC MMWR vol. 47 (No. RR-3), 1998. 2009 MA PedNSS Table 6B
Prevalence of anemia* among children aged <5 years, by county
Prevalence of anemia* among children aged <5 years, by county
0 - < 8
8 - < 12
12 - < 16
16 +
No Data

2009 Massachusetts Pediatric Nutrition Surveillance Report Page 49
* Among infants born during the reporting period. Year 2010 target: increase the proportion of mothers who breastfeed their babies in the early postpartum period to 75%.
2009 MA PedNSS Table 7B
Percentage of infants ever breastfed* by county
Percentage of infants ever breastfed* by county
0 - < 66
66 - < 75
75 - < 84
84 +
No Data
* Among infants who turned six months of age during the reporting period. Year 2010 target: increase the proportion of mothers who breastfeed their babies at six months to 50%.
2009 MA PedNSS Table 7B
Percentage of infants breastfed at least 6 months*, by county
Percentage of infants breastfed at least 6 months*, by county
0 - < 20
20 - < 29
29 - < 38
38 +
No Data

2009 Massachusetts Pediatric Nutrition Surveillance Report Page 50
* Among infants who turned twelve months of age during the reporting period. Year 2010 target: increase the proportion of mothers who breastfeed their babies at one year to 25%.
2009 MA PedNSS Table 7B
Percentage of infants breastfed at least 12 months*, by county
Percentage of infants breastfed at least 12 months*, by county
0 - < 9
9 - < 15
15 - < 21
21 +
No Data

2009 Massachusetts Pediatric Nutrition Surveillance Report Page 51
APPENDIX 3: TRENDS CHARTS FOR 2009 PEDNSS
Trends in prevalence of low birthweight*by race and ethnicity
Trends in prevalence of low birthweight*by race and ethnicity
0
5
10
15
2000 2001 2002 2003 2004 2005 2006 2007 2008 2009
Year
Per
cent
age
White Black Hispanic Asian Total
2009 MA PedNSS Table 18C * < 2500 grams, among infants born during the reporting period.
Year 2010 target: reduce low birthweight to 5% of live births.

2009 Massachusetts Pediatric Nutrition Surveillance Report Page 52
Trends in prevalence of high birthweight* by race and ethnicity
Trends in prevalence of high birthweight* by race and ethnicity
2009 MA PedNSS Table 18C * > 4000 grams, among infants born during the reporting period.
0
5
10
15
2000 2001 2002 2003 2004 2005 2006 2007 2008 2009Year
Per
cent
age
White Black Hispanic Asian Total
Trends in prevalence of short stature*among children aged <5 years, by race and ethnicity
Trends in prevalence of short stature*among children aged <5 years, by race and ethnicity
0
5
10
2000 2001 2002 2003 2004 2005 2006 2007 2008 2009Year
Per
cent
age
White Black Hispanic American Indian Asian Total
2009 MA PedNSS Table 18C
* < 5th percentile length or height-for-age, CDC Growth Charts, 2000. Year 2010 target: reduce growth retardation (short stature) among low-income children under age five years to 5%.

2009 Massachusetts Pediatric Nutrition Surveillance Report Page 53
Trends in prevalence of underweight*among children aged <5 years, by race and ethnicity
Trends in prevalence of underweight*among children aged <5 years, by race and ethnicity
0
5
10
2000 2001 2002 2003 2004 2005 2006 2007 2008 2009Year
Per
cent
age
White Black Hispanic American Indian Asian Total
* < 5th percentile weight-for-length or BMI-for-age, CDC Growth Charts, 2000. 5% of children are expected to fall below the 5th percentile. 2009 MA PedNSS Table 18C
Trends in prevalence of obesity*among children aged <5 years, by age
Trends in prevalence of obesity*among children aged <5 years, by age
0
5
10
15
20
25
2000 2001 2002 2003 2004 2005 2006 2007 2008 2009
Year
Per
cent
age
Aged <1 Yr Aged 1 Yr Aged 2 Yr Aged 3 Yr Aged 4 Yr Total
* > 95th percentile weight-for-length or BMI-for-age, CDC Growth Charts, 2000. 5% of children are expected to fall above the 95th percentile. 2009 MA PedNSS Table 20C

2009 Massachusetts Pediatric Nutrition Surveillance Report Page 54
Trends in prevalence of obesity*among children aged <5 years, by race and ethnicity
Trends in prevalence of obesity*among children aged <5 years, by race and ethnicity
0
5
10
15
20
2000 2001 2002 2003 2004 2005 2006 2007 2008 2009Year
Per
cent
age
White Black Hispanic American Indian Asian Total
* > 95th percentile weight-for-length or BMI-for-age, CDC Growth Charts, 2000. 5% of children are expected to fall above the 95th percentile. 2009 MA PedNSS Table 18C
Trends in prevalence of overweight* among children aged 2 to <5 years, by race and ethnicity
Trends in prevalence of overweight* among children aged 2 to <5 years, by race and ethnicity
0
5
10
15
20
25
2000 2001 2002 2003 2004 2005 2006 2007 2008 2009Year
Per
cent
age
White Black Hispanic American Indian Asian Total
* > 85th-<95th percentile BMI-for-age, CDC Growth Charts, 2000. 10% of children are expected to fall between these percentiles. 2009 MA PedNSS Table 18C

2009 Massachusetts Pediatric Nutrition Surveillance Report Page 55
Trends in prevalence of obesity* among children aged 2 to <5 years, by race and ethnicity
Trends in prevalence of obesity* among children aged 2 to <5 years, by race and ethnicity
0
5
10
15
20
25
30
2000 2001 2002 2003 2004 2005 2006 2007 2008 2009Year
Per
cent
age
White Black Hispanic American Indian Asian Total
* > 95th percentile BMI-for-age, CDC Growth Charts, 2000. 5% of children are expected to fall above the 95th percentile. 2009 MA PedNSS Table 18C
0
5
10
15
20
25
2000 2001 2002 2003 2004 2005 2006 2007 2008 2009Year
Per
cent
age
White Black Hispanic American Indian Asian Total
Trends in prevalence of anemia* among children aged <5 years, by race and ethnicity
Trends in prevalence of anemia* among children aged <5 years, by race and ethnicity
* Hb or Hct < 5th percentile, CDC MMWR vol. 47 (No. RR-3), 1998. 2009 MA PedNSS Table 18C

2009 Massachusetts Pediatric Nutrition Surveillance Report Page 56
Trends in prevalence of anemia*among children aged <5 years, by age
Trends in prevalence of anemia*among children aged <5 years, by age
* Hb or Hct < 5th percentile, CDC MMWR vol. 47 (No. RR-3), 1998. 2009 MA PedNSS Table 21C
0
5
10
15
20
25
2000 2001 2002 2003 2004 2005 2006 2007 2008 2009
Year
Per
cent
age
Aged 0.5-<1 Yr Aged 1-<1.5 Yrs Aged 1.5-<2 YrsAged 2-<3 Yrs Aged 3-<5 Yrs Total
Trends in the percentage of infants ever breastfed*by race and ethnicity
Trends in the percentage of infants ever breastfed*by race and ethnicity
0
1020
3040
5060
7080
90
2000 2001 2002 2003 2004 2005 2006 2007 2008 2009Year
Per
cent
age
White Black Hispanic Asian Total
2009 MA PedNSS Table 19C
* Among infants born during the reporting period. Year 2010 target: increase the proportion of mothers who breastfeed their babies in the early postpartum period to 75%.

2009 Massachusetts Pediatric Nutrition Surveillance Report Page 57
Trends in the percentage of infants breastfed at least 6 months*by race and ethnicity
Trends in the percentage of infants breastfed at least 6 months*by race and ethnicity
0
10
20
30
40
50
2000 2001 2002 2003 2004 2005 2006 2007 2008 2009Year
Per
cent
age
White Black Hispanic Asian Total
2009 MA PedNSS Table 19C
* Among infants who turned six months of age during the reporting period. Year 2010 target: increase the proportion of mothers who breastfeed their babies at six months to 50%.
Trends in the percentage of infants breastfed at least 12 months*by race and ethnicity
Trends in the percentage of infants breastfed at least 12 months*by race and ethnicity
0
10
20
30
2000 2001 2002 2003 2004 2005 2006 2007 2008 2009Year
Per
cent
age
White Black Hispanic Asian Total
2009 MA PedNSS Table 19C
* Among infants who turned twelve months of age during the reporting period. Year 2010 target: increase the proportion of mothers who breastfeed their babies at one year to 25%.

2009 Massachusetts Pediatric Nutrition Surveillance Report Page 58
Trends in the percentage of infants ever breastfed, and breastfed at least 6 and 12 months
Trends in the percentage of infants ever breastfed, and breastfed at least 6 and 12 months
01020304050607080
2000 2001 2002 2003 2004 2005 2006 2007 2008 2009
Year
Per
cent
age
Ever Breastfed Breastfed 6 Months Breastfed 12 Months
Year 2010 targets: increase the proportion of mothers who breastfeed their babies a) in the early postpartum period to 75%, b) at six months to 50%, and c) at one year to 25%. 2009 MA PedNSS Table 13C