pedicing cmlaie and maimm bain sain meae fom hbidiii …€¦ · · 2017-08-25pedicing cmlaie and...
TRANSCRIPT
Predicting Cumulative and Maximum Brain Strain Measures From
HybridIII Head Kinematics: A Combined Laboratory Study and Post-HocRegression Analysis
BROOKLYNN M. KNOWLES and CHRISTOPHER R. DENNISON
Biomedical Instrumentation Laboratory, Department of Mechanical Engineering, University of Alberta, Edmonton,AB, Canada
(Received 1 December 2016; accepted 3 May 2017; published online 11 May 2017)
Associate Editor Stefan M. Duma oversaw the review of this article.
Abstract—Due to growing concern on brain injury in sport,and the role that helmets could play in preventing braininjury caused by impact, biomechanics researchers andhelmet certification organizations are discussing how helmetassessment methods might change to assess helmets based onimpact parameters relevant to brain injury. To understandthe relationship between kinematic measures and brainstrain, we completed hundreds of impacts using a 50thpercentile Hybrid III head-neck wearing an ice hockeyhelmet and input three-dimensional impact kinematics to afinite element brain model called the Simulated InjuryMonitor (SIMon) (n = 267). Impacts to the helmet front,back and side included impact speeds from 1.2 to 5.8 ms21.Linear regression models, compared through multiple regres-sion techniques, calculating adjusted R2 and the F-statistic,determined the most efficient set of kinematics capable ofpredicting SIMon-computed brain strain, including thecumulative strain damage measure (specifically CSDM-15)and maximum principal strain (MPS). Resultant change inangular velocity, DxR, better predicted CSDM-15 and MPSthan the current helmet certification metric, peak g, and wasthe most efficient model for predicting strain, regardless ofimpact location. In nearly all cases, the best two-variablemodel included peak resultant angular acceleration, aR, andDxR.
Keywords—Head injury, Brain injury, Brain strain, Injury
biomechanics, Concussion, Helmet assessment, Sport biome-
chanics.
INTRODUCTION
Brain injuries, such as concussion, occur in hockeyat rates up to 0.54 for high school,19 0.41–3.1 for col-
legiate8,15 and 1.81 for professional,32 per 1000 expo-sures. A 2012 study considering football impactsdating back to 1961 found instances of brain injuriescausing disability continually increased each year.21
Despite the widespread use of helmets, sport andrecreation-related head injury remains the second mostcommon cause of hospitalization for traumatic braininjury (TBI).10 It is understood that helmet use miti-gates the risk of severe focal head injury, however theperceived increase in rates of sport-related brain in-juries has led to increased research efforts examiningthe role of helmets in brain protection. At the sametime, international organizations are discussing howhelmet certification methods might change towardsassessing helmet ability to protect wearers from diffusebrain injury.
Minimum helmet protective capacity is currentlyestablished through standard laboratory impact test-ing. Acceleration,1,5 or functionals using accelera-tion,29 establish helmet ability to attenuate impact. Thetext in contemporary helmet standards generally doesnot include a rationale on the choice of attenuationmetric, however it is generally accepted that the choiceof head acceleration is at least partially motivated byresearch on head injury biomechanics dating back tothe 1950s and 1960s.2
A group at Wayne State University performedsome of the earliest work on injury thresholds in the1960s, developing the cerebral concussion tolerancecurve (WSTC). Based on animal and human exposuredata,11 this work identified the maximum allowablelinear acceleration the head can withstand a given timeduration, defining a relationship between linear headacceleration and time duration and severe head injury.Efforts to approximate the WSTC inspired severity
Address correspondence to Brooklynn M. Knowles, Biomedical
Instrumentation Laboratory, Department of Mechanical Engineer-
ing, University of Alberta, Edmonton, AB, Canada. Electronic mail:
Annals of Biomedical Engineering, Vol. 45, No. 9, September 2017 (� 2017) pp. 2146–2158
DOI: 10.1007/s10439-017-1848-y
0090-6964/17/0900-2146/0 � 2017 The Author(s). This article is an open access publication
2146
metrics that aimed to quantify impact severity usingkinematics. The severity index (SI), used for footballhelmet certification,29 places a limit on the total valueof resultant linear acceleration integrated over time.The Head Injury Criterion (HIC) was later developed,which also integrates linear acceleration but insteadover set time duration 15 or 36 ms. Many of the hel-met certification standards in use today quantify im-pact attenuation through peak linear acceleration(peak g).1,4,5 Helmets certified using the aboveapproaches are credited with protecting against severehead injury in contact sports.6 To build on the cele-brated track record of helmets in preventing severeinjury, helmet certification organizations are nowconsidering what approaches might be used to quan-tify impact attenuation relative to the mechanics ofimpact that have been suggested as relevant in diffuseinjury.
As early as the 1940s, experimental work has shownangular motion to be a critical impact componentcausing diffuse brain injury. In 1943, Holbourn used agelatin mixture to represent brain tissue, whereresulting strains represented the occurrence of braininjuries. After applying both translational and rota-tional loads, he found that the greatest strains occurredunder strictly rotational motion.14 Later, Yarnell andOmmaya subjected rhesus monkeys to whiplash con-ditions, confirming the significance of angular motionon brain injuries33 and Gennarelli et al. subjectedsquirrel monkeys to linear and angular motions, notinga greater frequency of brain lesions under head rota-tion.9 This research established a link between headrotation and diffuse brain injury.
Today, there exist assessment functions that incor-porate angular kinematics, though there is no con-sensus over which kinematic measure or kinematicfunction is best for predicting diffuse injury. The gen-eralized acceleration model for brain injury tolerance(GAMBIT23) and the head impact power (HIP22) in-clude both linear and angular kinematics. Brain injurycriterion (BrIC30), rotational injury criterion (RIC17)and power rotational injury criterion (PRHIC17) in-clude only angular kinematics. The combined proba-bility of concussion (CP) was developed as a functionof linear and rotational acceleration and proved to be abetter predictor for concussion than linear accelerationalone.25 Specific to helmet assessment, the Hockeysummation of tests for the analysis of risk (HockeySTAR) formula is calculated as a function of linearand angular acceleration.26
Alongside efforts to establish kinematic functions toquantify impact severity, numerical head-brain modelshave been developed that use measures of stress andstrain in brain tissue to estimate brain injury risk anddistribution. A number of finite element head models
exist, all with the aim to represent human tissueresponse to inertial loading. Developed by Takhountset al. for the automotive industry, the Simulated In-jury Monitor (SIMon) approximates the average maleskull, cerebrospinal fluid layers, bridging veins andbrain (cerebrum, cerebellum and upper spinal cord).31
Global Human Body Modeling Consortium(GHBMC),30 Wayne State University Head InjuryModel (WSUHIM),28 and the University CollegeDublin Brain Trauma Model (UCDBTM)28 areexamples of other models currently being used. Inaddition to the major structures of the brain and skullrepresented by SIMon, these models represent facialbones, scalp and in some cases a deformable skull.Computing mechanical measures such as maximumprincipal stress, maximum principal strain (MPS) andmaximum pressure represents tissue deformation.Through correlating brain strain to injury, strainmeasures including the cumulative strain damagemeasure (CSDM) and maximum axonal strain havebeen proposed to represent injury risk. Numericalmodels have become tools used to better understandthe relationship between kinematic measures and tis-sue strain.
Related to the ongoing discourse on kinematicfunctions and head-brain models, certification organi-zations and researchers alike are working towardsimproved helmet certification methods. If kinematicfunctionals incorporating angular head rotation areadopted, it will be necessary to use headforms that arecapable of measuring head rotation, and the impactsimulation method must create realistic head rotations.While the specifics of the impact test equipment are yetto be determined, it is likely that either angular headkinematics or tissue strain measures from head modelswill be used in future certification methods. Conse-quently, it is important to document how linear andangular kinematics correlate with the emerging tissuestrain measures. Such documentation could ultimatelyinfluence choices on test equipment and the use ofkinematic functionals as opposed to numerical head-brain models.
The objective of this work is to document correla-tions between measured head kinematics and tissuestrain metrics using one plausible combination of testequipment and impact simulation method. Using theHybridIII head-neck and a custom impact experimentin tandem with the SIMon head-brain finite elementmodel, we measured linear and angular head kine-matics at impact and used the measures as inputs tocompute brain tissue strain. The measured kinematicswere then evaluated using multiple regression todetermine which kinematic measures correlated withestimated brain strain and the minimum number ofkinematics needed to predict strain measures.
Predicting Cumulative and Maximum Brain Strain Measures 2147
MATERIALS AND METHODS
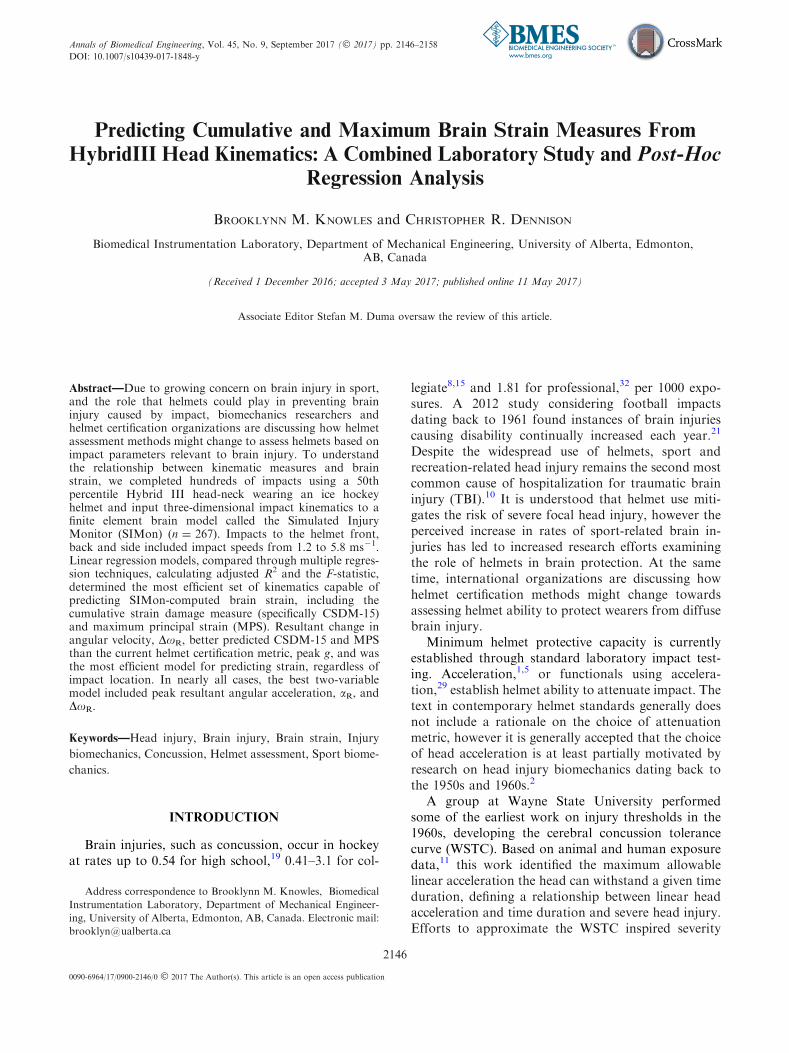
The experimental setup included a guided rail droptower with adjustable drop gimbal, an anthropomor-phic test device (ATD) head and neck (HybridIII 50thPercentile, 10 kg total mass of gimbal and head-neck)and a modular elastomer programmer surface moun-ted to a stationary steel impact anvil (Fig. 1). Anumber of methods can be explored for simulatinghead impacts that allow rotation of the head and herewe focused on a flexible neck approach to simulateimpact. The HybridIII neck was used as it representsone model being considered for future helmet assess-ment methods in place of the current rigid neck set-up.1,5 It is recognized that the HybridIII neck is stiff inaxial compression and another surrogate neck mayultimately be chosen, but here we represent one sce-nario commonly used for head impact evaluation. Infuture work, we will present results that consider a freedrop of a head form absent a neck, similar to thatbeing considered by European standards associa-tions.12
A variety of drop heights and impact locations werecompleted on 55 CSA certified helmets (Bauer 4500,size medium) for a total of 267 impacts. The experi-mental protocol was guided by common impact sitesand severities experienced by collegiate ice hockey
players, based on a study by Brainard et al. Brainardobserved that the majority of impacts were to the frontand back of the helmet and one percent of impactsresulted in peak linear head accelerations exceeding80 g.3 In our study, 24% of impacts exceeded 80 g,which is a greater percentage than that recorded byBrainard. A greater percentage of high peak g eventswere included to capture head kinematics over a widerange of impact severities. According to Margulieset al., change in angular velocities exceeding 46.5 rad/scan cause diffuse axon injury (DAI).20 Due to theinclusion of impacts resulting in atypically high peak gvalues, a small number of impacts reached angularkinematics that can be considered within range for anindividual to suffer DAI. Impact severity distribution,as quantified by peak g, is shown in Table 1 and im-pact locations referenced in this table are shown inFig. 2. The range of impact speeds included 1.2 to5.8 ms21, which encompasses speeds specified in icehockey helmet standards.1,5
Nine uniaxial accelerometers (Measurement Spe-cialties Inc. Hampton VA, model 64C-2000-360) weremounted in the HybridIII headform, arranged in a 3-2-2-2 array. Using the conventions prescribed in Pad-gaonkar et al., we converted linear acceleration mea-sures from the nine accelerometers to linearaccelerations and angular accelerations about the headcenter of mass.24 Linear and angular velocity wascomputed from linear and angular acceleration,respectively using a forward integration functionimplemented in Matlab. Impact speed was measuredby a purpose-built velocity gate setup to collectvelocity data within 40 mm of impact.
Impact acceleration data was collected and saved at100 kHz using National Instruments hardware andsoftware (PXI 6251 and Labview v8.5, Austin TX).Analog voltages were anti-alias filtered with cut-offfrequency 4 kHz using hardware prior to post-processlow-pass filtering per CFC 1000.27
The accelerometer data collected was digitally pro-cessed using Matlab to determine the peak resultantlinear acceleration and direction-specific changes inangular and linear velocity of the HybridIII headform.
HybridIII kinematics including directional linearacceleration and angular velocity were input to theImproved SIMon31 brain-skull FE model (solved withmulti-core processor, CoreTM i7-4790 CPU 8 GBRAM, Intel�, Santa Clara). The cumulative straindamage measure (specifically CSDM-15) and MPS aremechanical measures that here represent brain tissuedeformation. CSDM-15 represents the cumulativevolume fraction of the brain that reaches or exceeds atensile strain of 15% or greater. CSDM, computedwith SIMon, has corresponding risk assessment func-tions based on a body of injury data from animals and
FIGURE 1. Impact tower with helmeted 50th percentile Hy-bridIII mounted to 50th percentile neck mounted on a customgimbal with a purpose built velocity gate.
B. M. KNOWLES AND C. R. DENNISON2148

college football showing correlations between CSDMand probability of diffuse anatomic injury.30 PRHIC,based on integrated angular acceleration and angularvelocity, shows strong correlation with CSDM val-ues.18 MPS is capable of capturing all strain eventsincluding when strains do not exceed 15%, while thevolume of brain tissue exceeding the 15% strainthreshold is reported through CSDM-15. CSDM-15and MPS are reported here as these measures weredeveloped and correlated with injury using the SIMonmodel.31
The decision to work with SIMon, is based on thevalidation process done by previous researchersagainst cadaver and animal experiments31 using neu-tral density targets and intra-cranial pressures in orderto approximate the behavior of a human brain and
skull.13 The HybridIII head-neck setup was used dur-ing validation, making SIMon an appropriate choicefor our experimental set-up.
Three-dimensional data from the 267 impacts wereinput to SIMon (simulation time needed to reachconvergence being approximately 2–3 h per simula-tion). CSDM-15 and MPS were determined over80 ms. impact duration, allowing both CSDM-15 andMPS to reach a stable maximum. Here, SIMon com-puted CSDM-15 and MPS are relative measures forbrain strain and therefore increases in strain measuresare considered to indicate greater risk of brain injury.
To determine the most efficient set of kinematicsthat predict SIMon computed brain strain, includingCSDM-15 and MPS, linear regression models werecompared through multiple regression techniquesusing the equations below.
CSDM15 ¼ a0 þ b1a1 þ b2a2 þ b3a3 þ � � � þ bkak
MPS ¼ c0 þ e1c1 þ e2c2 þ e3c3 þ � � � þ ekck:
Beginning with a single predictor (k = 1), as thelinear model evolved by adding or replacing kinematicterms (ak, ck), statistical measures including weightedcoefficients (bk, ek) and their significance (p< 0.05)and adjusted R2 were computed. For a given numberof predictor terms, the magnitude of R2 conveys whichmodel best predicts variation in CSDM-15 and MPS.R2 will always increase with added terms, and thereforeadjusted R2 was computed to account for the increasednumber of terms.7 To allow comparison of modelswith similar R2 values, the F-statistic was calculated.The F-statistic here was used to represent how effi-ciently the model predicts the data set and, similar toR2, a higher F-statistic is favorable.7
Multiple Regression analysis allowed us to compareall models and identify which kinematics were signifi-cant predictors (p< 0.05), which model best fit thedata (R2) and determine if this was the most efficientmodel to predict the data (F). An ideal model wouldhave a maximum F-statistic with R2 close to 1 and allpredictor variables showing significance.
The single kinematics that will be considered indi-vidually and in combination include: peak resultant
TABLE 1. Resulting distribution of the number of impacts categorized by peak g range and impact location.
Location
No. of impacts
Total<45 g >45 g >80 g
Front 43 29 33 105
Back 39 31 18 88
Side 34 28 12 74
All 116 88 63 267
FIGURE 2. BauerTM hockey helmet showing (a) impactregions defined by 90-degree sections as shown from the topview, and impact locations for (b) front, (c) side and (d) backimpacts.
Predicting Cumulative and Maximum Brain Strain Measures 2149

linear acceleration (peak g), impact velocity (Vi),resultant change in linear velocity (DVR), peak resul-tant linear velocity (VR), peak resultant angularacceleration (aR), resultant change in angular velocity(DxR), directional change in angular velocity (Dxx,Dxy, Dxz), peak resultant angular velocity (xR) anddirectional peak angular velocity (xx, xy, xz). Figure 3contains example plots of angular velocity to demon-strate how kinematic terms were defined (e.g. resultantvs. direction-specific). Maximum kinematic valueswere determined irrespective of the time that the valuesoccurred. The conventions displayed in Fig. 3 fordetermining change in resultant and peak angularvelocity values were the same as those used for linearvelocity and linear acceleration.
RESULTS
Results for multiple regression models predictingCSDM-15 and MPS, considering all impact locationstogether, are found in Tables 2 and 3, respectively.Multiple regression results specific to impact location,considering separately impacts to the front, back andside, have been summarized in Tables 4, 5, and 6.The regression models that achieved the maximumF-statistic, maximum adjusted R2, and the best two-variable regression model are indicated in Tables 4, 5,
and 6, respectively, presenting which variables wereused to create each model based on impact location.
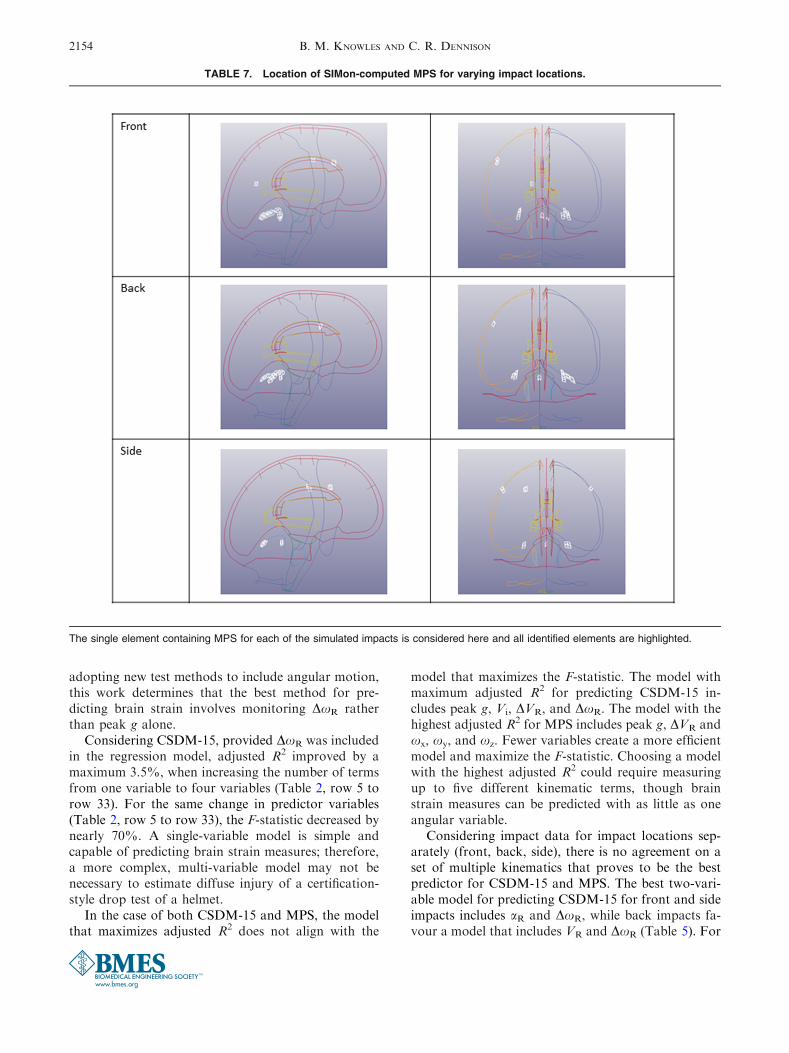
The location of MPS is reported in Table 7 byhighlighting the element that experienced the greatesttensile strain during impact. MPS was most commonlyreached in the cerebrum in regions adjacent to thecerebellum on the left and the right. Overall, more than80% of maximum strains occurred in this region (88%of Front, 93% of Back, 65% for Side impacts).
The single best kinematic predictor for both CSDM-15 and MPS considering all impact locations togetherwas DxR as shown by R2 of 0.86 and F-statistic 1629(Table 2, row 5) for CSDM-15 and R2 of 0.89 and F-statistic 2023 (Table 3, row 5) for MPS. Each kine-matic variable was statistically significant in predictingCSDM-15 and MPS when acting as an individualpredictor (Tables 2, 3, rows 1–7), though DxR identi-fies as the most efficient model for predicting bothstrain measures and a better option than peak g andaR. The highest adjusted R2 for CSDM-15 wasobtained using a 4-variable regression model includingpeak g, Vi, DVR and DxR (Table 2, row 33). A 5-variable model resulted in the highest adjusted R2 va-lue for MPS including peak g, DVR, xx, xy, and xz
(Table 3, row 37). Considering all regressions models(Tables 2, 3, rows 1–37), as a new term was added to aprevious model, adjusted R2 increased or stayed thesame.
FIGURE 3. Angular velocity plotted over time: (a) Three-dimensional angular velocity demonstrating the difference between xyand Dxy; Dxx and Dxz were determined in the same way and DxR was calculated as the resultant of these three values; (b)Resultant angular velocity over the impact time duration used to determine xR.
B. M. KNOWLES AND C. R. DENNISON2150
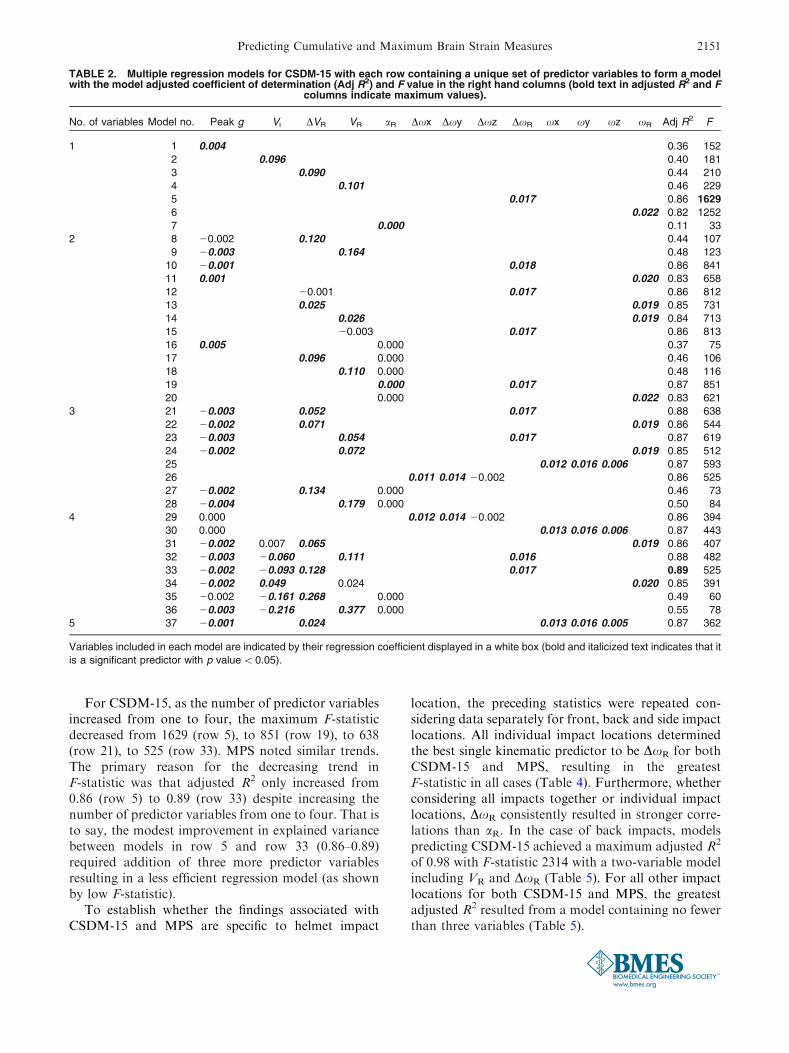
For CSDM-15, as the number of predictor variablesincreased from one to four, the maximum F-statisticdecreased from 1629 (row 5), to 851 (row 19), to 638(row 21), to 525 (row 33). MPS noted similar trends.The primary reason for the decreasing trend inF-statistic was that adjusted R2 only increased from0.86 (row 5) to 0.89 (row 33) despite increasing thenumber of predictor variables from one to four. That isto say, the modest improvement in explained variancebetween models in row 5 and row 33 (0.86–0.89)required addition of three more predictor variablesresulting in a less efficient regression model (as shownby low F-statistic).
To establish whether the findings associated withCSDM-15 and MPS are specific to helmet impact
location, the preceding statistics were repeated con-sidering data separately for front, back and side impactlocations. All individual impact locations determinedthe best single kinematic predictor to be DxR for bothCSDM-15 and MPS, resulting in the greatestF-statistic in all cases (Table 4). Furthermore, whetherconsidering all impacts together or individual impactlocations, DxR consistently resulted in stronger corre-lations than aR. In the case of back impacts, modelspredicting CSDM-15 achieved a maximum adjusted R2
of 0.98 with F-statistic 2314 with a two-variable modelincluding VR and DxR (Table 5). For all other impactlocations for both CSDM-15 and MPS, the greatestadjusted R2 resulted from a model containing no fewerthan three variables (Table 5).
TABLE 2. Multiple regression models for CSDM-15 with each row containing a unique set of predictor variables to form a modelwith the model adjusted coefficient of determination (Adj R2) and F value in the right hand columns (bold text in adjusted R2 and F
columns indicate maximum values).
No. of variables Model no. Peak g Vi DVR VR aR Dxx Dxy Dxz DxR xx xy xz xR Adj R2 F
1 1 0.004 0.36 152
2 0.096 0.40 181
3 0.090 0.44 210
4 0.101 0.46 229
5 0.017 0.86 1629
6 0.022 0.82 1252
7 0.000 0.11 33
2 8 20.002 0.120 0.44 107
9 20.003 0.164 0.48 123
10 20.001 0.018 0.86 841
11 0.001 0.020 0.83 658
12 20.001 0.017 0.86 812
13 0.025 0.019 0.85 731
14 0.026 0.019 0.84 713
15 20.003 0.017 0.86 813
16 0.005 0.000 0.37 75
17 0.096 0.000 0.46 106
18 0.110 0.000 0.48 116
19 0.000 0.017 0.87 851
20 0.000 0.022 0.83 621
3 21 20.003 0.052 0.017 0.88 638
22 20.002 0.071 0.019 0.86 544
23 20.003 0.054 0.017 0.87 619
24 20.002 0.072 0.019 0.85 512
25 0.012 0.016 0.006 0.87 593
26 0.011 0.014 20.002 0.86 525
27 20.002 0.134 0.000 0.46 73
28 20.004 0.179 0.000 0.50 84
4 29 0.000 0.012 0.014 20.002 0.86 394
30 0.000 0.013 0.016 0.006 0.87 443
31 20.002 0.007 0.065 0.019 0.86 407
32 20.003 20.060 0.111 0.016 0.88 482
33 20.002 20.093 0.128 0.017 0.89 525
34 20.002 0.049 0.024 0.020 0.85 391
35 20.002 20.161 0.268 0.000 0.49 60
36 20.003 20.216 0.377 0.000 0.55 78
5 37 20.001 0.024 0.013 0.016 0.005 0.87 362
Variables included in each model are indicated by their regression coefficient displayed in a white box (bold and italicized text indicates that it
is a significant predictor with p value<0.05).
Predicting Cumulative and Maximum Brain Strain Measures 2151

TABLE 3. Multiple regression models for MPS with each row containing a unique set of predictor variables to form a model withthe model adjusted coefficient of determination (Adj R2) and F value in the right hand columns (bold text in adjusted R2 and F
columns indicate maximum values).
No. of variables Model no. Peak g Vi DVR VR aR Dxx Dxy Dxz DxR xx xy xz xR Adj R2 F
1 1 0.003 0.43 192
2 0.066 0.45 206
3 0.062 0.48 234
4 0.070 0.51 260
5 0.011 0.89 2023
6 0.014 0.83 1239
7 0.000 0.17 49
2 8 0.000 0.060 0.48 116
9 20.001 0.088 0.51 132
10 0.000 0.011 0.89 1008
11 0.022 0.012 0.85 735
12 0.002 0.011 0.89 1009
13 0.020 0.012 0.86 788
14 0.022 0.012 0.86 772
15 0.001 0.011 0.89 1008
16 0.003 0.000 0.44 95
17 0.064 0.000 0.49 116
18 0.074 0.000 0.52 129
19 0.000 0.011 0.89 1025
20 0.000 0.014 0.84 640
3 21 20.001 0.014 0.011 0.89 686
22 0.000 0.027 0.012 0.86 526
23 20.001 0.013 0.011 0.89 679
24 0.000 0.026 0.012 0.86 514
25 0.006 0.010 0.009 0.89 720
26 0.006 0.008 0.003 0.87 556
27 0.989 0.000 0.838 0.49 77
28 20.001 0.092 0.000 0.52 87
4 29 0.000 0.005 0.008 0.002 0.87 417
30 0.000 0.006 0.010 0.008 0.89 541
31 0.000 0.022 0.009 0.012 0.86 397
32 0.000 20.022 0.034 0.011 0.89 514
33 20.001 20.036 0.044 0.011 0.89 530
34 0.000 0.043 20.016 0.013 0.86 398
35 0.000 20.083 0.134 0.000 0.50 61
36 20.001 20.133 0.214 0.000 0.56 78
5 37 0.001 20.019 0.006 0.010 0.009 0.90 447
Variables included in each model are indicated by their regression coefficient displayed in a white box (bold and italicized text indicates that it
is a significant predictor with p value<0.05).
TABLE 4. Summary of the variables included in multiple regression models predicting CSDM-15 (top) and MPS (bottom) resultingin the greatest F-statistic.
Impact No. of variables Variables included in regression model Adj R2 F
CSDM-15
All 1 DxR 0.86 1629
Front DxR 0.83 522
Back DxR 0.96 2386
Side DxR 0.72 185
MPS
All 1 DxR 0.89 2023
Front DxR 0.83 479
Back DxR 0.93 1072
Side DxR 0.78 253
Each row represents one of the four impact group considerations: all impacts considered together (All) and individual impact locations (Front,
Back, Side). Variables included in each model are indicated (bold and italicized text indicates that it is a significant predictor with p
value< 0.05).
B. M. KNOWLES AND C. R. DENNISON2152

DISCUSSION
This study used multiple regression techniques todetermine the least number of kinematic terms neces-sary to predict brain strain calculated using SIMon forone configuration of test equipment.
This study proves that it is possible to create amodel capable of predicting brain strain measuresbased on multiple linear and angular kinematics,though a single angular kinematic can predict bothCSDM-15 and MPS. The single best kinematic pre-dictor for CSDM-15 and MPS is DxR, consistent whenconsidering all impact locations together as well aswhen considering each impact location separately. Inall cases, the model that achieved the highest F-statisticfor predicting both brain strain measures included onlyDxR. The indication that brain strain can be predictedusing a single kinematic DxR agrees with work by
Takhounts et al. who established angular velocitycorrelated better with CSDM and MPS than any otherkinematic measures or functionals when consideringinjury in automotive impacts.31 Through the develop-ment of BrIC, Takhounts et al. confirmed that angularvelocity is a better predictor for CSDM and MPS thanangular acceleration and linear acceleration,30 which isin agreement with the findings in the present study asindicated by DxR showing a greater R2 and F-statisticthan peak g and aR.
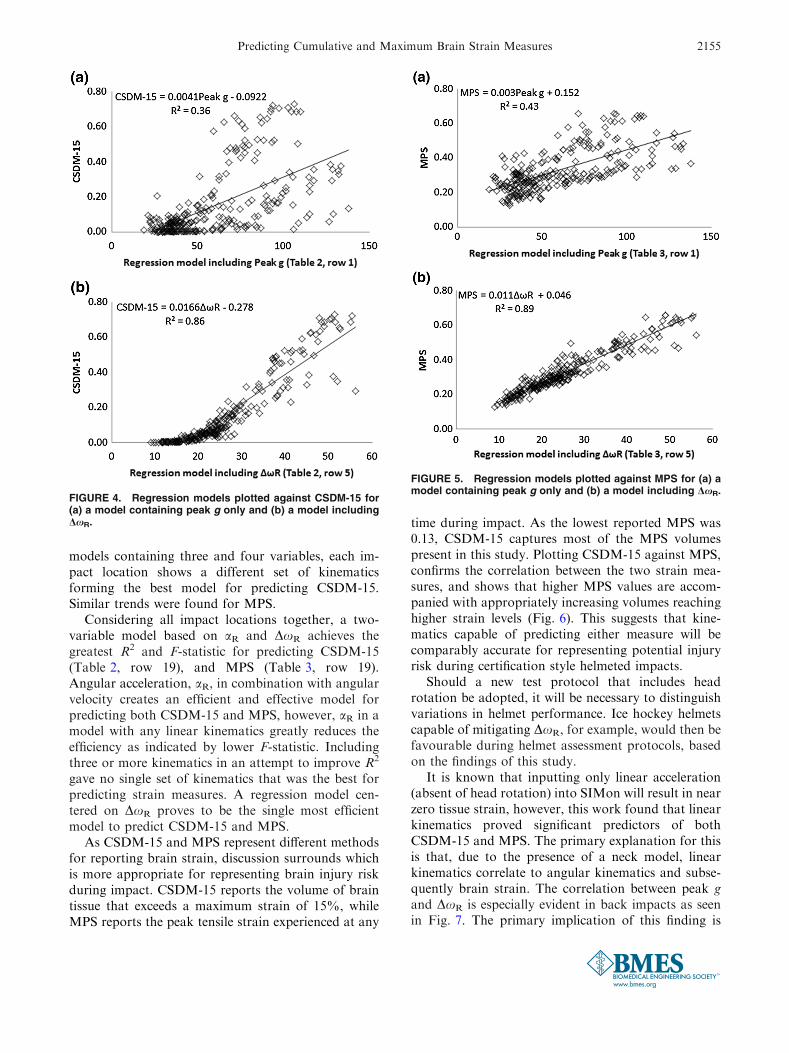
Considering single variable regression models, DxR
better predicts CSDM-15 and MPS than the currenthelmet certification metric, peak g, as shown by theplots in Figs. 4 and 5. A regression model includingDxR compared to a model containing peak g achievedgreater adjusted R2 and F-statistic. The significance ofthis finding is that as standard organizations discuss
TABLE 5. Summary of the variables included in multiple regression models predicting CSDM-15 (top) and MPS (bottom) resultingin the greatest adjusted R2.
Impacts No. of Variables Variables included in regression model Adj R2 F
CSDM-15
All 4 Peak g Vi DVR DxR 0.89 525
Front 4 Peak g xx xy xz 0.92 289
Back 2 VR DxR 0.98 2314
Side 2 aR DxR 0.82 157
MPS
All 5 Peak g DVR xx xy xz 0.90 447
Front 5 Peak g DVR xx xy xz 0.93 283
Back 3 Dxx Dxy Dxz 0.94 473
Side 4 Peak g Vi DVR aR 0.82 73
Each row represents one of the four impact group considerations: all impacts considered together (All) and individual impact locations (Front,
Back, Side). Variables included in each model are indicated (bold and italicized text indicates that it is a significant predictor with p
value< 0.05).
TABLE 6. Summary of the variables included in the best two-variable regression models for predicting CSDM-15 (top) and MPS(bottom).
Impacts No. of variables Variables included in regression model Adj R2 F
CSDM-15
All 2 aR DxR 0.87 851
Front aR DxR 0.85 267
Back VR DxR 0.98 2314
Side aR DxR 0.82 157
MPS
All 2 aR DxR 0.89 1025
Front aR DxR 0.89 356
Back aR DxR 0.94 612
Side aR DxR 0.81 142
Each row represents one of the four impact group considerations: all impacts considered together (All) and individual impact locations (Front,
Back, Side). Variables included in each model are indicated (bold and italicized text indicates that it is a significant predictor with p
value< 0.05).
Predicting Cumulative and Maximum Brain Strain Measures 2153
adopting new test methods to include angular motion,this work determines that the best method for pre-dicting brain strain involves monitoring DxR ratherthan peak g alone.
Considering CSDM-15, provided DxR was includedin the regression model, adjusted R2 improved by amaximum 3.5%, when increasing the number of termsfrom one variable to four variables (Table 2, row 5 torow 33). For the same change in predictor variables(Table 2, row 5 to row 33), the F-statistic decreased bynearly 70%. A single-variable model is simple andcapable of predicting brain strain measures; therefore,a more complex, multi-variable model may not benecessary to estimate diffuse injury of a certification-style drop test of a helmet.
In the case of both CSDM-15 and MPS, the modelthat maximizes adjusted R2 does not align with the
model that maximizes the F-statistic. The model withmaximum adjusted R2 for predicting CSDM-15 in-cludes peak g, Vi, DVR, and DxR. The model with thehighest adjusted R2 for MPS includes peak g, DVR andxx, xy, and xz. Fewer variables create a more efficientmodel and maximize the F-statistic. Choosing a modelwith the highest adjusted R2 could require measuringup to five different kinematic terms, though brainstrain measures can be predicted with as little as oneangular variable.
Considering impact data for impact locations sep-arately (front, back, side), there is no agreement on aset of multiple kinematics that proves to be the bestpredictor for CSDM-15 and MPS. The best two-vari-able model for predicting CSDM-15 for front and sideimpacts includes aR and DxR, while back impacts fa-vour a model that includes VR and DxR (Table 5). For
TABLE 7. Location of SIMon-computed MPS for varying impact locations.
The single element containing MPS for each of the simulated impacts is considered here and all identified elements are highlighted.
B. M. KNOWLES AND C. R. DENNISON2154
models containing three and four variables, each im-pact location shows a different set of kinematicsforming the best model for predicting CSDM-15.Similar trends were found for MPS.
Considering all impact locations together, a two-variable model based on aR and DxR achieves thegreatest R2 and F-statistic for predicting CSDM-15(Table 2, row 19), and MPS (Table 3, row 19).Angular acceleration, aR, in combination with angularvelocity creates an efficient and effective model forpredicting both CSDM-15 and MPS, however, aR in amodel with any linear kinematics greatly reduces theefficiency as indicated by lower F-statistic. Includingthree or more kinematics in an attempt to improve R2
gave no single set of kinematics that was the best forpredicting strain measures. A regression model cen-tered on DxR proves to be the single most efficientmodel to predict CSDM-15 and MPS.
As CSDM-15 and MPS represent different methodsfor reporting brain strain, discussion surrounds whichis more appropriate for representing brain injury riskduring impact. CSDM-15 reports the volume of braintissue that exceeds a maximum strain of 15%, whileMPS reports the peak tensile strain experienced at any
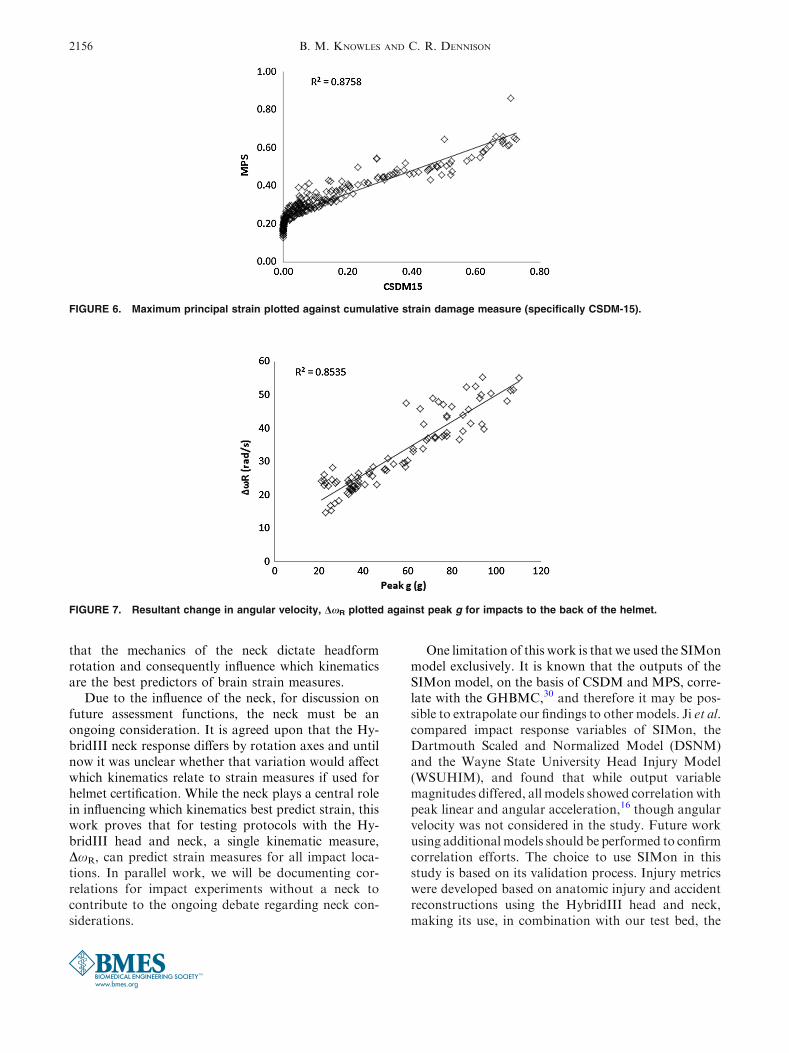
time during impact. As the lowest reported MPS was0.13, CSDM-15 captures most of the MPS volumespresent in this study. Plotting CSDM-15 against MPS,confirms the correlation between the two strain mea-sures, and shows that higher MPS values are accom-panied with appropriately increasing volumes reachinghigher strain levels (Fig. 6). This suggests that kine-matics capable of predicting either measure will becomparably accurate for representing potential injuryrisk during certification style helmeted impacts.
Should a new test protocol that includes headrotation be adopted, it will be necessary to distinguishvariations in helmet performance. Ice hockey helmetscapable of mitigating DxR, for example, would then befavourable during helmet assessment protocols, basedon the findings of this study.
It is known that inputting only linear acceleration(absent of head rotation) into SIMon will result in nearzero tissue strain, however, this work found that linearkinematics proved significant predictors of bothCSDM-15 and MPS. The primary explanation for thisis that, due to the presence of a neck model, linearkinematics correlate to angular kinematics and subse-quently brain strain. The correlation between peak gand DxR is especially evident in back impacts as seenin Fig. 7. The primary implication of this finding is
FIGURE 4. Regression models plotted against CSDM-15 for(a) a model containing peak g only and (b) a model includingDxR.
FIGURE 5. Regression models plotted against MPS for (a) amodel containing peak g only and (b) a model including DxR.
Predicting Cumulative and Maximum Brain Strain Measures 2155
that the mechanics of the neck dictate headformrotation and consequently influence which kinematicsare the best predictors of brain strain measures.
Due to the influence of the neck, for discussion onfuture assessment functions, the neck must be anongoing consideration. It is agreed upon that the Hy-bridIII neck response differs by rotation axes and untilnow it was unclear whether that variation would affectwhich kinematics relate to strain measures if used forhelmet certification. While the neck plays a central rolein influencing which kinematics best predict strain, thiswork proves that for testing protocols with the Hy-bridIII head and neck, a single kinematic measure,DxR, can predict strain measures for all impact loca-tions. In parallel work, we will be documenting cor-relations for impact experiments without a neck tocontribute to the ongoing debate regarding neck con-siderations.
One limitation of this work is that we used the SIMonmodel exclusively. It is known that the outputs of theSIMon model, on the basis of CSDM and MPS, corre-late with the GHBMC,30 and therefore it may be pos-sible to extrapolate our findings to other models. Ji et al.compared impact response variables of SIMon, theDartmouth Scaled and Normalized Model (DSNM)and the Wayne State University Head Injury Model(WSUHIM), and found that while output variablemagnitudes differed, all models showed correlation withpeak linear and angular acceleration,16 though angularvelocity was not considered in the study. Future workusing additional models should be performed to confirmcorrelation efforts. The choice to use SIMon in thisstudy is based on its validation process. Injury metricswere developed based on anatomic injury and accidentreconstructions using the HybridIII head and neck,making its use, in combination with our test bed, the
FIGURE 6. Maximum principal strain plotted against cumulative strain damage measure (specifically CSDM-15).
FIGURE 7. Resultant change in angular velocity, DxR plotted against peak g for impacts to the back of the helmet.
B. M. KNOWLES AND C. R. DENNISON2156
most appropriate choice. However, we acknowledge thepossibility that the findings in this study could be alteredby virtue of using another brain model.
This study is limited to relatively short impactdurations associated with helmeted impacts. As we aimto focus on kinematics that predict strain measuresspecifically for helmeted impacts, this study did notconsider impact durations exceeding 80 ms.
Further, we acknowledge that the use of the Hy-bridIII neck influences the results of this study and thepredictor variable coefficients in each regression modelare dictated by our specific experimental setup. Futurework will include helmeted impacts with the HybridIIIhead and no neck constraint to determine whether thefindings in the present study change.
This study is the first to document impact location-specific results to determine the best kinematic pre-dictors for brain strain measures. Hundreds of hel-meted impacts were completed at varying locationsand an extensive statistical analysis was performedshowing conclusively that while individual kinematicparameters are statistically significant when consideredalone, angular velocity is the single best kinematicpredictor for brain strain and that a combination oflinear and angular kinematics can predict brain strainmeasures. Considering independently the various im-pact locations, aR and DxR were identified as the besttwo-variable model for strain prediction in nearly allcases, excluding only back impacts for CSDM-15prediction. This study also shows that the mechanics ofthe neck will dictate the strains predicted, and there-fore which kinematics predict brain strain. The resultsof this study could be used to inform which kinematicscould be included for helmet assessment using dropswith the HybridIII head and neck.
ACKNOWLEDGMENTS
Wegratefully acknowledge funding from theNaturalScience and Engineering Research Council (NSERC) ofCanada (Discovery Grants 435921), the Pashby SportSafety Fund (2016: RES0028760), the BantingResearchFoundation (Discovery Award 31214), and the Facultyof Engineering and Department of Mechanical Engi-neering at the University of Alberta.
OPEN ACCESS
This article is distributed under the terms of theCreative Commons Attribution 4.0 InternationalLicense (http://creativecommons.org/licenses/by/4.0/),which permits unrestricted use, distribution, and re-
production in any medium, provided you give appro-priate credit to the original author(s) and the source,provide a link to the Creative Commons license, andindicate if changes were made.
REFERENCES
1ASTM F1045-07. Standard Performance Specification forIce Hockey Helmets.2BS 1869:1960. Specification for Protective Helmets forRacing Motorcyclists, 1960.3Brainard, L. L., J. G. Beckwith, J. J. Chu, J. J. Crisco, T.W. Mcallister, A.-C. Duhaime, A. C. Maerlender, and R.M. Greenwald. Gender differences in head impacts sus-tained by collegiate ice hockey players. Med. Sci. SportsExerc. 44:297–304, 2012.4CPSC. Safety Standard for Bicycle Helmets, Final Rule,1998.5CSA Z262.1-09. Standard for Ice Hockey Helmets., 2012.http://shop.csa.ca/en/canada/injury-prevention/z2621-09/invt/27009292009/.6Daneshvar, D. H., C. M. Baugh, C. J. Nowinski, A. C.McKee, R. A. Stern, and R. C. Cantu. Helmets and mouthguards: the role of personal equipment in preventing sport-related concussions. Clin. Sports Med. 30:145–163, 2011.7Devore, J. L. Probability and Statistics for Engineering andthe Sciences. Pacific Grove: Duxbury, 2000.8Flik, K., S. Lyman, and R. G. Marx. American collegiatemen’s ice hockey: an analysis of injuries. Am. J. SportsMed. 33:183–187, 2005.9Gennarelli, T. A., L. E. Thibault, and K. Ommaya.Pathophysiologic Responses to Rotational and Transla-tional Accelerations of the Head., 16th Stapp Car CrashConference, 1972.
10Gilchrist, J., K. E. Thomas, L. Xu, L. C. McGuire, and V.Coronado. Nonfatal traumatic brain injuries related tosports and recreation activities among persons aged £ 19Years. MMWR 60:1337–1342, 2011.
11Gurdjian, E., V. Roberts, and L. Thomas. Tolerance curvesof acceleration and intracranial pressure and protectiveindex in experimental head injury. J. Trauma 6:600–604,1966.
12Halldin, P. CEN/TC 158 Working Group 11 Rotationaltest methods, 2014.
13Hardy, W. N., M. J. Mason, C. D. Foster, C. S. Shah, J. M.Kopacz, K. H. Yang, A. I. King, J. Bishop, M. Bey, W.Anderst, and S. Tashman. A study of the response of thehuman cadaver head to impact. Stapp Car Crash J. 51:17,2012.
14Holbourn, A. H. S. Mechanics of head injuries. The Lancet242:438–441, 1943.
15Hootman, J. M., R. Dick, and J. Agel. Epidemiology ofcollegiate injuries for 15 sports: summary and recommen-dations for injury prevention initiatives. J. Athl. Train.42:311–319, 2007.
16Ji, S., H. Ghadyani, R. P. Bolander, J. G. Beckwith, J. C.Ford, T. W. McAllister, L. A. Flashman, K. D. Paulsen, K.Ernstrom, S. Jain, R. Raman, L. Zhang, and R. M.Greenwald. Parametric comparisons of intracranialmechanical responses from three validated finite elementmodels of the human head. Ann. Biomed. Eng. 42:11–24,2014.
Predicting Cumulative and Maximum Brain Strain Measures 2157
17Kimpara, H., and M. Iwamoto. Mild traumatic brain in-jury predictors based on angular accelerations during im-pacts. Ann. Biomed. Eng. 40:114–126, 2012.
18Kimpara, H., Y. Nakahira, M. Iwamoto, S. Rowson, andS. Duma. Head injury prediction methods based on 6 de-gree of freedom head acceleration measurements duringimpact. Int. J. Automot. Eng. 2:13–19, 2011.
19Marar, M., N. M. McIlvain, S. K. Fields, and R. D.Comstock. Epidemiology of concussions among UnitedStates high school athletes in 20 sports. Am. J. Sports Med.40:747–755, 2012.
20Margulies, S. S., and L. E. Thibault. A proposed tolerancecriterion for diffuse axonal injury in man. J. Biomech.25:917–923, 1992.
21Mueller, F. O., and R. C. Cantu. Annual Survey ofCatastrophic Football Injuries. Am. Footb. Coach. Assoc.Natl. Coll. Athl. Assoc. Natl. Fed. State High Sch. Assoc.,2011. http://www.unc.edu/depts/nccsi/FBCATReport2011.pdf.
22Newman, J. A., N. Shewchenko, and E. Welbourne. Aproposed New Biomechanical head injury assessmentfunction—the maximum power index. Stapp Car Crash J.44:215–247, 2000.
23Newman, J. A. A Generalized Model for Brain InjuryThreshold (GAMBIT), Proceedings of the 1986 Interna-tional IRCOBI Conference on the Biomechanics of Impact,1986.
24Padgaonkar, A. J., K. W. Krieger, and A. I. King. Mea-surement of angular acceleration of a rigid body usinglinear accelerometers. J. Appl. Mech. 42:552–556, 1975.
25Rowson, S., and S. M. Duma. Brain injury prediction:assessing the combined probability of concussion usinglinear and rotational head acceleration. Ann. Biomed. Eng.41:873–882, 2013.
26Rowson, B., S. Rowson, and S. M. Duma. Hockey STAR: amethodology for assessing the biomechanical performanceof hockey helmets. Ann. Biomed. Eng. 43:2429–2443, 2015.
27SAE J211. Instrumentation for Impact Test—Part 1:Electronic Instrumentation.
28Samaka, H., and F. Tarlochan. Finite element (FE) humanhead models/literature review. Int. J. Sci. Technol. Res.2:17–31, 2013.
29Standard Performance Specification for Newly Manufac-tured Football Helmets, NOCSAE DOC (ND) 002-13m15,2015.
30Takhounts, E. G., M. J. Craig, K. Moorhouse, J.McFadden, and V. Hasija. Development of brain injurycriteria (Br IC). Stapp Car Crash J. 57:243–266, 2013.
31Takhounts, E. G., S. A. Ridella, V. Hasija, R. E. Tannous,J. Q. Campbell, D. Malone, K. Danelson, J. Stitzel, S.Rowson, and S. Duma. Investigation of traumatic braininjuries using the next generation of Simulated InjuryMonitor (SIMon) finite element head model. Stapp CarCrash J. 52:1–31, 2008.
32Wennberg, R. A., and C. H. Tator. Concussion incidenceand time lost from play in the NHL during the past tenyears. Can. J. Neurol. Sci. 35:647–651, 2008.
33Yarnell, P., and A. K. Ommaya. Experimental cerebralconcussion in the rhesus monkey. Bull. N. Y. Acad. Med.45:39, 1969.
B. M. KNOWLES AND C. R. DENNISON2158