pelican island phase iii time zero plus 3 months final...
TRANSCRIPT

Pelican Island Restoration and StabilizationProject (Phase III),
Final Report Time Zero Plus Three Months
Prepared For:U.S. Fish and Wildlife Service, Pelican Island National Wildlife Refuge
(PINWR)Permit #4-061-63126-4
Prepared By:Coastal Resources Group, Inc.
P.O. Box 5430Salt Springs, FL 32134
June 1, 2006

2
Table of Contents
Table of Contents................................................................................................................ 2Introduction......................................................................................................................... 3
Figure 1. Location of PINWR and Pelican Island. .................................................... 3Figure 2. PINWR graphic of Pelican Island shoreline erosion. .................................. 4
Methods............................................................................................................................... 5Construction.................................................................................................................... 5
Figure 3. Aerial of completed turbidity curtain surrounding Pelican Island ............. 6construction area. ........................................................................................................ 6Figure 4. Retrieval of materials from staging location. .............................................. 7Figure 5. Release of materials from helicopter bucket. .............................................. 7Figure 6. Permitted restoration plan, July 8, 2004. ..................................................... 9Figure 7. Aerial showing location of the three restoration areas (planting areas). ... 10Figure 8. Picture of labor crews moving sand into restoration areas (planting areas).................................................................................................................................... 10
Time Zero Plus Three Months Monitoring–Fill and Planting Areas.......................... 11Results............................................................................................................................... 11
Construction.................................................................................................................. 11Figure 9. Location of the final placement of the fill and planting areas .................. 12and existing cordgrass............................................................................................... 12Figure10. Fill with no impact to seagrasses, Phase III completed in February 2006.................................................................................................................................... 13Figure 11. Aerial showing location of shallow swale and small opening in thebreakwater................................................................................................................. 14
Time Zero Plus Three Months Monitoring–Fill and Planting Areas.......................... 14Figure 13. Cordgrass plantings in same area May 4, 2006....................................... 15Figure 14. Cordgrass plantings May 4, 2006............................................................ 16Figure 15. Cordgrass plantings, May 4, 2006........................................................... 16Figure 16. Location of dead cordgrass and mangrove May 4, 2006........................ 17Figure 17. Volunteer mangroves February 2006. .................................................... 18Figure 18. Surviving planted mangrove and cordgrass May 4, 2006. ...................... 18Figure 19. One dead red mangrove May 4, 2006. .................................................... 19
Monitoring .................................................................................................................... 19Conclusions....................................................................................................................... 19Literature Cited ................................................................................................................. 20

3
Introduction
Pelican Island National Wildlife Refuge is located east of Sebastian, Florida in the barrierislands between Sebastian Inlet and the Wabasso Causeway within the Indian RiverLagoon (Figure 1). The refuge was established in 1903 and encompasses a total of 5,413acres of coastal habitat including coastal hammock, mangrove forest and marsh. Inparticular, one of several islands in the refuge, Pelican Island, has provided an importantresource as a nesting site for numerous Florida bird species. Unfortunately, the island haslong suffered from severe erosion problems along its northwestern shoreline resulting in adecrease in size of 60% since 1943 (Figure 2). Studies of the erosion pattern and forcessuggested that much of the problem is due to wakes from boat traffic in and near theIntracoastal Waterway that runs parallel directly west of Pelican Island (Parkinson andDunlevy, 1999).
Figure 1. Location of PINWR and Pelican Island.

4
Figure 2. PINWR graphic of Pelican Island shoreline erosion.
A report by Lewis Environmental Services, Installation of a Breakwater and SpartinaPlanting, the Phase I and II Shoreline Restoration Project, Pelican Island NationalWildlife Refuge, Florida, (2001), describes an effort to provide emergency protectionfrom erosion of the northwestern and southern shorelines of Pelican Island. For Phase Iof this project a 165 foot long breakwater was constructed and smooth cordgrass(Spartina alterniflora) was planted behind the breakwater to protect the existing shorelinefrom further erosion. This initial work was permitted under Permit Number 40061-63126issued by the St. Johns River Water Management District on January 10, 2000. The workwas undertaken as an emergency measure since efforts in August 1999 to stabilize theisland with plantings alone were destroyed by Hurricane Irene in October of 1999.
A second permit (new permit # 40-061-63126-2) was issued on November 9, 2000 bythe St. Johns River Water Management District and permit number 1999055091(LP-AP)was issued on January 10, 2000 by the Jacksonville District Corps of Engineers to addadditional materials to the breakwater (Phase II). The Phase II breakwater provided anadditional 930 cubic feet of fossilized shell delivered by helicopter from Sarasota shellpits and served to protect additional cordgrass plantings to protect the shoreline fromfurther erosion.
5
Close monitoring of the cordgrass plantings in 1999 and in 2001 showed that all theplantings did not survive due to a combination of factors. The first factor determined isthe unsuitable elevation for the cordgrass species. The elevations of the planting areasbehind the breakwater were not high enough to support sustained growth of the cordgrasspatches. Initially the plants did very well but much of the cordgrass died out within a fewyears. In addition, it is assumed that the three hurricanes which came close to PelicanIsland in the years between 2001 and 2006 may have uprooted many of the plants beforethey could successfully establish. Despite the combined impacts of the elevationproblems and the hurricanes an estimated 10,000 square feet of cordgrass survived andhas begun accumulating mangrove seedlings, most of the significant erosion has stopped,and the island expanded in area by 0.44 acre (19,166 ft2) for a total area of 2.78 acresbetween 1999 and 2003 as a result of the installation of the breakwater and the growth ofthe surviving plantings.
Permits for Pelican Island Phase III, were issued by the St. Johns Water ManagementDistrict (4-061-63126-4) on July 13, 2004 and the Jacksonville District Corps ofEngineers (SAJ- 2004-4457(IP-TSD)) on September 17, 2004. The Phase III permitsapproved approximately 260 cubic yards of fossilized shell to be added to the existingbreakwater and approximately 900 cubic yards of sand to be added to the shallows inthree areas behind the breakwater. Initiation of Phase III began, January 3, 2006.Construction of the breakwater was completed January 26, 2006. Cordgrass seedlings andmangroves were planted February 6-12, 2006. This report describes the methods ofconstruction, vegetation planting and results of the Time Zero Report Plus Three Monthsas required by Permit # 4-061-63126-4. Additional monitoring and reporting of thesuccess of the breakwater protection and vegetation planting will be completed per permitschedule.
Methods
ConstructionThe mobilization for construction of the breakwater began January 3, 2006, as a crewcontracted by the United States Fish and Wildlife Service (USFWS) began theinstallation of double turbidity curtains surrounding the project areas. The crew carefullyinstalled the turbidity curtains by hand preventing any impact to nearby seagrassmeadows surrounding the island. An airboat (provided by the Indian River CountyMosquito Control Department) was used to assist in the turbidity curtain construction bytowing and carrying the turbidity curtain into the shallow water surrounding theconstruction sites. Installation of the curtain was completed by January 7, 2006 (Figure3).
Fossilized shell (shell mined from the Caloosahatchee deposit near Sarasota, Florida) wasdelivered to the staging site at a location about ¾ miles from Pelican Island. A large pileof sand, excavated from several small constructed lakes within the refuge boundary, wasalready present at the site and consistency was similar to that already found at the island.

6
Figure 3. Aerial of completed turbidity curtain surrounding Pelican Islandconstruction area.
Materials were loaded into a large bucket by front end loaders operated by USFWSpersonnel. Shell and sand were moved from the staging area to Pelican Island using alarge funnel shaped bucket slung under a Black Hawk helicopter owned and operated byBrainerd Helicopters Inc. of Leesburg, Florida (Figures 4 and 5). Two personnel locatedon the island, directed the shell delivery by instructing the pilot by radio. Materials weredropped by the helicopter into strategically placed piles.

7
Figure 4. Retrieval of materials from staging location.
Figure 5. Release of materials from helicopter bucket.

8
The sand deliveries to the island initiated on January 10, 2006. The bucket which workedwell for the shell drops did not work well for the sand drops. Approximately ½ to ¾ ofthe sand, though relatively dry, stuck to the sides of the bucket preventing release ontothe island. The pilots attempted to release the sand from the buckets by banging thebucket on the ground. Often times the pilots had to repeat this process several times toempty a single bucket. After about 8 hours of this type of delivery, the pilots and theUSFWS staff decided that the process was too slow and posed possible impacts to thehelicopter.
To alleviate the problem, a new style of bucket was constructed consisting of straightsides and a single hinge door. The new bucket was built by the helicopter crew andground support team. The new bucket was able to hold approximately 3 cubic yards ofsand for each delivery. Sand deliveries to the island resumed on January 18, 2006 andcompleted the afternoon of January 21, 2006 without any further complications.
Upon completion of shell and sand delivered to the island, a crew of laborers fromFloraquatics, Inc., contracted by USFWS, was used to place the shell, a small fraction ofwhich was inadvertently scattered, onto the breakwater shell bar. The hand placementinitiated on January 23, 2006 and was directed by the Coastal Resources Group Inc.(CRG) Project Manager. Shell was manipulated into location according to permitdrawings using rakes, shovels, pitchforks, and wheel barrows (Figure 6). Uponcompletion of constructing the shell material, the Floraquatics crew and volunteers usedthe same mechanics to spread the sand out from the piles within each of the threeproposed wetland restoration areas (planting zones) (Figures 7 and 8). Sand dispersal ineach of the three zones was completed January 28, 2006.

9
Figure 6. Permitted restoration plan, July 8, 2004.
In conjunction with sand dispersal, the turbidity curtains from the outer edges of the dropzones were removed by boat and helicopter. The final sections of the curtain wereremoved on February 10 and 11, 2006.

10
Figure 7. Aerial showing location of the three restoration areas (planting areas).
Figure 8. Picture of labor crews moving sand into restoration areas (planting areas).

11
Time Zero Plus Three Months Monitoring –Fill and PlantingAreasMangroves were donated and planted by the Marine Resources Council of BrevardCounty. A total of 78 mangroves including 55 red mangroves (Rhizophora mangle) and23 black mangroves (Avicennia germinanas) were successfully planted within the threefill and planting areas. The red mangroves ranged in size from 3’ to 6’ tall and were carried to the island in pots up to 7 gallons in size. Seventeen of the larger red mangroveshad been cultivated in pots for approximately 12 years. The red mangroves were plantedat the lower edges of the planting zones and black mangroves were planted higher in theintertidal zone, both areas consistent with naturally occurring species dispersal. Severalcrews of volunteers planted approximately 12,000 bare root cordgrass, spaced onapproximately 1 foot centers. The average density of the plants is approximately 4 to 5plants per square meter. The average height of the plants after planting is 43.6 cm. Filland planting areas were completed February 23, 2006.
The island was inspected for the Time Zero Plus Three Month monitoring event on themorning of May 4, 2006 for the purpose of determining the success and mortality ofplanted species within the three fill and planting areas. The inspection was completedboth by ground survey with photography and by boat survey with binoculars. Theinspection was kept brief due to nesting approximately 20 cormorants on the southeastcorner of the island. A portion of the February 2006 fill area (Area 3, Figure 7) was notsurveyed on the ground due to the proximity and likely disturbance of the nesting birds.Although, this area was carefully inspected from both the east and west sides from a boatwith binoculars to determine mortality of either planted cordgrass or planted mangrovesat that location.
Results
ConstructionConstruction of the breakwater was completed January 26, 2006 adhering to all permitrequirements and turbidity monitoring as required by the permit. There were noviolations of the required permit parameters. Construction goals include restoration of0.77 acres of historical wetlands within Pelican Island. Shell material was placed over0.01 acre area adjacent to an existing oyster bar. Approximately 250 cu yards of shellmaterial (fossil shell) were placed on the surface of the existing bar. Additionally,approximately 1,000 cu yards of sand was placed over three areas, some of whichincluded existing land mass planted in 2003, although the cordgrass did not survive dueto elevation and hurricanes, for a total of 0.76 acre on the south side of an existing fossilshell breakwater (Figure 9). The island land mass is expanded from the original 2.34 acrein 1999 to the current land mass of 3.18 acre upon completion of this Phase III (Figure10). Thus the combined 0.01 acre of shell placed outside the existing breakwater and the0.76 acre of sand fill and plantings inside the breakwater met the goal of attempting toexpand the island by an additional 0.77 acres (33,541 square feet) with some overlap withexisting planting areas giving a total expansion of 0.40 acres. (Figure 10)

12
Manatee signs were posted as required in the permit although no manatees were observedduring the project. Law enforcement officials from several USFWS Refuges mannedpatrol boats to keep boaters away from the island during the construction phase. Theirboat, one other refuge boat and a canoe were the only surface vessels allowed into theproject area.
The scattered seagrass patches behind the breakwater were either avoided or protected byturbidity curtains. Tidal flushing to and from the upper mangroves and Spartina patchesabove planting areas 1 and 2 were maintained by the construction of a shallow swale(Figure 11). Tidal flushing behind the breakwater was achieved by the construction of asmall opening in the breakwater (Figure 11).
Figure 9. Location of the final placement of the fill and planting areasand existing cordgrass.

13
Figure10. Fill with no impact to seagrasses, Phase III completed in February 2006.

14
Figure 11. Aerial showing location of shallow swale and small opening in thebreakwater.
Time Zero Plus Three Months Monitoring –Fill and PlantingAreasThe island was inspected on the morning of May 4, 2006. The inspection was kept briefdue to approximately 20 nesting cormorants on the southeast corner of the island nearplanting area 3 (Figure 7). Planting area 3 was not inspected on the ground due to theproximity and likely disturbance of these nesting birds. This area was carefully inspectedfrom both the east and west sides from a boat using binoculars. No significant mortalityof either planted cordgrass or planted mangroves was observed at this location.
Results of the ground inspection and photography of the February 2006 fill and plantingareas indicated a very high survival. Approximately 90% of the planted smooth cordgrasswas alive and growing. The remaining 10% did not survive and all of it was located onthe north side of the created tidal creek. The assumed reason for the lack of survival inthis specific area is that the area was slightly more elevated than the surrounding groundsurface (Figures 12-16).
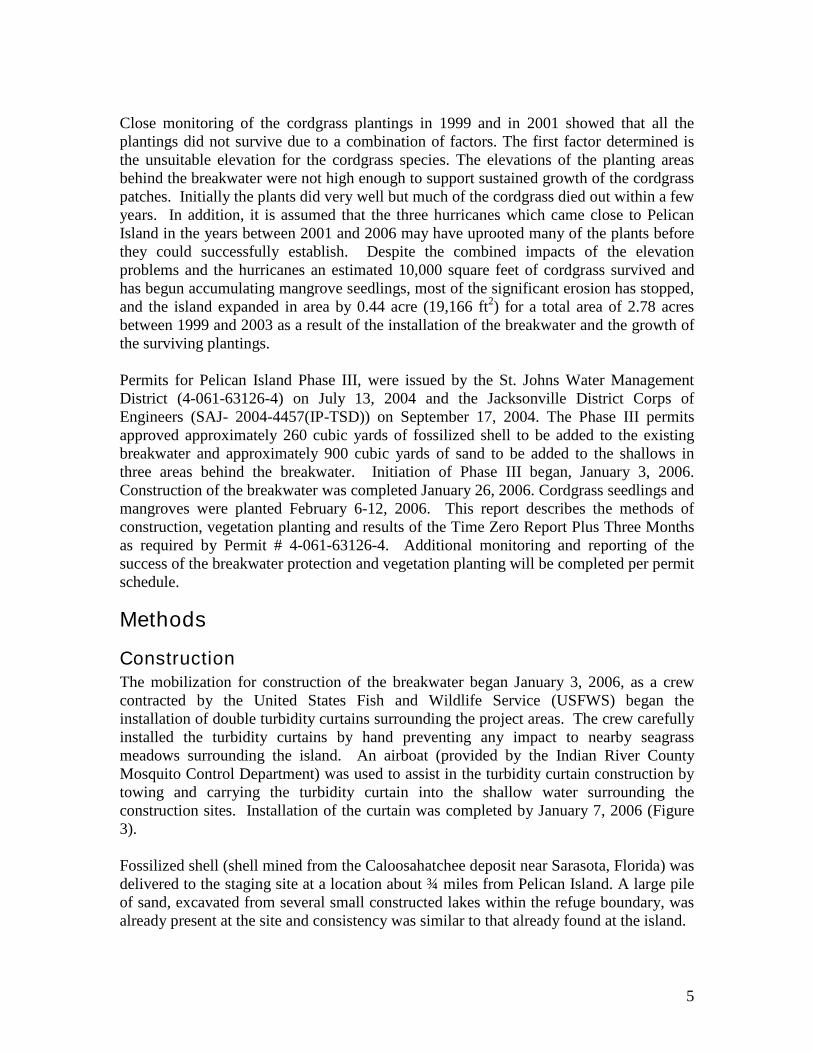
Nearly all of the mangrove plantings are surviving to date (Figures 17 and 18). Only oneof the 17 large planted red mangroves was dead (Figures 16 and 19). All of the smallplanted black mangroves were alive during this monitoring.

15
Figure 12. Cordgrass plantings after construction January 2006.
Figure 13. Cordgrass plantings in same area May 4, 2006.

16
Figure 14. Cordgrass plantings May 4, 2006.
Figure 15. Cordgrass plantings, May 4, 2006

17
Figure 16. Location of dead cordgrass and mangrove May 4, 2006.

18
Figure 17. Volunteer mangroves February 2006.
Figure 18. Surviving planted mangrove and cordgrass May 4, 2006.
19
Figure 19. One dead red mangrove May 4, 2006.
MonitoringAdditional monitoring will occur at Time Zero Plus 6 months (approximately August 1,2006). These monitoring events will be reported, along with the permit required TimeZero Plus 1 year (approximately February 1, 2007) and Time Zero Plus 2 Years(approximately February 1, 2008) monitoring events.
ConclusionsThe project appears to be progressing well. We anticipate that the oyster shell reef willbecome covered with live oysters over the next several years. This will add mass to thereef and lock the fossil shells together. Oyster reefs in the Indian River are typicallycolonized by up to 300 other species of small animals and plants. The cordgrass andmangroves that have been planted are anticipated to spread and thereby providecontinued protection of the shoreline.
Permitting requires an “As-Built” survey to be completed of the final construction. Although the project is ready to be surveyed, there may be a delay in its completion dueto the fact that several species of birds have begun nest site selection on the island. It isimperative that the nesting birds not be disturb them during this process. Surveyors andtheir equipment would disturb the birds, therefore we are delaying the survey untilnesting is complete.
20
Literature Cited
Lewis Environmental Services, Inc. 2000. Installation of a breakwater and Spartinaplanting, the Phase 1 shoreline restoration project, Pelican Island National WildlifeRefuge, Florida. 13 pp. + append.
Parkinson, R. W., and C. Dunlevy. 1999. Shoreline stabilization of Pelican Island.Florida Institute of Technology, Melbourne, FL, and Brevard Community College, PalmBay, Florida. Report submitted to the U. S. Fish and Wildlife Service. 60 pp + appends.