pelican rapids market area profile
TRANSCRIPT

EXTENSION CENTER FOR COMMUNITY VITALITY
Pelican Rapids Market Area Profile
A RETAIL AND SERVICE MARKET ANALYSIS OF THE PELICAN RAPIDS AREA Authored by Ryan Pesch
PROGRAM SPONSORS: CITY OF PELICAN RAPIDS

Pelican Rapids Market Area Profile 2

Pelican Rapids Market Area Profile 1
We would like to give special thanks to all participating businesses and members of the local retail study group for their input and direction given to the project: CJ Holl, Pelican Pete’s Pistachios and city council representative
John Ohman, Flatirons Financial
Don Perrin, Pelican Drug
Scott Richardson, Rapids Brake and Alignment
Don Solga, City Administrator
Pelican Rapids Market Area Profile A RETAIL AND SERVICE MARKET ANALYSIS OF THE PELICAN RAPIDS AREA January 2017 By Ryan Pesch, Extension Educators, Center for Community Vitality
© 2017 Regents of the University of Minnesota. All rights reserved. University of Minnesota Extension is an equal opportunity educator and employer. In accordance with the Americans with Disabilities Act, this material is available in alternative formats upon request. Direct requests to 612-625-8233.
Printed on recycled and recyclable paper with at least 10 percent postconsumer waste material.

Pelican Rapids Market Area Profile 2
Table of Contents INTRODUCTION AND TRADE AREA 3 RECOMMENDATIONS 4 RETAIL OVERVIEW 5 TRADE AREA GAP ANALYSIS 7 SEASONAL RESIDENT SPENDING ESTIMATES 7 MARKET PROFILE DEMOGRAPHICS 7 Age 8 Race 8 Household Composition 9 Education 10 Household Income 10 Household Net Worth 11 COMMUTING PATTERNS 12 TAPESTRY SEGMENTATION AREA PROFILE 13 APPENDICES 16 A: ESRI Methodology and full ESRI reports 16 B: Full LifeStyle Profiles xx C: Pelican Trade Area Business List 21

Pelican Rapids Market Area Profile 3
INTRODUCTION
University of Minnesota Extension created the Market Area Profile (MAP) program to assist
Minnesota communities in developing their retail and service sectors. The authors’ aim is to
provide existing businesses, potential businesses, and economic development organizations
information that will better serve their individual market and business strategies.
University of Minnesota Extension staff created this report through secondary data and analysis
compiled chiefly through Business Analyst, a GIS software program from Esri (www.Esri.com),
along with the U.S. Census. ESRI synthesizes market research data collected nationally every
year from almost 26,000 adult consumers through in-home, face-to-face interviews about their
media choices, demographics, lifestyles and attitudes, and usage of almost 6,000 products in
550 categories. Since the major customer for these data are national brands, information is not
collected for independent business categories like antique stores, attorneys, dental offices, etc.
For more information about Esri and the survey data, see appendix A.
GEOGRAPHIC AREA FOR ANALYSIS
Extension generated all reports and analysis for this report based on trade area similar to the
Pelican Rapids school district boundaries, including the trade area gap analysis, business mix
analysis, market profile demographics, commuting patterns, and tapestry segmentation (Figure
1). This area was selected as the primary convenience shopping area for residents in the
immediate vicinity, that is, an area from which the community derives a majority of resident
shoppers.
Figure 1: Pelican Rapids Trade Area

Pelican Rapids Market Area Profile 4
RECOMMENDATIONS
After reviewing the trade area gap analysis of Pelican Rapids, the study group added their
own knowledge of the community to identify the following perceived retail opportunities:
full-service restaurant or taproom, small engine repair, computer/cell phone/office supply
shop, appliance repair, photographic services, combined clothing/jewelry/shoe store
Using extensive databases, Esri measures the relative likelihood of adults in a specified trade
area to purchase various products and services based on the local demographic composition.
The authors added data from Esri, where available, to information provided by the study group.
Full-service Restaurant or Taproom The trade area gap analysis shows that the Pelican Rapids area has the potential to support 5.8
full-service restaurants and 5 currently are operating in the trade area. Considering that some
of these establishments are season (E.G., the Galaxy) and the demand does not take into
consideration seasonal resident or tourist spending on dining, another full-service restaurant
seemed an opportunity (see Appendix C for a listing of businesses by type). When considering
types of restaurants, the retail committee considered a taproom a distinct opportunity which
would complement other types of dining and be a draw for visitors in the region.
Based on the lifestyle segments calculated by ESRI, nearly a third (28%) of Pelican Rapids area
residents frequent a family restaurant at least weekly; the remainder do so monthly. Of the
family restaurant meals, 12% are for breakfast, 22% for lunch and 44% for dinner (Figure 2).
Figure 2: Dining frequency in the past six months (Source: ESRI)
Recruiting a family restaurant is a common desire of city residents and it was also identified as
a need through the 2016 Business Retention and Expansion (BR&E) visitations with business
owners. According to ESRI’s analysis of Pelican Rapids lifestyles, dining would be heavier on
weekends than weekdays (See Appendix A).
Clothing/Jewelry/Shoe Store At this time there is no clothing or clothing accessory shop in Pelican Rapids. Although a clothing
store may not be viable on its own with close competition from clothing store in nearby regional
centers like Detroit Lakes and Fergus Falls, a combination of goods together may provide enough
traffic to make the business go. Based on the average national spending per the Economic Census,
12%
22.2%
44.1%
0
10
20
30
40
50
Breakfast Lunch Dinner

Pelican Rapids Market Area Profile 5
residents of the trade area spend nearly $5 million at clothing and accessory establishment,
including jewelry. At this time all these sales leave the trade area.
Small Engine and Appliance Repair
Based on the the trade area gap analysis, local residents spend approximately $93,000 annually on
lawn/garden and appliance repair. At this time, although some establishments such as Lakeland
True Value provide small engine repair, no business is dedicated to small engines exclusively and no
one in the region provide appliance repair. The retail study committee thought that small engine
repair is not only an opportunity since, although some provide this service, the demand is probably
still high due to the many second homes and visitors recreating in the area.
Photographic Services After losing a long-time photographer some years ago and a younger photographer in 2016, the
retail committee identified this professional as a need for the community. According to the trade
area gap analysis, residents are spending over $200,000 on photographic services.
Computer/Cell Phone/Office Supply Not unlike the opportunity for a combined clothing and accessory operation, the combination off
these complementary goods could prove enough business to meet the convenience needs of
residents in these categories. The community has in the past supported both a cell phone franchise
and a computer repair shop.
RETAIL OVERVIEW
Table 1 below presents taxable retail and services sales for the City of Pelican Rapids for 2010 and
2014 (not data for the whole study area since only city data is available). Without inflation
adjustments, taxable sales in Pelican Rapids increased 16 percent from 2010 to 2014, while the
number of firms grew by two for a five percent increase (Table 1). Statewide, taxable sales increased
18 percent over the same time period and the number of retail and service establishments decreased
by four percent.
Table 1: Sales tax statistics for retail and service businesses in City of Pelican Rapids (Source: MN Dept. of Revenue)
2010 2014
Taxable Sales 10,567,104 12,287,445
Sales tax collected 752,892 880,879
Number of Businesses 39 41
There are several ways to measure performance other than dollars of sales. Economists expect cities
of larger populations to have more sales since their potential customer base is larger. A way to
compensate for that in a retail trade analysis is to measure the pull factor, which compares the local
taxable sales per capita to that of the state. A pull factor index higher than 1.0 usually indicates that
businesses are “pulling” customers from outside their community. According to this measure,
Pelican Rapids is retaining a majority of the sales one would expect with an overall retail pull factor
of 0.62. Per capita taxable sales in 2014 were estimated to be $4,919 locally and $7,893 for
Minnesota.

Pelican Rapids Market Area Profile 6
Table 2: Per capita taxable sales and pull factors (Source: Extension Calculations based on Sales Tax Statistics)
MN Sales per Capita (retail and service)
Pelican Sales per Capita (retail and service) Pull Factor
2010
$6,870 $4,289 0.62
2014 $7,893 $4,919 0.62

Pelican Rapids Market Area Profile 7
With few exceptions, businesses are listed in only one category for the Trade Area Gap
Analysis. As a result, local knowledge is needed to compare the gap analysis to the mix of
goods and services of existing businesses.
How businesses can use this information:
In categories where a retail gap exists, are there opportunities to expand your store
merchandise to offer these goods and services?
Categories with a surplus of stores may indicate Pelican Rapids is a destination for
shopping in those retail categories. Between all the stores in these categories, are you
providing a range of goods that will continue to draw customers to Pelican Rapids?
SEASONAL RESIDENT SPENDING ESTIMATES
The Pelican Rapids trade area includes 2,431 seasonal households which spend an estimated $13
million in retail and service spending near where their second home resides. Pelican Rapids
certainly does not capture all this spending by second homeowners in its trade area. According to
pull factors, Pelican Rapids does not capture the full spending of its local residents (see Retail
Overview” section). Based on past Extension research, seasonal residents in the region stay an
average of 93 days a year where their second home resides.
Figure 3: Spending estimates of seasonal residents (Source: Pesch, University of MN Extension)
Category Average Monthly Spending
(based on 2013 research)
Pelican Estimates
Grocery/liquor $120 $3,500,640
Dining/bars $74 $2,158,728
Gas/auto Service $74 $2,158,728
Pharmacy $11 $320,892
Home maintenance $95 $2,771,340
Entertainment/recreation $75 $2,187,900
Total retail $449 $13,098,228
Construction/remodeling $1,066 $31,097,352
Total retail and constuction $57,293,808
MARKET PROFILE DEMOGRAPHICS
Predicting consumer spending starts with knowing the area’s population. Knowing the
demographics of the market area provides retailers an indication of types of goods and services
households will purchase, as well as likely price points.
Figure 4: Age cohorts, Pelican Rapids trade area and Minnesota (source: ESRI)

Pelican Rapids Market Area Profile 8
Pelican Rapids has more middle-aged adults (ages 55-64 and 65-74 year) and less younger
adults than the Minnesota average (Figure 4). The resulting Pelican Rapids median age of 49.1 is
slightly older than the state median age of 38.2.
Figure 5: 2016 Non-white ethnicities by percent of population, Pelican Rapids trade area and Minnesota (source: ESRI)
The Pelican Rapids area population is 86.8% white alone with just the remaining 13.2% in other
race categories (Figure 5). Those of Hispanic ethnicity are counted as white by Census bureau
statistics.
0.0
2.0
4.0
6.0
8.0
10.0
12.0
14.0
16.0
18.0
20.0
0-4 5-9 10-14 15-24 25-34 35-44 45-54 55-64 65-74 75-84 85+
Perc
en
t
Pelican MN
0 2 4 6 8 10 12 14
Black
American Indian
Asian
Pacific Islander
Other Race
Two + Races
Hispanic
Percent
MN Pelican

Pelican Rapids Market Area Profile 9
Figure 6: 2010 Household composition for Pelican Rapids trade area and Minnesota (source: ESRI)
Pelican Rapids’ households are primarily husband-wife or husband-wife-children (Figure 6).
Figure 7: Types of housing in Pelican Rapids trade area (source: ESRI)
The Pelican Rapids trade area has more owner-occupied housing units than the state average
and significantly more vacant housing (Figure 7). The high percentage of vacant housing—
nearly 50% of all housing units—relates to many seasonal homes in the area, which the Census
Bureau classifies as vacant since it is not a primary residence (see Seasonal Resident Spending
Estimates section for details on economic impacts).
0 5 10 15 20 25 30 35 40 45
One person Households
Husband - Wife (Alone)
Husband - Wife - Children
Male Householder & Children
Male Householder & Other Family
Female Householder & Children
Female Householder & Other Family
Non-family Households
Percent
MN Pelican
0 10 20 30 40 50 60 70
Vacant
Renter
Owner Occupied
Percent
MN Pelican

Pelican Rapids Market Area Profile 10
Figure 8: Education levels of adults 25+ in trade area (source: ESRI)
Education levels of Pelican Rapids adults lag the state averages in bachelors and graduate
degrees, but outperform the state on associate degrees. Less than one third of Pelican Rapids’
adults are either high school graduates or have earned their GED (28%). Nearly a forth (23%)
have some college, with just over a fourth (27%) holding either an Associate’s Degree or a
bachelor’s degree. Eight percent have a graduate or professional degree (Figure 8).
Figure 9: Household income by category for Pelican Rapids trade area and Minnesota (source: ESRI)
0 5 10 15 20 25 30
< 9th grade
Some High School
High School Graduate
GED
Some College (no degree)
Associate Degree
Bachelor's Degree
Graduate / Professional Degree
MN Pelican
0 5 10 15 20 25
<$15
$15 - $24
$25 - $34
$35 - $49
$50 - $74
$75 - $99
$100 - $149
$150 - $199
$200+
Percent
In T
hou
san
ds
MN Pelican

Pelican Rapids Market Area Profile 11
Pelican Rapids’ median household income is less than the state averages, but the profile of
household income by category does not differ significantly (Figure 9). Minnesota has a larger
proportion of households earning over $100,000 annually and Pelican has a larger proportion
of households earning less than $75,000 annually. The difference of
these proportions is within single percentages in each category.
Median household income in Pelican Rapids in 2016 is $52,125
compared to the state median at $61,657.
These demographic data suggest Pelican Rapids potentially has a
higher rate of poverty than the state average, depending on the size of
the households. The federal government defines 100% poverty level in 2015 for all states
except Alaska and Hawaii as follows: (Source: Federal Register, 2015, January 22)
Figure 10: Net worth of households in Pelican Rapids trade area and MN by category (source: ESRI)
In contrast, Pelican Rapids’ median household net worth is $158,809 compared to the state
median of $151,171. Detailed percentages of households by net worth are in Figure xx which
shows a greater proportion of Pelican Rapids residents in the net worth categories from $100 -
$500,000 categories than the state average.
How businesses can use demographic information:
Age is an important factor to consider because personal expenditures change as individuals grow
older. A category that’s growing as baby boomers age is the 65 and older group. Catering to the
needs of an aging population can be beneficial to any retailer. Consumer spending on drug stores
and assisted care services flourish in areas with a large elderly population. In general, though, older
populations tend to spend less on the majority of goods and services. Studies indicate that nightlife
and entertainment spending (restaurants, bars, and theaters) by people over 65 is roughly half that
0 5 10 15 20 25
<$15
$15 - $34
$35 - $49
$50 - $74
$75 - $99
$100 - $149
$150 - $249
$250 - $500
$500+
Percent
In T
hou
san
ds o
f D
ollla
rs
MN Pelican
Household Size
Poverty Level
1 $11,770
2 $15,930
3 $20,090
4 $24,250
5 $28,410
6 $32,570
7 $36,730

Pelican Rapids Market Area Profile 12
spent by those under 65. Older adults also spend considerably less on apparel than other age
groups. On the other end of the spectrum, toy stores, day care centers, and stores with baby care
items do well in areas with many children and infants. Clothing stores and fast food establishments
also thrive in areas with a high adolescent population. Some entertainment and recreational venues,
such as movie theatres and golf courses, serve a broad section of the population. Others, such as
water parks or arcades, target certain age groups.
Ethnicity: Data show that ethnicity affects spending habits as much as other demographic
characteristics, such as income and age. Retailers that use segmentation based on race and ethnic
groups must make sure their efforts effectively measure the true preferences and behaviors of the
community.
Housing: Home ownership directly correlates with expenditures for home furnishings and home
equipment. Furniture, appliances, hardware, paint/wallpaper, floor covering, garden centers and
other home improvement products all prosper in active housing markets.
Education levels: Because income increases with advancing educational attainment, many retailers
focus on income level rather than education. In general, areas with high levels of educational
attainment tend to prefer shopping at smaller, non-chain specialty retail stores located in their
downtowns. They also tend to visit cultural establishments like museums and theaters at a
frequency over three times greater than those without a college degree. On the other hand, less-
educated populations generally have lower incomes and thus tend to prefer shopping at discount
retail outlets and chain stores. This group also spends more money on car maintenance and tobacco
products than those with a college degree.
Household income data is a good indicator of residents’ spending power. Household income
positively correlates with retail expenditures in many product categories. When evaluating a market,
retailers look at the median or average household income in a trade area and will seek a minimum
number of households within a certain income range before establishing a business or setting prices.
Another common practice is to analyze the distribution of household incomes….A few store
categories, such as auto parts, are more commonly found in areas with lower household incomes.
Highly affluent households with annual incomes above $100,000 … are strong consumers, as well
as physically active and civic-minded. Gearing a retail mix toward this segment may require a focus
in luxury goods and services…Middle-income households with annual incomes between $20,000
and $50,000, are much more mindful of their expenses than highly affluent families. These
households tend to be more frugal and selective in their buying behavior, shopping at discount
outlets for groceries and other goods rather than high-end stores. Big box stores are particularly
popular for middle and low-income households. Low-income households with annual incomes
below $20,000 are … living in poverty and thus spend very little on goods and services across the
board.
http://fyi.uwex.edu/downtown-market-analysis/understanding-the-market/demographics-and-
lifestyle-analysis/
COMMUTING PATTERNS
People tend to buy goods and services near where they live or work. Therefore, it is important
to know commuting patterns to identify retail competition.
Pelican Rapids Market Area Profile 13
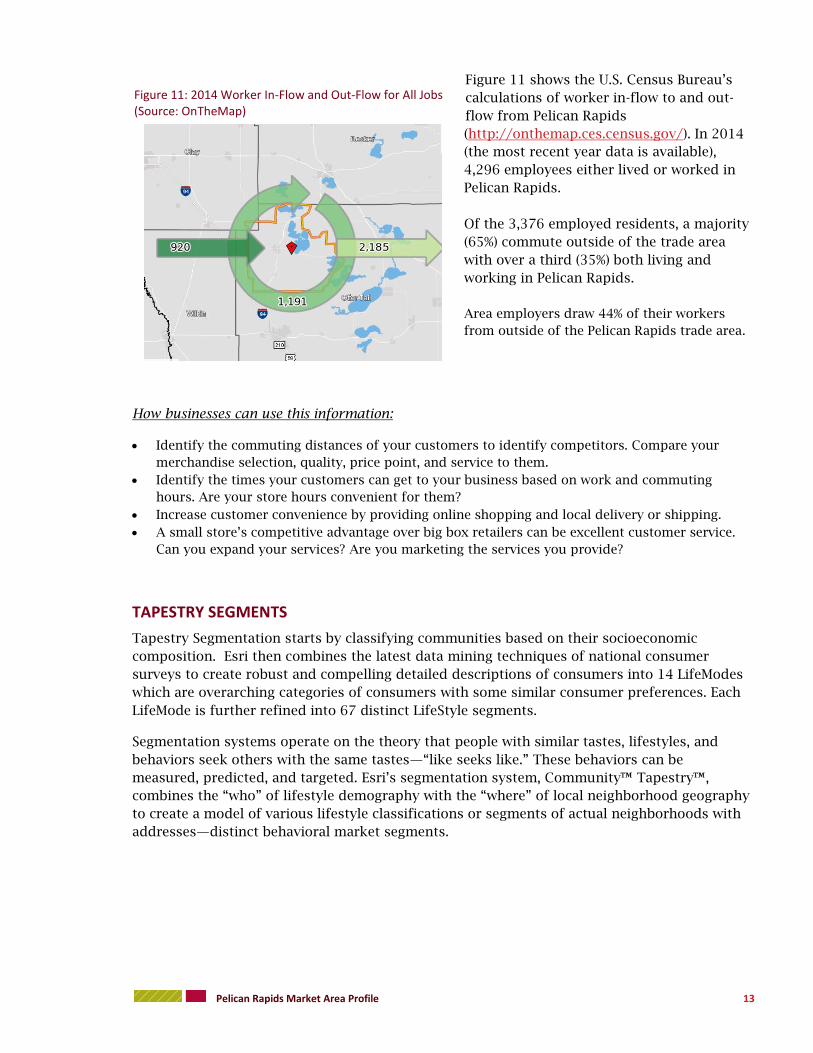
Figure 11 shows the U.S. Census Bureau’s
calculations of worker in-flow to and out-
flow from Pelican Rapids
(http://onthemap.ces.census.gov/). In 2014
(the most recent year data is available),
4,296 employees either lived or worked in
Pelican Rapids.
Of the 3,376 employed residents, a majority
(65%) commute outside of the trade area
with over a third (35%) both living and
working in Pelican Rapids.
Area employers draw 44% of their workers
from outside of the Pelican Rapids trade area.
How businesses can use this information:
Identify the commuting distances of your customers to identify competitors. Compare your
merchandise selection, quality, price point, and service to them.
Identify the times your customers can get to your business based on work and commuting
hours. Are your store hours convenient for them?
Increase customer convenience by providing online shopping and local delivery or shipping.
A small store’s competitive advantage over big box retailers can be excellent customer service.
Can you expand your services? Are you marketing the services you provide?
TAPESTRY SEGMENTS
Tapestry Segmentation starts by classifying communities based on their socioeconomic
composition. Esri then combines the latest data mining techniques of national consumer
surveys to create robust and compelling detailed descriptions of consumers into 14 LifeModes
which are overarching categories of consumers with some similar consumer preferences. Each
LifeMode is further refined into 67 distinct LifeStyle segments.
Segmentation systems operate on the theory that people with similar tastes, lifestyles, and
behaviors seek others with the same tastes—“like seeks like.” These behaviors can be
measured, predicted, and targeted. Esri’s segmentation system, Community™ Tapestry™,
combines the “who” of lifestyle demography with the “where” of local neighborhood geography
to create a model of various lifestyle classifications or segments of actual neighborhoods with
addresses—distinct behavioral market segments.
Figure 11: 2014 Worker In-Flow and Out-Flow for All Jobs (Source: OnTheMap)

Pelican Rapids Market Area Profile 14
The four lifestyle segments of the Pelican Rapids are nearly all focused in one LifeMode (Cozy
Country Living), reinforcing the large overlap among many households (see Appendix xx for a
full report). Lifestyle segments, including ESRI Community Tapestry, however, generalize a
geographic area and miss the particular demographic profile of communities. For example,
although non-whites make up a sizeable portion of the City of Pelican Rapids, all the lifestyle
segments from ESRI for the trade area describe rural whites. .
Small Town Simplicity (18% of Households)
Includes young families and senior householders that are bound by community ties. The lifestyle is
down-to-earth and semirural, with television for entertainment and news, and emphasis on
convenience for both young parents and senior citizens. Residents embark on pursuits including
online computer games, scrapbooking, and rural activities like hunting and fishing. Since almost 1
in 4 households is below poverty level, residents also keep their finances simple – paying bills in
person and avoiding debt.
Rural Resort Dwellers (40% of Housholds)
Although the Great Recession forced many owners of second homes to sell, Rural Resort Dwellers
residents remain an active market, just a bit smaller. These communities are centered in resort
areas, many in the Midwest, where the change in seasons supports a variety of outdoor activities.
Retirement looms for many of these blue collar, older householders, but workers are postponing
retirement or returning to work to maintain their current lifestyles. Workers are traveling further to
maintain employment. They are passionate about their hobbies, like freshwater fishing and hunting,
but otherwise have very simple tastes.
Prairie Living (29% of Households)
Figure 12: Pelican psychographics by percent of adults (Source: ESRI’s Tapestry Segments)
8.2
8.4
10.3
11.1
17.1
19.2
27.2
35.5
52.7
Usually pay more for environ safe product
Usually value green products over convenience
Usually buy items on credit rather than wait
Am interested in how to help the environment
Usually buy based on quality - not price
Usually use coupons for brands I buy often
Price is usually more important than brand name
Likely to buy a brand that supports a charity
Buying American is important to me

Pelican Rapids Market Area Profile 15
Prairie Living is Tapestry Segmentation’s most rural market, comprising about 1 percent of
households, located mainly in the Midwest, with a predominance of self-employed farmers. These
agricultural communities are not diverse, dominated by married-couple families that own single-
family dwellings and many vehicles. Median household income is similar to the US, and labor force
participation is slightly higher. Faith is important to this hardworking market. When they find time
to relax, they favor outdoor activities.
Heartland Communities (13% of Households)
Well settled and close-knit, Heartland Communities are semirural and semiretired. These older
householders are primarily homeowners, and many have paid off their mortgages. Their children
have moved away, but they have no plans to leave their homes. Their hearts are with the country;
they embrace the slower pace of life here but actively participate in outdoor activities and
community events. Traditional and patriotic, these residents support their local businesses, always
buy American, and favor domestic driving vacations over foreign plane trips.
Pelican Rapids Market Area Profile 16
APPENDIX A: ESRI METHODOLOGY AND REPORTS
The following information, from Esri, describes their data collection processes:
“These data are based upon national propensities to use various products and services,
applied to local demographic composition. Usage data were collected by GfK MRI in a
nationally representative survey of U.S. households. Esri forecasts for 2015 and 2020.
The Survey provides a detailed view of the 226 million adult consumers in the U.S. –
their media choices, demographics, lifestyles and attitudes, and usage of almost 6,000
products in 550 categories. Data are collected in person, with in-home, face-to-face
interviews. At each stage of the data collection process - from recruiting respondents
and interviewing them, to working with them to understand and complete a
comprehensive product and lifestyle questionnaire - GfK MRI relies on direct personal
interaction. Every year GfK MRI interviews almost 26,000 adult consumers in the 48
contiguous states for the Survey of the American Consumer™. Data collection for
the Survey is a two-stage process, and in each stage the personal approach advances the
reliability of the data.
During the initial in-home interview, GfK MRI interviewers observe and verify household and respondent characteristics and collect a wide range of demographic and media usage data. The interviewer also solicits cooperation for participation in the second, self-administered phase of the data collection process. The interviewer explains how to fill out the questionnaire booklet and arranges for its return to GfK MRI, often by personally picking it up the completed booklet. This level of attention makes it highly likely that participants will complete the questionnaire, further enhancing the reliability of Survey data.
For more detailed information about the data collection, see:
http://www.gfkmri.com/Products/TheSurveyoftheAmericanConsumer.aspx
Here is the link to the personal interview questions:
http://www.gfkmri.com/PDF/GfKMRI_Wave65PersonalInterview.pdf
Here is the link to the survey:
http://www.gfkmri.com/PDF/GfKMRI_Wave65ProductBooklet.pdf

Market ProfilePelican_MAP Prepared by EsriArea: 314.41 square miles
Population Summary 2000 Total Population 7,6172010 Total Population 7,5122016 Total Population 7,559
2016 Group Quarters 672021 Total Population 7,616
2016-2021 Annual Rate 0.15%2016 Total Daytime Population 6,208
Workers 2,536Residents 3,672
Household Summary2000 Households 2,979
2000 Average Household Size 2.522010 Households 3,118
2010 Average Household Size 2.392016 Households 3,149
2016 Average Household Size 2.382021 Households 3,181
2021 Average Household Size 2.372016-2021 Annual Rate 0.20%
2010 Families 2,1792010 Average Family Size 2.85
2016 Families 2,1872016 Average Family Size 2.84
2021 Families 2,2022021 Average Family Size 2.832016-2021 Annual Rate 0.14%
Housing Unit Summary2000 Housing Units 5,983
Owner Occupied Housing Units 41.5%Renter Occupied Housing Units 8.3%Vacant Housing Units 50.2%
2010 Housing Units 5,929Owner Occupied Housing Units 43.8%Renter Occupied Housing Units 8.8%Vacant Housing Units 47.4%
2016 Housing Units 6,040Owner Occupied Housing Units 43.0%Renter Occupied Housing Units 9.1%Vacant Housing Units 47.9%
2021 Housing Units 6,136Owner Occupied Housing Units 42.8%Renter Occupied Housing Units 9.0%Vacant Housing Units 48.2%
Median Household Income2016 $52,1252021 $56,758
Median Home Value2016 $190,8652021 $232,564
Per Capita Income2016 $27,2542021 $30,116
Median Age2010 47.02016 49.12021 50.6
Data Note: Household population includes persons not residing in group quarters. Average Household Size is the household population divided by total households. Persons in families include the householder and persons related to the householder by birth, marriage, or adoption. Per Capita Income represents the income received by all persons aged 15 years and over divided by the total population.Source: U.S. Census Bureau, Census 2010 Summary File 1. Esri forecasts for 2016 and 2021 Esri converted Census 2000 data into 2010 geography.
February 01, 2017
©2016 Esri Page 1 of 7

Market ProfilePelican_MAP Prepared by EsriArea: 314.41 square miles
2016 Households by IncomeHousehold Income Base 3,149
<$15,000 12.7%$15,000 - $24,999 10.7%$25,000 - $34,999 9.4%$35,000 - $49,999 14.2%$50,000 - $74,999 22.1%$75,000 - $99,999 13.6%$100,000 - $149,999 11.5%$150,000 - $199,999 3.3%$200,000+ 2.4%
Average Household Income $65,9322021 Households by Income
Household Income Base 3,181<$15,000 13.0%$15,000 - $24,999 10.1%$25,000 - $34,999 11.3%$35,000 - $49,999 8.2%$50,000 - $74,999 20.9%$75,000 - $99,999 15.4%$100,000 - $149,999 14.1%$150,000 - $199,999 4.4%$200,000+ 2.8%
Average Household Income $72,7182016 Owner Occupied Housing Units by Value
Total 2,597<$50,000 11.7%$50,000 - $99,999 15.0%$100,000 - $149,999 15.1%$150,000 - $199,999 10.0%$200,000 - $249,999 9.2%$250,000 - $299,999 8.2%$300,000 - $399,999 14.3%$400,000 - $499,999 8.2%$500,000 - $749,999 5.5%$750,000 - $999,999 2.2%$1,000,000 + 0.7%
Average Home Value $242,3142021 Owner Occupied Housing Units by Value
Total 2,628<$50,000 8.6%$50,000 - $99,999 11.2%$100,000 - $149,999 11.5%$150,000 - $199,999 10.9%$200,000 - $249,999 11.9%$250,000 - $299,999 11.4%$300,000 - $399,999 16.7%$400,000 - $499,999 9.0%$500,000 - $749,999 5.2%$750,000 - $999,999 2.9%$1,000,000 + 0.7%
Average Home Value $267,349
Data Note: Income represents the preceding year, expressed in current dollars. Household income includes wage and salary earnings, interest dividends, net rents, pensions, SSI and welfare payments, child support, and alimony. Source: U.S. Census Bureau, Census 2010 Summary File 1. Esri forecasts for 2016 and 2021 Esri converted Census 2000 data into 2010 geography.
February 01, 2017
©2016 Esri Page 2 of 7
Market ProfilePelican_MAP Prepared by EsriArea: 314.41 square miles
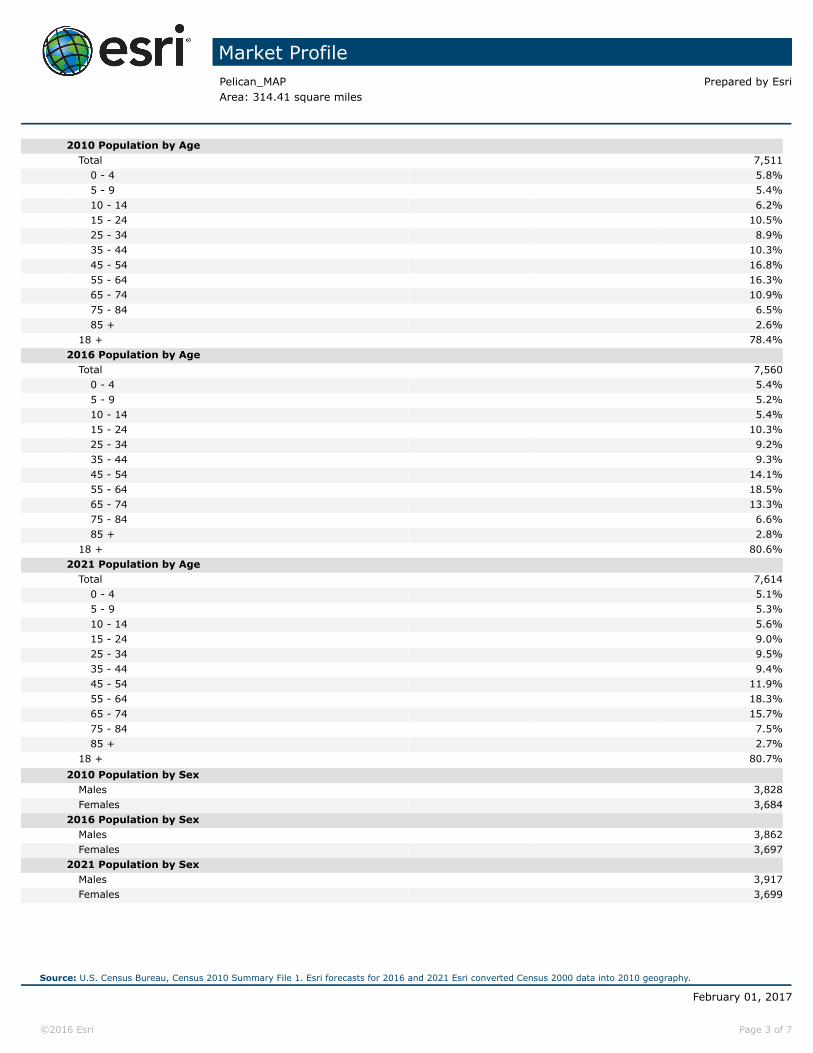
2010 Population by AgeTotal 7,511
0 - 4 5.8%5 - 9 5.4%10 - 14 6.2%15 - 24 10.5%25 - 34 8.9%35 - 44 10.3%45 - 54 16.8%55 - 64 16.3%65 - 74 10.9%75 - 84 6.5%85 + 2.6%
18 + 78.4%2016 Population by Age
Total 7,5600 - 4 5.4%5 - 9 5.2%10 - 14 5.4%15 - 24 10.3%25 - 34 9.2%35 - 44 9.3%45 - 54 14.1%55 - 64 18.5%65 - 74 13.3%75 - 84 6.6%85 + 2.8%
18 + 80.6%2021 Population by Age
Total 7,6140 - 4 5.1%5 - 9 5.3%10 - 14 5.6%15 - 24 9.0%25 - 34 9.5%35 - 44 9.4%45 - 54 11.9%55 - 64 18.3%65 - 74 15.7%75 - 84 7.5%85 + 2.7%
18 + 80.7%2010 Population by Sex
Males 3,828Females 3,684
2016 Population by SexMales 3,862Females 3,697
2021 Population by SexMales 3,917Females 3,699
Source: U.S. Census Bureau, Census 2010 Summary File 1. Esri forecasts for 2016 and 2021 Esri converted Census 2000 data into 2010 geography.
February 01, 2017
©2016 Esri Page 3 of 7
Market ProfilePelican_MAP Prepared by EsriArea: 314.41 square miles
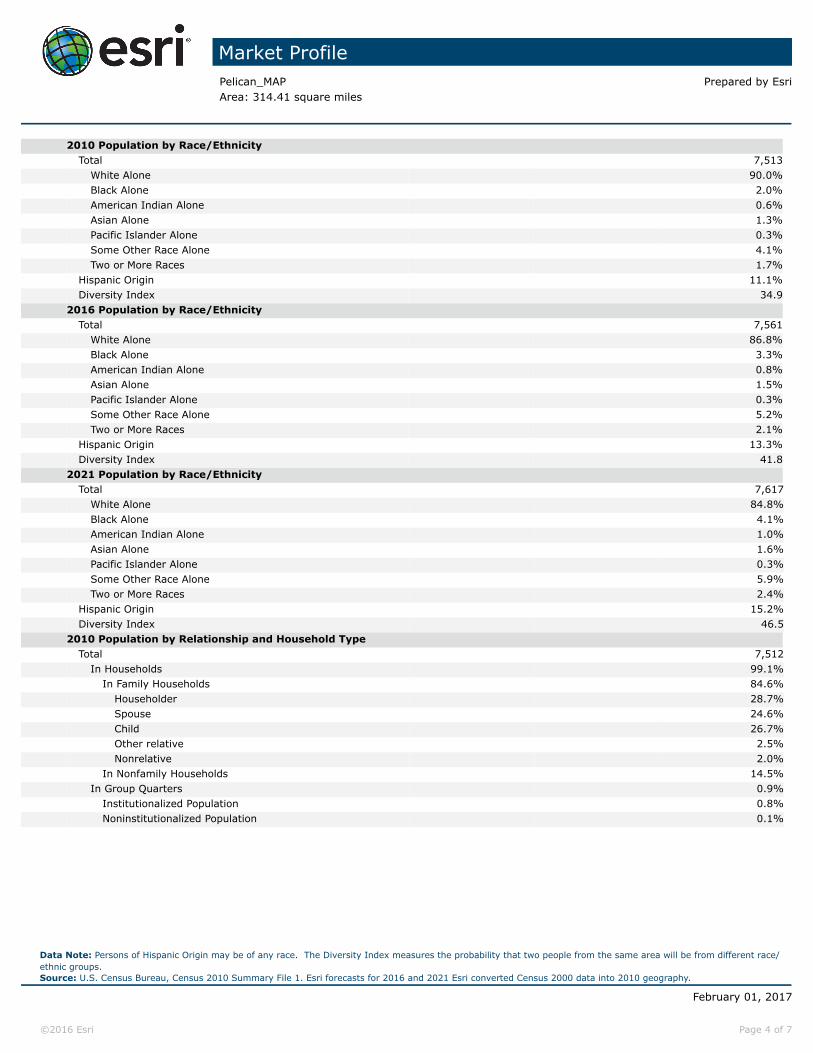
2010 Population by Race/EthnicityTotal 7,513
White Alone 90.0%Black Alone 2.0%American Indian Alone 0.6%Asian Alone 1.3%Pacific Islander Alone 0.3%Some Other Race Alone 4.1%Two or More Races 1.7%
Hispanic Origin 11.1%Diversity Index 34.9
2016 Population by Race/EthnicityTotal 7,561
White Alone 86.8%Black Alone 3.3%American Indian Alone 0.8%Asian Alone 1.5%Pacific Islander Alone 0.3%Some Other Race Alone 5.2%Two or More Races 2.1%
Hispanic Origin 13.3%Diversity Index 41.8
2021 Population by Race/EthnicityTotal 7,617
White Alone 84.8%Black Alone 4.1%American Indian Alone 1.0%Asian Alone 1.6%Pacific Islander Alone 0.3%Some Other Race Alone 5.9%Two or More Races 2.4%
Hispanic Origin 15.2%Diversity Index 46.5
2010 Population by Relationship and Household TypeTotal 7,512
In Households 99.1%In Family Households 84.6%
Householder 28.7%Spouse 24.6%Child 26.7%Other relative 2.5%Nonrelative 2.0%
In Nonfamily Households 14.5%In Group Quarters 0.9%
Institutionalized Population 0.8%Noninstitutionalized Population 0.1%
Data Note: Persons of Hispanic Origin may be of any race. The Diversity Index measures the probability that two people from the same area will be from different race/ethnic groups.Source: U.S. Census Bureau, Census 2010 Summary File 1. Esri forecasts for 2016 and 2021 Esri converted Census 2000 data into 2010 geography.
February 01, 2017
©2016 Esri Page 4 of 7

Market ProfilePelican_MAP Prepared by EsriArea: 314.41 square miles
2016 Population 25+ by Educational AttainmentTotal 5,574
Less than 9th Grade 7.1%9th - 12th Grade, No Diploma 5.8%High School Graduate 25.0%GED/Alternative Credential 3.4%Some College, No Degree 23.3%Associate Degree 11.3%Bachelor's Degree 16.3%Graduate/Professional Degree 7.8%
2016 Population 15+ by Marital StatusTotal 6,349
Never Married 18.6%Married 65.3%Widowed 6.8%Divorced 9.3%
2016 Civilian Population 16+ in Labor Force Civilian Employed 98.3% Civilian Unemployed 1.7%2016 Employed Population 16+ by IndustryTotal 3,941 Agriculture/Mining 5.0% Construction 9.3% Manufacturing 17.3% Wholesale Trade 3.0% Retail Trade 10.8% Transportation/Utilities 6.9% Information 1.6% Finance/Insurance/Real Estate 4.7% Services 37.8% Public Administration 3.6%2016 Employed Population 16+ by OccupationTotal 3,942 White Collar 51.4% Management/Business/Financial 13.4% Professional 16.8% Sales 9.5% Administrative Support 11.6% Services 13.9% Blue Collar 34.7% Farming/Forestry/Fishing 1.8% Construction/Extraction 8.6% Installation/Maintenance/Repair 4.3% Production 12.4% Transportation/Material Moving 7.5%2010 Population By Urban/ Rural Status
Total Population 7,512Population Inside Urbanized Area 0.0%Population Inside Urbanized Cluster 0.0%Rural Population 100.0%
Source: U.S. Census Bureau, Census 2010 Summary File 1. Esri forecasts for 2016 and 2021 Esri converted Census 2000 data into 2010 geography.
February 01, 2017
©2016 Esri Page 5 of 7
Market ProfilePelican_MAP Prepared by EsriArea: 314.41 square miles
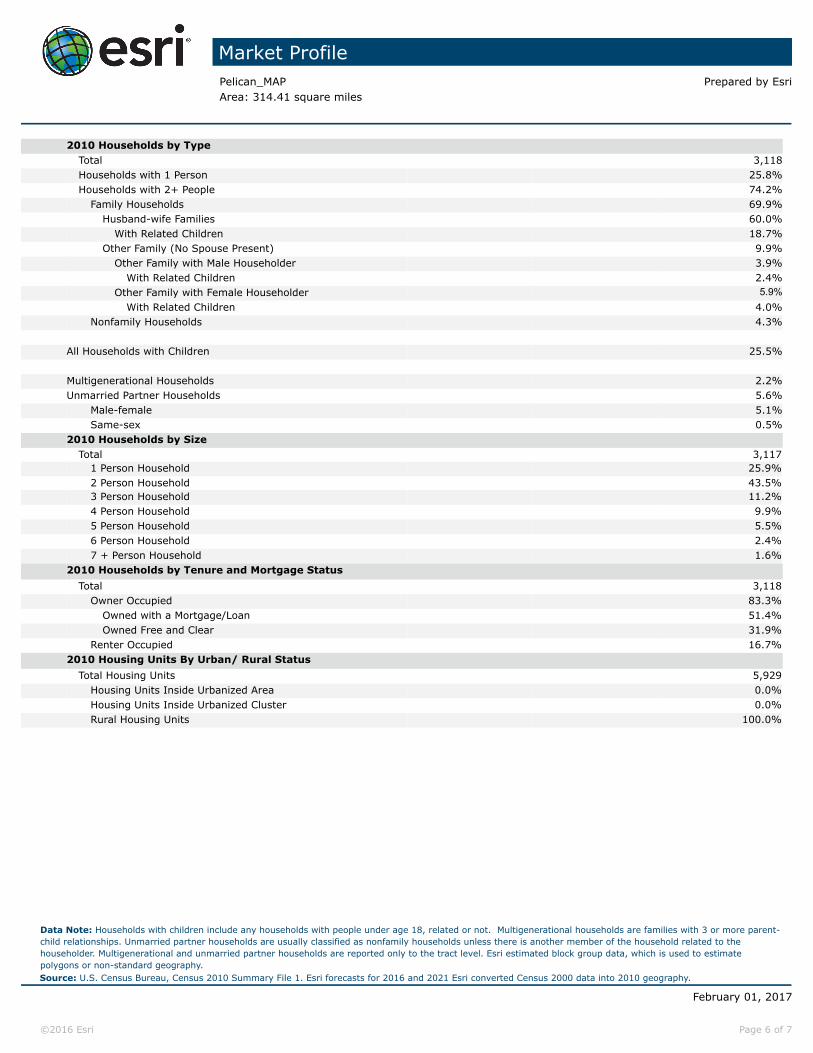
2010 Households by TypeTotal 3,118Households with 1 Person 25.8%Households with 2+ People 74.2%
Family Households 69.9%Husband-wife Families 60.0%
With Related Children 18.7%Other Family (No Spouse Present) 9.9%
Other Family with Male Householder 3.9%With Related Children 2.4%
Other Family with Female Householder 5.9%With Related Children 4.0%
Nonfamily Households 4.3%
All Households with Children 25.5%
Multigenerational Households 2.2%Unmarried Partner Households 5.6%
Male-female 5.1%Same-sex 0.5%
2010 Households by SizeTotal 3,117
1 Person Household 25.9%2 Person Household 43.5%3 Person Household 11.2%4 Person Household 9.9%5 Person Household 5.5%6 Person Household 2.4%7 + Person Household 1.6%
2010 Households by Tenure and Mortgage StatusTotal 3,118
Owner Occupied 83.3%Owned with a Mortgage/Loan 51.4%Owned Free and Clear 31.9%
Renter Occupied 16.7%2010 Housing Units By Urban/ Rural Status
Total Housing Units 5,929Housing Units Inside Urbanized Area 0.0%Housing Units Inside Urbanized Cluster 0.0%Rural Housing Units 100.0%
Data Note: Households with children include any households with people under age 18, related or not. Multigenerational households are families with 3 or more parent-child relationships. Unmarried partner households are usually classified as nonfamily households unless there is another member of the household related to the householder. Multigenerational and unmarried partner households are reported only to the tract level. Esri estimated block group data, which is used to estimate polygons or non-standard geography.Source: U.S. Census Bureau, Census 2010 Summary File 1. Esri forecasts for 2016 and 2021 Esri converted Census 2000 data into 2010 geography.
February 01, 2017
©2016 Esri Page 6 of 7

Retail Market PotentialPelican_MAP Prepared by EsriArea: 314.41 square miles
Demographic Summary 2016 2021Population 7,559 7,616Population 18+ 6,092 6,148Households 3,149 3,181Median Household Income $52,125 $56,758
Expected Number of Percent of Product/Consumer Behavior Adults/HHs Adults/HHs MPIApparel (Adults)
Bought any men's clothing in last 12 months 2,832 46.5% 98Bought any women's clothing in last 12 months 2,817 46.2% 105Bought clothing for child <13 years in last 6 months 1,585 26.0% 94Bought any shoes in last 12 months 3,215 52.8% 98Bought costume jewelry in last 12 months 1,103 18.1% 93Bought any fine jewelry in last 12 months 953 15.6% 85Bought a watch in last 12 months 732 12.0% 109
Automobiles (Households)HH owns/leases any vehicle 2,897 92.0% 107HH bought/leased new vehicle last 12 mo 281 8.9% 95
Automotive Aftermarket (Adults)Bought gasoline in last 6 months 5,429 89.1% 105Bought/changed motor oil in last 12 months 3,884 63.8% 130Had tune-up in last 12 months 1,639 26.9% 89
Beverages (Adults)Drank bottled water/seltzer in last 6 months 3,479 57.1% 87Drank regular cola in last 6 months 2,802 46.0% 102Drank beer/ale in last 6 months 2,512 41.2% 97
Cameras (Adults)Own digital point & shoot camera 1,854 30.4% 104Own digital single-lens reflex (SLR) camera 350 5.7% 67Bought any camera in last 12 months 382 6.3% 110Printed digital photos in last 12 months 196 3.2% 110
Cell Phones (Adults/Households)Bought cell phone in last 12 months 2,056 33.7% 93Have a smartphone 2,640 43.3% 74Have a smartphone: Android phone (any brand) 1,308 21.5% 80Have a smartphone: Apple iPhone 1,006 16.5% 64Number of cell phones in household: 1 1,087 34.5% 107Number of cell phones in household: 2 1,303 41.4% 111Number of cell phones in household: 3+ 504 16.0% 63HH has cell phone only (no landline telephone) 1,039 33.0% 79
Computers (Households)HH owns a computer 2,291 72.8% 95HH owns desktop computer 1,437 45.6% 101HH owns laptop/notebook 1,507 47.9% 88HH owns any Apple/Mac brand computer 224 7.1% 47HH owns any PC/non-Apple brand computer 2,164 68.7% 101HH purchased most recent computer in a store 1,137 36.1% 96HH purchased most recent computer online 406 12.9% 99Spent <$500 on most recent home computer 448 14.2% 98Spent $500-$999 on most recent home computer"
712 22.6% 118Spent $1,000-$1,499 on most recent home computer 210 6.7% 70Spent $1,500-$1,999 on most recent home computer 100 3.2% 70Spent $2,000+ on most recent home computer 86 2.7% 70
Data Note: An MPI (Market Potential Index) measures the relative likelihood of the adults or households in the specified trade area to exhibit certain consumer behavior or purchasing patterns compared to the U.S. An MPI of 100 represents the U.S. average. Source: These data are based upon national propensities to use various products and services, applied to local demographic composition. Usage data were collected by GfK MRI in a nationally representative survey of U.S. households. Esri forecasts for 2016 and 2021.
January 31, 2017
©2016 Esri Page 1 of 4

Retail Market PotentialPelican_MAP Prepared by EsriArea: 314.41 square miles
Expected Number of Percent of Product/Consumer Behavior Adults/HHs Adults/HHs MPIConvenience Stores (Adults)
Shopped at convenience store in last 6 mos 2,665 43.7% 86Bought brewed coffee at convenience store in last 30 days 942 15.5% 98Bought cigarettes at convenience store in last 30 days 947 15.5% 124Bought gas at convenience store in last 30 days 2,589 42.5% 129Spent at convenience store in last 30 days: <$20 289 4.7% 59Spent at convenience store in last 30 days: $20-$39 487 8.0% 88Spent at convenience store in last 30 days: $40-$50 508 8.3% 109Spent at convenience store in last 30 days: $51-$99 312 5.1% 116Spent at convenience store in last 30 days: $100+ 1,940 31.8% 139
Entertainment (Adults)Attended a movie in last 6 months 2,865 47.0% 79Went to live theater in last 12 months 542 8.9% 68Went to a bar/night club in last 12 months 883 14.5% 87Dined out in last 12 months 2,571 42.2% 94Gambled at a casino in last 12 months 803 13.2% 96Visited a theme park in last 12 months 620 10.2% 58Viewed movie (video-on-demand) in last 30 days 772 12.7% 75Viewed TV show (video-on-demand) in last 30 days 426 7.0% 54Watched any pay-per-view TV in last 12 months 887 14.6% 111Downloaded a movie over the Internet in last 30 days 262 4.3% 60Downloaded any individual song in last 6 months 913 15.0% 73Watched a movie online in the last 30 days 507 8.3% 52Watched a TV program online in last 30 days 449 7.4% 49Played a video/electronic game (console) in last 12 months 540 8.9% 85Played a video/electronic game (portable) in last 12 months 262 4.3% 94
Financial (Adults)Have home mortgage (1st) 1,796 29.5% 95Used ATM/cash machine in last 12 months 2,310 37.9% 77Own any stock 361 5.9% 77Own U.S. savings bond 402 6.6% 125Own shares in mutual fund (stock) 374 6.1% 85Own shares in mutual fund (bonds) 265 4.3% 89Have interest checking account 1,840 30.2% 107Have non-interest checking account 1,787 29.3% 104Have savings account 3,148 51.7% 96Have 401K retirement savings plan 734 12.0% 83Own/used any credit/debit card in last 12 months 4,442 72.9% 98Avg monthly credit card expenditures: <$111 719 11.8% 102Avg monthly credit card expenditures: $111-$225 473 7.8% 113Avg monthly credit card expenditures: $226-$450 391 6.4% 101Avg monthly credit card expenditures: $451-$700 246 4.0% 76Avg monthly credit card expenditures: $701-$1,000 202 3.3% 77Avg monthly credit card expenditures: $1,001+ 508 8.3% 92Did banking online in last 12 months 1,682 27.6% 77Did banking on mobile device in last 12 months 513 8.4% 60Paid bills online in last 12 months 2,044 33.6% 78
Data Note: An MPI (Market Potential Index) measures the relative likelihood of the adults or households in the specified trade area to exhibit certain consumer behavior or purchasing patterns compared to the U.S. An MPI of 100 represents the U.S. average. Source: These data are based upon national propensities to use various products and services, applied to local demographic composition. Usage data were collected by GfK MRI in a nationally representative survey of U.S. households. Esri forecasts for 2016 and 2021.
January 31, 2017
©2016 Esri Page 2 of 4

Retail Market PotentialPelican_MAP Prepared by EsriArea: 314.41 square miles
Expected Number of Percent of Product/Consumer Behavior Adults/HHs Adults/HHs MPIGrocery (Adults)
Used beef (fresh/frozen) in last 6 months 2,424 77.0% 111Used bread in last 6 months 3,029 96.2% 102Used chicken (fresh or frozen) in last 6 months 2,082 66.1% 96Used turkey (fresh or frozen) in last 6 months 520 16.5% 104Used fish/seafood (fresh or frozen) in last 6 months 1,596 50.7% 93Used fresh fruit/vegetables in last 6 months 2,668 84.7% 99Used fresh milk in last 6 months 2,872 91.2% 104Used organic food in last 6 months 392 12.4% 63
Health (Adults)Exercise at home 2+ times per week 1,543 25.3% 89Exercise at club 2+ times per week 420 6.9% 53Visited a doctor in last 12 months 4,688 77.0% 102Used vitamin/dietary supplement in last 6 months 3,331 54.7% 104
Home (Households)Any home improvement in last 12 months 957 30.4% 113Used housekeeper/maid/professional HH cleaning service in last 12 months
323 10.3% 78Purchased low ticket HH furnishings in last 12 months 453 14.4% 90Purchased big ticket HH furnishings in last 12 months 555 17.6% 84Bought any small kitchen appliance in last 12 months 736 23.4% 105Bought any large kitchen appliance in last 12 months 446 14.2% 111
Insurance (Adults/Households)Currently carry life insurance 3,062 50.3% 118Carry medical/hospital/accident insurance 4,245 69.7% 106Carry homeowner insurance 3,467 56.9% 121Carry renter's insurance 454 7.5% 91Have auto insurance: 1 vehicle in household covered 932 29.6% 96Have auto insurance: 2 vehicles in household covered 890 28.3% 99Have auto insurance: 3+ vehicles in household covered 918 29.2% 134
Pets (Households)Household owns any pet 1,910 60.7% 113Household owns any cat 815 25.9% 115Household owns any dog 1,596 50.7% 124
Psychographics (Adults)Buying American is important to me 3,211 52.7% 124Usually buy items on credit rather than wait 629 10.3% 88Usually buy based on quality - not price 1,043 17.1% 95Price is usually more important than brand name 1,659 27.2% 104Usually use coupons for brands I buy often 1,170 19.2% 102Am interested in how to help the environment 676 11.1% 68Usually pay more for environ safe product 498 8.2% 64Usually value green products over convenience 514 8.4% 80Likely to buy a brand that supports a charity 2,163 35.5% 102
Reading (Adults)Bought digital book in last 12 months 620 10.2% 77Bought hardcover book in last 12 months 1,040 17.1% 82Bought paperback book in last 12 month 1,635 26.8% 86Read any daily newspaper (paper version) 1,688 27.7% 106Read any digital newspaper in last 30 days 1,726 28.3% 85Read any magazine (paper/electronic version) in last 6 months 5,504 90.3% 100
Data Note: An MPI (Market Potential Index) measures the relative likelihood of the adults or households in the specified trade area to exhibit certain consumer behavior or purchasing patterns compared to the U.S. An MPI of 100 represents the U.S. average. Source: These data are based upon national propensities to use various products and services, applied to local demographic composition. Usage data were collected by GfK MRI in a nationally representative survey of U.S. households. Esri forecasts for 2016 and 2021.
January 31, 2017
©2016 Esri Page 3 of 4
Retail Market PotentialPelican_MAP Prepared by EsriArea: 314.41 square miles
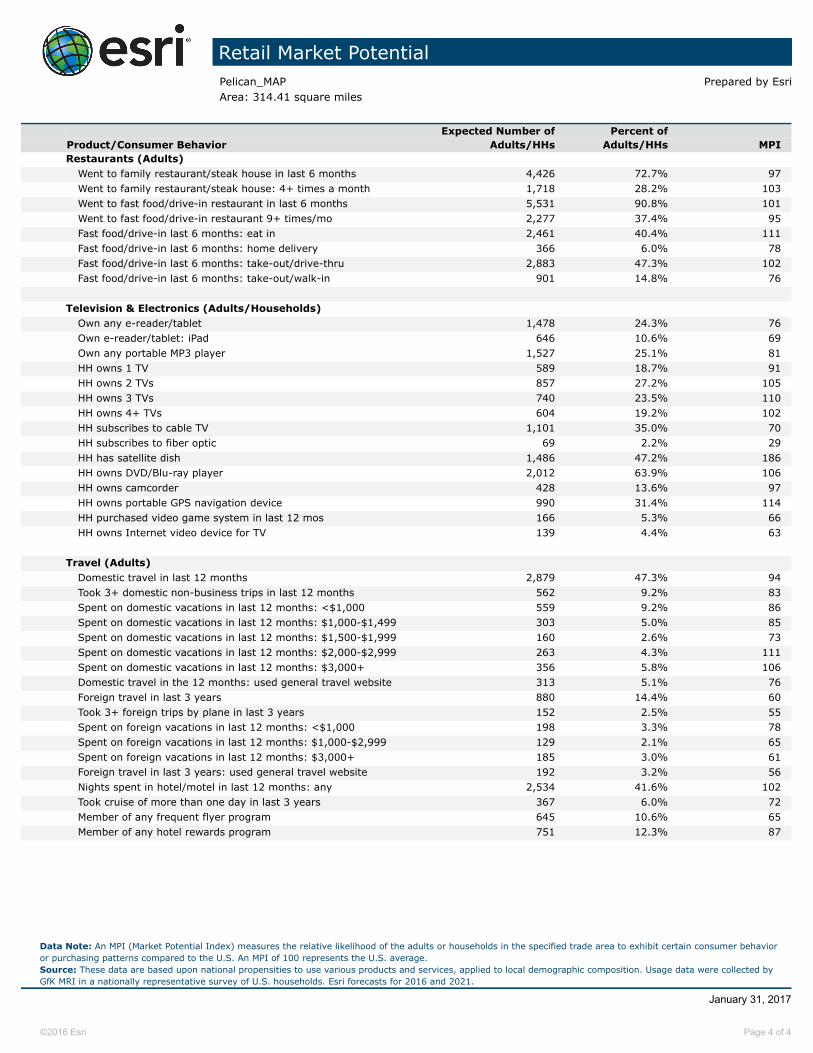
Expected Number of Percent of Product/Consumer Behavior Adults/HHs Adults/HHs MPIRestaurants (Adults)
Went to family restaurant/steak house in last 6 months 4,426 72.7% 97Went to family restaurant/steak house: 4+ times a month 1,718 28.2% 103Went to fast food/drive-in restaurant in last 6 months 5,531 90.8% 101Went to fast food/drive-in restaurant 9+ times/mo 2,277 37.4% 95Fast food/drive-in last 6 months: eat in 2,461 40.4% 111Fast food/drive-in last 6 months: home delivery 366 6.0% 78Fast food/drive-in last 6 months: take-out/drive-thru 2,883 47.3% 102Fast food/drive-in last 6 months: take-out/walk-in 901 14.8% 76
Television & Electronics (Adults/Households)Own any e-reader/tablet 1,478 24.3% 76Own e-reader/tablet: iPad 646 10.6% 69Own any portable MP3 player 1,527 25.1% 81HH owns 1 TV 589 18.7% 91HH owns 2 TVs 857 27.2% 105HH owns 3 TVs 740 23.5% 110HH owns 4+ TVs 604 19.2% 102HH subscribes to cable TV 1,101 35.0% 70HH subscribes to fiber optic 69 2.2% 29HH has satellite dish 1,486 47.2% 186HH owns DVD/Blu-ray player 2,012 63.9% 106HH owns camcorder 428 13.6% 97HH owns portable GPS navigation device 990 31.4% 114HH purchased video game system in last 12 mos 166 5.3% 66HH owns Internet video device for TV 139 4.4% 63
Travel (Adults)Domestic travel in last 12 months 2,879 47.3% 94Took 3+ domestic non-business trips in last 12 months 562 9.2% 83Spent on domestic vacations in last 12 months: <$1,000 559 9.2% 86Spent on domestic vacations in last 12 months: $1,000-$1,499 303 5.0% 85Spent on domestic vacations in last 12 months: $1,500-$1,999 160 2.6% 73Spent on domestic vacations in last 12 months: $2,000-$2,999 263 4.3% 111Spent on domestic vacations in last 12 months: $3,000+ 356 5.8% 106Domestic travel in the 12 months: used general travel website 313 5.1% 76Foreign travel in last 3 years 880 14.4% 60Took 3+ foreign trips by plane in last 3 years 152 2.5% 55Spent on foreign vacations in last 12 months: <$1,000 198 3.3% 78Spent on foreign vacations in last 12 months: $1,000-$2,999 129 2.1% 65Spent on foreign vacations in last 12 months: $3,000+ 185 3.0% 61Foreign travel in last 3 years: used general travel website 192 3.2% 56Nights spent in hotel/motel in last 12 months: any 2,534 41.6% 102Took cruise of more than one day in last 3 years 367 6.0% 72Member of any frequent flyer program 645 10.6% 65Member of any hotel rewards program 751 12.3% 87
Data Note: An MPI (Market Potential Index) measures the relative likelihood of the adults or households in the specified trade area to exhibit certain consumer behavior or purchasing patterns compared to the U.S. An MPI of 100 represents the U.S. average. Source: These data are based upon national propensities to use various products and services, applied to local demographic composition. Usage data were collected by GfK MRI in a nationally representative survey of U.S. households. Esri forecasts for 2016 and 2021.
January 31, 2017
©2016 Esri Page 4 of 4

Tapestry Segmentation Area ProfilePelican_MAP Prepared by EsriArea: 314.41 square miles
Top Twenty Tapestry Segments
2016 Households 2016 U.S. HouseholdsCumulative Cumulative
Rank Tapestry Segment Percent Percent Percent Percent Index1 Rural Resort Dwellers (6E) 40.2% 40.2% 1.0% 1.0% 39532 Prairie Living (6D) 28.9% 69.1% 1.1% 2.1% 2,6513 Small Town Simplicity (12C) 17.9% 87.0% 1.9% 4.0% 9434 Heartland Communities (6F) 12.5% 99.5% 2.4% 6.4% 5305 Green Acres (6A) 0.5% 100.0% 3.2% 9.6% 16
Subtotal 100.0% 9.6%
Total 100.0% 9.6% 1046
SiteU.S.
Top Ten Tapestry Segments Site vs. U.S.Top Ten Tapestry Segments Site vs. U.S.
Rural Resort Dwellers (6E)
Prairie Living (6D)
Small Town Simplicity (12C)
Heartland Communities (6F)
Green Acres (6A)
Percent of Households by Tapestry Segment4035302520151050
Data Note: This report identifies neighborhood segments in the area, and describes the socioeconomic quality of the immediate neighborhood. The index is a comparison of the percent of households or Total Population 18+ in the area, by Tapestry segment, to the percent of households or Total Population 18+ in the United States, by segment. An index of 100 is the US average.Source: Esri
February 01, 2017
©2016 Esri Page 1 of 6

Tapestry Segmentation Area ProfilePelican_MAP Prepared by EsriArea: 314.41 square miles
Tapestry LifeMode Groups 2016 Households 2016 Adult PopulationNumber Percent Index Number Percent Index
Total: 3,148 100.0% 6,093 100.0%
1. Affluent Estates 0 0.0% 0 0 0.0% 0Top Tier (1A) 0 0.0% 0 0 0.0% 0Professional Pride (1B) 0 0.0% 0 0 0.0% 0Boomburbs (1C) 0 0.0% 0 0 0.0% 0Savvy Suburbanites (1D) 0 0.0% 0 0 0.0% 0Exurbanites (1E) 0 0.0% 0 0 0.0% 0
2. Upscale Avenues 0 0.0% 0 0 0.0% 0Urban Chic (2A) 0 0.0% 0 0 0.0% 0Pleasantville (2B) 0 0.0% 0 0 0.0% 0Pacific Heights (2C) 0 0.0% 0 0 0.0% 0Enterprising Professionals (2D) 0 0.0% 0 0 0.0% 0
3. Uptown Individuals 0 0.0% 0 0 0.0% 0Laptops and Lattes (3A) 0 0.0% 0 0 0.0% 0Metro Renters (3B) 0 0.0% 0 0 0.0% 0Trendsetters (3C) 0 0.0% 0 0 0.0% 0
4. Family Landscapes 0 0.0% 0 0 0.0% 0Soccer Moms (4A) 0 0.0% 0 0 0.0% 0Home Improvement (4B) 0 0.0% 0 0 0.0% 0Middleburg (4C) 0 0.0% 0 0 0.0% 0
5. GenXurban 0 0.0% 0 0 0.0% 0Comfortable Empty Nesters (5A) ( (5A)
0 0.0% 0 0 0.0% 0In Style (5B) 0 0.0% 0 0 0.0% 0Parks and Rec (5C) 0 0.0% 0 0 0.0% 0Rustbelt Traditions (5D) 0 0.0% 0 0 0.0% 0Midlife Constants (5E) 0 0.0% 0 0 0.0% 0
6. Cozy Country Living 2,583 82.1% 677 4,964 81.5% 683Green Acres (6A) 16 0.5% 16 39 0.6% 19Salt of the Earth (6B) 0 0.0% 0 0 0.0% 0The Great Outdoors (6C) 0 0.0% 0 0 0.0% 0Prairie Living (6D) 909 28.9% 2,652 1,774 29.1% 2,777Rural Resort Dwellers (6E) 1,265 40.2% 3,954 2,334 38.3% 4,063Heartland Communities (6F) 393 12.5% 530 817 13.4% 610
7. Ethnic Enclaves 0 0.0% 0 0 0.0% 0Up and Coming Families (7A) 0 0.0% 0 0 0.0% 0Urban Villages (7B) 0 0.0% 0 0 0.0% 0American Dreamers (7C) 0 0.0% 0 0 0.0% 0Barrios Urbanos (7D) 0 0.0% 0 0 0.0% 0Valley Growers (7E) 0 0.0% 0 0 0.0% 0Southwestern Families (7F) 0 0.0% 0 0 0.0% 0
Data Note: This report identifies neighborhood segments in the area, and describes the socioeconomic quality of the immediate neighborhood. The index is a comparison of the percent of households or Total Population 18+ in the area, by Tapestry segment, to the percent of households or Total Population 18+ in the United States, by segment. An index of 100 is the US average.Source: Esri
February 01, 2017
©2016 Esri Page 3 of 6

Tapestry Segmentation Area ProfilePelican_MAP Prepared by EsriArea: 314.41 square miles
Tapestry LifeMode Groups 2016 Households 2016 Adult PopulationNumber Percent Index Number Percent Index
Total: 3,148 100.0% 6,093 100.0%
8. Middle Ground 0 0.0% 0 0 0.0% 0City Lights (8A) 0 0.0% 0 0 0.0% 0Emerald City (8B) 0 0.0% 0 0 0.0% 0Bright Young Professionals (8C) 0 0.0% 0 0 0.0% 0Downtown Melting Pot (8D) 0 0.0% 0 0 0.0% 0Front Porches (8E) 0 0.0% 0 0 0.0% 0Old and Newcomers (8F) 0 0.0% 0 0 0.0% 0Hardscrabble Road (8G) 0 0.0% 0 0 0.0% 0
9. Senior Styles 0 0.0% 0 0 0.0% 0Silver & Gold (9A) 0 0.0% 0 0 0.0% 0Golden Years (9B) 0 0.0% 0 0 0.0% 0The Elders (9C) 0 0.0% 0 0 0.0% 0Senior Escapes (9D) 0 0.0% 0 0 0.0% 0Retirement Communities (9E) 0 0.0% 0 0 0.0% 0Social Security Set (9F) 0 0.0% 0 0 0.0% 0
10. Rustic Outposts 0 0.0% 0 0 0.0% 0Southern Satellites (10A) 0 0.0% 0 0 0.0% 0Rooted Rural (10B) 0 0.0% 0 0 0.0% 0Diners & Miners (10C) 0 0.0% 0 0 0.0% 0Down the Road (10D) 0 0.0% 0 0 0.0% 0Rural Bypasses (10E) 0 0.0% 0 0 0.0% 0
11. Midtown Singles 0 0.0% 0 0 0.0% 0City Strivers (11A) 0 0.0% 0 0 0.0% 0Young and Restless (11B) 0 0.0% 0 0 0.0% 0Metro Fusion (11C) 0 0.0% 0 0 0.0% 0Set to Impress (11D) 0 0.0% 0 0 0.0% 0City Commons (11E) 0 0.0% 0 0 0.0% 0
12. Hometown 565 17.9% 287 1,129 18.5% 313Family Foundations (12A) 0 0.0% 0 0 0.0% 0Traditional Living (12B) 0 0.0% 0 0 0.0% 0Small Town Simplicity (12C) 565 17.9% 944 1,129 18.5% 1,079Modest Income Homes (12D) 0 0.0% 0 0 0.0% 0
13. Next Wave 0 0.0% 0 0 0.0% 0International Marketplace (13A) 0 0.0% 0 0 0.0% 0Las Casas (13B) 0 0.0% 0 0 0.0% 0NeWest Residents (13C) 0 0.0% 0 0 0.0% 0Fresh Ambitions (13D) 0 0.0% 0 0 0.0% 0High Rise Renters (13E) 0 0.0% 0 0 0.0% 0
14. Scholars and Patriots 0 0.0% 0 0 0.0% 0Military Proximity (14A) 0 0.0% 0 0 0.0% 0College Towns (14B) 0 0.0% 0 0 0.0% 0Dorms to Diplomas (14C) 0 0.0% 0 0 0.0% 0
Unclassified (15) 0 0.0% 0 0 0.0% 0
Data Note: This report identifies neighborhood segments in the area, and describes the socioeconomic quality of the immediate neighborhood. The index is a comparison of the percent of households or Total Population 18+ in the area, by Tapestry segment, to the percent of households or Total Population 18+ in the United States, by segment. An index of 100 is the US average.Source: Esri
February 01, 2017
©2016 Esri Page 4 of 6

Tapestry Segmentation Area ProfilePelican_MAP Prepared by EsriArea: 314.41 square miles
Tapestry Urbanization Groups 2016 Households 2016 Adult PopulationNumber Percent Index Number Percent Index
Total: 3,148 100.0% 6,093 100.0%
1. Principal Urban Center 0 0.0% 0 0 0.0% 0Laptops and Lattes (3A) 0 0.0% 0 0 0.0% 0Metro Renters (3B) 0 0.0% 0 0 0.0% 0Trendsetters (3C) 0 0.0% 0 0 0.0% 0Downtown Melting Pot (8D) 0 0.0% 0 0 0.0% 0City Strivers (11A) 0 0.0% 0 0 0.0% 0NeWest Residents (13C) 0 0.0% 0 0 0.0% 0Fresh Ambitions (13D) 0 0.0% 0 0 0.0% 0High Rise Renters (13E) 0 0.0% 0 0 0.0% 0
2. Urban Periphery 0 0.0% 0 0 0.0% 0Pacific Heights (2C) 0 0.0% 0 0 0.0% 0Rustbelt Traditions (5D) 0 0.0% 0 0 0.0% 0Urban Villages (7B) 0 0.0% 0 0 0.0% 0American Dreamers (7C) 0 0.0% 0 0 0.0% 0Barrios Urbanos (7D) 0 0.0% 0 0 0.0% 0Southwestern Families (7F) 0 0.0% 0 0 0.0% 0City Lights (8A) 0 0.0% 0 0 0.0% 0Bright Young Professionals (8C) 0 0.0% 0 0 0.0% 0Metro Fusion (11C) 0 0.0% 0 0 0.0% 0Family Foundations (12A) 0 0.0% 0 0 0.0% 0Modest Income Homes (12D) 0 0.0% 0 0 0.0% 0International Marketplace (13A) 0 0.0% 0 0 0.0% 0Las Casas (13B) 0 0.0% 0 0 0.0% 0
3. Metro Cities 0 0.0% 0 0 0.0% 0In Style (5B) 0 0.0% 0 0 0.0% 0Emerald City (8B) 0 0.0% 0 0 0.0% 0Front Porches (8E) 0 0.0% 0 0 0.0% 0Old and Newcomers (8F) 0 0.0% 0 0 0.0% 0Hardscrabble Road (8G) 0 0.0% 0 0 0.0% 0Retirement Communities (9E) 0 0.0% 0 0 0.0% 0Social Security Set (9F) 0 0.0% 0 0 0.0% 0Young and Restless (11B) 0 0.0% 0 0 0.0% 0Set to Impress (11D) 0 0.0% 0 0 0.0% 0City Commons (11E) 0 0.0% 0 0 0.0% 0Traditional Living (12B) 0 0.0% 0 0 0.0% 0College Towns (14B) 0 0.0% 0 0 0.0% 0Dorms to Diplomas (14C) 0 0.0% 0 0 0.0% 0
Data Note: This report identifies neighborhood segments in the area, and describes the socioeconomic quality of the immediate neighborhood. The index is a comparison of the percent of households or Total Population 18+ in the area, by Tapestry segment, to the percent of households or Total Population 18+ in the United States, by segment. An index of 100 is the US average.Source: Esri
February 01, 2017
©2016 Esri Page 5 of 6

Tapestry Segmentation Area ProfilePelican_MAP Prepared by EsriArea: 314.41 square miles
Tapestry Urbanization Groups 2016 Households 2016 Adult PopulationNumber Percent Index Number Percent Index
Total: 3,148 100.0% 6,093 100.0%4. Suburban Periphery 0 0.0% 0 0 0.0% 0Top Tier (1A) 0 0.0% 0 0 0.0% 0Professional Pride (1B) 0 0.0% 0 0 0.0% 0Boomburbs (1C) 0 0.0% 0 0 0.0% 0Savvy Suburbanites (1D) 0 0.0% 0 0 0.0% 0Exurbanites (1E) 0 0.0% 0 0 0.0% 0Urban Chic (2A) 0 0.0% 0 0 0.0% 0Pleasantville (2B) 0 0.0% 0 0 0.0% 0Enterprising Professionals (2D) 0 0.0% 0 0 0.0% 0Soccer Moms (4A) 0 0.0% 0 0 0.0% 0Home Improvement (4B) 0 0.0% 0 0 0.0% 0Comfortable Empty Nesters (5A) 0 0.0% 0 0 0.0% 0Parks and Rec (5C) 0 0.0% 0 0 0.0% 0Midlife Constants (5E) 0 0.0% 0 0 0.0% 0Up and Coming Families (7A) 0 0.0% 0 0 0.0% 0Silver & Gold (9A) 0 0.0% 0 0 0.0% 0Golden Years (9B) 0 0.0% 0 0 0.0% 0The Elders (9C) 0 0.0% 0 0 0.0% 0Military Proximity (14A) 0 0.0% 0 0 0.0% 0
5. Semirural 958 30.4% 324 1,946 31.9% 353Middleburg (4C) 0 0.0% 0 0 0.0% 0Heartland Communities (6F) 393 12.5% 530 817 13.4% 610Valley Growers (7E) 0 0.0% 0 0 0.0% 0Senior Escapes (9D) 0 0.0% 0 0 0.0% 0Down the Road (10D) 0 0.0% 0 0 0.0% 0Small Town Simplicity (12C) 565 17.9% 944 1,129 18.5% 1,079
6. Rural 2,190 69.6% 410 4,147 68.1% 400Green Acres (6A) 16 0.5% 16 39 0.6% 19Salt of the Earth (6B) 0 0.0% 0 0 0.0% 0The Great Outdoors (6C) 0 0.0% 0 0 0.0% 0Prairie Living (6D) 909 28.9% 2,652 1,774 29.1% 2,777Rural Resort Dwellers (6E) 1,265 40.2% 3,954 2,334 38.3% 4,063Southern Satellites (10A) 0 0.0% 0 0 0.0% 0Rooted Rural (10B) 0 0.0% 0 0 0.0% 0Diners & Miners (10C) 0 0.0% 0 0 0% 0Rural Bypasses (10E) 0 0.0% 0 0 0.0% 0
Unclassified (15) 0 0.0% 0 0 0.0% 0
Data Note: This report identifies neighborhood segments in the area, and describes the socioeconomic quality of the immediate neighborhood. The index is a comparison of the percent of households or Total Population 18+ in the area, by Tapestry segment, to the percent of households or Total Population 18+ in the United States, by segment. An index of 100 is the US average.Source: Esri
February 01, 2017
©2016 Esri Page 6 of 6

TAPESTRYSEGMENTATION
TM
esri.com/tapestry
Households: 1,215,000
Average Household Size: 2.21
Median Age: 52.4
Median Household Income: $46,000
LifeMode Group: Cozy Country Living
Rural Resort Dwellers
WHO ARE WE?Although the Great Recession forced many owners of second homes to sell, Rural Resort Dwellers residents remain an active market, just a bit smaller. These communities are centered in resort areas, many in the Midwest, where the change in seasons supports a variety of outdoor activities. Retirement looms for many of these blue collar, older householders, but workers are postponing retirement or returning to work to maintain their current lifestyles. Workers are traveling further to maintain employment. They are passionate about their hobbies, like freshwater fi shing and hunting, but otherwise have very simple tastes.
OUR NEIGHBORHOOD• Housing is owner-occupied, single-family homes, with some mobile homes. A strong market for second homes, these rural areas provide affordable homes valued at 8% less than the US median home value. Over half of the housing units are vacant due to a high seasonal vacancy rate.
• In this older market, 42% of households consist of married couples with no children at home, while another 28% are single person. Married couples with children at home have older school-age children.
• Set in scenic rural locations with proximity to outdoor activities, two vehicles are essential to get around.
SOCIOECONOMIC TRAITS• Rural Resort Dwellers residents are close to retirement. They’ve accumulated wealth and begun to shift their portfolios to low-risk assets. These active residents continue to work in skilled occupations.
• Simple tastes and modesty characterize these blue collar residents. They shop for timeless, comfortable clothing, but only when something must be replaced. They pay little attention to advertising and usually stick to the brands they know.
• They spend time with their spouses and also maintain a social calendar.
Note: The Index represents the ratio of the segment rate to the US rate multiplied by 100. Consumer preferences are estimated from data by GfK MRI.
6E

Male Female8% 4% 0 4% 8%
85+80–8475–7970–7465–6960–6455–5950–5445–4940–4435–3930–3425–2920–2415–1910–14
5–9< 5
* Hispanic can be of any race. US Average
2.2%
1.4%
1.8%
4.5%
1.5%
0.7%
80%60%40%20%0
White
Black
AmericanIndian
Asian andPac. Island
Other
Multiple
Hispanic*
92.4%
0
$60k $90k$30k $120k+
Median Household Income
$46,000
US Median $51,000
0
0
$300k$100k $200k $400k+
Median Net Worth
$129,000
US Median $71,000
$60,000
$40,000
$50,000
$30,000
$10,000
$20,000
0 160,000
Med
ian
Ear
ning
s
Workers (Age 16+)40,000 80,000 120,000
Constructionand Extraction
Transportation andMaterial Moving
Office andAdministrative Support
Management
Sales and Related
3500 50 100 150 200 250 300
Housing
Food
Apparel & Services
Transportation
Health Care
Entertainment &Recreation
Education
Pensions &Social Security
Other
88
50
91
104
93
64
80
92
80
TAPESTRYSEGMENTATION
TM
esri.com/tapestry
LifeMode Group: Cozy Country Living
Rural Resort Dwellers
INCOME AND NET WORTHNet worth measures total household assets (homes, vehicles, investments, etc.) less any debts, secured (e.g., mortgages)or unsecured (credit cards). Household income andnet worth are estimated by Esri.
AGE BY SEX (Esri data)
Median Age: 52.4 US: 37.6| Indicates US
RACE AND ETHNICITY (Esri data)
The Diversity Index summarizes racial and ethnic diversity. The index shows the likelihood that two persons, chosen at random from the same area, belong to different race or ethnic groups. The index ranges from 0 (no diversity) to 100 (complete diversity).
Diversity Index: 21.9 US: 62.1
6E
OCCUPATION BY EARNINGSThe fi ve occupations with the highest number of workers in the market are displayedby median earnings. Data from the Census Bureau’s American Community Survey.
AVERAGE HOUSEHOLD BUDGET INDEXThe index compares the average amount spent in this market’s household budgets for housing, food, apparel, etc., to the average amount spent by all US households. An indexof 100 is average. An index of 120 shows that average spending by consumers in this marketis 20 percent above the national average. Consumer expenditures are estimated by Esri.

Population900,000 11,000,000
2,731,000
Population Growth (Annual %)-0.5% 3.0%
0.4%
Population Density (Persons per sq. mile)0 25,000
1000
7
0Wealth Index
97 350
0Socioeconomic Status Index
106 350
0Housing Affordability Index
143 350
Own81.8%
Rent18.2%
HomeOwnership
US Percentage:63.6% Own36.4% Rent
TAPESTRYSEGMENTATION
TM
esri.com/tapestry
MARKET PROFILE (Consumer preferences are estimated from data by GfK MRI)
• Residents drive older domestic vehicles and prefer to spend their disposable income on gear to support their hobbies, which include freshwater fi shing, hunting with a rifl e or shotgun, and motorcycling.
• At home, Rural Resort Dwellers residents spend any free time working on their vehicles and maintaining their gear. They make frequent trips to their local hardware store for parts and tools. These hands-on consumers are also passionate about vegetable gardening.
• Due to their remote locations, these neighborhoods have satellite dishes. A few residents still rely on dial-up modems to stay connected. They don’t access the Internet often but will make online purchases for items diffi cult to fi nd in nearby stores.
• Their taste in TV shows refl ects their hobbies—Animal Planet, Discovery Channel, and the DIY Network.
ESRI INDEXESEsri developed three indexes to display average household wealth, socioeconomic status,and housing affordability for the market relative to US standards.
POPULATION CHARACTERISTICSTotal population, average annual population change since Census 2010, and average density (population per square mile) are displayed for the market relative to the sizeand change among all Tapestry markets. Data estimated by Esri.
LifeMode Group: Cozy Country Living
Rural Resort Dwellers6E
HOUSINGMedian home value is displayed for markets that are primarilyowner occupied; average rent is shown for renter-occupied markets. Tenure and home value are estimated by Esri. Housing type and average rent are from the Census Bureau’s American Community Survey.
Typical Housing:Single Family
Median Value:$163,000US Median: $177,000

High
Low
TAPESTRYSEGMENTATION
TM
esri.com/tapestry
Copyright © 2014 Esri. All rights reserved. Esri, the Esri globe logo, Tapestry, @esri.com, and esri.com are trademarks, service marks, or registered marks of Esri in the United States, the European Community, or certain other jurisdictions. Other companies and products or services mentioned herein may be trademarks, service marks, or registered marks of their respective mark owners.
G62222ESRI2C7/14dl
For more information1-800-447-9778
SEGMENT DENSITYThis map illustrates the density anddistribution of the Rural Resort DwellersTapestry Segment by households.
LifeMode Group: Cozy Country Living
Rural Resort Dwellers6E

TAPESTRYSEGMENTATION
TM
esri.com/tapestry
Households: 1,307,000
Average Household Size: 2.50
Median Age: 43.4
Median Household Income: $51,000
LifeMode Group: Cozy Country Living
Prairie Living
WHO ARE WE?Prairie Living is Tapestry Segmentation’s most rural market, comprising about 1 percent of households, located mainly in the Midwest, with a predominance of self-employed farmers. These agricultural communities are not diverse, dominated by married-couple families that own single-family dwellings and many vehicles. Median household income is similar to the US, and labor force participation is slightly higher. Faith is important to this hardworking market. Whenthey fi nd time to relax, they favor outdoor activities.
OUR NEIGHBORHOOD• About four-fi fths of households are owner occupied.
• Dominant household type is married-couples with no children.
• Most are single-family homes (87%) built before 1980; a higher proportion were built before 1940 (Index 225).
• Higher percentage of vacant housing units is at 16% (Index 137).
• Most households own 2 or 3 vehicles; this is the highest ranked market for owning 4 or more vehicles.
SOCIOECONOMIC TRAITS• Half have completed some college education or hold a degree.
• At 4.1%, the unemployment rate is less than half the US rate.
• Labor force participation rate slightly higher at 66%.
• Wage and salary income for 73% of households plus self-employment income for 27% (Index 242).
• Faith and religion are important to these residents.
• Tend to buy things when they need them, rather than when they want them or to be trendy.
• Somewhat resistant to new technology.
• Creatures of habit when purchasing food items.
Note: The Index represents the ratio of the segment rate to the US rate multiplied by 100. Consumer preferences are estimated from data by GfK MRI.
6D

Male Female8% 4% 0 4% 8%
85+80–8475–7970–7465–6960–6455–5950–5445–4940–4435–3930–3425–2920–2415–1910–14
5–9< 5
* Hispanic can be of any race. US Average
1.1%
2.3%
1.5%
5.9%
1.2%
0.6%
80%60%40%20%0
White
Black
AmericanIndian
Asian andPac. Island
Other
Multiple
Hispanic*
93.3%
0
$60k $90k$30k $120k+
Median Household Income
$51,000
US Median $51,000
0
0
$300k$100k $200k $400k+
Median Net Worth
$118,000
US Median $71,000
$50,000
$40,000
$30,000
$10,000
$20,000
0 100,000 200,000 300,000
Med
ian
Ear
ning
s
Workers (Age 16+)
Production Transportation andMaterial Moving
Office andAdministrative Support
Management
Sales and Related
3500 50 100 150 200 250 300
Housing
Food
Apparel & Services
Transportation
Health Care
Entertainment &Recreation
Education
Pensions &Social Security
Other
92
50
97
108
96
65
83
93
79
TAPESTRYSEGMENTATION
TM
esri.com/tapestry
LifeMode Group: Cozy Country Living
Prairie Living
INCOME AND NET WORTHNet worth measures total household assets (homes, vehicles, investments, etc.) less any debts, secured (e.g., mortgages)or unsecured (credit cards). Household income andnet worth are estimated by Esri.
AGE BY SEX (Esri data)
Median Age: 43.4 US: 37.6| Indicates US
RACE AND ETHNICITY (Esri data)
The Diversity Index summarizes racial and ethnic diversity. The index shows the likelihood that two persons, chosen at random from the same area, belong to different race or ethnic groups. The index ranges from 0 (no diversity) to 100 (complete diversity).
Diversity Index: 22.6 US: 62.1
6D
OCCUPATION BY EARNINGSThe fi ve occupations with the highest number of workers in the market are displayedby median earnings. Data from the Census Bureau’s American Community Survey.
AVERAGE HOUSEHOLD BUDGET INDEXThe index compares the average amount spent in this market’s household budgets for housing, food, apparel, etc., to the average amount spent by all US households. An indexof 100 is average. An index of 120 shows that average spending by consumers in this marketis 20 percent above the national average. Consumer expenditures are estimated by Esri.

Population900,000 11,000,000
3,334,000
Population Growth (Annual %)-0.5% 3.0%
0.3%
Population Density (Persons per sq. mile)0 25,000
1000
5
0Wealth Index
94 350
0Socioeconomic Status Index
117 350
0Housing Affordability Index
203 350
Own79.8%
Rent20.2%
HomeOwnership
US Percentage:63.6% Own36.4% Rent
TAPESTRYSEGMENTATION
TM
esri.com/tapestry
MARKET PROFILE (Consumer preferences are estimated from data by GfK MRI)
• Many own a truck, riding lawn mower, and ATV/UTV and have a satellite dish.
• They purchased plants and seeds in the past year for their vegetable garden, where their tiller comes in handy.
• They favor banking in person, have noninterest checking accounts, invest in CDs (more than 6 months), and have term/whole life insurance.
• They are pet owners.
• Leisure activities include fi shing, hunting, boating, camping, and attending country music concerts.
• Residents prefer to listen to faith and inspirational, as well as country music on the radio.
• They read home service, fi shing/hunting, and automotive magazines.
• They contribute to religious organizations and belong to religious clubs.
• Walmart is a favorite shopping stop; Subway is a favorite eating spot.
ESRI INDEXESEsri developed three indexes to display average household wealth, socioeconomic status,and housing affordability for the market relative to US standards.
POPULATION CHARACTERISTICSTotal population, average annual population change since Census 2010, and average density (population per square mile) are displayed for the market relative to the sizeand change among all Tapestry markets. Data estimated by Esri.
LifeMode Group: Cozy Country Living
Prairie Living6D
HOUSINGMedian home value is displayed for markets that are primarilyowner occupied; average rent is shown for renter-occupied markets. Tenure and home value are estimated by Esri. Housing type and average rent are from the Census Bureau’s American Community Survey.
Typical Housing:Single Family
Median Value:$125,000US Median: $177,000

High
Low
TAPESTRYSEGMENTATION
TM
esri.com/tapestry
For more information1-800-447-9778
SEGMENT DENSITYThis map illustrates the density anddistribution of the Prairie LivingTapestry Segment by households.
LifeMode Group: Cozy Country Living
Prairie Living6D
Copyright © 2014 Esri. All rights reserved. Esri, the Esri globe logo, Tapestry, @esri.com, and esri.com are trademarks, service marks, or registered marks of Esri in the United States, the European Community, or certain other jurisdictions. Other companies and products or services mentioned herein may be trademarks, service marks, or registered marks of their respective mark owners.
G62222ESRI2C7/14dl

TAPESTRYSEGMENTATION
TM
esri.com/tapestry
Households: 2,305,000
Average Household Size: 2.25
Median Age: 40.0
Median Household Income: $27,000
LifeMode Group: Hometown
Small Town Simplicity
WHO ARE WE?Small Town Simplicity includes young families and senior householders that are bound by community ties. The lifestyle is down-to-earth and semirural, with television for entertainment and news, and emphasis on convenience for both young parents and senior citizens. Residents embark on pursuits including online computer games, scrapbooking, and rural activities like hunting and fishing. Since almost 1 in 4 households is below poverty level, residents also keep their fi nances simple—paying billsin person and avoiding debt.
OUR NEIGHBORHOOD• They reside in small towns or semirural neighborhoods, mostly outside metropolitan areas.
• Homes are a mix of older single-family houses (61%), apartments, and mobile homes.
• A majority, 51%, of homes are owner occupied. (Index 80).
• Median home value of $88,000 is about half the US median.
• Average rent is $600 (Index 62).
• This is an older market, with almost half of the householders aged 55 years or older, and predominantly single-person households (Index 139).
SOCIOECONOMIC TRAITS• Education: 65% with high school diploma or some college.
• Unemployment higher at 11.9% (Index 138).
• Labor force participation lower at 51% (Index 81), which could result from lack of jobs or retirement.
• Income from wages and salaries (Index 82), Social Security (Index 142) or retirement (Index 112), increased by Supplemental Security Income (Index 203).
• Price-conscious consumers that shop accordingly, with coupons at discount centers.
• Connected, but not to the latest or greatest gadgets; keep their landlines.
• Community-orientated residents; more conservative than middle-of-the-road.
• Rely on television or newspapers to stay informed.
Note: The Index represents the ratio of the segment rate to the US rate multiplied by 100. Consumer preferences are estimated from data by GfK MRI.
12C

Male Female8% 4% 0 4% 8%
85+80–8475–7970–7465–6960–6455–5950–5445–4940–4435–3930–3425–2920–2415–1910–14
5–9< 5
* Hispanic can be of any race. US Average
77.3%
13.1%
3.8%
2.9%
9.5%
1.6%
1.2%
80%60%40%20%0
White
Black
AmericanIndian
Asian andPac. Island
Other
Multiple
Hispanic*
0
$60k $90k$30k $120k+
Median Household Income
$27,000
US Median $51,000
0
0
$300k$100k $200k $400k+
Median Net Worth
$14,000
US Median $71,000
$35,000
$25,000
$15,000
$5,000
0 350,000
Med
ian
Ear
ning
s
Workers (Age 16+)150,00050,000 250,000
Sales and Related
Food Preparationand Serving Related
Office andAdministrative Support
Production
Transportation andMaterial Moving
3500 50 100 150 200 250 300
Housing
Food
Apparel & Services
Transportation
Health Care
Entertainment &Recreation
Education
Pensions &Social Security
Other
57
35
58
59
57
50
50
54
53
TAPESTRYSEGMENTATION
TM
esri.com/tapestry
LifeMode Group: Hometown
Small Town Simplicity
INCOME AND NET WORTHNet worth measures total household assets (homes, vehicles, investments, etc.) less any debts, secured (e.g., mortgages)or unsecured (credit cards). Household income andnet worth are estimated by Esri.
AGE BY SEX (Esri data)
Median Age: 40.0 US: 37.6| Indicates US
RACE AND ETHNICITY (Esri data)
The Diversity Index summarizes racial and ethnic diversity. The index shows the likelihood that two persons, chosen at random from the same area, belong to different race or ethnic groups. The index ranges from 0 (no diversity) to 100 (complete diversity).
Diversity Index: 49.1 US: 62.1
12C
OCCUPATION BY EARNINGSThe fi ve occupations with the highest number of workers in the market are displayedby median earnings. Data from the Census Bureau’s American Community Survey.
AVERAGE HOUSEHOLD BUDGET INDEXThe index compares the average amount spent in this market’s household budgets for housing, food, apparel, etc., to the average amount spent by all US households. An indexof 100 is average. An index of 120 shows that average spending by consumers in this marketis 20 percent above the national average. Consumer expenditures are estimated by Esri.

Population900,000 11,000,000
5,424,000
Population Growth (Annual %)-0.5% 3.0%
0.1%
Population Density (Persons per sq. mile)0 25,000
1000
87
0Wealth Index
41 350
0Socioeconomic Status Index
68 350
0Housing Affordability Index
160 350
Own50.9%
Rent49.1%
HomeOwnership
US Percentage:63.6% Own36.4% Rent
TAPESTRYSEGMENTATION
TM
esri.com/tapestry
MARKET PROFILE (Consumer preferences are estimated from data by GfK MRI)
• Small Town Simplicity features a semirural lifestyle, complete with trucks (domestic, of course), ATVs, and vegetable gardens.
• Hunting, fi shing, and target shooting are favorite pastimes.
• A large senior population visit doctors and health practitioners regularly.
• However, a largely single population favors convenience over cooking—frozen meals and fast food.
• Home improvement is not a priority, but vehicle maintenance is.
ESRI INDEXESEsri developed three indexes to display average household wealth, socioeconomic status,and housing affordability for the market relative to US standards.
POPULATION CHARACTERISTICSTotal population, average annual population change since Census 2010, and average density (population per square mile) are displayed for the market relative to the sizeand change among all Tapestry markets. Data estimated by Esri.
LifeMode Group: Hometown
Small Town Simplicity12C
HOUSINGMedian home value is displayed for markets that are primarilyowner occupied; average rent is shown for renter-occupied markets. Tenure and home value are estimated by Esri. Housing type and average rent are from the Census Bureau’s American Community Survey.
Typical Housing:Single Family
Median Value:$88,000US Median: $177,000

High
Low
TAPESTRYSEGMENTATION
TM
esri.com/tapestry
Copyright © 2014 Esri. All rights reserved. Esri, the Esri globe logo, Tapestry, @esri.com, and esri.com are trademarks, service marks, or registered marks of Esri in the United States, the European Community, or certain other jurisdictions. Other companies and products or services mentioned herein may be trademarks, service marks, or registered marks of their respective mark owners.
G62222ESRI2C7/14dl
For more information1-800-447-9778
SEGMENT DENSITYThis map illustrates the density anddistribution of the Small Town SimplicityTapestry Segment by households.
LifeMode Group: Hometown
Small Town Simplicity12C

TAPESTRYSEGMENTATION
TM
esri.com/tapestry
Households: 2,864,000
Average Household Size: 2.38
Median Age: 41.5
Median Household Income: $39,000
LifeMode Group: Cozy Country Living
Heartland Communities
WHO ARE WE?Well settled and close-knit, Heartland Communities are semirural and semiretired. These older householders are primarily homeowners, and many have paid off their mortgages. Their children have moved away, but they have no plans to leave their homes. Their hearts are with the country; they embrace the slower pace of life here but actively participate in outdoor activities and community events. Traditional and patriotic, these residents support their local businesses, always buy American, and favor domestic driving vacations over foreign plane trips.
OUR NEIGHBORHOOD• Rural communities or small towns are concentrated in the Midwest, from older Rustbelt cities to the Great Plains.
• Distribution of household types is comparable to the US, primarily (but not the majority) married couples, more with no children, and a slightly higher proportion of singles (Index 112) that refl ects the aging of the population.
• Residents own modest, single-family homes built before 1970.
• They own one or two vehicles; commutes are short (Index 95).
SOCIOECONOMIC TRAITS• Retirees in this market depress the average labor force participation rate to less than 60% (Index 95), but the unemployment rate is comparable to the US.
• More workers are white collar than blue collar; more skilled than unskilled.
• The rural economy of this market provides employment in the manufacturing, construction, and agriculture industries.
• These are budget savvy consumers; they stick to brands they grew up with and know the price of goods they purchase. Buying American is important.
• Daily life is busy, but routine. Working on the weekends is not uncommon.
• Residents trust TV and newspapers more than any other media.
• Skeptical about their fi nancial future, they stick to community banks and low-risk investments.
Note: The Index represents the ratio of the segment rate to the US rate multiplied by 100. Consumer preferences are estimated from data by GfK MRI.
6F

Male Female8% 4% 0 4% 8%
85+80–8475–7970–7465–6960–6455–5950–5445–4940–4435–3930–3425–2920–2415–1910–14
5–9< 5
* Hispanic can be of any race. US Average
4.7%
2.4%
2.0%
6.1%
1.2%
0.8%
80%60%40%20%0
White
Black
AmericanIndian
Asian andPac. Island
Other
Multiple
Hispanic*
89.0%
0
$60k $90k$30k $120k+
Median Household Income
$39,000
US Median $51,000
0
0
$300k$100k $200k $400k+
Median Net Worth
$55,000
US Median $71,000
$60,000
$40,000
$50,000
$30,000
$10,000
$20,000
0 500,000
Med
ian
Ear
ning
s
Workers (Age 16+)200,000100,000 300,000 400,000
Production
Transportation andMaterial Moving
Office andAdministrative Support
Management
Sales and Related
3500 50 100 150 200 250 300
Housing
Food
Apparel & Services
Transportation
Health Care
Entertainment &Recreation
Education
Pensions &Social Security
Other
72
43
74
79
73
59
66
71
65
TAPESTRYSEGMENTATION
TM
esri.com/tapestry
LifeMode Group: Cozy Country Living
Heartland Communities
INCOME AND NET WORTHNet worth measures total household assets (homes, vehicles, investments, etc.) less any debts, secured (e.g., mortgages)or unsecured (credit cards). Household income andnet worth are estimated by Esri.
AGE BY SEX (Esri data)
Median Age: 41.5 US: 37.6| Indicates US
RACE AND ETHNICITY (Esri data)
The Diversity Index summarizes racial and ethnic diversity. The index shows the likelihood that two persons, chosen at random from the same area, belong to different race or ethnic groups. The index ranges from 0 (no diversity) to 100 (complete diversity).
Diversity Index: 29.6 US: 62.1
6F
OCCUPATION BY EARNINGSThe fi ve occupations with the highest number of workers in the market are displayedby median earnings. Data from the Census Bureau’s American Community Survey.
AVERAGE HOUSEHOLD BUDGET INDEXThe index compares the average amount spent in this market’s household budgets for housing, food, apparel, etc., to the average amount spent by all US households. An indexof 100 is average. An index of 120 shows that average spending by consumers in this marketis 20 percent above the national average. Consumer expenditures are estimated by Esri.

Population900,000 11,000,000
6,992,000
Population Growth (Annual %)-0.5% 3.0%
0.1%
Population Density (Persons per sq. mile)0 25,000
1000
93
0Wealth Index
63 350
0Socioeconomic Status Index
84 350
0Housing Affordability Index
216 350
Own70.3%
Rent29.7%
HomeOwnership
US Percentage:63.6% Own36.4% Rent
TAPESTRYSEGMENTATION
TM
esri.com/tapestry
MARKET PROFILE (Consumer preferences are estimated from data by GfK MRI)
• Traditional in their ways, residents of Heartland Communities choose to bank and pay their bills in person and purchase insurance from an agent.
• Most have high-speed Internet access at home or on their cell phone but aren’t ready to go paperless.
• Many residents have paid off their home mortgages but still hold auto loans and student loans. Noninterest checking accounts are common.
• To support their local community, residents participate in public activities.
• Home remodeling is not a priority, but homeowners do tackle necessary maintenance work on their cherished homes. They have invested in riding lawn mowers to maintain their larger yards.
• They enjoy country music and watch CMT.
• Motorcycling, hunting, and fi shing are popular; walking is the main form of exercise.
• To get around these semirural communities, residents prefer domestic trucks or SUVs.
• They prefer to travel in the US and favor the convenience of packaged deals.
ESRI INDEXESEsri developed three indexes to display average household wealth, socioeconomic status,and housing affordability for the market relative to US standards.
POPULATION CHARACTERISTICSTotal population, average annual population change since Census 2010, and average density (population per square mile) are displayed for the market relative to the sizeand change among all Tapestry markets. Data estimated by Esri.
LifeMode Group: Cozy Country Living
Heartland Communities6F
HOUSINGMedian home value is displayed for markets that are primarilyowner occupied; average rent is shown for renter-occupied markets. Tenure and home value are estimated by Esri. Housing type and average rent are from the Census Bureau’s American Community Survey.
Typical Housing:Single Family
Median Value:$89,000US Median: $177,000

High
Low
TAPESTRYSEGMENTATION
TM
esri.com/tapestry
Copyright © 2014 Esri. All rights reserved. Esri, the Esri globe logo, Tapestry, @esri.com, and esri.com are trademarks, service marks, or registered marks of Esri in the United States, the European Community, or certain other jurisdictions. Other companies and products or services mentioned herein may be trademarks, service marks, or registered marks of their respective mark owners.
G62222ESRI2C7/14dl
For more information1-800-447-9778
SEGMENT DENSITYThis map illustrates the density anddistribution of the Heartland CommunitiesTapestry Segment by households.
LifeMode Group: Cozy Country Living
Heartland Communities6F
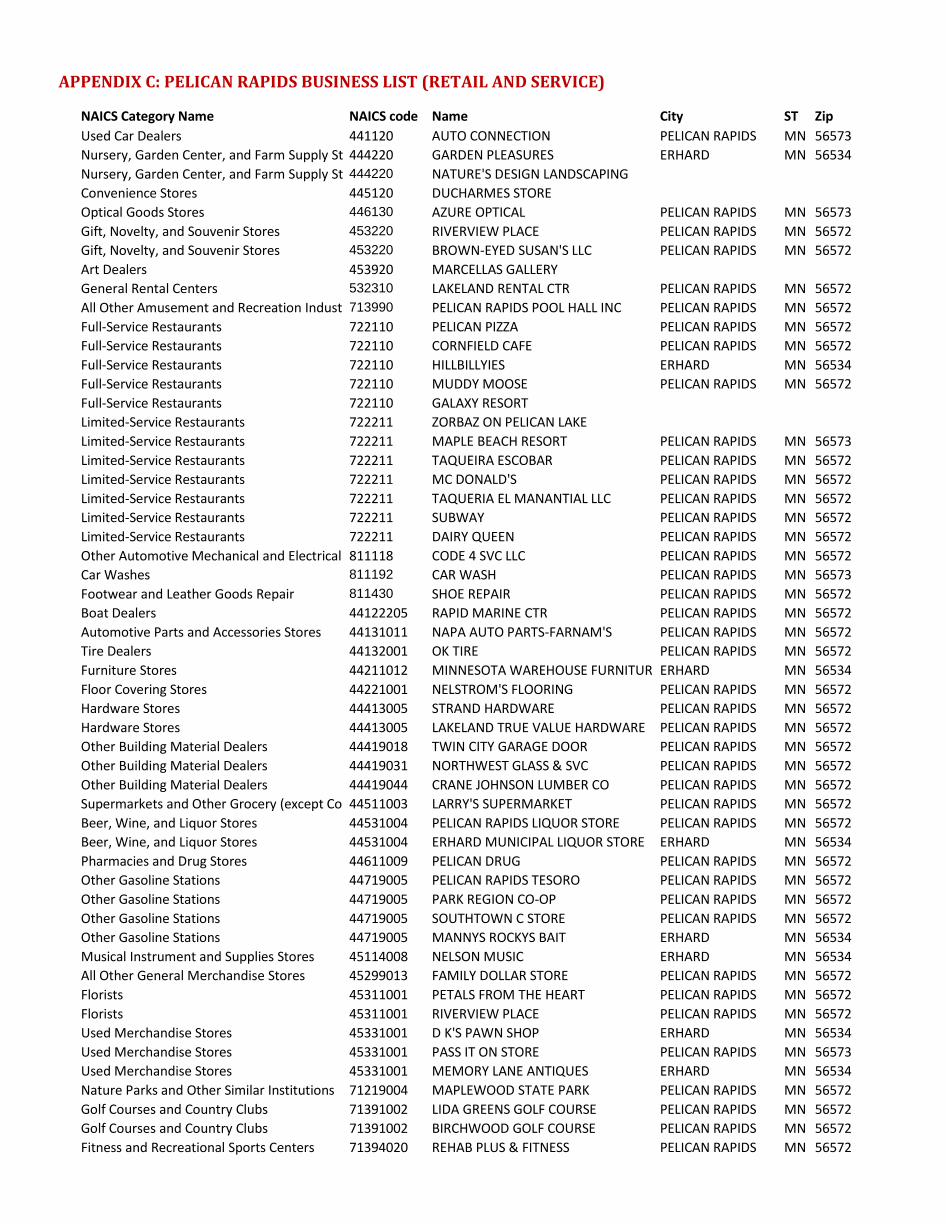
APPENDIX C: PELICAN RAPIDS BUSINESS LIST (RETAIL AND SERVICE)
NAICS Category Name NAICS code Name City ST Zip Used Car Dealers 441120 AUTO CONNECTION PELICAN RAPIDS MN 56573 Nursery, Garden Center, and Farm Supply St 444220 GARDEN PLEASURES ERHARD MN 56534 Nursery, Garden Center, and Farm Supply St 444220 NATURE'S DESIGN LANDSCAPING Convenience Stores 445120 DUCHARMES STORE Optical Goods Stores 446130 AZURE OPTICAL PELICAN RAPIDS MN 56573 Gift, Novelty, and Souvenir Stores 453220 RIVERVIEW PLACE PELICAN RAPIDS MN 56572 Gift, Novelty, and Souvenir Stores 453220 BROWN-EYED SUSAN'S LLC PELICAN RAPIDS MN 56572 Art Dealers 453920 MARCELLAS GALLERY General Rental Centers 532310 LAKELAND RENTAL CTR PELICAN RAPIDS MN 56572 All Other Amusement and Recreation Indust 713990 PELICAN RAPIDS POOL HALL INC PELICAN RAPIDS MN 56572 Full-Service Restaurants 722110 PELICAN PIZZA PELICAN RAPIDS MN 56572 Full-Service Restaurants 722110 CORNFIELD CAFE PELICAN RAPIDS MN 56572 Full-Service Restaurants 722110 HILLBILLYIES ERHARD MN 56534 Full-Service Restaurants 722110 MUDDY MOOSE PELICAN RAPIDS MN 56572 Full-Service Restaurants 722110 GALAXY RESORT Limited-Service Restaurants 722211 ZORBAZ ON PELICAN LAKE Limited-Service Restaurants 722211 MAPLE BEACH RESORT PELICAN RAPIDS MN 56573 Limited-Service Restaurants 722211 TAQUEIRA ESCOBAR PELICAN RAPIDS MN 56572 Limited-Service Restaurants 722211 MC DONALD'S PELICAN RAPIDS MN 56572 Limited-Service Restaurants 722211 TAQUERIA EL MANANTIAL LLC PELICAN RAPIDS MN 56572 Limited-Service Restaurants 722211 SUBWAY PELICAN RAPIDS MN 56572 Limited-Service Restaurants 722211 DAIRY QUEEN PELICAN RAPIDS MN 56572 Other Automotive Mechanical and Electrical 811118 CODE 4 SVC LLC PELICAN RAPIDS MN 56572 Car Washes 811192 CAR WASH PELICAN RAPIDS MN 56573 Footwear and Leather Goods Repair 811430 SHOE REPAIR PELICAN RAPIDS MN 56572 Boat Dealers 44122205 RAPID MARINE CTR PELICAN RAPIDS MN 56572 Automotive Parts and Accessories Stores 44131011 NAPA AUTO PARTS-FARNAM'S PELICAN RAPIDS MN 56572 Tire Dealers 44132001 OK TIRE PELICAN RAPIDS MN 56572 Furniture Stores 44211012 MINNESOTA WAREHOUSE FURNITUR ERHARD MN 56534 Floor Covering Stores 44221001 NELSTROM'S FLOORING PELICAN RAPIDS MN 56572 Hardware Stores 44413005 STRAND HARDWARE PELICAN RAPIDS MN 56572 Hardware Stores 44413005 LAKELAND TRUE VALUE HARDWARE PELICAN RAPIDS MN 56572 Other Building Material Dealers 44419018 TWIN CITY GARAGE DOOR PELICAN RAPIDS MN 56572 Other Building Material Dealers 44419031 NORTHWEST GLASS & SVC PELICAN RAPIDS MN 56572 Other Building Material Dealers 44419044 CRANE JOHNSON LUMBER CO PELICAN RAPIDS MN 56572 Supermarkets and Other Grocery (except Co 44511003 LARRY'S SUPERMARKET PELICAN RAPIDS MN 56572 Beer, Wine, and Liquor Stores 44531004 PELICAN RAPIDS LIQUOR STORE PELICAN RAPIDS MN 56572 Beer, Wine, and Liquor Stores 44531004 ERHARD MUNICIPAL LIQUOR STORE ERHARD MN 56534 Pharmacies and Drug Stores 44611009 PELICAN DRUG PELICAN RAPIDS MN 56572 Other Gasoline Stations 44719005 PELICAN RAPIDS TESORO PELICAN RAPIDS MN 56572 Other Gasoline Stations 44719005 PARK REGION CO-OP PELICAN RAPIDS MN 56572 Other Gasoline Stations 44719005 SOUTHTOWN C STORE PELICAN RAPIDS MN 56572 Other Gasoline Stations 44719005 MANNYS ROCKYS BAIT ERHARD MN 56534 Musical Instrument and Supplies Stores 45114008 NELSON MUSIC ERHARD MN 56534 All Other General Merchandise Stores 45299013 FAMILY DOLLAR STORE PELICAN RAPIDS MN 56572 Florists 45311001 PETALS FROM THE HEART PELICAN RAPIDS MN 56572 Florists 45311001 RIVERVIEW PLACE PELICAN RAPIDS MN 56572 Used Merchandise Stores 45331001 D K'S PAWN SHOP ERHARD MN 56534 Used Merchandise Stores 45331001 PASS IT ON STORE PELICAN RAPIDS MN 56573 Used Merchandise Stores 45331001 MEMORY LANE ANTIQUES ERHARD MN 56534 Nature Parks and Other Similar Institutions 71219004 MAPLEWOOD STATE PARK PELICAN RAPIDS MN 56572 Golf Courses and Country Clubs 71391002 LIDA GREENS GOLF COURSE PELICAN RAPIDS MN 56572 Golf Courses and Country Clubs 71391002 BIRCHWOOD GOLF COURSE PELICAN RAPIDS MN 56572 Fitness and Recreational Sports Centers 71394020 REHAB PLUS & FITNESS PELICAN RAPIDS MN 56572

APPENDIX C: PELICAN RAPIDS BUSINESS LIST (RETAIL AND SERVICE)
NAICS Category Name NAICS code Name City ST Zip Hotels (except Casino Hotels) and Motels 72111002 PELICAN MOTEL PELICAN RAPIDS MN 56572 All Other Traveler Accommodation 72119909 FRAZIERS RESORT PELICAN RAPIDS MN 56572 All Other Traveler Accommodation 72119909 NORTHSHORE RESORT PELICAN RAPIDS MN 56572 All Other Traveler Accommodation 72119909 CROSS POINT RESORT PELICAN RAPIDS MN 56572 All Other Traveler Accommodation 72119909 CRYSTAL LIDA RESORT & RV PARK PELICAN RAPIDS MN 56572 All Other Traveler Accommodation 72119909 LAKE LIZZIE SHORES RESORT PELICAN RAPIDS MN 56572 All Other Traveler Accommodation 72119909 LEISURE LANE RESORT PELICAN RAPIDS MN 56572 All Other Traveler Accommodation 72119909 SOLINGER'S RESORT PELICAN RAPIDS MN 56572 RV (Recreational Vehicle) Parks and Campgr 72121101 FRAZIER MAVIS TRAILER PARK PELICAN RAPIDS MN 56572 Drinking Places (Alcoholic Beverages) 72251117 HILLBILLIES VITTLES & BREW ERHARD MN 56534 General Automotive Repair 81111104 OK TIRE PELICAN RAPIDS MN 56572 General Automotive Repair 81111104 G B EXHAUST & AUTO REPAIR PELICAN RAPIDS MN 56572 General Automotive Repair 81111104 PELICAN TRANSMISSION-AUTO RPR PELICAN RAPIDS MN 56572 General Automotive Repair 81111104 LEROY NELSON GARAGE PELICAN RAPIDS MN 56572 General Automotive Repair 81111104 RAPIDS BRAKE & ALIGNMENT PELICAN RAPIDS MN 56572 General Automotive Repair 81111104 JIMS REPAIR PELICAN RAPIDS MN 56572 General Automotive Repair 81111104 ROGERS REPAIR PELICAN RAPIDS MN 56572 General Automotive Repair 81111104 MAPLEWOOD REPAIR PELICAN RAPIDS MN 56572 General Automotive Repair 81111104 BAUMANS REPAIR PELICAN RAPIDS MN 56572 Automotive Body, Paint, and Interior Repair 81112102 PETE'S BODY SHOP INC PELICAN RAPIDS MN 56572 Automotive Body, Paint, and Interior Repair 81112102 PERRIN AUTO BODY PELICAN RAPIDS MN 56572 Barber Shops 81211101 WEISHAIR'S BARBER & HAIRSTYLNG PELICAN RAPIDS MN 56572 Beauty Salons 81211202 CREATIVE IMPRESSIONS PELICAN RAPIDS MN 56572 Beauty Salons 81211202 BEAUTY CELLAR INC PELICAN RAPIDS MN 56572 Beauty Salons 81211202 ENVY SALON & SPA PELICAN RAPIDS MN 56572 Beauty Salons 81211202 PLUM HAVEN SALON PELICAN RAPIDS MN 56572 Beauty Salons 81211202 CAROL'S BEAUTY SHOP ERHARD MN 56534 Funeral Homes and Funeral Services 81221002 LARSON FUNERAL HOME PELICAN RAPIDS MN 56572 Pet Care (except Veterinary) Services 81291018 K9 CUTTERS PELICAN RAPIDS MN 56572 Pet Care (except Veterinary) Services 81291021 PRETTY PET GROOMING PELICAN RAPIDS MN 56572 Civic and Social Organizations 81341002 OTTERTAIL LODGE 284 PELICAN RAPIDS MN 56572 Civic and Social Organizations 81341003 VETERANS OF FOREIGN WARS PELICAN RAPIDS MN 56572