pemex classification system - unece · reserves new fields strategic challenges existing fields...
TRANSCRIPT

Ing. Gustavo Hernández GarcíaSubdirector de Planeación y Evaluación, Pemex E&P Septiembre 27, 2012
Pemex classification system

www.pep.pemex.com2
Content
• Introduction
• Classification system of resources and reserves
• Historical behavior of resources and reserves
• Final comments

www.pep.pemex.com
Rese
rves
New
fi
elds
Strategic challengesEx
isti
ng f
ield
s
1. Increase the Reserves Replacement Rate
2. Improve the success rate of exploratory wells
3. Increase the ultimate recovery factor
5. Reduce decline production
4. Reduce costs
People
ProcessesTechnologies
6. Accelerate the new production coming from development fields
Knowledgemanagement
Knowledge management,fundamental to face challenges
3

www.pep.pemex.com
Exploration
• Petroleum potential evaluation
• Reserves addition
• Delineation
Development
Exploitation
Commerciality
Reserves
• Petroleum systems
• Probable and possible reserves
• Proved reserves
Developed proved reserves
Production
Income
Each stage of the E&P process generates value
Generated value
4
Projects

www.pep.pemex.com5
Exploratory projects
7 Onshore7 Shallow waters6 Deep waters
20 projects:

www.pep.pemex.com
Main exploitation projects
10. Burgos11. Veracruz12. Cinco Presidentes13. Ébano Pánuco Cacalilao1. Chicontepec --------------- Under evaluation process (water, CO2)14. A. J. Bermúdez ----------- Nitrogen / Steam injection15. Jujo-Tecominoacán ------ Nitrogen16. Cantarell -------------------- Nitrogen17. Ku-Maloob-Zaap ---------- Nitrogen18. Abkatún-Pol-Chuc -------- Under evaluation process (gas, nitrogen)
1. Chicontepec2. Delta del Grijalva3. Crudo Ligero Marino4. Ixtal-Manik5. Yaxché6. Tsimin – Xux7. Ayatsil – Tekel8. Lankahuasa9. Lakach
Pressure Maintenance
OffshoreOnshore
Non-associated gasOil and associated gas
6
Main production projects
Main development projects
1
3
11
10
8175
15 144
18167
9 6
13
212

www.pep.pemex.com7
Content
• Introduction
• Classification system of resources and reserves
• Historical behavior of resources and reserves
• Final comments

www.pep.pemex.com
Classification of prospective resources
8
Prospective resources are those quantities of petroleum estimated, as of a given date, to be potentially recoverable from undiscovered accumulations
Currently the resources are classified like conventional and unconventional
The total resources estimation are based on probabilistic methods and identified the P90, Pmean and P10 calculations
The conventional resources correspond with onshore and offshore prospects
The unconventional resources correspond with shale oil and gas mainly
Remarks
Conventional Unconventional
P(90) – 45.1 P(90) – 30.4
P(mean) - 54.6 P(mean) - 60.2
P(10) – 64.5 P(10) – 93.0
Classification of resources:Billion of oil equivalent

www.pep.pemex.com
Classification of reserves
9
The classification of reserves are based on in the PRMS guidelines
The PRMS was taken as a reference to estimate the country's reserves since the beginning of its establishment in 1997
Proved reserves estimation are based on SEC rules since 2002
In México currently the reserves process take into account internal review, external audit and opinion for approval from regulators
International companies (Netherland Sewell International, DeGolyer & MacNaughton, and Ryder Scott Company), audit the 1P, 2P and 3P reserves
Remarks
Proved (1P) Probable 2P Possible 3P
13.8 12.3 26.2 17.7 43.8
Classification of reserves:Billion oil equivalent

www.pep.pemex.com
Resources and reserves distribution
10
BasinCumm. Prod.
Reserves Prospective Resources
1P 2P 3P Conv. Unconv.
Sureste 44.3 12.1 18.2 24.4 20.1
TampicoMisantla 6.4 1.0 7.0 17.7 2.5 30.7
Burgos 2.3 0.4 0.6 0.8 2.9 12.9
Veracruz 0.7 0.2 0.2 0.2 1.6 0.6
Sabinas 0.1 0.0 0.0 0.0 0.4 16.0
AguasProfundas 0.0 0.1 0.2 0.7 26.6
Plataf.Yucatán 0.5
Total 53.7 13.8 26.2 43.8 54.6 60.2
Billion barrels of crude oil equivalent
28.4
Oil and gas basins
Unconventional resources (Shale Gas)Exploratory
projectsExploitation and
Development projects

www.pep.pemex.com11
Content
• Introduction
• Classification system of resources and reserves
• Historical behavior of resources and reserves
• Final comments

www.pep.pemex.com12
The historical behavior of reserve values shows a clear change of tendency
0
10,000
20,000
30,000
40,000
50,000
60,000
70,000
2000 2001 2002 2003 2004 2005 2006 2007 2008 2009 2010 2011 2012
46.4
Values at January 1st of each yearBillion barrels of crude oil equivalent
58.2 56.253.0
50.0 48.0 46.9
Proved Probable Possible
45.4
Proved reserves (SEC)
Technical and economical reserves (SPE-WPC)
44.5
14.3
15.0
13.8
43.6 43.1
14.8
14.2
14.0
-1.0% -2.0% -2.0% -2.0% -1.2% 0.0%
43.1
+1.8%
43.8
17.7
12.3
13.8
This achievement is based on the increases in reserves due to exploratory results as well as increases in higher recovery factors in fields with development schemes supported by exploitation projects
www.pep.pemex.com
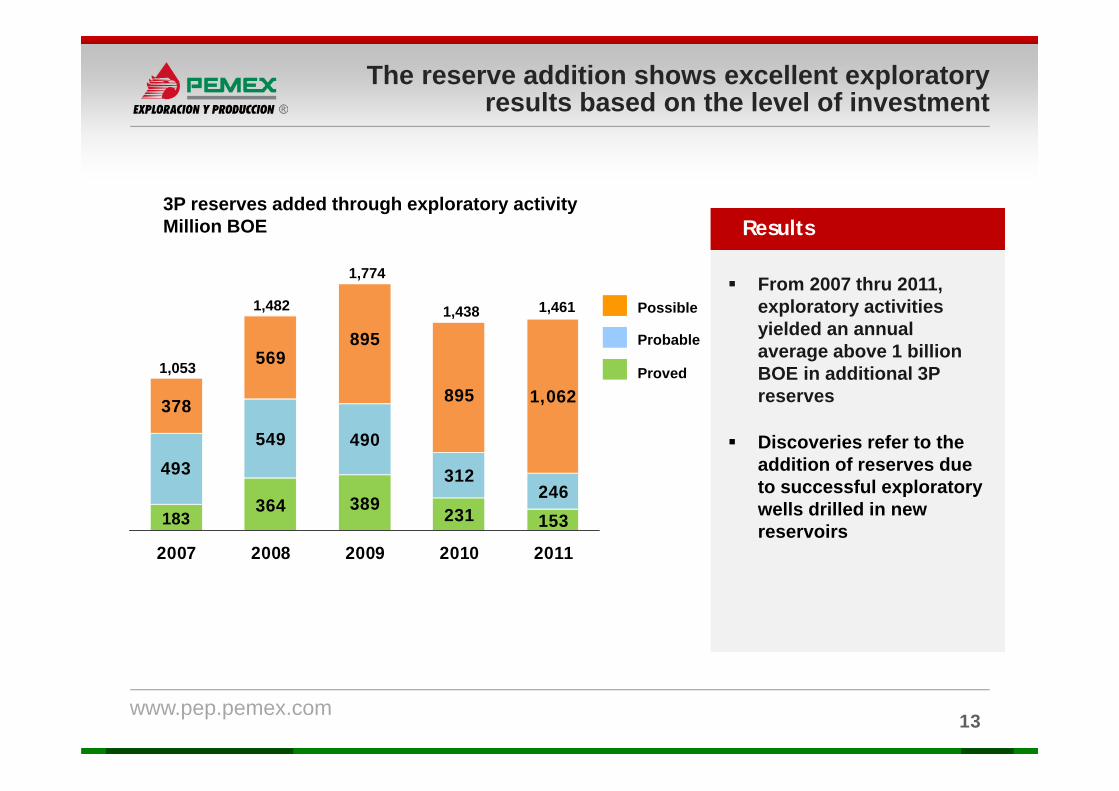
The reserve addition shows excellent exploratory results based on the level of investment
13
Possible
Probable
Proved
183364 389
231 153
493
549 490
312246
378
569895
895 1,062
2007 2008 2009 2010 2011
1,774
1,438
1,053
1,482 1,461 From 2007 thru 2011,
exploratory activities yielded an annual average above 1 billion BOE in additional 3P reserves
Discoveries refer to the addition of reserves due to successful exploratory wells drilled in new reservoirs
3P reserves added through exploratory activityMillion BOE Results

www.pep.pemex.com
Reserves additions (3P) due to discoveries
Million BOEMain discoveries 2006-2012
1,156.7889.4
852.1591.0
464.9340.0335.9
194.6180.9
164.7143.2135.0
122.2112.7111.7104.0
TsiminKayab
XuxAyatsil
TrionPit
KabBricol
LakachPiklisTekelLalail
KuilHomol
TerraPareto
Utsil
From 2006 thru 2012, 17 fields have been discovered with reserves over 100 mmboe
Along this period, the cumulative reserves amounting to 6,249 mmboe
14
Results
500.0250.0
Heavy oilLight oilGas-condensateGas
www.pep.pemex.com
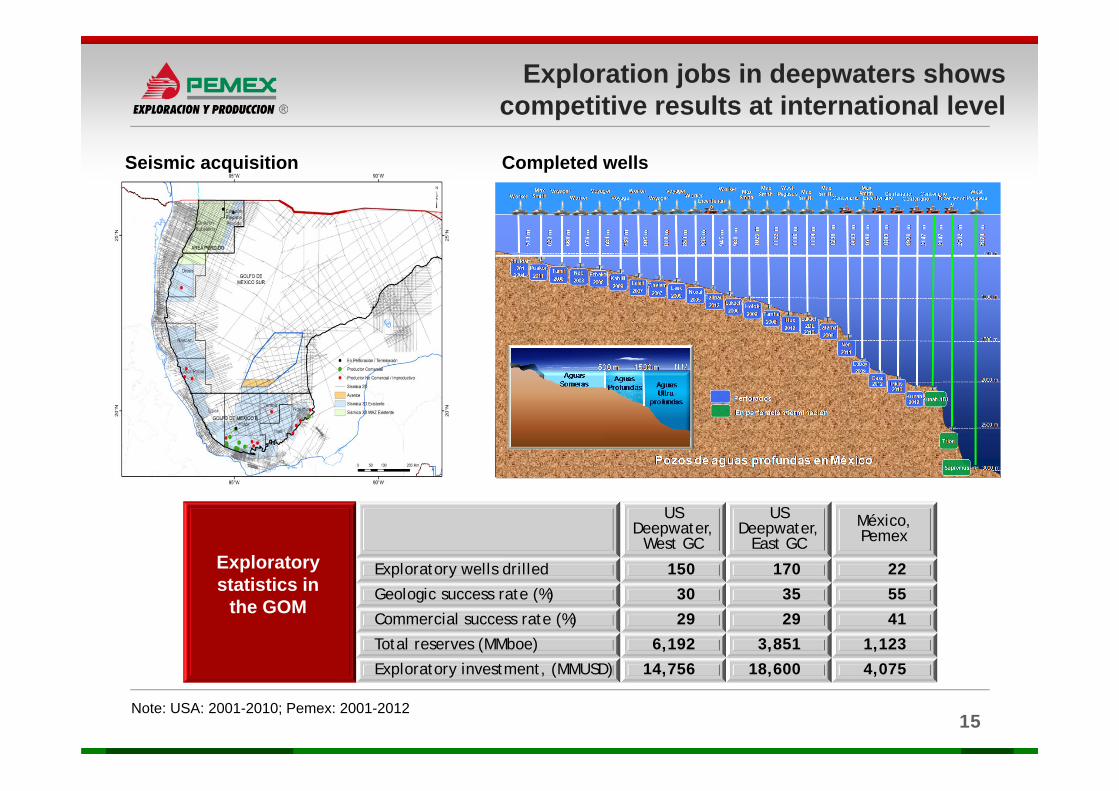
Exploration jobs in deepwaters shows competitive results at international level
15
US Deepwater,
West GC
US Deepwater,
East GCMéxico, Pemex
Exploratory wells drilled 150 170 22
Geologic success rate (%) 30 35 55
Commercial success rate (%) 29 29 41
Total reserves (MMboe) 6,192 3,851 1,123
Exploratory investment, (MMUSD) 14,756 18,600 4,075
Seismic acquisition
Note: USA: 2001-2010; Pemex: 2001-2012
Exploratory statistics in
the GOM
Completed wells

www.pep.pemex.com
1P and 3P reserve replacement rates have been sustainably increased
16
Note: Proved reserves replacement based on SEC rules
-500
0
500
1,000
1,500
2,000
2000 2001 2002 2003 2004 2005 2006 2007 2008 2009 2010 2011 2012
Incorporation
Production
14%
59%
108%
66%
102%
129%
45%
-19%
26% 26%
50%
77%
Millions barrels of crude oil equivalent
86%
104%
101%
138%
100%
3P reserves replacement (only discoveries)
Proved reserves replacement(integrated)
The integrated 1P reserves replacement rate is defined by the quotient of the net addition of proved reserves divided by the total production of period
In 2011, the integrated 1P reserves replacement rate was 101 percent, the highest rate obtained since the adoption of the SEC guidelines
This achievement of 1P replacement rate over 100 percent has allowed, for the first time, compensate each produced barrel from the proved reserves
Results
www.pep.pemex.com17
Content
• Introduction
• Classification system of resources and reserves
• Historical behavior of resources and reserves
• Final comments

www.pep.pemex.com18
Final comments
• The resources and reserves classification are based on the PRMS guidelines since 1997 and this process has allowed give consistency and confidence at Pemex’s booking
• Currently, proved reserves are based on SEC rules and the probable and possible estimation are based on PRMS guidelines
• Since 1999 Pemex publish their resources and reserves both editing publications and thru his media portal
• Historical behavior of reserves shows good tendency and the target is to maintenance the incremental behavior in the future
• Exploratory activity in deep waters and gas – oil shale will be essential in order to achieve the incorporation reserves targets