pemex_6-2012 global chlor-alkali review
DESCRIPTION
Chlor-Alkali market analysisTRANSCRIPT

7/18/2019 PEMEX_6-2012 Global Chlor-Alkali Review
http://slidepdf.com/reader/full/pemex6-2012-global-chlor-alkali-review 1/15
© 2012, IHS Inc. No portion of this presentation may be reproduced, reused, or otherwise distributed in any form without prior written consent.
Chlor-Alkali: Co-Products, not Co-Demand
Water
Salt
Electricity
Health Care
Water Treatment
Pharmaceuticals
Electronics
Plastics (PVC)
Metals: Aluminum, TiO2
Food Production
Processing & Packaging
Home/Gov’t Construction
Pulp and Paper Production
Auto & Truck Production
Flame Retardant Materials
Cell
Chlorine
Hydrogen
CausticSoda
1.0 ton
1.
1 ton
The combined output of
1.0 Ton o f Chlor ine and 1.1 Ton of Caustic = ECU ( Electro -Chemical Unit )
Caust ic Supply is Set by Chlor ine Produc t ion
21

7/18/2019 PEMEX_6-2012 Global Chlor-Alkali Review
http://slidepdf.com/reader/full/pemex6-2012-global-chlor-alkali-review 2/15
© 2012, IHS Inc. No portion of this presentation may be reproduced, reused, or otherwise distributed in any form without prior written consent. 22
2011 Latin America Caustic End Uses
Pulp & Paper 20%
Alumina31%
Organics11%
Soaps/Detergents/
Textiles12%
Inorganics5%
Water Treatment
4%
Others
20%
2011 Domestic Demand = 3.9 Mil l ion Dry Metr ic Ton s

7/18/2019 PEMEX_6-2012 Global Chlor-Alkali Review
http://slidepdf.com/reader/full/pemex6-2012-global-chlor-alkali-review 3/15
© 2012, IHS Inc. No portion of this presentation may be reproduced, reused, or otherwise distributed in any form without prior written consent. 23
Demand Growth Close Up
-4.0
-2.0
0.0
2.0
4.0
6.0
2006 2007 2008 2009 2010 2011 2012 2013 2014 2015 2016
N. America S. America Europe Africa/Middle East/Indian Subcontinent Asia
Caustic Soda Demand Year-on-Year, Million Metric Tons

7/18/2019 PEMEX_6-2012 Global Chlor-Alkali Review
http://slidepdf.com/reader/full/pemex6-2012-global-chlor-alkali-review 4/15
© 2012, IHS Inc. No portion of this presentation may be reproduced, reused, or otherwise distributed in any form without prior written consent. 24
2011 Latin America Caustic SodaSupply Demand Future
0.0
1.0
2.0
3.0
4.0
5.0
2006 2007 2008 2009 2010 2011 2012 2013 2014 2015 2016
Production (0.1/2.5) Domestic Demand (3.4/3.8)
Total Capacity (1.4/1.6)
Million Dry Metric Tons
(% AAGR = 06-11/11-16)

7/18/2019 PEMEX_6-2012 Global Chlor-Alkali Review
http://slidepdf.com/reader/full/pemex6-2012-global-chlor-alkali-review 5/15
© 2012, IHS Inc. No portion of this presentation may be reproduced, reused, or otherwise distributed in any form without prior written consent. 25
Mexico Caustic Net Trade
-14
-12
-10
-8
-6
-4
-2
0
2
46
09 A J O 10 A J O 11 A J O 12
Exports Imports Net Trade
Thousand Dr Metric Tons

7/18/2019 PEMEX_6-2012 Global Chlor-Alkali Review
http://slidepdf.com/reader/full/pemex6-2012-global-chlor-alkali-review 6/15
© 2012, IHS Inc. No portion of this presentation may be reproduced, reused, or otherwise distributed in any form without prior written consent.
• South America’s
demand will likelygrow by almost
700,000 metric tonsfrom 2011 to 2016
Latin America’s Growing Demand
Alpart (2013)
Alumina do Para (2014)
Suzano (2013, 2014)
Veracel (2013)
Fibria (2014, 2015)Eldorado (2012)
Klabin Kimberly
(2015)CMPC (2015)
Montes del Plata (2013)
New Pulp Mill Capacity
New Alumina Refinery Capacity
LEGEND
26

7/18/2019 PEMEX_6-2012 Global Chlor-Alkali Review
http://slidepdf.com/reader/full/pemex6-2012-global-chlor-alkali-review 7/15
© 2012, IHS Inc. No portion of this presentation may be reproduced, reused, or otherwise distributed in any form without prior written consent.
Electricity$152
Salt $32
Variable $14
Fixed $114
27
U.S. ECU Cash Costs: Throw Me a Lifebuoy
2000 TotalECU CashCost = $312
All costs in 2012 constant dollars.
7/18/2019 PEMEX_6-2012 Global Chlor-Alkali Review
http://slidepdf.com/reader/full/pemex6-2012-global-chlor-alkali-review 8/15
© 2012, IHS Inc. No portion of this presentation may be reproduced, reused, or otherwise distributed in any form without prior written consent. 28
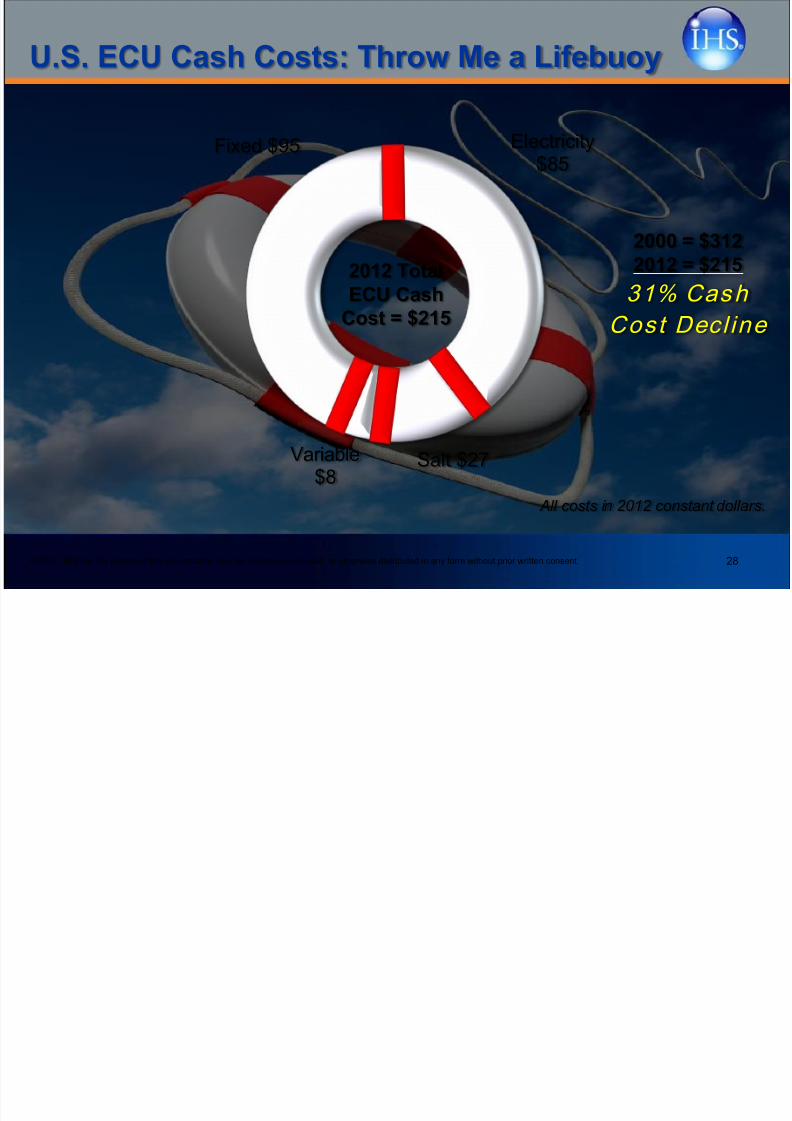
U.S. ECU Cash Costs: Throw Me a Lifebuoy
Electricity$85
Salt $27Variable$8
Fixed $95
2000 = $3122012 = $215
31% Cash
Cost Decl ine
All costs in 2012 constant dollars.
2012 TotalECU CashCost = $215

7/18/2019 PEMEX_6-2012 Global Chlor-Alkali Review
http://slidepdf.com/reader/full/pemex6-2012-global-chlor-alkali-review 9/15
© 2012, IHS Inc. No portion of this presentation may be reproduced, reused, or otherwise distributed in any form without prior written consent. 29
ECU Cash Costs: Shale Gas Improves U.S.
100
150
200
250
300
350
400
450
500
550600
2006 2007 2008 2009 2010 2011 2012 2013 2014 2015 2016
USGC ECU Cash Costs WEP ECU Cash Costs
NEA ECU Cash Costs CHI ECU Cash Costs
Cash Costs, Dollars Per Metric Ton
Middle East
2011 Electricity Costs(Cents/kWh)
North America = 3.0Europe = 8.4Brazil = 7.3
7/18/2019 PEMEX_6-2012 Global Chlor-Alkali Review
http://slidepdf.com/reader/full/pemex6-2012-global-chlor-alkali-review 10/15
© 2012, IHS Inc. No portion of this presentation may be reproduced, reused, or otherwise distributed in any form without prior written consent.
-1.00
-0.75
-0.50
-0.25
0.00
0.25
0.50
0.75
1.00
13.0
13.5
14.0
14.5
15.0
15.5
16.0
16.5
17.0
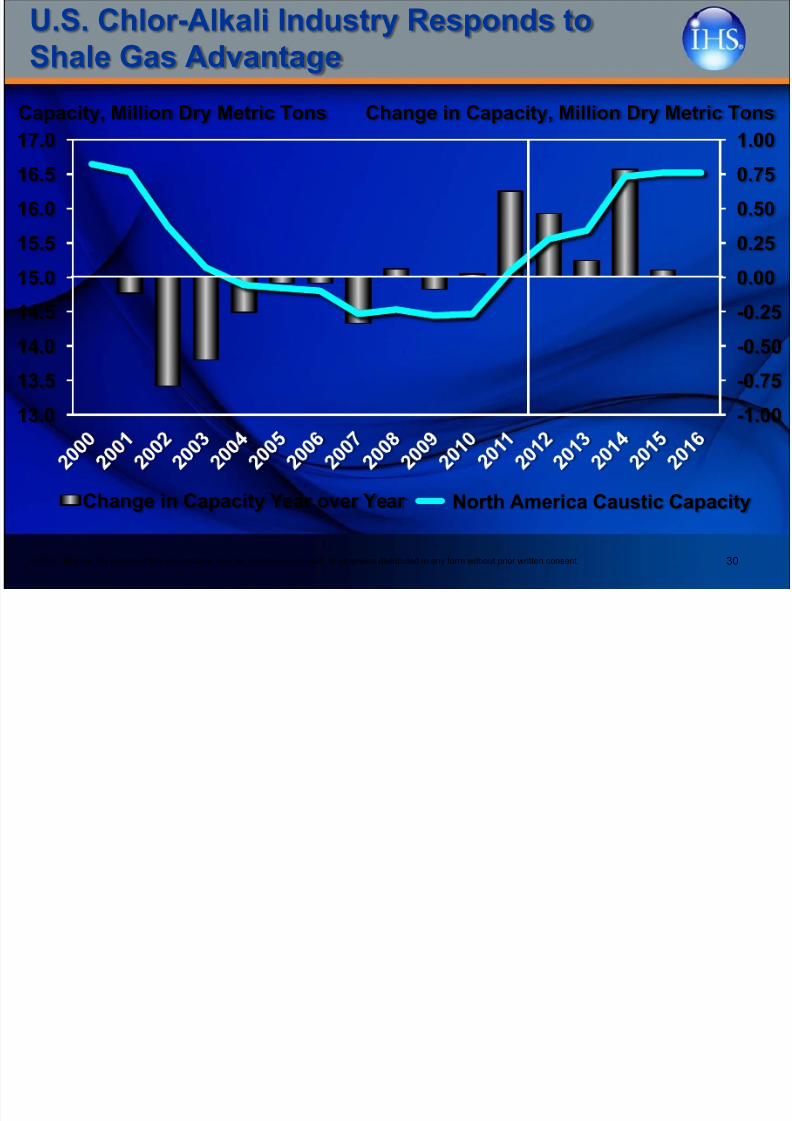
Change in Capacity Year over Year North America Caustic Capacity
Capacity, Million Dry Metric Tons Change in Capacity, Million Dry Metric Tons
U.S. Chlor-Alkali Industry Responds toShale Gas Advantage
30
North America Caustic Capacity

7/18/2019 PEMEX_6-2012 Global Chlor-Alkali Review
http://slidepdf.com/reader/full/pemex6-2012-global-chlor-alkali-review 11/15
© 2012, IHS Inc. No portion of this presentation may be reproduced, reused, or otherwise distributed in any form without prior written consent. 31
U.S. Producers- Net Exports Rising
0%
2%
4%
6%
8%
10%
12%
14%
0.0
0.5
1.0
1.5
2.0
2.5
3.0
3.5
2006 2007 2008 2009 2010 2011 2012 2013 2014 2015 2016
Imports Exports Net Exports as % of Total Demand
Million Dry Metric Tons Percentage

7/18/2019 PEMEX_6-2012 Global Chlor-Alkali Review
http://slidepdf.com/reader/full/pemex6-2012-global-chlor-alkali-review 12/15
© 2012, IHS Inc. No portion of this presentation may be reproduced, reused, or otherwise distributed in any form without prior written consent. 32
Global Outlook for Caustic Soda Flows
2011
2006
2016
Net Trade Flows
United States
7 7 3
1 3 2 0
2 5 1 3
South America
1 3 2 1
1 9 1 5
2 4 5 7
Europe
5 1 1
5 2 5
4 1 6
Global Caustic Net Trade, Thousand Dry Metric Tons
Northeast Asia
2 5 0 9
3 3 6 6
3 9 8 6
Southeast Asia
2 2 0 3
2 6 4 1
3 2 3 3
Middle East
6 5 1
5 7 0
7 1 0

7/18/2019 PEMEX_6-2012 Global Chlor-Alkali Review
http://slidepdf.com/reader/full/pemex6-2012-global-chlor-alkali-review 13/15
© 2012, IHS Inc. No portion of this presentation may be reproduced, reused, or otherwise distributed in any form without prior written consent. 33
Arbitrage Determines a ‘Global Price’
CFR Aus tral ia
$430 FOBMiddle East
$450 FOB
Northeast Asia
$410 FOB
USGC
$94
February 2012 Spot Caustic Prices

7/18/2019 PEMEX_6-2012 Global Chlor-Alkali Review
http://slidepdf.com/reader/full/pemex6-2012-global-chlor-alkali-review 14/15
© 2012, IHS Inc. No portion of this presentation may be reproduced, reused, or otherwise distributed in any form without prior written consent. 34
Price: The Battle Zone
0
100
200
300
400
500
600
700
800
00 01 02 03 04 05 06 07 08 09 10 11 12 13 14 15 16
U.S. AAP Caustic USGC
West Europe Contract (Delivered)
NEA Contract* (Delivered Taiwan)
Dollars Per Dry Metric Ton
* Excludes China

7/18/2019 PEMEX_6-2012 Global Chlor-Alkali Review
http://slidepdf.com/reader/full/pemex6-2012-global-chlor-alkali-review 15/15
© 2012, IHS Inc. No portion of this presentation may be reproduced, reused, or otherwise distributed in any form without prior written consent. 35
Beneath the Waves: Price Support
60
70
80
90
100
110
120
130
0
100
200
300
400
500
600
Jan-10 May-10 Sep-10 Jan-11 May-11 Sep-11 Jan-12
FOB NEA Spot CFR SEA Spot Dubai Crude Oil
Caustic, U.S. Dollars per DMT Crude, U.S. Dollars per Barrel
2010 Avg = $78 per Barrel
2011 Av g = $106 per B arrel
Japan Tsunam i
Tosoh Explos ion