penergetic the natural biotechnology with the impulse of
TRANSCRIPT

penergetic the natural biotechnology
With theimpulse of nature

Dear Readers,
Nature demands that we treat her with care. We have become increasingly aware that overuse and aggressive treatments harm soils, plants and animals and dis-rupt their systems.
The magazine “Geo Kompakt”, issue 5 – 12/05, Geheimnis Natur (The secrets of nature), tells us wondrous things about how plants communicate with each other, but also with insects, birds and bats. German television recently reported on research that has been carried out on the communication between the roots of trees in a forest.
18 years ago, Penergetic International AG started their research and development work on a process for transferring biological information onto carrier materials. What seemed slightly esoteric at the time has now been accepted into the mainstream. The principles of biodynamic agriculture are, not least, also based on the targeted use of relevant information on the crops’ reproduc-tion (yield development) and self-protection (health). The results from various research institutions at faculties of biological science underpin the positive impact of using gentle, bioactive materials. Hundreds of documented trials are testament of the positive and gentle cultivation of soil, of qualitative and quantitative crop improvement in Europe, South America, Canada and Southeast Asia.
Large farms benefit from a reduced use of chemical fertilizers. In different area of this world, overfertilized fields are recovering. Wheat, potatoes, coffee plants, grape vines respond to the information that has been transferred through the Penergetic system with healthy growth and high yields.
Penergetic International AG is a family-run company based in Romanshorn, Switzerland. The experience of three generations of the family is reflected in the continuous develop-ment of the products. Many long-standing partners distribute Penergetic products for animals, plants, soil, liquid manure, compost and water locally and advise customers in how to optimize their efficiency. Penergetic has accepted the challenge to solve a variety of agricultural issues and is developing a broad range of biologically active and gentle materials. This documentation of detailed results in the most diverse areas and impres-sive photographic material on the achieved results reflects Penergetic International AG’s considerable contribution to improving the situation of worldwide food production.
Paul Meiler
“ If you want to find the secrets of the universe, think in terms of energy, frequency and vibration ...” Nikola Tesla

Soil / penergetic b
The ProductPractical experience reportsObservation in soil structure in the U.S.A.
Soil fertility in BrazilAlkaline soil in Canada
Penergetic InternationalCover CropsPenergetic Products
Livestock / penergetic tThe ProductPractical experience reportsMilk goat farm in France Dairy Cows in Costa Rica Dairy farm Willenbring, U.S.A.
Carcass quality in Thailand
Compost / penergetic k
Water vitalisation / AquaKat
The ProductPractical experience reportsManure composting in CanadaComposting in Canada
The ProductPractical experience reportsDairy Farms in CanadaHerbicide spray in GermanySwine Farms in the U.S.A.
Manure / penergetic g
The ProductPractical experience reportsSlurry in South KoreaManure Lagoon in the U.S.A.
Observation in slurry in FinlandSuckler Cow Manure in SwitzerlandFloating layer in Switzerland
Penergetic Technology
Plants / penergetic p
The ProductPractical experience reportsSoybean in BrazilSoybean in Brazil – Photos Corn in the U.S.A.
Corn in Sri LankaCorn in CanadaAlfalfa in Central California, U.S.A.
Alfalfa in the U.S.A. Potatoes in South AfricaPotatoes in Canada Cherry in ChileRice in Costa RicaCarrots in BrazilVegetables in Abu DhabiCotton in GreeceViticulture in AustriaWine in AustriaWheat, oat and rape in the U.K.
Coffee in Brazil
—
—
—
—
—
—
—
—
—
—
—
—
—
—
—
—
—
—
—
—
—
44
48
50
52
56
58
58
60
62
66
70
78
81
86
88
91
96
101
38
40
40
42
36
4
6
34
47
49
51
49
55
57
59
61
65
69
77
80
85
87
90
95
100
103
39
41
41
43
37
5
33
35
—
—
—
—
—
—
—
—
—
—
—
—
—
—
—
—
—
—
—
106
110
112
114
120
126
128
130
132
136
138
142
144
144
104
118
134
140
146
109
111
113
117
126
127
129
131
133
137
139
143
145
145
105
119
135
141
147
—
—
—
—
—

— 76
These may be enormous figures, but if we look at the global population of around 8 billion people, whose food comes from those 11% of surface area used for agri cultural purposes, then we might get an idea of how important food production is. Unfortunately, this pressure to produce enough food, has an adverse effect on food production standards. The focus has been increasingly on quantity rather than quality. This has long-lasting effects on the soil, plants, animals and, consequently, on us humans. In addition, approximately 6 million hectares of agricultural land are lost to erosion, salinization, deserti fi cation or building development. Change is urgently needed and penergetic products can make an important contribution that will also yield commercial benefits.
Penergetic International AG is leading the change. Its vision is to think of future generations today and to drive the smart agricultural revolution. This is already being implemented in many countries! penergetic products were developed to promote a sustainable, high-
performing and efficient agriculture. In this way, the company wants to achieve its goal of saving resour ces and optimally utilizing existing potentials, and thus achieve the sustainable, ecologically sound, economically viable and independent agriculture of the future.
The penergetic product range comprises penergetic b – for soil penergetic p – for plants penergetic t – for animals penergetic g – for liquid manure penergetic k – for compost and
livestock bedding AquaKat – for water vitalization
This product range tackles the root causes rather than just relieving the symptoms. At the same time, the individual products form one large system in which they support each other.
PenergeticInternational
Agriculture is one of the oldest economic sectors and most important occupations of mankind. Around 5.6 billion hectares or 11% of the Earth’s surface are used for agricultural purposes. More than 40% of all employees worldwide work in this sector.

— 98
Cover Crops
Cover crop has been used in soil conservation since ancient times. During the collaboration with Dr. Ademir Calegari, Penergetic noted that cover crop and no-till methods have additional positive effects when penergetic products are used. For this reason, we want to introduce the different areas of applications for cover crops and contribute further to developing smart agricultural methods.
Dr. Ademir CalegariSoil Scientist ResearcherSenior Agronomist IAPARLondrina, PR Brazil
A milestone in agriculture
The introduction of these species, isolated or in cocktails (mix), are fundamental tools for the improvement of the crop rotation system and for the development of a no till system with quality.The adequate use of these species certainly
will contribute to the soil protection, improvement of physical, chemical and biological attributes, as well as promoting greater biodiversity in the production systems, contributing to a smarter and sustainable agriculture.
All the information comprised can be applied to the plots in the rural areas, after an appropriate diagnosis of the local conditions for the implementation of cover crops species plants that best fit to the specifically cropping / farming systems according to the need of soil and commercial crops.
Spring – Summer cover crops
Pearl Millet (Pennisetum glaucum)Crotalaria spectabilis (Crotalaria spectabilis)Crotalaria ochroleurca (Crotalaria ochroleuca)Crotalaria juncea (Crotalaria juncea)Buckwheat (Fagopyrum esculentum)Sunflower (Helianthus annuus)Finger millet (Eleusine coracana)Brachiaria ruziziensis (Urochloa ruziziensis)Dwarf pigeonpea (Cajanus cajan)Autumn – Winter cover crops
Oilseed Radish (Raphanus sativus)Common Vetch (Vicia sativa)Hairy Vetch (Vicia villosa)Rye (Secale cereale)White Lupine (Lupinus albus)Black Oat (Avena strigosa)Field Pea (Pisum sativum ssp. Arvense)Consortium, cocktail and mix of cover crops
Amount of seeds (kg/ha)MarkingsGeneral observationsSome additional cover crops in the U.S.A. and in Europe
10 — 11
10 — 11
12 — 13
12 — 13
14 — 15
14 — 15
16 — 17
16 — 17
18 — 19
18 — 19
20 — 21
20 — 21
22 — 23
22 — 23
24 — 25
24 — 25
26 — 27
26 — 27
26 — 27
28 — 33

— 1110
Importance of the projectRedeem of soil health
To provide the soil with a high productive potential for crops through balance in their chemical, physical and biological attributes.
Integrating tools that contribute to a better management of the soil-plant-water system and harmonize the various components of the production system
Massive adoption of different cover crops (isolated or cocktails) according to needs identified by the diagnosis of each area
Integrated crop-livestock-forestry Systems (CLFS)
Technologies in bioactivation Biological assets
Diversification, combination and rotation of crops
Customized evaluation for each property Analysis of plant tissue for determination
of nutrient contents Return to the true no till system on straw with quality
Soil protection and erosion risk reduction Elevation in infiltration rates and water
retention in the soil profile Increase of organic matter Increased availability of nutrients Increase in macro-, meso-, microfauna
and flora populations Less occurrence and propagation of weeds
Project Living Soil
What is the Project Living Soil (PLS)?A tool that works par excellence for the bioactivation of the productive systems(soil and plant) through the cover crops.
The “Living Soil Project” is an initiative of the WebBio Academy in Brazil, which makes it possible to identify select and at field level, alternatives, strategies and management practices of sustainable agricultural productions that promote a better balance between the soil-water-plant relationship. This shouldlead to greater productivity and profitability with a minimal environmental impact, providing a better and more intelligent use of the natural resources and greater rationality in the use of the necessary inputs to the means of agricultural production.
soil water plant
Action strategiesDiagnostic of the area
Before planting Standard georeferenced soil analyzes
of 0 – 10 cm, 0 – 20 cm, 20 – 40 cm and nematological analyzes for all treatments.
During the growth of coverage Biological evaluations (nematodes and
microorganisms) Periodical measuring of the vegetative
growth of plants Evaluation of root growth and soil profile
effects (compaction), through the opening of trenches
Evaluation of the dry matter of cover crops, which should be carried out in the full flowering of the plants, before the accomplishment of the management (mechanical and / or chemical)
Evaluation of the suppression of invasive (weed) plant populations
After coverage management Evaluation of qualitative soil attributes
(chemical, physical and biological)
As a strategic tool for better results, the pener getic b bio-activator for soil should be applied in total area before PLS implantation. Agronomic and economic evaluations will be carried out in all areas of the PLS.
Implantation of summer crops on the PLSThe crops should follow the recommendation of fertilization and soil correction by the technical team, and the use of the bio- activators penergetic b for soil in the imple - mentation of the project and penergetic p for plants during the development of the crop is recommended.
HarvestThe cover crop areas will be compared to the management used by the farmer. Summer crops will be harvested (soybean, corn, cotton, beans, etc.) over the crops and compared to the farmer’s control areas. These evaluations should be conducted in the same locations (side by side).
Expected results Recuperation of soil health by promoting
the rebalancing of biota through No Till System with quality (including cover crops, crop rotation) and the use of tools that promote the bioactivation.
Adequate and rational use of inputs, reducing production costs and increasing the profitability of the agricultural activity.
Contribution to the development of sustain-able production systems, improving the quality of the lives of those who consume and of those who produce food.
“ The project will last three years in the same area, covering the main Brazilian productive states.”

— 1312
Crotalaria spectabilisSpring – Summer Soil Covers
Identification Common name Crotalaria spectabilis
Scientific name Crotalaria spectabilis
Family Fabaceae (Leguminous)
Characteristics Weight of 1,000 seeds (grams) 16 to 19
Root system branched-penroot
Height (m) 1,0 a 1,5
Growing habit shrubby erect
Flowering (days) 110 to 140
Cycle (days) 170 to 180
Green mass (mt / ha) 20 to 30
Dry mass (mt / ha) 4 to 6
Frost tolerance Tolerant
Seeding season Late spring – early summer
Seeding In line (kg / ha) 12 to 15
throwing sowing (kg / ha) 15
In mixtures with 2 to 3 coverages (kg / ha) 10
In mixtures with 4 to 6 coverages (kg / ha) 8
Consortium with corn In line (kg / ha) 10
Throwing sowing (kg / ha) 20
Nematodes1 Pratylenchus brachyurus RF < 1
Meloidogyne incognita RF < 1
Meloidogyne javanica RF < 1
Heterodera glycines RF < 1
Rotilenchulus reniformis Susceptible
Pratylenchus coeae RF < 1
Pratylenchus zea RF < 1
Recycling of nutrients Nitrogen (% in dry matter)2 1,97 to 3,30
Phosphorus P2O5 (% in dry matter) 0,07 to 0,25
Potassium K2O (% in dry matter) 0,78 to 1,78
Indications Benefits: Reduces nematode population.
Attention points: Difficult control of plants out of stage.
RF = reproduction factor
Pearl millet Spring – Summer Soil Covers
Identification Common name Millet
Scientific name Pennisetum glaucum
Family Poaceae (Grasses)
Characteristics Weight of 1,000 seeds (grams) 3,7 a 4
Root system Fasciculated
Height (m) 1,5 a 2,5
Growing habit Erect thicket
Flowering (days) 45 to 50
Cycle (days) 130 to 140
Green mass (mt / ha) 50 to 60
Dry mass (mt / ha) 8,0 to 15
Frost tolerance Susceptible
Seeding season Late spring – early summer
Seeding In line (kg / ha)
throwing sowing (kg / ha)
In mixtures with 2 to 3 coverages (kg / ha)
In mixtures with 4 to 6 coverages (kg / ha)
Consortium with corn In line (kg / ha) –––––
throwing sowing (kg / ha) –––––
Nematodes1 Pratylenchus brachyurus RF < 1
Meloidogyne incognita RF < 1
Meloidogyne javanica RF < 1
Heterodera glycines RF < 1
Rotilenchulus reniformis RF < 1
Pratylenchus coeae –––––
Pratylenchus zea –––––
Recycling of nutrients Nitrogen (% in dry matter)2 0,34 a 3,40
Phosphorus P2O5 (% in dry matter) 0,13 a 0,29
Potassium K2O (% in dry matter) 1,05 a 3,80
Indications Benefits: Little picky in phosphorus. Reduces fusarium and rhizoctonia.
Attention points: Can increase population of caterpillars.
RF = reproduction factor

— 1514
Crotalaria ochroleurca Spring – Summer Soil Covers
Identification Common name Crotalária ochroleuca
Scientific name Crotalaria ochroleuca
Family Fabaceae (Leguminous)
Characteristics Weight of 1,000 seeds (grams) 6 to 8
Root system profound penroot
Height (m) 1,5 to 2,0
Growing habit shrubby erect
Flowering (days) 120 to 135
Cycle (days) 125 to 135
Green mass (mt / ha) 20 to 30
Dry mass (mt / ha) 7 to 10
Frost tolerance Susceptible
Seeding season Late spring – early summer
Seeding In line (kg / ha) 10
throwing sowing (kg / ha) 12
In mixtures with 2 to 3 coverages (kg / ha) 10
In mixtures with 4 to 6 coverages (kg / ha) 8
Consortium with corn In line (kg / ha) 5 to 8
throwing sowing (kg / ha) 20% more
Nematodes1 Pratylenchus brachyurus RF < 1
Meloidogyne incognita Not hostess
Meloidogyne javanica Not hostess
Heterodera glycines RF < 1
Rotilenchulus reniformis RF < 1
Pratylenchus coeae –––––
Pratylenchus zea –––––
Recycling of nutrients Nitrogen (% in dry matter)2 0,80 to 1,25
Phosphorus P2O5 (% in dry matter) 0,06 to 0,08
Potassium K2O (% in dry matter) 0,50 to 0,87
Indications Benefits: Fast growth, pivoting roots, soil reclaimer, high biomass
Attention points: Attention to the management of vegetation before full bloom (increase fibers), which can make it difficult to plant the later culture.
RF = reproduction factor
Crotalaria junceaSpring – Summer Soil Covers
Identification Common name Sunn Hemp
Scientific name Crotalaria juncea
Family Fabaceae (Leguminous)
Characteristics Weight of 1,000 seeds (grams) 50
Root system deep taproot
Height (m) 2,0 to 3,0
Growing habit shrubby erect
Flowering (days) 70 to 130
Cycle (days) 170 to 180
Green mass (mt / ha) 35 to 60
Dry mass (mt / ha) 10 to 15
Frost tolerance Susceptible
Seeding season Late spring – early summer
Seeding in lines 25 (kg / ha)
broadcast sowing 30 (kg / ha)
Spacing between rows (25 to 50 cm) 25 to 30 (seeeds / linear m)
In mixtures with 2 to 3 crops 10 to 12 (kg / ha)
In mixtures with 4 to 6 crops 8 to 10 (kg / ha)
Intercropping with corn in lines 16 (kg / ha)
broadcast sowing 20% more
Nematodes1 Pratylenchus brachyurus Susceptible
Meloidogyne incognita Susceptible / Resistent mod.
Meloidogyne javanica RF < 1
Heterodera glycines RF < 1
Rotilenchulus reniformis RF < 1
Pratylenchus coffeae –––––
Pratylenchus zea –––––
Recycling of nutrients Nitrogen (% in dry matter)2 1,13 to 4,40
Phosphorus P2O5 (% in dry matter) 0,09 to 0,37
Potassium K2O (% in dry matter) 0,57 to 3,37
Indications Benefits: High nitrogen fixing capacity. Soil recovering and improvement. Allopathic effects on several invasive plants (weeds)
Attention points: Hostesses of Pratylenchus brachyurus, and some fungi. Biomass when incorporated, effects of tissue with glucosinolates are transformed into isothiocyanates and control nematodes (Pratylenchus, and others) and soilborne diseases trough “biofumiga-tion”. These molecules are volatile and toxic to soil microorganisms and nematodes.
RF = reproduction factor

— 1716
Buckwheat Spring – Summer Soil Covers
Identification Common name Buckwheat
Scientific name Fagopyrum esculentum
Family Polygonaceae
Characteristics Weight of 1,000 seeds (grams) 32 to 37
Root system Vigorous Taproot
Height (m) 0,6 to 1,2
Growing habit Erect
Flowering (days) 35 to 50 days
Cycle (days) 75 to 85
Green mass (mt / ha) 15 to 28
Dry mass (mt / ha) 3 to 6
Frost tolerance Susceptible
Seeding season Late spring – summer
Seeding in lines 40 to 60 (kg / ha)
broadcast sowing 20% more
Spacing between rows (17 to 40 cm) 25 a 30 (seeeds / linear m)
In mixtures with 2 to 3 crops 18 to 25 (kg / ha)
In mixtures with 4 to 6 crops 15 to 18 (kg / ha)
Intercropping with corn in lines 30 to 40 (kg / ha)
broadcast sowing 20% more
Nematodes1 Pratylenchus brachyurus Not hostess
Meloidogyne incognita Not hostess
Meloidogyne javanica Not hostess
Heterodera glycines Not hostess
Rotilenchulus reniformis –––––
Pratylenchus coffeae –––––
Pratylenchus zea –––––
Recycling of nutrients Nitrogen (% in dry matter)2 1,80 to 2,01
Phosphorus P2O5 (% in dry matter) 0,20 to 0,31
Potassium K2O (% in dry matter) 3,00 to 3,71
Indications Benefits: The deep roots with high amount of mycorrhiza fungi make support long drought period. The dense, fibrous roots produce mild acids that release nutrients from the soil. Quick soil cover, efficient weed control, nectar for pollinators and beneficial insects, topsoil loosening rejuvenator for low-fertility soils. Excellent in beekeeping (high amount of pollen and nectar). The flowers attract beneficial insects that parasitize aphids, mites and other pests. Including hover flies (Syrphidae), predatory wasps, minute pirate bugs, insidious flower bugs, tachinid flies and lady beetles.
Attention points: Weeds can grow in low plant population.
RF = reproduction factor
SunflowerSpring – Summer Soil Covers
Identification Common name Sunflower
Scientific name Helianthus annuus
Family Compositae
Characteristics Weight of 1,000 seeds (grams) 50 to 95
Root system branched-tap root
Height (m) 1,8 to 3,0
Growing habit erect
Flowering (days) 60 to 80
Cycle (days) 70 to 120
Green mass (mt / ha) 40 to 70
Dry mass (mt / ha) 7 to 15
Frost tolerance Moderately tolerant
Seeding season Late spring – summer
Seeding in lines 3 to 20 (kg / ha)
broadcast sowing 20% more
Spacing between rows (17 to 34 cm) 12 a 15 (seeeds / linear m)
In mixtures with 2 to 3 crops 3 to 4 (kg / ha)
In mixtures with 4 to 6 crops 2 (kg / ha)
Intercropping with corn in lines 4 to 6 (kg / ha)
broadcast sowing 5 to 7 (kg / ha)
Nematodes1 Pratylenchus brachyurus Susceptible
Meloidogyne incognita Susceptible
Meloidogyne javanica Susceptible
Heterodera glycines RF < 1
Rotilenchulus reniformis RF < 1
Pratylenchus coffeae –––––
Pratylenchus zea –––––
Recycling of nutrients Nitrogen (% in dry matter)2 1,02 to 1,80
Phosphorus P2O5 (% in dry matter) 0,15 to 0,24
Potassium K2O (% in dry matter) 2,40 to 2,78
Indications Benefits: Develops well in sandy soils, clayey, acid (pH from 5.1), fast initial phase growing; Alternative for oil production, for biofuel with the use of the pie in animal feed.
Attention points: Excessive rainfall and high temperatures, as well as crop residues can trigger attacks diseases of: Alternaria spot, rot of the stem (Erwinia sp.), Macrophomina, etc. Not recommended to rotate with beans (common diseases).
RF = reproduction factor

— 1918
Finger millet Spring – Summer Soil Covers
Identification Common name Finger millet
Scientific name Eleusine coracana
Family Poaceae (Gramineae)
Characteristics Weight of 1,000 seeds (grams) 2,3 to 2,5
Root system Fasciculated Root
Height (m) 0,8 to 1,2
Growing habit erect
Flowering (days) 80 to 110 days
Cycle (days) 130 to 170
Green mass (mt / ha) 25 to 40
Dry mass (mt / ha) 6 to10
Frost tolerance Susceptible
Seeding season Late spring – summer
Seeding in lines 8 to 10 (kg / ha)
broadcast sowing 20% more
Spacing between rows (17 to 34 cm) 45 a 60 (seeeds / linear m)
In mixtures with 2 to 3 crops 3 to 5 (kg / ha)
In mixtures with 4 to 6 crops 2 to 4 (kg / ha)
Intercropping with corn in lines –––––
broadcast sowing –––––
Nematodes1 Pratylenchus brachyurus –––––
Meloidogyne incognita Susceptible
Meloidogyne javanica Susceptible
Heterodera glycines RF < 1
Rotilenchulus reniformis RF < 1
Pratylenchus coffeae –––––
Pratylenchus zea –––––
Recycling of nutrients Nitrogen (% in dry matter)2 1,03 to 1,53
Phosphorus P2O5 (% in dry matter) 0,06 to 0,17
Potassium K2O (% in dry matter) 1,24 to 1,89
Indications Benefits: Fasciculate roots (can produce more than 6 mt / ha of roots), indicated mainly in sandy soil where increase soil particle aggregates. Grows on poor soils and supports long drought season. High weed suppression.
Attention points: After biomass managed it´s recommended to wait 15 – 25 days before sowing the next crop (slow decomposition of root system, which can lead to N temporary immobilization).
RF = reproduction factor
Brachiaria ruziziensisSpring – Summer Soil Covers
Identification Common name Brachiaria ruziziensis *
Scientific name Urochloa ruziziensis
Family Poaceae (Gramineae)
Characteristics Weight of 1,000 seeds (grams) 12.5
Root system Fasciculated root
Height (m) 0,8 to 1,2
Growing habit caespitosus
Flowering (days) 40 to 50
Cycle (days) perennial
Green mass (mt / ha) 20 to 55
Dry mass (mt / ha) 12 to 16
Frost tolerance low
Seeding season Late spring – summer
Seeding in lines 7 to 10 (kg / ha)
broadcast sowing 9 to 12 (kg / ha)
Spacing between rows (17 to 34 cm) 30 to 40 (seeeds / linear m)
In mixtures with 2 to 3 crops 4 to 5 (kg / ha)
In mixtures with 4 to 6 crops 2 to 3 (kg / ha)
Consortium with corn in lines 6 to 8 (kg / ha)
broadcast sowing 20% more
Nematodes1 Pratylenchus brachyurus Susceptible
Meloidogyne incognita RF < 1
Meloidogyne javanica RF < 1
Heterodera glycines RF < 1
Rotilenchulus reniformis RF < 1
Pratylenchus coffeae –––––
Pratylenchus zea –––––
Recycling of nutrients Nitrogen (% in dry matter)2 0,75 to 2,01
Phosphorus P2O5 (% in dry matter) 0,04 to 0,15
Potassium K2O (% in dry matter) 0,60 to 1,49
Indications Benefits: Grows in soils with medium chemical fertility. Precocity and high biomass production. Can be intercropped with corn and other crops, ease of handling, high nutrients recycling and high C / N ratio (around 40). Reduces Fusarium sp., Rhizoctonia sp. (white-mold).
Attention points: Attempt for continuous use and every 2 years to perform nematode analysis (Pratylenchs brachiurus), since it is host and can increase these populations and provoke damage to the next crops.
RF = reproduction factor

— 2120
Dwarf pigeonpea Spring – Summer Soil Covers
Identification Common name Dwarf pigeonpea
Scientific name Cajanus cajan
Family Fabaceae (leguminosa)
Characteristics Weight of 1,000 seeds (grams) 65 to 80
Root system vigorous / tap root
Height (m) 1,0 to 1,8
Growing habit harpy / erect
Flowering (days) 70 to 100
Cycle (days) 130 to 160
Green mass (mt / ha) 12 to 45
Dry mass (mt / ha) 3 to 12 (mt / ha)
Frost tolerance Susceptible
Seeding season Late spring – summer
Seeding in lines 35 to 40 (kg / ha)
broadcast sowing 20% more
Spacing between rows (17 to 34 cm) 18 to 25 (seeeds / linear m)
In mixtures with 2 to 3 crops 15 to 20 (kg / ha)
In mixtures with 4 to 6 crops 12 to 18 (kg / ha)
Intercropping with corn in lines 20 to 25 (kg / ha)
broadcast sowing 20% more
Nematodes1 Pratylenchus brachyurus RF < 1
Meloidogyne incognita RF < 1
Meloidogyne javanica RF < 1
Heterodera glycines RF < 1
Rotilenchulus reniformis RF < 1
Pratylenchus coffeae –––––
Pratylenchus zea –––––
Recycling of nutrients Nitrogen (% in dry matter)2 1,32 a 3,35
Phosphorus P2O5 (% in dry matter) 0,09 a 0,25
Potassium K2O (% in dry matter) 0,47 a 2,84
Indications Benefits: Grows in soils with medium fertility, biological chisel plow (disrupting soil compacted layers); Allopathic effects on invasive plants (weeds). Reduces Fusarium sp. and Rhizoctonia sp.
Attention points: Avoid highly compacted soils, since the roots of this legume may not be so efficient. In this case use the giant pigeonpea, because their vigorous tap root system.
RF = reproduction factor
Oilseed radishAutumn – Early Winter Soil Covers
Identification Common name Oilseed radish
Scientific name Raphanus sativus
Family Brassicaceae (cruciferae)
Characteristics Weight of 1,000 seeds (grams) 8 to 14
Root system deep / tuberous / tap root
Height (m) 0,8 to 1,6
Growing habit Herbaceous determinated
Flowering (days) 60 to 90
Cycle (days) 140 to 160
Green mass (mt / ha) 20 to 65
Dry mass (mt / ha) 3 to 9
Frost tolerance Tolerant
Seeding season Spring – late summer – early autumn
Seeding in lines 10 to 17
broadcast sowing 20% more
Spacing between rows (17 to 34 cm) 25 a 35 (seeeds / linear m)
In mixtures with 2 to 3 crops 4 to 5 (kg / ha)
In mixtures with 4 to 6 crops 2 to 3 (kg / ha)
Consortium with corn in lines 5 to 8 (kg / ha)
broadcast sowing 20% more
Nematodes1 Pratylenchus brachyurus Not hostess
Meloidogyne incognita RF < 1
Meloidogyne javanica Susceptible
Heterodera glycines –––––
Rotilenchulus reniformis –––––
Pratylenchus coffeae –––––
Pratylenchus zea –––––
Recycling of nutrients Nitrogen (% in dry matter)2 0,92 to 2,96
Phosphorus P2O5 (% in dry matter) 0,18 to 0,33
Potassium K2O (% in dry matter) 2,02 to 3,90
Indications Benefits: Fast growth – deep roots that can break down soil compacted layers, and high nutrient recycling (N, S, P). During growth period it can promote weed suppression.
Attention points: Do not sow in areas with Sclerotinia problems. Intercropped with other species such as rye, oat, millet, buckwheat, etc., may be use 2 to 3 kg / ha, will decrease white mold and undermine the later crops. Can be successfully mixed with grasses, legume and other cover crop species.
RF = reproduction factor

— 2322
Common vetch Autumn – Winter Soil Covers
Identification Common name Common vetch
Scientific name Vicia sativa
Family Fabaceae (leguminous)
Characteristics Weight of 1,000 seeds (grams) 36 to 60
Root system Tap root
Height (m) 0,5 to 0,8
Growing habit decumbent
Flowering (days) 120 to 150
Cycle (days) 180 to 200
Green mass (mt / ha) 20 to 30
Dry mass (mt / ha) 4 to 6
Frost tolerance Tolerant
Seeding season Late summer – early autumn
Seeding in lines 50 to 80 (kg / ha)
broadcast sowing 20% more
Spacing between rows (17 to 34 cm) 25 to 30 (seeds / linear m)
In mixtures with 2 to 3 crops 18 to 25 (kg / ha)
In mixtures with 4 to 6 crops 12 to 18 (kg / ha)
Intercropping with corn in lines –––––
broadcast sowing –––––
Nematodes1 Pratylenchus brachyurus Susceptible and hostess
Meloidogyne incognita Susceptible and hostess
Meloidogyne javanica Susceptible and hostess
Heterodera glycines –––––
Rotilenchulus reniformis –––––
Pratylenchus coffeae –––––
Pratylenchus zea –––––
Recycling of nutrients Nitrogen (% in dry matter)2 0,20 to 3,47
Phosphorus P2O5 (% in dry matter) 0,13 to 0,38
Potassium K2O (% in dry matter) 2,10 to 2,56
Indications Benefits: Efficient weed population control (mattress over the ground). High nitrogen supply by biological fixation and N recycling. Can be used as animal fodder (isolated or mixed with oat, rye, raygras, etc.).
Attention points: Better development in soils with high level of Ca and high soil pH.
RF = reproduction factor
Hairy vetchAutumn – Winter Soil Covers
Identification Common name Hairy vetch
Scientific name Vicia villosa
Family Fabaceae (leguminous)
Characteristics Weight of 1,000 seeds (grams) 36 to 60
Root system Tap root
Height (m) 0,5 to 0,8
Growing habit decumbent
Flowering (days) 140 to 160
Cycle (days) 200 to 230
Green mass (mt / ha) 20 to 30
Dry mass (mt / ha) 4 to 6
Frost tolerance Tolerant
Seeding season Autumn and summer – late winter
Seeding in lines 30 to 60 (kg / ha)
broadcast sowing 20% more
Spacing between rows (17 to 34 cm) 25 to 30 (seeds / linear m)
In mixtures with 2 to 3 crops 18 to 25 (kg / ha)
In mixtures with 4 to 6 crops 12 to 18 (kg / ha)
Consortium with corn in lines –––––
broadcast sowing –––––
Nematodes1 Pratylenchus brachyurus Susceptible and hostess
Meloidogyne incognita Susceptible and hostess
Meloidogyne javanica Susceptible and hostess
Heterodera glycines –––––
Rotilenchulus reniformis –––––
Pratylenchus coffeae –––––
Pratylenchus zea –––––
Recycling of nutrients Nitrogen (% in dry matter)2 1,88 to 4,36
Phosphorus P2O5 (% in dry matter) 0,10 to 0,41
Potassium K2O (% in dry matter) 2,30 to 4,26
Indications Benefits: Rustic crop that fits well in soils with low content of pH, Al and P. Provide high N to the soil and next crops in temperate and subtropical regions. Trough mulching effects, soil structure, higher water retention, crop root development, soil biological activity leads to increase crop yields. Can be mixed with oat, rye, ryegrass, radish, buckwheat, phacelie, etc., produces quality fodder with high protein content.
Attention points: Mix hairy vetch with rye and other grasses reduce drastically N leaching and enhance cash crop yield. In France low cycle varieties.
RF = reproduction factor

— 2524
Rye Autumn – Winter Soil Covers
Identification Common name Rye
Scientific name Secale cereale
Family Fabaceae (gramínea)
Characteristics Weight of 1,000 seeds (grams) 16 to 20
Root system fasciculated with tiller
Height (m) 0,6 to 0,8
Growing habit Clump / Erect
Flowering (days) 60 to 90
Cycle (days) 140 to 150
Green mass (mt / ha) 20 to 30
Dry mass (mt / ha) 2 to 5
Frost tolerance Tolerant
Seeding season Late summer – early autumn
Seeding in lines 50 to 70
broadcast sowing 20% more
Spacing between rows (17 to 34 cm) 60 to 70 (seeds / linear m)
In mixtures with 2 to 3 crops 20 to 25 (kg / ha)
In mixtures with 4 to 6 crops 10 to 15 (kg / ha)
Intercropping with corn in lines –––––
broadcast sowing –––––
Nematodes1 Pratylenchus brachyurus Susceptible
Meloidogyne incognita Susceptible
Meloidogyne javanica Susceptible
Heterodera glycines –––––
Rotilenchulus reniformis –––––
Pratylenchus coffeae –––––
Pratylenchus zea –––––
Recycling of nutrients Nitrogen (% in dry matter)2 0,58 to 1,22
Phosphorus P2O5 (% in dry matter) 0,08 to 0,29
Potassium K2O (% in dry matter) 0,75 to 1,45
Indications Benefits: Rye grows fast (even in cold fall) helps trap snow in winter, further boosting winter hardiness. Weed suppression, erosion control and soil root disease reduction. Due to lignin, hemicellulose and cellulose tissue content, remain higher soil covering. Deep roots promote better drainage, nutrient recycling of P, K and other nutrients. Quick maturity in spring can help maintain late-spring soil moisture. Can be mixed with oat, can avoid leaf rust attack; with vetch and other legume, more N during higher period for the next crop.
Attention points: Better soil effects when mixed with other cover crops such as hairy vetch, oat, lupine, field pea, radish, mustard, buckwheat, etc
RF = reproduction factor
White lupine Autumn – Winter Soil Covers
Identification Common name White lupine
Scientific name Lupinus albus
Family Fabaceae (Leguminous)
Characteristics Weight of 1,000 seeds (grams) 300 to 500
Root system tap root
Height (m) 0,8 to 1,2
Growing habit Bushy erect
Flowering (days) 50 to 70
Cycle (days) 180 days
Green mass (mt / ha) 20 to 30
Dry mass (mt / ha) 2 to 3
Frost tolerance Tolerant
Seeding season Late summer / early autumn – winter
Seeding in lines 60 to 80
broadcast sowing 20% more
Spacing between rows (17 to 34 cm) 15 to 20 (seeds / linear m)
In mixtures with 2 to 3 crops 25 to 30
In mixtures with 4 to 6 crops 15 to 20
Consortium with corn in lines –––––
broadcast sowing –––––
Nematodes1 Pratylenchus brachyurus RF > 1
Meloidogyne incognita RF > 1
Meloidogyne javanica RF > 1
Heterodera glycines RF > 1
Rotilenchulus reniformis –––––
Pratylenchus coffeae –––––
Pratylenchus zea –––––
Recycling of nutrients Nitrogen (% in dry matter)2 1,22 to 1,97
Phosphorus P2O5 (% in dry matter) 0,09 to 0,29
Potassium K2O (% in dry matter) 1,00 to 2,66
Indications Benefits: used as a cover crop, oil (seeds), forage (sweet varieties) and animal fodder. High fixing nitrogen and cycling phosphorus and other nutrients. Nitrogen fixing can vary from 100 to 200 kg N ha-1. P fixed by Fe, Al, and Ca phosphates can be released by root exudates (citric acid secretion) and citrate. The bitter seeds have higher protein content.
Attention points: As it is a host plant of several species of nematodes, it is recommended to mix with oat, rye, millet, triticale, among others to diminish these effect.
RF = reproduction factor

— 2726
Black oat Autumn – Winter Soil Covers
Identification Common name Black Oat
Scientific name Avena strigosa
Family Poaceae (Gramínea)
Characteristics Weight of 1,000 seeds (grams) 13 to 16
Root system Fasciculated / tillering
Height (m) 0,8 to 1,2
Growing habit caespitose
Flowering (days) 80 to 110
Cycle (days) 120 to 180
Green mass (mt / ha) 30 to 60
Dry mass (mt / ha) 3 to 6
Frost tolerance little Tolerant
Seeding season Late summer / early autumn – middle autumn
Seeding in lines 55 to 70
broadcast sowing 20% more
Spacing between rows (17 to 34 cm) 60 to 70 (seeds / linear m)
In mixtures with 2 to 3 crops 30 to 40 (kg / ha)
In mixtures with 4 to 6 crops 25 to 30 (kg / ha)
Intercropping with corn in lines –––––
broadcast sowing –––––
Nematodes1 Pratylenchus brachyurus RF < 1
Meloidogyne incognita RF < 1
Meloidogyne javanica RF < 1
Heterodera glycines RF < 1
Rotilenchulus reniformis RF < 1
Pratylenchus coffeae –––––
Pratylenchus zea –––––
Recycling of nutrients Nitrogen (% in dry matter)2 0,70 to 1,68
Phosphorus P2O5 (% in dry matter) 0,10 to 0,42
Potassium K2O (% in dry matter) 1,08 to 3,08
Indications Benefits: Very fast growth. High biomass production, efficient soil protection, efficient suppressing weed population and high versatility to fit in different cropping rotation systems, Soil attributes improvement. Can be used also as fodder (forage and grains) to animals. Good results can be achieved when mixed with other cover crop species (legume and other species). When mixed with rye, the rust occurrence can be highly decreased. Normally oats are more tolerant of wet soil than barley, but require more moisture.
Attention points: Oat can be used as soil covering (mulch or straw), forage or hay, and grain options.
RF = reproduction factor
Field peaAutumn – Early Spring Soil Covers
Identification Common name Austrian winter peas (black); Canadian field peas (spring peas)
Scientific name Pisum sativum ssp. Arvense
Family Fabaceae (leguminous)
Characteristics Weight of 1,000 seeds (grams) 95 to 125
Root system Tap root
Height (m) 0,6 to 0,8
Growing habit climbing
Flowering (days) 40 to 50
Cycle (days) 80 to 110
Green mass (mt / ha) 20 to 30
Dry mass (mt / ha) 4 to 6
Frost tolerance No tolerant
Seeding season Autumn – early spring
Seeding in lines 25 to 40 (kg / ha)
broadcast sowing 45 to 50
Spacing between rows (17 to 50 cm) 15 to 20 (seeds / linear m)
In mixtures with 2 to 3 crops 12 to 20 (kg / ha)
In mixtures with 4 to 6 crops 10 to 14 (kg / ha)
Consortium with corn in lines very efficient, sow when maize are around 0,60 to 0,80 m.
broadcast sowing –––––
Nematodes1 Pratylenchus brachyurus Susceptible
Meloidogyne incognita Susceptible
Meloidogyne javanica –––––
Heterodera glycines –––––
Rotilenchulus reniformis –––––
Pratylenchus coffeae –––––
Pratylenchus zea –––––
Recycling of nutrients Nitrogen (% in dry matter)2 0,20 to 3,47
Phosphorus P2O5 (% in dry matter) 0,13 to 0,38
Potassium K2O (% in dry matter) 2,10 to 2,56
Indications Benefits: Fast growing, high biomass and soil covering. In spring can suppress weeds properly. Used as forage – normally 18-20% of protein or grain, isolated or mixed with oat, rye, raygras, etc , May be used as cash crop. Attract beneficial organisms. Nitrogen cycling.
Attention points: Moderately cold and drought tolerant. Can adapt in semi-arid climate, in soils with medium fertility. Mycosphaerella and Ascochyta pisi foot rot are the main diseases of economic importance in field pea. Also can be susceptible to Sclerotinia sp. in some regions.
RF = reproduction factor

— 2928
Consortium, cocktail and mix of cover crops
Consortium spring / summer Millet ADR-300 (5 – 8 kg / ha) + buckwheat (15 – 20 kg / ha)
+ crotalarias (spectabilis, breviflora and ochroleuca) (6 – 8 kg / ha each) * may be mixed or each species individually.
Millet ADR-300 (5 – 8 kg / ha) + buckwheat (15 – 20 kg / ha) + crotalaria (spectabilis, breviflora and ochroleuca) (6 – 8 kg / ha each) + dwarf pigeon pea or mucuna (10 – 15 kg / ha)
Consortium autumn / winter – Indicated for areas with altitude
Forage turnip (3 – 4 kg / ha) + black oats (20 – 25 kg / ha) + common vetch (15 – 20 kg / ha)
Black oats (20 – 25 kg / ha) + white lupine (30 – 35 kg / ha) + rye (15 – 20 kg / ha)
Covers Single Cocktail with 2 or 3 covers
Cocktail with 5 to 6 covers
Intercropping with corn
Pearl millet 20 6 – 8 5 – 6 –
Crotalaria spectabilis 15 8 – 10 6 – 8 10
Crotalaria ochroleurca 12 – 15 8 – 10 6 – 8 10
Crotalaria juncea 20 8 – 10 6 – 8 –
Buckwheat 60 20 15 –
Sunflower 30 5 2 –
Finger millet 10 5 3 –
Brachiaria ruziziensis 10 6 3 3
Dwarf pigeon pea 35 20 15 20 – 25
Oilseed radish 20 4 – 5 2 – 3 –
Common vetch 50 30 15 –
Rye 60 30 20 –
White lupine 100 50 20 –
Black oat 65 40 29 –
Seed quantity (kg / ha)
Markings1 RF = reproduction factor
RF < 1 initial population of nematodes is reduced RF = 1 initial nematode population is maintained (does not increase or decrease) RF > 1 initial population of nematodes is increased
2 The values expressed in Nitrogen (N) are relative to biological fixation and recycled for legumes and recycled for other families.
General observationsThe recommendation of seed density may vary from crop to crop, according to the weight, germination, vigor and purity of the seeds. The information in this leaflet has been summarized from the available literature for the practice of green fertilization, and not used for forage or seed and grain production. For any species, planting season and region it is important to comply with the soil moisture conditions for seed germination and development. The information and values may vary with plant age, plant type, soil, fertility, climate, season and sowing density.
References
CALEGARI, A.; COSTA, M.B.; MONDARDO, A.; WILDNER, L. do P.; ALCÂNTARA, P.B.; MIYASAKA, S.; AMADO, T.; Adubação Verde no Sul do Brasil. 2.ed. Rio de Janeiro: AS-PTA, 1993. 346p. 2ª. Edição
CALEGARI, A.;.DONIZETI CARLOS, J.A._ Recomendações de plantio e informações gerais sobre o uso de espécies para adubação verde no Brasil. In: LIMA FILHO, O. F. de; AMBROSANO, E. J.; ROSSI, F.; CARLOS, J. A. D. (Ed.). Adubação verde e plantas de cobertura no Brasil: fundamentos e prática. Brasília, DF: Embrapa, 2014. v. 2, Cap. 27,_ p. 453-478.
CALEGARI, A. Plantas de cobertura. Manual Técnico. Fev. 2016. Penergetic. Uberaba, MG 24p. (3a. edição).
CARLOS, J. A. D.; Tabelas de recomendações – Pirai Sementes, 2016.
DERPSCH, R.; CALEGARI, A.; Adubação verde de inverno. Londrina, IAPAR, 2ª edição, 1992. p. 80. (IAPAR, Boletim, 73).
Managing cover crops profitability? Project manager and Editor 3rd ed.Agriculture Network handbook series, bk 9. ISBN 978-888626-124 (pbk). Sustainable Agriculture Network. 10300 Baltimore ave. Bldg. 046, Beltsville, MD 20705 HYPERLINK “http://www.sare.org” www.sare.org, 2007. 244p.
Serrantonio, Marianne . Metodologies for screening soil improving legumes. 1956. ISBN – 0-87857-8=989-3 Rodale Institute Research Center, Rodale Institute. 611 Siegfriedale Road. Kutztown, Pa. 19530, USA. 1991, 312 p.
WUTKE, E. B.; CALEGARI, A.; WILDNER, L. DO P. Espécies de adubos verdes e plantas de cobertura e recomendações para uso. In: LIMA FILHO, O. F. de; AMBROSANO, E. J.; ROSSI, F.; CARLOS, J. A. D. (Ed.). Adubação verde e plantas de cobertura no Brasil: fundamentos e prática. Brasília, DF: Embrapa, 2014. v. 1, p. 59–168.
Technical Manual of Cover Crops – Edition 02 • September 2016© Copyright Webbio Academy® – Exclusive use of the Living Soil Project.No reproduction, even if partial, without prior authorization. (Law 9.610/98).

— 3130
Some additional cover crops in the U.S.A. and in Europe
In 2003, Ademir Calegari visited France and shared experiences and ideas and encouraged Frédéric Thomas, researcher and farmer from France, to start with different trials, testing and validating some different mix cover crops.
So, these different mix cover crops can be tested and used in different countries in Europe, U.S.A and also some other countries.
Species / basics
Basics During the period between cash crops, seeding any cover crop is a big step forward in restoring water quality, maintaining and developing soil fertility and in the long term saving fertilizer inputs and reducing the need for tillage. Each plant has its own attributes that fit specific or diverse situations. Therefore, it is very important to have a good knowledge of each one of these important “agronomical tools” in order to use them properly and gain the maximum benefits.
Common (white) mustard Seeding rate: 8 – 10 kg / ha single (3 – 4 kg / ha into a mix)Most widely used cover crop, easy to establish, quickly covers soil surface but very sensi-tive to stress (lack of water, lack of nitrogen or very high temperatures) and can run to seed very quickly. Biomass rapidly becomes fibrous, breaks down slowly and during decomposi-tion, N losses can be high.
Phacelia Seeding rate: 6 – 10 kg / haRequires better establishment, small roots, very beneficial in improving surface soil struc-ture, especially in clay soils. Popular with bees. Improves density in mixtures and can easily be destroyed by knife roller; its black coloured residues help to warm up the soil (just like field bean residues). If N is available (manure or legumes), it produces a lot of biomass; also a good K scavenger (indeterminate flowering habit and produces a lot of seeds).
Oat (spring or winter variety) Seeding rate: 70 – 90 kg / ha Not expensive and easy to establish, oats are better suited as autumn and winter cover crops. When drilled too early they produce low levels of biomass and are susceptible to rust and aphids. Generally, crop is not killed by frosts and will re-grow in spring.
Phacelia tanacetifolia, Vigna unguiculata (cowpea), Faba bean, Lotus corniculatus (bird’s trefoil),
Melillotus officinalis, Lollium multiflorum (Ryegrass), X-Triticosecale (Triticale), (Hordeum vulgare)
Barley, Sorghum bicolor (Sorghum), Sudan grass, Brassica sp. (Oil seed rape), Asian radish,
Fodder radish, Moha, (Sinapis sp.) white and Black mustard, Alexandrian clover (Bersim clover),
Subterranean clover, Persian clover, Crimson clover, White clover, Red clover, Lathyrus sp.,
Faba bean, Faenun graecum, Camelina sp., Linun usitatisimum (Flax), etc.
Fodder radish Seeding rate: 6 – 8 kg / haVersatile plant suited to almost all soil types and conditions. Developes huge biomass and leaves a good soil structure. Resists to drought and is not attractive to slugs. Good basis for a lot of mixes.
Rye Seeding rate: 70 – 100 kg / haVery aggressive plant with good soil restructuring root system. Does not develop a lot of biomass after autumn seeding but becomes very productive in the following spring. Very sensitive to slugs when young. Useful for thick mulch to direct drill legumes, maize or vegetable crops. High residue in C / N ratio, risk of early N deficiency. Mixing with vetches or peas is advisable.
Triticale Seeding rate: 80 – 120 kg / haSame properties as rye but little bit less aggressive and more susceptible to pests and diseases. Should be sown as hibernate cover crop.
Barley (spring or winter variety) Useful and cheap cover crop, can supply some biomass in autumn (spring varieties). Barley is sensitive to stress and diseases. Not advisable in rotation with winter cereals.
Rye grass Seeding rate: 17 – 22 kg / haSlow early growth, once established becomes very aggressive. Better suited to cover crops which will be hibernate. Can supply a useful source of forage and is a N scavenger. One of the few species that can grow under maize, but can be very difficult to manage either mechanically or chemically.
Oil seed rape Seeding rate: 8 – 12 kg / haVery inexpensive cover crop, aggressive with good soil structuring attributes. To get best from OSR as cover crop needs to be sufficient N available. Used in any rotation where OSR is not a part. OSR will encourage slugs, this should be taken into account when considering.
Fodder rape Seeding rate: 8 – 12 kg / haVery similar to OSR but with more foliage (better cover) and can be grazed.
“ New species” These species have been introduced recently as potential cover crops with some useful attributes. It is not a complete list; new species are screened every year by min-till and no-tillage organisations and also by seed suppliers. There are many other species which might be suited as cover crops but it is a case of finding them and trialling them on a local basis.
Sunflower Seeding rate: 20 – 25kg / haBest suited to hot and dry conditions, supplies good levels of biomass if planted early in the summer. Good option for summer cover crops in rotations where it is not planted as a cash crop; killed by frost. In biomass type mixtures form a basis, which absorbs N, P and K: Doesn’t provide much soil cover but does absorb a lot of nutrients and helps suppress weeds.
Rough oat or Brazilian oat(avena strigosa)
Seeding rate: 35 – 45kg / haWill grow under all conditions. Is close to forage oat, quite aggressive and produces a heavy biomass that can be converted into quality forage (could be fibrous). As a cover crop, remaining straw on soil can be difficult to break down and may require some extra N: therefore risk of N deficiency in next crop. Can be reduced by including a legume.
Flax Seeding rate: 20 – 30 kg / haEasy to establish even under dry conditions. Low surface biomass, produces a good level of roots and competes well with weeds. Remaining residue can block tillage tools and seeders.
Buckwheat Seeding rate: 45 – 55 kg / haQuite easy to establish in stubble during summer, competes well with broadleaved weeds (allotropic effect). Quite easy to use as “double” crop or catch crop. Remaining seeds after harvest or in cover crops biomass will germinate next spring when temperature reaches 12°C. Not recommended as cover crop or mix before maize, sugar beet, and sunflower. Encourages bees and wildlife. Good P scavenger.
Species / “new species”

— 3332
Camelina Seeding rate: 8 – 12 kg / haOil seed plant, seeded very shallow, emerges and grows quickly and competes well with weeds. With a growing cycle (90 – 100 days), a high risk of producing viable seeds. Can be used as double crop and companion crop especially in association with legumes (e.g. lentil, soybean, lupine).
Asian radish Seeding rate: 5 – 8 kg / haQuite easy to establish, absorbs a lot of N. Unlike the fodder radish, stem doesn’t grow (if sown late summer and autumn) but develops rapidly and produces long tap roots. In sufficient soil fertility, root can become very big and weigh several kg. Usually killed by winter frosts (-7 or -8°C) or by rolling or shallow tillage. Crucifer. Crop returns fertility stored in its root as a low C/N ratio.
Turnip Seeding rate: 6 – 10 kg / haCruciferous species mopping up a lot of residual N. Like OSR, no growth of stem in autumn and foliage is good for grazing. Will not be killed during winter and continue to absorb N. During spring growth initially depletes N available for the following crop. This N will be only available later to the cash crop.
Moha millet Seeding rate: 25 – 30 kg / haSummer grass, need high temperatures, water and N. Excellent source of forage and useful cash crop, when in conjunction with legume (e.g. Alexandrian clover). Sensitive to sunlight, must be seeded early (before mid-July), long day length stimulates growth.
Sorghum Seeding rate: 15 – 25 kg / haVery aggressive tropical grass producing heavy biomass and roots, when planted early. Drought resistant when well established (needs to be well seeded). Benefits from high temperatures, moisture and N. Several types (grain, sugar, paper) can produce different volumes and qualities of vegetation. Good source of forage.
Black mustard Seeding rate: 2 – 3 kg / haVery low thousand grain weight and strong emergence (vegetal development a little bit like OSR, produce a stem in autumn), can be seeded at very low seed rate. Growth cycle is longer than white mustard, chance of producing seed lower, therefore less competitive with weeds. Could be employed as a “bio-fumigant” on nematodes.
Nyger Seeding rate: 8 – 12 kg / haClosely related to sunflowers and best suited to hot moist conditions. If drilled early, it can produce high levels of biomass and will smother volunteers and weeds. First light frost will kill it. Attractive to slugs. If planted early is a versatile cover crop. Planted alone or in mixture, gives good results. Should be a companion crop with autumn sown OSR (attracts slugs) and killed with first frost, will not compete with crop.
Bengal vetch Seeding rate: 40 – 50 kg / haSame traits as common vetch but with faster growth: depending on conditions, of 25% to 40% more biomass in 3 months in summer and autumn. Quite good choice where sown between winter cereal crops supplying N to the following crop.
Cerdagne vetch (Mountain vetch) Seeding rate: 30 – 40 kg / haWell suited to dry and harsh conditions. Like bitter vetch, various species are not yet catalogued so cannot be differentiated in between.
Alexandrian clover (Berseem clover)
Seeding rate: 8 – 12 kg / haAnnual or biennial clover, develops rapidly during summer and autumn if conditions are favourable. Prefers deeper soils with a good natural fertility and sufficient moisture. Significantly less competitive under dry conditions. Under good conditions it can produce high levels of biomass (3 – 4 mt of DM / ha are possible after barley or wheat crop), fixing significant amounts of N. Very good source of forage alone or in mixes but also very good cover crop between two straw crops. No need to destroy before planting next straw crop (can be dealt by herbicides during the autumn and winter).
Persian clover Seeding rate: 8 – 12 kg / haLike Alexandrian clover it provides biomass during summer. Grows better in poorer soils and harder conditions: more resistant to frost and harder to destroy.
Crimson clover Seeding rate: 12 – 15 kg / haBiennial clover, quite slow to establish in autumn but opposed to Berseem clover performs better under more difficult climatic conditions and lighter soils. Quite winter hard, will regrow again in spring very fast (the main production period). Good source of forage and a useful complement for cover crop mix with early spring biomass production. Despite its qualities, is not a big N fixer: In field trials, often at bottom of the list. Good cover crop to use on wet soils before maize, as long as it is killed off before using up all soil moisture.
Field bean Seeding rate: 150 – 200 kg / haDespite large seed size and heavy seed rates, very useful and versatile plant as cover crops (volunteers are a good indication). Produces a considerable amount of biomass and tap root is good for soil re-structuring. Able to quickly fix the high amounts of N (80 – 200 kg N / ha in 3 – 4 months). Not ideal forage crop but can be used in silage or haylage. Can be included in many summer, autumn or winter mixes. Usually killed by winter frost but if sown late (after corn harvest), will go through winter easily and start to grow again in spring. Good companion crop (OSR, sunflower, corn, cereals), not very competitive against weeds. Spring variety “Diana” with a lot smaller grain size (300 – 400 gr / 1000 grains) tested by conservation agriculture networks, seems to bring equal results at half seed rate.
Forage pea Seeding rate: 60 – 80 kg / haVery versatile legume well suited cover crop. A lot hardier, producing a bigger biomass and more disease resistant than varieties used for grain production. Good supplement of any cover mix. Produces good quality forage useful in forage and grain mixes.
Latyrus Seeding rate: 35 – 45 kg / haBetter suited to calcareous soil where it can produce good levels of biomass. In these conditions good N fixer. Grain is toxic, can’t be used as forage, but useful as companion plant especially for OSR (short growing cycle and easily killed by frost).
Lentil Seeding rate: 25 – 35 kg / haGenerally prefers calcareous and non-acidic soils. Does not produce high levels of biomass, still quite competitive with weeds (when drilled at high seed rates). Rarely used as cover crop and especially not in mixtures. Very useful as companion crop for OSR, if used GFL mix (Gesse/ fenugreek/lentil). Black fodder lentil, produces more biomass and is more aggressive, but seed is in short supply.
Fenugreek Seeding rate: 10 – 15 kg / haTypical smell of curry (plant and seeds). Suited to clay and calcareous soil and quite hardy conditions. With lentils, fenugreek is not an aggressive plant. Potential biomass is not great but for forage has high quality (not for dairy cows – curry taste goes into the milk). Does not perform well in cover crop mixtures; good companion crop for OSR. Its strong smell can deter insects but attract hares and deer.
Legume cover crops In Europe, few are included in our crop rotations, so they should be included in cover crops mixes. This is probably at odds with the concept of the N holding cover crops aimed at reducing nitrate level in drainage water. They bring more diversity, promote a higher biomass production and, none the less, fix some N, which can reduce the dependence on artificial fertilizer. Finally, legumes have a low C / N ratio so do not tie up soil N. As an essential natural plant species, they should be included wherever possible.
Common vetch (spring or winter cultivars)
Seeding rate: 40 – 50 kg / haSlow to establish, but as a climber will smother other species in autumn (or spring if seeded late). Very good N fixer, that combines quite well with cover crops and forage mixes. Easily controlled with knife roller or any other mechanical destruction. Tendency to re-grow and can block up tine based tillage machinery. Its shallow root system aids biologic activity.
Hairy vetch Seeding rate: 35 – 45 kg / haInitially slower to establish than common vetch, once growing can become quite aggres-sive. Can dominate any species or mixture and will smother weeds on volunteers by its very high levels of vegetation. Has trait of having 3 – 5% seeds remaining dormant and may well germinate in the following cash crop. Risk of contamination is limited by conservation tillage and direct drilling, but could be a problem for organic growers.
Species / legume cover crops

— 3534
“ Biomax” type blends The word “Biomax” explains the objective of the multiple species cover crops: to produce the maximum level of biomass encouraging a maximum amount of bio-diversity in the soil and the surface. Once again, this list of examples is obviously not complete. Never the less it should supply ideas and guidelines to help growers understand how to blend plants types in order to be able to make their own Biomax mixes according to their conditions, objectives and available seed.
Mustard | phacelia | pea | vetch Seeding rate: 2 kg / ha | 2 kg / ha | 20 kg / ha | 12 kg / haMixture is quite well balanced with some good conventional cover crops associated with a couple of very good legumes. Well suited for sowing from middle to the end of august for autumn and winter intercropping. If sown too early, risk that mustard will run to seed even if the seed rates are reduced.
Sunflower | radish | phacelia | pea | vetch
Seeding rate: 6 kg / ha | 2 kg / ha | 2 kg / ha | 15 kg / ha | 10 kg / haMixture produces more impressive vegetation and a bigger biomass capable of fixing good levels of N. Possible to drill early, right after harvesting winter cereals. Can be used for longer intercrop periods or between two winter cereals. Usually controlled by the winter weather and does not need to be destroyed chemically or mechanically.
Radish | flax | phacelia | pea | vetch
Seeding rate: 3 kg / ha | 7 kg / ha | 2 kg / ha | 15 kg / ha | 10 kg / haIf sunflower is grown on the farm as a cash-crop, it is possible to increase amount of radish and add some flax. Mix probably less productive in term of biomass but with soil structuring effect in combination with radish and flax makes a useful cover crop.
Asian radish | phacelia | field bean | Alexandrian or Crimson clover | vetch or pea
Seeding rate: 2 kg / ha | 2 kg / ha | 30 kg / ha | 3 kg / ha | 10 kg / haCover consists five “levels” with the tillage radish dealing with “deep underground level”. Biomax will be a bit shorter with slightly less biomass but its vegetation will be very dense. Good N fixer with fast return to next crop. Ideal cover crop between winter cereal crops.
Oat | field bean | Pea | vetch | phacelia
Seeding rate: 25 kg / ha | 50 kg / ha | 20 kg / ha | 15 kg / ha | 2 kg / haMixture for winter-spring intercropping, slightly higher seed rate. Drilled in October or November, majority of plants will go through the winter and come up in spring. As most are legumes, their growth will not only absorb soil moisture but also increase level of N fixed and of C returned to the soil during the intercrop period. Oat can be easily replaced by summer oat, rye or any other winter cereals by adjusting seed rate.
Sorghum | radish | moha rough oat | pea | vetch | Alexandrian or Crimson clover
Seeding rate: 3 kg / ha | 2 kg / ha | 5 kg/ ha | 10 kg / ha | 10 kg / ha | 5 kg / haSummer biomax for forage production. Should be sown early after winter barley or OSR. Potential of biomass production is very high and such a diversity of plants will easily adapt to and compensate adverse climatic conditions.
Field bean | vetch | pea | Alexandrian clover | lentil
Seeding rate: 30 kg / ha | 10 kg / ha | 15 kg / ha | 3 kg / ha | 5 kg / ha Pure legume biomax for max. N fixation. During 3 – 4 months summer intercrop period, possible that mixture can produce 4 – 5 mt / ha of DM with 100 – 180 kg of N / ha (kept in total biomass: surface vegetation and roots) a large percentage (40 – 50%) will be available for the next crop.
Sunflower | phacelia | radish | OSR | rough oat | flax | nyger | pea | vetch | Alexandrian clover | field bean
Seeding rate: 3 kg / ha | 2 kg / ha | 1 kg / ha | 3 kg / ha | 4 kg / ha | 3 kg / ha | 1 kg / ha | 6 kg / ha | 5 kg / ha | 2 kg / ha | 15 kg / haTen species are a very complex biomax mixture. If weather conditions are favourable, (when sown after a winter cereal), possible for this type of mixture to produce 10 mt / ha of DM with 150 – 250 kg of N / ha recycled and fixed in the surface vegetation. Mixture is a real soil fertility booster.
Classical blends Not an exhaustive list but contains the main species used at present. Other plants can also be used as cover crops alone or in mixtures. Researchers, seed dealers and conservation agriculture networks continue to investigate other species and select some specific varieties that can perform new functions. Below are listed only few examples to give some ideas, associations and mixtures. Please note that the more species put in a mix, the better they will perform in terms of soil structure, fertility, biomass, weed control, stability, etc.: the more complex the blend, the more simple it becomes!
Mustard | phacelia Seeding rate: 4 kg / ha | 5 kg / haConventional and very classic mix for fields with good levels of N or where some kind of manure or slurry will be applied. Usually high biomass production. Depending on fertility and weather conditions, mustard can become dominant (in this case reduce the seed rate of mustard or dilute it with a third species). Seedbed must be sufficiently good for phacelia to establish well.
Winter oat | mustard Seeding rate: 20 kg / ha | 4 kg / haEasy mix to use with a good potential of biomass production if sufficient N available. Mix is good for weed control but residues are high in C and may use more N from the soil during decomposition than return any for the next crop. Is even more evident if cover crop is incorporated or ploughed down, if following crop is directly drilled. Residue remains on the soil surface, decomposition is slower tying up less soil N.
Spring oat | vetch Seeding rate: 50 kg / ha | 25 kg / haMix is better suited for seeding later in the season, possilbility to hibernate and completing its work the following spring. Earlier sowed oats may not be competitive enough and could leave space for weeds to develop. Winter cover crop and addition of some field beans with reduced seed rate of oats and vetch will be a better option (40 kg / ha oat, 20 kg / ha vetch and 40 kg / ha Berseem) and will fix more N.
Winter oat | phacelia Seeding rate: 20 kg / ha | 5 kg / haGood potential biomass producer with a better balanced C/N ratio. Care must be taken as oats can become dominant. Better to mix with a third species (a legume like vetch).
Winter oat | phacelia | vetch Seeding rate: 15 kg / ha | 3 kg / ha | 15 kg / haVery well balanced mix with species that have got different and complementary vegetative behaviours. Adding vetch will improve biomass production, soil coverage and increase N pool. While lowering average C/N ratio of residues. Mix can give good results after winter cereals crops (long intercrop period) as well as after maize (where it will hibernate). In this situation it is recommended to increase the seed rates by 10 to 20% in order to get more quickly better cover.
Alexandrian clover | phacelia Seeding rate: 5 kg / ha | 5 kg / haTwo less competitive species that can cooperate well together to produce a good cover and a well-balanced biomass. Easy to manage. Mix needs to be established well and prefers deep silty soils with good natural fertility. Mixture is useful between two winter cereals or for longer inter crop periods where, if planted too early, it will be held back by winter frosts.
Radish | forage pea Seeding rate: 5 kg / ha | 25 kg / haMore impressive and bushy, able to produce a large biomass (4 – 6 mt of DM / ha) if sown early. Good couple for short intercrop periods before winter cereals if OSR is not one of the main crops in the rotation. Performance will be improved by incorporating other species in the mixture like sunflower, phacelia, flax, vetch.
Pea | vetch | field bean Seeding rate: 25 kg / ha | 20 kg / ha | 50 kg / haQuite well balanced mixture with the objective of fixing max. N to boost soil’s natural fertility. For summer-autumn or winter-spring intercropping it is recommended to add some oats, phacelia or radish or maybe all three to boost biomass production and level of cover without reducing ability to fix N. Pure legume mix, fits well in no-till and organic farming systems. Care should be taken when the crop is distroyed, possible for N leaching, breaching environmental legislation.
Species / “Biomax” type blendsSpecies / classical blends

A passion for nature. Made in Switzerland.We encourage a sustainable and gentle agricul-ture for humans, animals and the environment since 20 years. We are based in Switzerland, the ideal place to turn our vision into reality.State-of-the-art production facilities, innovative product development and a highly qualified team ensure a production to the highest quality standards.
Penergetic’s development work is based on a holistic approach. It is important to take into account as many interrelations of natural process chains in agriculture and the environ-ment as possible into account, ideally all of them. Biological systems are open cycles. In various process chains that are interlinked with each other, they form our eco-system.
Penergetic products stimulate biological systems with natural impulses. In this way, cycles can be
optimized and the efficiency of individual pro-cesses can be improved. Increased yields and higher profits together with improved well-being of the animals ensure the future viability of the farms. The Penergetic product system covers six areas of use.
The individual products are cycles within them-selves and interact with one another. The prod-ucts are optimized continuously and their effects complement each other.
PenergeticProducts
penergetic products for water
for plants
for animals
for liquid manure
for compost
for soils

Benefits Accelerates microbial activity and soil quality
Increases phosphorus availability
Reduces influence of harmful micros
Activates crop residue decomposting
Helps mitigate soil compaction
Increased number of beneficial fungi in the soil
Less fertilizer needed due to improved soil fertility
Optimised soil structure (air, water, heat balance)
Easier tillage
Less machinery work needed
Redudes weed pressure
Soil life – soil health – these are the farmer’s most important assets and must be supported and promoted. penergetic b has been designed to stimulate soil biology and to promote its activity. By stimulating the soil organisms, the mycorrhizae and indirectly the root growth are activated. The crop residues in the fields should not be neglected. They are useful and important food for soil organisms.
Soil
promotes
healthy rootsystems
improves
soil quality
activates
crop residuedecomposition
accelerates
microbial activity
helps
mitigate soilcompaction

— 4140
Improvement in soil structure with ‘activated’ manure
Observation of soil structure and soil quality over two years (2015–2016)
Aerobic activation with liquid manure and penergetic b
Willenbring Farm, Minnesota U.S.A.
Field 2 and field 6 were both treated with penergetic b and p for the first time in the spring of 2015 and again in the spring of 2016. Both fields received 1,500–2,000 gal / ac (14–18 m3 / ha) of penergetic g/k treated (aerobically activated) liquid dairy manure for the first time in September of 2016.
Notice how much different the Sulfur levels are for both fields in 2016.
Also how the pH of both fields have gone form alkaline to balanced since the use of penergetic products.
Soil / penergetic b Penergetic U.S.A. Willenbring Dairy Farm Minnesota U.S.A.
left: Sept. 2016 – after 1 year of penergetic g/k use with no agitation since May 2016. Aerobically activated liquid dairy manure. Nutrients are in an organically bound form = no risk to the groundwater.right: Field 6 on 17.09.2016: An example of a healthy, loose soil with good air, water and nutrient exchange.
“ Through the use of the penergetic products, I am beginning to find significantly more earthworms and signs of life in our soils.” Matthew Willenbring
Practical experiencereportsObservation in soil structure in the U.S.A.
Soil fertility in BrazilAlkaline soil in Canada
Sample identification soil pH sulfur (ppm)
Field 2 – 2011 8.1 7
Field 2 – 2014 7.3 8
Field 2 – 2016 6.8 20
Field 6 – 2011 8.3 9
Field 6 – 2014 7.2 9
Field 6 – 2016 6.8 27
All of the soil samples were taken in the fall of each year. Tested at Midwest Laboratories Omaha, NE.
— 39
— 41
— 41
38
40
40

— 4342
Poor yields on alkaline soils have been transformed into productive fields
Nothing of value had grown on this land in southern Alberta in the past 30+ years: yet, it has been used for a little cattle grazing. Historically, some koshia (an alkaline soil pH tolerant invasive weed) has been about the only thing that has grown on this ground.
penergetic b converts a non-productive alkaline field into producting alfalfa field in just 12 month.
Before: typical alkaline soil
After: see the difference
Treatment August 2015:
800 gr / ac (2 kg / ha) penergetic b Spring 2016:
300 gr / ac (750 gr / ha) penergetic b» Note: No penergetic p has been applied!
Results Field previously planted in alfalfa,
cut in late July 2016 Yield: 1 mt / ac = 2.5 mt / ha!
» penergetic b made this formerly alkaline field productive!
Fertile soil without phosphorus even after five years of cultivation
Penergetic Brazil Araunah Agro
Penergetic Canada
+
2015 mg / dm3
lower than 5.705.70 – 8.428.43 – 11.1511.16 – 13.8813.89 – 16.60
Levels of phosphor left: 2010 (Averages of 3,06 mg / dm3) right: 2015 (Averages of 9,20 mg / dm3)
2010 mg / dm3
0.60 – 1.642.34 – 3.324.69 – 6.217.79 – 9.3210.53 – 11.50
Levels of potassium left: 2010 (Averages of 0,32 cmolc / dm3) right: 2015 (Averages of 0,52 cmolc / dm3)
2010 mg / dm3
0.21 – 0.240.27 – 0.300.32 – 0.350.38 – 0.410.44 – 0.46
2015 mg / dm3
lower than 0.430.43 – 0.490.50 – 0.560.57 – 0.630.64 – 0.70
Levels of sulfur left: 2010 (Averages of 11,07 mg / dm3) right: 2015 (Averages of 16,38 mg / dm3)
2010 mg / dm3
7.00 – 7.398.05 – 8.779.58 – 10.3310.99 – 11.7112.46 – 13.00–––
2015 mg / dm3
10.00 – 12.0512.06 – 14.9314.94 – 17.8017.81 – 20.6820.69 – 23.5623.57 – 27.00
Development of soil fertility of the Fazenda Boa Fè by the use of penergetic b and pThe Farm Boa Fè goes into the 14th harvest without phosphorus fertilization. The remaining nutrients are used as required. The productivity of the farm is comparable to that of the neighbours. The fields are alternately used for soya and corn. On these fields, hay has been cultivated two times in the intermediate harvest as winter food for the cattle.
3 11.5
1.9 2.5
1.5 1.5
1.50.6
2.8
7.1
5.7
8.7
8.78.7
9.5
8.6
16.6
0.4
0.28
0.26
0.26
0.34
0.31
0.21
0.31
0.46
0.47
0.48 0.43
0.48 0.60
0.50 0.70
0.47
1010
1313
13
13
12
9
7
13
27 14
1122
17
17
10

Benefits Improved assimilation of nutrients
Stimulates plant growth
Increases mycorrhizal fungi
Strengthens plants
Reduction of fertilizer
Accelerates chlorophyll and photosynthesis activity
Improved yield and enhanced crop quality
Increased stress resistance
Activates the symbiosis of soil-root-plant
Stabilisation of the biological optimum for plants
Works synergistically with other agri-inputs
Plant growth depends largely on the health of the soil and the fertilizer that is used. A good and healthy quality of the product ensures an optimal agricultural cycle for the benefit of animals and humans.penergetic p is used as a plant tonic. The product has a stabilizing effect on plant growth and strengthens the immune system of the plants. This reduces susceptibility to diseases and pest infestation. Additional benefit is the stimulation of microbiology in the root area and the increase of the plant’s natural nutrient uptake. Plants become more resistant and through that show a better productivity.
Plants
Strengthens
plantsand increasesresistance
ACCELERATES
photosynthesis activityand chlorophyll
IMPROVES
nutrients flow
promotes
increased yield
INCREASES
mycorrhizalfungi

— 4746
Performance of the Penergetic Technology in soybean
The Penergetic Technology operates in soil and plant bioactivation with the potential to promote positive effects on plant vitality.
With the use of penergetic, some authors found positive results in the reduction of inputs, indicating a better use of existing fertility, better release and utilization of nutrients to plants and existing natural resources,
consequently the increase in crop productivity. In this sense, the purpose of the work was to evaluate the performance of Penergetic Technology in soybean production in the crop of 2015 / 16.
Material and methodsFor the performance of the test, the following treatments were evaluated:
Plants / penergetic p Penergetic Brazil Araunah Agro
June Faria Scherrer Menezes PhD in Plant Science / UFV, Professor and Researcher ofthe Department of Agronomy of UniRV, Rio Verde / GO
Table 1: Description of the treatments used in the test (Rio Verde / GO, crop of 2015 / 16)
* penergetic b – 250 gr / ha applied before sowing, with desiccation management (single dose application).** penergetic p – 250 gr / ha divided into two applications, whereas: 125 gr / ha applied to V3 – V4 and 125 gr / ha
applied to the 15 to 20 days after the first application.Applications made with CO2 pressurized precision pulverizer, using 150 lt / ha of syrup.
Treatment Dose of penergetic products Application time
1 Standard fertilizer (100% mineral fertilizer) – –
2 Fertilizer adjusted (50% mineral fertilizer) – –
3 Zero fertilizer (0% mineral fertilizer) – –
4 Standard fertilizer + 250 gr / ha penergetic b * + 250 gr / ha penergetic p **
250 gr penergetic b / 2 x 125 gr penergetic p
Dry / V3 – V4 / 15 – 20 days after first application
5 fertilizer adjusted + 250 gr / ha penergetic b + 250 gr / ha penergetic p
250 gr penergetic b / 2 x 125 gr penergetic p
Dry / V3 – V4 / 15 – 20 days after first application
6 Zero fertilizer + 250 gr / ha penergetic b + 250 gr / ha penergetic p
250 gr penergetic b / 2 x 125 gr penergetic p
Dry / V3 – V4 / 15 – 20 days after first application
Practical experiencereportsSoybean in BrazilSoybean in Brazil – PhotosCorn in the U.S.A.
Corn in Sri LankaCorn in CanadaAlfalfa in Central California, U.S.A.
Alfalfa in the U.S.A.
Potatoes in South AfricaPotatoes in CanadaCherry in ChileRice in Costa RicaCarrots in BrazilVegetables in Abu DhabiCotton in GreeceViticulture in AustriaWine in AustriaWheat, oat and rape in the U.K.
Coffee in Brazil
— 47
— 49
— 51
— 55
— 57
— 59
— 59
— 61
— 65
— 69
— 77
— 80
— 85
— 87
— 90
— 95
— 100
— 103
44
48
50
52
56
58
58
60
62
66
70
78
81
86
88
91
96
101

— 4948
All cultural treatments were carried out according to the technical indication for the crop, and according to the schedule of the farm, except for the fertilization that followed the treatments. To perform the test, it was used to cultivate soybean the Nidera 7000, in the commercial area of central pivot, the Fontes do Saber Farm, belonging to the University of Rio Verde (UniRV). The evaluations were carried out in plots of 22.5 m2, representing 9 planting lines by 5 m in length. For the harvest, four central lines were used for 4 m in length, in a completely randomized design with four repetitions. In order to avoid influence among the treatments, a distance of 20 m was used between the plots.
During the crop cycle, the following evaluations were carried out: soil analysis, performed before planting, at depths of 0–10 cm, 10–20 cm and 20–4 0 cm; root volume by water displacement in full flowering; dry mass of the area and root in the R1/ R2 stage; average rate of chlorophyll in stage R1/ R2; number of nodules at 30 days after emergence; average height of the plants in the stage R1/ R2 and at harvest and grain yield. The grain yield was adjusted to 13% moisture and calculated at sc / ha-1. All data of the analyzed variables were submitted to analysis of variance and average test (Tukey to 5% of probability) to obtain the final results.
Results and discussionThe average height of plants in R1/ R2 was higher in plots that received the Penergetic Technology, with 72.62 cm. The height of plants in the plots without penergetic application were similar regardless of fertilization. The plots that did not receive mineral fertilization (0% fertilization) showed higher plant height, both in the general average and with the application of penergetic, with 79.05 cm (Table 2)
The plots fertilized with penergetic presented higher chlorophyll index, in relation to plots without penergetic (Table 2). Possibly, the higher the chlorophyll index, the higher the N and Mg content in the leaf. The dry mass of the soybean root in R1/ R2 didn’t show any difference between treatments and the application or not of penergetic (Table 2). Results similar to those obtained from the root volume (Table 2). The dry mass of the aerial part of the plants at R1/ R2 was higher in the plots without application of penergetic and the fertilization that presented the highest dry mass of the aerial part was with 50% of the mineral fertilization (Table 2).
The number of nodes in the R1/ R2 stage was similar in all plots where there was application of penergetic. However, in plots that did not receive penergetic, the number of nodules was higher, and the soybean of the part that was not fertilized had the highest number of nodules per plant, 39.6 (Table 2). The plant height at harvest (116 days after sowing) was higher in plots that received the Penergetic Technology, with 64.85 cm. The height of plants in the plots without penergetic application were similar regardless of fertilization. Inferring that the penergetic interfered positively in the final height of plants (Figure 1). The plots that did not receive mineral fertilization (0% A.M.) presented higher plant height, regardless of whether they received penergetic or not (Figure 1). The height results of plants at the time of harvest were similar to the evaluation of the height of plants in R1/ R2 in the first evaluation of the test (Table 2). The treatment with 100% of mineral fertilizer and penergetic presented the highest grain yield (74 sc / ha), 11% more in relation to the treatment that did not receive penergetic (66 sc/ha), as can be seen in Figure 1.
Treatments Plant height
w / o penergetic with penergetic average
100% fertilizer 69.05 68.15 B 68.60 AB
50% fertilizer 63.15 70.65 B 66.90 B
0% fertilizer 64.25 79.05 A 71.65 A
Average 65.48 b 72.62 a 69.05
CV (%) 4.65
Table 2: Evaluation parameters R1/ R2 stage
Figure 1: Height average of plants at harvest and productivity
Chlorophyll Index
w / o penergetic with penergetic average
43.2 44.42 43.81
43.67 44.97 44.32
43.02 45.1 44.06
43.30 b 44.83 a 44.07
3.9
Treatments Dry matter of root (g / plant)
w / o penergetic with penergetic average
100% fertilizer 16.4 14.4 15.3
50% fertilizer 17.8 15.8 16.8
0% fertilizer 14 14.1 14.2
Average 16.1 a 14.8 a 15.5
CV (%) 13.85
Dry matter of plant (g / plant)
w / o penergetic with penergetic average
23.2 B 23.46 B 23.4 B
30.6 A 24.5 A 27.5 A
23.9 B 19.7 AB 21.8 B
25.9 a 22.6 b 24.2
10.07
Treatments Root volume (ml / plant)
w / o penergetic with penergetic average
100% fertilizer 5.37 6.19 5.78
50% fertilizer 7.25 6.5 6.87
0% fertilizer 6.62 5.82 6.12
Average 6.42 a 6.1 a 6.26
CV (%) 21.34
Number of nodules per plant
w / o penergetic with penergetic average
28.7 B 19.4 24.0 b
26.8 B 21.9 24.3 b
39.6 A 23.8 31.7 a
31.7 a 21.7 b 26.7
13.21
ConclusionThe use of bioactivators of soils (penergetic b) and plants (penergetic p) in the soybean crop promoted greater homogeneity in the plant stand; largest population of plants per hectare; higher plant height; higher chlorophyll content and higher grain yield.
5762 60 6062 63
6965
0
10
20
30
40
50
60
70
80
100% fertilizer 50% fertilizer 0% fertilizer average
Average plant height at harvest (cm)
control penergetic
66 65 67 66
74
65
72 70
0
10
20
30
40
50
60
70
80
100% fertilizer 50% fertilizer 0% fertilizer average
Productivity sc / ha
control penergetic
5762 60 6062 63
6965
0
10
20
30
40
50
60
70
80
100% fertilizer 50% fertilizer 0% fertilizer average
Average plant height at harvest (cm)
control penergetic
66 65 67 66
74
65
72 70
0
10
20
30
40
50
60
70
80
100% fertilizer 50% fertilizer 0% fertilizer average
Productivity sc / ha
control penergetic

— 5150
Penergetic Brazil Araunah Agro
Some user photos concerning the effect of penergetic p
Michel Marques Dezan
Reginaldo Maeda
Anauri Nicolino
Jose Rossi
Janpier Bresson

— 5352
Silage corn is an important agricultural crop feed to livestock in the United States and elsewhere. Silage corn grown with penergetic shows many advatages.
Remarkable results his first year make WA State corn grower a true believer in using penergetic products.
The first time Peter Gines, a corn grower (Outlook, WA) used penergetic he ended up calling his local penergetic dealer, mid-July and said: “I think I might have the tallest corn in the valley! You bette get out her.” From that phone call until harvest (mid-September) the results of the penergetic treated corn vs. control were truly impressive.
Penergetic U.S.A. Penergetic Solutions (U.S.A.)
Optimized corn growth with increased stalk diameter and more cobs
TreatmentsFirst year of use only 3.5 oz / ac (250 gr / ha) penergetic p. After the dramatic results the grower experienced the first year he has become a regular penergetic user by increasing his use onto more acerage and now using the full penergetic program like below:
200 gr / ac (500 gr / ha) penergetic b soil treatment
10 0 gr / ac (250 gr / ha) penergetic p seed treatment
100 gr / ac (250 gr / ha) penergetic p 2 – 6 leaf stage
100 gr / ac (250 gr / ha) penergetic p ear formation (optional)
July 21st: Gines penergetic cornis > 11 feet (> 3 m) tall
Comparison in all pictures: treated (left) and control (right)
Roots and stalk diameter one month before harvest
Results (all one month before harvest) Significantly larger roots and brace roots Greater diameter of corn stalks
(approx. 20% larger) Size difference of the corn ears and
approx. 6 times more stalks with 2 ears Bigger cobs, 13% more and bigger kernels 100% pollination in penergetic treated corn 7 mt/acre (15.9 mt / ha) more corn yielded
(treated vs. untreated)
Size and quality of cobs
“ I’ve never had corn this good on July 21st and at harvest penergetic caused a major difference in yield.” Peter Gines, Oultook, WA

— 5554
Penergetic Sri Lanka DIMO Agribusiness
Effects of penergetic applications on corn with different quantity of fertilizer
Sri Lanka is not only known for its Ayurveda medicine and tea. The country has also a rich agriculture. In order to prove the effectiveness of the penergetic products, a test was carried out in corn.
Comparison in corn with different applications and fertilizer combinations
Variety: Jet 999Trial duration: 110 daysPlot size: 2,000 m2
Plant spacing: 60 x 30 cmNPK fertilizer: 100% in Test 1 & control and 80% in Test 2
Both Test 1 and Test 2 were treated with the same quantities of penergetic:
penergetic b: 1 application of 60 gr, 3 weeks before seeding
penergetic p: 3 applications of 40 gr
Plant growth parameters two months after planting
109.9 108.282.31
0
20
40
60
80
100
120
Ave.Plant height (cm)
Test 01 Test 02 Control
63.561
58.05
55565758596061626364
Ave.Leaf length (cm)
Test 01 Test 02 Control
9.8
9.41 9.39
9.19.29.39.49.59.69.79.89.9
Ave.Leaf width (cm)
Test 01 Test 02 Control
109.9 108.282.31
0
20
40
60
80
100
120
Ave.Plant height (cm)
Test 01 Test 02 Control
63.561
58.05
55565758596061626364
Ave.Leaf length (cm)
Test 01 Test 02 Control
9.8
9.41 9.39
9.19.29.39.49.59.69.79.89.9
Ave.Leaf width (cm)
Test 01 Test 02 Control
Trial Design – Complete block design
Agronomic characters
Note: Plant height was taken by collar region of the plant to upper most bud of the plant.Leaf length and leaf width was taken by 2nd leaf from upper most bud.
Agronomic characters Test 1 (100% NPK) + penergetic
Test 2 (NPK 80%) + penergetic
Control
Average grain yield (kg / ha) 9,320 7,320 7,400
Days to harvest 110 110 110
Average plant height (cm) – 2WAP 6.3 6.1 5.9
One month after planting 56.97 52 47.7
Average ear height (cm) 116.8 106.4 108.8
Average cob length (cm) 19.8 18.8 18.3
Average maximum cob girth (cm) 16.52 15.8 15.4
Number of seed rows 14 14 14
1000 grain weight (gr) 301 298 270
Seed colour Orange Orange Orange
Pest and disease (Sheath blight / stem borer) No pest found No pest found No pest found
Boarder plant Jet 999
Jungle Road tothe field
Test 1100% NPK fertilizer
Test 280% NPK fertilizer
Control plotwithout penergetic
109.9 108.282.31
0
20
40
60
80
100
120
Ave.Plant height (cm)
Test 01 Test 02 Control
63.561
58.05
55565758596061626364
Ave.Leaf length (cm)
Test 01 Test 02 Control
9.8
9.41 9.39
9.19.29.39.49.59.69.79.89.9
Ave.Leaf width (cm)
Test 01 Test 02 Control
109.9 108.282.31
0
20
40
60
80
100
120
Ave.Plant height (cm)
Test 01 Test 02 Control
63.561
58.05
55565758596061626364
Ave.Leaf length (cm)
Test 01 Test 02 Control
9.8
9.41 9.39
9.19.29.39.49.59.69.79.89.9
Ave.Leaf width (cm)
Test 01 Test 02 Control
109.9 108.282.31
0
20
40
60
80
100
120
Ave.Plant height (cm)
Test 01 Test 02 Control
63.561
58.05
55565758596061626364
Ave.Leaf length (cm)
Test 01 Test 02 Control
9.8
9.41 9.39
9.19.29.39.49.59.69.79.89.9
Ave.Leaf width (cm)
Test 01 Test 02 Control
109.9 108.282.31
0
20
40
60
80
100
120
Ave.Plant height (cm)
Test 01 Test 02 Control
63.561
58.05
55565758596061626364
Ave.Leaf length (cm)
Test 01 Test 02 Control
9.8
9.41 9.39
9.19.29.39.49.59.69.79.89.9
Ave.Leaf width (cm)
Test 01 Test 02 Control
109.9 108.282.31
0
20
40
60
80
100
120
Ave.Plant height (cm)
Test 01 Test 02 Control
63.561
58.05
55565758596061626364
Ave.Leaf length (cm)
Test 01 Test 02 Control
9.8
9.41 9.39
9.19.29.39.49.59.69.79.89.9
Ave.Leaf width (cm)
Test 01 Test 02 Control
left: Seedlings two weeks after planting control (left), penergetic b (right)
right: Seedlings 50 days after planting control (left), penergetic b & p (right)

— 5756
left: penergetic treatedright: control
The graphs are showing the effect of the penergetic application in conjunction with fertilizer. All graphs give the signs, that 100% fertilizer and penergetic products give the best result.
9320
7320 7400
0
1000
2000
3000
4000
5000
6000
7000
8000
9000
10000
Test 01 Test 02 Control
Average grain yield (kg/ha)
116.8
106.4108.8
100
102
104
106
108
110
112
114
116
118
Test 01 Test 02 Control
Average ear height (cm)
16.52
15.8108.8
14.6
14.8
15
15.2
15.4
15.6
15.8
16
16.2
16.4
16.6
16.8
Test 01 Test 02 Control
Average maximum cob girth (cm)
7320 7400
106.4108.8
15.8
108.8
9,320
7320 7400
0
1000
2000
3000
4000
5000
6000
7000
8000
9000
10000
Test 01 Test 02 Control
Average grain yield (kg/ha)
116.8
106.4108.8
100
102
104
106
108
110
112
114
116
118
Test 01 Test 02 Control
Average ear height (cm)
16.52
15.8108.8
14.6
14.8
15
15.2
15.4
15.6
15.8
16
16.2
16.4
16.6
16.8
Test 01 Test 02 Control
Average maximum cob girth (cm)
7,320 7,400
106.4108.8
15.8
108.8
9320
7320 7400
0
1000
2000
3000
4000
5000
6000
7000
8000
9000
10000
Test 01 Test 02 Control
Average grain yield (kg/ha)
116.8
106.4108.8
100
102
104
106
108
110
112
114
116
118
Test 01 Test 02 Control
Average ear height (cm)
16.52
15.8108.8
14.6
14.8
15
15.2
15.4
15.6
15.8
16
16.2
16.4
16.6
16.8
Test 01 Test 02 Control
Average maximum cob girth (cm)
7320 7400
106.4108.8
15.8
108.8
Test and control cobs were selected randomly, harvested 5m x 5m area in each plot.left: Test 1 – 100% NPK and control right: Test 2 – 80% NPK
ConclusionAccording to the results Test 1 showed considerable yield increase towards the control and the Test 2 (20% with respect to the control plot). However, Test 2 showed yield reduction with respect to the control.
Test 1 showed highest cob length, cob girth and grain weight than the Test 2 and control. However, Test 2 was the lowest. Therefore we can conclude that there is positive impact for plant growth by using penergetic treatment but reduction of fertilizer such as NPK 20% lead to yield and growth reduction.
Yield comparison – 10 cobsleft: Test 1 – treated with penergetic b & p with 100% NPK 1.684 gr/10 cob (12% moisture)middle: Test 2 – treated with penergetic b & p, 20% less NPK 1.329 gr/10 cob (12% moisture)right: Control – non treated with penergetic 1.342 gr/10 cob (12% moisture)

— 5958
Penergetic Canada
Differences between penergetic treated and untreated (control) corn are clearly visible
Better development and higher corn yields. These are just two of the advantages found in the use of penergetic p in corn. Treatment of corn variety “Maizex” CHU Range: 2,400 – 2,500Date of seeding: Mai 22, 2015Date of comparison: August 12, 2015Harvest: scheduled for early September, 2015
Summary Introduction Comparative cob weigh tests showed
penergetic treated cobs to be 15% to 20% heavier (on average) 3 to 4 weeks before harvest.
Cobs from penergetic treated corn appear healthier and more robust.
Kernels are more uniform in size.
Facts and figuresControl: GSP (Grower Standard Practice): 225 lbs / ac (252 kg / ha) with 9-40-9 + micros penergetic treated: GSP 225 lbs / ac with 9-40-9 + micros + 200 gr / ac (= 500 gr / ha) penergetic b (applied with fertilizer).Seed treatment: 100 gr / ac (= 250 gr / ha) penergetic p.Applied with Roundup: 100 ml /ac (= 250 ml / ha) penergetic p molasses
Results Increased yield Higher quality (kernel size and shape,
more uniformity, cob weight)
“ Once I cut the headland *, the difference in the development and height of the penergetic treated portion (compared to the control) readily became apparent. Fantastic!” Mark Van Klei, Rosedale, B.C. (Canada)
* The front rows of corn planted perpendicular to the main field.
Left: controlRight: penergetic treated
Above: control Below: penergetic treated
Left: control Right: penergetic treated
Comparison photos August 12, 2015
August 19, 2015: Control (left side) and penergetic treated (right side)

— 6160
Penergetic U.S.A.Penergetic Solutions (U.S.A.)
penergetic use exceed expectation in terms of quality and yield
Alfalfa is an important silage crop grown in North America. Be it a conventional or organic crop; under irrigation or dryland, penergetic use on alfalfa has consistently shown terrific results both in terms of an increase in yield and quality.
Silica Ridge Farm in Eastern Washington State an organic alfalfa crop is grown under irrigation. Qualtiy alfalfa hay is for the export market.
The 160 acres (64 ha) were treated with penergetic b molasses 3.5 fl.oz/ac
(250ml/ha) and penergetic p molasses 3.5 fl.oz/ac
(250ml/ha)
Also retained 20 acres (8 ha) untreated (as control). Note: Several core samples were pulled by the grower from both the treated and untreated bales and sent to lab for analysis. Tonnage results were also complied.
Comparative Results
Component Untreated penergetic treated Difference in %
Moisture % 13.1 12.4 5.3% lower
ADF % 30.5 24.9 18.4% lower
NDF % 40.3 29.4 27.1% lower
Crude Protein % 19.6 24.5 25.0% higher
RFV % 150.0 220.0 46.7% higher
Yield (tons/acre) 1.75 2.21 26.2% more
“ As recommended by Reed, my penergetic adviser, to properly evaluate the effectiveness of the penergetic products on my alfalfa, we retained a 20 acre section of the same pivot that was untreated (meaning no penergetic used). I got our farm crew to walk out in the field to see if they could observe any differences between the two sections. It was obvious – even to the naked eye – in the penergetic treated portion the plants were much thicker and had fuller growth than in the untreated section. Based on the visual differences, it seemed likely the component analysis and yield monitoring would further confirm things. When the results came back they exceeded my expectations – both in terms of quality and yield. As a result, I’ve decided to implement the penergetic program over our entire farm (about 1.200 acres). It ’s simply too effective and has such a high ROI it wouldn’t make sense not to.” Jared Omlin, owner/operator, Silica Ridge Farms
Penergetic U.S.A.Penergetic Solutions (U.S.A.)
penergetic p demonstrates strong residual effect on perennial crops
“A picture is worth a thousand words.” In this areal view of alfalfa crop in Central California the advantage of using penergetic p is clearly evident.
Historically, the east field (lower right hand side) has always outperformed the west field (upper left hand side). However, as evidenced by this aerial photo, since starting to apply penergetic p, the westerly (penergetic-treated) field now outperforms the easterly (control) field.
penergetic ratepenergetic p molasses at 3.5 fl oz/ac (250 ml/ha)
Application scheduleApplied after 5th cut
This picture was taken when the 7th cut of alfalfa was still in the field. In other words, this was the second cut since penergetic p was applied, yet there is still a clearly visual difference in crop volume between where penergetic was previously applied. As experi-enced elsewhere, this provided clear evidence that in the case of perennial crops (such as alfalfa) that penergetic application can have a residual effect – meaning its efficacy can last longer than one crop (or cut).
Aerial view from drone penergetic treated (left side) and control (right side)

— 6362
Variety: MondealsYield in mt / ha: Test 67 mt, Control 58 mt, regional norm 55– 60 mt
Results + 15% yield - 80% costs for spraying
programme (foliar) Bigger plants Thicker stalks More and bigger tubers
Penergetic South Africa Boland Organic Solutions CC
Evaluation for the use of penergetic products in potatoes
Potatoes are a basic foodstuff cultivated worldwide. Various combinations of penergetic products and organic fertilizers were evaluated to respond to the requirement for organic farming.
Trial run in South Africa’s Western Cape region on potatoes (var. Mondeals). We are using a spray programme for foliar fertilization containing penergetic p Bentonite. The control is the regular spray programme usually used on the farm. Our trial programme is done at a cost about 20% of that of the control spray programme. Soil fertilizers were the same for both control and test.
Remarks / ConclusionWe ran a few trial before and found that our best results are obtained by using penergetic p during the early stages of crop growth. No more penergetic was given after week 4 (but GroStim contains some penergetic p molasses).
The use of herbicides and pesticides remained the same as that was not part of the criteria for the study. We were interested in getting a better result for cheaper. penergetic was part of a cheaper program providing way better results than the more expensive program.
Differences in stem thickness left: control right: penergetic treated
Uitvlug (Variety: Mondeals) Week 4 Control (left side) and penergetic treated (right side)
Spray programme for the trial area
Plant stage Application Product Dosage / ha
80% emergence Blister pulverizer Herbali 1 lt
GroStim 1 lt
penergetic p 200 gr
Week 2 Blister pulverizer Herbali 500 ml
GroStim 1 lt
penergetic p 200 gr
Week 4 Blister pulverizer GroStim 1 lt
Week 6 Blister pulverizer GroStim 1 lt
Cal-Up 1 lt
Week 8 Blister pulverizer Cal-Up 1 lt
Week 10 Blister pulverizer Cal-Up 1 lt

— 6564
Penergetic CanadaSolutions Penergetic Quebec
Province of Quebec, good results achieved for late potato varieties on various farms
The province of Quebec is one of the largest area in Canada were potatos are growing. In this test the effectiveness of penergetic products in potato cultivation have been determined.
Various farms through the Province of Quebec were involved in this trial series. All farms had a control and a test field (the penergetic field was 8 ha / 20 ac in size). With the exception of adding the penergetic protocol the control and the penergetic treated sections were identical in terms of quality of the land / soil, variety, other inputs, etc.
At harvest, using the FCI Canada official testing method of evaluation, potatoes were dug up from four 3 m (10 feet) length of a sample row from both the control and penergetic field areas. This data was then used to calibrate the yield per acre in terms of hundredweight (cwt) – which is 100 pounds of potatoes. The results are summarized in the table “yield comparison”; whereas, the following pages provide more farm specific details.
Methodology Even horizon for control / penergetic Even number of plants, on 10 linear feet Each sample is weighed individually Official method for FCI Canada
penergetic control
8 7
6 5
4 3
2 1
Treatments
Results in yield
Yield comparison all farms (cwt / ac)
Penergetic Soil treatment Seed treatment Foliar application Remarks
acre (ha) acre (ha) acre (ha)
penergetic b 300 gr / acre (750 gr / ha)
Soil treatment can be mixed with herbicede, NOP or other products. Apply 15 days before seeding. Can be applied in Autumn.
penergetic p 100 gr /acre(250 gr / ha) in the furrow
Can be used with other products on seed. Inoculate 100 gr / ac (250 gr / ha) in the furrow.
penergetic p at first leaves 100 gr /acre(250 gr / ha)
Can be mixed with NPK, foliar fertilizer or farm chemicals. Reduce fertilizer use by 20%.
penergetic p at beginning of flowering 100 gr /acre(250 gr / ha)
Can be mixed with NPK, foliar fertilizer or farm chemicals. Reduce fertilizer use by 20%.
Farm Location Potato variety cwt / ac difference
% difference to control
1 Rondeau Lanoraie AC Chaleur +44 +9%
2 Rondeau Lanoraie Goldrush +73 +16%
3 Fiset Lyster Norland +43 +8%
4 Réal Pinsonneault & fils Napierville Murdoch +100 +23%
5 Réal Pinsonneault & fils Napierville Vivaldi +119 +22%
6 Isabel Napierville Belmont +84 +20%
7 Anonymous Ste-Eulalie Goldrush +66 +14%
8 Valupierre Ile d’Orléan Murdoch +46 +11%
9 MGE Ouellet Rivière du Loup Russet +94 +21%
Average +74.33 +16%
0
50
100
150
200
250
300
350
400
450
500
550
600
650
700
750
Farm 1 Farm 2 Farm 3 Farm 4 Farm 5 Farm 6 Farm 7 Farm 8 Farm 9
Yield comparison all farms (cwt/ac)
control Ø penergetic ØFor this comparison the average of the samplings of each control and penergetic fields per farm was taken.

— 6766
Results and photos of the fields
All photos are from penergetic fields:1 Ferme Rondeau, variety AC Chaleur2 Ferme Rondeau, variety Goldrush3 Ferme Fiset, variety Norland4 Ferme Réal Pinsonneault & fils, variety Murdoch5 Ferme Réal Pinsonneault & fils, variety Vivaldi6 Ferme Isabel, variety Belmont7 Ferme anonyme, variety Goldrush
Mr. Denis Dutil, expert in potatoes for over 50 years
General note: Best results have been achieved with all kind of late potatoes, for penergetic has more time to work well.
Yield comparison (cwt / ac)1 2 3
4 5 6
0
100
200
300
400
500
600
700
1 & 2 3 & 4
Yield (cwt/ac)
control penergetic
0
100
200
300
400
500
600
700
1 & 2 3 & 4
Yield (cwt/ac)
control penergetic
0
100
200
300
400
500
600
700
1 & 2 3 & 4 5 & 6 7 & 8
Yield (cwt/ac)
control penergetic
0
100
200
300
400
500
600
700
1 & 2 3 & 4 5 & 6 7 & 8
Yield (cwt/ac)
control penergetic
0
100
200
300
400
500
600
700
800
1 & 2 3 & 4 5 & 6 7 & 8
Yield (cwt/ac)
control penergetic
0
100
200
300
400
500
600
1 & 2 3 & 4 5 & 6 7 & 8
Yield (cwt/ac)
control penergetic
1 2 3
4 5 6
0
100
200
300
400
500
600
700
1 & 2 3 & 4
Yield (cwt/ac)
control penergetic
0
100
200
300
400
500
600
700
1 & 2 3 & 4
Yield (cwt/ac)
control penergetic
0
100
200
300
400
500
600
700
1 & 2 3 & 4 5 & 6 7 & 8
Yield (cwt/ac)
control penergetic
0
100
200
300
400
500
600
700
1 & 2 3 & 4 5 & 6 7 & 8
Yield (cwt/ac)
control penergetic
0
100
200
300
400
500
600
700
800
1 & 2 3 & 4 5 & 6 7 & 8
Yield (cwt/ac)
control penergetic
0
100
200
300
400
500
600
1 & 2 3 & 4 5 & 6 7 & 8
Yield (cwt/ac)
control penergetic
7 8 9
0
100
200
300
400
500
600
700
1 & 2 3 & 4 5 & 6 7 & 8
Yield (cwt/ac)
control penergetic
0
100
200
300
400
500
600
1 & 2 3 & 4 5 & 6 7 & 8
Yield (cwt/ac)
control penergetic
0
100
200
300
400
500
600
700
800
1 & 2 3 & 4 5 & 6 7 & 8
Yield (cwt/ac)
control penergetic
7 8 9
0
100
200
300
400
500
600
700
1 & 2 3 & 4 5 & 6 7 & 8
Yield (cwt/ac)
control penergetic
0
100
200
300
400
500
600
1 & 2 3 & 4 5 & 6 7 & 8
Yield (cwt/ac)
control penergetic
0
100
200
300
400
500
600
700
800
1 & 2 3 & 4 5 & 6 7 & 8
Yield (cwt/ac)
control penergetic
7 8 9
0
100
200
300
400
500
600
700
1 & 2 3 & 4 5 & 6 7 & 8
Yield (cwt/ac)
control penergetic
0
100
200
300
400
500
600
1 & 2 3 & 4 5 & 6 7 & 8
Yield (cwt/ac)
control penergetic
0
100
200
300
400
500
600
700
800
1 & 2 3 & 4 5 & 6 7 & 8
Yield (cwt/ac)
control penergetic
1 2 3
4 5 6
0
100
200
300
400
500
600
700
1 & 2 3 & 4
Yield (cwt/ac)
control penergetic
0
100
200
300
400
500
600
700
1 & 2 3 & 4
Yield (cwt/ac)
control penergetic
0
100
200
300
400
500
600
700
1 & 2 3 & 4 5 & 6 7 & 8
Yield (cwt/ac)
control penergetic
0
100
200
300
400
500
600
700
1 & 2 3 & 4 5 & 6 7 & 8
Yield (cwt/ac)
control penergetic
0
100
200
300
400
500
600
700
800
1 & 2 3 & 4 5 & 6 7 & 8
Yield (cwt/ac)
control penergetic
0
100
200
300
400
500
600
1 & 2 3 & 4 5 & 6 7 & 8
Yield (cwt/ac)
control penergetic
1 Ferme Rondeau, variety AC Chaleur 2 Ferme Rondeau, variety Goldrush 3 Ferme Fiset, variety Norland
4 Ferme Réal Pinsonneault & fils, variety Murdoch
5 Ferme Réal Pinsonneault & fils, variety Vivaldi
6 Ferme Isabel, variety Belmont
7 Ferme anonyme, variety Goldrush 8 Ferme Valupierre, variety Murdoch 9 Ferme MGE Ouellet, variety Russet

— 6968
Effect on productivity and quality in cherry orchards with the use of penergetic b and penergetic p as bio-stimulants for soil and plants.
Penergetic Chile Agrotrust Ltda. Soc. Comercial
More yield, better quality and larger cherries with penergetic
Orchard 1, 2016The evaluated treatments considered a control (T0) without application of the products to evaluate and a treatment (T1) with application of products to evaluate in an area of approximately 1.6 hectares. All the applications were made on the ridge with pulverizer and python aimed at the root zone.
Location: Reserva de Comalle, located in ComalleVariety: Cherry cv Royal DownStart test: August 2016End test: December 2016
Penergetic Pre- treatment
Pre- flower
Flowering Fruit set Post- harvest
Observations
penergetic b 300 gr/ha Application to the soil at the beginning of the season. Can be combined with herbicide.
penergetic p 250 gr/ha Can be mixed with NPK or foliar fertilizers. Fertilization reduce of 20%. Can be mixed with herbicides.
penergetic p 200 gr/ha
penergetic p 200 gr/ha
penergetic b 300 gr/ha To improve the soil and com-posting of organic matter.
Dosage / Recommendations (same for both orchards)
Results
Field Fruit-bearing
Fruits /tree
Fruits / ASTT
T0 2,537 18.0
T1 2,449 15.0
Field Yield and productivity
kg / tree kg / ASTT kg / ha
T0 18.9 0.13 16,818
T1 19.8 0.12 17,600
Fruit-bearing load, yield and productivity
Operational business benefits
Results of the commercial evaluation of the products penergetic b and penergetic p
Calibration Color
ASTT: trunk cross-sectional area
Quality of the fruit
Field Mean fruit weight (grs)
T0 7.5
T1 8.2
Field Mean firmness (Lb)
T0 12.0
T1 11.9
Field Mean °BRIX
T0 15.6
T1 16.3
Fruit weight
Firmness
Soluble solids
+ 0.7 gr= 9.33%
+ 782 kg / ha= 4.65%
+ 0.7 gr= 4.49%
Field kg / ha cost / kg cost / ha NP / ha product cost / ha US$ US$ / ha
T0 16,818 1.2 20,182 56,752 0 36,571
T1 17,600 1.2 21,120 66,177 51 45,006
Difference 8,435
Orchard 1
pre caliber L XL J JJ XJJT0 0% 21% 63% 13% 4% 0%T1 0% 17% 48% 16% 17% 2%
0%
10%
20%
30%
40%
50%
60%
70%
Calibration curves
Light red Red MahoganyRed Mahogany Dark
MahoganyT0 10% 37% 40% 13% 0%T1 6% 33% 42% 17% 3%
0%5%
10%15%20%25%30%35%40%45%
Color curves
Orchard 1
pre caliber L XL J JJ XJJT0 0% 21% 63% 13% 4% 0%T1 0% 17% 48% 16% 17% 2%
0%
10%
20%
30%
40%
50%
60%
70%
Calibration curves
Light red Red MahoganyRed Mahogany Dark
MahoganyT0 10% 37% 40% 13% 0%T1 6% 33% 42% 17% 3%
0%5%
10%15%20%25%30%35%40%45%
Color curves

— 7170
These photos were taken in a farm in the area near Curicó where farmers are using penergetic
Orchard 2
Q XL J JJ XJJT0 0% 5% 18% 44% 34%T1 0% 3% 13% 25% 60%
0%
10%
20%
30%
40%
50%
60%
70%
Weight curves
Q XL J JJ XJJT0 0% 4% 17% 41% 38%T1 0% 1% 11% 28% 61%
-10%
0%
10%
20%
30%
40%
50%
60%
70%
Diameter curves
Orchard 2
Q XL J JJ XJJT0 0% 5% 18% 44% 34%T1 0% 3% 13% 25% 60%
0%
10%
20%
30%
40%
50%
60%
70%
Weight curves
Q XL J JJ XJJT0 0% 4% 17% 41% 38%T1 0% 1% 11% 28% 61%
-10%
0%
10%
20%
30%
40%
50%
60%
70%
Diameter curves
Orchard 2, 2017The evaluated treatments considered a control (T0) without application of the products to evaluate and a treatment (T1) with application of products to evaluate in an area of appro - xi mately 0.5 hectares each. The plants were planted in 2014 with a distance of 4.25 m x 2.3 m to each other.
Location: Agrícola Montefrutal, sector La Higuerilla, communitiy of Sagrada FamiliaVariety: Cherry cv LapinsStart 2. test: September 2017End 2. test: December 2017
Results Fruit quality
Calibration curves
Field Yield
Fruit /plant
kg / plant
kg / ha
T0 1188 10.5 9,347
T1 1377 16.6 14,711
Field Quality of fruit
Ø Weight in gram
Firmness DU
SS °Brix
T0 11.6 70.0 19.8
T1 12.5 75.1 18.6
+ 5,364 kg/ha= 57.38%
+ 0.9 gr= 7.8%
Weight and size
Calibration Q XL J JJ XJJ
Weight in gram 4.1-6.4 6.5-8.9 9.0-9.9 10.0-11.9 >12
Diameter in mm 22-24 24-26 26-28 28-30 >30
Weight Diameter

— 7372
Penergetic Costa Rica Fabricio Alfaro
Reduced nutrient loss and better nutrient uptake in rice cultivation
ClimateMaximum and minimum temperatures As can be seen in table 1, the maximum temperature during the period of the test was below 35°C, this being a critical value that can cause hollowing. Each degree of increase in temperature can cause up to 30% hollow grain. The minimum temperature is another very influential factor. Nocturnal temperatures should not be higher than 22°C; with each degree of increase, production can decrease by up to 15%. The tendency in the last few years has been towards an increase in minimum temperatures. This is presenting itself during this period, which has seen temperatures above 25°C. It is necessary to pay attention to it and to observe its impact on rice production and, even more so, on the selection of new materials. The rate of development of the crop is directly linked to the temperature, above a base temperature above which the crop grows until a maximum temperature is reached.
Maximum and minimum relative humidityTable 2 shows the values of maximum and minimum relative humidity during the test. Relative humidity is linked to solar radiation, for which reason, in general, it is not taken into account for evaluating its influence on yields. Rather, its influence is indirect, determining the higher or lower presence of diseases. As can be seen and for the period in which the test was performed, the relative humidity values were favourable; hence, no diseases presented themselves.
PrecipitationPrecipitation has little direct impact on the growth and development of the crop; its effect is more indirect, influencing sowing opportunities. Moreover, with rice being a flooded crop, the influence of precipitation is low. This crop cycle was characterised by a year denominated Niño, with a pattern of little precipitation, as can be seen in table 3, in which the maximum precipitation was 39.6 mm, with the aggregate amount for the period being 374.6 mm.
Rice – another basic foodstuff all over the world. This report demonstrates the effectiveness of penergetic p in rice cultivation. Measurement test of the effect of penergetic b and penergetic p in the cultivation of rice in the variety Lazarroz in Hacienda Mojica Ing. Hernán Rodríguez A. 2016
Final Report
This study is an effort to provide new tools in managing the cultivation of rice, as part of a commitment to give the farmer basic information for making decisions in the agronomic management of rice cultivation.The application of products that improve the efficiency of utilisation and absorption of the nutrition employed is becoming of vital importance, taking into account that fertilization is one of the highest-costing roubles in rice production. Fertilization is performed according to the phenological stages and for this it is done taking into account the number of leaves growing, where V3, V4 indicates the start of tillering, V5, V6 active tillering and V8, V9 the start of floral primordium, these being the stages in which fertilization is performed. In this way, the work is done according to the moments the plant requires it. Moreover, index concepts are integrated, which allow us to
evaluate and quantify methods for achieving greater efficiency of N applied and to be able to synchronise the fertilization with demand for the crop. To carry out this study, we relied on the support and supervision of an interdisciplinary team, consisting of Dr. Rafael Salas, a specialist in soils, and Dr. Juan Ramón Navarro, a specialist in agricultural statistics.
Test of densities and increasing doses of nitrogen in two varieties of rice.
LocationThe proposed test was performed in Hacienda Mojica, located in the province of Bagaces, Costa Rica, which is located between the coordinates: 10.41804-85.181063.
Location of Hacienda Mojica Bagaces, Guanacaste, Costa Rica

— 7574
RadiationSolar raditation (table 4) is the climatic variable with the greatest effect on yields. Its effect is minor in the first stages of development. However, it is very strong in the reproductive stage (from differentiation of the primordium to the flowering period), affecting the number of grains per panicle.
TestTo develop the study, the following protocol was used:
Evaluation of the products penergetic b and penergetic p
Variety: Lazarroz The experimental design used was that of
simple random sampling without replacement Weights and germination tests 5 treatments and 5 repetitions were
established Setup in the field (marking, sowing and
fertilization) Evaluation of pests and diseases Application of fertilization in the
corresponding periods Harvest
Distribution of treatments in the test fieldThe experimental units were distributed in the field at random in order to follow the statistical model of simple random sampling without replacement.
Management of the testCharacteristics of the test soilThe test soil is classified as: Fluventic Ustropept
Fluventic = alluvial plain Ust = Practical humidity pattern;
the soil remains dry for 90 days or more consecutively
Ept = Inceptisol, well defined soils with horizonThe soil analyses are presented in table 6. As can be seen, the phosphorus is the element that presents a concentration far below the established critical value.
Temperatures
10
15
20
25
30
35
40
45
01. M
rz
08. M
rz
15. M
rz
22. M
rz
29. M
rz
05. A
pr
12. A
pr
19. A
pr
26. A
pr
03. M
ai
10. M
ai
17. M
ai
24. M
ai
31. M
ai
07. J
un
14. J
un
21. J
un
28. J
un
05. J
ul
12. J
ul
19. J
ul
26. J
ul
Time in days
TEMP_C_Max
TEMP_C_Min
0
20
40
60
80
100
120
01. M
rz08
. Mrz
15. M
rz22
. Mrz
29. M
rz05
. Apr
12. A
pr19
. Apr
26. A
pr03
. Mai
10. M
ai17
. Mai
24. M
ai31
. Mai
07. J
un14
. Jun
21. J
un28
. Jun
05. J
ul12
. Jul
19. J
ul26
. Jul
Time in days
Relative humidity
Relative humidity
RH_Max(%)
RH_Min(%)
Precipitation (mm)
Radiation Mj/m2/day
05
1015202530354045
01. M
rz
08. M
rz
15. M
rz
22. M
rz29
. Mrz
05
. Apr
12. A
pr
19. A
pr26
. Apr
03
. Mai
10
. Mai
17
. Mai
24
. Mai
31
. Mai
07
. Jun
14
. Jun
21
. Jun
28
. Jun
05
. Jul
12
. Jul
19
. Jul
26
. Jul
Time in days
Precipitation (mm)
Precipitation (mm)
0
5
10
15
20
25
01. M
rz08
. Mrz
15. M
rz22
. Mrz
29. M
rz05
. Apr
12. A
pr19
. Apr
26. A
pr03
. Mai
10. M
ai17
. Mai
24. M
ai31
. Mai
07. J
un14
. Jun
21. J
un28
. Jun
05. J
ul12
. Jul
19. J
ul26
. Jul
Time in days
Radiation
Radiation Mj/m2/day
Precipitation (mm)
Radiation Mj/m2/day
05
1015202530354045
01. M
rz
08. M
rz
15. M
rz
22. M
rz29
. Mrz
05
. Apr
12. A
pr
19. A
pr26
. Apr
03
. Mai
10
. Mai
17
. Mai
24
. Mai
31
. Mai
07
. Jun
14
. Jun
21
. Jun
28
. Jun
05
. Jul
12
. Jul
19
. Jul
26
. Jul
Time in days
Precipitation (mm)
Precipitation (mm)
0
5
10
15
20
25
01. M
rz08
. Mrz
15. M
rz22
. Mrz
29. M
rz05
. Apr
12. A
pr19
. Apr
26. A
pr03
. Mai
10. M
ai17
. Mai
24. M
ai31
. Mai
07. J
un14
. Jun
21. J
un28
. Jun
05. J
ul12
. Jul
19. J
ul26
. Jul
Time in days
Radiation
Radiation Mj/m2/day
Table 1 Maximum and minimum temperatures in º C from 1/03/2016 to 31/07/2016
Table 2 Graph of maximum and minimum relative humidity in the period from 01/03/2016 to 31/07/2016
Table 3 Precipitation chart for the period from 01/03/2016 to 31/07/2016
Table 4 Radiation in Mj/m²/day for the period 01/03/2016 to 31/07/2016
Treatment Treatment
M1 Trichoderma + penergetic p (application 22 days after seeding)
M2 Farm witness (control)
M3 penergetic b in V2 + penergetic p in V4
M4 penergetic b in V2
M5 penergetic p in V4
Table 5: Distribution of treatments in test field
penergetic b – 100 gr Bentonite + 100 ml Molassespenergetic p – 200 ml Molasses
Table 6: Soil analysis Río Blanco plot
Concentration of elements in the soil
Identification pH cmol (+) / l Cationic ratios mg / l
H2O Ca Mg K Ac. Int CIC E Ca / Mg Ca / K Mg / K Ca + Mg / K P Cu Fe Mn Zn
PLOT C10 5.7 12.6 4.91 0.29 0.16 18.0 2.58 43.6 16.9 29.59 2 11 61 62 4.8
Notes:1. The units are expressed in m/vol (cmol(+)/L, %=g/100 ml, mg/L).2. Procedure: pH in water, in soil: solution ratio 1:2.5; acidity, Ca and Mg in KCl 1M, 1:10; P, K, Zn, Fe, Mn and Cu in Olsen Modified (NaHCO3 0.5M, disodic EDTA 0.01M, Superfloc 127, pH 8.5), 1:10. Acidity by titling (CIA-SC09-01-02-P04)*, P for Spectrophotometry UVV (CIA-SC09-01-02-P06)* and the rest for Spectrophotometry of AA (CIA-SC09-01-02-P05)*.* www.eca.or.cr (Laboratory of Soils and Foliage, Centre of Agronomic Studies, University of Costa Rica).

— 7776
Evaluated productsThe products that are going to be evaluated are:
penergetic b“penergetic b is a bio-stimulant developed in Switzerland whose objective is to increase and improve the biological activity of the soil. This makes it possible to make efficient use of organic resources such as stubble and other vegetal residues, as well as recycling nutrients in the soil and thus leaving them available for crop. penergetic b is an environmentally friendly and efficient product that achieves good results with low dosages. It is easy to use, as it can be combined with herbicides. It is a novel economic tool and efficient for keeping soil healthy”. Tec. Adrian Gutiérrez. (2016)Improves and accelerates the process of decomposition and mineralisation of the stubble, establishes a better balance of the
microorganisms of the soil, stimulates the formation of humus.
penergetic pA bio-stimulant developed in Switzerland with high technology whose objective is to promote vigorous and healthy development of crops. It manages to increase the productive potential of these by making better use of the resources available in the environment and of those supplied by man. An enhancer of growth, it increases the root mass, reduces the use of pesticides and fertilizers, increases the efficiency of consumables and improves the assimilation of nutrients by the plant.
Variety LazarrozIts main characteristics include:
Average days to harvest: 115 to 120 days Intermediate tillering Moderately tolerant of flattening Average plant height 115 to 120 cm Less than 10% hollowing Type of growth: semi-erect Low threshing Weight of a thousand grains: 27.7 gr Long grain Entire grain 90 % Mill yield 69 % Entire yield 62 % Amylose 29.7 % White centre 0.8 Good cooking (50 to 60 days)
Phenological stages in riceThe system of description of the stages of development allows better identification of the crop development. This provides a better tool for performing work such as fertilization at the time when the crop requires it. And not with the method of days often used by old-fashioned fertilization. This system, proposed by Counce, is based on the number of leaves, where S is denominated for the stages of seed germination, V for the leaves, the first complete leaf with the presence of a foliar necklace being on the main stem, and R for the panicle formation stage, initiating floral primordium until physiological maturity (Counce, 2003).
Dosage N P2O5 K2O S Stage
29.3 – 23.2 – 0 4 58.6 46.4 V4
18.6 – 14.7 – 13 – 6.6 (S) 6 55.8 44.1 45 19.8 V6
27.4 – 0 – 14.4 – 7.3 (S) 5.5 75.35 39.6 16.5 V9
189.75 90.5 84.6 36.3
Phenological Stage Element: N Element: P2O5 Element: K2O
V3 – V4 31 % 51 % 0 %
V6 – V7 30 % 49 % 53 %
V8 – V9 39 % 0 % 47 %
Distribution and periods of application of the fertilizerThe periods and distribution of the fertilizer are shown in the following boxes
The applications of fertilizer were performed in the periods described in table 8; the phenological stages were determined as key in the agronomic management of the rice.
Table 7: Fertilizer applied per element
Table 8: Percentage distribution of fertilizer per element per phenological stage.
V2 V3 V4 V6
V7 R4 R9
V2 V3 V4 V6
V7 R4 R9
V2 V3 V4 V6
V7 R4 R9
V2 V3 V4 V6
V7 R4 R9
V2 V3 V4 V6
V7 R4 R9
V2 V3 V4 V6
V7 R4 R9
V2 V3 V4 V6
V7 R4 R9
V2
V7
V3
R4
V4
R9
V6
Main phenological stages on the rice plant

— 7978
0
50
100
150
200
250
M1 M2 M3 M4 M5
)ah/gk( N noitprosb
A
Treatments
grain N
straw N
total
0
10
20
30
40
50
60
70
80
90
100
P M1 M2 M3 M4 M5
Abs
orpt
ion
P (k
g/ha
)
Treatments
grain P
straw P
total
0
50
100
150
200
250
300
350
M1 M2 M3 M4 M5
Abs
orpt
ion
K (k
g/ha
)
Treatments
grain K
straw K
total
0
50
100
150
200
250
M1 M2 M3 M4 M5
)ah/gk( N noitprosb
A
Treatments
grain N
straw N
total
0
10
20
30
40
50
60
70
80
90
100
P M1 M2 M3 M4 M5
Abs
orpt
ion
P (k
g/ha
)
Treatments
grain P
straw P
total
0
50
100
150
200
250
300
350
M1 M2 M3 M4 M5
Abs
orpt
ion
K (k
g/ha
)
Treatments
grain K
straw K
total
Arial 9: Production Ich kann leider nur die Achsenbeschriftungen, nicht aber die Datenlegende verändern.
Falls Du die Balken ohne P ausschneiden willst und ins Original einfügen
0
5
10
15
20
25
30
35
40
M1 M2 M3 M4 M5
)ah/gk( S,gM,a
C noitprosbA
Treatments
Ca*
Mg*
S*
0
1000
2000
3000
4000
5000
6000
7000
8000
9000
10000
M1 M2 M3 M4 M5
)ah/gk( L dna S noitcudorP
Treatments
Production
0
10
20
30
40
50
60
70
80
90
100
P M1 M2 M3 M4 M5
Table 11 Average absorption of phosphorous kg/ha in V6 and R9
potassium absorbed is in the straw and not in the grain. This indicates that it is found in high availability in the soil, since this absorption corresponds to the native elements and those added by the fertilizer. Table 16: The same trend is reflected as in the previous graphs, where treatment M5 is the one with the highest absorption and treatment M4 the one with the lowest absorption. Table 17: As shown in table 10, treatment 5 is the one that obtained the highest yield and treatment 4 the one with the lowest production.
Final conclusions As was seen in the previous charts, treatment 5,
in which only penergetic p was used, was where the best results were achieved, both in production – 9.213 kg/ha – and in absorption of all the nutrients analysed. This is described in the literature as one of its functions, the increase in efficiency in the absorption of nutrients and an increase in yields.
Treatment 4, penergetic b, was the one with the lowest yield – 6134.67 kg/ha. It also showed lower absorption of all the nutrients. The conclusion is that it will be necessary to evaluate this product in various cycles due to its mode of action.
Establish these tests in the dry period to obtain clearer production data.
ResultsThe following tables show the data obtained from the samples sent to the soil laboratory of the UCR (CIA).
Absorption in kg/ha in the different phenological stagesIn table 10, it can be seen that treatment M5 is the one that had the highest absorption of nitrogen, with treatment M4 being the one with the lowest absorption. As is seen in table 10, after V6 there is a greater increase in the absorption of nitrogen. In table 11, it can be seen that treatment 5 is the one with the highest absorption of phosphourus and that treatment 4 is the one with the lowest, with a greater increase in absorption in all the treatments of stage V6 to R9. In table 12, treatment 5 is the one with the highest absorption of potassium and treatment 4 the one with the lowest absorption, with treatment 3 second in terms of absorption at 293.24 kg / ha. In table 13, all the treatments absorbed more nitrogen in grain than in biomass, with treatment 5 being the one with the highest absorption. In table 14 it is shown that there is greater absorption of phosphorus in the biomass than in the grain in all the treatments, with treatment 5 being the one with the highest absorption and treatment 4 the one with the lowest. In table 15, it can be highlighted that the majority of the
167.68157.11 163.09
112.62
192.88
0
50
100
150
200
250
M1 M2 M3 M4 M5
Abs
orpt
ion
N (k
g/ha
)
Treatments
V6
R9
Total
0
10
20
30
40
50
60
M1 M2 M3 M4 M5
)ah/gk( P fo noitprosbA
Treatments
V6
R9
Total
263.83 248.43
293.24
196.30
345.52
0
50
100
150
200
250
300
350
400
M1 M2 M3 M4 M5
)ah/gk( K fo noitprosb
A
Treatments
V6
R9
Total
0
50
100
150
200
250
M1 M2 M3 M4 M5
)ah/gk( N noitprosb
A
Treatments
grain N
straw N
total
0
10
20
30
40
50
60
70
80
90
100
P M1 M2 M3 M4 M5
Abs
orpt
ion
P (k
g/ha
)
Treatments
grain P
straw P
total
0
50
100
150
200
250
300
350
M1 M2 M3 M4 M5
Abs
orpt
ion
K (k
g/ha
)
Treatments
grain K
straw K
total
Table 10 Absorption of nitrogen (kg/ha) in V6 and R9
Table 12 Average absorption of potassium (kg/ha) in V6 and R9
Table 14 Absorption phosphorus in grain and straw in kilos per hectare
Table 16 Total absorption Ca, Mg, S in kilos per hectare
Table 13 Absorption nitrogen in grain and straw in kilos per hectare
Table 15 Absorption potassium in grain and straw in kilos per hectare
Table 17 Dry and clean production in kilos/ha per treatment
Treatment Yield / ha Grain / straw ratio Harvest index EI FPP
M1 8,606.67 0.94 0.48 51.33 45.36
M2 7,684.00 0.95 0.49 48.91 40.50
M3 9,150.67 0.94 0.49 56.11 48.22
M4 6,134.67 0.93 0.48 54.47 32.33
M5 9,213.33 0.93 0.48 54.47 48.56
Suitable 0.70 – 0.80 0.45 ≥ 50 50 – 60
Table 9: Efficiency indices in nitrogenised fertilization in the test treatments
The results of the previous box indicate that for the harvest index, which is the ratio of the weight of the grain to the total biomass including the grain and the ratio of grain to straw, the values obtained for all the treatments are higher than the desired values.
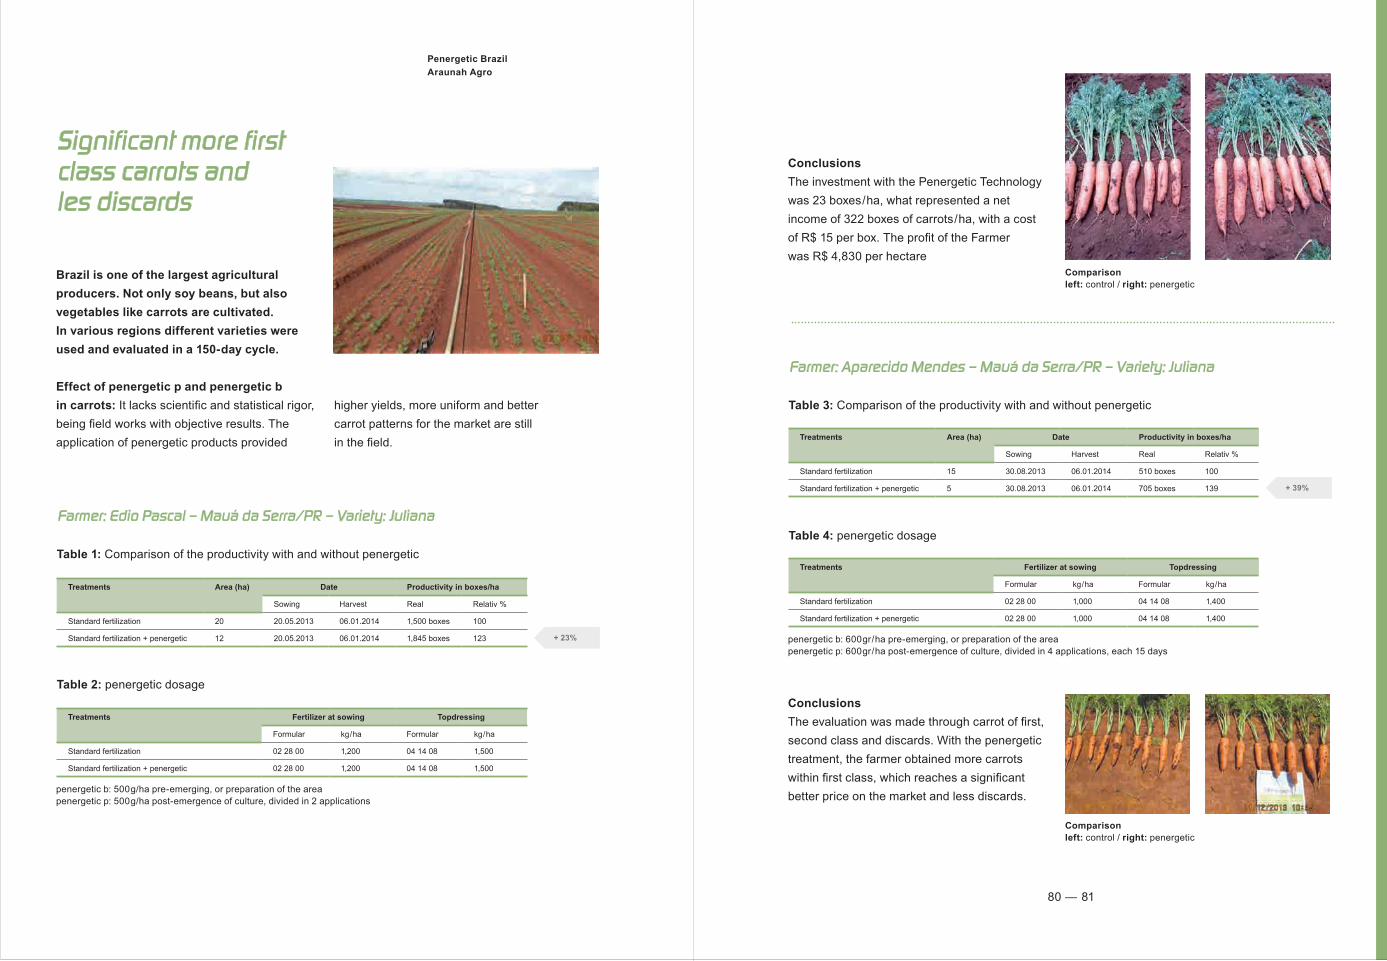
— 8180
Penergetic BrazilAraunah Agro
Significant more first class carrots and les discards
Brazil is one of the largest agricultural producers. Not only soy beans, but also vegetables like carrots are cultivated. In various regions different varieties were used and evaluated in a 150-day cycle.
Effect of penergetic p and penergetic b in carrots: It lacks scientific and statistical rigor, being field works with objective results. The application of penergetic products provided
higher yields, more uniform and better carrot patterns for the market are still in the field.
Farmer: Edio Pascal – Mauá da Serra/PR – Variety: Juliana
Treatments Area (ha) Date Productivity in boxes/ha
Sowing Harvest Real Relativ %
Standard fertilization 20 20.05.2013 06.01.2014 1,500 boxes 100
Standard fertilization + penergetic 12 20.05.2013 06.01.2014 1,845 boxes 123
Treatments Fertilizer at sowing Topdressing
Formular kg / ha Formular kg / ha
Standard fertilization 02 28 00 1,200 04 14 08 1,500
Standard fertilization + penergetic 02 28 00 1,200 04 14 08 1,500
Table 1: Comparison of the productivity with and without penergetic
Table 2: penergetic dosage
+ 23%
penergetic b: 500 g/ha pre-emerging, or preparation of the areapenergetic p: 500 g/ha post-emergence of culture, divided in 2 applications
Conclusions The investment with the Penergetic Technology was 23 boxes / ha, what represented a net income of 322 boxes of carrots / ha, with a cost of R$ 15 per box. The profit of the Farmer was R$ 4,830 per hectare
Conclusions The evaluation was made through carrot of first, second class and discards. With the penergetic treatment, the farmer obtained more carrots within first class, which reaches a significant better price on the market and less discards.
Comparisonleft: control / right: penergetic
Comparisonleft: control / right: penergetic
Farmer: Aparecido Mendes – Mauá da Serra/PR – Variety: Juliana
Table 3: Comparison of the productivity with and without penergetic
Treatments Area (ha) Date Productivity in boxes/ha
Sowing Harvest Real Relativ %
Standard fertilization 15 30.08.2013 06.01.2014 510 boxes 100
Standard fertilization + penergetic 5 30.08.2013 06.01.2014 705 boxes 139 + 39%
Table 4: penergetic dosage
Treatments Fertilizer at sowing Topdressing
Formular kg / ha Formular kg / ha
Standard fertilization 02 28 00 1,000 04 14 08 1,400
Standard fertilization + penergetic 02 28 00 1,000 04 14 08 1,400
penergetic b: 600 gr / ha pre-emerging, or preparation of the areapenergetic p: 600 gr / ha post-emergence of culture, divided in 4 applications, each 15 days

— 8382
Farmer: Irmãos Bergamasco – Perdizes County/MG – Variety: Bangoea
Treatments Productivity in boxes / linear meter
Real Relativ %
Standard fertilization 3,600 boxes 100
Standard fertilization + penergetic 4,340 boxes 121
Treatments Fertilizer at sowing Topdressing
Formular kg / ha Formular kg / ha
Standard fertilization 02 30 10 2,000 12 06 18 300
Standard fertilization + penergetic 02 30 10 2,000 12 06 18 300
Table 1: Comparison of the productivity with and without penergetic
Table 2: penergetic dosage
+ 21%
penergetic b: 600 gr/ha pre-emerging, or preparation of the areapenergetic p: 600 gr/ha post-emergence of culture, divided in 4 applications, each 15 days
Conclusions The good results were possible, although the area hat high level of nematodes.
Comparisonleft: penergetic / right: control
Dosage and test design for all applications
Test overview period February 2018 until June, 2018
Dosage penergetic b: 100 gr / ha penergetic p (molasses): 50 ml / ha penergetic p (powder): 50 gr / ha
Test design penergetic b:
15 days before planting applied without fertilizer
penergetic p: 15 days, 30 days, 45 days and 60 days after planting (molasses and powder)
Penergetic U.A.E. Lanner General Trading L.L.
Interesting results regarding vegetable growth in the desert
Case 1 Okra (Abelmoschus esculentus)
Observations The stem and the nodes are stronger The growth rate becomes fast The number of nodes increases which
leads to more production Reduction of the downy mildew and
erysiphales without application of pest spray and vitamins
The color of okra becomes darker and shiny
ConclusionApplying penergetic b and p in okra plant improves the quality of the plant itself. It strengthens the stem and nodes, which results in higher production rate, having a higher quality in terms of size, color, smell and taste.
Much importance is given to organically produced food in Abu Dabi. Practically without soil and water, but with a well elaborated management program and penergetic products, amazing things can be achieved.

— 8584
Case 4 Onion (Allium Cepa)
Test site Open field, Abu Dhabi Located in Excalibur Organic Farm,
Al Bahia, Abu Dhabi
Observations Increase the size of onion by 20% from
the normal onion harvested The outer layer of the bulb or tunic
becomes thicker Improvement of quality, smell or aroma
and production Longer shelf life span having the same
100% quality The onion bulb is stronger after the
application The taste becomes sweeter and juicier The shoot and the stem bark becomes
thicker, longer and the color becomes darker and shiny
No evidence of black mould on the tunic bulb
ConclusionIt is therefore concluded that by applying penergetic b and p, regeneration of soil life as well as the formation speeds up the rotting process. It becomes unsusceptible to black mould and other diseases even without using pesticides or other artificial sustenance. The taste quality increases and it boosts the nutritional composition of the onion such as the calcium, iron foliate, magnesium, phosphorus and potassium. There is an improvement in the physical appearance; it becomes firm and compact with no abnormal development and the outer skin or tunic is strong enough to protect the flesh of the bulb.
Case 3 Beetroot
Test site Open field, Abu Dhabi Located in Excalibur Organic Farm,
Al Bahia, Abu Dhabi
Observations The roots become longer, and increase
of root nodes The size of beetroot becomes bigger,
colors become darker and there is an increase in sweetness
Increase of production by 40% Unsusceptible to diseases and pest
ConclusionThe application of both penergetic b and p has provided a big difference regarding the previous harvest. The production increases, the quality and the cost in terms of maintenance, using own organic spray or own organic fertilizer are reduced.
Case 2 Cucumber (Cucumis sativus)
Test site 18 greenhouses having 4,896 sqm Located in Excalibur Organic Farm,
Al Bahia, Abu Dhabi
Observations The roots increase their quantity and
dimension by 20% to 30% that helps to strengthen the growth and immune system from sickness and insects
Improvement of quality, taste, smell or aroma and size
Increase in production by 30% to 40% from the normal harvest
Extend the shelf life of the product The harvesting period increased from
65 days to 80 days Reduce the application of own organic
fertilizer (vitamins and nutrients) by 40%
ConclusionApplying penergetic b and p (use small quantity per hectare) regenerates the soil life (humus formation) as well as the formation of mycorr-hizae. By activating soil life, soil fertility is lastingly improved and the soil structure (tillage) is optimized. In addition, rotting is promoted (aerobic metabolic processes in the soil), which speeds up the rotting process. The application increases the growth rate, quality and production of cucumber.
left: control / right: penergetic After application of penergetic b and p

— 8786
Case 5 Potato (Solanum tuberosum)
Test site Al Wathba Farm, Abu Dhabi
Observations The stems are thicker and taller from
40 cm to 50 cm Strong endurance to phytophthora infestation The tuber increases its production from 3 to 5 The outer layer skin is stronger and
unsusceptible for scratches or damages The size increases to 5% The color becomes whiter and shiny Longer shelf life having the same quality in
terms of taste, smell and appearance Increase in production by 30% to 40%
ConclusionApplying penergetic b and p in potato improves the production, having a higher quality in terms of size, appearance and taste.
Case 6 Corn (Zea mays)
Test site Open field Located in Excalibur Organic Farm,
Al Bahia, Abu Dhabi
Observations The corn stalk becomes greener,
taller and thicker The husk becomes thicker and greener
and protects more the kernel and the cob
Instead of one cob they have two cobs of the same size
The corn cob is more covered with kernels The kernels are bigger, heavier, tastier
and become golden yellow There is an increase of production by 40%
ConclusionThe application of penergetic b and p has tremendously increased the harvest. It provides not only quantity but it also improves the net weight, color, size and quality.
After application of penergetic b and p
Farm Visit from the Minister of Climate Change and Environment (middle) (left: Mr. Saif Almahairi, right: Mr. Sameer (Agr. Ing.))
Dosage and test design for all applications
Test overview period February 2018 until June, 2018
Dosage penergetic b: 100 gr / ha penergetic p (molasses): 50 ml / ha penergetic p (powder): 50 gr / ha
Test design penergetic b:
15 days before planting applied without fertilizer
penergetic p: 15 days, 30 days, 45 days and 60 days after planting (molasses and powder)

— 8988
Penergetic Greece DEC GmbH, Gert Dieterle
Neighboring farmers are shocked about the huge difference in cotton fields
Cotton is used in different areas of our daily life, such as clothing, medicine, household etc. of our living environment. It is recommendable to use as less pesticides and sprays as possilble.
Evident difference between penergetic treated cotton plants and control The difference between penergetic plants and control plants was evident from beginning. Between the 2nd and 3rd fertilization application the neighbor farmers were shocked about the big difference, also to their own plants and they asked, what he has done on his trial field.
Area: 72 stremma or 7.2 ha Quality of the soil: PoorApplied products:
penergetic p molasses penergetic p bentonite Nitrogen N40 and N46 Pesticides
Applications 3rd June – 4 leaf stage –
300 ml / ha penergetic p molasses 14th June – plant height 25 cm –
300 ml / ha penergetic p molasses 20th July – fertilization application –
300 gr / ha penergetic p bentonite.
Observed differences on the penergetic plants
much more intense in green color looking much more healthy 5–10 cm more height complete root system was much longer
and stronger than control higher cotton quality
Applications for one cotton season control field penergetic field
NPK € 1,224 € 1,224
Pesticides € 1,008 € 1,008
Herbicides € 720 –
penergetic products – € 375
Total costs € 2,952 € 2,607
Cotton harvest result Control field:
1 stremma / 200 kg or 1 ha / 2,000 kg penergetic field:
1 stremma / 360 kg or 1 ha / 3,600 kg » The profitability was close to 80%
The farmer has only used two times nitrogen (N40 and N46) and one time phosphorus and pesticides. The whole year he has not used any herbicides, e.g. against worms, like he did before.
The farmer was scared about the first application of penergetic and did not reduce the recommended Penergetic reduction of fertilizer and sprays by at least minus 20%.
» Additional income in 2017: € 7,257 = +128%
“ I have never seen that happen before. I will use Penergetic again!” D. Georgios, Greece
The pictures were taken during 2nd
spaying with molasses at 14th June 2017(left: penergetic, right: control)

— 9190
Penergetic Austria Penergetic Österreich
Field Report Viticulture – penergetic application since 2006
The Nepomuk Winery was a conventionally managed company until 2006. From 2006 on, penergetic products were added to the spraying agents. Spray was reduced each year until the final 65% reduction was achieved in 2011.
Status 2011: Reduction of conventional pesticides by approx. 65%
The Nepomuk Farm – our homeOur farm and its vineyards are nestled in the charming Arbesthaler hills, right in the middle of the wine region of Carnuntum – a liveable region that also offers many special features. When one thinks of Goettlesbrunn, one thinks of wine. No other beverage reflects the land from which it comes to a higher degree. Carnuntum is an ideal testing ground for modern cultivation and vinification of red wines. The hot, sunny climate between the Danube and Lake Neusiedl, together with the clay, sand, gravel and loess-soil, create the conditions that give the wines their unique-ness. The wine is in the truest sense of the word a natural product and the noblest embodiment of the spirit of nature. Through careful, selective harvesting of the grapes and a natural integrated management, we try to treat the wine respectfully in order to maintain its lightness and grandeur.
penergetic applications since 2006 In 2006, some penergetic products were
added to the conventional synthetic chemical pesticides. The conventional pesticides were reduced by approximately 10%.
In 2007, a special spray schedule was developed together with Mr. Christof Weber, and the conventional spray quantities could be reduced by 15 – 20%.
In 2008, more attention was paid to soil vitalization. The penergetic spray schedule was adapted accordingly. Conventional pesticides were already reduced between 30 – 40%.
In 2009, soil vitality was taken even more into account and the reduction of pesticides was increased to 50%.
In 2010, despite a very wet year, the conventional spray amount was reduced by 55%.
In 2011, soil vitalization and development of mycorrhiza were even more in focus. A 60% reduction of the conventional pesticides was planned. In 2011, partly even a 65% reduction took place – with the very best results and savings!
Cost-neutral applicationsSince application of the special spray schedule for viticulture in 2007, the treatments have always been cost-neutral. That is, the cost of the penergetic products was covered by the reduction of conventional pesticides. In the meantime, there is even an extra profit of 190 Euros per hectare due to the substantial reduction of pesticides.
Our assortment The focus of our company is on the local Austrian grape variety Zweigelt, which has long since made a name for itself well beyond Austria. But we also produce the internationally known wines of the burgundy group, such as Pinot blanc, Chardonnay, Pinot gris and Pinot noir, Merlot and Cabernet Sauvignon. Of course, we also have THE Austrian variety: the Grüner Veltliner, which is experiencing a renaissance at the moment and is also making an international breakthrough. We vinify our wines traditionally (large wood and steel) and internationally (barriques).
No additional work for penergetic applications No additional work is needed for the penergetic applications, as the products are simply added to conventional sprayings with the exception of the area composting, i.e. soil treatment in autumn. Here a separate spraying is done after the harvest. Normally leaf pulling is done one week after flowering with a device producing a pulsating airflow. Due to the permanent plant coverage, one can always drive in the vineyards.
Like that, diseases can be counteracted in time even with very wet conditions. Also soil erosion through wind and water can be kept at a minimum – on the contrary; actually, a build-up of humus is taking place.
No nitrogen applied for about 10 yearsSince 2003 no more spraying of acaricides (against mites). Since 2009 no more spraying against Botrytis. No nitrogen fertilization was applied for about ten years. For 2011, an application was planned. However, for the purpose of comparison some acres were treated not conventionally, but only with the addition of penergetic p molasses. However, due to the good development, no nitrogen fertilization took place in 2011 after all.
Better soil structureOver the years, the soil has become looser with better crumbling structure. A greater diversity of species, such as vetch, has developed. Insect pests like the rust mite have declined. The vines became more vigorous and above all more resistant to stress related diseases and rapidly changing weather conditions.
Christian and Maria Grassl

— 9392
Decreased pesticide useThe wine quality and also the sales increased generally in recent years. Especially the white series have gained in fruitiness and fullness. Generally speaking, pesticides were decreased annually by about 10% since we started applying the Penergetic technology (2006 minus 10% – 2011 minus 65%).
In 2010, we leased an additional ca. 3 acres. Here the pesticides were reduced by 50% immediately without any loss of quality or quantity.
Increasing annual profitBesides all the positive effects regarding to vitality of the vines, aeration of the soil and increasing quality of the wines produced, there is extra annual profit of 190 Euros per ha. And I think the end is not yet in sight.
Christian Grassl
Our Awards Rubin Carnuntum 2006
Falstaff 90 points (Falstaff is an Austrian magazine: www.falstaff.at)
Rubin Carnuntum 2007 NÖ WEIN 2008 (North East Wine): among the best
Merlot 2006 NÖ WEIN 2009: among the best. Falstaff 91 points
Exor 2007 (Zweigelt Reserve) NÖ WEIN 2009: among the best. Falstaff 91 points Salon Austria Wine 2010
Exor 2008 (Zweigelt Reserve) Falstaff 91 points
Cuvée Nepomuk 2005 Falstaff 91 points
Cuvée Nepomuk 2006 Falstaff 90 points
Cuvée Nepomuk 2007 Falstaff 90 points
Cuvée Nepomuk 2008 Falstaff 92 points
Grüner Veltliner Selektion 2008 Salon Austria Wine 2009
Grüner Veltliner Selektion 2009 Salon Austria Wine 2010
Penergetic Austria Penergetic Österreich
Diploma thesis to compare penergetic effects versus standard treatments
Effect of stone meals (penergetic) on the sensory parameters of wine carried out at Federal College and Federal Office for Viticulture and Fruit-Growing Klosterneuburg.
Diploma Thesis submitted by Marius PimpelOn the subjects of
plant protection (with exercises) Wine and fruit growing technological
laboratory (viticulture)Variety: Green Veltliner
Effect of plant tonics / fortifiersPlant tonics have no direct effect on harmful pathogens, but simply strengthen the resistance of the plant against pathogens (Harms and Walter,
2008). The main modes of action of plant tonics are increased plant resistance, promotion of rooting, growth and flowering, increase of yield, promotion of soil organisms and activation of existing nutrients and components. By judicious use of plant tonics, a prevalence of pathogens is prevented (Hofman, 1995). If used properly, the result should be healthier and better-growing plants, reduced losses and increased flower formation (Hall Mann, 2007) (Mohr, 2005). The resistive power of the plants is based either on the activation of plant defense mechanisms or on the hardening of tissue (Harms and Walter, 2008). Plant tonics must be used preventively in several applications, since they have no direct effect
against pathogens (Hall Mann, 2007). The plant- strengthening effect is difficult to verify scien- tifically in most cases (Harm, 2010). In the fight against decay plant tonics achieve similar results as unilateral leaf removal in the grape zone or like fungicides with additional Botrytis effect. There is currently no reliable evidence of a strengthening of the grape skin through treatment with plant tonics (Harms and Walter, 2008). In addition to resistance-inducing properties, a direct effect against certain stages of fungi development has been observed with some plant tonics (Harm, 2008).
Sprayings in the vineyard
Test design / Location: W. Glatzer, Göttlesbrunn (Carnuntum area) / Size: 2 plots – each with 3 rows and 30 vines. The rows are labeled at the upper end to separate from the rest of the vineyard. Then Michael Pimpel of Bayer Cropscience and Christof Weber of Weber Agrartechnik (penergetic products) made a spraying plan for each plot. The trial area was on a slight southern slope with sandy loess and subsoil of gravelly loam. Variant 1 (V1): The rows are treated with standard (100%) amounts of pesticides. Variant 2 (V2): The rows are treated with 30% less pesticides + penergetic p. When pesticides were reduced due to favourable weather conditions, etc., the reduction was done equally in both lots. The amounts of penergetic p were per plot 7 gr per treatment except for the spraying were 9 gr per plot at the at the time of budding.

— 9594
Evaluation of measurement of nutrient content and tace elements
Nutrients
June 21/2013 At the first time of leaf sampling (outgoing blossom) it is striking that the nitrogen content of the plant in variant 2 is clearly higher than in variant 1. Potassium is slightly higher in variant 2. Calcium could have been more in version 2 before the rainfall. Otherwise there is no significant difference in other nutrients.
August 17/2013The second leaf sampling shows a high, but equivalent amount of calcium in both variants. Nitrogen was used for chlorophyll synthesis. Potassium, magnesium and phosphorous are balanced.
September 01/2013The third leaf sampling that took place around the start of full ripening, did not show any greater changes. The calcium content rose and was even a bit higher in variant 1 than in variant 2. One could see that the grapes in variant 2 appeared riper.
Trace elements
June 21/2013 The values of iron and manganese are significantly higher in variant 1 than in variant 2. A big difference between the variants can be seen in copper. In this phase the values of the standard variant generally dominate. Since a lot of nitrogen was used for building chlorophyll in variant 2, it can be assumed that the trace elements were also consumed in the process.
August 17/2013This looks different, though. Here variant 2 dominates again, in particular regarding copper. Trace elements are replenished for the formation of chlorophyll.
September 01/2013The values of copper and zinc decreased in variant 2. Otherwise the values remained rather the same.
above: V1 (left) and V2 (right)
below: Spraying plan 2013 Marius Pimpel, Göttlesbrunn. Application was done using a motorized sprayer (petrol), provided by the trial farm. The objective was to apply the pro- ducts directly and make them stick to the leaves as well as possible.
V1 V2
Spraying Pesticide V1, Amount Standard IP V2, Amount penergetic Reason Date
1 Netzschwefel Stulln 4 kg / ha – 75 gr / plot 3 kg / ha – 50 gr + 9 gr penergetic p/plot
Leaf curl & mites 27/04/13
2 Netzschwefel Stulln 4 kg / ha – 45 gr / plot 30 gr/plot + 7gr penergetic p Oidium 09/05/13
Ortho Phaltan 500 SC
1 lt / ha – 30 ml / plot 20 ml / plot Peronospora 09/05/13
Envidor 9 ml / plot 6 ml / plot Mites 09/05/13
3 Collis 0.4 lt / ha – 9 ml / plot 6 ml / plot + 7gr penergetic p Oidium/Botrytis 24/05/13
Profiler 1,5 kg / ha – 40 gr / plot 30 gr / plot Peronospora 24/05/13
PH-Opti 0.2 ml / 100 lt 10 ml / 5 ml 0.2 ml / 100 lt 10 ml / 5 ml Miscibility 24/05/13
4 Collis 0.4 lt / ha – 9 ml / plot 6 ml / plot + 7gr penergetic p Oidium/Botrytis 08/06/13
Profiler 1,5 kg / ha – 40 gr / plot 30 g / plot Peronospora 08/06/13
PH-Opti 0.2 ml / 100 lt 10 ml / 5 ml 0.2 ml / 100 lt 10 ml / 5ml Miscibility 08/06/13
5 Luna Experience 0.2 lt / ha – 8 ml / plot 6 ml / plot + 7gr penergetic p Oidium 21/06/13
Melody Combi 2.0 kg / ha – 50 gr / plot 2.0 kg / ha – 35 gr / plot Peronospora 21/06/13
6 Runner 0.4 lt / ha – 9 ml / plot 0.4 lt / ha – 6 ml / plot + 7gr penergetic p
Tortrix, moth 05/07/13
Prosper 0.8 lt / ha – 18 ml / plot 0.8 lt / ha – 12 ml / plot Oidium 05/07/13
Melody Combi 2.0 kg / ha – 50 gr / plot 2 kg / ha – 35 gr / plot Peronospora 05/07/13
7 Prosper 0.8 lt / ha – 18 ml / plot 0.8 lt / ha – 12 ml / plot + 7gr penergetic p
Oidium 18/07/13
Ortho Phaltan 500 SC
1 lt / ha – 30 ml / plot 20 ml / plot Peronospora 18/07/13
Runner 0.4 lt / ha – 9 ml / plot 0.4 lt / ha – 6 ml / plot + 7gr penergetic p
Tortrix, moth 18/07/13
8 Prosper 0.8 lt / ha – 18 ml / plot 0.8 lt / ha – 12 ml / plot Oidium 05/08/13
Melody Combi 2.4 kg / ha – 50 gr / plot 2 kg / ha – 35 gr / plot Peronospora 05/08/13
9 Prosper 0.8 lt / ha – 18 ml / plot 0.8 lt / ha – 12 ml / plot Oidium 16/08/13
Melody Combi 2.4 kg / ha – 50 gr / plot 2 kg / ha – 35 gr / plot Peronospora 16/08/13
Spraying scheme 2013 Marius Pimpel, Göttlesbrunn
N K Mg Ca P N K Mg Ca P N K Mg Ca P
Fe Cu Zn Mn Fe Cu Zn Mn Fe Cu Zn Mn
Ave
rage
Res
ult i
n %
0,00
1,00
2,00
3,00
4,00
Ave
rage
Res
ult i
n %
0,00
1,00
2,00
3,00
4,00
Ave
rage
Res
ult i
n %
0,00
1,00
2,00
3,00
4,00
Ave
rage
Res
ult i
n pp
m
0
50
100
150
200
0
50
100
150
200
0
50
100
150
200
Ave
rage
Res
ult i
n pp
m
Ave
rage
Res
ult i
n pp
m
VariantsStandardpenergetic
VariantsStandardpenergetic

— 9796
DiscussionSustainability in crop protection is becoming a more and more important subject. Pesticides should be reduced and the environment should be protected, but at the same time high quality, healthy vine should end up in the wine glass of the consumer.
Great numbers of plant protection strategies are continuously being developed in order to not pollute the environment too much. Pesticides are reduced, sprays are skipped, but also weather stations and sophisticated programs like Vitimeteo are used to calculate the severity of attacks in order to achieve targeted applica-tions. Unfortunately, as it was the case in 2013 with Oidium, with varying degrees of success.
In this thesis, the attempt was made to compare a normal plant protection variant, treated as per normal IP praxis, to a variant that was treated with 30 percent less pesticides and strengthened by penergetic p.
The first major objective, support for maintaining the health of the vines, could be achieved as the grapes of the special variant were very healthy all the way till harvesting. It even went so far that the special version without Botrytis could be harvested in good condition whereas some rotting berries had to be removed in the IP variant.
The penergetic p has a similar effect as potassium silicate of hardening the skin of the berries and therefore less occurrence of Botrytis. This was already confirmed by “Harms and Walter 2008”.
SummaryIn modern plant protection various strategies have been tried and tested over and over again to protect plants successfully against a number of diseases. Moreover, it is a further challenge to use as small quantities of plant protection agents as possible, which is partly facilitated by the use of fungus-resistant varieties, which require far less plant protection. Thus, with questions of sustainability arising, this topic is gaining importance.
This diploma paper has investigated if lower amounts of chemical plant protection agents could be used, if their effect is enhanced by the use of penergetic p, which affect the plant similarly to plant fortifiers. The question arising is, if the plant can thus be protected as well against common diseases as with an ordinary IP concept.
A further consideration was if this more sustainable variant would enable the producer to receive an equally good or even fruitier product. A rating for diseases and nutrient analysis of the leaves should reveal any differences between the variants. Especially a testing for nitrogen contents, which play a crucial role in photosynthesis showed clear results.
At harvest it was striking that with the IP variant some diseased berries had to be removed from the clusters, whereas this was not necessary in the variant treated with penergetic p and lower amounts of synthetic spraying agents.
The second major objective (according to “Weber 2005”) was the propagated effect of penergetic p: increase of chlorophyll and photosynthesis performance for which increased nitrogen, but also trace elements are needed, could be demonstrated impressively by leaf sample measurements. Equally important in this comparison, according to “Walter Harms and 2008”, is better health of the “informed” grapes over the IP grapes.
As determined at the multiple tastings of the separately vinified batches, there were no differences between the wines except for small nuances. But the wine is young and the wines of 2013 generally develop rather slowly. So one would have to await the further development with age and then compare again.
At any rate, this plant protection comparison trial – including vinification – is a pointer in the direction of developing sustainable plant protection and an option to strengthen plant health and inherent resistance of the plants against fungi as well as reducing chemical pesticides considerably.
Viticulture will not be able to do completely without chemical products – especially in difficult years – but with the plant fortifying effect of penergetic p a new direction can be taken.
Apart from that, there were no significant differences between the variants, which can be judged as positive, since it reveals that lower expenditures regarding synthetic spraying agents combined with biological strengthening of the plants can lead to a healthy crop and consequently good wine.
If spraying passes are not reduced, but the amounts of spraying agents used per pass can be reduced by the support of the penergetic p, it is possible to not only boost photosynthesis, leading to healthy and vital plants, but also to tread new ways of sustainability in viticulture.

— 9998
Penergetic U.K. Penergetic UK Ltd.
penergetic b and penergetic p helps to compensate damages from slugs
Trials on wheat, oats and oil seed rape have been conducted over three years at Sudbury Park Farm Derbyshire. The fields show a good level of production with the Penergetic plots returning increased yield and crops that are better able to withstand challenges than the control plots.
The trials were all carried out at Sudbury Park Farm Derbyshire U.K. Two fields (Fischpond and Top Park) were selected, each with a defined control area and a testing area.
Wheat
Varieties Crusoe milling wheat and Skyfall milling wheat
Size of fields Fishpond
penergetic: 4.77 ha Control: 1.79 ha
Top Park penergetic: 8.84 ha Control: 15.72 ha
Doses of penergetic used 450 gr / ha of penergetic b
in October (2016/10/21) 200 gr / ha of penergetic p
in March (2017/03/16) 200 gr / ha of penergetic p
5 weeks later (2017/04/20) 200 gr / ha of penergetic p
5 weeks later (2017/05/22) 150 gr / ha of penergetic p
3 weeks later (2017/06/09) All other inputs remained the same,
the only difference between the treated and control plots was the addition of penergetic products
Yield Fishpond 2017 Yield Top Park 2017
Fishpond Harvest in tonnes / ha
Increase in tonnes
Increase in %
penergetic 10.380 0.550 5.5
Control 9.830
Top Park Harvest in tonnes / ha
Increase in tonnes
Increase in %
penergetic 10.170 1.160 12.9
Control 9.010
Yield comparison
11.47
8.7 9.01
13.38
9.16
10.17
0
2
4
6
8
10
12
14
16
Var. Crusoe 2015 Var. Crusoe 2016 Var. Crusoe 2017
Yield Top Park mt / ha
control penergetic
8.79.05
9.839.08 9.34
10.38
0
2
4
6
8
10
12
14
16
Var. Gallant 2014 Var. Crusoe 2016 Var. Skyfall 2017
Yield Fishpond mt / ha
control penergetic
11.47
8.7 9.01
13.38
9.16
10.17
0
2
4
6
8
10
12
14
16
Var. Crusoe 2015 Var. Crusoe 2016 Var. Crusoe 2017
Yield Top Park mt / ha
control penergetic
8.79.05
9.839.08 9.34
10.38
0
2
4
6
8
10
12
14
16
Var. Gallant 2014 Var. Crusoe 2016 Var. Skyfall 2017
Yield Fishpond mt / ha
control penergetic
penergetic: + 5.5% penergetic: + 12.9%
Due to difficult weather conditions harvest of Fishpond had to take place in two steps: The control plot was harvested on 15th August. A small part of the Penergetic plot was harvested on 16th August, the reminder on 27th August due to prolonged rain showers. The yields per hectare listed above refer only to the part of penergetic harvested on 16th August. However, the obtained samples should not be reliably used as a comparison.

— 101100
Winter oats
The trial was carried out at Sudbury Park Farm Derbyshire on the Kennel Park Field following the previous years crop of oil seed rape OSR variety Holl316.
Variety Winter Oats, 1st year
Winter oil seed rape, 1
The trial was carried out on Knoll field. This was the first year of OSR after six years of cereals.
Variety Elgar
Doses of Penergetic used 450 gr / ha of penergetic b
in October (2016/10/21) 200 gr / ha of penergetic p
in March (2017/03/16) 200 gr / ha of penergetic p
5 weeks later (2017/04/20) 200 gr / ha of penergetic p
5 weeks later (2017/05/22) 150 gr / ha of penergetic p
3 weeks later (2017/06/09) All other inputs remained the same,
the only difference between the treated and control plots was the addition of penergetic products
Doses of penergetic used 450 gr / ha of penergetic b
in September (2016/09/20) 225 gr / ha of penergetic p
6 weeks later (2016/10/31) 150 gr / ha of penergetic p
in March (2017/03/15) 200 gr / ha of penergetic p
5 weeks later (2017/04/19) 100 gr / ha of penergetic p
4 weeks later (2017/05/10) All other inputs remained the same,
the only difference between the treated and control plots was the addition of penergetic products
The crop in the penergetic plot suffered serious slug damage leading to a reduction in plant numbers, however the plants developed a deeper canopy and increased seed per plant to maintain a yield level of 4.44 tonnes per hectare equal to the control as shown on the pictures.
Yield
Analysis
Analysis
Kennel Park Harvest in tonnes / ha
Increase in tonnes
Increase in %
penergetic 8.680 + 0.400 + 4.8
Control 8.280
Knoll Moisture in % Oil content in %
penergetic 8.19 45.3
Control 7.97 45.2
Kennel Park kg / hl Moisture in %
penergetic 48.80 15.10
Control 48.70 15.10
penergetic: + 4.8%
ConclusionThe oats treated with penergetic b and p show an increase in yield towards the test field. Moisture stayed the same. Just before harvest was due to start there was a day of heavy rainfall with strong wind on the crop. It was noticed that the penergetic treated plot was able to withstand this better than the untreated with less plants falling due to the wet conditions.
ConclusionThe use of penergetic b and p helped to compensate for the damage caused by the slugs. The farm owner and staff at the farm commented that based on previous experience they expected greater losses where the slugs had been active.
ComparisonControl (above) and penergetic (below)
Yield results for 2018 for the oatspenergetic plot yielding 8.040 mt / ha and the control at 7.2 mt / ha.That's an increase of 840 kg per hectare.

— 103102
Winter oil seed rape, 2
We also conducted another trial in a field which had never previously received any penergetic products at all. We noticed that the crop was developing with uneven plant growth due to compaction of heavy low lying soil. Both areas had been sown at the same time and rate but as shown on the photograph taken on 12 April 2017 the area to left of the picture was flowering well ahead of that on the right. We decided to use penergetic p molasses as a spray at 200 ml per hectare to see if we could help rectify the situation. The second photograph taken on 4 May 2017 shows just how rapid the plants were able to catch up following the application of penergetic p on 13 April. The final yield was comparable to other OSR grown elsewhere on the farm at 3.8 tonnes per hectare.
12 April (above) and 4 May (below)The penergetic plot developes very well after an additional spray
Advantages in coffee planting when using cover crops and penergetic products
Penergetic Brazil
Fernandes et al. (2018) in an experiment conducted in:
Experimental Station Izidoro Bronzi, Araguari, Minas Gerais State, Brazil
Coffee farmers Association of Araguari (ACA)
Procafé Foundation
VarietyCatuaí Vermelho IAC 15, planted in a clay soil with a drip irrigation system, (2.3 lt / h water), 3.7 m x 0.7 m of space between the plants and same between the drip irrigators.
Treatments 1 Control 2 Control + cover crop (CC) mix 3 100% fertilizer* + PNG 4 100% fertilizer + PNG + CC mix 5 50% fertilizer + PNG 6 50% fertilizer + PNG + CC mix 7 100% fertilizer 8 100% fertilizer + CC mix 9 75% fertilizer + PNG 10 75% fertilizer + PNG + CC mix
* 450kg/ha of N, 85kg/ha of P2O5, 400kg/ha
of K2O (fertilizers applied per year).
Studying the effect of penergetic (PNG) and cover crops (CC) with different doses of PNG and chemical fertilizers on coffee plantation
Dr. Ademir Calegari Soil Scientist ResearcherSenior Agronomist IAPARLondrina, PR Brazil

— 105104
left: Coffee intercropped by mix cover cropsright: Coffee intercropped by mix cover crops after slashing
Cover crop mixThe cover crops Fagopirum esculentum (buckwheat), Crotalaria breviflora, Crotalaria ochroleuca, Mucuna prupriens (dwarf mucuna), Cajanus cajan (dwarf pigeon pea), pear millet and Vigna unguiculata (cowpea) were sowed broadcast between the coffee rows in a spring season, and after around 85–90 days they were slashed and the residues left covering the soil surface.
ResultsThe results showed important benefits of nutrients cycling by the cover crops, weed control between the coffee rows, and among others improving soil moisture and soil biology (biodiversity).
In table 2, the data comprising effects of penergetic and penergetic combined with cover crops, including or not chemical fertilizers, show significate differences in dry grain yield when compared with control plot. Very good results are obtained when penergetic is involved. Using cover crops + penergetic + 50% fertilizer (treatment 6), it was possible to achieve 65.6 bags of coffee (1 bag = 60 kg of dry bean coffee grain) per hectare. That is an increase
of 33% compared with treatment 2 (control + cover crops) and of 22% compared with treatment 7 (100% fertilizer).
With the Penergetic Technology and cover crops species intercropped and slashed in the flowering stage (when the soil contains reasonable nutrient levels), it is possible to reduce the dosis of chemical fertilizer and still have an increase in yield. Comparing treatment 7 (100% fertilizer) and treatment 10 (75% fertilizer + PNG + CC), treatment 10 realized 33% more yield.
Table 3 is presenting the ranking achieved and compared among all treatments. Comparing treatment 10 (75% fertilizer + PNG + CC mix) and treatment 6 (50% fertilizer + PNG + CC mix), probably the costs of fertilizer are quite similar to the grain coffee improvement. This leads to conclude that with 50% fertilizer + PNG + CC mix, it´s possible to achieve high coffee grain yield with profitability, and almost 23% higher yield when compared to treatment 7 with just 100% chemical fertilizer.
ConclusionsIt may be preliminarily concluded that:
The use of Penergetic Technology for soil and plants is beneficial for the nutrition of the coffee plant, especially when it is combined with CC mix
With CC mix, the productivity was higher in all the treatments, compared to the treatments without CC mix
The inclusion of CC mix in the coffee production system in the Minas Gerais
is promising, because it allows the increase of the biomass produced, in addition to signaling potential gains in coffee productivity over a period of several seasons
The use of Penergetic Technology in all chemical fertilizer dosis tested, when CC mix is included, occur like a synergism, and in all treatments coffee dry grain yield was increased
6153.2
61.1
105.6
48.4
18.5 17 19.831.5
15.7
159.6
132.1
109.3
188
101.3
18.6 13.7 15
37.1
16.69.7 10.7 11.8
18.110.7
0
20
40
60
80
100
120
140
160
180
200
control + CC 100% fertilizer(control) + CC
100% fertilizer + PNG + CC
75% fertilizer + PNG + CC
50% fertilizer + PNG + CC
N P2O5 K2O Ca Mg
Table 1: Nutrients cycling by the cover crops
67.6
60.5
60.5
50.8
65.6
60.5
55.4
53.4
43.8
41.8
0 5 10 15 20 25 30 35 40 45 50 55 60 65 70
10 75% fertilizer + PNG + CC
9 75% fertilizer + PNG
8 100% fertilizer + CC
7 100% fertilizer
6 50% fertilizer + PNG + CC
5 50% fertilizer + PNG
4 100% fertilizer + PNG + CC
3 100% fertilizer + PNG
2 control 1 + CC
1 control
Yield in bags/ha
41.8
43.8
50.8
53.4
55.4
60.5
60.5
60.5
65.6
67.6
0 5 10 15 20 25 30 35 40 45 50 55 60 65 70
1 control
2 control 1 + CC
7 100% fertilizer
3 100% fertilizer + PNG
4 100% fertilizer + PNG + CC
5 50% fertilizer + PNG
8 100% fertilizer + CC
9 75% fertilizer + PNG
6 50% fertilizer + PNG + CC
10 75% fertilizer + PNG + CC
Yield in bags/ha (rank order)
67.6
60.5
60.5
50.8
65.6
60.5
55.4
53.4
43.8
41.8
0 5 10 15 20 25 30 35 40 45 50 55 60 65 70
10 75% fertilizer + PNG + CC
9 75% fertilizer + PNG
8 100% fertilizer + CC
7 100% fertilizer
6 50% fertilizer + PNG + CC
5 50% fertilizer + PNG
4 100% fertilizer + PNG + CC
3 100% fertilizer + PNG
2 control 1 + CC
1 control
Yield in bags/ha
41.8
43.8
50.8
53.4
55.4
60.5
60.5
60.5
65.6
67.6
0 5 10 15 20 25 30 35 40 45 50 55 60 65 70
1 control
2 control 1 + CC
7 100% fertilizer
3 100% fertilizer + PNG
4 100% fertilizer + PNG + CC
5 50% fertilizer + PNG
8 100% fertilizer + CC
9 75% fertilizer + PNG
6 50% fertilizer + PNG + CC
10 75% fertilizer + PNG + CC
Yield in bags/ha (rank order)
Table 2: Productivity of the treatments in the 2nd year of the trial
Table 3: Ranking productivity results

boosts
the immunesystem
improves
digestion
BETTER
nutrient utilization
IMPROVES
meat quality
PROMOTES
weight gain
Benefits Better conditions for livestock
Single feedstuff
Less stress and improved well-being
of the animals
Improves digestion
Boosts the immune system
Promotes better feed conversion
Stabilized quality and production
Greater weight gain
Improved meat quality
penergetic t is a feed supplement, which improves the quality in livestock farming. The product promotes a better feed efficiency and regulates the animals’ immune system and regenerative capacities. It also has a positive effect on the entire organism. A further advantage is the improved climate in stables, which results from the positive changes with regard to excretion.Livestock

— 109108
Test in organic goat rearing and production of cheese for direct sales
The farm was taken over by Ms. Alexandra Dupont on January 1, 2011. It was in the process of being converted to organic methods. The entire farm was awarded organic certification on October 1, 2011. Since March 3, 2014 the farm is also home to wethers and “retired” nannies.
SituationSince the farm has commenced operations, it comprises 20 hectares of land. As a sole farmer, Ms. Dupont breeds goats and produces cheese that she sells directly. Volunteers of WWOOF France and other helpers, friends and temporary trainees support her in her work, totaling the equivalent of one part-time employee working half days. Depending on the year and hay quality, the farm produces 16,000 to 20,000 liters of goats’ milk annually.
Livestock at the farm comprises: 4 generative bucks, in a separate enclosure 49 dairy goats dry goats young female goats are approved for milking
by Ms. Dupont from three years of age. In this way they have sufficient time to mature and grow to their full size.
The animal sanctuary is also home to 90 castrated bucks and ten old nanny goats, both in their own enclosures and buildings.
BuildingFrom March to October the dairy goats are kept in a 13 hectare enclosure next to a building of 100 square meters. During the winter they stay in this building.
Feed rationsWater is available to the animals freely.Throughout the entire year they can feed freely on hay from fodder grass/clover (mostly fodder grass) and are also fed an individual ration of concentrates at the time of milking (one milking in the morning, one in the evening). This daily ration, fed in two equal portions, comprises a total of 800 grams during the summer, 1 kilogram in the winter.
Practical experiencereportsMilk goat farm in FranceDairy Cows in Costa Rica Dairy farm Willenbring, U.S.A.
Carcass quality in Thailand
Livestock / penergetic t Penergetic France TOCROP SARLS
— 111
— 113
— 115
— 119
109
112
114
116

— 111110
TrialThe trial commenced on October 8, 2017, the set-up was quite simple: the goats were given 1 gr penergetic t each with their morning ration; it was sprinkled over the concentrate. The goats readily accepted the feed mix with penergetic t. On December 18, 2017, Ms. Dupont had used up the 3 kg standard bucket of penergetic t.
ObservationsMs. Dupont observed several positive effects. However, since no weighings, detailed analyses or other controls were carried out, she does not want to comment because a direct relationship between the observed effects and penergetic t has thus not be proven. Nonetheless, three examples of observed effects should be mentioned:
From December 28, ten days after penergetic t was fed to the animals for the last time, the herd was affected by conjunctivitis, while it had been in perfect health when the last dose of penergetic t was taken.
Despite the hay from the 2017 harvest being of very poor quality, milk production appeared to be higher than during the same period of the pre vious year, and higher than forecast by Ms. Dupont before the trial.
In addition, an obvious and easily measurable result was observed and measured: two days after penergetic t was introduced, the curd was
of much better quality and more homogeneous, it kept better on the draining table, resulting in less waste in cheese production.
14 days after the trial commenced, the farm switched to winter mode: the animals were kept inside the building and thus had no access to grass, but hay was freely available to them.This change in their diet had no effect whatso-ever on milk quality, which was consistently better than before, significantly higher than before the trial. This obvious improvement of milk quality could thus only have been the result of adding penergetic t to the feed.
Measurements Before the trial she produced around
1.3 Crottin* goats cheeses from 1 liter of milk. During the trial she produced around
1.7 Crottin goats cheeses from 1 liter of milk. After the bucket of penergetic t was used up,
the quality declined again.
Commercial aspectsWith annual milk yield of 18,000 liters, the following cost-benefit ratio applies, calculated for a full test year:
When the Tocrop consultant, who was asked by the Penergetic importers to carry out the trial, visited on January 14, 2018, Ms. Dupont bought a bucket of penergetic t and agreed to share her experiences with people contacting her.
Period December 18, 2017 – January 14, 2018 Since her supply of penergetic t was used up,
Ms. Dupont bought a feed supplement on a calcium carbonate base instead; the result was rather disappointing. Compared to penergetic t the amount of cheese produced from 1 liter of milk was reduced; although the curd was better with that feed additive than before using penergetic t, the quality was not
as good as during the period penergetic t was fed to the animals.
The goat herd was affected by conjunctivitis.
Period January 14, – January 22, 2018On the evening of January 14, Ms. Dupont started to use penergetic t again and returned to the same feed cycle as before: 1 gr of penergetic t per goat and day, at the time of the morning milking. On January 21, she then noticed the curd having returned to the high quality levels and achieved the one liter of milk to 1.7 Crottins conversion rate again.
Photo from January 20, 2018. Right with penergetic tleft without: the cheese is less firm, loses more water and cheese in shapes and is slightly yellower with penergetic t.
Parameter Without penergetic With penergetic
Annual milk yield 18,000 lt 18,000 lt minimum
Conversion rate 1.3 FCR 1.7 FCR
Number of cheeses per year 23,400 pieces 30,600 pieces
Selling price per cheese € 2.50 € 2.50
Annual turnover € 58,500 € 76,500
Annual costs of penergetic t 0 € 456.10
Additional annual net profit, generated by penergetic t € 17,543.90
Return on investment with penergetic t 38.5 times the purchase price
* Crottin: name of the goat cheese

— 113112
Year Total of cows milking in 6 herds
Average of milk in liters in finished lactations
Total of liters produced in 6 herds annually
2011 505 14.0 2,596,694
2012 560 12.8 2,634,065
2013 576 15.8 3,320,733
2014 597 15.8 3,433,997
Table 2: Comparison of the total milk production of the analyzed six dairy herds during the test period
Lapse of time Sept 2010 –Sept 2011
Sept 2011 – Sept 2012
Sept 2012 –Sept 2013
Sept 2013 –Sept 2014
Evaluated animals 607 708 763 703
% heat detection 52.5 51.0 52.2 51
I/A services by conception 2.46 2.27 2.16 2.10
% pregnant at first service 33.7 38.2 33.5 39.1
Interval between calving in days 404 408 388 387
Age at first calving in months 32.7 27.4 28.3 27.3
Table 1: Four years comparison in six dairy herds
It is important to consider that even though the data are not statistically significant their economic weight for the observed herds is significant because of the quantity of represented animals.
As for the production indicators, it can be deduced from table 2 that the average of milk production improved by 1.8 liters of milk per cow per day, which means an increase of 12.9%.
Finally, it was observed that despite increasing the number of lactating animals in the herds in a year by only 92 animals (18.2%), there was an increase of 837,303 liters of milk produced (32.2%) in 2014 compared to 2011.
Again it is important to emphasize that the only change in management was the additional feeding with penergetic t since November 2012. The increase of 837,303 liters of milk with the same area and only with 92 more animals is a figure with a high economic importance.
Penergetic Penergetic de Costa Rica S.A.
Four years test on reproduction and performance in dairy cows
The combinded reproductive and productive performances of six dairx herds (Holstein /Jersey) were analized over four years.
This retrospective analysis was made by Dr. Jaime Murillo Herrera, MSC teacher from Universidad Nacional de Costa Rica and private consultant of Cooperativa de productores de leche Dos Pinos in cooperation with ING. Fabricio Alfaro Jaikel, MBA as CEO of Penergetic de Costa Rica.
Benefits Less semen doses Less costs Less time to pregnancy More milk
The management of the 6 dairy farms was 100% grazing, with two milkings daily. They were additionally fed twice a day with a concentrate, according to milk production. The farms are located at a height of 400 meters over sea level, with temperatures ranging between 25°C and 33°C, with a good humidity average ratio above 70% throughout the year.
Four periods between 2010 and 2014 were analyzed, each from September to September. The only change in the management of these herds was the feed supplementation with penergetic t since November 2012. These two years are highlighted in colour.
From table 1 it can be deduced that the detected percentage of heats is quite consistent in the last 4 years, but we can see a decrease in services by conception; going from 2.46 in the time period of 2010 – 2011 to 2.10 in the time period of 2013 – 2014 (less semen doses, less costs, less months to pregnancy).
In the analyzed four years period, the percentage of pregnancy at first service improved from 33.7% to 39.1%, the interval between calving decreased by 17 days and the age of the heifers at first calving was reduced by 5 months.

— 115114
Changes observed
Decreased somatic cell averages
Increased Decreased
Appetites and consistency in eating Time between calving an return to feed
Number of healty, thifty and heavy calves born Somatic cell average from 326,000 (2014) to 191,000 (Sept. 2017)
Hair coat shine and overall bright appearance Incidences of DA’s, septic mastitis cases and veterinary required calving issues
Farrier required lameness evaluations and hoof issues
Cow comfort noticed by increased resting times Poor appetites and inconsistencies in eating
Return on investmentThe somatic cell count (SCC) premium we now receive from maintaining a consistently lower SCC, pays for the cost of penergetic t (for cows) for our herd.
Application Rate5 grams per cow per day as a top-dressing to a TMR**.
My farm story ...
The Minnesota Dairyman: We run a tie-stall AI-herd dairy operation, and we were running into waxing and waning (coming and going) periods of mastitis, somatic cell counts over 400,000 SCC frequent DA’s*, lameness issues and struggling with cow comfort and stress. We would modify one management practice as encouraged by our veterinary team, yet another challenge would take the forefront. We were juggling multiple regimes and variables, and we were watching our cows miss their genetic potential … does this sound like your farm?
From our experience, using penergetic t for cows avoids costs of:
Veterinary bills Retreating conditions Loss of production and throwing out
treated milk Farrier costs
Penergetic U.S.A. Penergetic Solutions (U.S.A.)
What could penergetic t do for your dairy herd?
0
100
200
300
400
500
600
kliM L
m/sllec 000,001
month/year of count
Somatic cell monthly averages
November 2015: began feeding penergetic t: for cows
penergetic t: for cows
* DA: displaced abomasums** TMR: total mixed rotation

— 117116
Margins in animal husbandry are very low. For this reason, alternatives are searched for a better fattening result.
The effect of penergetic t fattening on carcass quality in swine fattening phase
This study was carried out about the effect of penergetic t fattening on swine carcass one month before slaughtering. Material and method600 fattening pigs in one house, average 80 kg weight separated and divided by sex into 3 groups:
Control: 360 fattening pigs (castrated and female separated) were separated in 3 pens with 60 pigs per pen. The control groups were fed normal feed without penergetic t fattening
Treatment 1: 120 fattening pigs (castrated and female separated) were allocated in 2 pens with 60 pigs per pen. 100 ppm penergetic t fattening mixed into feed during 1 month of production period
Treatment 2: 120 fattening pigs (castrated and female separated) were allocated in 2 pens with 60 pigs per pen. 150 ppm penergetic t fattening mixed into feed during one month of production period
The fattening pigs were fed 2 times per day by automatic feeder
Penergetic ThailandBehn Meyer Chemicals (T) Co.Ltd.
Study on carcass quality in the last four fattening weeks
penergetic t fattening field trial designed swine housing
female
castrated
60 swine
60 swine
60 swine
60 swine
60 swine
60 swine
60 swine100 ppm
60 swine100 ppm
60 swine150 ppm
60 swine150 ppm
fans Collect dataThe pigs in all groups were tested during one month or weight avg. 110 kg – 125 kg before slaughtering.The carcass quality was checked in each group by LSQ standard by Pfeiffer & Falkenberg (1972)
BF5
BF4
BF3b
Carcass LSQ Standard
highest
LSQ = 0.15red meat (%) 48.76
LSQ = 0.26red meat (%) 46.88
LSQ = 0.30red meat (%) 45.05
very high high
medium low lowest
LSQ = 0.38red meat (%) 43.37
LSQ = 0.44red meat (%) 42.00
LSQ = 0.47red meat (%) 40.31

— 119118
Results
Control group
Test 1: 100 ppm penergetic t fattening
Test 2: 150 ppm penergetic t fattening
Group BF3 BF4 b LSQ LSQ avg.
Control 35 30 90 0.36
30 30 90 0.33 0.35
100 ppm penergetic t 25 15 80 0.25
20 10 90 0.16
25 15 100 0.20
20 10 80 0.18 0.20
150 ppm penergetic t 25 20 85 0.26
25 10 80 0.21
15 15 70 0.21
20 10 70 0.21 0.22
Conclusion Both, 100 ppm and 150 ppm penergetic t
groups showed the benefit on carcass quality, as the deposit of back fat was more reduced in test, recorded data followed by LSQ standard when compared with control group (0.20>0.22>0.35 LSQ)
In the treatment of penergetic t fattening, in both 100 ppm and 150 ppm groups the response of sex to carcass quality was shown. The results showed that female pigs had trend to increase carcass quality more than castrated pigs.
The effect of penergetic t fattening both of 100 ppm and 150 ppm to the pigs’ final weight showed that the pigs lower than 120 kg weight had trend to respond better to the product than the pigs over 120 kg weight
Conclusion concentrate The results showed that there was no effect
on carcass quality by increasing dosage rate from 100 ppm to 150 ppm
There was no interaction between control and penergetic treatments, if the pigs are kept in the same house.
LSQ = BF3 + BF4
2bLSQ dataleft: 100 ppm penergetic t (weight < 120kg)right: control
BF4
BF3b
b
BF4
BF3

Benefits Homogenisation of slurry and liquid manure
Converts problematic anaerobic manure
into a beneficial aerobic fertilizer
Odour abatement
Improved plant compatibility
Improved stable climate
Reduced requirement of pit agitation
Less scorching of plants
Easier assimilation of nutrients
The nozzles of drag hoses clog up less
Suitable for dairy and swine manure
Farmyard manure (liquid manure, slurry).One or more of these valuable fertilizers are produced on all farms. Careful and good preparation ensures sustainability on the soil.penergetic g is used as a rotting aid in liquid manure. As a result, the consistency of the liquid manure is optimized and becomes homogeneous and flowable. Aerobic activation reduces floating and sinking layers and leads to a reduction of odour emissions. The liquid manure becomes a valuable fertilizer and causes less chemical burns.
BREAKs DOWN
sedimentation andfloating layers
suitable
for dairy and swinemanure
ABATEMENT
of odour
REDUCES
requirement forpit agitation
CONVERTS
problematicanaerobic manureinto a beneficialaerobic fertilizer
Manure

— 123122
Manure / penergetic g
Case 1. Pig slurry
Test Site: Hanul Farm Pig fattening farm with over 3,000 pigs Run by Young-tae Kim for over 20 years Located in Ham-An in Korea
(about 380 km south of Seoul)
Test Overview Period: Oct. 22, 2011 – Feb. 15, 2012
(4 months) Control / penergetic group: 500 pigs each
with an average weight of ca. 18 kgs All barns are above a slurry cistern / tank
(slurry pig pen)
Test Products penergetic t: fed with fodder (60 gr / mt) penergetic g: applied into slurry cistern /
tank (once a week, 2 gr / pig)
Results Free-flowing slurry, no sediments, Floating layers of slurry dissolved,
more homogeneous Increased microbial activity Much less cough Less hyperemia (red eye): control group
(80% – 90%), test group (10% – 20%) Reduced unpleasant odors by 80% Better meat quality Decreased pig mortality Improved working conditions of farmers
Practical experiencereportsSlurry in South KoreaManure Lagoon in U.S.A.
Observation in slurry in FinlandSuckler Cow Manure in Switzerland Floating layer in Switzerland
Application of penergetic g in pig slurry and its effect in various crops
This study on slurry, was carried out regarding effects of penergetic g and penergetic t in stables and on field applications.
Slurry in cistern
Control group and penergetic group
Penergetic South Korea ok-Seong
— 128
— 129
— 131
— 133
— 135
122
128
130
132
134

— 125124
Nasal cavity
No pathogenic microorganisms detected in any of the analyses.
Control group: more closed and blocked with mucous penergetic group: clear and normal
Control group versus penergetic group:clear difference
Less nitrate, phosphate and potassium excreted due to improved feed conversion
More beneficial microorganism (Lactobacillus) in pigs’ intestine
All analyses by FACT, The Foundation of Agricultural Technology Commercialization and Transfer.
Parameter Reduction in %
Nitrogen 12.4%
Phosphate 45.0%
Potassium 72.0%
Control and penergetic group Control and penergetic group
Meat quality
Thickness of intestines (health of internal organs)
Condition of hind leg (overall health)
More than twice as thick. The meat is firmer and grayish pinkin penergetic group.
* [ ] : Premium quality = % of Grade 1+ & Grade 1
National average based on 950,018 pigs. penergetic farm 360 pigs.
Control Control
penergetic farm penergetic farm
7,350,000
10,850,000
0
2,000,000
4,000,000
6,000,000
8,000,000
10,000,000
12,000,000
Untreated penergetic
Lactobacillus CFU/ml – average of two analyses
100 100 100 100
178
102 91
50
020406080
100120140160180200
Grade 1+ Grade 1 Grade 2 Grade E
Meat quality compared to national average (%)
National average
penergetic
5.68
12.3
34
05
10152025303540
Bacillus Actinobacteria
Beneficial soil microorganisms(Nov. 2011; Buyeo, Korea)
conventional
penergetic
0.62
0.79
00.10.20.30.40.50.60.70.80.9
conventional penergetic slurry
Leaf thickness (mm)
Condition of lungs

— 127126
Analyses hind leg
Case 2. Applications of liquid fertilizer from pig slurry
Benefits (with combined use of penergetic products)
Reduce unpleasant odors and the occurrence of harmful insects and their larvae
Significantly lower mortality rate and reduction of respiratory diseases
Economical; reduce or eliminate the use of chemical additives
Minimize groundwater pollution
Liquid fertilizer from pig slurry using penergetic products.
Best results are obtained by using the products in combination if feasible.
Bacillus promotes plant growth. Actinobacteria speeds up decomposition of organic matter.
1 Rice cultivation Mar – Aug, 2006 / Dangjin, Korea
Application cases
Cultivated by Min-Hyung Cho; 10 hectare (used 25 lt of liquid fertilizer per 3.3 m2)
Numer of stems (Aug 22, 2006)left: Traditional cultivation / number of stems: 16.7right: penergetic treated slurry (replaced chemical fertilizer by 90%) / numer of stems: 24.7 (+148%)
2 Potato cultivation July 28, 2006 / Chuncheon, Korea
Cultivated by Jong-Sung Hong; 1 lt hectare (used 50 lt of liquid fertilizer per 3.3 m2)
Potato crop (10 stems)left: Conventionalright: Larger protatoes with penergetic treated slurry
Protein Saturated fat Unsaturated fat Potassium
Control (A) 14.73% 37.92% 62.08% 2,34416 mg / kg
penergetic (B) 18.18% 35.57% 64.43% 2,79560 mg / kg
Comparison (B/A %) 123.4%(3.45%↑)
94%(2.35%↓)
103.8%(2.35%↑)
119.2%(45144 mg / kg↑)
Product Usage Dosage
penergetic t Feed additive 6 kg / 100 mt fodder
penergetic g Slurry treatment 10 gr / LSU / week
penergetic k Compost and soil treatment 3 gr / m² on the barn floor after mucking out. Repeat each time after bedding.
7,350,000
10,850,000
0
2,000,000
4,000,000
6,000,000
8,000,000
10,000,000
12,000,000
Untreated penergetic
Lactobacillus CFU/ml – average of two analyses
100 100 100 100
178
102 91
50
020406080
100120140160180200
Grade 1+ Grade 1 Grade 2 Grade E
Meat quality compared to national average (%)
National average
penergetic
5.68
12.3
34
05
10152025303540
Bacillus Actinobacteria
Beneficial soil microorganisms(Nov. 2011; Buyeo, Korea)
conventional
penergetic
0.62
0.79
00.10.20.30.40.50.60.70.80.9
conventional penergetic slurry
Leaf thickness (mm)
2 gr
4 gr
00.5
11.5
22.5
33.5
44.5
conventional penergetic slurry
Leaf weight (grams)

— 129128
Penergetic U.S.A. Penergetic Solutions (U.S.A.)
Problems of heavy crusts on manure lagoons solved by penergetic products
Nutritional values of the potatoes
Tested by Gangwon-do Agricultural Research & Extensions Services.
Cultivated by Baek-Je Agricultural Association; used 40 lt of liquid fertilizer per 3.3 m2.
3 Spinach cultivation Nov, 2010 – Mar 2011 / Buyeo, Korea
Fertilizers used in greenhousesA: Liquid = treated slurry with penergetic g / chemical / organic B: Chemical / organic / liquid = treated slurry with penergetic g C: Organic / liquid = treated slurry with penergetic g / chemical
Certificate of Results
Weight of spinach (based on 12 plants)A: Liquid fertilizer (penergetic g) 430 gr B: Organic fertilizer 320 gr C: Chemical fertilizer 280 gr
Liquid manure – waste or natural fertilizer? This is a recurring question. If the liquid manure has sedimentation or floating layers, this means a lot of work for the farmer. penergetic g is the solution!
Lagoon Treatment with penergetic g / kTreatment of a 400,000 gal lagoon (1,600 m3) Location: Bow Area, Skagit County, WA400 dairy cows
Protocol used 72 lbs (33 kg) of penergetic g / k added to
lagoon as shock treatment 6.5 lbs (3 kg) of penergetic g / k per week
for 12 weeks Then 3.25 lbs (1.5 kg) of penergetic g / k per
week = regular/maintenance application rate
Parameter Conventional (A) penergetic Slurry (B) Comparison B / A %
Fiber 0.51% 0.77% 151.0%
Starch 16.55% 20.45% 123.6%
Vitamin C 96.3 ppm 125.3 ppm 130.1%
A: December 23, 2013Prior to treatment, there was a heavy crust on the lagoon surface.
B: January 3, 2014 11 days after treatment: The lagoon’s liquid manure was bubbling, the previous crust submerged and dissolved already partially. There was no mechanical agitation involved!
C: January 3, 2014 16 days after treatment: Further improvement in lagoon quality is evident.
A
B
C

— 131130
Farmer who uses penergetic since 2016Jussi Kinnunen, Keihärinkoski
No need to stir canals. Works incredibly well. We spread slurry in springtime. First to
one block only, where the grass grows very strongly. Even though we had a cold weather period.
Reduction of fertilizer: 30%!Total amount: about 700 m3 slurry per year.
Farmer who uses penergetic since 2013Olli Ervasti, Sotkajärvi
Yes, it works well. Before we needed a machine to stir the canals, but not anymore.
There is less ammonia in the stable. Much less flies in the stable. There were oxygen bubbles in the outside
tank. Slurry is homogenous and has a dark green color. Much, much better than before!
Total amount: about 600 m3 slurry per year.
Farmer who uses penergetic since 2007Veijo Saarikoski, Teuva
The slurry is good. No top layer in the slurry tank. For the ‘third grass crop’ we spread only
slurry and it grows well. We can also use ‘the third grass crop’ for
silage. Still good quality for the cows.Total amount: about 1,000 m3 slurry per year.
Farmer who uses penergetic since January 2013Tero Tirkkonen, Nilsiä
August 2014: “Now I have to believe that it works. There was no layer in the outside slurry tank. It was easy to stir. The slurry does not make any dregs to the bottom as earlier. Grass is growing well.”
August 2016: “This is great. I have seen that there is no need to make extra work with the
slurry. We notice more effective fertilizing effect. We have grass fields and it seems to work very, very well. I appreciate that we can get good crop and plenty of grass silage to our dairy cows from our nearest fields.”
August 2017: “I have decreased fertilizers of the second grass crop (the first one was conventional). We can see a remarkably good effect in the fields. There are many many worms in the field. I can see them when I am ploughing. The soil is also fluffier than before.”
Total amount: about 800 m3 slurry per year.
Farmer who uses penergetic since 2015Harri Pakarinen, Rautalampi
In grass silage, D-values are good. They have been 750 and 650.
The consultant of the slaughterhouse calculates how much more protein has to be added to the silage. This has to be very little.
In the winter, 2017/2018 we even didn’t need to add protein to the silage at all.
The slurry runs/moves better in the canals. There is no need to stir the slurry tank
as much as before.Total amount: about 300 m3 slurry per year.
Penergetic Finland LUCERNA Toiminimi
Various results and observations from five farmers using penergetic g
Statements from farmers in Finland about their many years of experience with penergetic g
First of all a short introduction about the use of Penergetic in various areas and the respective results of five customers.
The productFormerly known as penergetic g / k – it concerns penergetic art.no. 2010 and art.no. 2210. These products were mainly applied when a large amount of straw was within the manure /slurry. In Finland, the beddings are generally put into the pits. Therefore, these products are optimal for our market.
Cow and pig slurryRecommendation:1st week: 2 kg / 100 m3 weekly2nd – 5th week: 1.5 – 2 kg / 100 m3 weeklySubsequent: 1 kg / 100 m3 additional new slurryBlocked canals and bottom layers: 2 kg / 100 m3 until slurry is free flowting
Pig slurryEmpty canals: 1 kg / 100 m3
Repeat after drained out.
Information about some prices in Finland Diesel fuel costs about € 0.80 / liter excluding
taxes. When stirring a slurry tank with e.g. a 100 horsepower tractor, they spend about 15 – 20 liters fuel per hour. When farmers can save working hours with slurry stirring it also means spending less money; 1 hour is 15 x € 0.80 = € 12 minimum.
For instance NPK 27-3-5 (N = 27 %, P = 3 %, K = 5 % including) fertilizer costs about € 310 per 1,000 kg without taxes. When farmers are able to decrease every year some 10 kg / ha fertilizers that means savings! E.g. 50 kg / ha less is € 0,31 x 50 = € 15,50. Farmers spread 25 – 30 m3 per hectare slurry. With a 1,000 m3 slurry tank, they need 40 ha of fields. 40 x € 15,50 = € 620. This we experience every year. Savings are increasing and use of chemical fertilizer diminishes.
With these two facts in the “slurry handling”; farmers realize continuously very good results and have a considerable advantage when using penergetic g.

— 133132
Chemical analysis of three slurry samplings with and without penergetic gThe purpose of this experiment was to analyse the chemical composition of the manure and to determine changes due to the influence of penergetic g. The analyses were carried out by the Laboratory for Soil and Environmental Analysis lbu in Thun/CH.
No treatment before first sampling in February
One treatment of 2 lt / 100 m3 ten weeks before second sampling end of April
Weekly 2 lt / 100 m3 for new manure during one year until third sampling
Observable changesThe farmer noticed that the slurry was less smelly and more fluid. This has reduced the stirring effort. The floating layers have been reduced.
Penergetic Switzerland Walser & Co. AG
Three analysis to evaluate the quality of manure
Suckler cow liquid manure is very viscous and tends to have floating layers. Futhermore this is associated with odour emissions. penergetic g was applied to improve the entire situation.
An average 15 – 25 suckler cows are kept at the farm on Lake Zurich. The slurry tank is underground and covered. At the time of the first sampling, the tank was about ¾ full. The first sample was taken without prior treatment. Immediately after sampling, penergetic g molasses was stirred once into the slurry tank 10 weeks before second sampling. After second sampling, follow-up treatment was performed weekly for one year until the third sampling.
Analysis liquid organic fertilizers
Parameters 09.02.2017 without penergetic
28.04.2017 once penergetic
26.04.2018 weekly penergetic
Unit Method
Dry Matter TS 105°C 1.50 1.70 5.70 % D-TS-lbu
Ash residue 500°C 38.40 35.90 30.70 % D-AS-lbu
Ash loss 500°C 61.60 64.10 69.30 % D-AS-lbu
Carbon Corg 357.30 371.90 401.70 gr / kg TS D-AS-lbu
pH-value 7.58 7.67 7.00 pH-orgDüngerflüssig-lbu
Entire N after Kjeldahl 71.30 63.80 37.00 gr / kg TS NKjeldahl-Büchi-lbu
Ammonium-nigrogen N-NH4 38.40 38.00 14.30 gr / kg TS N-NH4-Büchi-lbu
C/N-ratio 5.01 5.83 10.85 Calculation
Phosphorus P 8.62 9.45 7.89 kg / mt TS AD-KW-ICP-lbu
Phosphorpentoxyd P2O5 19.75 21.65 18.07 kg / mt TS Calculation
Potassium K 137.00 120.00 53.90 kg / mt TS AD-KW-ICP-lbu
Potassiumdioxyd K2O 164.68 144.61 64.99 kg / mt TS Calculation
Calcium Ca 21.20 23.80 19.50 kg / mt TS AD-KW-ICP-lbu
Magnesium Mg 7.47 7.13 5.97 kg / mt TS AD-KW-ICP-lbu
Sulfur S 5.59 5.55 4.51 kg / mt TS AD-KW-ICP-lbu
Graphic view of the analysis, entire and dividedA: The respective units B+C: To make the differences between the samples easier to see, the parameters are divided into two graphs below.
Graphic view of the analysis,entire and divided
0 50 100 150 200 250 300 350 400 450
Sulfur S
Magnesium Mg
Calcium Ca
Potassiumdioxyd K2O
Potassium K
Phosphorpentoxyd P2O5
Phosphorus P
C/N-ratio
Ammonium-nigrogen N-NH4
Entire N after Kjeldahl
pH-value
Carbon Corg
Ash loss 500°C
Ash residue 500°C
Dry Matter TS 105°C
09.02.2017 28.04.2017 26.04.2018
0 10 20 30 40 50 60 70 80
Sulfur S
Magnesium Mg
Calcium Ca
Phosphorpentoxyd P2O5
Phosphorus P
C/N-ratio
Ammonium-nigrogen N-NH4
Entire N after Kjeldahl
pH-value
Ash loss 500°C
Ash residue 500°C
Dry Matter TS 105°C
09.02.2017 28.04.2017 26.04.2018
0 50 100 150 200 250 300 350 400 450
Potassiumdioxyd K2O
Potassium K
Carbon Corg
09.02.2017 28.04.2017 26.04.2018
A
B
C

— 135134
Penergetic Switzerland Walser & Co. AG
Persistent floating layer are dissolved with penergetic g / k
Floating layers causes additional agitating costs for farmers. The layer on this farm was 1.5m thick and didnt dissolve any more.
Farm detailsThe Schlunegger family produces goat’s and Tomme cheese. The farm is 50 hectares in size and is located approximately 800 m above sea level.
Animal stock Approx. 200 goats Approx. 80 fattening pigs Approx. 20 cattle
The problem Strong floating layers Strong odour
The slurry consists of 90% pig slurry and 10% cattle slurry. Three years before we treated
the slurry with penergetic g, which resulted in reduced odour but did not solve the main problem of the floating layer. After analysing the slurry and related factors in detail, we decided to use penergetic g (pig slurry). Even though odour was reduced even more, the floating layer remained.
We were very surprised about how persistent the floating layer was. Measures that would usually lead to perfectly homogeneous slurry were only partially successful, so we needed to take stronger action: penergetic k! The rotting process had to be the solution to this problem. In May we scattered additionally to penergetic g – 2 kg of penergetic k across the floating layer. At our next visit at the start of August, we noticed that the floating layer was already half dissolved. At that point in time we scattered another 1 kg of penergetic k and arranged to visit again in early November.
In early November we saw bubbles coming up where the surface was liquid. This showed that the microorganisms were working hard.
Condition of the slurry without penergetic
Condition of the slurry after penergetic g was applied
Condition of the slurry after penergetic g was applied. Supplemented by penergetic k (the bubbles that are forming show that the microorganisms are extremely active).
Photographs by Jürg Beerhalter

Benefits Stimulates the composting process
Stabilizes rotting processes
Improves stable climate
Reduces ammonia emissions
Supports increased humus formation
Mitigates in-barn odours
Reduces fly and insect pressures
Accelerated development
Less machinery work needed
Reduced environmental pollution
penergetic k is a rotting agent for compost and bedding. The product promotes the degradation of organic matter and accelerates the rotting process. In barns it improves the sanitation and climate.The product reduces the unpleasant odour from compost or manure to a natural level. The composting process itself is accelerated and optimized, the final product (humus) becomes enriched by the aerobic rotting processes.
reduces
fly and insectpressures
mitigates
in-barn odours
converts
ammonia
supports
increased humusformation
IMPROVES
compostquality
Compost

— 139138
Better and faster rotting of manure and higher valued fertilizer for plants
Practical experiencereportsManure composting in CanadaComposting in Canada
Compost / penergetic k Penergetic Canada Solutions Penergetic Quebec
In this comparison of manure with and without penergetic k, the advantage of faster decomposition and significantly less odour is clearly demonstrated.
Dosage recommendation 40 gr / m3 penergetic k
ResultsCharacteristics of manure treated with penergetic k
Lighter, drier texture Brown colour with white fungi evident Dryer and less clumpy Practically no odour
Characteristics of untreated manure compact, heavy texture Brown, greenish colour Pasty and humid Emits a slightly nauseous odour
Germinating radish seed with and without penergetic k treated cow manure
longer roots (+ 13%) larger root mass (+ 34%) more uniform growth (+ 37%) larger vegetable mass (+ 61%) improved germination (+ 4.2%) less evidence of water stress a continuation of rapid root growth
above: Characteristics of manure treated with penergetic k (22°C)below: Characteristics of untreated manure (13°C)
left: Control right: with penergetic k
— 139
— 141
137
140

— 141140
ResultThe penergetic k treated compacted leaves composted successfully in 21 days!Besides noticing “no odour from penergetic- treated compost”, the City has undertaken no further technical analysis as for them the most important thing was increasing the “through put” of compostable material through their municipal works composting yard. This, the penergetic k did very successfully and, as a result, now all material to be composed gets treated with penergetic k. The finished compost, so created by the City of Sherbrooke, is used for their own purposes – for flower pots, urban landscaping, etc.
Subsequently, they have observed that: provided the ambient air temperature was suitable when penergetic k was added, the composting process got underway quickly. Furthermore, once the process was started, even if the exterior of the pile became much colder, the composting process continued inside the piles (windrows) – as the temperature there remains higher.
“Before treating with penergetic k, the material after more than one year of storage was only at the beginning of the composting process. We found large blocks of compact leaves still almost fully intact.”
Foliage waste transformed into valuable fertilizer within 21 days
Penergetic CanadaSolutions Penergetic Quebec
The City of Sherbrooke (population 250,000) decided to initiate a city-wide composting operation. The problem was that, after two years of collecting leaves and other raw materials from householders, their municipal works yard was full of compostable material which was not breaking down / decomposing properly (and they were running out of storage room).
Seeking a solutions, the City approached Eric Schaffner of Solutions Penergetic. The mandate from the City of Sherbrooke was clear: “to compost the material they were collecting as fast as possible to create space for new raw materials to arrival.”
A test was conducted with 2,000 tons of leaves that had been stored for one year. The compacted leaf material was put in windrow, half of which penergetic k was applied on, at a rate of 50 grams per m3. The windrows were mixed with a Bacchus windrow and turned again after 15 days.
Temperature after one weekleft: penergetic 60°Cright: Control 40°C
left: Compostable material in works yard. No decomposition after 1+ year.right: Same raw material now 21 days after composted with penergetic k.
AB
C
D
A
B
A: ControlB-D: penergetic

Water vitalisation
SAVING
and optimizationof additives
LESS
need forcleaning, shorternon-operatingtime
GREATER HIGHERfeed efficiency water consumption
STRONGERplant growth
BETTER
nutrient uptake
Benefits Beneficial to humans, animals and plants
Better assimilation of water
Lime and other deposits are easier to remove
No installation costs & maintenance-free
No energy consumption –
neither magnetic nor electric
In livestock Increased water intake
Increased performance
Additives dissolve better
Supports sustainability
In plant cultivation Better nutrient uptake
Stronger plant growth
Contribution to increased yield
Reduced fertilizer use
Supports sustainability
Take advantage of biostimulation with the Penergetic technology for vitalized and structured water.The AquaKat is a physical device, which forwards a previously programmed frequency pattern to the water. The water responds to frequencies and gets through this restructured and vitalized. The vitalized water transports the ingredients better into the metabolic system of an organism, which makes e.g. chemical agents even more effective. This could lead to a considerable reduction of spraying agents.
AquaKat

— 145144
Problems solved of water quality in the tank for drinking water supply in dairy
The water used for watering dairy cows has a large influence on milk quantities. If the cows don’t drink enough, the amount of milk is lower. This can be improved by fitting an AquaKat.
Dairy farm, 180 cows Improve water quality Avoid harsh chemicals Achieve better health and performance
There has been great success at reducing the hardness of water using the AquaKat. It can be used to address iron in the water and eliminate hydrogen sulphide. Since animals like the better taste of the water, they drink more. Based on tests, an average 1.5 litres increase in milk production per cow per day and reduced use of detergents in the milk parlour has been observed. The AquaKat XL has a capacity of 6,000 litres per day, means one AquaKat XL per 60 cows. This usage calculation is based on 100 litres per cow per day (more for regular milk cows and less for cows during gestation). A difference was noticeable after one month, but it achieved its maximum effectiveness after three months. With respect to wash water in the milk parlour, it is much easier to clean up after milking with the AquaKat water. There was one farmer who forgot to use detergent one day and he noticed that it was just as effective (with just the AquaKat water) as when he used soap.
In the case of water from a groundwater source, we recommend that some penergetic w (for groundwater) be used – at a rate of 2.5 kg every 3 months – suspended in the well or storage tank in a flow through filter cloth bag (so the product slowly dissipates to the water supply).
Alberta Organic dairy farm, 400 cows Algae problem in water tank solved.
The iron-derived algae bacteria sludge in a water tank could be resolved simply by installing an AquaKat XXL.
Water vitalisation / AquaKat Penergetic Canada
Water tank (inside) before using AquaKat
Practical experiencereportsDairy Farms in CanadaHerbicide spray in GermanySwine Farms in the U.S.A.
— 145
— 147
— 147
144
146
146

— 147146
30 % less herbicide spray agent with AquaKat
The AquaKat is a device that can be easily fitted to the sprayer. Due to its effect on the water structure, spray agent can be better dissolved in the spray liquid and the amount of spray agent required can be reduced. An active and simple contribution to nature protection.
DatesHerbicide spraying (Atlantis) in winter wheat with AquaKat. A hitch sprayer with 2,000 liter filling volume and 21 m spray width was used for spraying. From the herbicide (Atlantis) 350 ml / ha were sprayed.
Penergetic Germany Penergetic Vertrieb Deutschland e.K.
In the experiment were compared Herbicide 30% reduced with AquaKat and without AquaKat Herbicide at full cost with and without AquaKat
22.04.15 reduced without AquaKat (left) reduced with AquaKat (right)
28.04.15 reduced without AquaKat (left) reduced with AquaKat (right)
22.04.15 full herbizide without AquaKat (left) full herbizide with AquaKat (right)
28.04.15 full herbizide without AquaKat (left) full herbizide with AquaKat (right)
Less odour and easier cleaning of filters aswell calmer animals with AquaKat
Swine Farm, Minnesota 1 Less water filter cleaning Less smell in the barn Improved feed conversion
The operator tells that before installing an AquaKat he would have to clean the water filter on the main water line every two weeks as the filter filled with sediment shutting off the flow to the barns. Since the AquaKat has been installed there has been no build-up of sediment even after more than 6 weeks. He also noticed that the swine drank more water, that they were calmer and that feed conversion was improved. Another noticeable result was the reduced smell in the barn. The operator himself now drinks water from the barn supply, as it tastes better than the one he has in his house, which is on the same water source.
Swine Farm, Minnesota 2 Noticeably calmer / healthfulness pigs Less smell in the barn Bubbling in the liquid manure Visibly better conditions
The property contains 3 barns with swine close to market weight. The barns are identical in terms of genetics and age of animals, feed rations and water. One barn was equipped with two AquaKat XL on the water line. As shown in the table below there were big differences noticeable simply by changing the water.
Penergetic U.S.A.Penergetic Solutions (U.S.A.)
Observations Control Barn AquaKat Barn
Disposition / Demeanour Nervous, irritated, jumping up on one another
Calm, appeared relaxed
Hide Coloration Grey Pink
Tail biting / scratches Yes, easy to spot evidence of both No tail biting evident, one scratch
Coughing High incidence, various animals one coughing animal
Odour Strong, pervasive pig house odour Noticeably fresher smelling
Slurry condition (through slats) Still, nothing evident Bubbling, active
Comparison between barns at Swine Farm, Minnesota 2

— 149148
PenergeticTechnology We have been able to transmit selected
frequencies to suitable material under controlled conditions of electromagnetic induction. This leads to a modified electron status of the material, which was treated with the Penergetic Technology. The penergetic products emit the selected electro-magnetic frequencies to the area of application and generate the desired effect.
Electrical impulses and magnetic waves make life possibleUtilizing the potential in agriculture: principles that have been successfully used in the treatment of humans for decades can now also be utilized in agriculture with penergetic products.
Application of frequencies. And properties.
Programming selected propertiesThe programming is not limited to single frequencies or characteristics. Several frequencies can be combined simultaneously
on one product. Thanks to many years of experience, a selection of frequencies in combination with one another can be chosen today, which have already proven to be effective, to achieve more optimal results.
In agriculture, desired improvements such as better growth or resistance, can be stimulated with penergetic products. This biostimulation strengthens the whole organism and leads to an optimal use of the available resources and to an increase in quantity and quality of the products.
The Penergetic Technology is based on physical principles. All of life, including growth, actions and thoughts are not possible without electrical impulses and magnetic waves. The Realization that every atom, molecule, compound and substance has its own electro-magnetic frequency led to the development of the Penergetic Technology.
“ The application of penergetic products showed interesting trends in the development of plants. This should be further reviewed for a new approach in agriculture.” Prof. Dr. Maria R. Finckh Ecological plant protection, University Kassel

PenergeticInternational
Penergetic International AGRomiszelgstrasse 1CH-8590 RomanshornT +41 71 466 60 [email protected] www.penergetic.com
ImprintPublisher: Penergetic International AGGraphic design: Silvia Wasner
© 2018 Penergetic International AG Switzerland, all rights reserved

www.penergetic.com
penergetic the natural biotechnology