penn state geog 596 capstone project avian influenza rss web mapping exploring geographic and...
TRANSCRIPT

Penn State GEOG 596Capstone Project
Avian influenza RSS web mapping exploring geographic
and temporal aspects of outbreak events

Short Abstract
(As submitted to FOSS4G ’07 presentation committee)
The Avian Influenza RSS Mapper – Open Source (AIRMOS) application demonstrates interactive geographic and temporal visualization of RSS feeds providing information on the spread and type of avian influenza events world-wide. The application is based on open source GIS software including GeoServer, OpenLayers and PostGIS.

Goals
Link RSS text information with geographic map and timeline of events Primary goal: Display human infection cases and
confirmed human deaths caused by avian influenza H5N1 virus
Secondary goal: Display outbreaks of H5N1 virus among avian species (wild and domestic)

What is Avian Influenza?
Also known as “bird flu” Common name for disease caused by
H5N1 influenza virus Transmitted to humans by infected wild
and domestic birds Rarely transmitted from person to
person (currently only in isolated cases)

“Avian Flu” definition “As of 2007, "avian flu" is being commonly used to refer
to infection from a particular subtype of Influenza A virus, H5N1, which can cause severe illness in humans who are infected. Currently, this strain is transmitted by contact with infected birds, and has been transmitted from one person to another only in a few cases. H5N1 flu is therefore not pandemic now and is not currently capable of causing a pandemic. Only if H5N1 mutates into a form that can be readily transmitted from one person to another could it cause a pandemic.” www.wikipedia.org (http://en.wikipedia.org/wiki/Avian_influenza),
accessed 14 July 2007

Human Mortality
“H5N1 flu is a concern due to the global spread of H5N1 that constitutes a pandemic threat. The majority of H5N1 flu cases have been reported in southeast and east Asia.”
Human mortality rate averages 61% percent on average since first diagnosed human infections in 2003. www.wikipedia.org (
http://en.wikipedia.org/wiki/Human_mortality_from_H5N1) Accessed 14 July 2007

Cumulative Human Cases of and Deaths from H5N1 as of April 11, 2007

Confirmed human cases and mortality rate of
avian influenza (H5N1) as of June 15, 2007

What is RSS?
• “RSS (which, in its latest format, stands for "Really Simple Syndication") is a family of web feed formats used to publish frequently updated content such as blog entries, news headlines or podcasts. An RSS document, which is called a "feed," "web feed," or "channel," contains either a summary of content from an associated web site or the full text. RSS makes it possible for people to keep up with their favorite web sites in an automated manner that's easier than checking them manually.”• www.wikipedia.org (http://en.wikipedia.org/wiki/RSS)
Accessed 14 July 2007

RSS data sources
Avian Influenza data sources World Health Organization (WHO)
http://www.who.int/csr/disease/avian_influenza/en/index.html
U.S. Department of Health and Human Services http://avianflu.gov/
General news sources http://www.reuters.com http://www.cnn.com
What is Open Source software?
“The term was initially and is most commonly applied to the source code of software that is available to the general public with relaxed or non-existent intellectual property restrictions. This allows users to create software content through incremental individual effort or through collaboration.” www.wikipedia.org
(http://en.wikipedia.org/wiki/Open_source) Accessed 14 July 2007

What Open Source tools will be used?
• GeoServer – “Middleware” server software that supports multiple data input and output formats “connecting from legacy databases to many diverse clients”. Written in Java.• (http://geoserver.org/)
• OpenLayers – Presentation layer software for displaying map data in modern web browsers. Written in JavaScript.• (http://www.openlayers.org/)
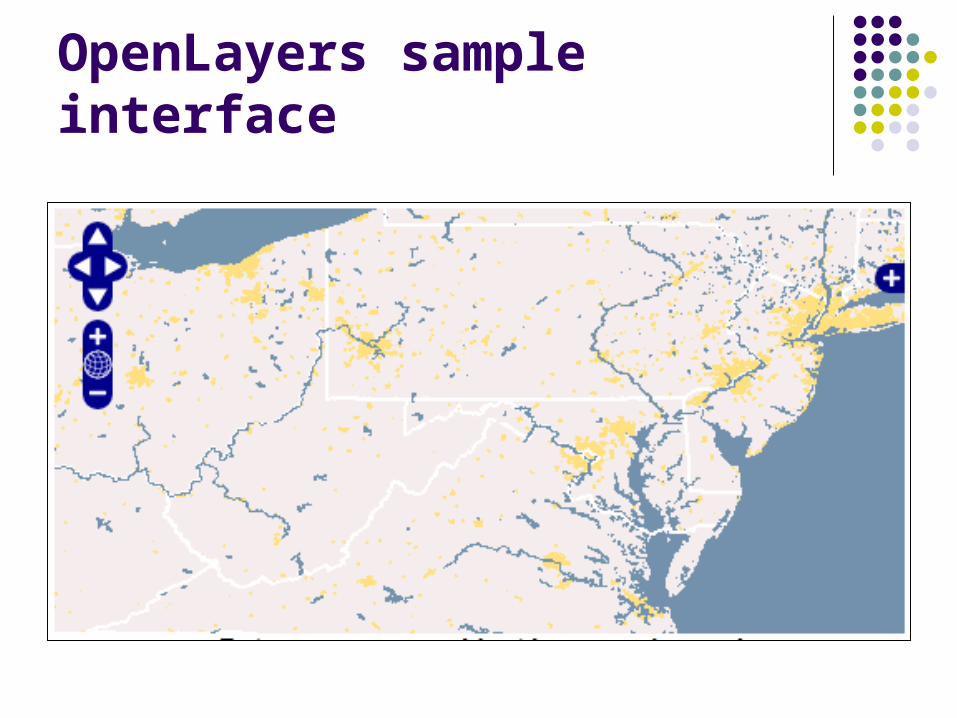
OpenLayers sample interface

What Open Source tools will be used?
PostGIS – “PostGIS adds support for geographic objects to the PostgreSQL object-relational database. In effect, PostGIS "spatially enables" the PostgreSQL server, allowing it to be used as a backend spatial database for geographic information systems (GIS), much like ESRI's SDE or Oracle's Spatial extension.” (http://postgis.refractions.net/)

What Open Source tools will be used?
GeoNames.org – “The Geonames "RSS to GeoRSS Converter" reads the entries of an RSS feed and searches the Geonames Database to find a location for the entry text.” It is a web service that geocodes text RSS and outputs a georeferenced RSS feed with latitude and longitude coordinates. (http://www.geonames.org/)
MIT SIMILE project Timeline tool – A JavaScript based interactive timeline tool for visualizing temporal data. (http://simile.mit.edu/timeline/)

SIMILE Timeline tool

What is different about this proposed application than most “mashup” mapping websites?
Uses Open Source tools Link between map display and interactive
timeline tool Display of live and historical RSS feed info
that originally had only a limited geographic component (country name and state/province name)
Unique data visualization tool

Project Plan Investigate data sources Evaluate Open Source software tools Install and test Open Source software “stack”
Test Geonames.org ability to georeference WHO avian influenza RSS feed
Store historical WHO RSS feed info in PostGIS database Filter items with keywords
Link PostGIS (database) to GeoServer (middleware) to OpenLayers (presentation)
Link to multiple RSS feeds (WHO, US Govt., General news feeds)
Integrate SIMILE Timeline tool to synchronize with map display

Presentation plan
Plan to present at Free Open Source Software For GIS (FOSS4G) conference in Victoria, British Columbia on Sept. 24 to 27 2007, assuming presentation is accepted.
Long Abstract
This paper reports on a prototype Internet web mapping application demonstrating interactive geographic visualization of RSS feeds of avian influenza outbreak events using open source GIS and web mapping software. The application displays the geographic distribution of historical and recent avian influenza events, and allows users to explore the time dimension of the data by focusing on certain date ranges or viewing an animated map display through time.

Long Abstract (cont.) The Avian Influenza RSS Mapper – Open Source
(AIRMOS) application reads Internet data sources including the World Health Organization’s avian influenza RSS feed. The application is based on open source GIS software including GeoServer, OpenLayers and PostGIS with some additional custom Java components. Using the Geonames.org free geocoding web service and similar open source tools, we georeference place names referred to in the RSS feeds and store the historical and ongoing RSS information in the PostGIS database. A Web Feature Service is then produced with GeoServer for an OpenLayers client using the PostGIS database.

Long Abstract (cont.) AIRMOS displays incident locations classified by type
(human death, human sickness, avian only outbreak) and allows users to switch between different RSS feeds displayed on the map. Additional open source software is used to enable display of the time component of RSS information. This timeline tool allows users to view a particular date-range or see an animated progression of avian influenza events through time. Users will be able to drill down for greater information about a specific incident once they have searched using the geographic and temporal controls.

Questions?