penndot research agreement -...
TRANSCRIPT
ATLSS is a National Center for Engineering Research
on Advanced Technology for Large Structural Systems
117 ATLSS Drive
Bethlehem, PA 18015-4729
Phone: (610)758-3525 www.atlss.lehigh.edu
Fax: (610)758-5902 Email: [email protected]
PENNDOT RESEARCH AGREEMENT E03134
100 YEAR SERVICE LIFE STUDY
CHLORIDE MIGRATION COEFFICIENT EVALUATION
By
Clay Naito, Ph.D., P.E.
Liyang Ma
Amirali Shojaeiandivkolaei
Paolo Bocchini, Ph.D.
John Fox, Ph.D.
Aman Karamlou
June 2016
ATLSS REPORT NO. 16-04
ATLSS Report 16-04 Migration Coefficient of PennDOT Certified Concrete Page 1
ABSTRACT
A research study sponsored by Pennsylvania Department of Transportation is conducted to examine the chloride
resistance of concrete commercially produced in Pennsylvania. Concrete produced by ready mix suppliers and
precast and prestressed concrete producers were examined. PennDOT certified concrete class A, AA, and AAAP,
and precast SCC and HES mixes were procured from suppliers in the form of 4x8 in. cylinders and evaluated in
accordance with Nordtest Method NT Build 492. The test determines the chloride migration coefficient from non-
steady-state migration experiments. Experiments were conducted on concrete cured to 28, 56 and 112 days. Across
all ages the study resulted in an average non-steady-state migration coefficient of 9.9E-12 m2/s for class A, 8.3E-12
m2/s for class AA, 6.1E-12 m2/s for class AAAP, 7.6E-12 m2/s for HES and 1.0E-12 m2/s for SCC. The test
procedure, methods, computation method, results and discussion are included in this report. In general SCC
performed the best followed by AAAP, HES, AA, and A. Correlation was observed between increased design mix
strength reduced and migration coefficient. There was minimal correlation between migration coefficient and
concrete water/cement ratio, design slump, admixtures, and unit weight. High migration values were observed for
concretes containing coarse aggregate with a GL classification and an absorption of 1.99. A probabilistic analysis of
the results indicate that he majority of concretes evaluated will not provide satisfactory resistance to chlorides when
used in standard bridge structures with a 100 year design life.

ATLSS Report 16-04 Migration Coefficient of PennDOT Certified Concrete Page 2
TABLE OF CONTENTS
Abstract.......................................................................................................................................................................... 1
Table of Contents........................................................................................................................................................... 2
List of Figures ................................................................................................................................................................ 3
Overview ....................................................................................................................................................................... 4
Research Program .................................................................................................................................................. 4
NT Build 492 Test Method ............................................................................................................................................ 7
Test Schedule and Design ...................................................................................................................................... 7
Sample Preparation ................................................................................................................................................ 8
Preconditioning ...................................................................................................................................................... 8
Migration Test ....................................................................................................................................................... 9
Measurement of Chloride Penetration Depth ...................................................................................................... 11
Determination of Non-Steady State Migration Coefficient ......................................................................................... 13
Determination of Dnssm ......................................................................................................................................... 13
Sample Calculations ............................................................................................................................................ 13
Experimental Results and Discussion .......................................................................................................................... 15
Influence of Concrete Type ................................................................................................................................. 16
Influence of Concrete Strength ............................................................................................................................ 16
Influence of water to cement ratio ....................................................................................................................... 18
Influence of Unit Weight ..................................................................................................................................... 18
Influence of Slump .............................................................................................................................................. 19
Influence of Concrete Age ................................................................................................................................... 19
Influence of Coarse Aggregate ............................................................................................................................ 20
Probabilistic Assessment of PennDOT Certified Mixes .............................................................................................. 21
Conclusions and Future Work ..................................................................................................................................... 25
References ................................................................................................................................................................... 27
Appendix ..................................................................................................................................................................... 28
Post-Test Images .................................................................................................................................................. 30
ATLSS Report 16-04 Migration Coefficient of PennDOT Certified Concrete Page 3
LIST OF FIGURES
Figure 1: Company location map relative to PennDOT districts ................................................................................... 6
Figure 2: 50 mm concrete sample .................................................................................................................................. 8
Figure 3: Vacuum container with three specimens ........................................................................................................ 9
Figure 4: One arrangement of the migration test setup [NT Build 1999] ...................................................................... 9
Figure 5: Migration set-up and test in the lab .............................................................................................................. 10
Figure 6: Flowchart of the test procedure .................................................................................................................... 11
Figure 7: Split specimens with silver nitrate solution .................................................................................................. 11
Figure 8: Measurement of penetration depths (a) NT Build 492 [1999] (b) on Specimen .......................................... 12
Figure 9: Variation of C.O.V with age of concrete ...................................................................................................... 14
Figure 10: Variation of 56-days migration coefficient with mix type ......................................................................... 16
Figure 11: Variation of migration coefficient at 56-days with concrete 7-day compressive strength ......................... 17
Figure 12: Variation of migration coefficient at 56-days with 28-day compression strength ...................................... 17
Figure 13: Variation of 56-day migration coefficient with w/c ratio ........................................................................... 18
Figure 14: Variation of 56-day migration coefficient with unit weight ....................................................................... 18
Figure 15: Variation of 56-day migration coefficient with slump ............................................................................... 19
Figure 16: Variation of migration coefficient with concrete age ................................................................................. 19
Figure 17: Migration coefficient with coarse aggregate absorption ............................................................................ 20
Figure 18: Migration coefficient with coarse aggregate type ...................................................................................... 20
Figure 19: Probability of failure for splash condition .................................................................................................. 23
Figure 20: Probability of failure for spray condition ................................................................................................... 23
Figure 21: Summary of the experimental results ......................................................................................................... 25

ATLSS Report 16-04 Migration Coefficient of PennDOT Certified Concrete Page 4
OVERVIEW
This report details chloride migration evaluation of class A, AA, AAAP, High Early Strength (HES), and Self-
Consolidating Concrete (SCC) produced in Pennsylvania for PennDOT construction. The concretes were produced
by ready mix suppliers and precast bridge producers throughout the state, delivered to Lehigh University, and tested
at ages ranging from 28 to 113 days. The concrete was tested in accordance with Nordtest Method NT Build 492:
NT Build 492, (1999), “Nordtest Method Concrete, Mortar and Cement-Based Repair Materials: Chloride
Migration Coefficient from Non-Steady-State Migration Experiments,” Nordic Council of Ministers, Espoo,
Finland.
The study is conducted to assess the variability of chloride resistance of concrete produced in the state of
Pennsylvania. The migration coefficient is used as a metric of chloride resistance which in turn is used as an input
parameter for FIB 34 to determine the expected service life of components fabricated from the concrete.
FIB 34 Task Group 5.6. “Model Code for Service Life Design.” Tech. no. Bulletin 34. Lausanne: International
Federation for Structural Concrete, 2006.
In a natural environment the process of chloride penetration is measured in years. The traditional accelerated
methods such as diffusion cells or solution immersion are time-consuming to obtain results (Luping and Nilsson,
1992a, b). To address these limitations the Nordtest Method NT Build 492 was developed by Luping and Nilsson
(1992a, b). The method imparts an electrical field to a concrete sample to accelerate chloride migration and provides
a mathematical model to determine the ion diffusion as a result of the applied electrical field.
The NT Build 492 method has been used by researchers around the world to investigate the chloride migration
coefficient of concrete and its relationship with the other concrete properties. For example, the correlation of
chloride migration coefficient and concrete maturity was studied by Li, Dong, and Xiong (2014). The study
suggested a strong correlation between chloride diffusion coefficient with curing ages and curing temperature. More
comprehensive tests investigating temperature effects and concrete strength with various admixtures have been
conducted by Presuel-Moreno, Liu, Wu, and Arias (2013). The migration coefficient was found to be dependent on
many factors in the concrete composition such as the cement type, amount of water and admixtures.
Research Program
This study is the first phase of a research effort funded by the Pennsylvania Department of Transportation to assess
the design life of concrete bridge structures produced in the state. Included are all concrete types used for standard
production of substructure and superstructure components. These concretes are designated as HES, SCC, A, AA,
and AAAP. The PennDOT (2016) required mechanical properties for each class of concrete and their usage are
summarized in Table 1. A self-consolidating concrete mix with properties similar to HES (High Early Strength) was
also included. One sample of HPC was also acquired, since the properties are the same as that of AAAP it is herein
classified as AAAP.
ATLSS Report 16-04 Migration Coefficient of PennDOT Certified Concrete Page 5
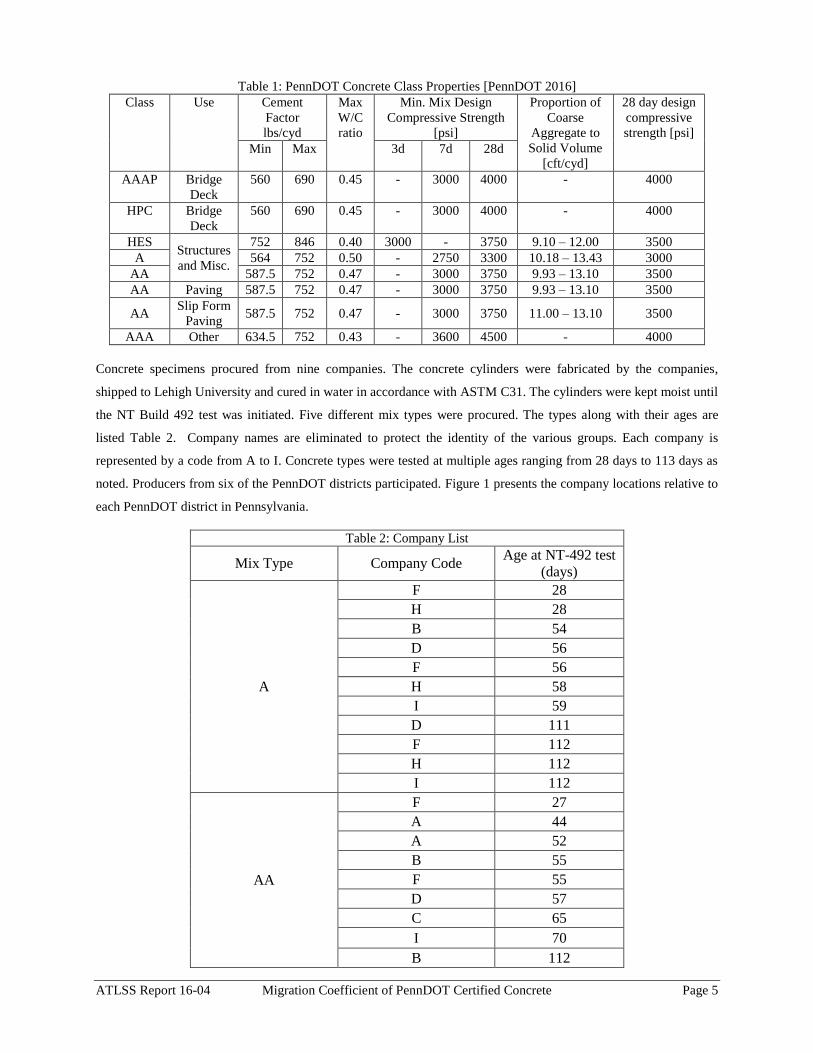
Table 1: PennDOT Concrete Class Properties [PennDOT 2016]
Class Use Cement
Factor
lbs/cyd
Max
W/C
ratio
Min. Mix Design
Compressive Strength
[psi]
Proportion of
Coarse
Aggregate to
Solid Volume
[cft/cyd]
28 day design
compressive
strength [psi]
Min Max 3d 7d 28d
AAAP Bridge
Deck
560 690 0.45 - 3000 4000 - 4000
HPC Bridge
Deck
560 690 0.45 - 3000 4000 - 4000
HES Structures
and Misc.
752 846 0.40 3000 - 3750 9.10 – 12.00 3500
A 564 752 0.50 - 2750 3300 10.18 – 13.43 3000
AA 587.5 752 0.47 - 3000 3750 9.93 – 13.10 3500
AA Paving 587.5 752 0.47 - 3000 3750 9.93 – 13.10 3500
AA Slip Form
Paving 587.5 752 0.47 - 3000 3750 11.00 – 13.10 3500
AAA Other 634.5 752 0.43 - 3600 4500 - 4000
Concrete specimens procured from nine companies. The concrete cylinders were fabricated by the companies,
shipped to Lehigh University and cured in water in accordance with ASTM C31. The cylinders were kept moist until
the NT Build 492 test was initiated. Five different mix types were procured. The types along with their ages are
listed Table 2. Company names are eliminated to protect the identity of the various groups. Each company is
represented by a code from A to I. Concrete types were tested at multiple ages ranging from 28 days to 113 days as
noted. Producers from six of the PennDOT districts participated. Figure 1 presents the company locations relative to
each PennDOT district in Pennsylvania.
Table 2: Company List
Mix Type Company Code Age at NT-492 test
(days)
A
F 28
H 28
B 54
D 56
F 56
H 58
I 59
D 111
F 112
H 112
I 112
AA
F 27
A 44
A 52
B 55
F 55
D 57
C 65
I 70
B 112

ATLSS Report 16-04 Migration Coefficient of PennDOT Certified Concrete Page 6
Table 2: Company List
Mix Type Company Code Age at NT-492 test
(days)
D 113
I 113
F 111
H 113
AAAP
H 29
G 54
B 55
D 55
F 56
H 59
B 112
D 112
F 112
HES E 53
SCC E 57
E 112
Figure 1: Company location map relative to PennDOT districts
ATLSS Report 16-04 Migration Coefficient of PennDOT Certified Concrete Page 7
NT BUILD 492 TEST METHOD
The concrete samples were evaluated in accordance with NT Build 492. The testing method is summarized in this
section.
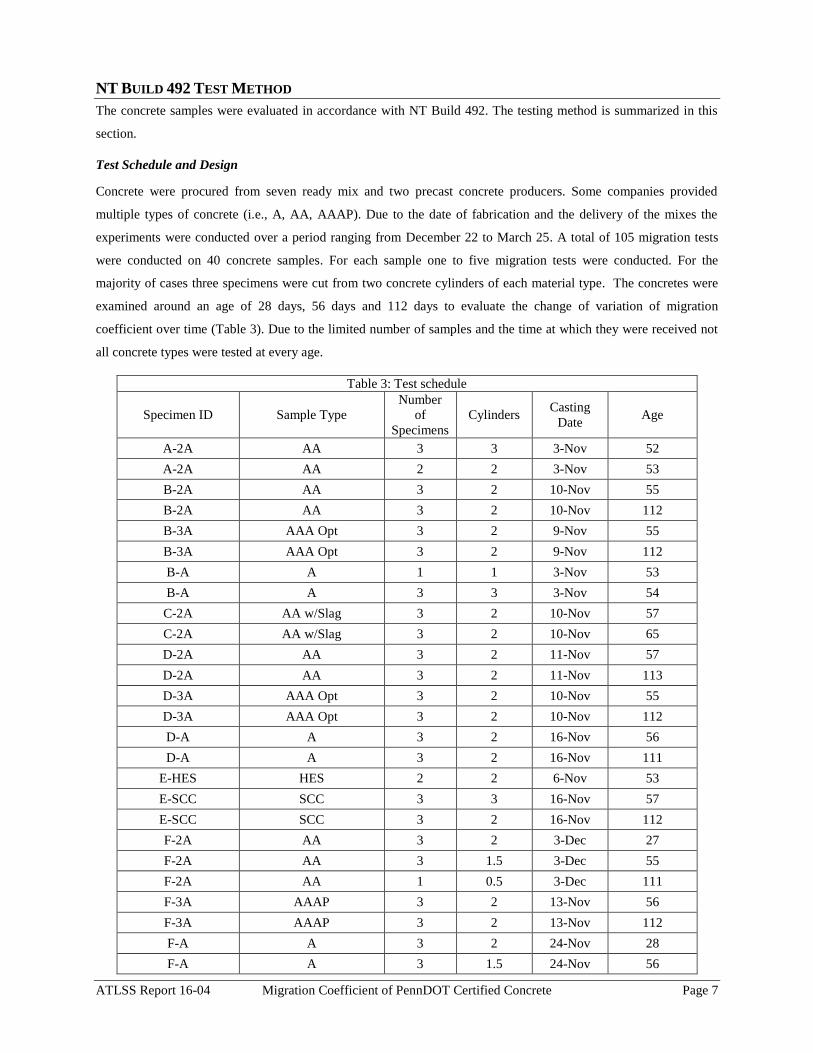
Test Schedule and Design
Concrete were procured from seven ready mix and two precast concrete producers. Some companies provided
multiple types of concrete (i.e., A, AA, AAAP). Due to the date of fabrication and the delivery of the mixes the
experiments were conducted over a period ranging from December 22 to March 25. A total of 105 migration tests
were conducted on 40 concrete samples. For each sample one to five migration tests were conducted. For the
majority of cases three specimens were cut from two concrete cylinders of each material type. The concretes were
examined around an age of 28 days, 56 days and 112 days to evaluate the change of variation of migration
coefficient over time (Table 3). Due to the limited number of samples and the time at which they were received not
all concrete types were tested at every age.
Table 3: Test schedule
Specimen ID Sample Type
Number
of
Specimens
Cylinders Casting
Date Age
A-2A AA 3 3 3-Nov 52
A-2A AA 2 2 3-Nov 53
B-2A AA 3 2 10-Nov 55
B-2A AA 3 2 10-Nov 112
B-3A AAA Opt 3 2 9-Nov 55
B-3A AAA Opt 3 2 9-Nov 112
B-A A 1 1 3-Nov 53
B-A A 3 3 3-Nov 54
C-2A AA w/Slag 3 2 10-Nov 57
C-2A AA w/Slag 3 2 10-Nov 65
D-2A AA 3 2 11-Nov 57
D-2A AA 3 2 11-Nov 113
D-3A AAA Opt 3 2 10-Nov 55
D-3A AAA Opt 3 2 10-Nov 112
D-A A 3 2 16-Nov 56
D-A A 3 2 16-Nov 111
E-HES HES 2 2 6-Nov 53
E-SCC SCC 3 3 16-Nov 57
E-SCC SCC 3 2 16-Nov 112
F-2A AA 3 2 3-Dec 27
F-2A AA 3 1.5 3-Dec 55
F-2A AA 1 0.5 3-Dec 111
F-3A AAAP 3 2 13-Nov 56
F-3A AAAP 3 2 13-Nov 112
F-A A 3 2 24-Nov 28
F-A A 3 1.5 24-Nov 56

ATLSS Report 16-04 Migration Coefficient of PennDOT Certified Concrete Page 8
Table 3: Test schedule
Specimen ID Sample Type
Number
of
Specimens
Cylinders Casting
Date Age
F-A A 1 0.5 24-Nov 112
G-3A AAAP 3 3 4-Nov 54
G-3A AAAP 1 1 4-Nov 55
H-3A AAA HPC 3 1.5 3-Dec 29
H-3A AAA HPC 3 1.5 3-Dec 59
H-3A AAA HPC 2 1 3-Dec 113
H-A A 3 1.5 3-Dec 28
H-A A 3 1.5 3-Dec 58
H-A A 2 1 3-Dec 112
I-2A AA 3 2 20-Nov 70
I-2A AA 3 2 20-Nov 113
I-A A 3 2 20-Nov 69
I-A A 3 2 20-Nov 112
Sample Preparation
Migration coefficient specimen samples were made from the 4 x 8 in. cylinders. Each sample was cut into 50 ± 2
mm thick segments as showed in Figure 2. A water-cooled diamond saw was used to saw the concrete cylinder
perpendicularly to its axis. As recommended by NT Build 492, the end surface that is nearer to the first cut (the
middle surface) was exposed to the chloride solution (catholyte).
Figure 2: 50 mm concrete sample
Preconditioning
After sawing the concrete cylinder, the specimens were brushed and washed. The surfaces of the specimen were
wiped remove excess water. When the specimens were surface-dry, they were placed in the vacuum container for
vacuum treatment. The absolute pressure in the vacuum container was reduced to less than 50 mbar (5 kPa) within a
few minutes. Since an absolute pressure is defined the chamber must be capable of providing a vacuum in the range
of -100 to -96 kPa. The vacuum was maintained for 3 hours and then, with both the end surfaces exposed and pump
still running, the container was filled with saturated Ca(OH)2 solution. The Ca(OH)2 solution was made by 5.37 g
Calcium hydroxide with 3100 ml pure water. The specimens were immersed in Ca(OH)2 solution under vacuum for

ATLSS Report 16-04 Migration Coefficient of PennDOT Certified Concrete Page 9
an additional hour and then depressurized to standard room pressure (i.e., 101 kPa). The specimens were kept in
solution for 18 ± 2 hours. Figure 3 shows three specimens under vacuum treatment.
Figure 3: Vacuum container with three specimens
Migration Test
According to NT Build 492, the principle of the test is to apply an external electrical potential axially across the
specimen and force the chloride ions outside to migrate into the specimen. The setup is illustrated in Figure 4. In the
laboratory, three parallel setups are established numbered 1 to 3 so that the three specimens can be tested in parallel.
Steps of the testing procedure and the testing setups are illustrated in Figure 5.
Figure 4: One arrangement of the migration test setup [NT Build 1999]

ATLSS Report 16-04 Migration Coefficient of PennDOT Certified Concrete Page 10
Figure 5: Migration set-up and test in the lab
Each specimen is subjected to an initial voltage of 30 V. The initial current through each specimen is recorded.
Based on the initial current when subject to 30 V, the voltage applied is adjusted in accordance with the
recommendations in Table 4. Initial temperature in each anolyte solution is recorded. As noted in Table 4 test
duration is 24 hours for the majority of the cases but could range from 6 hours for high initial current and up to 96
hours for low initial current.
Table 4: Test voltage and duration for concrete specimen [NT Build 1999]
ATLSS Report 16-04 Migration Coefficient of PennDOT Certified Concrete Page 11
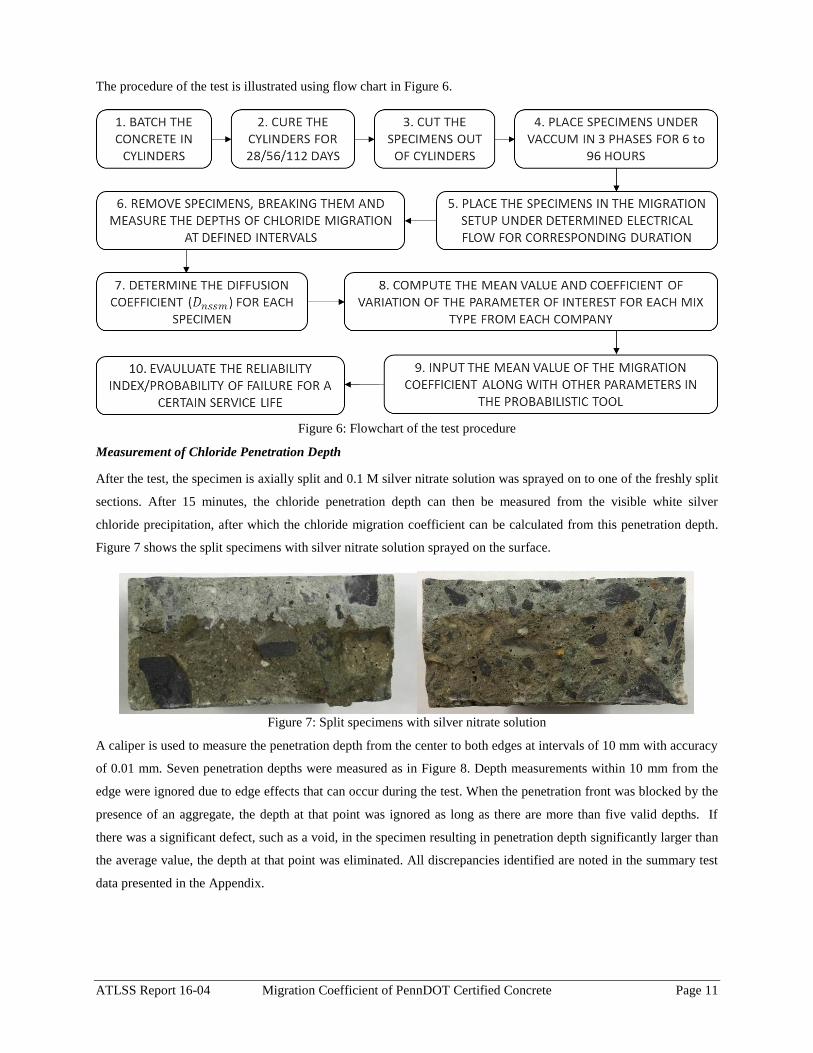
The procedure of the test is illustrated using flow chart in Figure 6.
Figure 6: Flowchart of the test procedure
Measurement of Chloride Penetration Depth
After the test, the specimen is axially split and 0.1 M silver nitrate solution was sprayed on to one of the freshly split
sections. After 15 minutes, the chloride penetration depth can then be measured from the visible white silver
chloride precipitation, after which the chloride migration coefficient can be calculated from this penetration depth.
Figure 7 shows the split specimens with silver nitrate solution sprayed on the surface.
Figure 7: Split specimens with silver nitrate solution
A caliper is used to measure the penetration depth from the center to both edges at intervals of 10 mm with accuracy
of 0.01 mm. Seven penetration depths were measured as in Figure 8. Depth measurements within 10 mm from the
edge were ignored due to edge effects that can occur during the test. When the penetration front was blocked by the
presence of an aggregate, the depth at that point was ignored as long as there are more than five valid depths. If
there was a significant defect, such as a void, in the specimen resulting in penetration depth significantly larger than
the average value, the depth at that point was eliminated. All discrepancies identified are noted in the summary test
data presented in the Appendix.

ATLSS Report 16-04 Migration Coefficient of PennDOT Certified Concrete Page 12
a) b)
Figure 8: Measurement of penetration depths (a) NT Build 492 [1999] (b) on Specimen
ATLSS Report 16-04 Migration Coefficient of PennDOT Certified Concrete Page 13
DETERMINATION OF NON-STEADY STATE MIGRATION COEFFICIENT
Chloride migration coefficient is a parameter used to quantify the resistance of concrete to the transport of chlorides.
There are two methods currently used to determine the coefficient. The first utilizes steady state experiments such as
diffusion or a migration cell, and the other utilizes non-steady state experiments [Andrade, Castellote, Alonso, and
Gonzalez 2000]. Steady state evaluation is a time consuming process that can take months or years to conduct. Non-
steady state or non-stationary methods can be completed in an accelerated manner and in the case of the NT Build
492 consists of a 24 to 96 hour test. In addition to the relatively short duration the non-stationary methods also
assesses the binding of chlorides with the cement paste and the ionic transport. Steady state methods only do the
later [Castellote, Andrade, and Alonso 2001].
The NT Build 492 Method determines the Non-Steady State Migration Coefficient, Dnssm. The measurement is
typically designated in 10-12 m2/s. A higher value is indicative of a faster diffusion of chlorides and a shorter design
life for the structure in which it is utilized. Henceforth the terminology migration coefficient will be used to refer to
the non-steady state migration coefficient as determined using NT Build 492 [1999].
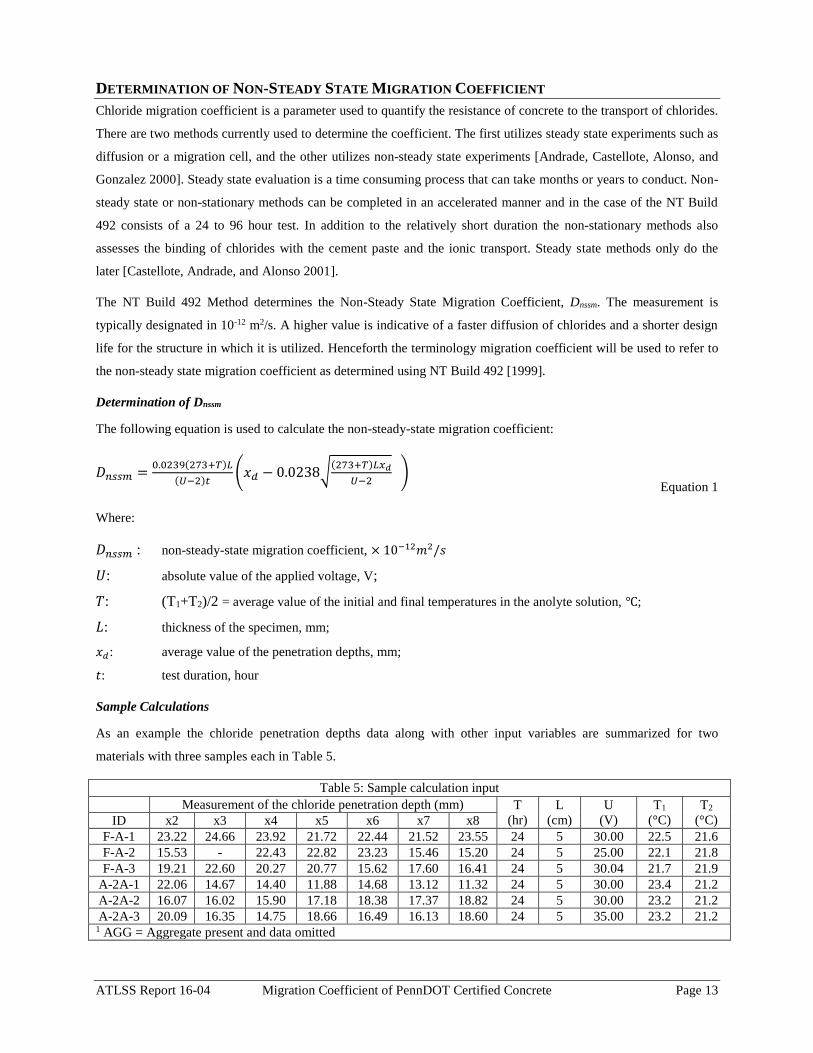
Determination of Dnssm
The following equation is used to calculate the non-steady-state migration coefficient:
Equation 1
Where:
𝐷𝑛𝑠𝑠𝑚 : non-steady-state migration coefficient, × 10−12𝑚2/𝑠
𝑈: absolute value of the applied voltage, V;
𝑇: (T1+T2)/2 = average value of the initial and final temperatures in the anolyte solution, ℃;
𝐿: thickness of the specimen, mm;
𝑥𝑑: average value of the penetration depths, mm;
𝑡: test duration, hour
Sample Calculations
As an example the chloride penetration depths data along with other input variables are summarized for two
materials with three samples each in Table 5.
Table 5: Sample calculation input
Measurement of the chloride penetration depth (mm) T
(hr)
L
(cm)
U
(V)
T1
(°C)
T2
(°C) ID x2 x3 x4 x5 x6 x7 x8
F-A-1 23.22 24.66 23.92 21.72 22.44 21.52 23.55 24 5 30.00 22.5 21.6
F-A-2 15.53 - 22.43 22.82 23.23 15.46 15.20 24 5 25.00 22.1 21.8
F-A-3 19.21 22.60 20.27 20.77 15.62 17.60 16.41 24 5 30.04 21.7 21.9
A-2A-1 22.06 14.67 14.40 11.88 14.68 13.12 11.32 24 5 30.00 23.4 21.2
A-2A-2 16.07 16.02 15.90 17.18 18.38 17.37 18.82 24 5 30.00 23.2 21.2
A-2A-3 20.09 16.35 14.75 18.66 16.49 16.13 18.60 24 5 35.00 23.2 21.2 1 AGG = Aggregate present and data omitted
𝐷𝑛𝑠𝑠𝑚 =0.0239(273+𝑇)𝐿
(𝑈−2)𝑡(𝑥𝑑 − 0.0238√
(273+𝑇)𝐿𝑥𝑑
𝑈−2 )
ATLSS Report 16-04 Migration Coefficient of PennDOT Certified Concrete Page 14
The non-steady-state migration coefficient is calculated from the values in Table 5 using Equation 1. Average value
of the three samples is calculated along with the coefficient of variation to evaluate the accuracy of the test. Table 6
shows the non-steady-state migration coefficient calculated using the input from Table 6.
Table 6: Migration coefficient with mean, coefficient of variation and age
Sample
Code
Dnssm
Migration Coefficient
(E-12 m2/s)
Average COV Age(days)
F-A-1 10.695
9.960 11.3% 28 F-A-2 10.521
F-A-3 8.665
A-2A-1 6.565
7.043 9.3% 52 A-2A-2 7.793
A-2A-3 6.771
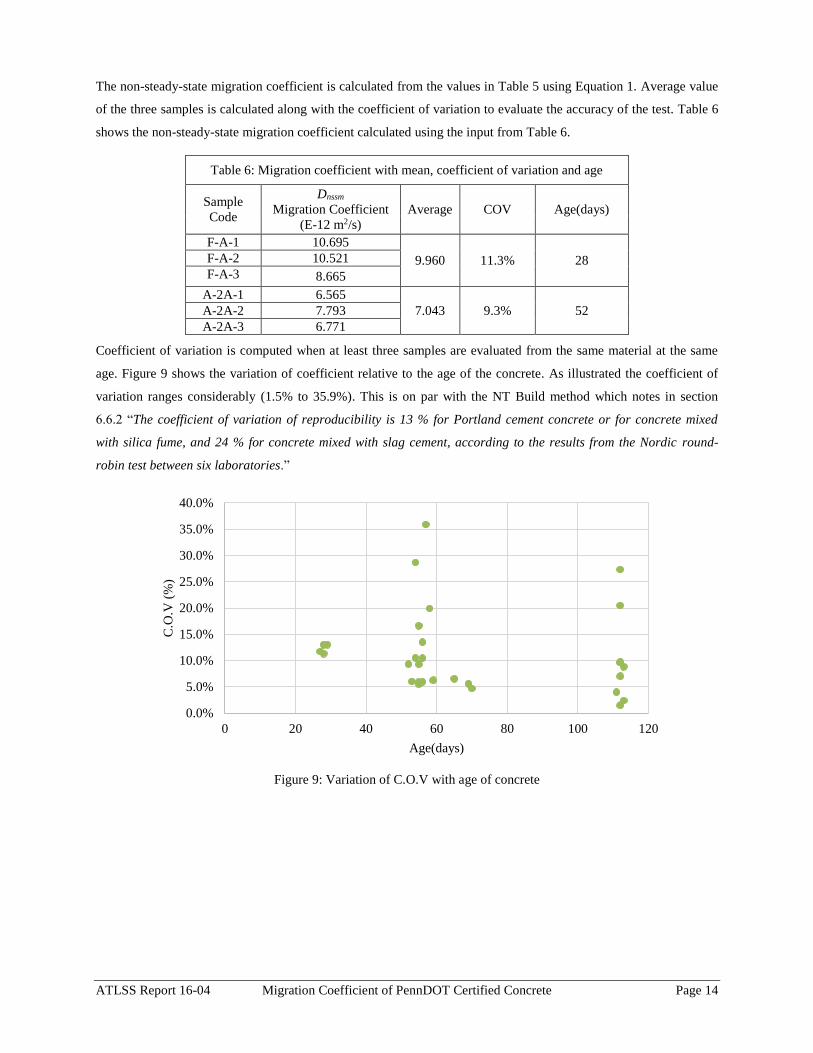
Coefficient of variation is computed when at least three samples are evaluated from the same material at the same
age. Figure 9 shows the variation of coefficient relative to the age of the concrete. As illustrated the coefficient of
variation ranges considerably (1.5% to 35.9%). This is on par with the NT Build method which notes in section
6.6.2 “The coefficient of variation of reproducibility is 13 % for Portland cement concrete or for concrete mixed
with silica fume, and 24 % for concrete mixed with slag cement, according to the results from the Nordic round-
robin test between six laboratories.”
Figure 9: Variation of C.O.V with age of concrete
0.0%
5.0%
10.0%
15.0%
20.0%
25.0%
30.0%
35.0%
40.0%
0 20 40 60 80 100 120
C.O
.V (
%)
Age(days)

ATLSS Report 16-04 Migration Coefficient of PennDOT Certified Concrete Page 15
EXPERIMENTAL RESULTS AND DISCUSSION
As mentioned previously, concrete were procured from seven ready mix and two precast concrete producers. Some
companies provided multiple types of concrete (i.e., A, AA, AAAP). A total of nine concrete producers are involved
in the test. Some of the producers provide 3 types of concrete while some of them provide only 1 type of concrete. A
total of 105 migration tests were conducted on 40 concrete samples. For each sample one to five migration tests
were conducted. For the majority of cases three specimens were cut from two concrete cylinders of each material
type. The concretes were examined around an age of 28 days, 56 days and 112 days to evaluate the change of
variation of migration coefficient over time.
Table 7 presents the summary non-steady state migration coefficient along with its mix type, company code, COV
and age for all tests conducted.
Table 7: Migration coefficient data
Mix Type Company
Code Average COV Age
A
F 9.960 11.30% 28
B 6.970 10.48% 54
H 7.288 12.97% 28
D 20.019 13.50% 56
F 9.889 10.47% 56
I 9.995 5.60% 69
H 5.828 19.89% 58
D 17.601 3.99% 111
I 8.569 9.66% 112
F 7.867 - 112
H 5.207 - 112
AA
A 6.005 - 44
A 7.043 9.34% 52
F 10.375 11.70% 27
B 7.340 16.58% 55
D 14.984 13.14% 57
C 7.157 6.49% 65
F 10.040 9.33% 55
I 8.344 4.68% 70
B 7.075 20.48% 112
D 13.682 8.81% 113
I 7.567 2.39% 113
H 2.843 - 113
F 5.466 - 111
AAAP
G 8.380 28.67% 54
H 4.849 13.02% 29
B 4.939 5.50% 55
D 10.914 5.88% 55
F 5.219 5.94% 56
H 3.985 6.24% 59
B 4.798 1.51% 112

ATLSS Report 16-04 Migration Coefficient of PennDOT Certified Concrete Page 16
Table 7: Migration coefficient data
Mix Type Company
Code Average COV Age
D 6.649 9.65% 112
F 5.240 7.01% 112
HES E 7.551 6.02% 53
SCC E 1.219 35.88% 57
SCC E 0.858 27.31% 112
The influence of concrete mix type, w/c ratio, unit weight, slump and strength on migration coefficient is evaluated.
Influence of Concrete Type
From the limited data examined there appears to be limited correlation between concrete type and migration
coefficient. The average data for concrete tested at an age of approximately 56 days is presented in Figure 10. While
the sample size is too small to draw any firm conclusion, it is noted that migration coefficient is reduced with better
concrete. Across all ages the study resulted in an average non-steady-state migration coefficient of 9.9E-12 m2/s for
class A, 8.3E-12 m2/s for class AA, 6.1E-12 m2/s for class AAAP, 7.6E-12 m2/s for HES and 1.0E-12 m2/s for SCC.
It should be noted that the one SCC sample tested had the highest strength among all the others and it has the lowest
migration coefficient.
Figure 10: Variation of 56-days migration coefficient with mix type
Influence of Concrete Strength
In a general sense the migration coefficient decreases with increase in concrete compressive strength. The 7-day and
28-day compressive strengths for a number of mix designs were provided by the concrete producers and are
compared to the migration coefficient measured at an age of 56-days as shown in Figure 11 and Figure 12. As
shown higher strength concretes are observed to produce a lower migration coefficient.
6.970
20.019
9.889
5.828
9.995
7.043
7.340
7.157
14.984
10.0408.344
4.939
10.914
5.219
8.380
3.985
7.551
1.219
0.00
5.00
10.00
15.00
20.00
25.00
Dnss
m(E
-12
m2/s
)

ATLSS Report 16-04 Migration Coefficient of PennDOT Certified Concrete Page 17
Figure 11: Variation of migration coefficient at 56-days with concrete 7-day compressive strength
Figure 12: Variation of migration coefficient at 56-days with 28-day compression strength
0.000
5.000
10.000
15.000
20.000
25.000
0 2000 4000 6000 8000 10000 12000 14000
Dnss
m(E
-12
m2/s
)
Strength (psi)
0.000
5.000
10.000
15.000
20.000
25.000
0 2000 4000 6000 8000 10000 12000 14000
Dn
ssm
(E-1
2 m
2/s
)
Strength (psi)
ATLSS Report 16-04 Migration Coefficient of PennDOT Certified Concrete Page 18
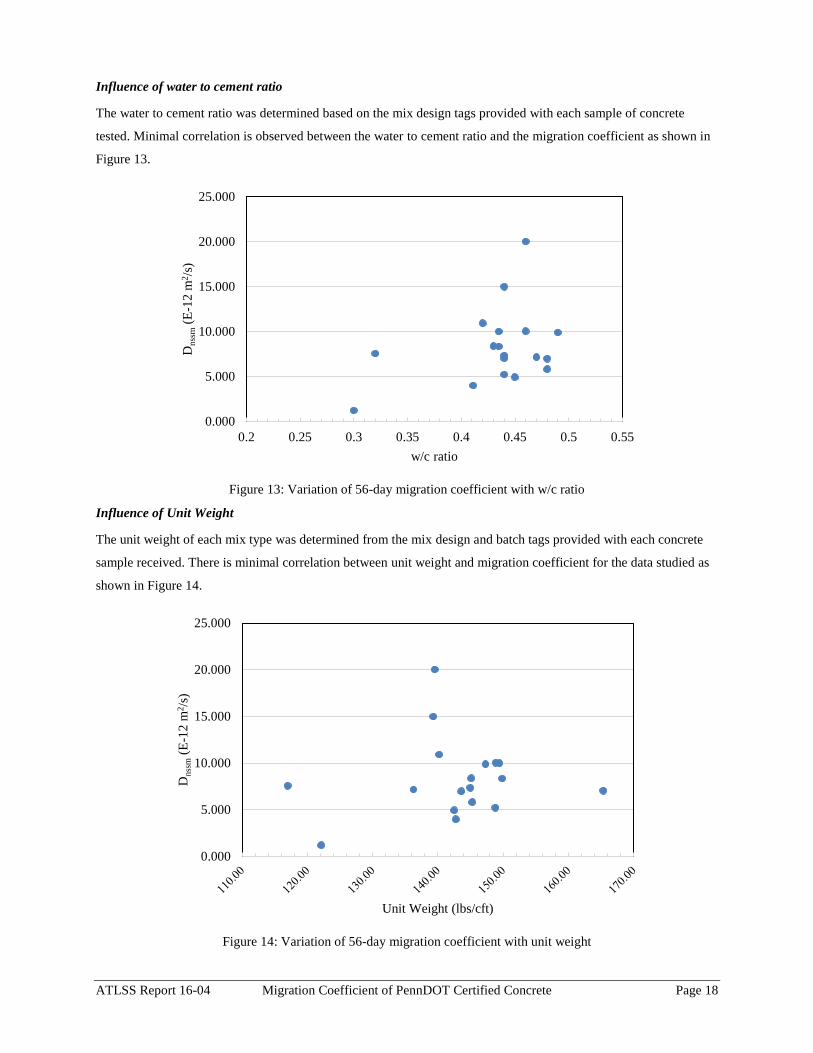
Influence of water to cement ratio
The water to cement ratio was determined based on the mix design tags provided with each sample of concrete
tested. Minimal correlation is observed between the water to cement ratio and the migration coefficient as shown in
Figure 13.
Figure 13: Variation of 56-day migration coefficient with w/c ratio
Influence of Unit Weight
The unit weight of each mix type was determined from the mix design and batch tags provided with each concrete
sample received. There is minimal correlation between unit weight and migration coefficient for the data studied as
shown in Figure 14.
Figure 14: Variation of 56-day migration coefficient with unit weight
0.000
5.000
10.000
15.000
20.000
25.000
0.2 0.25 0.3 0.35 0.4 0.45 0.5 0.55
Dnss
m(E
-12
m2/s
)
w/c ratio
0.000
5.000
10.000
15.000
20.000
25.000
Dn
ssm
(E-1
2 m
2/s
)
Unit Weight (lbs/cft)

ATLSS Report 16-04 Migration Coefficient of PennDOT Certified Concrete Page 19
Influence of Slump
The slump of each mix type was determined from the mix design and batch tags provided with each concrete sample
received. Minimal correlation between the plastic slump and the migration coefficient was observed as shown in
Figure 15.
Figure 15: Variation of 56-day migration coefficient with slump
Influence of Concrete Age
The migration coefficient for the concrete tested tends to decrease with age. The migration coefficient tests were
conducted at approximately 28, 56, and 112 days of age. Not all concretes were tested at each age and due to similar
concrete fabrication dates the test date varied around the target as illustrated in Figure 16. The migration coefficients
consistently decrease as the age of the concrete increases from 28 days to 56 and 112 days. The test results are
agreement with other studies of the chloride penetration behavior in laboratory tests and real structures, where a
clear time dependency of the migration coefficient is observed.
Figure 16: Variation of migration coefficient with concrete age
5.219
3.985
6.970
5.828
9.995
7.340
8.344
4.939
10.040
8.380
9.889
7.1577.551
1.219
0.000
2.000
4.000
6.000
8.000
10.000
12.000
3 1/2 3 3/4 4 1/4 4 1/2 4 1/2 4 3/4 4 3/4 5 1/4 5 1/2 6 1/2 7 7 1/2 7 1/2 24
Dnss
m(E
-12
m2/s
)
Slump (in.)
0
5
10
15
20
25
20 40 60 80 100 120
Dn
ssm
(E-1
2 m
2/s
)
Age (Days)

ATLSS Report 16-04 Migration Coefficient of PennDOT Certified Concrete Page 20
Influence of Coarse Aggregate
The coarse aggregate absorption and type were examined for each of the samples provided. The aggregate types
were identified from the PennDOT Concrete Mix Design Form (TR-4221A) which identified the coarse aggregate
producer and supplier code. The coarse aggregate properties were determined from PennDOT Bulletin 14
Publication 34 - Aggregate Producers. The specific gravity, absorption, sodium sulfate soundness and rock
composition is provided. No correlation was observed between either the specific gravity or soundness and the
migration coefficient. One concrete sample produced very high migration coefficient values. This material was
produced from one aggregate type and was present in three mixes D-A, D-2A and D-3A. As illustrated in the three
outliers in Figure 17 and the Sandstone – GL types in Figure 18 the concretes containing these aggregates had a very
high migration coefficient. This may be attributed to the high absorption of the aggregate (1.99) or the fact that the
material is a sandstone gravel (GL).
Figure 17: Migration coefficient with coarse aggregate absorption
Figure 18: Migration coefficient with coarse aggregate type
0.0
5.0
10.0
15.0
20.0
25.0
0.00 0.50 1.00 1.50 2.00 2.50
Mig
rati
on C
oef
fici
ent
[E-1
2 m
2/s
]
Coarse Aggregate Absorption
0.000
5.000
10.000
15.000
20.000
25.000
Mig
rati
on
Co
effi
cien
t [E
-12
m2 /
s]
ATLSS Report 16-04 Migration Coefficient of PennDOT Certified Concrete Page 21
PROBABILISTIC ASSESSMENT OF PENNDOT CERTIFIED MIXES
A parallel task of this research effort was to develop tool to perform the full-probabilistic design approach detailed
in fib Bulletin 34 - Model Code for Service life Design [2006], for the chloride-induced corrosion in uncracked
concrete. Service life design of the concrete is based on the solution to a mathematical model for initiation of
corrosion in the reinforcing steel in a concrete section exposed to chlorides. . The model uses Fick's 2nd law to
compare the chloride content in the concrete at the depth of the reinforcement at a desired time, to the critical
chloride content for the reinforcing steel. A Monte Carlo simulation is used to solve the problem repeatedly, by
changing the value of each of the random variables in the equation based on their predefined probability distribution.
The tool was developed is titled Probabilistic Chloride Ingress Model (ProCIM). It is executable in Microsoft Excel
[2013] and is detailed in [Shojaeian, Bocchini, Naito, Ma, Karamlou, and Fox 2016]. The data generated on the
chloride migration coefficient for each mix in this report is used to determine the performance of a structure when
fabricated from the various concrete mixes. Default parameters are used for the majority of inputs for the model with
the following exceptions. An average temperature of 55.85⁰F with a standard deviation of 15.7⁰F is assumed for
Pennsylvania. The clear cover is assumed to be 2.5 in. based on deck reinforcement requirements for PennDOT
Bridge Design Standards BD-600 [2014]. A construction tolerance for the vertical location of the reinforcement is
assumed to be 0.25 in. in accordance with PennDOT Specifications [2016]. Three cement types are defined by fib
34, Portland Cement Concrete (I), Portland Fly Ash Cement Concrete (F) and Blast Furnace Slag Cement Concrete
(S). Since data on the exact formulations used by the PA concrete producers do not match the mixes used in the fib
34 the closest match was used. Concretes containing slag are identified as cement type S, those containing fly ash
are designated as cement type F and those with neither are designated as cement type I. The concretes were tested at
an age of approximately 28, 56 and 112 days. The aging coefficient in the tool is based on the use of 28 day
strengths however since the migration coefficient did not change considerably over 112 days the performance of all
concretes are compared using the same aging coefficient. This is done regardless of whether the chloride migration
coefficient was computed at 28, 56 or 112 days. Consequently the performance of the older concretes using the tool
will be unconservative.
The ability of the concrete to achieve a 100 year design life is examined. Two environmental conditions are studied.
The first considers a splash road environment. This correlates to a concrete element that is within 1.5 m from a
chloride source. The second environment consists of a spray road environment where the concrete element is more
than 1.5 m from a chloride source. Note that these calculations are conducted for uncoated reinforcing bars. By
PennDOT requirements reinforcement would likely be epoxy coated for these environments and would thus perform
better. Additional study is required to modify the formulations to assess the performance of epoxy coated bars. The
performance of all concretes tested with three or more samples are summarized in Table 8.
In assessment of performance the following terminology is used. Failure occurs when the chloride concentration is
greater than the critical chloride concentration at the location of the reinforcement at the service life of interest. The
probability of failure is the probability of this event occurring. The reliability index is the defined as minus the
inverse of the standard Gaussian cumulative distribution function computed at the probability of failure. According
to fib 34 an acceptable probability of failure is 10% which corresponds to a reliability index of 1.3. A calculated
reliability index greater than 1.3 at the reinforcement at the service life of interest is deemed satisfactory

ATLSS Report 16-04 Migration Coefficient of PennDOT Certified Concrete Page 22
performance. A calculated reliability index less than 1.3 at the reinforcement at the service life of interest is deemed
unsatisfactory performance.
Table 8: Service life performance of concretes
Type
Chloride migration
coefficient [E-12 m2/s] Age
(days)
Cement
Type
Splash Road Environment Spray Road Environment
Average COV
Calculated
Reliability
Index
Satisfactory /
Unsatisfactory
Calculated
Reliability
Index
Satisfactory /
Unsatisfactory
B-A 6.970 10.50% 54 S 0.23 U1 0.42 U
D-A 20.019 13.50% 56 FA 0.36 U 0.58 U
D-A 17.601 4.00% 111 FA 0.44 U 0.68 U
F-A 9.960 11.30% 28 S 0.03 U 0.21 U
F-A 9.889 10.50% 56 S 0.04 U 0.21 U
H-A 7.288 13.00% 28 S 0.21 U 0.39 U
H-A 5.828 19.90% 58 S 0.34 U 0.53 U
I-A 8.569 9.70% 112 S 0.11 U 0.30 U
A-2A 7.043 9.30% 52 S 0.22 U 0.41 U
B-2A 7.340 16.60% 55 S 0.21 U 0.39 U
B-2A 7.075 20.50% 112 S 0.23 U 0.42 U
B-3A 4.939 5.50% 55 S 0.42 U 0.62 U
B-3A 4.798 1.50% 112 S 0.45 U 0.64 U
C-2A 7.157 6.50% 65 S 0.21 U 0.40 U
D-2A 13.682 8.80% 113 F 0.62 U 0.86 U
F-2A 10.375 11.70% 27 S 0.01 U 0.19 U
F-2A 10.040 9.30% 55 S 0.03 U 0.21 U
I-2A 9.995 5.60% 69 S 0.02 U 0.20 U
I-2A 8.344 4.70% 70 S 0.13 U 0.31 U
I-2A 7.567 2.40% 113 S 0.18 U 0.36 U
D-3A 10.914 5.90% 55 FA 0.81 U 1.03 U
D-3A 6.649 9.70% 112 FA 1.14 U 1.39 Sa
F-3A 5.219 5.90% 56 S 0.41 U 0.60 U
F-3A 5.240 7.00% 112 S 0.39 U 0.58 U
G-3A 8.380 28.70% 54 I -0.64 U -0.41 U
H-3A 4.849 13.00% 29 S 0.44 U 0.63 U
H-3A 3.985 6.20% 59 S 0.55 U 0.75 U
E-HES 4.524 16.90% 161 S 0.48 U 0.68 U
E-SCC 1.219 35.90% 57 S 1.32 Sa 1.57 Sa
E-SCC 0.858 27.30% 112 S 1.57 Sa 1.84 Sa
The results of the analysis indicate that the majority of concretes will not provide adequate protection for uncoated
reinforcement when used in a splash or spray condition. The performances of three concrete types are examined in
1 Sa = Satisfactory reliability, U = Unsatisfactory reliability

ATLSS Report 16-04 Migration Coefficient of PennDOT Certified Concrete Page 23
more detail below. The concrete with the highest, lowest and median chloride migration coefficient are examined
(Table 9). The probabilities of failure of the three mixes are presented as a function of time and are illustrated in
Figure 19 and Figure 20.
Table 9: Concrete for further examination
Type Chloride migration coefficient [E-12 m2/s]
Age (days) Cement
Type Average COV
High D-A 20.019 13.50% 56 FA
Median I-2A 7.567 2.40% 113 S
Low E-SCC 0.858 27.30% 112 S
Figure 19: Probability of failure for splash condition
Figure 20: Probability of failure for spray condition
Based on the detailed probabilistic analysis presented in Figure 19 and Figure 20 the high and median migration
coefficients do not provide adequate protection for the reinforcement. Based on the study the critical chloride
concentrations would be reached at the reinforcement at approximately 15-20 years for the two concretes. The
0
5
10
15
20
25
30
35
40
45
0 20 40 60 80 100
Pro
bab
ilit
y o
f fa
ilure
[%
]
Time [years]
D-A (High)
I-2A (Medium)
E-SCC (Low)
0
5
10
15
20
25
30
35
40
0 10 20 30 40 50 60 70 80 90 100
Pro
bab
ilit
y o
f fa
ilure
[%
]
Time [years]
D-A (High)
I-2A (Medium)
E-SCC (Low)
Target probability of failure
Target probability of failure
ATLSS Report 16-04 Migration Coefficient of PennDOT Certified Concrete Page 24
concrete with the low migration coefficient is needed to achieve satisfactory performance at the 100 year design life.
As an aside it is interesting to note that the median migration coefficient resulted in a shorter time to failure than the
concrete with the high migration coefficient. This can be attributed to the fact that the concrete with the highest
migration coefficient contained fly ash while the median contained slag. According to fib 34 these two materials
result in different rates of migration over time and are illustrated in Figure 19.

ATLSS Report 16-04 Migration Coefficient of PennDOT Certified Concrete Page 25
CONCLUSIONS AND FUTURE WORK
A research study sponsored by Pennsylvania Department of Transportation was conducted to examine the non-
steady state chloride migration coefficient of concrete commercially produced in Pennsylvania. Concrete produced
by ready mix suppliers and precast and prestressed concrete producers were examined. PennDOT certified concrete
class A, AA, and AAAp, and precast SCC and HES mixes were procured from suppliers in the form of 4x8 in.
cylinders and evaluated in accordance with Nordtest Method NT Build 492. Experiments were conducted on
concrete cured to approximately 28, 56 and 112 days. The concrete results for the test program are summarized in
Figure 21.
Figure 21: Summary of the experimental results
The following conclusions can be made:
The NT Build 492 test procedure is easy to follow but may produce a high coefficients of variation. COV varied
from 1.5% to 35.9%
Migration coefficient tends to decrease for higher class concretes. In general SCC performed the best followed
by AAAP, HES, AA, and A.
Across all ages the study resulted in an average non-steady-state migration coefficient of 9.9E-12 m2/s for class
A, 8.3E-12 m2/s for class AA, 6.1E-12 m2/s for class AAAP, 7.6E-12 m2/s for HES and 1.0E-12 m2/s for SCC.
Migration coefficient tended to decrease with increased design mix compressive strength and increased concrete
age.
There was minimal correlation between migration coefficient and concrete water/cement ratio, design slump,
admixtures, and unit weight.
High migration values were observed for three concretes types produced by one manufacturer. Each type (A,
AA, and AAAP) contained coarse aggregate with a GL classification and an absorption of 1.99. The outlying
results produced by these concretes may be related to either the class of aggregate used or the high absorption of
the aggregate and should be further examined through microscopy and chemical analysis.
9.96
0
10.3
75
7.28
8
4.84
97.04
3
6.97
0
7.34
0
4.93
9 7.15
7
20.0
19
14.9
84
10.9
14
7.55
1
1.21
9
9.88
9
10.0
40
5.21
9
8.38
0
5.82
8
3.98
5
9.99
5
8.34
4
7.07
5
4.79
8
17.6
01
13.
682
6.64
9
0.85
8
7.86
7
5.46
6
5.24
0
5.20
7
2.84
3
8.56
9
7.56
7
0
5
10
15
20
25
AA A
AA
AA
AP
Op
t
AA
w/S
lag A
AA
AA
AP
Op
t
HE
S
SC
C A
AA
AA
AP
AA
AP A
AA
A H
PC A
AA
A B B B C D D D E E F F F G H H I I
Dnss
m (
*1
E-1
2 m
2/s
)
Concrete Type and Company Code
28 days 56 days 112 days

ATLSS Report 16-04 Migration Coefficient of PennDOT Certified Concrete Page 26
The measured migration coefficients were used to assess the service life of uncoated reinforcement through a
probabilistic analysis. It was found that the majority of concretes tested when used in a bridge structure would
not result in an acceptable level of performance at 100 years of service.

ATLSS Report 16-04 Migration Coefficient of PennDOT Certified Concrete Page 27
REFERENCES
Andrade, C., Castellote, M., Alonso, C., and González, C. (2000). Non-steady-state chloride diffusion coefficients
obtained from migration and natural diffusion tests. Part I: Comparison between several methods of calculation.
Materials and Structures, 33(1), 21-28.
Castellote, M., Andrade, C., & Alonso, C. (2001). Measurement of the steady and non-steady-state chloride
diffusion coefficients in a migration test by means of monitoring the conductivity in the anolyte chamber.
Comparison with natural diffusion tests. Cement and Concrete Research, 31(10), 1411-1420.
ASTM C31/C31M-15 Standard Practice for Making and Curing Concrete Test Specimens in the Field, ASTM
International, West Conshohocken, PA, 2015, http://dx.doi.org/10.1520/C0031_C0031M-15AE01
FIB 34 Task Group 5.6. “Model Code for Service Life Design.” Tech. no. Bulletin 34. Lausanne: International
Federation for Structural Concrete, 2006.
NT Build 492, (1999), “Nordtest Method Concrete, Mortar and Cement-Based Repair Materials: Chloride
Migration Coefficient from Non-Steady-State Migration Experiments,” Nordic Council of Ministers, Espoo,
Finland.
Li, P. P., Dong, G. H., and Xiong, J. B. (2014). The correlation of chloride diffusion coefficient and concrete
maturity value and its application in marine engineering. In Advanced Materials Research (Vol. 1004, pp. 1551-
1555). Trans Tech Publications.
Luping, T. and Nilsson, L. (1992a). Chloride Diffusivity in High Strength Concrete at Different Ages. Nordic
Concrete Research, Nordic Concrete Federation, Vol.11, 162-171.
Luping, T. and Nilsson, L. (1992b). Rapid Determination of the Chloride Diffusivity in Concrete by Applying an
Electrical Field. ACI Materials Journal, 89(1), 49-53.
Pennsylvania Department of Transportation. (2016). Publication 408/2016 Specifications, 2016 Edition Effective
April 1, 2016.
Pennsylvania Department of Transportation. (2014). PennDOT Index of Standards for Bridge Designs BD-600.
http://www.dot.state.pa.us/public/Bureaus/BOPD/Bridge/2014/BD/BD600M.pdf (Accessed June 2016).
Presuel-Moreno, F., Liu, Y., Wu, Y. Y., & Arias, W. (2013). Analysis and Estimation of Service Life of Corrosion
Prevention Materials Using Diffusion, Resistivity and Accelerated Curing for New Bridge Structures-Volume 2:
Accelerated Curing of Concrete With High Volume Pozzolans (Resistivity, Diffusivity and Compressive Strength).

ATLSS Report 16-04 Migration Coefficient of PennDOT Certified Concrete Page 28
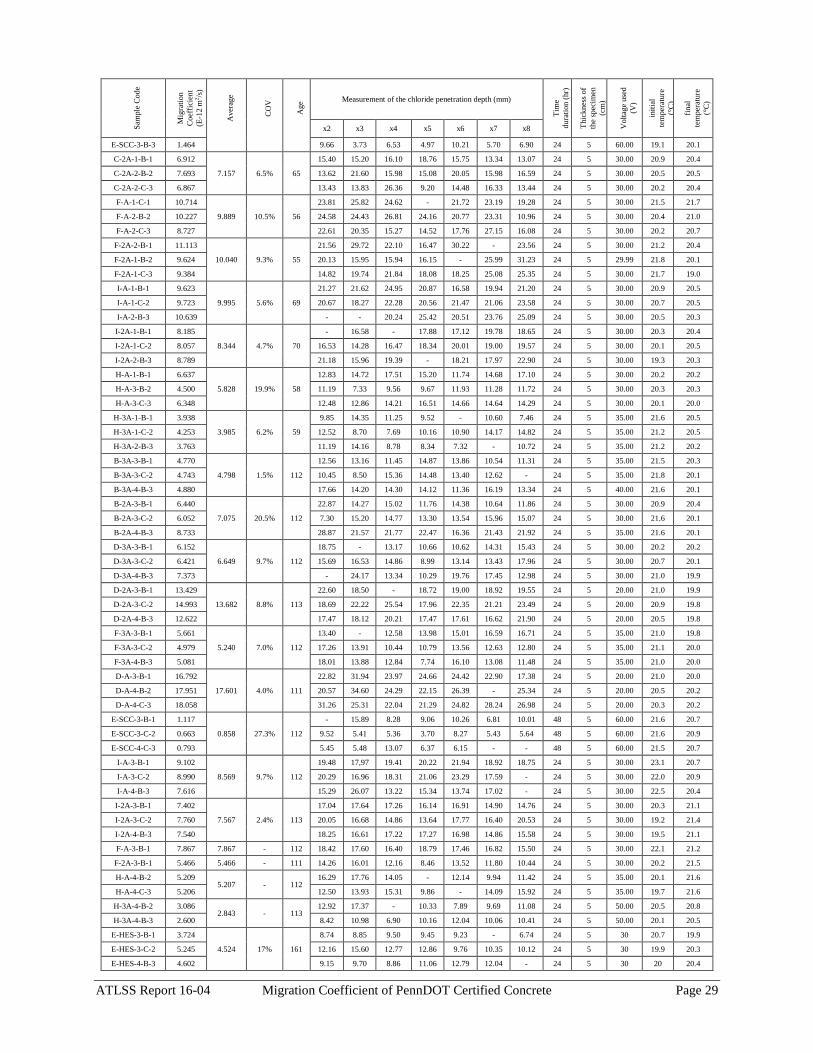
APPENDIX
The unprocessed data is provided in this appendix for completeness. The measured data as well as the samples after
the completion of testing are included. S
ample
Code
Mig
rati
on
Coef
fici
ent
(E-1
2 m
2/s
)
Aver
age
CO
V
Age Measurement of the chloride penetration depth (mm)
Tim
e
dura
tion (
hr)
Thic
knes
s of
the
spec
imen
(cm
)
Volt
age
use
d
(V)
init
ial
tem
per
ature
(°C
)
final
tem
per
ature
(°C
)
x2 x3 x4 x5 x6 x7 x8
Trial 6.716 - - - 15.90 12.80 16.00 13.40 17.70 12.90 15.40 24 5 30.00 24.7 21.2
A-2A-1-2 5.372 6.005 - 44
16.22 16.08 16.04 19.36 11.86 9.64 8.34 24 5 35.01 23.8 21.1
A-2A-1-3 6.638 13.14 16.33 17.25 12.68 13.07 15.65 14.80 24 5 30.00 25.1 21.2
F-A-1-1 10.695
9.960 11.3% 28
23.22 24.66 23.92 21.72 22.44 21.52 23.55 24 5 30.00 22.5 21.6
F-A-1-2 10.521 15.53 - 22.43 22.82 23.23 15.46 15.20 24 5 25.00 22.1 21.8
F-A-2-3 8.665 19.21 22.60 20.27 20.77 15.62 17.60 16.41 24 5 30.04 21.7 21.9
A-2A-2-1 6.565
7.043 9.3% 52
22.06 14.67 14.40 11.88 14.68 13.12 11.32 24 5 30.00 23.4 21.2
A-2A-3-2 7.793 16.07 16.02 15.90 17.18 18.38 17.37 18.82 24 5 30.00 23.2 21.2
A-2A-4-3 6.771 20.09 16.35 14.75 18.66 16.49 16.13 18.60 24 5 35.00 23.2 21.2
A-2A-5-2 3.575 53
7.34 8.86 8.86 9.38 12.35 11.57 8.86 24 5 35.00 21.2 21.8
A-2A-6-3 9.710
21.66 25.07 17.73 16.83 23.64 27.40 15.12 24 5 30.00 20.8 21.6
B-A-1-1 4.740
53 8.35 15.42 9.54 9.42 11.14 11.76 10.39 24 5 30.00 21.0 21.3
B-A-2-1 7.793
6.970 10.5% 54
15.28 15.14 18.21 21.49 12.16 19.25 18.48 24 5 30.00 21.7 21.1
B-A-3-2 6.719 15.25 12.80 13.35 16.15 13.53 16.50 17.03 24 5 30.01 22.0 21.0
B-A-4-3 6.397 12.75 12.37 13.94 13.38 18.30 14.82 14.33 24 5 30.01 22.7 20.9
G-3A-1-1 5.126
8.380 28.7% 54
12.31 7.58 5.88 18.45 15.64 9.98 12.01 24 5 30.00 20.0 20.5
G-3A-2-2 8.954 22.00 22.33 21.38 18.13 19.71 18.21 15.06 24 5 30.00 20.0 21.7
G-3A-3-3 10.905 18.95 20.53 26.74 25.89 27.79 25.33 19.60 24 5 30.00 20.0 20.7
G-3A-4-3 8.535 55 13.76 - 20.10 18.23 17.98 19.13 22.81 24 5 30.00 21.8 20.7
E-1-1 7.230 7.551 6.0% 53
16.38 13.72 15.00 17.63 16.25 16.43 16.55 24 5 30.00 21.8 20.9
E-2-2 7.872 16.37 15.88 18.68 17.70 17.57 16.85 18.03 24 5 30.00 22.0 21.2
F-2A-1-1 9.585
10.375 11.7% 27
25.28 17.58 - 18.36 23.13 20.62 19.98 24 5 30.00 21.0 20.9
F-2A-2-2 9.767 21.88 16.32 18.05 15.88 20.17 13.58 20.71 24 5 25.27 20.6 20.8
F-2A-1-3 11.772 21.40 23.57 25.13 - 26.00 29.48 25.22 24 5 29.83 20.9 20.8
H-A-2-B-1 6.292
7.288 13.0% 28
- 18.48 15.01 14.05 18.75 15.32 15.62 24 5 35.00 21.6 20.4
H-A-2-C-2 7.400 18.68 14.01 11.76 19.14 16.78 15.33 18.84 24 5 30.00 21.1 20.8
H-A-1-C-3 8.172 25.15 29.66 24.90 21.69 15.20 12.78 15.60 24 5 35.00 21.2 20.7
H-3A-2-B 4.153
4.849 13.0% 29
11.31 10.75 8.08 8.32 - 15.32 12.49 24 5 35.00 21.1 19.9
H-3A-1-C 5.012 - 11.76 16.67 15.56 10.54 12.37 11.96 24 5 35.00 20.8 19.8
H-3A-2-C 5.384 12.94 16.83 - 11.06 10.73 12.33 20.36 24 5 35.00 20.5 20.3
B-3A-1-C-1 5.174
4.939 5.5% 55
14.59 18.45 10.76 - 12.50 12.17 12.79 24 5 35.00 20.7 19.6
B-3A-2-B-2 5.002 13.38 12.72 12.09 13.04 13.69 13.80 - 24 5 35.00 20.7 19.9
B-3A-2-C-3 4.642 12.13 - - 11.53 11.16 14.77 11.63 24 5 35.00 20.7 19.9
B-2A-1-B-1 6.993
7.340 16.6% 55
14.00 - 23.41 10.58 14.58 15.88 14.72 24 5 30.00 21.8 20.0
B-2A-2-B-2 6.334 17.99 15.09 13.48 - 11.24 12.19 15.06 24 5 30.00 21.5 20.1
B-2A-2-C-3 8.692 16.83 14.20 15.13 29.82 15.71 - 22.38 24 5 30.00 21.5 20.2
D-3A-1-B-1 10.268
10.914 5.9% 55
29.64 17.97 17.89 22.28 23.17 20.95 23.61 24 5 30.00 21.5 20.3
D-3A-2-B-2 11.552 24.44 26.34 22.32 26.60 19.43 23.04 31.70 24 5 30.00 20.7 20.6
D-3A-2-C-3 10.923 20.67 20.92 23.57 24.62 22.46 25.12 27.61 24 5 30.00 20.3 20.9
C-2A-1-B-1 -
- - 57
- - - - - - - - - - - -
C-2A-1-C-2 - - - - - - - - - - - - -
C-2A-1-C-3 5.894 15.46 15.80 12.92 12.67 12.22 12.34 11.64 24 5 30.00 20.3 19.9
D-2A-1-C-1 16.596 14.984 13.1% 57
22.22 23.76 - 21.83 25.77 22.28 26.83 24 5 20.00 20.1 20.1
D-2A-2-C-2 15.566 21.70 17.53 25.59 - 25.86 22.95 20.86 24 5 20.00 20.1 20.1
C-2A-2-B-3 12.790 - - 58 28.21 21.02 18.11 12.69 10.62 17.56 22.59 24 5 20.00 21.1 20.1
F-3A-1-B-1 5.427
5.219 5.9% 56
10.46 10.23 - 11.98 10.44 12.83 17.86 24 5 30.00 21.0 20.6
F-3A-1-C-2 5.366 10.64 11.67 8.94 9.96 14.69 15.70 13.60 24 5 30.00 21.1 20.6
F-3A-2-B-3 4.862 13.94 14.00 10.53 13.17 10.50 12.80 14.23 24 5 35.00 22.0 20.9
D-A-1-B-1 17.497
20.019 13.5% 56
16.06 12.27 27.47 30.20 28.81 30.68 29.08 24 5 20.00 20.9 20.3
D-A-2-B-2 22.873 19.93 25.79 25.62 24.58 23.95 26.08 24.28 24 5 15.00 20.3 19.8
D-A-2-C-3 19.687 20.82 24.31 19.86 20.18 22.44 20.06 20.83 24 5 15.00 20.3 20.0
E-SCC-1-C-1 1.480 1.219 35.9% 57
7.21 4.52 5.77 6.58 - 6.42 10.75 24 5 60.00 20.1 19.9
E-SCC-2-C-2 0.714 4.06 3.14 - 2.48 5.15 3.23 3.29 24 5 60.00 19.1 19.6
ATLSS Report 16-04 Migration Coefficient of PennDOT Certified Concrete Page 29
Sam
ple
Code
Mig
rati
on
Coef
fici
ent
(E-1
2 m
2/s
)
Aver
age
CO
V
Age Measurement of the chloride penetration depth (mm)
Tim
e
dura
tion (
hr)
Thic
knes
s of
the
spec
imen
(cm
)
Volt
age
use
d
(V)
init
ial
tem
per
ature
(°C
)
final
tem
per
ature
(°C
)
x2 x3 x4 x5 x6 x7 x8
E-SCC-3-B-3 1.464 9.66 3.73 6.53 4.97 10.21 5.70 6.90 24 5 60.00 19.1 20.1
C-2A-1-B-1 6.912
7.157 6.5% 65
15.40 15.20 16.10 18.76 15.75 13.34 13.07 24 5 30.00 20.9 20.4
C-2A-2-B-2 7.693 13.62 21.60 15.98 15.08 20.05 15.98 16.59 24 5 30.00 20.5 20.5
C-2A-2-C-3 6.867 13.43 13.83 26.36 9.20 14.48 16.33 13.44 24 5 30.00 20.2 20.4
F-A-1-C-1 10.714
9.889 10.5% 56
23.81 25.82 24.62 - 21.72 23.19 19.28 24 5 30.00 21.5 21.7
F-A-2-B-2 10.227 24.58 24.43 26.81 24.16 20.77 23.31 10.96 24 5 30.00 20.4 21.0
F-A-2-C-3 8.727 22.61 20.35 15.27 14.52 17.76 27.15 16.08 24 5 30.00 20.2 20.7
F-2A-2-B-1 11.113
10.040 9.3% 55
21.56 29.72 22.10 16.47 30.22 - 23.56 24 5 30.00 21.2 20.4
F-2A-1-B-2 9.624 20.13 15.95 15.94 16.15 - 25.99 31.23 24 5 29.99 21.8 20.1
F-2A-1-C-3 9.384 14.82 19.74 21.84 18.08 18.25 25.08 25.35 24 5 30.00 21.7 19.0
I-A-1-B-1 9.623
9.995 5.6% 69
21.27 21.62 24.95 20.87 16.58 19.94 21.20 24 5 30.00 20.9 20.5
I-A-1-C-2 9.723 20.67 18.27 22.28 20.56 21.47 21.06 23.58 24 5 30.00 20.7 20.5
I-A-2-B-3 10.639 - - 20.24 25.42 20.51 23.76 25.09 24 5 30.00 20.5 20.3
I-2A-1-B-1 8.185
8.344 4.7% 70
- 16.58 - 17.88 17.12 19.78 18.65 24 5 30.00 20.3 20.4
I-2A-1-C-2 8.057 16.53 14.28 16.47 18.34 20.01 19.00 19.57 24 5 30.00 20.1 20.5
I-2A-2-B-3 8.789 21.18 15.96 19.39 - 18.21 17.97 22.90 24 5 30.00 19.3 20.3
H-A-1-B-1 6.637
5.828 19.9% 58
12.83 14.72 17.51 15.20 11.74 14.68 17.10 24 5 30.00 20.2 20.2
H-A-3-B-2 4.500 11.19 7.33 9.56 9.67 11.93 11.28 11.72 24 5 30.00 20.3 20.3
H-A-3-C-3 6.348 12.48 12.86 14.21 16.51 14.66 14.64 14.29 24 5 30.00 20.1 20.0
H-3A-1-B-1 3.938
3.985 6.2% 59
9.85 14.35 11.25 9.52 - 10.60 7.46 24 5 35.00 21.6 20.5
H-3A-1-C-2 4.253 12.52 8.70 7.69 10.16 10.90 14.17 14.82 24 5 35.00 21.2 20.5
H-3A-2-B-3 3.763 11.19 14.16 8.78 8.34 7.32 - 10.72 24 5 35.00 21.2 20.2
B-3A-3-B-1 4.770
4.798 1.5% 112
12.56 13.16 11.45 14.87 13.86 10.54 11.31 24 5 35.00 21.5 20.3
B-3A-3-C-2 4.743 10.45 8.50 15.36 14.48 13.40 12.62 - 24 5 35.00 21.8 20.1
B-3A-4-B-3 4.880 17.66 14.20 14.30 14.12 11.36 16.19 13.34 24 5 40.00 21.6 20.1
B-2A-3-B-1 6.440
7.075 20.5% 112
22.87 14.27 15.02 11.76 14.38 10.64 11.86 24 5 30.00 20.9 20.4
B-2A-3-C-2 6.052 7.30 15.20 14.77 13.30 13.54 15.96 15.07 24 5 30.00 21.6 20.1
B-2A-4-B-3 8.733 28.87 21.57 21.77 22.47 16.36 21.43 21.92 24 5 35.00 21.6 20.1
D-3A-3-B-1 6.152
6.649 9.7% 112
18.75 - 13.17 10.66 10.62 14.31 15.43 24 5 30.00 20.2 20.2
D-3A-3-C-2 6.421 15.69 16.53 14.86 8.99 13.14 13.43 17.96 24 5 30.00 20.7 20.1
D-3A-4-B-3 7.373 - 24.17 13.34 10.29 19.76 17.45 12.98 24 5 30.00 21.0 19.9
D-2A-3-B-1 13.429
13.682 8.8% 113
22.60 18.50 - 18.72 19.00 18.92 19.55 24 5 20.00 21.0 19.9
D-2A-3-C-2 14.993 18.69 22.22 25.54 17.96 22.35 21.21 23.49 24 5 20.00 20.9 19.8
D-2A-4-B-3 12.622 17.47 18.12 20.21 17.47 17.61 16.62 21.90 24 5 20.00 20.5 19.8
F-3A-3-B-1 5.661
5.240 7.0% 112
13.40 - 12.58 13.98 15.01 16.59 16.71 24 5 35.00 21.0 19.8
F-3A-3-C-2 4.979 17.26 13.91 10.44 10.79 13.56 12.63 12.80 24 5 35.00 21.1 20.0
F-3A-4-B-3 5.081 18.01 13.88 12.84 7.74 16.10 13.08 11.48 24 5 35.00 21.0 20.0
D-A-3-B-1 16.792
17.601 4.0% 111
22.82 31.94 23.97 24.66 24.42 22.90 17.38 24 5 20.00 21.0 20.0
D-A-4-B-2 17.951 20.57 34.60 24.29 22.15 26.39 - 25.34 24 5 20.00 20.5 20.2
D-A-4-C-3 18.058 31.26 25.31 22.04 21.29 24.82 28.24 26.98 24 5 20.00 20.3 20.2
E-SCC-3-B-1 1.117
0.858 27.3% 112
- 15.89 8.28 9.06 10.26 6.81 10.01 48 5 60.00 21.6 20.7
E-SCC-3-C-2 0.663 9.52 5.41 5.36 3.70 8.27 5.43 5.64 48 5 60.00 21.6 20.9
E-SCC-4-C-3 0.793 5.45 5.48 13.07 6.37 6.15 - - 48 5 60.00 21.5 20.7
I-A-3-B-1 9.102
8.569 9.7% 112
19.48 17,97 19.41 20.22 21.94 18.92 18.75 24 5 30.00 23.1 20.7
I-A-3-C-2 8.990 20.29 16.96 18.31 21.06 23.29 17.59 - 24 5 30.00 22.0 20.9
I-A-4-B-3 7.616 15.29 26.07 13.22 15.34 13.74 17.02 - 24 5 30.00 22.5 20.4
I-2A-3-B-1 7.402
7.567 2.4% 113
17.04 17.64 17.26 16.14 16.91 14.90 14.76 24 5 30.00 20.3 21.1
I-2A-3-C-2 7.760 20.05 16.68 14.86 13.64 17.77 16.40 20.53 24 5 30.00 19.2 21.4
I-2A-4-B-3 7.540 18.25 16.61 17.22 17.27 16.98 14.86 15.58 24 5 30.00 19.5 21.1
F-A-3-B-1 7.867 7.867 - 112 18.42 17.60 16.40 18.79 17.46 16.82 15.50 24 5 30.00 22.1 21.2
F-2A-3-B-1 5.466 5.466 - 111 14.26 16.01 12.16 8.46 13.52 11.80 10.44 24 5 30.00 20.2 21.5
H-A-4-B-2 5.209 5.207 - 112
16.29 17.76 14.05 - 12.14 9.94 11.42 24 5 35.00 20.1 21.6
H-A-4-C-3 5.206 12.50 13.93 15.31 9.86 - 14.09 15.92 24 5 35.00 19.7 21.6
H-3A-4-B-2 3.086 2.843 - 113
12.92 17.37 - 10.33 7.89 9.69 11.08 24 5 50.00 20.5 20.8
H-3A-4-B-3 2.600 8.42 10.98 6.90 10.16 12.04 10.06 10.41 24 5 50.00 20.1 20.5
E-HES-3-B-1 3.724
4.524 17% 161
8.74 8.85 9.50 9.45 9.23 - 6.74 24 5 30 20.7 19.9
E-HES-3-C-2 5.245 12.16 15.60 12.77 12.86 9.76 10.35 10.12 24 5 30 19.9 20.3
E-HES-4-B-3 4.602 9.15 9.70 8.86 11.06 12.79 12.04 - 24 5 30 20 20.4
ATLSS Report 16-04 Migration Coefficient of PennDOT Certified Concrete Page 30
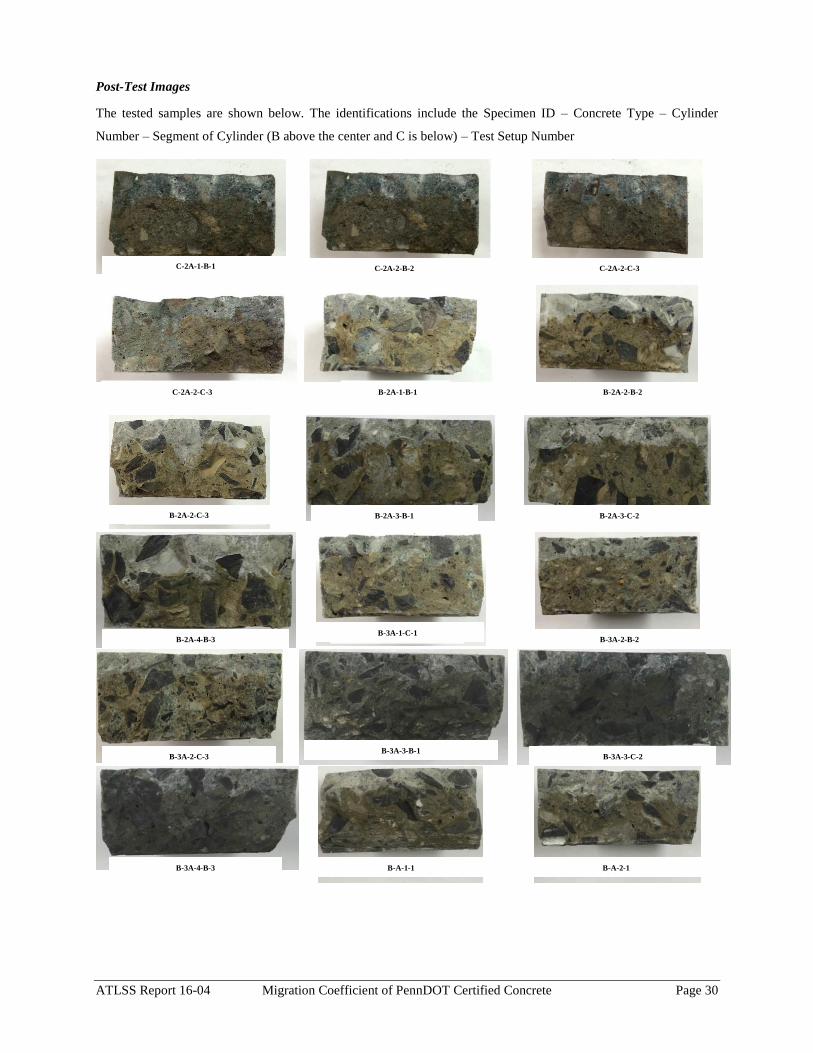
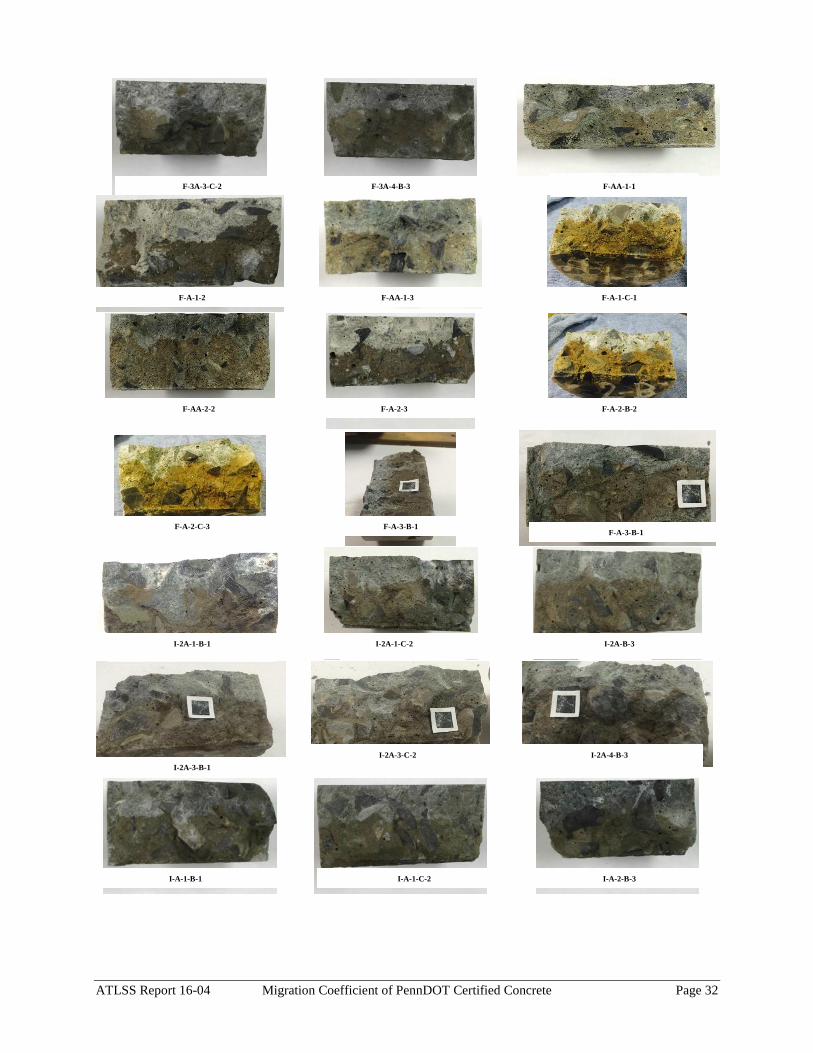
Post-Test Images
The tested samples are shown below. The identifications include the Specimen ID – Concrete Type – Cylinder
Number – Segment of Cylinder (B above the center and C is below) – Test Setup Number
C-2A-1-B-1
C-2A-2-B-2
C-2A-2-C-3
C-2A-2-C-3
B-2A-1-B-1
B-2A-2-B-2
B-2A-2-C-3
B-2A-3-B-1
B-2A-3-C-2
B-2A-4-B-3
B-3A-1-C-1
B-3A-2-B-2
B-3A-2-C-3
B-3A-3-B-1
B-3A-3-C-2
B-3A-4-B-3
B-A-1-1
B-A-2-1

ATLSS Report 16-04 Migration Coefficient of PennDOT Certified Concrete Page 31
B-A-3-2
B-A-4-3
A-2A-1-1
A-2A-1-2
A-2A-1-3
A-2A-2-1
A-2A-3-2
A-2A-4-3
A-2A-5-2
A-2A-6-3
A-3A-3-B-1
A-3A-3-C-2
A-3A-4-B-3
F-2A-1-B-2
F-2A-1-C-3
F-2A-2-B-1
F-3A-1-B-1
F-3A-1-C-2
F-3A-2-B-3
F-3A-3-B-1
G-3A-4-3
22
ATLSS Report 16-04 Migration Coefficient of PennDOT Certified Concrete Page 32
F-3A-3-C-2
F-3A-4-B-3
F-AA-1-1
F-A-1-2
F-AA-1-3
F-A-1-C-1
F-AA-2-2
F-A-2-3
F-A-2-B-2
F-A-2-C-3
F-A-3-B-1
F-A-3-B-1
I-2A-1-B-1
I-2A-1-C-2
I-2A-B-3
I-2A-3-B-1
I-2A-3-C-2
I-2A-4-B-3
I-A-1-B-1
I-A-1-C-2 I-A-2-B-3

ATLSS Report 16-04 Migration Coefficient of PennDOT Certified Concrete Page 33
I-A-3-B-1
-2
I-A-4-B-3
-2
D-A-3-B
-2
D-A-4-B
-2
D-A-4-C
-2
D-2A-1-C-1
-2
D-2A-2-B-3
-3
-2
D-2A-2-C-2
-3
-2
D-2A-2-C-2
-3
-2
D-2A-3-B-1
-3
D-2A-3-C-2 D-2A-4-B-3
-3
D-3A-1-B-1
-3
D-3A-2-B-2
-3
D-3A-2-C-3
-2
D-A-1-B-1
D-A-2-B-2
-3
D-A-2-C-3
-2
E-HES-1-1 E-HES-2-2 E-SCC-1-C-1

ATLSS Report 16-04 Migration Coefficient of PennDOT Certified Concrete Page 34
E-SCC-2-C-2
-3
-2
E-SCC-3-B-3
-3
-2
E-SCC-3-C-2
-3
-2
E-SCC-4-C-3
-3
-2
H-2A-3-B-2
-3
-2
H-3A-1-B-1
-3
-2
H-3A-1-C-2
22
-3
H-3A-3-B-2
2
H-3A-4-B-3
2
H-A-1-B-1
22
H-A-1-C-3
22
H-A-2-B-1
22
H-A-2-C-2
22
H-A-3-B-2
22
H-A-3-C-3
22
H-A-4-B-2 H-A-4-C-3
22
G-3A-1-1
22
G-3A-2-2 G-3A-3-3