pennsylvania dui association underage drinking psa ... · items about smoking, delinquent behavior...
TRANSCRIPT

Pennsylvania DUI Association Underage Drinking PSA Campaign Evaluation Report
Submitted to:
Pennsylvania Driving Under the Influence Association Submitted by:
Olszak Management Consulting, Inc. 425 Sixth Ave, Suite 350 Pittsburgh, PA 15219 www.olszak.com
September 2007

Table of Contents Page I. Background 1 II. Methodology 2 III. Focus Group Findings 8 IV. Survey Findings A. Parent Perspectives 14 B. Youth Perspectives 18 C. Comparisons – Youth and Parent Perspectives 24 D. Per-Post Comparisons 26 E. Protective and Risk Factors 35 V. Discussion
A. Access to Alcohol 38 B. Alcohol Use 40 C. Messages 42
D. Issues for Further Research 44 VI. Recommendations 45 VII. Appendices
Appendix A: Public Service Announcements 46 Appendix B: Media Presentation Rating Form 47 Appendix C: Pre-Survey Interim Report 50 Appendix D: Parent Survey (English) 59 Appendix E: Parent Survey (Spanish) 65 Appendix F: Youth Survey 72

Pennsylvania DUI Association Underage Drinking PSA Campaign Evaluation
Report & Recommendations, September 2007 Page 1 of 76
I. Background Purpose of the Study The Pennsylvania DUI Association was established in 1979 to encourage and facilitate the growth of alcohol safety programs. The Association offers a host of training and certification programs, as well as management and technical assistance for county alcohol safety programs. Recently, the Association received a grant from Pennsylvania Commission on Crime and Delinquency to raise awareness of underage drinking for parents and adults in Pennsylvania. PA DUI conducted a Public Service Announcement campaign for six communities, providing technical assistance that included an e-newsletter, a tragedy plan, an activity guide and the option to create local PSA campaigns. In July 2006, the Association engaged Olszak Management Consulting, Inc. to design and implement a research effort to evaluate the outcomes of the local PSA campaigns. This report describes the methodology used and the research findings. Recommendations for future outreach activities are also included. Olszak Management Consulting, Inc. would like to acknowledge the following individuals for their considerable assistance with this effort:
• Maryann Bowman, Somerset County Drug Free Communities • Gary Buchsen, Principal, Windber Area Middle School • Felicity DeBacco-Erni, Director, Pennsylvania Against Underage Drinking/PA SADD • Nora L. Drexler, President, Coalition Pathways, Inc. • Robert Dulac, Court of Common Pleas Allegheny County, PA Criminal Division • Chris France, Court of Common Pleas Allegheny County, PA Criminal Division • Steven Gobble, Principal, Towanda Junior/Senior High School • Cheryl Guither, Berks County Community Partnership • Kristy Kaliszewski, Special Projects Coordinator, Coalition Pathways, Inc. • Sylvia Maus, Consultant, PA DUI Association • Thomas M. McCaffrey, Senior Supervisor ARD/DUI/ISC/AHSP Interlock Units Adult Probation
Services, Court of Common Pleas Allegheny County, PA Criminal Division • Jim Modrak, Bethel Park Police Department • Chris Smith, Lycoming Comprehensive Highway Safety Program • Yvonne L. Stroman, Director of Community Partnership Programs, Community Prevention
Partnership of Berks County • Scott Szinsmeister, Bethel Park Police Department • Catherine L. Tress, Western PA Law Enforcement Director, PA DUI Association/Team DUI,
Law Enforcement Services Division

Pennsylvania DUI Association Underage Drinking PSA Campaign Evaluation
Report & Recommendations, September 2007 Page 2 of 76
II. Methodology The evaluation of the PA DUI Association PSA campaign involved gathering and analyzing data using a two-pronged research design:
1. Focus groups to obtain feedback from parents and students concerning the proposed campaign media and messages
2. A pre-post survey effort to obtain measurements on attitudes, behavior and environmental factors before and after the campaign.
This section describes how Olszak conducted each phase of the data collection process. Focus Groups In early fall of 2006, Olszak conducted six focus groups for students and their parents. Three of the focus groups were held in Somerset County, and three in the Pittsburgh area. The purpose of these focus groups was to test the PSA campaign messages and the effectiveness of three types of public service announcements: a print advertisement, a radio spot, and a television ad (additional information about the PSAs can be found in Appendix A: Public Service Announcements). Focus group participants were recruited with the assistance of regional contacts in these areas. In Somerset County, Mary Ann Bowman from Somerset County Drug Free Communities helped recruit the participants for the focus groups that were held in Somerset, Windber, and Berlin. Cathy Tress at the PA DUI Association/Team DUI, Bob Dulac and Tom McCaffrey at Adult Probation Services of the Allegheny County Court of Common Pleas, and Jim Modrak and Scott Szinsmeister from the Bethel Park Police Department provided assistance in finding the participants for the focus groups in Bethel Park, North Hills, and Moon Township. To facilitate these recruitment efforts, Olszak prepared a one-page flyer with brief information about the focus groups that was then distributed among these regional contacts, as well as SADD contacts and schools in Allegheny County. The six focus groups took place on the following dates at these locations:
• September 25: Boys and Girls Club, Somerset, Somerset County • September 26: Windber Middle and High School, Windber, Somerset County • September 27: Community Center, Bethel Park, Allegheny County • September 28: LaRoche College, North Hills, Allegheny County • September 30: Public Library, Moon Township, Allegheny County • October 2: Middle and High School, Berlin, Somerset County
There were a total of 71 participants in attendance at the focus group meetings. Table 1 on the next page shows the composition of focus groups in terms of the participants’ geography and types (student or adult).

Pennsylvania DUI Association Underage Drinking PSA Campaign Evaluation
Report & Recommendations, September 2007 Page 3 of 76
Table 1: Composition of focus groups by location and participant type
Participant Type Location Adult Student Grand Total
Allegheny County - Bethel Park 8 7 15 Allegheny County - Moon 4 6 10
Allegheny County - North Hills 2 6 8 Somerset County - Berlin 3 5 8
Somerset County - Somerset 8 8 16 Somerset County - Windber 8 6 14
Grand Total 33 38 71 Thirty-eight students attended the focus groups. Composition of student attendees with regard to their grade is shown in Table 2. Although recruitment efforts were primarily targeted at the students in 6th, 8th, and 10th grades, four students of other ages (one in 7th, one in 9th, and two in 11th grade) also attended. For the purposes of this report, their responses were combined as follows: 7th grade with 6th, 9th grade with 8th, and 11th grade with 10th.
Table 2: Composition of focus groups by student grade Grade Total
6 10 8 16 Participant Type: Student
10 12 Student Total 38
Focus group participants, including students and parents, first assembled in one room where Olszak representatives presented them with three types of media materials: a print ad, a radio spot, and a video presentation. Then the parents and students were separated into two groups to discuss these materials. Each group was moderated by a representative from Olszak. First, a moderator asked the participants to complete the Media Presentation Rating Form (see Appendix B: Media Presentation Rating Form) and then solicited and recorded their opinions about each of the media materials. Each focus group lasted from forty minutes to an hour. The results from these sessions were summarized and reported to the DUI Association in October of 2006 and are presented in Section III of this report. Survey 1. Survey Participant Recruitment Olszak attempted to recruit parent and student participants for the survey in six regions throughout Pennsylvania. The resulting response for the pre-survey came primarily from four regions: Erie County, Lycoming area, Reading area and Somerset County. The following individuals provided invaluable assistance in Olszak’s recruiting efforts:

Pennsylvania DUI Association Underage Drinking PSA Campaign Evaluation
Report & Recommendations, September 2007 Page 4 of 76
• Felicity DeBacco-Erni, Director, Pennsylvanians Against Underage Drinking/SADD – All Areas • Nora Drexler, President and Kristy Kaliszewski, Special Projects Coordinator at Coalition
Pathways, Inc. – Erie County • Chris Smith, Comprehensive Highway Safety Program – Lycoming Area • Steve Gobble, Principal, Towanda Junior-Senior High School – Lycoming Area • Cheryl Guither, Berks County Community Partnership – Reading Area • Yvonne Stroman, Director of Community Partnership Programs, Community Prevention
Partnership of Berks County – Reading Area • Mary Ann Bowman, Somerset County Drug Free Communities – Somerset County • Gary Buchsen, Principal, Windber Area Middle School – Somerset County
2. Questionnaire Design The content and format of the survey instrument were influenced, to varying degrees, by questionnaires already in use around the country and the state of Pennsylvania. Among these are:
• The Communities That Care© (CTC) survey, which has been used periodically in many communities across the state since 1998.
• The National Youth Anti-Drug Campaign, sponsored by the Office of National Drug Control Policy.
Unlike the instruments used in these other survey efforts, the DUI Association questionnaire did not include items about smoking, delinquent behavior and drug abuse, but focused on the topic of alcohol use. Like the Communities That Care survey, this questionnaire incorporated clusters of items, most in a five-point Likert format1, to produce scales that measure certain risk and protective factors as well as outcomes (see table below). Risk and protective factors are environmental influences that may contribute to more undesirable outcomes (risk factors) or fewer undesirable outcomes (protective factors). Outcomes include measurable attitudes and behavior related to alcohol. The factors and outcomes were measured by no less than three survey items and no more than eight items each.
Item Clusters in the Pre Survey Youth Survey
Parent Survey
Risk and Protective Factors: • Family X X • School X X • Community X X • Social Participation X • Parenting X Outcomes: • Access to Alcohol X X
1 The Likert scale technique uses a range of response choices that fall between two extremes. For example: Strongly Agree, Agree, Not Sure, Disagree, Strongly Disagree.

Pennsylvania DUI Association Underage Drinking PSA Campaign Evaluation
Report & Recommendations, September 2007 Page 5 of 76
Item Clusters in the Pre Survey Youth Survey
Parent Survey
• Moral Attitudes about Alcohol X • Risk-Awareness X • Alcohol-related Behavior X • Messages about Dangers of Alcohol X X
The surveys were tested on a small group of students within the desired age range, as well as parents. As a result of the pre-test, the instrument was reduced in length by approximately 25% and formatting adjustments were made to simplify the survey. The final versions of the surveys appear in Appendices D-F. 3. Pre-Survey Administration and Response To make it as easy as possible for participants to complete the survey, Olszak developed three versions: two paper surveys, including both English and Spanish-language versions, and an online version (in English only) (see Appendices D-F to view the surveys). In total, 1,033 youth surveys and 258 parent surveys were completed. Of these, 20 youth surveys and 45 parent surveys were completed on-line; 45 of the parent surveys were submitted in the Spanish-language paper version.
Grade Level* Youth Surveys Parent Surveys 6th 293 121 8th 308 65
10th 432 72 Total 1,033 258
* Note: Although students in 6th, 8th, and 10th grade were targeted, a few surveys were submitted by students who identified themselves as being in other grade levels. For purposes of data analysis, the grade levels were recoded as follows: 6th and 7th = 6th; 8th and 9th = 8th; 10th, 11th and 12th = 10th. Parents were assigned to the grade level of the oldest qualifying child.
The majority of responses originated from three targeted areas: Somerset, Lycoming and Reading. Another substantial contribution came from the Erie area. These targeted locations, although named for their central city or county, drew respondents from much wider geographies that corresponded to Intermediate Unit (IU) service areas (see map on following page). For example, the Lycoming area included submissions from Bradford, Lycoming, Sullivan, and Tioga counties (covered by BLaST IU 17). Surveys were also distributed to other locations that fell outside the targeted areas, in both the western and eastern parts of Pennsylvania. Thus, the totals shown above include 87 student surveys and 15 parent surveys that were not from targeted areas. The completed surveys reflected both grade level distinctions as well as geographic distinctions. This was due to the schools that participated in the surveys. For example, the Reading area effort concentrated on students in the 6th grade; Somerset focused on 8th grade students; and Lycoming’s participants were primarily from high school (10th grade) students. Data from all surveys, regardless of administration method, were entered into a common database and analyzed together.

Pennsylvania DUI Association Underage Drinking PSA Campaign Evaluation
Report and Recommendations, September 2007 Page 6 of 76
Major Survey Site Intermediate Unit Component Counties Lycoming Area Blast IU 17 Bradford, Lycoming, Sullivan, Tioga – Clinton (part) Reading Area Berks County IU 14 Berks – Montgomery and Chester (part) Somerset Area Appalachia IU 08 Somerset, Cambria, Blair, Bedford
Pennsylvania DUI Association Underage Drinking PSA Campaign Evaluation
Report and Recommendations, September 2007 Page 7 of 76
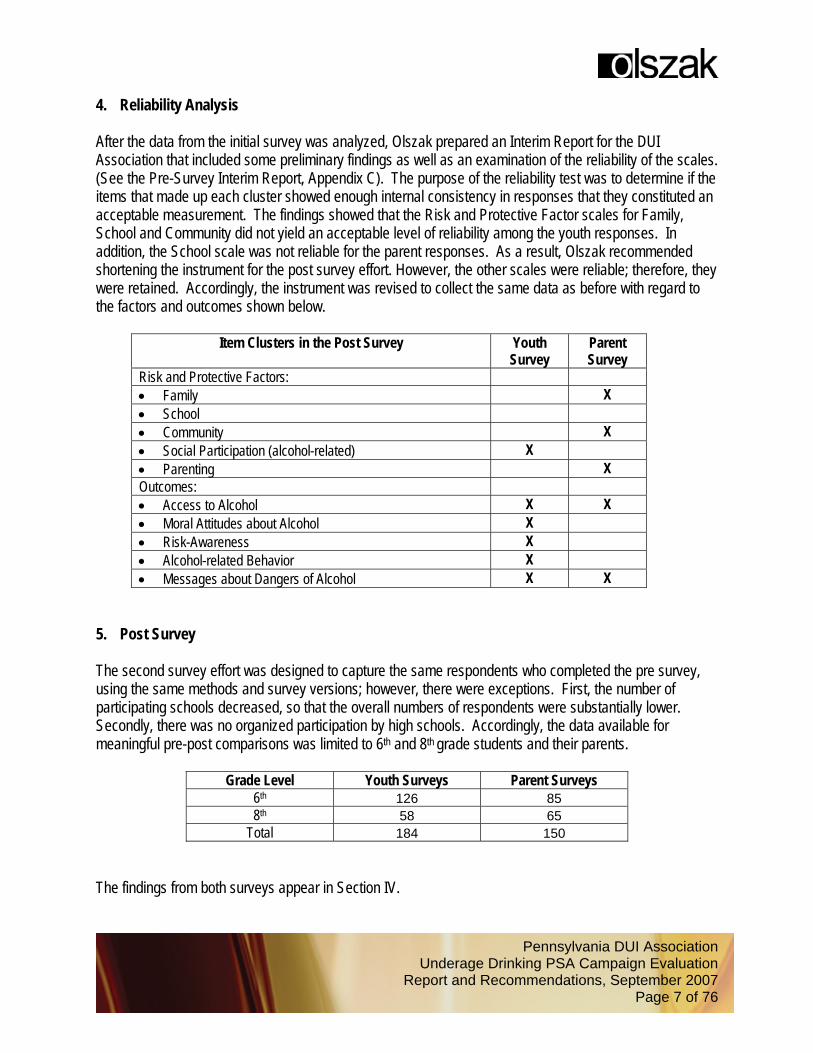
4. Reliability Analysis After the data from the initial survey was analyzed, Olszak prepared an Interim Report for the DUI Association that included some preliminary findings as well as an examination of the reliability of the scales. (See the Pre-Survey Interim Report, Appendix C). The purpose of the reliability test was to determine if the items that made up each cluster showed enough internal consistency in responses that they constituted an acceptable measurement. The findings showed that the Risk and Protective Factor scales for Family, School and Community did not yield an acceptable level of reliability among the youth responses. In addition, the School scale was not reliable for the parent responses. As a result, Olszak recommended shortening the instrument for the post survey effort. However, the other scales were reliable; therefore, they were retained. Accordingly, the instrument was revised to collect the same data as before with regard to the factors and outcomes shown below.
Item Clusters in the Post Survey Youth Survey
Parent Survey
Risk and Protective Factors: • Family X • School • Community X • Social Participation (alcohol-related) X • Parenting X Outcomes: • Access to Alcohol X X • Moral Attitudes about Alcohol X • Risk-Awareness X • Alcohol-related Behavior X • Messages about Dangers of Alcohol X X
5. Post Survey The second survey effort was designed to capture the same respondents who completed the pre survey, using the same methods and survey versions; however, there were exceptions. First, the number of participating schools decreased, so that the overall numbers of respondents were substantially lower. Secondly, there was no organized participation by high schools. Accordingly, the data available for meaningful pre-post comparisons was limited to 6th and 8th grade students and their parents.
Grade Level Youth Surveys Parent Surveys 6th 126 85 8th 58 65
Total 184 150 The findings from both surveys appear in Section IV.
Pennsylvania DUI Association Underage Drinking PSA Campaign Evaluation
Report and Recommendations, September 2007 Page 8 of 76
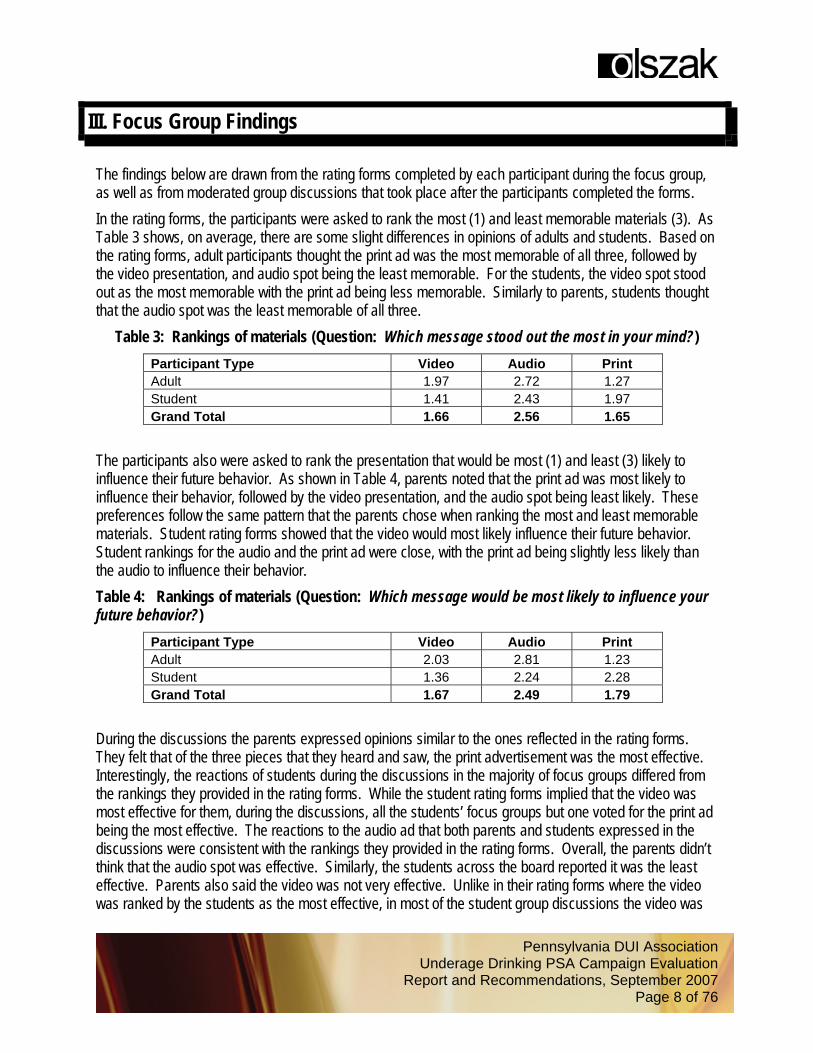
III. Focus Group Findings The findings below are drawn from the rating forms completed by each participant during the focus group, as well as from moderated group discussions that took place after the participants completed the forms. In the rating forms, the participants were asked to rank the most (1) and least memorable materials (3). As Table 3 shows, on average, there are some slight differences in opinions of adults and students. Based on the rating forms, adult participants thought the print ad was the most memorable of all three, followed by the video presentation, and audio spot being the least memorable. For the students, the video spot stood out as the most memorable with the print ad being less memorable. Similarly to parents, students thought that the audio spot was the least memorable of all three.
Table 3: Rankings of materials (Question: Which message stood out the most in your mind?) Participant Type Video Audio Print Adult 1.97 2.72 1.27 Student 1.41 2.43 1.97 Grand Total 1.66 2.56 1.65
The participants also were asked to rank the presentation that would be most (1) and least (3) likely to influence their future behavior. As shown in Table 4, parents noted that the print ad was most likely to influence their behavior, followed by the video presentation, and the audio spot being least likely. These preferences follow the same pattern that the parents chose when ranking the most and least memorable materials. Student rating forms showed that the video would most likely influence their future behavior. Student rankings for the audio and the print ad were close, with the print ad being slightly less likely than the audio to influence their behavior. Table 4: Rankings of materials (Question: Which message would be most likely to influence your future behavior?)
Participant Type Video Audio Print Adult 2.03 2.81 1.23 Student 1.36 2.24 2.28 Grand Total 1.67 2.49 1.79
During the discussions the parents expressed opinions similar to the ones reflected in the rating forms. They felt that of the three pieces that they heard and saw, the print advertisement was the most effective. Interestingly, the reactions of students during the discussions in the majority of focus groups differed from the rankings they provided in the rating forms. While the student rating forms implied that the video was most effective for them, during the discussions, all the students’ focus groups but one voted for the print ad being the most effective. The reactions to the audio ad that both parents and students expressed in the discussions were consistent with the rankings they provided in the rating forms. Overall, the parents didn’t think that the audio spot was effective. Similarly, the students across the board reported it was the least effective. Parents also said the video was not very effective. Unlike in their rating forms where the video was ranked by the students as the most effective, in most of the student group discussions the video was

Pennsylvania DUI Association Underage Drinking PSA Campaign Evaluation
Report and Recommendations, September 2007 Page 9 of 76
seen as the second-best option after the print ad. Students felt the video was clearer than the radio ad, and one group voted it the most effective piece. The results of the rating forms and reactions to each of the three materials that were solicited during the discussions are presented below. Print Advertisement Message Ratings
Clarity Adult Student Total Very clear 85% 84% 85% Somewhat clear 15% 16% 15% Not clear at all - - - 100% 100% 100% Importance Adult Student Total Very important 88% 97% 93% Somewhat important 12% - 6% Not important at all - - - 100% 100% 100% Made sense Adult Student Total Yes 79% 85% 82% No 9% 5% 7% Not sure 12% 10% 11% 100% 100% 100% Useful information Adult Student Total A lot 36% 67% 53% Some 64% 26% 43% None 0% 8% 4% 100% 100% 100% New information Adult Student Total Yes 9% 18% 14% No 88% 67% 76% Not sure 3% 13% 8% 100% 100% 100%
Discussion Comments
• Parents characterized the print ad as “eye opening,” “striking,” “like a slap.” • Many parents thought it was very relevant, “it hit home,” because indeed in many families alcohol is
easily accessible to children. • Parents and kids said the ad was simple, self-explanatory, and easy to comprehend. • Parents liked that the message was clear and provided specific instructions/advice to parents what
to do to prevent kids from having an easy access of alcohol at home: “Keep track of your supply.”

Pennsylvania DUI Association Underage Drinking PSA Campaign Evaluation
Report and Recommendations, September 2007 Page 10 of 76
• Parents felt the ad contained useful information (a number to report underage drinking). • Older students identified the ad as targeting parents; younger children weren’t certain. • Both parents and students provided several suggestions on how to make this print ad even more
effective. Among the suggestions were adding more color; showing an open refrigerator; including in the ad a picture of a kid opening a refrigerator’s door; and putting something on a refrigerator (pictures, magnets, kids’ papers, etc.) to make it look more real, like a fridge in anybody’s home.
Audio Spot Message Ratings
Clarity Adult Student Total Very clear 55% 49% 51% Somewhat clear 45% 46% 46% Not clear at all - 5% 3% 100% 100% 100% Importance Very important 85% 87% 86% Somewhat important 15% 13% 14% Not important at all - - - 100% 100% 100% Made sense Yes 79% 77% 78% No 9% 3% 6% Not sure 12% 21% 17% 100% 100% 100% Useful information A lot 36% 41% 39% Some 64% 51% 57% None - 8% 4% 100% 100% 100% New information Yes 6% 23% 15% No 91% 62% 75% Not sure 3% 15% 10% 100% 100% 100%
Discussion Comments
• To many participants, the background noise in the audio spot was “confusing,” “distracting,” “too busy.” They noted that they could not understand what it was, and some said it sounded like Halloween, an amusement park ride, or coyotes.
• Parents said the ad didn’t have much to catch one’s attention, it was “easy to tune out.” However, the kids reported it was attention-getting and “different from other radio ads.”

Pennsylvania DUI Association Underage Drinking PSA Campaign Evaluation
Report and Recommendations, September 2007 Page 11 of 76
• Both kids and parents pointed out that it didn’t show any consequences of drinking for either parents or kids.
• It also didn’t provide any specific advice for parents what to do to prevent underage drinking. Similarly, many students felt like it didn’t have a message for them about what to do.
• Parents noted that the audio spot contained a statement that was not very true (that kids could get alcohol in a store).
• Like in the case with the print ad, the participants suggested a number of ideas to make the audio spot more effective:
o Include the names of the sponsoring organizations at the beginning of the ad, so people will know what it is about
o Include real stories, like victims’ testimonies, to make it more personal o Include sounds of sirens, car accident, somebody crying o Include sounds of beer being opened and poured, kids’ voices o Include messages on affects of alcohol (for example, how it affects driving skills, possibility
of loosing a driving license). Video Presentation Message Ratings
Clarity Adult Student Total Very clear 52% 74% 64% Somewhat clear 48% 23% 35% Not clear at all - 3% 1% 100% 100% 100% Importance Very important 91% 90% 90% Somewhat important 9% 10% 10% Not important at all - - - 100% 100% 100% Made sense Yes 79% 85% 82% No 9% 5% 7% Not sure 12% 10% 11% 100% 100% 100% Useful information A lot 36% 67% 53% Some 64% 26% 43% None - 8% 4% 100% 100% 100% New information Yes 9% 28% 19% No 88% 46% 65% Not sure 3% 26% 15% 100% 100% 100%

Pennsylvania DUI Association Underage Drinking PSA Campaign Evaluation
Report and Recommendations, September 2007 Page 12 of 76
Discussion Comments
• Both parents and kids noted that the video presentation might send the wrong message. They explained that in the video it looked like the kids were having fun, it almost glamorized drinking.
• The setting shown in the video was not very relevant to the parents, although for the children this was not a concern. Parents said that the video showed “bad inner city kids,” while the communities in which the participants live are suburban or rural. In this regard, several parent groups explained that the more typical setting in which some of the kids in their communities could drink is not the streets but somebody’s garage, home, back porch, or the woods.
• Some parents said the mother in the video looked older. In the student groups, several children mentioned that the mother seemed “relatable”.
• Some adult participants mentioned that they do not have a lot of Hispanic population, and since in the video the kid looked Hispanic, it was not very relevant to their communities. The kids’ groups did not share this concern.
• Many parents and some students agreed that the video was not effective because it didn’t show any consequences of drinking.
• To parents, the video didn’t have any specific advice on what to do. They felt that the statement “Do what you can!” was too generic.
• Students interpreted the message as “parents should talk to their kids,” or “pay attention.” • To make the video more effective, parents and children made the following suggestions similar to
their assessment of the radio spot: o Add something that would be shocking for both parents and kids (for example, bad car
accident as a result of drunk driving) o Give specific advice for parents (for example, “Check on your kids”) rather than general
“Do what you can!” statement o Include consequences for both parents and children o Include real-life experiences.
In several groups, when commenting on all three types of the materials, a few parents suggested creating all three ads (print, radio, and video) around one theme. They thought that the theme of keeping alcohol at home that was presented in the print ad was effective and could also be used in audio and video presentations. This would make all three messages more memorable and consistent with each other.

Pennsylvania DUI Association Underage Drinking PSA Campaign Evaluation
Report and Recommendations, September 2007 Page 13 of 76
IV. Survey Findings A. PARENT PERSPECTIVES 1. Access to Alcohol A central theme of the PA DUI’s campaign is that parents should take steps to prevent their children from gaining access to alcoholic beverages. In response to a series of questions posing hypothetical situations in which children might obtain or use alcohol, most parents felt it would be “difficult”, or “very difficult”, for their children to engage in these activities. Chief among the methods cited as “easy” or “very easy” for children was the tactic of getting a stranger to buy alcohol for them; this scenario was put forth by 31% of the parents of 10th graders, 23% of the parents of 8th graders, and even 7% of the parents of 6th graders. In general, parents felt that ease of access to alcohol increased with the age of the child.
How easy or difficult would it be for a child of yours to do any of the following?
7%
2%
1%
2%
0%
1%
23%
14%
8%
2%
5%
0%
31%
20%
15%
13%
8%
1%
0% 5% 10% 15% 20% 25% 30% 35%
Get an older person that they don’t know tobuy alcoholic beverages for them?
Drink alcohol with a group of his/her friends?
Go to a party or dance club without yourknowledge?
Get an older person that they know to buyalcoholic beverages for them?
Steal alcoholic beverages from some placeother than your home?
Have a party at home without yourpermission?
Percent who responded "easy" or "very easy"
6th Grade 8th Grade 10th Grade
Figure 1. Parent Perspectives on Ease of Access to Alcohol, by Child’s Grade Level

Pennsylvania DUI Association Underage Drinking PSA Campaign Evaluation
Report and Recommendations, September 2007 Page 14 of 76
In section C. Comparisons – Youth and Parent Perspectives, part 1 - Access to Alcohol, these findings are compared with the responses of the youth to a similar set of questions. 2. Parenting Patterns Although most parents reported that they practice several protective parenting strategies, those approaches tend to occur less frequently with older children. Among the findings shown in Figure 2 below, the following stand out:
• While 57%-68% of parents report that they let their children know they can speak honestly with them, only 31%-50% say that when their children are in trouble, they talk with their parents about it.
• Most (63%-64%) parents of 6th or 8th graders are certain that their children have not had any alcohol when the parents were not at home, only 47% of the parents of 10th graders are sure.
• Half or less (38%-50%) of the parents say they are doing everything they can to keep alcohol away from their children.
How much does each of the following statements describe you?
74%
68%
64%
65%
55%
55%
50%
51%
36%
63%
57%
63%
57%
55%
42%
42%
45%
32%
61%
63%
47%
36%
46%
44%
38%
31%
42%
0% 10% 20% 30% 40% 50% 60% 70% 80%
I tell my children how pleased I am w henthey do something right
I let my children know that they can speakhonestly w ith me
I am certain that none of my children havehad any alcohol w hen I w as not at home
I know w here my children are and w hatthey are doing w hen they are not at home
I talk w ith my children about how w rong itis to drink alcohol
I am clear about the rules in my family
I am doing everything I can to keep alcoholaw ay from my children
When my children are in trouble, theycome and talk to me about it
Religion is a very important part of myfamily’s life
Percent who responded "Exactly"
6th Grade 8th Grade 10th Grade
Figure 2

Pennsylvania DUI Association Underage Drinking PSA Campaign Evaluation
Report and Recommendations, September 2007 Page 15 of 76
Risky parenting practices were reported with less frequency than protective ones. The most-often cited risk factor, reported by 6% of 10th grade parents and 11% of 6th and 8th grade parents, was the lack of time available to spend with children due to busy schedules. A curious practice, reported by 6% of the parents of 6th graders, was toleration of teenage children having a drink when a parent is present.
How much does each of the following statements describe you?
11%
7%
2%
6%
3%
11%
6%
9%
2%
2%
6%
3%
7%
1%
0%
0% 5% 10% 15% 20%
My busy schedule keeps me from spendingenough time w ith my children
When my child gets into trouble, I say that Iam the one to blame
I get into arguments w ith family members
I think it’s okay to let teenage children havean alcoholic drink at home w hen I am there
I let my children have parties at home w hen Iam not there
% responding "A lot" or "Exactly"
6th Grade 8th Grade 10th Grade
Figure 3

Pennsylvania DUI Association Underage Drinking PSA Campaign Evaluation
Report and Recommendations, September 2007 Page 16 of 76
3. Messages about Alcohol Even before the DUI campaign, parents were being exposed to messages about the risks of alcohol use. As Figure 4 shows, about three-quarters of the respondents had recently seen a message on television, or remembered an incident in the news, that evoked the dangers of alcohol. Slightly more than half of the parents (51%) reported that one of their children had asked them a question about alcohol within the past few months. More than one-third (36%) knew someone who was recently injured by a drunk driver.
In the past few months, have you seen or heard anything about the dangers of alcohol in any of the following ways?
35%
36%
45%
51%
58%
74%
75%
0% 10% 20% 30% 40% 50% 60% 70% 80%
Child of someone I know got into trouble
Someone I know w as injured by a drunk driver
Heard a message on the radio about alcohol
Children asked a question about alcohol
Someone I know misbehaved because of alcohol
Something happened in the new s
Saw a message on TV about alcohol
Percent of parents who responded "Yes"
Figure 4
These same items were included in the post survey, allowing for a comparison of changes in exposure to messages over time. In addition, some of these items were also included in the survey of youth, permitting an examination of generational perspectives. These issues are explored in section B. Youth Perspectives, part 4. Messages About Alcohol and section C. Comparisons – Youth and Parent Perspectives, part 2. Messages about Alcohol.

Pennsylvania DUI Association Underage Drinking PSA Campaign Evaluation
Report and Recommendations, September 2007 Page 17 of 76
B. YOUTH PERSPECTIVES This section presents the results of the youth survey, which drew 1,033 respondents from grades 6 through 102. All of the youths were asked the same set of questions, with the same response choices, allowing for comparisons of results by grade level. This analysis focuses on outcome topics: access, attitudes, behavior and messages. 1. Access to Alcohol As shown in the chart below, the perception that alcohol is easily obtained from home without parents knowing about it generally increases with age. Among 10th graders, 32% said that access to alcohol is “very easy” or “easy”, compared to 22% of the 8th graders and 7% of the 6th graders. A factor that may have influenced alcohol access for those in 6th grade is that 45% report that there is no alcohol at home.
If you wanted to, how easy or difficult would it be for you to get alcoholic beverages from home without your
parents knowing it?
4%
3%
12%
4%
24%
45%
8%
7%
15%
22%
7%
19%
25%
5%
13%
19%
20%
14%
16%
17%
2%
0% 10% 20% 30% 40% 50%
Very easy
Easy
Not sure
Difficult
Very difficult
No alcohol at home
No answer
Responded "Easy" or "Very easy"
6th Grade 8th Grade 10th Grade
Figure 5 2 See the Methodology section for a discussion of grade level classifications.
Pennsylvania DUI Association Underage Drinking PSA Campaign Evaluation
Report and Recommendations, September 2007 Page 18 of 76
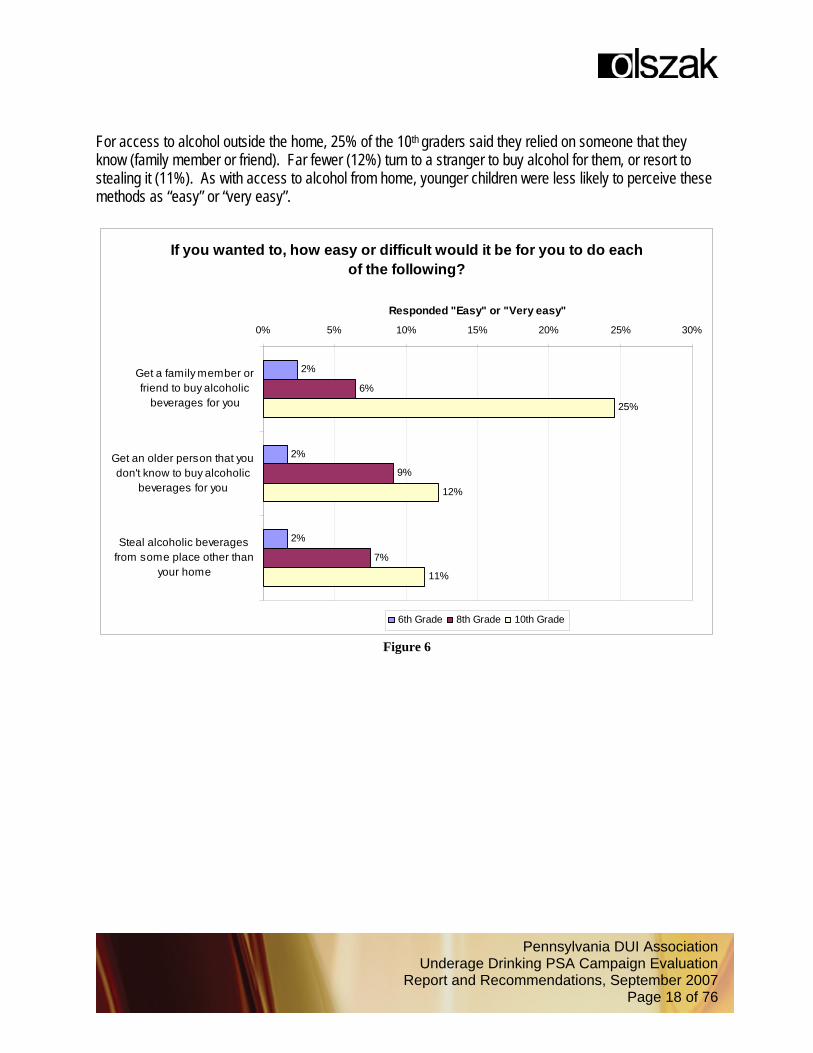
For access to alcohol outside the home, 25% of the 10th graders said they relied on someone that they know (family member or friend). Far fewer (12%) turn to a stranger to buy alcohol for them, or resort to stealing it (11%). As with access to alcohol from home, younger children were less likely to perceive these methods as “easy” or “very easy”.
If you wanted to, how easy or difficult would it be for you to do each of the following?
2%
2%
2%
6%
9%
7%
25%
12%
11%
0% 5% 10% 15% 20% 25% 30%
Get a family member orfriend to buy alcoholic
beverages for you
Get an older person that youdon't know to buy alcoholic
beverages for you
Steal alcoholic beveragesfrom some place other than
your home
Responded "Easy" or "Very easy"
6th Grade 8th Grade 10th Grade
Figure 6

Pennsylvania DUI Association Underage Drinking PSA Campaign Evaluation
Report and Recommendations, September 2007 Page 19 of 76
2. Attitudes about Alcohol On the youth survey, respondents were given a list of five actions involving the use of alcohol and asked first whether they thought the behavior would be wrong, and secondly, whether the behavior would be harmful. A comparison of results by grade level shows some similarities and differences in the responses. For both grades, driving after having a drink was seen as wrong or harmful by about three-quarters of the respondents (72%-79%). The 10th graders felt it was about equally wrong, and harmful, to ride in a vehicle driven by someone who has had a drink (73%-74%), but the 8th graders were less definite about that behavior (61%-69%). For the remaining three actions, most (58%-68%) of the 8th graders felt these would be wrong or harmful to do; however, the 10th graders were less inclined to feel that way (43%-53%).
8th Grade
Would This Be Wrong/Harmful for You to Do?
74%
69%
67%
64%
58%
72%
61%
68%
65%
58%
0% 20% 40% 60% 80% 100%
Drive a car or truck after having an alcoholic drink
Ask someone to buy alcoholic beverages for you
Have several drinks in a row
Ride with someone who has had an alcoholicdrink
Drink alcoholic beverages with your friends
Responded, "Yes, definitely"
Harmful to do Wrong to do
Figure 7.
10th Grade
Would This Be Wrong/Harmful for You to Do?
76%
74%
51%
52%
46%
79%
73%
53%
49%
43%
0% 20% 40% 60% 80% 100%
Drive a car or truck after having an alcoholic drink
Ride with someone who has had an alcoholic drink
Ask someone to buy alcoholic beverages for you
Have several drinks in a row
Drink alcoholic beverages with your friends
Responded, "Yes, definitely"
Harmful to do Wrong to do
Figure 8 The 6th graders were also asked this same set of questions; however, there was some indication that the left-to-right ordering of the response choices on the instrument may have been confusing to them, because

Pennsylvania DUI Association Underage Drinking PSA Campaign Evaluation
Report and Recommendations, September 2007 Page 20 of 76
approximately one-fifth indicated that these activities would be “not at all” harmful or wrong. This proved to be an anomaly; in the post-survey, the ordering of the responses was reversed (right to left), and the percentage of “not at all” responses dropped substantially among the 6th graders. The conclusion was that the 6th grade responses should not be considered valid. 3. Alcohol Use Not surprisingly, the survey results indicated that, among youth, use of alcohol increases with age. While the proportion of 6th graders who reported having had a drink was 23%, the percentage increased to 32% among 8th graders and 48% among 10th graders.
Have you ever had a whole drink?
77%68%
52%
23%32%
48%
0%10%20%30%40%50%60%70%80%90%
100%
6th 8th 10th
Grade Level
NoYes
Figure 9
The question above was used as a conditional item, leading to a follow-up question for those who gave a “yes” response. Those who ever did have a drink were asked to indicate how often they used alcohol while engaged in one of each of six social activities. For those who had done so, the frequencies are presented in the chart on the next page. They show that the most commonly reported social setting for using alcohol was going on a date or to a party, followed by hanging around at a friend’s house when adults are absent, or doing the same at their own home. To a lesser extent, the respondents also used alcohol when hanging around in an outside area, going to a music concert or sports event, and finally, riding around with friends in a car.

Pennsylvania DUI Association Underage Drinking PSA Campaign Evaluation
Report and Recommendations, September 2007 Page 21 of 76
In the past 6 months, how often did you you drink alcoholic beverages when you...
8%
8%
8%
10%
13%
15%
2%
4%
3%
6%
6%
5%
4%
2%
2%
4%
8%
11%
0% 5% 10% 15% 20%
Rode around at night with friends in acar?
Went to a music concert or sportsevent?
Hung out with friends at night at anoutside area, such as a park, parking
lot or street corner?
Hung around at home with your friendswhen your parents were not there
Hung around at someone else’s homewith your friends when there were no
adults there?
Went on a date or to a party?
M ore than half the timeAbout half the timeLess than half the time
Figure 10

Pennsylvania DUI Association Underage Drinking PSA Campaign Evaluation
Report and Recommendations, September 2007 Page 22 of 76
4. Messages about Alcohol Like the parents in this study, students were asked to indicate sources of messages about the dangers of alcohol that they might have seen or heard during the past few months. The most frequently reported source of such messages was television, indicated by about three-fourths of the youth sample. A majority (51%-59%) also reported receiving messages from printed material or from events in the news. Having a talk with parents about the dangers of alcohol occurred conversely with grade level, from 58% for the 6th
graders to 36% for the 10th graders. Finally, less than half of the youth reported hearing a message on the radio or knowing someone who was injured by a drunk driver.
Messages about the dangers of alcohol in the past few months
70%
57%
58%
56%
36%
31%
77%
59%
52%
43%
45%
41%
80%
58%
51%
36%
48%
41%
0% 20% 40% 60% 80% 100%
Saw a message on TV about the dangers of alcohol
Saw a poster, print advertisement, or printed sheetof paper with message
Something happened in the news that made youthink about it
Parent/guardian talked to you about dangers ofalcohol
Heard a message on the radio
Someone you knew was injured because of a drunkdriver
6th Grade8th Grade10th Grade
Figure 11

Pennsylvania DUI Association Underage Drinking PSA Campaign Evaluation
Report and Recommendations, September 2007 Page 23 of 76
C. COMPARISONS – YOUTH AND PARENT PERSPECTIVES 1. Access to Alcohol Parents and youth completed surveys with an overlapping set of questions about the ease or difficulty of access to alcohol. The respondents were given three methods of access and asked to rate them on a scale of 1 (very difficult to do) to 5 (very easy to do). The chart below, showing the average (mean) ratings using the 5-point scale, identified a few trends:
• None of the means approached the midpoint value (3), signifying that most respondents felt these methods of access were relatively difficult.
• Youth respondents rated ease of access substantially higher than parents for the method of getting a stranger to buy alcoholic beverages.
• Parents rated ease of access slightly higher than youth regarding stealing alcohol from some place other than home.
• The older the child, the less difficult access is perceived to be, by both parents and youth.
How easy or difficult do you think it would be for you (any of your children) to do any of the following? Get a family member or friend to buy alcoholic beverages
for you (your child)
1.26
1.68
2.04
1.36
1.62
2.28
0.00 1.00 2.00 3.00 4.00 5.00
6th Grade
8th Grade
10th Grade
Scale of Difficulty (1 = very difficult, 5 = very easy)
Parent
Youth
Get an older person that you don't know (your child doesn't know) to buy alcoholic beverages for you (your child)
1.32
1.75
1.99
1.53
2.02
2.31
0.00 1.00 2.00 3.00 4.00 5.00
6th Grade
8th Grade
10th Grade
Scale of Difficulty (1 = very difficult, 5 = very easy)
Parent
Youth
Steal alcoholic beverages from some place other than your home
1.32
1.95
2.10
1.37
1.76
2.07
0.00 1.00 2.00 3.00 4.00 5.00
6th Grade
8th Grade
10th Grade
Scale of Difficulty (1 = very difficult, 5 = very easy)
Parent
Youth
Figure 11

Pennsylvania DUI Association Underage Drinking PSA Campaign Evaluation
Report and Recommendations, September 2007 Page 24 of 76
2. Messages about Alcohol Parents and youth were also asked similar questions about messages they had heard or seen regarding the dangers of alcohol use. As Figure 13 below indicates, television was the most frequent “message agent” indicated by both parents and youth; over three-fourths (76%) of both groups said that they had seen a message via television in the past few months. The data also show that:
• A significantly higher proportion of parents mentioned seeing or hearing about an alcohol-related incident in the news (75%) than was evident among the young respondents (53%)
• The proportions of parents who said that one of their children asked them about alcohol (59%) nearly matched the percentage of youth respondents who said that their parents had talked with them about alcohol (58%)
• More than half (58%) of the youth respondents recalled seeing a message in print form (parents were not asked this question).
• Radio messages were picked up by less than half of both groups of respondents.
In the past few months, have you seen or heard anything about the dangers of alcohol in any of the
following ways?
76%
75%
59%
47%
76%
53%
58%
58%
44%
0% 10% 20% 30% 40% 50% 60% 70% 80% 90%
Did you see a message on TV about alcohol?
Did something happen in the new s that madeyou think about how dangerous alcohol could
be?
Did any of your children ask you a questionabout the dangers of alcohol?
Did a parent or guardian talk to you about thedangers of alcohol?
Did you see a poster, print advertisement, orprinted sheet of paper w ith a message about
the dangers of alcohol?
Did you hear a message on the radio aboutalcohol?
Percent who responded "yes"
Parent Youth
Figure 13

Pennsylvania DUI Association Underage Drinking PSA Campaign Evaluation
Report and Recommendations, September 2007 Page 25 of 76
D. PRE-POST COMPARISONS This section presents the survey results for the students and parents who completed the Fall 2006 surveys and the Spring 2007 surveys. The comparison cohort constitutes a subset of those who completed the initial (pre-) survey; the overall numbers are smaller and there were not enough 10th graders in the post survey to provide an opportunity for comparative analysis. The numbers of surveys in the analysis are shown below.
Table 5: Composition of the Pre-Post Comparison Sample - Youth Grade Level Pre Post Total
6th 107 126 233 8th 48 58 106
Total 155 184 339
It should also be noted that two areas—Somerset and Reading—produced respondents in the 6th grade group, but only Somerset yielded 8th grade respondents. This explains the difference in size between the two grade-level samples. Finally, it is important to acknowledge that the post sample was not identical to the pre sample. The analysis, which begins on the following page, focuses on outcomes: access, attitudes, behavior and messages. Because parents were also asked questions about access and messages, the pre-post comparisons for them are included where appropriate. The breakdown of the parent pre-post comparison sample is shown below
Somerset Area Reading Area Combined Areas Pre 43 85 128 Post 52 65 117 Total 95 150 245

Pennsylvania DUI Association Underage Drinking PSA Campaign Evaluation
Report and Recommendations, September 2007 Page 26 of 76
Access to Alcohol Overall, the vast majority of young respondents indicated that gaining access to alcohol is difficult. On a scale of 1 to 5 (1 representing the greatest difficulty), the average ratings for both surveys and both grade levels fell between 1 and 2 (See chart below). However, the post-survey revealed a moderation of those views on the part of many respondents. With the exception of the views of 8th graders regarding getting a stranger to buy alcohol, the average ratings increased (signifying greater ease of access) in the post survey results. It should also be noted that getting “a family member or friend to buy alcoholic beverages” was generally perceived as the most difficult of the three methods shown; however, among 8th graders in the post survey, the differences in the ratings among the three methods was too small to be meaningful.
How easy or difficult would it be for you to do any of the following?
Get a family member or friend to buy alcoholic beverages for you
1.20
1.52
1.38
1.95
1.00 2.00 3.00 4.00 5.00
6th Grade
8th GradeGra
de L
evel
Scale of Difficulty (1 = very difficult, 5 = very easy)
Pre Post Get an older person that you don't know to buy
alcoholic beverages for you
1.49
2.04
1.78
1.88
1.00 2.00 3.00 4.00 5.00
6th Grade
8th GradeGra
de L
evel
Scale of Difficulty (1 = very difficult, 5 = very easy)
Pre Post
Steal alcoholic beverages from some place other than your home
1.34
1.67
1.49
2.00
1.00 2.00 3.00 4.00 5.00
6th Grade
8th GradeGra
de L
evel
Scale of Difficulty (1 = very difficult, 5 = very easy)
Pre Post Figure 12. Pre-Post Comparisons of Youth Perspectives on Ease or Difficulty of Access to Alcohol
One possible explanation of this increase in the perception of easier access to alcohol may stem from the timing of the surveys. The pre survey was administered in the autumn while the post survey was conducted in the following spring. In the intervening 6 months, some students may have gained additional knowledge from their peers about getting access to alcohol. The 6 months, therefore, could have represented one stage in the progressive tendency toward easier access with grade level, observed previously in Figure 6 on page 19.

Pennsylvania DUI Association Underage Drinking PSA Campaign Evaluation
Report and Recommendations, September 2007 Page 27 of 76
While it was noted earlier that, in general, parents felt access to alcohol would be difficult for their children, a change in perspective was evident in the post-survey. As the chart below indicates, for each one of six risky behaviors listed, a larger proportion of parents in the second survey felt that their children would find it “easy” or “very easy” to do. There are at least two possible explanations for this change: 1) parents have become more aware, over the 6-month period, that their children are finding it less difficult to get alcohol (reinforcing the findings discussed on Page 27); or 2) parents have been alerted, through messages about the dangers of alcohol, that access to alcohol is less difficult than they had first perceived it to be.
How easy or difficult do you think it would be for a child of yours to do any of the following?
3.1%
0.8%
1.6%
0.8%
0.8%
1.6%
7.7%
6.8%
3.4%
3.4%
3.4%
2.6%
0% 5% 10% 15% 20% 25%
Drink alcohol w ith a group of his/herfriends?
Steal alcoholic beverages from someplace other than your home?
Go to a party or dance club w ithout yourknow ledge?
Get an older person that they don’t knowto buy alcoholic beverages for them?
Have a party at home w ithout yourpermission?
Get an older person that they know to buyalcoholic beverages for them?
% who reponded "easy" or "very easy"
Pre Post
Figure 13

Pennsylvania DUI Association Underage Drinking PSA Campaign Evaluation
Report and Recommendations, September 2007 Page 28 of 76
1. Attitudes about Alcohol For the 6th grade respondents, attitudes about how “wrong” certain risky behaviors are changed very little from the first survey to the second. On a scale of 1 to 5 (1 representing “not at all” wrong, and 5 meaning “yes, definitely” wrong) the average (mean) ratings for five behaviors generally fell slightly above the 4 mark (equivalent to a “yes, probably” response). On average, the younger respondents made little moral distinction among the five behavior scenarios proffered by the questionnaire.
If you could get away with doing any of the following, do you think you would feel that it is wrong to do?
Would it be wrong to ask someone to buy alcoholic beverages for you?
4.11
4.75
4.26
4.31
1.00 2.00 3.00 4.00 5.00
6th Grade
8th Grade
Scale: 1 = Not at all, 5 = Yes, definitely
Pre Post
Would it be wrong to have several drinks in a row?
4.20
4.69
4.19
4.14
1.00 2.00 3.00 4.00 5.00
6th Grade
8th Grade
Scale: 1 = Not at all, 5 = Yes, definitely
Pre Post
Would it be wrong to ride in a car or truck with someone who has had an alcoholic drink?
4.18
4.50
4.26
4.26
1.00 2.00 3.00 4.00 5.00
6th Grade
8th Grade
Scale: 1 = Not at all, 5 = Yes, definitely
Pre Post
Would it be wrong to drive a car or truck after having an alcoholic drink?
4.19
4.81
4.28
4.55
1.00 2.00 3.00 4.00 5.00
6th Grade
8th Grade
Scale: 1 = Not at all, 5 = Yes, definitely
Pre Post
Would it be wrong to drink alcoholic beverages with your friends?
4.16
4.42
4.21
3.97
1.00 2.00 3.00 4.00 5.00
6th Grade
8th Grade
Scale: 1 = Not at all, 5 = Yes, definitely
Pre Post
Figure 14 The 8th grade students generally rated behaviors as wrong more frequently than the 6th graders, so the mean ratings are higher (closer to 5). The 8th graders gave their highest “wrongness” ratings to driving after drinking and asking someone else to buy alcohol for them. However, the most notable trend was the backward movement of the 8th grade students with regard to all five of the behaviors. In particular, the post survey respondents were significantly less “definite” about whether it would be wrong to ask someone to buy alcohol for them, to drink alcohol with their friends, or to have several drinks in a row.

Pennsylvania DUI Association Underage Drinking PSA Campaign Evaluation
Report and Recommendations, September 2007 Page 29 of 76
Similar patterns of responses prevailed when the youths were asked how harmful they felt these behaviors would be. Eighth graders were more likely than 6th graders to rate the activities as definitely harmful, but pulled back from this certainty on the second survey. “Harmful” ratings corresponded closely with “wrong” ratings for activities.
If you ever did any of the following, do you think it would be harmful to you?
Would it be harmful to to drink alcoholic beverages that you have asked someone to buy
or get for you?
4.17
4.65
4.25
4.31
1.00 2.00 3.00 4.00 5.00
6th Grade
8th Grade
Scale: 1 = Not at all, 5 = Yes, definitely
Pre Post
Would it be harmful to have several drinks in a row?
4.26
4.81
4.18
4.31
1.00 2.00 3.00 4.00 5.00
6th Grade
8th Grade
Scale: 1 = Not at all, 5 = Yes, definitely
Pre Post
Would it be harmful to drive a car or truck after having an alcoholic drink?
4.25
4.79
4.24
4.60
1.00 2.00 3.00 4.00 5.00
6th Grade
8th Grade
Scale: 1 = Not at all, 5 = Yes, definitely
Pre Post
Would it be harmful to ride in a car or truck with someone who has had an alcoholic drink?
4.19
4.67
4.21
4.38
1.00 2.00 3.00 4.00 5.00
6th Grade
8th Grade
Scale: 1 = Not at all, 5 = Yes, definitely
Pre Post
Would it be harmful to drink alcoholic beverages with your friends?
4.22
4.63
4.07
4.11
1.00 2.00 3.00 4.00 5.00
6th Grade
8th Grade
Scale: 1 = Not at all, 5 = Yes, definitely
Pre Post
Figure 17 2. Alcohol Use Respondents in the youth survey were asked about their use of alcoholic beverages in two ways:
1. Frequency of alcohol use in various social activities or settings involving peers, such as going out on a date, to a party or concert, etc.
2. High-risk behavior related to alcohol consumption, such as having five or more drinks in a row (binge drinking) or drinking to the point of “feeling drunk”.

Pennsylvania DUI Association Underage Drinking PSA Campaign Evaluation
Report and Recommendations, September 2007 Page 30 of 76
Use of alcohol in social activities was measured on a scale of 1 (never) to 5 (every time) for six different activities and averaged for each participant. The summary by grade level, shown below, indicates that:
1. The responses were not greatly different between the two grade levels. 2. A slightly greater frequency of use was reported in the post survey
Use of alcohol in social activities
1.30
1.15
1.27
1.44
1.61
1.53
1.00 2.00 3.00 4.00 5.00
6th Grade
8th Grade
Total
Scale: 1 = "never", 5 = "every time"
PrePost
Figure 18
How many times in the past six months have you had 5 or more drinks in a row?
88%
13%
0%
0%
65%
24%
6%
6%
0% 10% 20% 30% 40% 50% 60% 70% 80% 90% 100%
Not at all
A few times
Once or tw ice a month
Several times a month
Percent of 8th grade respondents
Pre
Post
Figure 19. Alcohol Use by 6th Grade Students
Pennsylvania DUI Association Underage Drinking PSA Campaign Evaluation
Report and Recommendations, September 2007 Page 31 of 76
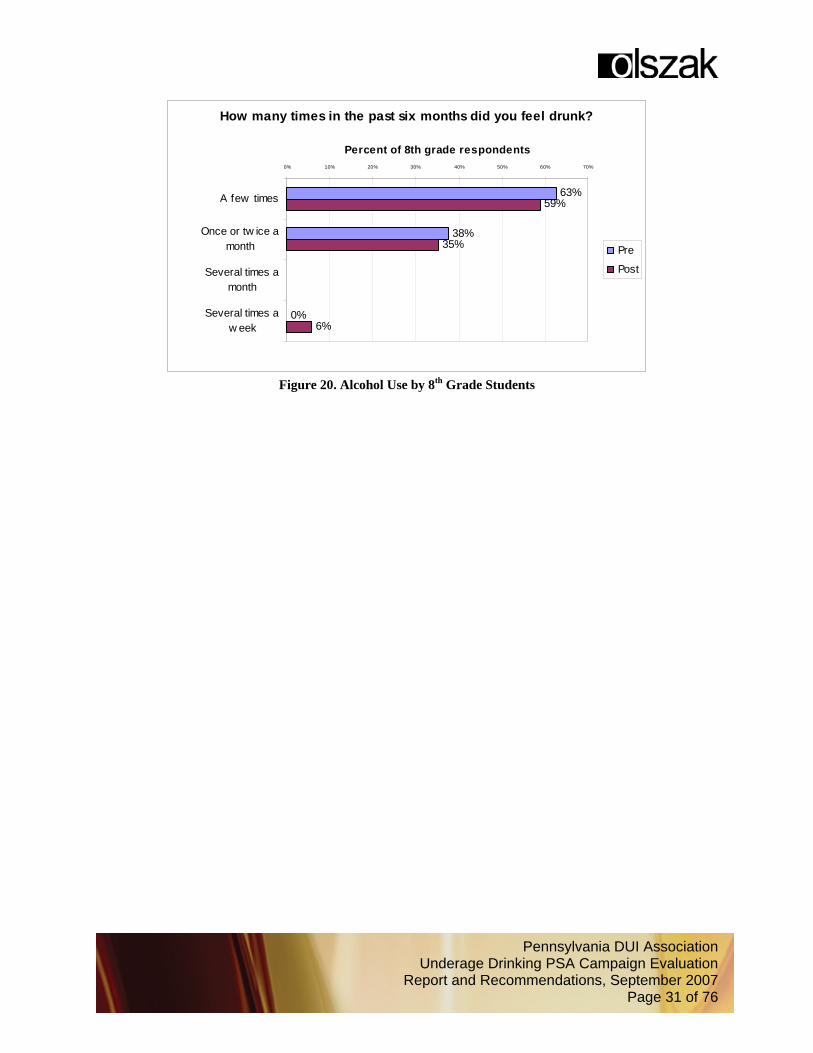
How many times in the past six months did you feel drunk?
63%
38%
0%
59%
35%
6%
0% 10% 20% 30% 40% 50% 60% 70%
A few times
Once or tw ice amonth
Several times amonth
Several times aw eek
Percent of 8th grade respondents
Pre
Post
Figure 20. Alcohol Use by 8th Grade Students

Pennsylvania DUI Association Underage Drinking PSA Campaign Evaluation
Report and Recommendations, September 2007 Page 32 of 76
3. Messages about Alcohol A comparison of the types of alcohol-related messages experienced by respondents before and after the campaign showed no significant change with regard to most of the communication channels. Television messages and news events were the primary venues for receiving messages. Nearly two-thirds of the youth respondents reported that a parent or guardian had spoken with them about the dangers of alcohol. While a similar proportion (63%) indicated that they had seen a message in print form in the first survey that proportion dropped to 51% in the second survey. Messages on the radio were acknowledged by just over a third of the respondents.
In the past few months, have you seen or heard anything about the dangers of alcohol in any of
the following ways?
76%
65%
64%
63%
38%
35%
73%
63%
63%
51%
35%
34%
0% 10% 20% 30% 40% 50% 60% 70% 80% 90% 100%
Did you see a message on TV about alcohol?
Did something happen in the news that madeyou think about how dangerous alcohol could
be?
Did a parent or guardian talk to you about thedangers of alcohol?
Did you see a poster, print advertisement, orprinted sheet o f paper with a message about
the dangers of alcohol?
Did you hear a message on the radio aboutalcohol?
Did someone you know get injured because ofa drunk driver?
Percent who answered "Yes"
PrePost
Figure 21

Pennsylvania DUI Association Underage Drinking PSA Campaign Evaluation
Report and Recommendations, September 2007 Page 33 of 76
For parents with 6th and 8th grade children, the types of messages received also remained fairly constant from the first survey to the second. There was a substantial decrease in the proportion who said they had heard something in the news that made them think about the dangers of alcohol, down from 73% to 64%. However, there was also an increase in the proportion who said that someone they knew was injured by a drunk driver, up from 27% to 33%. For all other channels, the change was 5 percentage points or less, which is essentially flat.
In the past few months, have you seen or heard anything about the dangers of alcohol in the following ways?
77%
73%
55%
53%
48%
27%
27%
72%
64%
55%
56%
52%
33%
22%
0% 10% 20% 30% 40% 50% 60% 70% 80% 90% 100%
Did you see a message on TV aboutalcohol?
Did something happen in the news thatmade you think about how dangerous
alcohol could be?
Did any of your children ask you a questionabout the dangers of alcohol?
Did someone you know misbehave afterdrinking alcohol?
Did you hear a message on the radio aboutalcohol?
Did someone you know get injuredbecause of a drunk driver?
Did the children of someone you know getinto trouble because of alcohol?
Percent of Parent Respondents
Pre Post
Figure 22

Pennsylvania DUI Association Underage Drinking PSA Campaign Evaluation
Report and Recommendations, September 2007 Page 34 of 76
E. PROTECTIVE AND RISK FACTORS As noted earlier (see Methodology section), several sets of questionnaire items were clustered to form scales which were intended to gauge environmental factors that might serve to prevent underage drinking (protective) or increase the likelihood of its occurrence (risk). In the pre-survey, these scales were not found to be reliable (internally consistent) when used in the survey of youth; however, the same scales were reliable in the parent survey. In this section, parent perspectives are shown for factors related to Community, School and Family. 1. Community In the chart below, community protective factors are displayed with the proportion of parent responses indicating that each of the positive statements describe their neighborhoods “very much”. Parents were most inclined to say that their neighborhood was “a safe place to live” and that “people I meet on the street know me”. They were less likely to say that their neighbors were supportive in time of need. Very few (11%-15%) indicated that their communities had “things that are fun for kids to do”. The most striking aspect is that, for all of the statements except the last one listed, the responses from the Reading area were significantly less positive.
How much does each of the following statements describe your neighborhood?
68%
54%
51%
38%
15%
29%
15%
20%
18%
11%
68%
36%
36%
36%
11%
0% 10% 20% 30% 40% 50% 60% 70% 80%
This is a safe place to live
People that I meet on the street know me
If I w ould need help, or someone to talk toabout something important, I can f ind help here
People in this neighborhood help each other
This neighborhood has things that are fun forkids to do
% of parents responding "very much"
Lycoming Reading Somerset
Figure 23. Community Protective Factors

Pennsylvania DUI Association Underage Drinking PSA Campaign Evaluation
Report and Recommendations, September 2007 Page 35 of 76
Community risk factors, shown in the chart below, emphasize aspects that make the community undesirable or hostile. Reading area respondents identified these as characteristics of their neighborhood much more frequently.
How much does each of the following statements describe your neighborhood?
13%
6%
5%
18%
18%
12%
11%
6%
8%
0% 10% 20% 30% 40% 50% 60% 70% 80%
There are people in this neighborhood w hocan get my child into trouble
People talk about w anting to get out of thisneighborhood
People get into loud arguments on the streets
% of parents responding "very much"
Lycoming Reading Somerset
Figure 24 2. School School protective factors include quality of education, safety and involvement of parents and children. The general trend of the responses was that, as the grade level increases, a) the parents show less involvement while children become more engaged in activities; b) parents’ perception of school safety declines; and c) parents become less satisfied with the quality of education.
Parents' perceptions of school protective factors, by grade level of eldest child
67%
40%
34%
44%
45%
28%
39%
25%
44%
33%
47%
31%
0% 20% 40% 60% 80%
Parent feels "very satisfied" with quality of education
Parent knows child's teachers "very well" or "fairly well"
Children participate in after-school activities "very often"
Parent feels child's school is "very safe"
Percent of Parent Respondents
6th Grade 8th Grade 10th Grade
Figure 25

Pennsylvania DUI Association Underage Drinking PSA Campaign Evaluation
Report and Recommendations, September 2007 Page 36 of 76
3. Family Family risk and protective factors were discussed in Section A. Parent Perspectives, Part 2. Parenting Patterns. In this section, we make a comparison between pre-post changes in risk and protective factors for both parents and community. This comparison is made possible by taking the clusters of responses for the survey items related to each factor and translating them into means (averages) based on a common 5-point scale. For protective factors, ideally, the means should approach the high value, 5. For risk factors, the expectation is that the means would be as minimal as possible, with the lowest value being 1. The chart below shows the comparison of means for Family Risk, Family Protective, Community Risk and Community Protective factors for the pre and post surveys. Changes of a half-point (.5) or more are noteworthy. Three significant findings are evident: • The Family Risk factor ratings increased from 1.2 to 1.9, indicating an significant increase in
unfavorable family environment elements • The Family Protective factor rating for the Somerset Area decreased from 4.5 to 4.0, signifying a slight
decline in nurturing elements. • The Community Protective factor ratings for all areas remained consistently low, reflecting a perception
of little support from the community.
Pre-Post Change in Risk and Protective Factors
1.2
1.9
4.3
4.1
1.7
1.8
1.9
2.0
1.2
1.9
4.5
4.0
1.4
1.4
2.2
2.4
1.2
1.9
4.4
4.1
1.6
1.6
2.0
2.2
0.0 1.0 2.0 3.0 4.0 5.0
Pre
Post
Pre
Post
Pre
Post
Pre
Post
Fam
ily R
isk
Fam
ily P
rote
ctiv
eC
omm
unity
Ris
kC
omm
unity
Prot
ectiv
e
Value (scale 1 to 5)
Reading Area Somerset Area Total
Figure 26

Pennsylvania DUI Association Underage Drinking PSA Campaign Evaluation
Report and Recommendations, September 2007 Page 37 of 76
V. Discussion A. ACCESS TO ALCOHOL Parents’ perceptions about how easy it was for their children to gain access to alcohol bore a strong negative correlation to their self-reporting rating of family protective factors. The stronger the family protective factors were, the less likely parents were to feel that their children could easily obtain alcohol. The scatterplot below indicates this relationship, with the family protective scale along the x-axis (horizontal) and the access-to-alcohol scale along the y-axis (vertical). In a negative correlation, the “line of best fit” runs from the top left corner of the graph to bottom right corner. The stronger the correlation, the closer the points are to the line. In general, parents tended to score their family protective factors quite high, and access to alcohol quite low, which explains why most of the plot points are in or near the bottom right corner.
Correlation between Family Protective Factors and Perception of Child's Access to Alcohol (All Areas)
1.00
1.50
2.00
2.50
3.00
3.50
4.00
4.50
5.00
1.00 1.50 2.00 2.50 3.00 3.50 4.00 4.50 5.00
Scale Mpos - Family Protective
Scal
eL -
Acc
ess
to A
lcoh
ol
Figure 27
For respondents in the Somerset area, the correlation between family protective factors and less access to alcohol was even stronger. Below, the scatterplot for Somerset parents shows a much more concentrated focus area for the plot points, with very few responses occurring away from the line.

Pennsylvania DUI Association Underage Drinking PSA Campaign Evaluation
Report and Recommendations, September 2007 Page 38 of 76
Correlation between Family Protective Factors and Perception of Access to Alcohol (Somerset Area)
1.00
1.50
2.00
2.50
3.00
3.50
4.00
4.50
5.00
1.00 1.50 2.00 2.50 3.00 3.50 4.00 4.50 5.00 Scale Mpos - Family Protective
Scal
eL -
Acc
ess
to A
lcoh
ol
Figure 28
These data suggest that the extent to which parents felt confident in their parenting practices and family environment generally, they also felt pretty sure that their children could not easily obtain alcoholic beverages. While parents generally gave access to alcohol low ratings (indicating difficulty), they nevertheless felt that the easiest method for their children to obtain alcohol was to “get an older person that they don’t know to buy” it for them. This was true for parents with children at all grade levels, but primarily for those with children in the 10th grade; among this group of parents, 31% rated the “stranger” method “easy” or “very easy”. In contrast, 25% of the 10th grade student respondents gave “easy” or “very easy” ratings to the method of getting “a family member or friend” to get alcohol for them, more than twice the rating for getting alcohol from a stranger (12%). These findings suggest that parents’ confidence in family protective factors to prevent their children’s access to alcohol may be somewhat misplaced. They also provide supportive evidence for the approach of the PA DUI campaign, which encourages parents to take more responsibility. Some of the parents acknowledged this dilemma; less than half expressed full agreement with the statement, “I am doing everything I can to keep alcohol away from my children.” Earlier in the report, it was noted that parents gave relatively low ratings to the protective factors in their communities. However, the correlation between community protective factors and parents’ ratings of access to alcohol was weak.

Pennsylvania DUI Association Underage Drinking PSA Campaign Evaluation
Report and Recommendations, September 2007 Page 39 of 76
B. ALCOHOL USE The youth survey posed a cluster of questions to respondents, asking them first to rate certain behaviors by how “wrong” they considered each of them, and then by how “harmful” they were. From the responses about wrongness, a Moral Attitude scale was developed; the responses about harmfulness comprised a Risk Awareness scale. In the Youth Perspectives section of the report, it was noted that moral attitudes and risk awareness were closely aligned for most of the suggested behaviors. There is a strong, positive correlation between the two reliable scales, as demonstrated in the scatterplot below. The “line of best fit” for a positive correlation runs from the bottom left corner of the graph to the top right corner, with plotted points positioned close to the line. The correlation is not perfect, however; there are several outlying cases, indicating some discrepancies between moral attitudes and risk awareness.
Correlation between Moral Attitudes and Risk Awareness Regarding Alcohol Use
1.00
1.50
2.00
2.50
3.00
3.50
4.00
4.50
5.00
1.00 1.50 2.00 2.50 3.00 3.50 4.00 4.50 5.00
Scale L - Moral Attitudes about Alcohol Use
Scal
e M
- R
isk
Aw
aren
ess
Figure 29
The measurements of alcohol use by students were taken from two sets of questions yielding two reliable scales:
1. The Use of Alcohol with Social Activities scale was derived from survey items about the frequency of alcohol use with activities such as dances, parties, concerts, hanging out with friends, etc.
2. The High-Risk Behavior scale took its values from responses about situations such as mixing drinking with driving, riding with a driver who has had alcohol, binge drinking, and “feeling drunk”.
As expected, many students who engaged in drinking associated with social activities also reported instances of high-risk behavior. The correlation between the two scales, however, was only moderate; as the scatterplot below indicates, there were many exceptions.

Pennsylvania DUI Association Underage Drinking PSA Campaign Evaluation
Report and Recommendations, September 2007 Page 40 of 76
Correlation between Use of Alcohol with Social Activities and High-Risk Behavior
1.00
1.50
2.00
2.50
3.00
3.50
4.00
4.50
5.00
1.00 1.50 2.00 2.50 3.00 3.50 4.00 4.50 5.00
Scale G - Use of Alcohol with Social Activities
Scal
e I -
Hig
h R
isk
Beh
avio
rA
ssoc
iate
d w
ith A
lcoh
ol
Figure 30
Another testable assumption is that greater risk awareness serves to reduce the incidence of high risk behavior. While there is a correlation between the two phenomena, it is very weak. As the scatterplot on the top of the next page indicates, there were many exceptions within the survey data. One obvious explanation is that by the time high-risk behavior is in progress, the opportunity for moral judgment or risk awareness to influence behavior has passed. Another explanation, supported by the survey data, is that youths were less “definite” about the wrongfulness or harmfulness of drinking with their friends or having several drinks in a row than they were about driving under the influence of alcohol or riding with someone who was. So while some kinds of high-risk behaviors are deterred by moral attitudes and risk awareness, others are not.

Pennsylvania DUI Association Underage Drinking PSA Campaign Evaluation
Report and Recommendations, September 2007 Page 41 of 76
Correlation between Risk Awareness and High-Risk Behavior (alcohol)
1.00
1.50
2.00
2.50
3.00
3.50
4.00
4.50
5.00
1.00 1.50 2.00 2.50 3.00 3.50 4.00 4.50 5.00
Scale M - Risk Awareness
Scal
eG -
High
Ris
k B
ehav
ior
(alc
ohol
)
Figure 31
C. MESSAGES In the course of this study, information about messages concerning the dangers of alcohol was collected in two ways: the surveys of parents and youth measured the channels by which messages were received; the focus groups with parents and youth gleaned feedback about the messages used in the PA DUI’s campaign. The results can be summarized as follows: Survey Findings • TV messages were the most frequently cited by both parents and youth. About three-fourths of the
respondents reported having seen a message in the months prior to the survey. • Parents were more likely to notice news items than youth. While over 70% of the parents mentioned
seeing a news story that made them think about the dangers of alcohol, only about half of the students did.
• Radio messages were less likely to be heard (or remembered) than TV messages. Only about 40% of parents and youth reported hearing a message on the radio.
Focus Group Findings Participants expressed the following sentiments about messages: • Be real – parents and youth felt that the most effective approach was to show the gritty reality of
alcohol access and use: an open refrigerator door showing beer next to the food, or the wreckage resulting from drunken driving.
• Be relevant – participants felt that messages would be most effective if they included their actual experiences and problems, such as non-urban settings or teenagers drinking in the woods.

Pennsylvania DUI Association Underage Drinking PSA Campaign Evaluation
Report and Recommendations, September 2007 Page 42 of 76
• Suggest action – parent participants wanted to know what they should do. For example, the print advertisement received praise for advising parents to “Take stock of your supply” of alcohol.
Limitations of the Campaign Assessment While the study did produce interesting and useful findings, a more rigorous test of the effectiveness of the DUI Association campaign would have required the following: • A measurement of the exposure to the campaign. The survey results showed that parents and youth
remember hearing and seeing messages about the danger of alcohol through various media channels; however, determining how much exposure they received over time would have necessitated a much more controlled study with the use of journals or other detailed data collection methods.
• Accounting for messages received from sources other than the PA DUI Association. It is not clear from the responses whether parents and youths who took the survey were able to make a distinction between the DUI Association spots and other messages related to the prevention of underage drinking.
• Accounting for the relative emotional effect of messages. Although three-fourths of parents reported seeing a TV spot, a nearly equal proportion said that a news item made them think about the dangers of alcohol. Distinguishing the weight of each message in the thinking and reaction of parents would require a very complicated research design.
Although this study did not conclusively measure the impact of the PA DUI campaign upon environmental factors and behavior, several trends were noted: • In the pre/post comparisons, a significant difference was noted in the perceptions of parents about the
ease of access to alcohol. Although the post survey showed that most parents still believed their children would have difficulty getting alcohol, it appears that more parents became aware of the possibilities and moderated their views when surveyed after the campaign.
• In the two communities involved in both the pre and post surveys, parents were inclined to rate their family risk factors significantly higher, and their family protective factors somewhat lower, in the second survey. The connection between family risk factors and children’s alcohol-related attitudes and behavior could not be firmly established by this study. Another unanswered question is whether these changes in family environment could have offset the impact of the PA DUI Association campaign.
Finally, it must be acknowledged that, because of logistical limitations and attrition, the survey process was not able to follow the rigorous structure of an experimental research design: • Neither the adult sample nor the youth sample was exactly the same for each survey. • Because of the anonymity of the survey, it was not possible to directly link the parent respondents with
those of their own children. D. ISSUES FOR FURTHER CONSIDERATION Solitary Drinking An increasing problem among young people is a tendency to engage in binge drinking alone. Our study did not delve into this issue, but instead focused on drinking while engaged in social activities or hanging out

Pennsylvania DUI Association Underage Drinking PSA Campaign Evaluation
Report and Recommendations, September 2007 Page 43 of 76
with friends. At least one study has noted that solitary drinking in adolescence is a precursor to a troubled adulthood. 3 Types of Alcohol Consumed Our study did not determine, for those young people who drank, exactly what types and quantities of beverages were being used. Recently, some researchers have noted that more teenagers are turning from beer to hard liquor, which they are able to purloin from home.4 Sources of Alcohol More detail is needed about the types of persons who provide alcohol to underage drinkers. Our survey asked about general categories (family vs. non-family members) of alcohol providers, but additional questions could be asked about whether non-family members are classmates, known adults, adult strangers, etc. Gender Gender was not an item on our survey, so no separate data is available for girls. However, some studies point to an alarming increase in drinking among female students.5 Drinking at Home This study noted that some parents felt it was “okay to let teenage children have an alcoholic drink at home when I am there.” Some researchers have explored the issue of children getting their first alcoholic drink from their parents. 6 It should be noted that, with the exception of gender, the topics mentioned above are not covered by the Communities That Care survey or other surveys conducted in Pennsylvania. There is, therefore, a persistent gap in knowledge about these issues. Additional research, funded through public or private sources, or some combination of the two, could obtain some baseline information about these issues that could be followed up regularly. The reports referenced, as well as the findings from our research and the discussion above, form the basis for the recommendations which follow.
3 Psychosocial functioning of adults who experienced substance use disorders as adolescents. By Rohde, Paul; Lewinsohn, Peter M.; Seeley, John R.; Klein, Daniel N.; Andrews, Judy A.; Small, Jason W. Psychology of Addictive Behaviors. 2007 Jun Vol. 21(2) 155-164. 4 Centers for Disease Control and Prevention. (2007) Types of Alcoholic Beverages Usually Consumed by Students in 9th-12th Grades --- Four States, 2005. Morbidity and Mortality Weekly Report, 56(29): 737-740. 5 Binge drinking said on rise among girls. Chicago Tribune, Thursday, March 30, 2006. 6 Hearsta, M.O., Fulkerson, J.A., Maldonado-Molinac, M.M., Perrya, C.L., Kelli A. Komro, K.A. (2007) Who needs liquor stores when parents will do? The importance of social sources of alcohol among young urban teens. Preventive Medicine, Article in Press, Corrected Proof, doi: 10.10.16/j.ypmed.2007.02.018.

Pennsylvania DUI Association Underage Drinking PSA Campaign Evaluation
Report and Recommendations, September 2007 Page 44 of 76
VI. Recommendations Message Channels • Television seems to be the medium that is most likely to appeal to parents as well as youths. It also
offers opportunities for visual presentation that are not inherent in other resources • Printed messages are apparently remembered by most youths, according to the survey findings.
However, young people are exposed to other messages in printed format as well. If the DUI Association wants to send a specific message in print format to the underage population, it should consider devising a message that will stand out among the print messages that they receive in magazines, from school, on flyers and other types of media.
• The study findings suggest that radio may not be a very effective way of reaching audiences of either generation. Unless the PA DUI Association can develop an audio spot that rises above the typically fast-paced stream of radio announcements, it should choose to put its resources into other, more effective media.
Message Content • The study findings, and those of other researchers mentioned in the Discussion section, suggest that a
generic message sent to a general audience may not be effective. Although production of multiple spots can be costly, there may be some impact to distributing specialized messages that address different aspects of the underage drinking problem, for example:
o Girls drinking o Youths drinking liquor o Youths drinking alone o Getting alcohol at home from parents or other adults present
As noted earlier, additional research is needed on these topics; the findings can be useful for guiding message content as well as message delivery strategies.
• The environmental settings depicted in messages may be important for making the message relevant to different audiences. Messages should be tailored to be appropriate for residents of urban, suburban and rural areas.
• It is important for parents to understand that their children are more likely to obtain alcohol from a family member or friend than from a stranger. The PA DUI Association should continue to convey this message in whatever ways possible, not only to parents, but to counselors, social workers and other professionals who may be advising parents about family issues.
To reduce the costs of developing the myriad messages recommended above, the PA DUI Association might harness the abilities of young talented volunteers with artistic talents through the sponsorship, with local partners, of competitions from which the most effective and powerful media products and messages might be selected. The focus group format employed in this study yielded useful ideas and important insights. The PA DUI Association should continue to test any message it develops in a focus group or other appropriate format.

Pennsylvania DUI Association Underage Drinking PSA Campaign Evaluation
Report and Recommendations, September 2007 Page 45 of 76
VI. Appendices
Appendix A: Public Service Announcements
Print Advertisement
The radio spot and television advertisement can be found at: http://www.padui.org/media.htm.

Pennsylvania DUI Association Underage Drinking PSA Campaign Evaluation
Report and Recommendations, September 2007 Page 46 of 76
Appendix B: Media Presentation Rating Form
Media Presentation Rating Form (Students & Parents)
RATINGS
Please mark the box below that best describes your opinion of the presentations.
“The Easiest Place…” Print Advertisement
Would you say that the presentation...
Gave a message that was:
very clear somewhat clear not clear at all
Gave a message that was:
very important somewhat important not important at all
Made sense to you?
Yes No Not sure
Gave useful information?
a lot some none
Told you something that you didn't already know?
yes no not sure
“No Big Deal” Radio Spot
Would you say that the presentation...
Gave a message that was:
very clear somewhat clear not clear at all
Gave a message that was:
very important somewhat important not important at all
Made sense to you?
Yes No Not sure
Gave useful information?
a lot some none
Told you something that you didn't already know?
yes no not sure

Pennsylvania DUI Association Underage Drinking PSA Campaign Evaluation
Report and Recommendations, September 2007 Page 47 of 76
“No Big Deal” Video Presentation
Would you say that the presentation...
Gave a message that was:
very clear somewhat clear not clear at all
Gave a message that was:
very important somewhat important not important at all
Made sense to you?
Yes No Not sure
Gave useful information?
a lot some none
Told you something that you didn't already know?
yes no not sure

Pennsylvania DUI Association Underage Drinking PSA Campaign Evaluation
Report and Recommendations, September 2007 Page 48 of 76
RANKINGS
Which message stood out the most in your mind? Please rank them with 1 for the most memorable and 3 for the least memorable.
____ The Easiest Place (print) ____ No Big Deal (audio) ____ No Big Deal (video)
Which message would be most likely to influence your future behavior? Please rank them with a 1 for the presentation that is most likely to influence you and 3 for the one least likely to influence you.
____ The Easiest Place (print) ____ No Big Deal (audio) ____ No Big Deal (video)

Pennsylvania DUI Association Underage Drinking PSA Campaign Evaluation
Report and Recommendations, September 2007 Page 49 of 76
Appendix C: Pre-Survey Interim Report
This report contains an assessment of the pre-survey results for the purpose of setting the stage for the post-survey effort to come. Rather than presenting a comprehensive analysis of the data collected so far, the report provides information about the reliability of measurement scales, anomalies and other points of interest about the findings, and recommendations for retaining, excluding or changing questionnaire items in the post-survey design. The term reliability refers to the ability of a scale—a cluster of items used to measure a particular domain, or theme—to demonstrate enough response consistency to verify that it is a useful measure of what it purports to measure. If respondents give inconsistent information, it may signify that they do not understand the questions, the questions are not constructed in an appropriate way, or there are too few items in the scale for it to work as expected. In this report, scales that are labeled as “low” in consistency most likely exhibit the latter of the three problems. The Parent and Youth surveys were constructed to capture information about the following domains:
• School – Risk and Protective factors • Family – Risk and Protective factors • Community – Risk and Protective factors • Social Participation – Risk and Protective factors • Behavior (outcomes) • Attitudes (outcomes)
In addition, both surveys asked questions about the respondents’ exposure to messages about the dangers of alcohol use, either through the media (TV, radio, news, print material) or personal experience with negative effects of alcohol use by others. Each section of the report (beginning with the Parent survey and continuing with the Youth survey) explores the following:
• The reliability of scaled items • The usefulness of stand-alone items • Findings that may influence or enhance the understanding of the second wave of results.
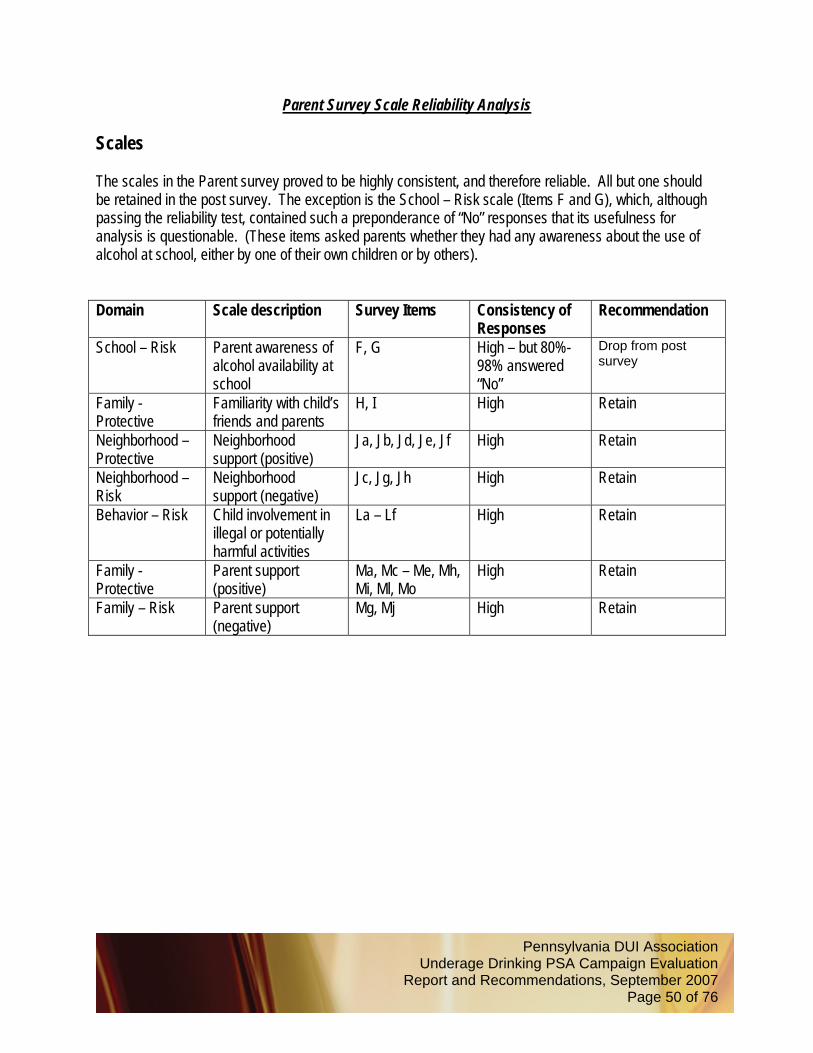
Pennsylvania DUI Association Underage Drinking PSA Campaign Evaluation
Report and Recommendations, September 2007 Page 50 of 76
Parent Survey Scale Reliability Analysis Scales The scales in the Parent survey proved to be highly consistent, and therefore reliable. All but one should be retained in the post survey. The exception is the School – Risk scale (Items F and G), which, although passing the reliability test, contained such a preponderance of “No” responses that its usefulness for analysis is questionable. (These items asked parents whether they had any awareness about the use of alcohol at school, either by one of their own children or by others). Domain Scale description Survey Items Consistency of
Responses Recommendation
School – Risk Parent awareness of alcohol availability at school
F, G High – but 80%-98% answered “No”
Drop from post survey
Family - Protective
Familiarity with child’s friends and parents
H, I High Retain
Neighborhood – Protective
Neighborhood support (positive)
Ja, Jb, Jd, Je, Jf High Retain
Neighborhood – Risk
Neighborhood support (negative)
Jc, Jg, Jh High Retain
Behavior – Risk Child involvement in illegal or potentially harmful activities
La – Lf High Retain
Family - Protective
Parent support (positive)
Ma, Mc – Me, Mh, Mi, Ml, Mo
High Retain
Family – Risk Parent support (negative)
Mg, Mj High Retain

Pennsylvania DUI Association Underage Drinking PSA Campaign Evaluation
Report and Recommendations, September 2007 Page 51 of 76
Other Survey Items The first section of the Parent Survey includes stand-alone items (Parts A through E) which are not part of scales (see chart below). Because items B - E show low correlations with outcomes (Behavior and Attitudes), they are not essential to the post survey. It is recommended that the post survey exclude these, but retain Item A because it provides a mechanism for organizing and comparing parent responses by the ages of their children. Domain Description Survey
Item Correlation with Outcomes
Recommendation
Number of children in each grade level
A Used to split data into subgroups
Retain
School - Protective
Satisfaction with child’s education
B Low Drop from post survey
School - Protective
How well do you know your child’s teachers?
C Low Drop from post survey
Social - Protective
Child involvement in after-school activities
D Low Drop from post survey
School - Protective
How safe do you feel your child’s school is?
E Low Drop from post survey
Access to Alcohol at Home (Item K) • In the Somerset area, a majority of parents felt it would be “difficult” or “very difficult” for their child to
acquire alcohol at home undetected. • In the Reading area, more than 60% of parents reported that they do not keep alcohol at home.
How easy or difficult would it be for your child to get alcohol at home without your knowing it?
0% 10% 20% 30% 40% 50% 60% 70%
No alcohol in my home
Very difficult
Difficult
Not Sure
Easy
Very easy
Resp
onse
Percent of Area Respondents
Reading Area Lycoming Area Somerset Area

Pennsylvania DUI Association Underage Drinking PSA Campaign Evaluation
Report and Recommendations, September 2007 Page 52 of 76
Exposure to Messages (Part N) • Many parents in the campaign areas have already seen TV messages about the dangers of alcohol,
most prominently in the Somerset area.
In the past few months, did you see a message on TV about the dangers of alcohol?
0% 10% 20% 30% 40% 50% 60% 70% 80% 90%
No response
Don't remember
No
Yes
Res
pons
e
Percent of Area Respondents
Reading Area Lycoming Area Somerset Area
• Parents with children in the higher grades were more likely to have been asked about alcohol.

Pennsylvania DUI Association Underage Drinking PSA Campaign Evaluation
Report and Recommendations, September 2007 Page 53 of 76
In the past few months, did any of your children ask you about the dangers of alcohol?
0% 10% 20% 30% 40% 50% 60% 70%
No response
Don't remember
No
Yes
Percent by Grade Level of Oldest Child
6th 8th 10th
Youth Survey Reliability Analysis
Scales The chart below summarizes reliability results for the youth survey. The items focusing on Risk and Protective factors in the Social, School, Family and Community domains are apparently not precise enough, as clusters, to provide reliable measurements against which to evaluate outcomes. While they provide useful background information, it is probably not useful to include them in the second round of surveys. However, the items forming scales for assessing outcomes—Behavior and Attitude measures—are reliable and should be retained in their current form in the post-survey. We also recommend changes in the Social Participation scales (Parts F and G.) that will make the survey less cumbersome and reduce redundancy. Domain Scale description Survey Items Consistency of
Responses Recommendation
Social - Protective
Participation in Activities Aa – Ad, Af Low Drop from post
survey School - Protective
Motivation to do well in school Ba, Bb Low Drop from post
survey School - Risk Unmotivated by
school Bc - Be Low Drop from post survey
Family - Protective
Engagement with Family Members Cb, Cd, Ce Medium Drop from post
survey

Pennsylvania DUI Association Underage Drinking PSA Campaign Evaluation
Report and Recommendations, September 2007 Page 54 of 76
Domain Scale description Survey Items Consistency of Responses
Recommendation
Family - Risk Alienation from Family Members Ca, Cc Medium Drop from post
survey Community – Protective
Neighborhood supportiveness Da, Db, Dd - Df Low Drop from post
survey Family – Protective
Parent support (positive) Ea, Ec, Ed, Ef Medium
Drop from post survey
Family – Risk Parent support (negative) Eb, Ee Medium Drop from post
survey Behavior Social
Participation (General)
Fc, Fd, Fe High Drop from post survey – overlap with Ga - Gf
Behavior – Risk Social Participation (Alcohol-Related) Ga - Gf High Retain – position
after Item H. Behavior – Risk High-Risk Behavior
(Alcohol) Ia, Ib, Ic High Retain
Behavior – Risk Access to Alcohol Ka, Kb, Kc High Retain Attitudes Moral Attitudes
(Alcohol-Related) La - Le High Retain
Attitudes Risk Awareness (Alcohol-Related) Ma - Me High Retain
Other Survey Items - Outcomes The items shown below, although not part of a scale, are important outcome indicators. Item H is a screening question that governs a skip pattern, moving respondents without alcohol experience to Item J. The large proportion of 6th graders indicating that there is no alcohol at home reflects the preponderance of Reading area respondents at this grade level. Both experience with and access to alcohol increase with age. Experience with Alcohol (Item H)
Have you ever had a whole drink?
77%68%
52%
23%32%
48%
0%10%20%30%40%50%60%70%80%90%
100%
6th 8th 10th
Grade Level
NoYes

Pennsylvania DUI Association Underage Drinking PSA Campaign Evaluation
Report and Recommendations, September 2007 Page 55 of 76
Availability of Alcohol at Home (Item J)
How easy or difficult would it be for you to get alcohol at home without your parents knowing it?
0% 10% 20% 30% 40% 50%
No answ er
No alcohol at home
Very diff icult
Diff icult
Not sure
Easy
Very easy
Percent of Respondents by Grade Level
6th 8th 10th
Items H. and J, as well as the six items in part N (exposure to messages about alcohol), are important to the study and should be retained in their current form in the post survey. Like the parents, many youths have had recent exposure to alcohol-related messages on television. Recent Exposure to Messages about the Dangers of Alcohol
TV 76%Printed material 58%Incident in the news 53%Parent or guardian 44%Radio 44%Someone you know injured by drunk driver 38%

Pennsylvania DUI Association Underage Drinking PSA Campaign Evaluation
Report and Recommendations, September 2007 Page 56 of 76
Correlations The reliability of scales on the Youth Survey makes possible a number of correlation strategies. Examples are shown in the charts on the next page and described below. A. This example of a strong correlation shows the relationship between moral attitudes (“would this be
wrong to do?”) and perceptions of risk (“would this be harmful to do?”). When these are matched, the resulting scatterplot (XY diagram) would, in a perfect correlation (1.00, represented by the arrow), show points arranged in a straight line from the lower left corner of the graph to the upper right corner; the value of this correlation is .89, which is considered to be very strong.
B. This example correlates one type of behavior (use of alcohol in social activities) with another type of
behavior: engaging in high-risk activities (binge drinking, driving after drinking, or riding with someone who is driving after drinking). The correlation is “moderate”, indicating that drinking alcohol at parties, performances, hanging around with friends, etc. is sometimes connected with dangerous activity, but not always.
C. This example of a weak correlation matches a risk factor – negative attitudes about school – with an
outcome – attitudes about the “wrongness” of alcohol use. The widely-scattered responses show that a connection between these two aspects is unlikely to exist.

Pennsylvania DUI Association Underage Drinking PSA Campaign Evaluation
Report and Recommendations, September 2007 Page 57 of 76
A. Strong Correlation
Correlation between Moral Attitudes and Risk Awareness Regarding Alcohol Use
0.00
1.00
2.00
3.00
4.00
5.00
6.00
0.00 1.00 2.00 3.00 4.00 5.00 6.00
Scale L - Moral AttitudesSc
ale
M -
Ris
k A
war
enes
s
B. Moderate Correlation
Correlation between Use of Alcohol with Social Activities and High-Risk Behavior
0.00
1.00
2.00
3.00
4.00
5.00
6.00
0.00 1.00 2.00 3.00 4.00 5.00 6.00
Scale G - Use of Alcohol with Social Activities
Scal
e I -
Hig
h R
isk
Beh
avio
rA
ssoc
iate
d w
ith A
lcoh
ol
C. Weak Correlation
Correlation between Negative Attitudes toward School and Moral Attitudes regarding Alcohol Use
0.00
1.00
2.00
3.00
4.00
5.00
6.00
0.00 1.00 2.00 3.00 4.00 5.00 6.00
Scale L - Moral Attitudes about Alcohol Use
Scal
eB(n
eg) -
Neg
ativ
e A
ttitu
des
abou
t Sch
ool

Pennsylvania DUI Association Underage Drinking PSA Campaign Evaluation
Report and Recommendations, September 2007 Page 58 of 76
Appendix D: Parent Survey (English) A. How many children do you have in each of the following grades? (Answer only for those children who
live with you most of the time.)
_____ 6th Grade _____ 8th Grade _____ 10th Grade
For your answers to the next several questions, please have in mind your children who are in 6th, 8th or 10th grade. Think about the past 6 months when they have attended school. B. How satisfied are you with the quality of education your child(ren) receive at school?
Answer only for your children in: 6th Grade 8th Grade 10th Grade Very satisfied Somewhat satisfied Not very satisfied Not at all satisfied
C. How well do you know your child’s teachers?
Answer only for your children in: 6th Grade 8th Grade 10th Grade Very well Fairly well Not very well Not at all
D. How often do any of your children take part in after-school activities (such as band, a club, a prayer
group, or sports?

Pennsylvania DUI Association Underage Drinking PSA Campaign Evaluation
Report and Recommendations, September 2007 Page 59 of 76
Answer only for your children in: 6th Grade 8th Grade 10th Grade Very often Fairly often Not very often Not at all
E. How safe do you feel your child’s school is? Is it …
Answer only for your children in: 6th Grade 8th Grade 10th Grade Very safe Somewhat safe Not very safe Not safe at all Not sure
For your answers to the next two questions, think about the past 6 months that any of your children who are now in 6th, 8th or 10th grade attended school. F. In the past 6 school months, have you been told that alcohol is being kept, used or sold at a school
attended by any child of yours?
Answer only for your children in: 6th Grade 8th Grade 10th Grade No A few times More than a few times
G. In the past 6 school months, has any child of yours used, kept or sold alcohol at school?
Answer only for your children in: 6th Grade 8th Grade 10th Grade No A few times More than a few times
For your answers to the next two questions, think about the friends of your children who are now in 6th, 8th or 10th grade.

Pennsylvania DUI Association Underage Drinking PSA Campaign Evaluation
Report and Recommendations, September 2007 Page 60 of 76
H. How well do you know your child’s friends? Answer only for your children in: 6th Grade 8th Grade 10th Grade Not at all Not very well Fairly well Very well
I. How well do you know the parents of your child’s friends?
Answer only for your children in: 6th Grade 8th Grade 10th Grade Not at all Not very well Fairly well Very well
For the next question, think about the neighborhood where you live. J. How much does each of the following statements describe a neighborhood like yours?
Is this like your neighborhood? Not at all Sometimes Very much 1 3 3
a. People that I meet on the street know me. b. If I would need help, or someone to talk to about something
important, I can find help here.
c. People get into loud arguments on the streets.
d. This neighborhood has things that are fun for kids to do.
e. This is a safe place to live.
f. People in this neighborhood help each other.
g. People talk about wanting to get out of this neighborhood. h. There are people in this neighborhood that can get my child into
trouble.
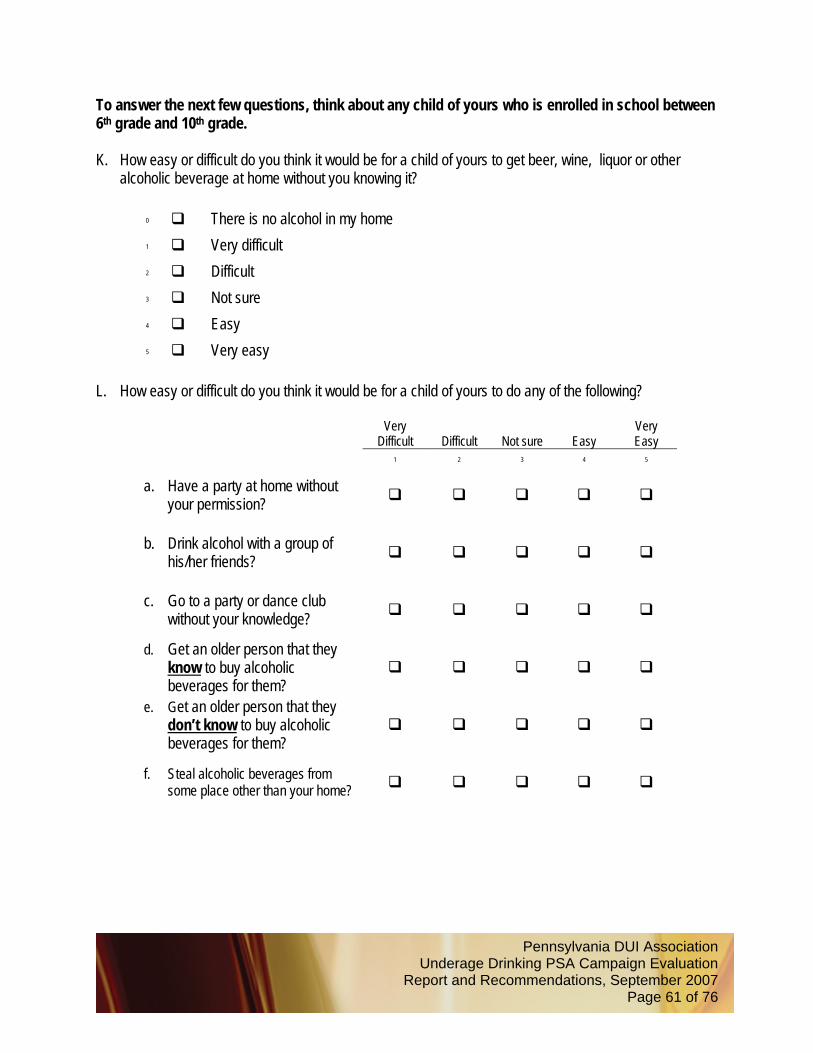
Pennsylvania DUI Association Underage Drinking PSA Campaign Evaluation
Report and Recommendations, September 2007 Page 61 of 76
To answer the next few questions, think about any child of yours who is enrolled in school between 6th grade and 10th grade. K. How easy or difficult do you think it would be for a child of yours to get beer, wine, liquor or other
alcoholic beverage at home without you knowing it?
0 There is no alcohol in my home 1 Very difficult 2 Difficult 3 Not sure 4 Easy 5 Very easy
L. How easy or difficult do you think it would be for a child of yours to do any of the following?
Very Difficult
Difficult
Not sure
Easy
Very Easy
1 2 3 4 5
a. Have a party at home without your permission?
b. Drink alcohol with a group of his/her friends?
c. Go to a party or dance club without your knowledge?
d. Get an older person that they know to buy alcoholic beverages for them?
e. Get an older person that they don’t know to buy alcoholic beverages for them?
f. Steal alcoholic beverages from some place other than your home?
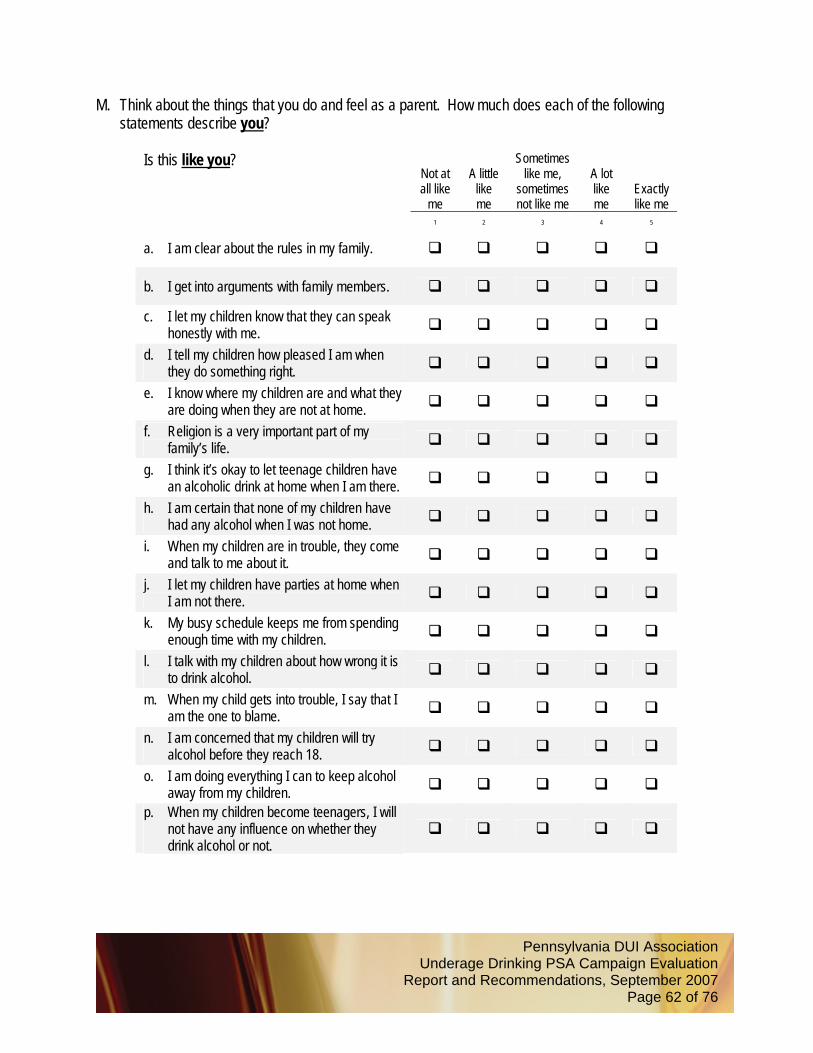
Pennsylvania DUI Association Underage Drinking PSA Campaign Evaluation
Report and Recommendations, September 2007 Page 62 of 76
M. Think about the things that you do and feel as a parent. How much does each of the following statements describe you?
Is this like you?
Not at all like
me
A little
like me
Sometimes like me,
sometimes not like me
A lot like me
Exactly like me
1 2 3 4 5
a. I am clear about the rules in my family.
b. I get into arguments with family members.
c. I let my children know that they can speak honestly with me.
d. I tell my children how pleased I am when they do something right.
e. I know where my children are and what they are doing when they are not at home.
f. Religion is a very important part of my family’s life.
g. I think it’s okay to let teenage children have an alcoholic drink at home when I am there.
h. I am certain that none of my children have had any alcohol when I was not home.
i. When my children are in trouble, they come and talk to me about it.
j. I let my children have parties at home when I am not there.
k. My busy schedule keeps me from spending enough time with my children.
l. I talk with my children about how wrong it is to drink alcohol.
m. When my child gets into trouble, I say that I am the one to blame.
n. I am concerned that my children will try alcohol before they reach 18.
o. I am doing everything I can to keep alcohol away from my children.
p. When my children become teenagers, I will not have any influence on whether they drink alcohol or not.

Pennsylvania DUI Association Underage Drinking PSA Campaign Evaluation
Report and Recommendations, September 2007 Page 63 of 76
N. In the past few months, have you seen or heard anything about the dangers of alcohol in any of the
following ways?
In the past few months… No
Yes
Don’t remember
1 2 3
a. Did you see a message on TV about alcohol?
b. Did you hear a message on the radio about alcohol?
c. Did something happen in the news that made you think about how dangerous alcohol could be?
d. Did someone you know get injured because of a drunk driver?
e. Did someone you know misbehave after drinking alcohol?
f. Did any of your children ask you a question about the dangers of alcohol?
g. Did the children of someone you know get into trouble because of alcohol?
O. What county do you live in? ___________________________________ P. What is your email address? ___________________________________
Thank you very much for helping with this survey!

Pennsylvania DUI Association Underage Drinking PSA Campaign Evaluation
Report and Recommendations, September 2007 Page 64 of 76
Appendix E: Parent Survey (Spanish) A. ¿Cuantos hijos tiene usted en los siguientes grados? ( Incluya los hijos que vivan con usted la
mayoría del tiempo)
_____ 6to Grado
_____ 8vo Grado
_____ 10mo Grado
Para su contestación a las siguientes preguntas, por favor tenga en mente los hijos que estén en los grados sexto, octavo y décimo. Refierase a los pasados seis meses en que asistieron la escuela. B. ¿Que tan satisfecho ha estado usted con la calidad de educación que su hijo (s) recibe en la escuela.
Conteste solo por su hijo en:
6to Grado
8voGrado
10mo Grado
Muy satisfecho
Algo satisfecho
No muy satisfecho
Nada satisfecho

Pennsylvania DUI Association Underage Drinking PSA Campaign Evaluation
Report and Recommendations, September 2007 Page 65 of 76
C. ¿Que tan bien conoce usted a los maestros de sus hijos? Conteste solo por su hijo en: 6to Grado 8vo Grado 10mo Grado Muy bien
Bastante bien
No muy bien
No los conozco
D. ¿Que tan amenudo sus hijos participan en actividades despues de la escuela, por ejemplo ( banda,
clubes, deportes, grupos de oración?
Consteste solo por su hijo en: 6to Grado 8vo Grado 10mo Grado Muy amenudo Bastante amenudo No muy amenudo Nunca
E. ¿Que tan segura usted cree que es la escuela?
Conteste solo por su hijo en: 6to Grado 8vo Grado 10mo Grado Muy segura Algo segura No muy segura Peligrosa No es segura
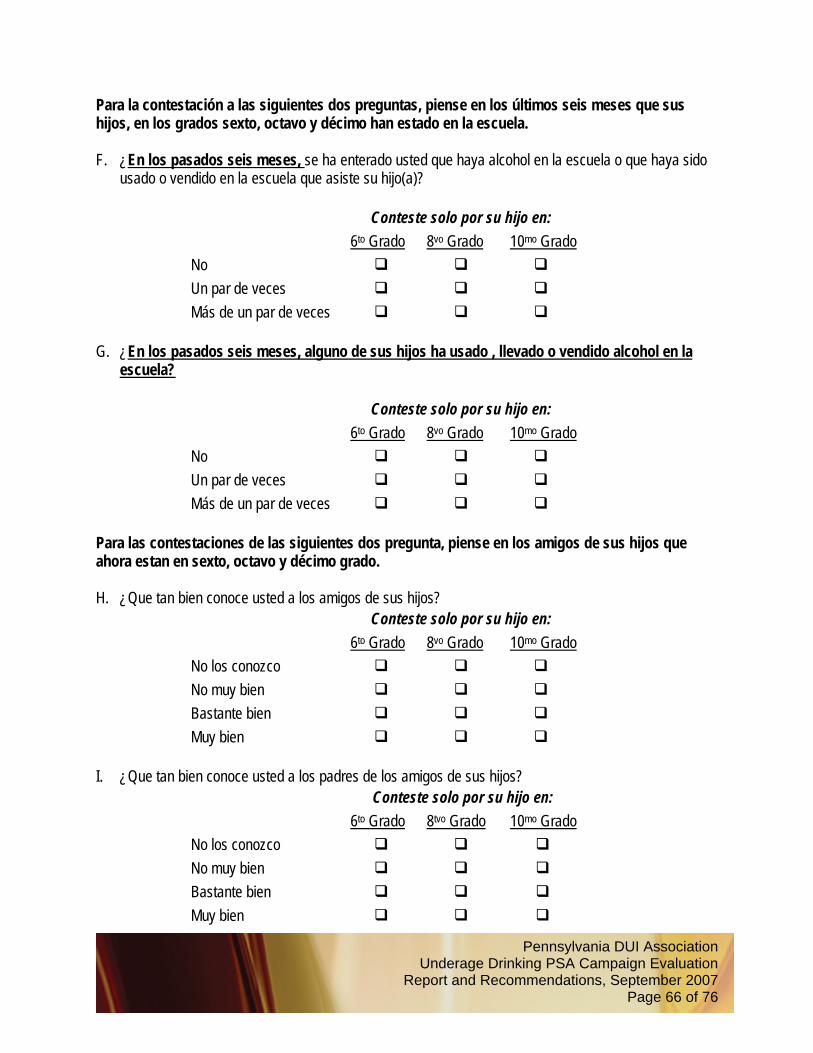
Pennsylvania DUI Association Underage Drinking PSA Campaign Evaluation
Report and Recommendations, September 2007 Page 66 of 76
Para la contestación a las siguientes dos preguntas, piense en los últimos seis meses que sus hijos, en los grados sexto, octavo y décimo han estado en la escuela. F. ¿En los pasados seis meses, se ha enterado usted que haya alcohol en la escuela o que haya sido
usado o vendido en la escuela que asiste su hijo(a)?
Conteste solo por su hijo en: 6to Grado 8vo Grado 10mo Grado No Un par de veces Más de un par de veces
G. ¿En los pasados seis meses, alguno de sus hijos ha usado , llevado o vendido alcohol en la
escuela?
Conteste solo por su hijo en: 6to Grado 8vo Grado 10mo Grado No Un par de veces Más de un par de veces
Para las contestaciones de las siguientes dos pregunta, piense en los amigos de sus hijos que ahora estan en sexto, octavo y décimo grado. H. ¿Que tan bien conoce usted a los amigos de sus hijos?
Conteste solo por su hijo en: 6to Grado 8vo Grado 10mo Grado No los conozco No muy bien Bastante bien Muy bien
I. ¿Que tan bien conoce usted a los padres de los amigos de sus hijos?
Conteste solo por su hijo en: 6to Grado 8tvo Grado 10mo Grado No los conozco No muy bien Bastante bien Muy bien

Pennsylvania DUI Association Underage Drinking PSA Campaign Evaluation
Report and Recommendations, September 2007 Page 67 of 76
Para la siguiente pregunta , piense en el vecindario que usted vive J. ¿Cual de las siguientes frases describen major a su vecindario?
¿Son los siquientes como su vecindario? Nunca A veces Siempre 1 3 3
i. Personas que veo en la calle me conocen. j. Si necesito alguna ayuda, o a alguien con quien discutir algo
importante, puedo encontrar ayuda.
k. Persona tienen discusiones a alta voz en la calle.
l. El vecindario tiene cosas divertidas para los ninos hacer.
m. Es una area segura para vivir.
n. Las personas se ayudan unas a otras en el vecindario.
o. Personas hablan de querer salirse de este vecindario. p. Hay personas en este vecindario que pueden meter a mi hijo(a)
en problemas. Para contester las siguientes pregruntas, piense en cualquiera de sus hijos que estan en los grados de sexto y decimo. K. ¿Que tan fácil o difícil usted cree que es para su hijo(a) obtener cerveza, vino or licor en su casa sin
usted saber?
0 No hay alcohol en mi casa 1 Muy difícil 2 Díficil 3 No estoy seguro 4 Fácil 5 Muy fácil

Pennsylvania DUI Association Underage Drinking PSA Campaign Evaluation
Report and Recommendations, September 2007 Page 68 of 76
L. ¿Que tan fácil o difícil usted cree que seria para un hijo (a) suyo hacer lo siguiente
Muy Difícil
Difícil
No estoy seguro
Fácil
Muy Fácil
1 2 3 4 5
g. ¿Tener una fiesta en su casa sin su permiso?
h. ¿Tomar bebidas alcohólicas con un grupo de sus amigos(as)?
i. ¿Asistir a una fiesta o club de baile sin su conocimiento?
j. ¿Pedir a una persona mayor que ellos, que conocen, les compre bebidas alcoh”olicas?
k. ¿Pedir a una persona mayor que ellos, que no conozcan, les compre bebidas alcohólicas.
l. ¿Robar bebidas alcohólicas de algun otro sitio que no sea su casa?

Pennsylvania DUI Association Underage Drinking PSA Campaign Evaluation
Report and Recommendations, September 2007 Page 69 of 76
Piense en las cosas que usted hace y piensa como padres. Cuantas de las siguientes frases lo describen mejor a usted.
¿Es esto como usted? Nada como
yo
Un
poco como
yo
A veces como yo, a veces
no
Mucho como
yo
Exactamente como
yo 1 2 3 4 5
q. Soy muy claro con respecto a las reglas en mi familia.
r. A veces tengo discusiones com miembros de mis familia.
s. Yo les dejo saber a mis hijos (as) que pueden hablar honestamente conmigo.
t. Yo les digo a mis hijos(as) que estoy orgullozo(a) cuando hacen algo bien.
u. Yo se cuando mis hijos están o no están en la casa.
v. La religión es muy importante en la vida de mi familia.
w. Yo creo que esta bien dejar a los adolecentes tomar un trago en casa cuando yo estoy en la casa.
x. Estoy seguro de que ninguno de mis hijos ha tomado alcohol en mi casa en mi ausencia.
y. Cuando mis hijos tienen problemas, ellos lo discuten conmigo.
z. Yo dejo que mis hijos tengan fiestas en la casa cuando yo no estoy.
aa. Mi horario es tan ocupado que no me permite pasar mucho tiempo con mis hijos.
bb. Yo hablo con mis hijos sobre lo malo que es beber bebidas alcohólicas.
cc. Cuando mi hijo se mete en problemas, yo soy el culpable.
dd. Estoy preocupado que mi hijo va a probar bebidas alcohólicas antes de que cumpla 18.
ee. Yo estoy hacienda todo lo posible para mantener a mis hijos alejados de las bebidas alcohólicas.
ff. Cuando mis hijos sean adolecentes, no voy a influenciarlos con respecto a que beban o no bebidas alcohólicas.

Pennsylvania DUI Association Underage Drinking PSA Campaign Evaluation
Report and Recommendations, September 2007 Page 70 of 76
M. En los pasados meses, ha usted oido o visto algo sobre los peligros del alcohol en algunos de estos
medios.
En los pasados meses … No
Si
No recuerdo
1 2 3
h. ¿Ha visto algun mensaje en la televisión con respecto a bebidas alcohólicas.
i. ¿Ha oido algun mensaje con respecto a bebidas alcohólicas en la radio?
j. ¿Ha pasado algo en las noticias que lo ha hecho pensar a usted en lo peligroso que pueden ser las bebidas alcohólicas?
k. ¿Alguien que usted conozca ha sido herido por un conductor borracho?
l. ¿Alguien conocido no se ha comportado debidamente despues de tomar alcohol?
m. ¿Alguno de sus hijos le ha preguntado sobre los peligros del alcohol?
n. ¿Algun hijo de un conocido suyo ha estado en problemas por causa del alcohol?
Gracias por ayudar en esta encuesta!

Pennsylvania DUI Association Underage Drinking PSA Campaign Evaluation
Report and Recommendations, September 2007 Page 71 of 76
Appendix F: Youth Survey A. Here is a list of things that some people may do very often and other people may not do at all. How
often in the past 6 months have you done each of the following things?
How often in the past 6 months did you… Not at
all Once
or twice A few times
Several times
Very often
1 2 3 4 5
a. Play on a sports team?
b. Volunteer to help someone in your community?
c. Work for pay near your neighborhood or school?
d. Go to a religious service?
e. Move to a home in a different neighborhood? f. Take part in an after-school activity, like a club, band,
scout troop, 4-H, church group, etc. ? B. Think about the things that you do and feel while you are in school. How much does each of the
following statements describe you?
Does this describe you? Not at
all
A little
Sometimes, sometimes
not
A lot
Exactly 1 2 3 4 5
a. I try to do well in school.
b. My teachers encourage me to do well.
c. School is a place where I get into trouble.
d. I try to find ways to avoid going to school.
e. I don’t feel like I am accepted when I am at school.

Pennsylvania DUI Association Underage Drinking PSA Campaign Evaluation
Report and Recommendations, September 2007 Page 72 of 76
C. Think about the things that you do and feel while you are at home. How much does each of the following statements describe your family?
Does this describe your family?
Not at all
A little
Sometimes, sometimes
not
A lot
Exactly 1 2 3 4 5
gg. I get into arguments with family members. hh. I feel that I can speak honestly with family
members. ii. My family members do not give me credit when I
do something right. jj. There is at least one adult in my family who wants
to know where I go and what I do when I am not at home.
kk. I do things with my family. D. Think about the neighborhood where you now live. How much does each of the following statements
describe your neighborhood?
Not at all Sometimes Very much 1 3 4
q. People that I meet on the street know me. r. If I would need help, or an adult to talk to about something
important, I can find help here.
s. People get into loud arguments on the streets.
t. This neighborhood has things that are fun to do.
u. This is a safe place to live.
v. People in this neighborhood help each other.

Pennsylvania DUI Association Underage Drinking PSA Campaign Evaluation
Report and Recommendations, September 2007 Page 73 of 76
E. Think about your parents or guardian. (If your parents live in separate homes, think about the one you
are living with now). How much does each of the following statements describe parents or guardians who are like yours?
Not at
all Probably
not Yes,
probably Yes,
definitely 1 2 3 4
a. They are very clear on the rules. b. They don’t mind if I have friends over when there is no adult
at home.
c. If I drank alcohol, they would say that was wrong. d. They think it is important to talk with my teachers about how
I am doing in school.
e. They drink a lot of alcohol when they are at home. f. They think it is important to know who my friends are and
what I do with them. F. Here is a list of things that some people may do very often and other people may not do at all. How
often in the past 6 months have you done each of the following things?
How many times in the past 6 months did you… Not at
all
Once
or twice
3-6
times
7-9
times
10 times
or more 1 2 3 4 5
a. Go on a date or to a party?
b. Go to a sports event or music concert? c. Hang around at home with your friends when your
parents were not there? d. Hang around at someone else’s home with your
friends when there were no adults there?
e. Ride around at night with friends in a car? f. Hang out with friends at night at an outside area, such
as a park, parking lot, or street corner?

Pennsylvania DUI Association Underage Drinking PSA Campaign Evaluation
Report and Recommendations, September 2007 Page 74 of 76
G. During those times when you did each of the following activities in the past 6 months, how often did
you drink alcoholic beverages?
How often in the past 6 months did you drink alcohol when you…
None (or
never did it)
Less than half the time
About half the
time
Most of the time
Every time
1 2 3 4 5
a. Went on a date or to a party?
b. Went to a music concert or sports event? c. Hung around at home with your friends when
your parents were not there? d. Hung around at someone else’s home with your
friends when there were no adults there?
e. Rode around at night with friends in a car? f. Hung out with friends at night at an outside area,
such as a park, parking lot, or street corner? H. Have you ever had a whole drink (not just a sip or taste) of beer, wine, wine cooler, liquor (vodka, gin,
whiskey, etc.) or mixed drinks made with liquor?
Please check one box and then follow the direction next to it.
NO Skip to Question J. at the top of page 5 YES Continue to answer questions below
I. In the past 6 months, how many times did you each of the following?
Not at all A few times
Once or twice a month
Several times a month
Several times a week
1 2 3 4 5
a. Drive a car, truck or motorcycle within one hour after having one or more drinks of any alcoholic beverage?
b. Have 5 or more whole drinks in a row?
c. Feel drunk?

Pennsylvania DUI Association Underage Drinking PSA Campaign Evaluation
Report and Recommendations, September 2007 Page 75 of 76
J. If you wanted to, how easy or difficult do you think it would be for you to get alcoholic beverages from
home without your parents knowing it?
0 There is no alcohol in my home 1 Very difficult 2 Difficult 3 Not sure 4 Easy 5 Very easy
K. If you wanted to, how easy or difficult do you think it would be for you to do each of the following:
Very Difficult
Difficult
Not sure
Easy
Very Easy
1 2 3 4 5
m. Get a family member or friend to buy alcoholic beverages for you?
n. Get an older person that you don’t know to buy alcoholic beverages for you?
o. Steal alcoholic beverages from some place other than your home?
L. If you could get away with doing any of the following, do you think you would feel that it is wrong to do?
Would this be wrong for you to do? No, not at all
Probably not
Not sure
Yes, probably
Yes, definitely
1 2 3 4 5
a. Ask someone to buy alcoholic beverages for you?
b. Ride in a car or truck with someone who has had an alcoholic drink?
c. Drive a car or truck after having an alcoholic drink?
d. Drink alcoholic beverages with your friends?
e. Have several drinks in a row?

Pennsylvania DUI Association Underage Drinking PSA Campaign Evaluation
Report and Recommendations, September 2007 Page 76 of 76
M. If you ever did any of the following, do you think it would be harmful to you?
Would this be harmful for you to do? No, not at all
Probably not
Not sure
Yes, probably
Yes, definitely
1 2 3 4 5
a. Drink alcoholic beverages that you have asked someone to buy or get for you?
b. Ride in a car or truck with someone who has had an alcoholic drink?
c. Drive a car or truck after having an alcoholic drink?
d. Drink alcoholic beverages with your friends?
e. Have several drinks in a row?
N. In the past few months, have you seen or heard anything about the dangers of alcohol in any of the
following ways?
In the past few months… No
Yes
Don’t remember
1 2 3
o. Did a parent or guardian talk to you about the dangers of alcohol?
p. Did you see a message on TV about alcohol?
q. Did you hear a message on the radio about alcohol?
r. Did something happen in the news that made you think about how dangerous alcohol could be?
s. Did someone you know get injured because of a drunk driver?
t. Did you see a poster, print advertisement, or printed sheet of paper with a message about the dangers of alcohol?
O. What grade are you in?
6th Grade 8th Grade 10th Grade P. What county in Pennsylvania do you live in? ___________________________________ Q. What is your email address? ___________________________________
Thank you very much for helping with this survey!