pennsylvania fish & boat commission business … fish & boat commission business analysis...
TRANSCRIPT

Pennsylvania Fish & Boat Commission
Business Analysis
The Pennsylvania State UniversityEcosystem Science & Management
College of Agricultural Sciences
July 1, 2017

Penn State- PA Fish and Boat Commission Business Analysis 1
Pennsylvania Fish & Boat Commission
Business Analysis
Conducted by:
Professor Judd Michael
Ecosystem Science & Management
College of Agricultural Sciences
Ryan Laudermilch, MBA
Graduate Assistant
Smeal College of Business
211 Forest Resources Building
Ecosystem Science & Management
Penn State University
University Park, PA 16802
814 863 2976

Penn State- PA Fish and Boat Commission Business Analysis 2
Table of Contents
Executive Summary ...................................................................................................................................... 5
I. Background ................................................................................................................................................ 7
Introduction to Project .............................................................................................................................. 7
Format of Report ....................................................................................................................................... 7
II. General Agency Description .................................................................................................................... 8
III. Observations about PFBC ....................................................................................................................... 9
Strengths and Weaknesses ........................................................................................................................ 9
PFBC Core Strengths .......................................................................................................................... 10
Secondary Strengths ............................................................................................................................ 11
PFBC Weaknesses .............................................................................................................................. 11
Long-term Strategy Challenges .............................................................................................................. 13
Value Chain Analysis ............................................................................................................................. 14
Impacts of License Price Scenarios ........................................................................................................ 15
Angler Reactions to Price Increases ........................................................................................................ 17
IV. Trends Impacting PFBC ....................................................................................................................... 21
Trend 1. Urbanization ............................................................................................................................. 21
Trend 2. Increased Competition for Recreational Time .......................................................................... 22
Trend 3. National Participation Trends in Outdoor Recreation .............................................................. 23
Trend 4. Customer Digital Engagement and Social Media ..................................................................... 23
Trend 5. Retail Disruption ...................................................................................................................... 23
Trend 6. Organizational Transparency .................................................................................................... 24
Trend 7. Increasing popularity of unpowered boating ........................................................................... 25
V. Managing Expenses ............................................................................................................................... 26
Opportunities for Expense Reduction ..................................................................................................... 26
Reductions in Fish Production ............................................................................................................ 26
Production Planning ................................................................................................................................ 27
Changes in Angler Behavior ............................................................................................................... 28
Other Expense Reduction Opportunities: Outsourcing ........................................................................... 29
Combine Fish and Boat Funds ................................................................................................................ 29
VI. Revenue Generation .............................................................................................................................. 30

Penn State- PA Fish and Boat Commission Business Analysis 3
New Licensing Options ........................................................................................................................... 30
Optional Conservation Stamps ............................................................................................................... 31
Additional Means of Revenue Generation .............................................................................................. 32
The Need for More Marketing Efforts .................................................................................................... 35
VII. Marketing Enhancement ...................................................................................................................... 36
Current Role of Outreach, Education, and Marketing ............................................................................ 36
Marketing Strengths and Weaknesses ..................................................................................................... 37
Suggestions for PFBC’s Marketing Program .......................................................................................... 38
Better Market Segmentation ............................................................................................................... 38
Raising the Brand Equity for PFBC .................................................................................................... 39
Establish Commission Branding Guidelines ....................................................................................... 40
Messaging: Build Expectations around Experience, Not Outcomes ................................................... 42
Include Engagement Opportunities in All Agency Communications ................................................. 44
E-Commerce Strategies .......................................................................................................................... 45
Email Reactivation Campaigns ........................................................................................................... 45
Insight Generation ............................................................................................................................... 46
Online License Sales Capabilities ....................................................................................................... 47
Other E-commerce Tactics.................................................................................................................. 49
Search Engine Optimization ............................................................................................................... 51
Social Media Strategy Formulation and Execution ................................................................................ 53
PFBC Social Media Strategy .............................................................................................................. 56
Leadership’s role in Social Media ...................................................................................................... 58
IX. General Suggestions ............................................................................................................................. 59
Multi-Year License Sales ........................................................................................................................ 59
Multi-year License Recommendations ............................................................................................... 61
New Private Boat Fishing Licenses ........................................................................................................ 62
Threats to PFBC Business Model ....................................................................................................... 62
Pricing Strategy for Private Boat Fishing Licenses ............................................................................ 63
Product Management Practices ............................................................................................................... 65
Women & Youth Angling ....................................................................................................................... 66
Scaling PFBC Outreach and Education .................................................................................................. 67
First Catch Center Pilot Program ........................................................................................................ 68
Continue to Simplify Fishing Regulations .............................................................................................. 69

Penn State- PA Fish and Boat Commission Business Analysis 4
Management and Organization ............................................................................................................... 69
Strategic Investments .............................................................................................................................. 70
Data Analysis Capabilities ...................................................................................................................... 71
Emphasis on Boating .............................................................................................................................. 71
Stakeholder Influence ............................................................................................................................. 72
RBFF “60 in 60” Campaign as Stakeholder ................................................................................... 73
Responding to Trends ............................................................................................................................. 74
Trend 1. Urbanization ......................................................................................................................... 74
Trend 2. Increased Competition for Recreational Time ...................................................................... 75
Trend 3. National Participation Trends in Outdoor Recreation .......................................................... 75
Trend 4. Customer Digital Engagement and Social Media ................................................................. 76
Trend 5. Retail disruption .................................................................................................................. 76
Trend 6. Organizational Transparency ................................................................................................ 77
Trend 7. Increasing popularity of unpowered boating ....................................................................... 77
X. Strategic Planning .................................................................................................................................. 79
Future Strategic Goals ............................................................................................................................. 80
Suggestions from SWOT Analysis ..................................................................................................... 82
XI. Concluding Thoughts ............................................................................................................................ 84
References ................................................................................................................................................... 85
About the Authors ....................................................................................................................................... 85
Acknowledgements ................................................................................................................................. 85

Penn State- PA Fish and Boat Commission Business Analysis 5
Executive Summary
The Pennsylvania Fish and Boat Commission contracted with Penn State to analyze PFBC
operations, the competitive environment for its products and services, and trends impacting its
ability to meet current and future objectives. We were asked to write a “business plan”
document that could help leadership prepare for the next strategic planning cycle.
We observed that the agency is well run with a dedicated staff who have expertise in their focal
areas and care about their constituents. However, staff are oftentimes limited in their abilities to
achieve objectives due to availability of funds. The agency faces more than $100million in
infrastructure needs while encountering financial headwinds in the form of increasing mandated
expenditures and declining revenue streams. Leadership currently maintains a reserve fund of
monies but that balance is in danger of being depleted.
Threats facing the agency include changing demographics and leisure time activities, current and
future obligations being projected to overcome annual revenues, and general difficulty in being
able to “change” the organization due to external stakeholders. Taken together all these trends
form a significant hurdle blocking PFBC from achieving long term economic sustainability.
We examined opportunities for expense reduction within the agency and found the following:
Most of the easily-achieved expense reduction opportunities have already been identified
and many have been put in place.
External forces such as stakeholders constrain PFBC’s ability to go after larger cost-
reduction strategies.
Internal factors like mandated and fixed expenses also constrain the ability to
significantly cut costs.
Specific options for cutting expenses include:
o Cutting back on fish production appears to be possible and warranted as a cost
cutting measure.
o Reducing number of hatcheries.
o Outsourcing of various functions.
o Improved production planning related to fish production and stocking.
We also looked for opportunities to increase revenue generation and discuss the following:
New and revised licensing options.
Capturing more revenue from unlicensed anglers and boaters.
Obtaining revenue from a consumptive water use fee.
Mandatory unpowered boat licenses.
Penn State- PA Fish and Boat Commission Business Analysis 6
The marketing function within the agency is one that needs more emphasis since it should be
seen as the main driver of increased revenues. We discuss marketing needs from multiple fronts,
with an overall suggestion that increased investment will be necessary to counter trends that
would otherwise reduce revenues. Marketing-related recommendations for the agency include
improved branding guidelines and messaging, with more engagement opportunities for all PFBC
communications, and an emphasis on female anglers and those in urban areas. Proper use of
social media could play a major role in marketing efforts.
E-commerce strategies should be more focused, with an emphasis on such areas as email
reactivation campaigns, insight generation, and better on-line sales capabilities. Related areas of
discussion include:
Digital licenses that can be emailed to anglers.
Obtain more emails from customers.
Improve cross-selling with the on-line platform.
Use search engine optimization techniques to create “buzz” around PA fishing and
boating.
Other general suggestions for the agency include:
New methods of engaging channel members such as retailer partners.
Improved project management techniques.
Scaling Outreach and Marketing to reach under-served and non-traditional populations.
Take advantage of favorable trends such as more unpowered boating.
Simplify fishing regulations and communicate those to customers.
Manage stakeholder influence on the agency.
Improve data analysis capabilities, especially as it relates to knowledge about the
customer.
Improve management of the organization with specific emphasis on business-related
functions.
Clarify roles of the Commissioners and educate them about their governance functions.
The Fish and Boat Commission provides a plethora of opportunities and benefits to the
Commonwealth and its citizens. The agency depends primarily on license and fee revenue to
provide these “common goods”, many of which are not reimbursed or directly paid for. This
business model has worked in the past but is at risk given the many factors impacting revenues
and expenses. We urge the agency to make the difficult decisions and changes necessary in
order to maintain its role as a conservation and recreation leader.

Penn State- PA Fish and Boat Commission Business Analysis 7
I. Background
Introduction to Project
The Pennsylvania Fish and Boat Commission (PFBC) is faced with multiple challenges that
threaten its ability to continue providing services to anglers, boaters, and other stakeholders of
the Commonwealth’s waterways. Trends in demographics and free-time leisure activities
coincide with changes in cost structures to create a situation in which fee-derived revenues are
decreasing while mandatory costs are increasing. PFBC leadership has recognized that revenues
are insufficient to support current levels of programs and services; this situation will presumably
require an increase in revenues or a decrease in costs, or some combination of both.
The PFBC Board of Commissioners has suggested that the Commission continue providing a
static (or even increasing) level of goods and services even in the face of what would appear to
be a declining customer base. Such a strategy would seem to be very difficult to achieve for a
for-profit business, and may also be impossible for a state agency. The challenges of making this
strategy work if the agency is constrained by an inability to raise prices or decrease operational
costs create an even bigger hurdle.
Many of the Commission’s key stakeholders may not fully understand the business-related
challenges currently faced by PFBC, and that these challenges may make it nearly impossible for
leadership to move the agency forward in a sustainable manner. The Commission’s Executive
Director has recognized this situation and asked Penn State to analyze the PFBC business plan
with an eye toward informing the new strategic plan.
Director Arway has stated “responsiveness is key to any business – in our case, a government
business”. With that need in mind PFBC began working with professors and MBA students
from Penn State to help develop a business plan that will inform decision-making and the
development of the agency’s next strategic plan. An overarching goal is to help the agency
identify ways to minimize costs and increase revenues by applying concepts that might seem
foreign to a state agency but which are, he believes, necessary to improve the responsiveness of
PFBC on behalf of its customers.
Format of Report
This report begins with a general overview and description of the agency as seen through the lens
of outside observers. We discuss trends that are impacting the agency and detail our key
observations about the Commission. We then transition into the sections in which we provide
additional observations and suggestions related primarily to expense reduction and revenue
enhancement. Finally, we provide recommendations that will dovetail with the Commission’s
new strategy plan.

Penn State- PA Fish and Boat Commission Business Analysis 8
II. General Agency Description
Mission
The Pennsylvania Fish and Boat Commission’s mission is to protect, conserve and enhance the
Commonwealth’s aquatic resources and provide fishing and boating opportunities. The mission
reflects its statutory responsibilities in section 321 of the Fish and Boat Code, 30 Pa. C.S. §321,
relating to:
- The encouragement, promotion and development of fishery interests.
- The protection, propagation and distribution of fish.
- The management of boating and the operation of boats.
- The encouragement, promotion and development of recreational boating.
Vision
By 2017, the Pennsylvania Fish & Boat Commission will provide high quality services to insure
essential resource management and protection and improved fishing and boating recreation;
engage targeted audiences in safe fishing and boating; and maintain and improve the agency’s
workforce and physical infrastructure.
Values
The Commission’s values are its guiding principles. These statements outline the behaviors that
are expected of all employees, Commissioners, Boating Advisory Board members, and
volunteers. Evident in its daily decision-making, the values impact every aspect of the
organization:
- … committed to prudently managing the Commonwealth’s aquatic resources.
- … committed to providing high quality public service.
- … committed to being wise stewards of the assets entrusted to us.
- … committed to creating a positive and cooperative work environment where staff are
given the opportunity to develop their expertise and ideas are openly exchanged,
acknowledged, and respected.
Penn State- PA Fish and Boat Commission Business Analysis 9
III. Observations about PFBC
The current business environment faced by PFBC could be termed “challenging”. Not only are
demographic and societal changes having negative impacts on opportunities for revenue
generation but required expenses are increasing and the agency lacks the ability to set prices for
its products. Moreover, infrastructure deficiencies (i.e., boiler and roof repairs, high-hazard,
unsafe dams) and other projects (i.e., hatchery oxygen alarms, watercraft, access upgrades)
represent approximately $110million in outstanding needs for the agency.
Mandated expenses along with declining revenues have combined in recent years to create
financial pressures leading to staff cutbacks. Reductions in force have left the agency very
“lean” to the point that additional cuts in key staff positions will result in reduced services.
Strengths and Weaknesses
The figure below provides a framework for understanding the organization in the context of
crafting and implementing strategy. A SWOT analysis is a time-tested analytical tool to help
leaders manage their future. The purpose of the SWOT analysis is to provide information on
your strengths and weaknesses in relation to the opportunities and threats faced by the
organization.
Some experts believe an organization must understand its external and internal contexts so
management can develop a vision and a strategy that link the two. Only by weaving together an
understanding of the organization with your intended actions can you effectively develop a
future strategic plan. Given that a main purpose of this report is to feed into the agency’s next
strategic plan, it should be helpful for leadership to consider how this framework can assist in
strategic planning.

Penn State- PA Fish and Boat Commission Business Analysis 10
Figure 1. Outline for SWOT analyses
Strengths:
something we do well valuable know how assets (physical, human,
intangible) competitive capability attributes of organization alliances with partners
Weaknesses:
something we do poorly a disadvantage a deficiency in expertise or
competence lack of assets (physical, human,
intangible) missing capabilities
Opportunities:
best prospects for revenues competitive advantage where is the good match with
goods & services we have to offer
Threats:
new product/service offerings disrupting our business
demographics social trends internal and external forces
impacting operations
Our team put together a list of the primary strengths and weaknesses that we have seen in the
agency. Understanding the strengths and weaknesses of the organization is an important process
for leadership; this introductory look at the agency should help guide strategic planning and
future investments. Because the weaknesses are more relevant and valuable for the purposes of
this report we will concentrate more on them. We will remind readers that weaknesses are
generally considered as factors internal to the organization; opportunities and threats are external
and will be considered in latter sections of the report.
PFBC Core Strengths
Capable of producing large quantities of recreational fish
Waterway Conservation Officers to enforce laws and regulations
Operationally efficient in management of facilities, staff, and programs
Agency is currently able to maintain a “reserve fund” of monies to be used for contingencies

Penn State- PA Fish and Boat Commission Business Analysis 11
Secondary Strengths
Strong and capable leadership team
Functionally talented staff
Producing an excellent product in Pennsylvania fisheries and waterways
Key player in national organizations like AFWA and RBFF
PFBC Weaknesses
Financial/Economic
o Current and future obligations are becoming greater than projected annual
revenues
o Increasing fiscal realities have forced agency to request a license/fee increase
o Sustaining core operations while meeting rising retirement and health care
obligations will be difficult or impossible without an increase in revenue or
drastically lowered costs.
o Much of the low-hanging (expense) fruit has already been harvested, which
implies that the agency will be forced to make difficult decisions to achieve any
real savings
o Very difficult to monetize PFBC conservation efforts and their value to the
Commonwealth and citizens
o Very difficult to monetize large economic impacts of fishing and boating (i.e., tax
revenue generation) that currently accrue to the Commonwealth’s General Fund
o There is a general inability to account for actual costs of fish species and an
inability to assign costs to portions of the agency
o Reserve fund
Human Capital
o Full-time complement of employees has been systematically reduced – from 432
approved positions down to about 380 – and the agency cannot go any lower
without significant programmatic cuts that would seriously impact the services
provided
o Lack of funds prevents leadership from hiring staff that would be tasked to
increase revenue
o Insufficient WCO’s to adequately monitor violations and bring in revenue
o Difficult to incentivize employees to encourage them to reduce expenses or
increase revenues
o Employee morale in parts of the agency is low
o Lack of common purpose throughout workforce
o Lack of marketing/customer focus throughout agency

Penn State- PA Fish and Boat Commission Business Analysis 12
Management and Leadership
o Management hierarchy and who is responsible for key functions are not always
clear
o There is a lack of diversity among agency leadership, which is very evident in the
Commissioners
o Individual Commissioners have significantly different views related to agency
operations, outcomes, etc.
Strategic
o The Fish and Boat Commission is viewed by many stakeholders as similar to the
PA Game Commission
o Don’t always make investments “strategically”
o Leaders in upper and middle management need a more holistic view of
organization
o Political influence causes inflexibility
o Strategic, operational, marketing, etc. plans developed by agency seem not to be
followed
o Time frame for strategic planning is different than for production decisions
Production
o No tie-in between what is grown/stocked and what the customer demands
o Production planning is done too far into the future
o Production levels are based on what agency can make under permits
Especially true for trout volumes
o Outdated plant and equipment in some areas
Markets and Marketing1
o Demographic trends and customer preferences are moving against the agency and
there has been little to no success in countering these trends
o Lack strong cross-selling abilities between fishing licenses and boat registration
o Relationship with retailers/agents is not strong enough
o Retailers are not incentivized to sell PFBC products
The cost of selling multi-year licenses is not covered by the $1/license
agent fee
Multi-year licenses lack full licensing agent support for continued growth
o Insufficient focus on boating opportunities
o Insufficient marketing and outreach staff to meet goals (see related notation above
under Human Capital)
1 Note that other more specific strengths and weaknesses of Outreach & Marketing are discussed in section VII
below.

Penn State- PA Fish and Boat Commission Business Analysis 13
o Insufficient marketing budget to achieve goals
We would reinforce one other observation that was of minor concern to us: we read multiple
internal documents related to strategic planning, cost reduction plans, etc., that were being only
partially followed 2. Many organizations will expend time and money on crafting plans but the
plans end up collecting dust on a shelf. It is not clear to us why some of the plans were not
followed, or suggestions not put into place, but this should be perceived by management as a
weakness that needs to be addressed.
Long-term Strategy Challenges
One of our biggest concerns, and biggest threats to the agency, is related to the ability (or
inability) of agency leaders to be able to formulate a long-term strategy to ensure economic
sustainability of the organization.
Primary reasons for the inability to plan longer-term include:
o Influence of external stakeholders restraining change efforts
o Unknowns related to legislative approvals
These two factors alone severely restrict agency leadership from being able to estimate future
revenues or plan for expense reduction strategies.
With participation declining and expenses increasing, PFBC needs to develop long-term
strategies to ensure a sustainable future for the agency. We observed that the current challenges
have pressured the agency to formulate short-term “survival” strategies, which offer only 2-3
years of agency guidance. This is a sub-optimal way to plan for the future.
Assuming fishing and boating participation will continue to decline, fewer strategic options are
available to PFBC leaders. There is a strong desire to increase license prices, which indicates a
“harvest” strategy is being followed. According to Robert M. Grant in Contemporary Strategy
Analysis, a harvest strategy is deployed by organizations as to extract maximum revenue from a
dwindling market. Firms optimize profits before the market is reduced to a non-profitable size
and that line of business is terminated.
It seems obvious that the primary means to increase funding will be by extracting more money
from a population of fewer anglers. Because the agency is self-funding, it must use license
pricing for any short-term increase in funds; which in the long run leads to fewer anglers.3
2 Examples include: “Hatchery Cost Savings Work Group Report” 8/2011; “PFBC Fishing License Sales Marketing
Action Plan” 10/2013. 3 As noted elsewhere, boating trends are increasing and will offer opportunities for increased revenues, but the
boating side of the agency is traditionally much smaller than fishing.

Penn State- PA Fish and Boat Commission Business Analysis 14
Currently, there are no observable financial incentives for PFBC to increase the amount of time
people spend fishing. The act of purchasing a license is the only time the agency is rewarded
with funding. This situation creates conflicts both within the agency and with various
stakeholders who seek to force actions by the agency regardless of economic consequences.
To avoid being forced to execute a harvest strategy, all stakeholders should consider the full
value of each angler in Pennsylvania. This includes the economic benefits of angling in
Pennsylvania. One solution is funding PFBC with a portion of Pennsylvania sales tax on fishing
and boating equipment. Funding through sales taxes will incentivize PFBC to grow the number
of anglers in Pennsylvania and increase the time they spend pursuing related activities.
Value Chain Analysis
One of the first things we did was to analyze PFBC as a business; in doing this we considered the
values of PFBC’s activities much like a for-profit business would but with an eye toward
understanding the value that the agency and its constituents bring to the Commonwealth. Figure
2 below provides a visual to help readers understand the “value chain” created by fishing and
boating-related recreation in Pennsylvania.
Figure 2. Depiction of Value Chain for Fishing and Boating

Penn State- PA Fish and Boat Commission Business Analysis 15
Many of our conversations with PFBC staff included some discussion of the economic effects of
fishing, boating, and related outdoor recreation. According to the Outdoor Industry Association,
the total outdoor recreation economy generates $6.7 billion in state and local revenue for just
New York, New Jersey, and Pennsylvania. Based on a 2016 report by Southwick Associates,
each PA angler generates $54.38 in state and local tax revenue. The average angler in
Pennsylvania contributes just over $23 to PFBC activities. This indicates an imbalance in the
value chain in that the Commonwealth receives economic benefits that are derived from PFBC
efforts to increase fishing and boating participation.
As mentioned in the Long-term Strategy Challenges section above, the leaders of PFBC are
forced to make decisions that optimize their outcomes based on license sales alone. The
Commonwealth of Pennsylvania (meaning the General Fund), retailers, and anglers all benefit
from PFBC resources and investments that allow and encourage high rates of use. As people fish
and boat more in Pennsylvania, there is more consumption of related goods and services and thus
increased tax revenue into the General Fund. PFBC is charged with creating and maintaining
outdoor recreation opportunities that only provide a partial and sometimes indirect return on the
investment. If PFBC was a for-profit business then there would normally be a direct relationship
between achieving such goals and financial returns. However, we observe a disconnect between
agency efforts to create quality resources (e.g., waterways and fishery stocks) and high
participation rates by boaters and anglers, and the financial rewards received by the agency.
This is another weakness at the agency: as key performance indicators (KPIs) improve the value
generated by those activities should increase. The only KPI that impacts PFBC revenues is
license sales4. This creates the need to make nearsighted decisions that will eventually shrink the
agency’s customer base.
The leaders of PFBC are attempting to change the current legislation so that the agency can
capture (tax) revenue from equipment sales. This will help align the incentives of all players in
the fishing and boating value chain. Additionally, sales tax income naturally adjusts to the
consumer price index and inflation. This could eliminate or reduce the need for sharp license
price increases as seen in 1983, 1996, and 2005, and currently pending before the Legislature.
Impacts of License Price Scenarios
As previously stated, the number of anglers in Pennsylvania has stagnated since 1990. The base
license price has remained fixed at $21.00 since 2005 while the effects of inflation have
pressured PFBC to operate on shoe-string budgets and possibly make sub-optimal decisions. As
show in the figure below, discounting against inflation makes the purchasing power of $21.00
equivalent to $16.24 at the end of 2016. On average, the purchasing power from each license sale
decreased by 2.02% annually.
4 Injuries and fatalities, for example, are also a KPI for PFBC but are not related to revenues.

Penn State- PA Fish and Boat Commission Business Analysis 16
Figure 3. Longitudinal changes in purchasing power of licenses
Decisions on license prices must be made with a strategic vision. The last three major price
increases have led to significant decreases in license sales revealing price sensitivity among
Pennsylvania anglers. Therefore, PFBC must decide the agency’s tolerance for angler attrition
versus fee increases.
License price increases are generally controlled by Pennsylvania legislators. At this time PFBC
has proposed bills to gain control of setting license prices and fee structures. The three most
likely scenarios to come from these actions are: 1) legislators maintain control of license pricing
and allow increased prices, 2) legislators maintain control of license pricing and prices are not
increased, and 3) Legislators grant PFBC permission to increase license prices and PFBC
increases prices in 2018.
1) Legislators maintain control of license pricing and increase prices for 2018
Pennsylvania legislators are being asked to increase license prices for 2018 by 30% for
all licenses and 100% for senior lifetime licenses. The following years, fees will increase
3% annually. The Trout/Salmon Permit is also proposed to increase from $8 to $14.
Despite an anticipated drop of 7-10% in license sales, evidence suggests that revenues
will increase. PFBC will need to make decisions on how to best use the funds generated
by the price increase. With a decrease in anglers, demand for stocked fish will also

Penn State- PA Fish and Boat Commission Business Analysis 17
decrease. This will theoretically allow for more budget cuts through hatchery reductions.
The best use for the additional funds will need to be determined.
2) Legislators maintain control of license pricing and prices are not increased
If that status quo continues, fishing license prices will remain constant for the 2018
license year. Expenses are likely to increase over 2017 and the agency’s emergency fund
will be used to maintain operations and a somewhat constant level of programing. This
could lead to more severe budget cuts in the years to come and would pressure leadership
to find other means to increase revenues (e.g., increase license sales volume to women).
3) Legislators grant PFBC permission to increase license prices and PFBC increases
license prices in 2018.
If PFBC is granted control of license pricing, it is likely to be a temporary situation. A
three to five-year span with a large initial increase and incremental 3% increases in the
years to follow.
Angler Reactions to Price Increases
Between May 2016 and April 2017, our conversations with anglers, interest groups, biologists,
PFBC personnel, and retailers yielded a perceived lack of price sensitivity for current anglers.
Individuals who identified as anglers and regularly engage in the sport did not report license
prices being enough to prevent license purchases. The evidence, however, suggests that price
increases do lead to a decrease in sales volume.
Evidence related to the impacts of price decreases is equivocal, but two recent instances are
suggestive of what happens when the agency decreases prices. First, PFBC reduced license costs
by $1 in 2015 and saw no significant increase in sales (and this likely resulted in a net loss of
over $467,000 as per a Southwick analysis). Second, in the fall of 2016 we assisted agency
personnel in designing a program that would cut license prices in half during the latter portion of
the annual season. Long term impacts are still not known and may in fact be net positive, but
this large decrease in sales price did not cause a corresponding large increase in late-season sales
volume. Thus, we can suggest that reducing license prices is not an effective means for
increasing revenue to the agency.

Penn State- PA Fish and Boat Commission Business Analysis 18
Historical license price increases in 1983, 1996, and 2005 resulted in similar angler loss patterns
as seen in the table below. The percent of anglers lost was adjusted against the previous five-year
sales trend. Senior Lifetime anglers are not included in these sales figures because the purchase
nature of those anglers is extremely different than anglers that need to be retained. Additionally,
the resident annual license is used as the anchor point for pricing.
Table 1. Impacts of License Price Increases on Angler Participation and License Sales Revenue
Year of
Increase
Price
Increase
Expected Sales
without Increase
Actual
Licenses Sold
Estimated
Lost Sales
Percent
Anglers
Lost
License
Revenue
Change
2005 29% 879,137 810,788 68,349 -7.8% +$3,287,826
1996 35% 1,046,324 962,614 83,710 -8.0% +$2,868,752
1983 33% 1,142,808 1,035,649 107,159 -9.4% +$2,519,100
Because the range of price increases is narrow, it is assumed that price sensitivity has a linear
relationship. Based on these three data points, every 10% increase in license price will result in a
loss of 2.57% in total anglers. Based on a polynomial regression of angler totals between 1979

Penn State- PA Fish and Boat Commission Business Analysis 19
and 2016, the expected number of anglers in 2018 is 825,2745. This serves as the basis for the
revenue projections for changes in license fees. It is assumed that each license will continue to
generate $5 in revenue from Federal Excise Taxes.
Table 2. Revenue projections for various license price increases
Percent
Price
Increase
New
Price
Change in
Participation
License
Revenue
Federal
Excise Tax
Revenue
Total Fishing
Revenue
Additional
Revenue
0.00% $21.00 0.00% $17,330,755 $ 4,126,370 $21,457,126 $ -
10.00% $23.10 -2.57% $18,574,462 $ 4,020,446 $22,594,908 $ 1,137,782
20.00% $25.20 -5.13% $19,729,192 $ 3,914,522 $23,643,714 $ 2,186,588
30.00% $27.30 -7.70% $20,794,946 $ 3,808,598 $24,603,544 $ 3,146,418
50.00% $31.50 -12.84% $22,659,525 $ 3,596,750 $26,256,274 $ 4,799,149
75.00% $36.75 -19.25% $24,489,757 $ 3,331,940 $27,821,697 $ 6,364,571
100.00% $42.00 -25.67% $25,763,888 $ 3,067,130 $28,831,017 $ 7,373,892
132.87% $48.90 -34.11% $26,592,920 $ 2,718,906 $29,311,825 $ 7,854,700
Revenue is maximized at the license price of $48.90, adding $7.8 million for operating activities,
but the total number of anglers is decreased by 34%. However, we would note that the agency
has no historical reference with which to know what actually might happen to purchase rates if
prices are increased by more than 50% in a given year.
The above model illustrates the commitment of Pennsylvania anglers to fishing. While it is
possible for PFBC to optimize revenues with the above information, the agency is committed to
do what’s best for anglers and its many stakeholders. Price increases could make the acquisition
of new, price-sensitive anglers (e.g., those with low disposable income) more difficult and could
ultimately reduce participation to a small core of the most dedicated individuals.
The proposed license and permit fee increases are by our estimates predicted to generate $3.1
million in additional operational revenue for 2018 (Table 3). Incremental increases in license
price will help the agency combat price inflation until 2022. Not noted in this table is additional
revenue from the proposed 80% increase in the Trout/Salmon permit; this is estimated by PFBC
to be $2.8 million per year. PFBC’s estimates for net revenue increases in 2018 if all proposed
fees are increased equals approximately $6.18million.
5 This figure includes senior lifetime licenses

Penn State- PA Fish and Boat Commission Business Analysis 20
Table 3. Impacts of proposed general license fee increase on participation and revenues.
Year
Average
License
Price
Price
Increase
Expected
License
Sales
License Sales
Revenue
Federal Excise
Tax Revenue
Total
Revenue
Year-over-
Year
Revenue
Change
2017 (est) $23.80 0% 841,743 $20,033,483 $4,208,715 $24,242,198 --
2018 $30.94 30% 761,720 $23,567,605 $3,808,598 $27,376,203 $3,134,005
2019 $31.87 3% 755,854 $24,087,694 $3,779,268 $27,866,962 $490,759
2020 $32.82 3% 750,033 $24,619,260 $3,750,164 $28,369,424 $502,462
2021 $33.81 3% 744,257 $25,162,557 $3,721,284 $28,883,841 $514,417
2022 $34.82 3% 738,525 $25,717,843 $3,692,626 $29,410,469 $526,629
We would also note that Pennsylvania fishing license prices are currently similar to neighboring
states. Several of these states, including New Jersey, New York and Michigan, give significant
funding to their fishing and boating agency.
Table 4. General Fishing License Prices for Eastern States
For many of the eastern states, the environmental resources vary greatly between states. The
wildlife agencies of some neighboring states have anglers engaged in both saltwater and
freshwater fishing. Managing resources among the Great Lakes states and Canada also
complicates agency programing. Therefore, significant variances in resource characteristics and
cost structures complicate benchmarking across states.
Anglers are still likely to compare the most measurable difference for them; license prices. In
today’s connected world, comparing prices between products is easy and common. There is
likely to be a ripple effect in adjacent states for any state in the region that dramatically change
prices for general licenses.
Pennsylvania New Jersey New York Virginia Maryland Ohio West Virginia Michigan Indiana
General Fishing License 22.70$ 22.50$ 25.00$ 23.00$ 20.50$ 19.00$ 19.00$ 26.00$ 17.00$
Trout Stocking Fee 9.70$ N/A N/A 23.00$ 5.00$ N/A 10.00$ N/A 11.00$
Comparable State Fishing License Prices

Penn State- PA Fish and Boat Commission Business Analysis 21
IV. Trends Impacting PFBC
The following section discusses some of the major consumer and social trends that we perceive
are impacting the agency. Each of them is briefly described here, but in a latter section of the
report we will provide suggestions on how to mitigate or take advantage of each of the trends.
Readers should consider each of these trends in the context of either an opportunity or a threat.
We distinguished this section of the report from the SWOT analysis to ensure proper emphasis,
but these trends must be considered in a strategic sense given their capability to impact the
agency.
Trend 1. Urbanization
While rural Pennsylvania provides endless miles of waterways, the general population will
continue to move into cities where fewer outdoor recreation opportunities are present (or may be
perceived as unavailable or unappealing). The map below shows that many rural counties in
Pennsylvania are expected to experience population losses between 2017 and 2022. If the casual
angler is unwilling or unable to travel, PFBC will need to provide urban fishing and boating
opportunities if it is to take advantage of population shifts.
A trend that may be hidden inside a more urban population is that traditional outdoor activities
such as fishing are less likely to be considered “cool” or even socially acceptable to urbanites.
Youth are not taught anything about fishing or hunting in school (and fewer will engage in
Scouts, 4-H, etc.) and without a family member who fishes they are very unlikely to pick up the
sport on their own.

Penn State- PA Fish and Boat Commission Business Analysis 22
Figure 4. Map of estimated population growth from 2017-22 overlaid with 2016 fishing license
sales by zip code.
Trend 2. Increased Competition for Recreational Time
A related trend is that nearly all well-established recreational activities are being challenged by
new, niche sports, as well as by nontraditional recreation activities related to electronics, gaming,
etc. Team sports like baseball are seeing declines in youth participation. Major League Baseball,
for example, is anticipating a future lag in attendance as a direct result of this decrease. Fishing
and hunting are currently suffering from these declines in traditional, outdoor recreation
activities. PFBC and its national partners have been proactive in recruiting youth and women to
fishing as a way of reversing this trend but to date have not been effective on a large scale.
Sports and recreation are becoming increasingly segmented to suit the needs and desires of its
participants. Fishing may be no different. Today, anglers can define themselves as native trout
fishermen, kayak anglers, musky anglers, micro-fishing experts and more. Catering to the
specific wants and needs of all angling sub-groups may be an impossible feat for PFBC.

Penn State- PA Fish and Boat Commission Business Analysis 23
Trend 3. National Participation Trends in Outdoor Recreation
According to the Outdoor Industry Association, 48.6% of the United States population
participated in at least one outdoor activity in 2016. Across all outdoor activities, there was an
increase in total individuals participating, but the total number of outings decreased. The total
number of outings peaked in 2012 with 12.4 billion and decreased to 11 billion by 2016. For
sporting goods retailers and manufacturers this can lead to less consumption by participants,
especially for established activities like angling.
This trend may in part explain the steadily declining numbers of angler fishing days in
Pennsylvania. Southwick Associates analyzed data to show that Pennsylvania anglers reduced
the number of days fishing from approximately 17,000 in 2001 to around 8,000 in 2011. Over
the same period the number of fishing days per angler dropped from an average of 18 to 9.
Trend 4. Customer Digital Engagement and Social Media
No one can escape buzzwords like big data, disruptive technology, social media influencers, and
analytics. Businesses, non-profits, and the public sector are all competing for the time and
attention of potential customers. The digital space is crowded but a necessary place for
organizations to have a presence. The best marketers are involved in two-way communication
with the public. The one-way messages of traditional advertising are becoming less important
and, in some cases, damaging to brands. The rules of social media are rapidly evolving, which
can create a need to use social media specialists and marketing firms.
Consumers are obviously spending more of their time using “digital devices” and have for better
or worse incorporated those devices into their daily lives. Most people in the younger
generations use their smart phones for tasks ranging from communication to information
gathering to making payments. The organization that ignores these trends does so at its own
peril and we believe this holds for state-level natural resources agencies as well.
Trend 5. Retail Disruption
E-commerce continues to take market share from the brick-and-mortar retailers that PFBC relies
on for license distribution. This trend is directly related to the move of consumers toward e-
purchases instead of buying at an actual store location.
Pennsylvania anglers will want to purchase electronic licenses not only for the convenience, but
may also be forced to find new places to purchase licenses if corporate retail locations
consolidate or disappear from the landscape. In 2016, 6.7% of PFBC fishing license transactions
took place at either Kmart or Gander Mountain stores. Both retailers are closing stores as the
result of bankruptcy filings, which will mean that PFBC anglers will need to adjust their buying
habits. The license purchasing process will need to be constantly refined to adapt to changes in
retail distribution and customer expectations.
Penn State- PA Fish and Boat Commission Business Analysis 24
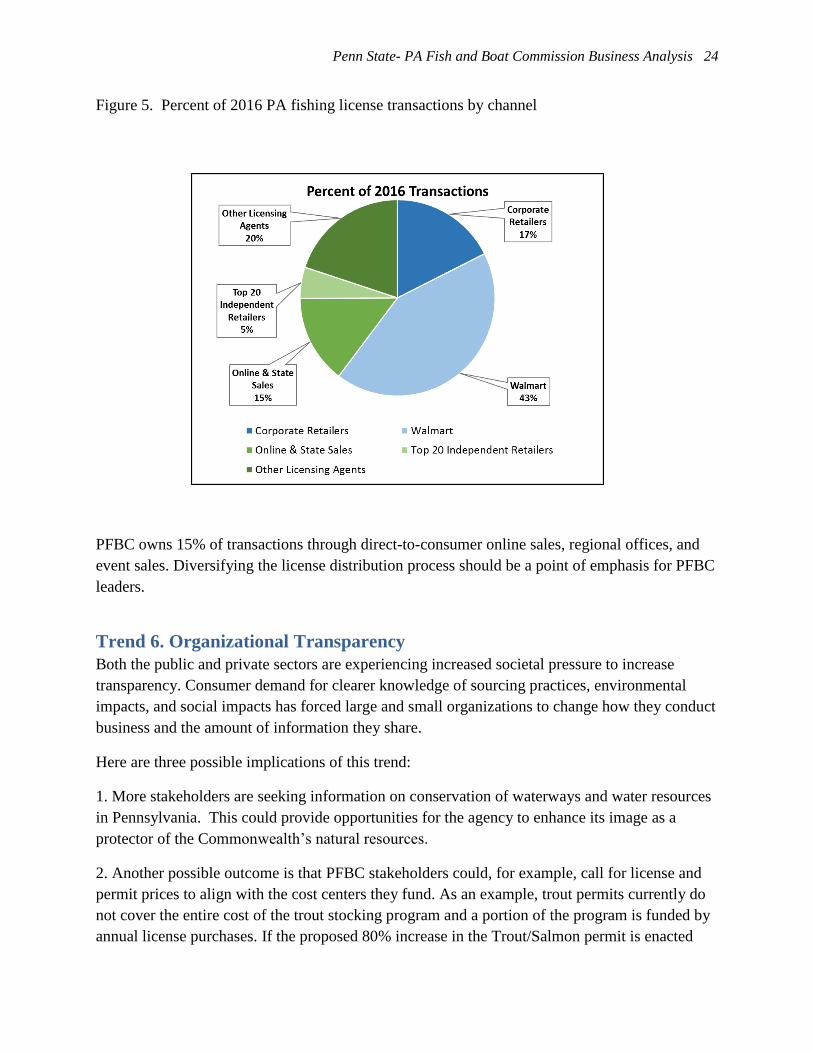
Figure 5. Percent of 2016 PA fishing license transactions by channel
PFBC owns 15% of transactions through direct-to-consumer online sales, regional offices, and
event sales. Diversifying the license distribution process should be a point of emphasis for PFBC
leaders.
Trend 6. Organizational Transparency
Both the public and private sectors are experiencing increased societal pressure to increase
transparency. Consumer demand for clearer knowledge of sourcing practices, environmental
impacts, and social impacts has forced large and small organizations to change how they conduct
business and the amount of information they share.
Here are three possible implications of this trend:
1. More stakeholders are seeking information on conservation of waterways and water resources
in Pennsylvania. This could provide opportunities for the agency to enhance its image as a
protector of the Commonwealth’s natural resources.
2. Another possible outcome is that PFBC stakeholders could, for example, call for license and
permit prices to align with the cost centers they fund. As an example, trout permits currently do
not cover the entire cost of the trout stocking program and a portion of the program is funded by
annual license purchases. If the proposed 80% increase in the Trout/Salmon permit is enacted

Penn State- PA Fish and Boat Commission Business Analysis 25
then in 2018 approximately 58% of trout hatchery costs would be borne by permit sales alone.
The 30% of anglers who don’t purchase a trout stamp may believe they are partially funding a
program that provides no benefit to them; this fact could become a point of contention for those
who do not fish for trout. Complete transparency of PFBC operations and finances may not have
been demanded yet by the casual angler or boater, but it is likely to become more of an issue in
the future, especially as the Commission seeks approval for fee increases.
3. Stakeholders such as politicians and Commissioners could feel the need for even more
oversight of the agency and its operations. The Legislative oversight is already a constraining
factor that limits the ability of PFBC leadership to make needed decisions ranging from fish
production to employment.
Trend 7. Increasing popularity of unpowered boating
The fifth annual Special Report on Paddlesports (2015) illustrated the increasing popularity of
human-powered boating as a recreation activity. This is a very positive trend that the agency
should take advantage of. There are several categories of unpowered boats that are rapidly
increasing in popularity and the agency should capture this potential revenue. Of note is that
kayaking and paddleboarding are seeing rapid increases in participation while canoeing has seen
small declines.
Kayak fishing is another rapidly growing segment that should be targeted by PFBC.
KayakFishing magazine did a survey in 2015 that showed kayak anglers are a relatively young,
male-dominated, well-educated and affluent market. They also appear to be more dedicated
anglers in terms of days spent fishing and retention rates.

Penn State- PA Fish and Boat Commission Business Analysis 26
V. Managing Expenses
All for-profit businesses must have control over their expenses. State natural resource agencies
are no different and in fact may have even more impetus to control costs given restrictions on
revenue generation. The following section will provide suggestions on how PFBC could reduce
operating expenses.
Cost reduction seems to have become a cultural standard across the agency. All bureaus have
been observed stretching funds, with examples like keeping equipment running as long as
possible. Small processes like customer mailings have been optimized by the Bureau of
Administration with the help of Commonwealth resources. Recent awards received by PFBC
were well earned by the agency and its employees for pursuing operational excellence.
Opportunities for Expense Reduction
We would make three main observations with respect to expense reductions:
1. As noted above, much of the easily-achieved expense reduction opportunities
have already been harvested, which implies that the Agency will be forced to go
after more challenging or “out of the box” areas to achieve impactful savings.
However, with a significant portion of agency expenditures being dedicated to
fish production, reducing fixed assets and personnel in the hatcheries could yield
significant savings for the agency.
2. External forces serve to constraint the agency’s ability to enact cut-backs that
would reduce expenses.
3. Internal factors such as employee contracts, mandated expenses, and fixed
expenses also constrain leadership’s ability to cut costs.
Reductions in Fish Production
Fish production, specifically cold water species, is dictated by the agency’s previous strategic
plan. The key assumption is that anglers take as many fish as will be produced. This long-
standing belief was likely established in previous generations when angler numbers were
increasing and the agency was growing. With fishing license revenues flattening and expenses
rising, lowering fish production appears to be a necessary step to keep the budget in alignment.
The main cost centers in fish production are fixed assets, personnel, and fish food. In business,
managers make programming decisions based on fixed (plant, property, and overhead) and
variable costs (material costs and personnel). At the PFBC hatcheries, personnel are allocated

Penn State- PA Fish and Boat Commission Business Analysis 27
like fixed costs, because their efforts will be reallocated to another program. Savings in fish food
are minimal in comparison to personnel and facility costs.
PFBC will incur hidden expenses when closing a hatchery. For trout specifically, the number of
stocking locations will need to be decreased and the number of stocked fish per location may
decrease. This would decrease transportation costs.
Hatchery closings will impact all stakeholders differently. This is a politically charged topic that
requires buy-in from anglers, sportsman interest groups, agency staff, commissioners, and state
politicians.
Production Planning
Executive Director Arway stated that the current stocking amounts are a result of historic
decisions to lift angler expectations in the state of Pennsylvania. The recreational fishing legacy
created by PFBC is one factor making changes in production difficult for the agency.
Production planning is largely guided by three beliefs held to varying degrees across all
stakeholders. First, is that Pennsylvania anglers will consume the maximum number of fish
stocked. Second, any declines in the biomass stocked by PFBC has a large, negative impact on
angling experience. Lastly, trophy fish are necessary for angler retention.
These beliefs guide the commission to fix production in strategic plans without variance. This
rigidity in production schedules locks a significant portion of the annual PFBC operating budget
into fish production activities.
Due to production being fixed, the Bureau of Fisheries directs the allocation of stocking
programs. It has been stated that Fisheries is becoming more strategic with its allocation models
so that fish are stocked where the people are. After allocations are made, the Bureau of
Hatcheries is responsible for executing the orders by producing the fish and distributing them to
their assigned locations. On the back end, marketing is asked to generate demand through public
relations, advertising, and outreach efforts.

Penn State- PA Fish and Boat Commission Business Analysis 28
Figure 6. PFBC demand planning process
In manufacturing industries, production is typically variable and is based on optimizing outputs
versus expected demand. Typically, marketing and sales professionals discuss goals before
production is scheduled, then manufacturing determines production amounts and executes the
plans. During this work flow, demand is simultaneously monitored and generated.
For PFBC this suggests that a means for changing production volumes should be the initial
consideration. One method of varying capacity is outsourcing fish production to commercial
hatcheries (or to co-ops) in short-term contracts.
The Bureau of Fisheries is currently constructing stocking models to ensure that stocked fish
have the greatest possible impact for anglers. It is recommended that the Bureau of Outreach,
Education, and Marketing works in conjunction with Fisheries to generate demand at select
locations prior to stocking. Promotional materials include press releases, signage, and owned
advertising channels like the fishandboat.com and the PFBC Facebook page.
Changes in Angler Behavior
A factor that should be considered in production (stocking) planning is how angler behavior has
changed over the past decade. It is apparent that more anglers are practicing “catch and release”
and this has implications for the number of fish that need to be stocked by the agency. If, for
example, a significant number of anglers are releasing fish then the data from the 2008 “trout
survey” report may no longer be accurate for production planning.
It may be the case that the catch and release rates have increased sufficiently that the agency
does not have to stock as many fish since anglers are effectively “stocking” the streams with fish

Penn State- PA Fish and Boat Commission Business Analysis 29
released after a catch. If this is true then any agency reductions in trout stocking levels would be
offset by anglers who are releasing fish for others to catch.
Other Expense Reduction Opportunities: Outsourcing
The Agency should take a hard look at its operations and consider all opportunities for
outsourcing. This builds on a recommendation by the Pennsylvania Legislative Budget and
Finance Committee for PFBC’s strategic plan “to focus more narrowly on core agency
functions.”
Below are just a few of the areas that should be considered:
a) Biological services – outsource stream surveys to non-government organizations, etc.
b) Marketing – hire advertising agencies to implement traditional and digital marketing
campaigns
c) Outreach and Education – increase outreach capabilities of boating and angling interest
groups with goal of reducing PFBC staffing needs and growing the number of workshops
available to targeted customer segments
d) Mailings – direct mail has benefits but is expensive; work with other government
agencies to utilize their systems and personnel
e) Fish Production – give more of this to co-ops
f) Fish Stocking – Consider outsourcing stocking truck ownership and associated driver
overhead. Low utilization of stocking trucks makes ownership inefficient.
Outsourcing is commonly used by corporations to reduce expenses and can be an effective
strategy if a partner with appropriate qualifications can be found.
Combine Fish and Boat Funds
Another option under consideration is to combine the agency’s Fish Fund and Boat Fund. This
could save financial and other resources by increasing efficiency and reducing redundancy in
tasks.

Penn State- PA Fish and Boat Commission Business Analysis 30
VI. Revenue Generation
The Fish and Boat Commission is a user-funded agency - meaning it receives no Pennsylvania
General Fund tax revenue to support its programs. The Commission operates out of two special
funds, the Fish Fund and the Boat Fund. The principal sources of revenue for the Fish Fund are
fishing licenses and fees (about 66%) and federal funds (about 22%) obtained from taxes on
fishing-related items. For the Boat Fund, boat registration/titling fees, refunds of liquid fuels
taxes on gas used by motorboats and federal aid are the top revenue categories.
Following are examples of ways for the agency to increase revenues. However, the most
important method will be via Marketing and Outreach, which is covered in the next section of
the report.
New Licensing Options
We believe that the agency will have to consider options for new licenses to help bring in
additional revenues. Not only is there a general need for additional revenue, but several sport
fish species do not cover their costs and this contributes to the dire straits in agency finances.
There would seem to be possibilities for increasing revenue from current anglers by segmenting
their activities. States such as Minnesota and Michigan have several licensing categories and
add-on permits, which allow anglers to choose which species they pursue. Examples include:
The muskellunge (musky) breeding program is a prime example of one that is a candidate
for change. This program consumes many agency resources and there is little apparent
incentive for the agency to continue it. Annual program costs are approaching $1 million
and it caters to a small number of trophy anglers who most certainly do not cover the
costs of this program. Creating a musky stamp would provide additional funds to support
the program and capture revenue from musky anglers in Pennsylvania. Or, the musky
breeding program could be dropped entirely.
PFBC leaders have also discussed wild trout stamps. This could capture value from
individuals who fish Class A trout streams year-round.
A different option would be for PFBC to do away with trout stamps and roll that cost into the
main license. People in urban areas may not like this since they are less likely to fish for trout
and they would see a big license cost increase with little or no value. Such a change would
require additional marketing efforts to promote the new value-added of the all-in-one license
We also suggest the agency considers introducing a new requirement for buying a “senior
lifetime trout” permit that will help cover the costs of that program.

Penn State- PA Fish and Boat Commission Business Analysis 31
A major shortcoming of new license categories is that the customer base does not grow. These
are only tools to capture more value from active anglers. These can be utilized to raise funds in
the short-term, but could have long-term consequences.
Optional Conservation Stamps
Based on conversations with wildlife conservation professionals and monitoring PFBC events,
we see an opportunity for the PFBC to re-brand the agency as a conservation organization.
PFBC is viewed as a sister agency to the Pennsylvania Game Commission in the eyes of some
stakeholders and this has multiple ramifications. We believe it is important for PFBC to maintain
its own identify from PGC; detaching rods from guns, and fish from deer, and positioning the
agency as a conservation organization could create new revenue streams while helping PFBC’s
image. The figure below suggests how the PFBC brand can be repositioned to access new
customers and revenue streams.
Increasing PFBC brand strength is a recommendation dealt with later in this report. It can be
done in conjunction with changing perceptions of PFBC as a major contributor to conservation
as well as creator of recreational opportunities. In doing stream repairs, completing species
inventories, and monitoring water quality, the agency already has plenty of material to change
public perception. This could be used to attract revenue from people outside of the current
angling and boating community. Moreover, if done correctly it could take advantage of the
shifts toward an urbanized population in Pennsylvania while appealing to conservation-minded
individuals who live in large metroplexes.
Such a brand migration (as seen below) would benefit the Save Our Susquehanna campaign. For
real, sustainable success, the agency must sell conservation tags through non-licensing agent
channels. Without a new distribution method, it’s likely that only the current customer base will
be engaged. Going direct to consumers through online sales is likely to be quickest and most
cost-effective way to launch conservation-related products.

Penn State- PA Fish and Boat Commission Business Analysis 32
Figure 7. Brand perception map for PA state agencies
Additional Means of Revenue Generation
1. Revenue from Law Enforcement
We did not dig deeply into prospects for increasing revenues from the agency’s law enforcement
function, but it would appear that there are opportunities for law enforcement to bring in
additional revenues. If, for example, a significant number of boaters and anglers are not
following the rules then perhaps more fines are appropriate. Industrial violators may provide
much greater opportunity for fine-based revenues; policing streams and paying greater attention
to industrial violators could not only increase revenues but also benefit the Commonwealth by
reducing pollution.
2. Consumptive Water Use Fee
To quote the Chesapeake Bay Commission, “Pennsylvania is a water-rich state, blessed with an
abundance of both surface and groundwater” but nearly one-quarter of the state’s river and
stream miles are “impaired”. This means that they are not safe for drinking, fishing, swimming,
or aquatic life.6
6 From the “Water Rich & Water Wise” report by the Chesapeake Bay Commission, Dec. 2016.

Penn State- PA Fish and Boat Commission Business Analysis 33
The Fish and Boat Commission plays a key role as stewards of the Commonwealth’s water
resources. We would note that these efforts are generally not reimbursed by the Commonwealth
or those who benefit, directly or indirectly, from quality water resources.
One means under consideration for directing water-related funding to PFBC is a “consumptive
water use fee”. Bills are currently under consideration by the PA House and Senate which would
provide for “registration of extraordinary nonagricultural and nonmunicipal water users” (HB
20) and impose a water resource fee for those users.
We believe that PFBC should receive funding to reimburse it for its efforts to ensure high quality
water resources in Pennsylvania. This funding could come from the General Fund or from
revenues created by a new consumptive water use fee. With nearly six billion gallons of water
being used each day in the Commonwealth, without compensation, there is an opportunity to
generate an estimated $245million dollars annually. This is revenue that is not only needed and
deserved by agencies such as PFBC, but would reimburse Pennsylvania citizens who are
essentially giving away a valuable resource.
3. Capture revenue from unlicensed anglers/boaters
Our anecdotal experience over the past year suggests there are a significant number of persons
who do not purchase the required fishing or boating license. It is unclear whether this is because
people are unaware that they need a license7 or they know the requirements, but are purposefully
breaking the rules. Most likely it is some combination of both, and the low odds of being met by
a WCO in the field likely contribute to the latter.
Regardless, we would suggest that license-based revenues could be increased by a minimum of
5-10% if PFBC could capture a significant percentage of persons who do not purchase a license
as required. This implies that at least $2 million in additional revenue is being “lost” annually by
the agency. This lost revenue is perhaps the most significant pool of potential monies that the
agency should strive to recover.
We believe that changes in on-waterway signage and options to instantly purchase
licenses/permits and use of e-license options should be considered to help solve this issue; these
will be covered more in the latter sections of this report.
4. Mandatory Unpowered Boat Licenses
Current law states that all powered boats used in Pennsylvania must be registered, but
unpowered boats do not unless they utilize Commission or DCNR property. Unpowered boat
7 Our observations and interviews at waterways suggest foreign anglers are much more likely to claim they are
unaware of the need for a license to fish.

Penn State- PA Fish and Boat Commission Business Analysis 34
owners wanting to use PFBC or DCNR property have a choice to either register their boats or
purchase a launch permit.
Unpowered registration fees and launch permits currently cost $10 for one year or $18 for two
years.
PFBC analyses from five years ago suggested that the agency could increase revenues by nearly
three-quarters of a million dollars by requiring all unpowered boat owners to either register their
boat(s) or purchase a launch permit. It is noteworthy that the number of unpowered boats used in
Pennsylvania has significantly increased since that time, with as many as 50% more boats in use
today.
We suggest that strong consideration be given to a requirement that all unpowered boat owners
must purchase some form of license or permit. These monies could help fund programs by
PFBC that benefit all boaters (e.g., water rescue and boater education).
5. Sell naming rights
A trend that is gaining traction with non-profits and academic institutions is selling naming rights
for an organization’s assets to some corporate partner. PFBC could try, for instance, to put the
logo of an outdoors retailer on its hatchery trucks. Or, lakes could be “sponsored by” some
corporate partner that would pay a fee to have their name associated with the area.
6. Sell customer data
The Commission has a relatively small amount of data on anglers and boaters, and we are
suggesting that in the future it obtain additional information. If PALS is replaced then the new
system should be designed to capture data that can be used by the agency to better understand its
customers (e.g., efforts should be made to obtain emails from all license purchasers). The data
might also have significant value to an outdoors retailer or equipment supplier and leadership
should consider options for obtaining value from those data. Qualified sales leads, like the email
address of a current angler, bring an average value of $5 to $25 per email address. Selling
segmented customer lists based on retention rates can also increase the value to retailers and
manufacturers.
7. Reimbursement for Services Provided to other Gov’t Bodies
Our group was impressed by the many public services provided by PFBC, as well as the services
provided to other agencies of the Commonwealth. The challenge for PFBC leadership is that
they are currently not reimbursed for the valuable services provided to other government bodies.
Examples of those bodies include: DCNR, PEMA, PA National Guard, and local Townships.
We believe that PFBC should rightfully receive compensation for services provided to other
units of state and local government. At the least PFBC should be able to recover its direct costs.

Penn State- PA Fish and Boat Commission Business Analysis 35
Our suggestion is that leadership work to maximize its ability to receive compensation for
services provided to the other units.
The Need for More Marketing Efforts
In the distant past, agency-related activities and funding increased as a function of increased
societal interest in outdoor recreation, mainly sportfishing and boating. Marketing functions were
not as necessary for growing angler interest - it happened naturally. That natural growth has
stalled and yet there is a need for agencies to defend and grow their revenue streams to offset
increasing costs.
Investments in marketing capabilities will help the agency understand angler needs, allocate
resources, and adapt to the changing demographics in Pennsylvania, all with the ultimate goal of
increasing revenues. The following section will focus specifically on marketing as a function
within the organization and how it can be used to increase revenues while also achieving other
goals.

Penn State- PA Fish and Boat Commission Business Analysis 36
VII. Marketing Enhancement
The role of marketing in a traditional sense can be seen as increasing revenues for the
organization. In today’s world, however, marketing must take on additional roles related to key
areas such as image and reputation. The following section details our thoughts and suggestions
on how and why marketing should be used within PFBC.
It should become clear that we believe the marketing function will play a key role in revenue
enhancement for the agency, but also that marketing has traditionally not played a large enough
role in the organization. The marketing and outreach budget will need to be increased in order to
afford more emphasis in these areas, and there should be a concurrent increase in staffing.
Here are two quotes that reflect the enhanced role that we think marketing should play in the
agency:
“Marketing is too important to be left to the marketing department”
David Packard of Hewlett-Packard
“In a truly great organization you can’t tell who’s in the marketing department.
Everyone in the organization has to make decisions based on the impact on the
consumer.” Stephen Burnett, Northwestern University
Marketing can be thought of as the business function that identifies customer needs and wants,
and designs and delivers appropriate products, services, and programs to those customers8.
Without a solid marketing function it is very hard for any organization to achieve sales or
revenue goals. It is also important to reinforce that marketing of the product and the
organization are tasks that should be understood and valued by nearly all personnel.
Current Role of Outreach, Education, and Marketing
The Bureau of Outreach, Education, and Marketing has traditionally lead the agency’s mission to
teach Pennsylvania residents about waterways conservation, amphibians, reptiles, and safe
boating practices. PFBC has worked with schools, non-profit organizations, and other state
agencies to bring outdoor education to children and curious adults. This bureau is charged with
8 This discussion of marketing is taken in part from Kotler & Armstrong, Principles of Marketing.

Penn State- PA Fish and Boat Commission Business Analysis 37
improving agency communications, increasing demand for PFBC programs, and providing
business intelligence to internal and external stakeholders.
Marketing Strengths and Weaknesses
As stated by PFBC leadership, marketing functions are relatively new to state agencies,
especially in the resource management world, and development of the marketing function has
lagged behind. For Pennsylvania, outreach, education, and marketing efforts became more
important after license sales peaked in the early 1990s. For national and state organizations,
bolstering marketing capabilities has been a steep learning curve with some leaders disputing the
return on investment.
PFBC does not seem to have a comprehensive marketing program and has not historically
dedicated sufficient resources to reach its goals. We will discuss some of the key issues in the
following section, and then provide suggestions toward the end of the report.
Many of these weaknesses are of no fault of PFBC or its staff. They are competencies that take
time to learn, practice, and fully implement. The following discussion is meant to be a guide for
creating a robust set of skills that will improve PFBC’s ability to engage anglers, boaters, and
non-participating stakeholders.
Observed Strengths:
1) Public engagement with special interest groups – Programs like Trout in the Classroom
show PFBC’s ability to work with partners like Trout Unlimited for common goals.
2) Providing fishing classes to the public – Lessons free to female anglers have gained
traction across the state and show indications that similar programs to specific customer
segments can grow participation
3) Abundant educational resources on fishandboat.com – PFBC has expansive digital
materials that allow people to learn about regulations, best practices, safety, conservation,
and several other related topics. Leveraging this information will grow participation.
4) Strong core readership of Angler & Boater magazine – PFBC has constant contact with
its long-time angler base through the magazine. The rich content has kept the readership
base at roughly 14,000.
Observed Weaknesses:
1) Building brand equity for PFBC – The agency needs to take credit for its stewardship of
waterways and benefits to the greater public.
2) Establishment of branding guidelines – Several logos, symbols, and program names exist
in public communication. Rigidly defining the look of PFBC, from logo to text fonts, will
create a consistent image for the agency to use when connecting with the public.

Penn State- PA Fish and Boat Commission Business Analysis 38
3) Messaging and storytelling - Build Expectations around Experience, Not Outcomes –
Current communications suggest that fish are the product of PFBC, when stories about
building friendships and reconnecting with nature will get people outside and
participating.
4) Customer engagement in all PFBC communications – The agency has traditionally
transmitted one-way communications with anglers and boaters. Today’s customers expect
to have conversations and interactions with the brands they use.
5) Few email reactivation campaigns – Other state agencies have boosted sales with email
campaigns to recently lapsed anglers. Customers, past and present, should be periodically
reminded to participate in boating and angling.
6) Executing digital marketing tactics – Capturing sales leads, cross-selling and up-selling is
not currently attempted by PFBC through its direct, online sales channel.
7) Generating insights on anglers and non-anglers – Market research reports can inform
decisions and have financial value to retailers and manufacturers. No continuous
reporting on angler and non-angler needs or demographics is conducted by PFBC.
8) Resource Allocation – Marketing and Outreach does not receive sufficient funding.
Suggestions for PFBC’s Marketing Program
The following sections provide an overview of the key areas where we see opportunities for
enhancing the marketing function within the agency.
Better Market Segmentation
Effective marketing starts with understanding and defining the market for the product and
services an organization can provide. In PFBC’s case this includes estimations of revenue
potential in Pennsylvania from fishing and boating activities. The second step is to segment this
market based on measurable factors affecting customer buying behavior. For example, in the
perceptual map previously presented, contribution to conservation of waterways could segment
the market for PFBC into customers who care about conservation and those who don’t.
Demographic variables could segment a market if they lead to significant differences in buying
behavior. As an example, age seems to be one important demographic factor that influences
fishing and boating activities.
Once market segments are identified, targeting of segments where an organization can capitalize
on its strengths and minimize the effect of its weaknesses is the next strategic step. Selection of
segments to focus on can improve the efficiency of marketing activities as it could focus
investment, reduce costs and increase revenue per dollar of marketing investments. Finally, once
target segments are identified, marketing efforts including advertising, digital marketing,
campaign marketing, etc. can be developed to promote products and services most appealing to
the target audience.

Penn State- PA Fish and Boat Commission Business Analysis 39
Identifying the target segment’s needs and desires is the most important part of any marketing
plan. Without understanding what customers want, marketing investments can promote the
wrong thing at a high cost. The Recreational Boating and Fishing Foundation has identified
sports, recreation and fun as the most popular reason why people fish. Relaxation and getting
away is the second reason and spending time with friends and family or being a part of the
community is the third reason motivating fishing activities. Any marketing effort that focuses on
anything but these drivers of behavior could be an inefficient/ineffective use of time and dollars.
Raising the Brand Equity for PFBC
The Pennsylvania Fish & Boat Commission is perceived by many to be hidden behind the scenes
of angling and boating in Pennsylvania. This implies there is room for the agency to step
forward to own more than license sales, hatchery fish production, and law enforcement.
At times, PFBC forgets to tell the public that they are the “good guys”. The agency contributes to
water quality, public safety, and a vast array of ecosystem services. All communications
represent the brand and create impressions on stakeholders. Reviving and repositioning the
PFBC brand will enable the agency to generate funds through alternative revenues and “build the
love” for the agency and it’s work.
We would reiterate that PFBC is often viewed in tandem with the Game Commission and can
find itself lumped in with PGC when Legislators want to force one or the other to do their
bidding. Improving PFBC’s image may help with this problem.
The figure below illustrates how anglers may move from “trial” to loyal fishermen via a
traditional brand equity model. The strongest relationship between a brand and people is at the
top of the pyramid. It’s a relationship between the brand (or company) and the customer that is
nearly unbreakable. Examples of brand resonance can be witnessed at Harley-Davidson events
and college football games. The opening day of trout season is a similar event in Pennsylvania.
The only difference is that the PFBC brand isn’t at the forefront of the experience. Utilizing
media coverage of stocking runs and the carnival atmosphere of the opening day helps build
brand equity, but ultimately anglers are fishing because of the connections with other people.

Penn State- PA Fish and Boat Commission Business Analysis 40
Figure 8: The journey of anglers through Keller’s Brand Equity Model
A resource unique to PFBC is that nearly all who fish Pennsylvania waters interact with PFBC
through licensing agents, the PFBC website, and at least on its managed waters. The agency has
an opportunity to be the interface for anglers and angling interest groups. Non-governmental
groups such as Trout Unlimited, Backcountry Hunters & Anglers, Muskies Unlimited, B.A.S.S.,
and many others create and contain many long-lived anglers. Additionally, they are key
stakeholders in many policy decisions at the state and national level. PFBC should be a conduit
for anglers to these groups to grow their numbers. People involved in the sport through social
connections are more likely to be retained and thus increasing connections should lead to less
churn.
Establish Commission Branding Guidelines
In researching the projects and initiatives that PFBC is involved in, several logos varying in
color, font, and graphics were observed. Using too many logos is known to dilute brand identity
and can confuse customers. Establishing brand guidelines and branding strategies for the
commission will build brand equity for PFBC.
In driving a clear and consistent brand to residents and anglers, the Pennsylvania Fish & Boat
Commission’s protection, conservation, and enhancement activities will be linked to revenue-
driving items like fishing licenses and boating permits. Additionally, brand equity can increase
the success of introduced products and revenue streams.
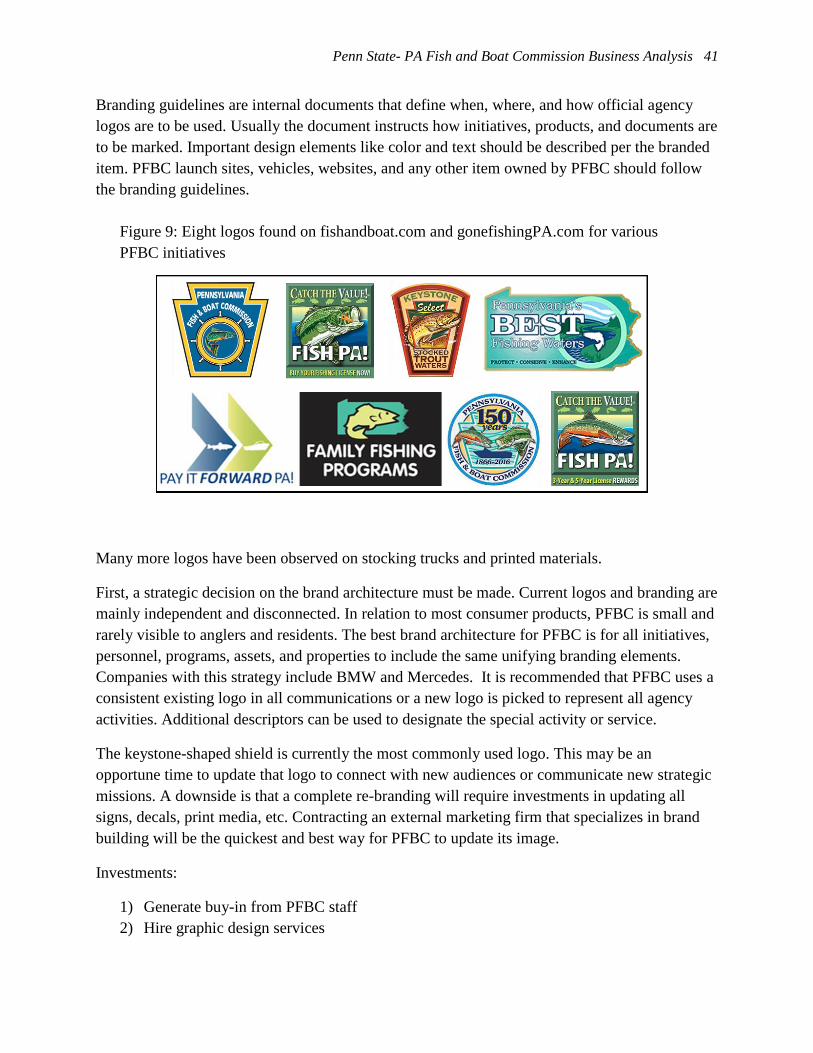
Penn State- PA Fish and Boat Commission Business Analysis 41
Branding guidelines are internal documents that define when, where, and how official agency
logos are to be used. Usually the document instructs how initiatives, products, and documents are
to be marked. Important design elements like color and text should be described per the branded
item. PFBC launch sites, vehicles, websites, and any other item owned by PFBC should follow
the branding guidelines.
Figure 9: Eight logos found on fishandboat.com and gonefishingPA.com for various
PFBC initiatives
Many more logos have been observed on stocking trucks and printed materials.
First, a strategic decision on the brand architecture must be made. Current logos and branding are
mainly independent and disconnected. In relation to most consumer products, PFBC is small and
rarely visible to anglers and residents. The best brand architecture for PFBC is for all initiatives,
personnel, programs, assets, and properties to include the same unifying branding elements.
Companies with this strategy include BMW and Mercedes. It is recommended that PFBC uses a
consistent existing logo in all communications or a new logo is picked to represent all agency
activities. Additional descriptors can be used to designate the special activity or service.
The keystone-shaped shield is currently the most commonly used logo. This may be an
opportune time to update that logo to connect with new audiences or communicate new strategic
missions. A downside is that a complete re-branding will require investments in updating all
signs, decals, print media, etc. Contracting an external marketing firm that specializes in brand
building will be the quickest and best way for PFBC to update its image.
Investments:
1) Generate buy-in from PFBC staff
2) Hire graphic design services

Penn State- PA Fish and Boat Commission Business Analysis 42
3) Change signage at managed properties
4) Update logos on vehicles, printed materials, etc.
Desired Outcomes:
1) Decreased price sensitivity for licenses and permits
2) Build awareness in markets where alternative revenue streams can be generated
3) Increase definition of PFBC’s mission and create perceptual distance from the
Pennsylvania Game Commission
4) Build agency awareness in urban/metro area
Messaging: Build Expectations around Experience, Not Outcomes
“Stop and look around: Anglers get to see some amazing sights when out in
nature. Colorful sunsets, sunrises, gatherings of migratory birds, strange animal
behavior, incredible landscapes, friends doing silly things…shoot this stuff. In fact,
shoot this stuff more than just your standard trophy or grip-and-grin. It can be far
more interesting when looking back at your trip as a whole. Tell a story, not just a
piece of one.”
– Tim Romano on photography and angling, Trout Magazine Spring 2017
In review of PFBC publications, communications, images and the messages conveyed by those
images, we noted that “success” is portrayed as being the harvest of large fish (see the figure
below). Telling too many stories of large fish defines and elevates angler expectations. The
resources PFBC manages will be expected to deliver on those expectations or some anglers will
be disappointed with the results of fishing experiences.

Penn State- PA Fish and Boat Commission Business Analysis 43
Figure 10: The 2017 Pennsylvania Fishing Summary and banners from fishandboat.com
These images show how large fish are defining successful fishing experiences.
The messaging campaign does involve anglers and encourages them to share experiences. PFBC
should redefine the user-generated content that is published to capture the full fishing experience
beyond catching the occasional trophy fish. Table 5 shows the top three reasons US anglers fish.
PFBC should align content with the reasons people go fishing beyond catching fish. The
messages conveyed by PFBC can suggest urban fishing, teaching children, recruiting friends,
and experiencing natural events and surroundings.
Table 5. Top three reasons people fish
Reasons People Fish
>35% for sport, recreation, and fun
35% for relaxation and to get away
20% to be with family and friends Source: Recreational Boating and Fishing Foundation
Strategic goals and recommendations set by PFBC commissioners and leadership should be
reflected in the images chosen for publication. For example, if increasing participation in urban
markets is a major strategic goal then this region should somehow be represented in agency
publications and user generated content. Or, agency publications will have to be segmented by
region to appeal to different audiences.
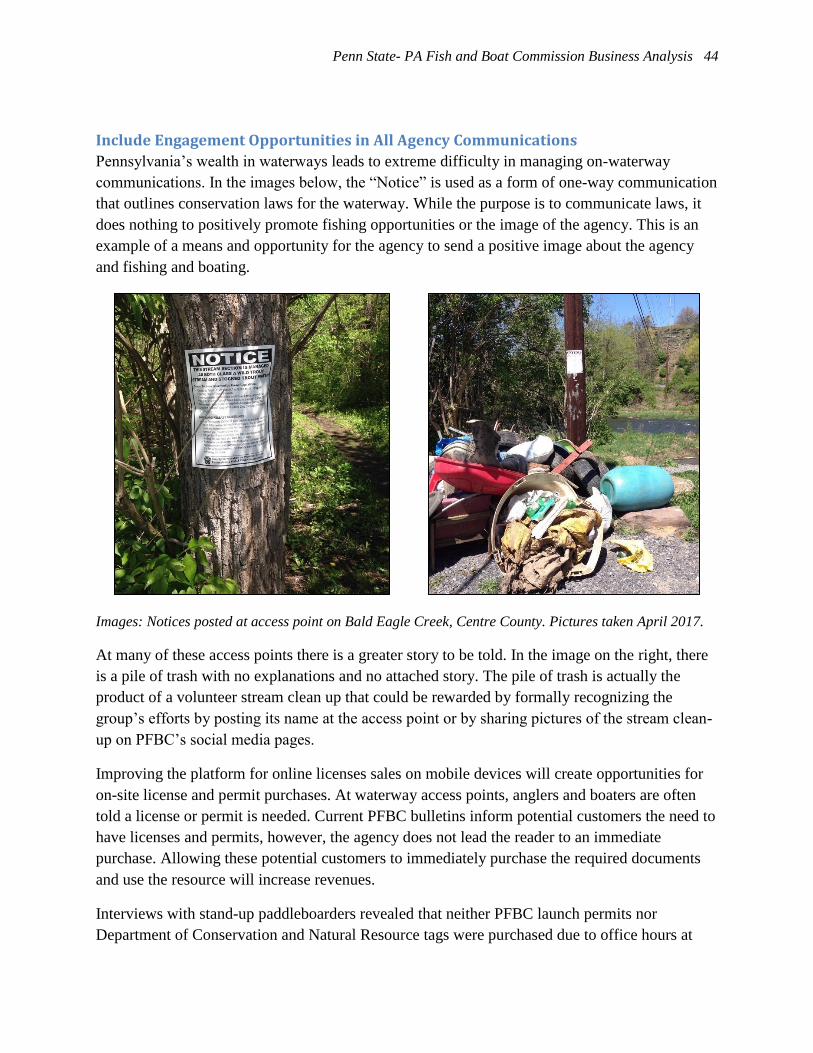
Penn State- PA Fish and Boat Commission Business Analysis 44
Include Engagement Opportunities in All Agency Communications
Pennsylvania’s wealth in waterways leads to extreme difficulty in managing on-waterway
communications. In the images below, the “Notice” is used as a form of one-way communication
that outlines conservation laws for the waterway. While the purpose is to communicate laws, it
does nothing to positively promote fishing opportunities or the image of the agency. This is an
example of a means and opportunity for the agency to send a positive image about the agency
and fishing and boating.
Images: Notices posted at access point on Bald Eagle Creek, Centre County. Pictures taken April 2017.
At many of these access points there is a greater story to be told. In the image on the right, there
is a pile of trash with no explanations and no attached story. The pile of trash is actually the
product of a volunteer stream clean up that could be rewarded by formally recognizing the
group’s efforts by posting its name at the access point or by sharing pictures of the stream clean-
up on PFBC’s social media pages.
Improving the platform for online licenses sales on mobile devices will create opportunities for
on-site license and permit purchases. At waterway access points, anglers and boaters are often
told a license or permit is needed. Current PFBC bulletins inform potential customers the need to
have licenses and permits, however, the agency does not lead the reader to an immediate
purchase. Allowing these potential customers to immediately purchase the required documents
and use the resource will increase revenues.
Interviews with stand-up paddleboarders revealed that neither PFBC launch permits nor
Department of Conservation and Natural Resource tags were purchased due to office hours at

Penn State- PA Fish and Boat Commission Business Analysis 45
Pennsylvania State Parks. The paddleboarders interviewed were not aware that PFBC launch
permits allowed use of waterways in state parks. Suggesting mobile purchases of permits on-site
is likely to capture sales by eliminating user excuses of limited access. This provides another
example of one segment of the population that should be buying PFBC permits but does not have
the awareness or ease of purchase to do so.
E-Commerce Strategies
We will include what we term as e-commerce strategies under the Outreach and Marketing
function since at this time it appears that these areas would be overseen by marketing leadership.
Email Reactivation Campaigns
PFBC currently has a valid email address for 25% of annual license holders and 35% for multi-
year license holders. Email reactivation campaigns executed by RBFF and partner states had
response rates of roughly 5%, which is successful when compared to many retail businesses.
The Penn State team conducted an analysis of PALS data from 2008-2013. A key finding is that
people appear to be 315% more likely to purchase a license in the current year if they purchased
one in the year prior. It validates the need to connect with recently lapsed anglers.
Based on the observed response rate of 5% in similar campaigns and the current resident annual
license price of $21, the agency should be able to capture $1.05 in future license sales from each
email address it holds. Increasing the percent of emails captured to 50% can potentially add
2,600 anglers (in subsequent year) and $55,000 in revenue.
Table 6. Potential revenue for angler emails
2016 Resident
Annual
License Sales
Expected
Lapsed
Anglers
(30%)
Emails
Captured
(25%)
Retained
Anglers from
Campaign
Revenue Lift
to PFBC
Average
Return per
Address
690,675 207,203 51,801 2,590 $54,391 $1.05
PFBC started a partnership with Penn State Athletics in 2016 which allowed the agency to
connect with people at football games and advertise during hockey and basketball games. The
PFBC brand had good visibility during these events but the return on investment is unknown.
Email addresses were also captured from individuals who entered to win a boat donated by Bass
Pro Shops.
We recommend that the bureaus of Outreach and Administration work together to capture more
information about license holders including email addresses. Having capabilities to communicate
with current anglers will show measurable benefits to PFBC. This is achievable by mandating

Penn State- PA Fish and Boat Commission Business Analysis 46
email capture at time of license sales or incentivizing customers to volunteer the information.
Anglers might value, for example, electronic copies of their licenses. Providing this service could
be an inexpensive way of rapidly increasing the number of valid email addresses.
As previously mentioned, retailers and manufacturers will be interested in purchasing lists of
customer information. Information can be as specific as individual contacts and a broad as
reports on the general angling population. Knowing more about PFBC’s current customers and
their changing needs can generate revenue for the agency.
According to McKinsey & Company, private firms that leverage their customer data realize 6%
higher margins than peers (Brown, Kanagasabai, Pant, & Pinto, 2017). Detailed customer
information has considerable value to retailers, manufacturers, and even state agencies. License
purchasing patterns, participation habits and corresponding customer demographics can be an
additional product to sell to retailers and manufacturers.
Individuals who purchase licenses are the precise target customers for outdoor sporting goods
companies. Market research reports for niche industries are extremely valuable. Companies such
as Nielsen, IRI, and The NPD Group, sell reports based on point-of-sale data and consumer
trends. The NPD Group was selling a market report on a $300 million sporting goods category at
$18,000 in the summer of 2016. If market research is conducted by PFBC, it’s reasonable that a
professionally constructed report by PFBC could be worth $5,000 or more to manufacturers and
corporate retailers.
Insight Generation
Nationally, wildlife agencies look to groups like RBFF to capture the pulse of outdoor
enthusiasts. The Bureau of Outreach, Education, and Marketing should be looking for insights on
anglers and non-anglers, alike. A survey of Pennsylvania anglers in 2008 still informs important
decisions across the agency. Additional sources of insights tend to come from testimonials. It has
been observed that certain testimonials carry extra influence when considering policy change.
PFBC should use its position as the gatekeeper to Pennsylvania’s waterways and continuously
monitor those seeking information, licenses, and permits. Formalizing these insights into reports,
the agency will be able to make better strategic decisions and be able to generate revenue from
the reports it creates.
The agency can continuously monitor its customer base with electronic surveys sent via email or
posted on social media outlets. These surveys can monitor the changing needs of both current
and lapsed anglers. Small sample sizes can still have statistical significance, so conducting
surveys can be a monthly activity.
Developing surveys and generating reports will be most effective if conducted by an expert in
the Bureau of Outreach, Education, and Marketing. Questions of angler opinion or behavior that
impact the entire bureau and specific agency functions can be put through the same process. For
example, the Bureau of Law Enforcement can sample awareness regarding a regulation change

Penn State- PA Fish and Boat Commission Business Analysis 47
for a specific body of water. Existing customer information allows such a survey to target people
in the affected area.
Online License Sales Capabilities
While the current online sales platform can complete transactions, it lacks advanced digital
marketing tactics to increase sales rates, attract new sales leads, and increase average transaction
sales. PFBC’s ALS online sales platform is responsible for 14% of all license transactions and
over $4 million in revenue. Increasing the sales capabilities of the PFBC website is one of the
greatest opportunities to increase fishing license sales revenue.
Advanced digital marketing refers to additional website content that encourages additional sales
and increases sales leads. Implementation of these tactics will require additional coding on
fishandboat.com and The Outdoor Store. By executing the tactics below, PFBC will be able to
manage online sales like a business.
In 2016, PFBC’s online license sales channel was responsible for above average sales per
customer. The ALS online sales platform averaged $35.64 per unique customer, while the
average across all fishing license sales was $29.59. The retail and ecommerce industries use
average ticket price as a metric to drive total revenue. PFBC can develop the capabilities to
enhance metrics like this to drive total revenue.
Without using any advanced digital marketing tactics, the higher average receipt can be
attributed to more high-priced items being sold via online sales. As shown in Table 8 below, the
ALS online sales platform was responsible for a high percentage of expensive license categories
like non-resident fishing licenses and multi-year licenses.

Penn State- PA Fish and Boat Commission Business Analysis 48
There are two purchasing behaviors observed in the online sales data:
1) Anglers use online sales for higher-priced, long-term investments. Multi-year license
sales probably aren’t purchased on an impulse. Customers buying them online are
researching and making the buying decision outside of retailers.
2) Non-resident anglers see convenience or less confusion with online license purchases, or
may want to have the license prior to arriving in Pennsylvania. Increasing digital
marketing efforts to non-residents is likely to be accepted and rewarded with more
revenue.
From these insights, PFBC can drill down and look for opportunities to sell additional products
to multi-year license buyers and non-residents. For example, better communication could
influence anglers considering purchase of a 3-year license to instead purchase a 5-year license.
An additional metric which drives business for ecommerce companies is lead generation. Leads
for online sellers are typically well-qualified email addresses. Qualified is used to describe a lead
License Category Percent of All Channel Revenue Percent of Online License Revenue
Resident Annual Fishing License 56.38% 36.46%
Trout/Salmon Permit 14.08% 10.26%
Non-Resident Annual 7.93% 16.56%
Combo Trout/Salmon & Lake Erie 4.02% 4.11%
3-Year Resident Fishing 3.15% 7.09%
Senior Lifetime Lifetime 3.10% 2.05%
3-Day Tourist 2.35% 5.04%
5-Year Resident Fishing 1.99% 5.14%
7-Day Tourist 0.93% 2.02%
Senior Resident Annual 0.81% 0.52%
3-Year Trout/Salmon Permit 0.78% 1.72%
Lake Erie Permit 0.61% 0.53%
5-Year Trout/Salmon Permit 0.48% 1.22%
3-Year Non-Resident Fishing 0.29% 1.21%
Licenses/Permits <1% of Revenue 3.16% 6.17%
Totals 100% 100%
Percentage of Revenue by Sales Channel
Table 7: Percent of revenue comparison for fishing license sales across all channels versus
online sales.

Penn State- PA Fish and Boat Commission Business Analysis 49
for which the customer has an interest relevant to the product being sold. A qualified email lead
could be owned by a current or former angler or a person visiting fishandboat.com.
Currently, PFBC possesses the emails of 25% of annual license holders and 35% of multi-year
license holders. Digital marketers equate email addresses to sales leads. PFBC should track and
improve two measures in relation to online sales: average customer purchase and lead
generation. The tactics discussed below will help PFBC increase the average receipt total and
generate more leads.
Other E-commerce Tactics
Tactic 1: Email fishing licenses to purchasers
Potential customers are currently met with warning that fishing licenses must be printed at time
of purchase. This warning and the need to print immediately creates a very real barrier to
potential customers. PFBC is willing to help anglers by emailing them a copy of their license,
however, the customer must call PFBC to initiate the request. The need to print at time of
purchase narrows the addressable market for online license sales. With this policy people without
readily-available printers or those using a mobile device are disqualified as potential purchasers.
Recommendation: Customers should have the option to receive an electronic copy of their
fishing license through email. This will allow PFBC to capture valid email addresses of active
anglers. Remember that the average value of an active fishing license holder is $1.05 in future
sales to PFBC.
If PFBC changes the rule mandating a visible license and allows anglers to carry a digital copy
then this would of course provide greater leeway for anglers to receive electronic copies of the
license without worrying about printing a hard copy. The move toward e-licenses should also
assist PFBC in collecting more angler emails.
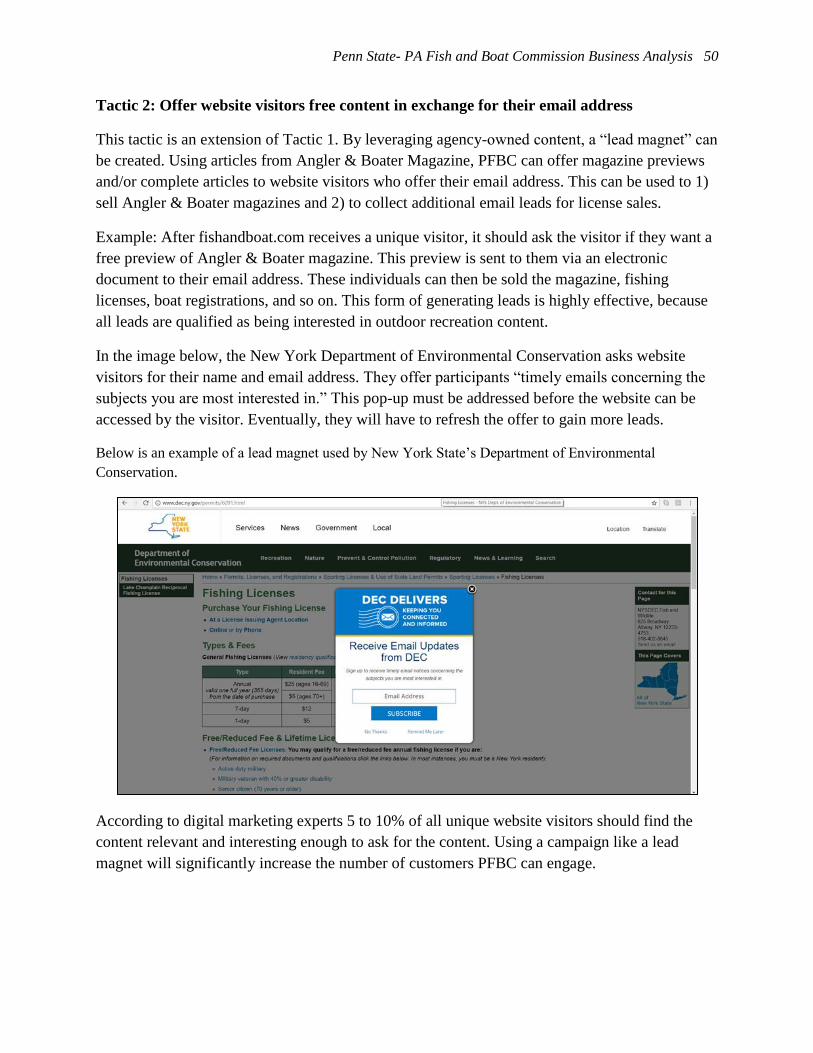
Penn State- PA Fish and Boat Commission Business Analysis 50
Tactic 2: Offer website visitors free content in exchange for their email address
This tactic is an extension of Tactic 1. By leveraging agency-owned content, a “lead magnet” can
be created. Using articles from Angler & Boater Magazine, PFBC can offer magazine previews
and/or complete articles to website visitors who offer their email address. This can be used to 1)
sell Angler & Boater magazines and 2) to collect additional email leads for license sales.
Example: After fishandboat.com receives a unique visitor, it should ask the visitor if they want a
free preview of Angler & Boater magazine. This preview is sent to them via an electronic
document to their email address. These individuals can then be sold the magazine, fishing
licenses, boat registrations, and so on. This form of generating leads is highly effective, because
all leads are qualified as being interested in outdoor recreation content.
In the image below, the New York Department of Environmental Conservation asks website
visitors for their name and email address. They offer participants “timely emails concerning the
subjects you are most interested in.” This pop-up must be addressed before the website can be
accessed by the visitor. Eventually, they will have to refresh the offer to gain more leads.
Below is an example of a lead magnet used by New York State’s Department of Environmental
Conservation.
According to digital marketing experts 5 to 10% of all unique website visitors should find the
content relevant and interesting enough to ask for the content. Using a campaign like a lead
magnet will significantly increase the number of customers PFBC can engage.

Penn State- PA Fish and Boat Commission Business Analysis 51
Tactic 3: Cross-Sell and Up-sell with Online Sales Platform
The best ecommerce sites in business are using opportunities to cross-sell and up-sell before
transactions are completed. Currently, The Outdoor Shop is not capable of connecting customers
to other applicable licenses or permits. Smart online retailers make suggestions before a
customer finishes a transaction. The agency is missing a large revenue generating opportunity
across 15% of license transactions.
Recommendation: The marketing managers for PFBC should build in up-sale and cross-sale
capabilities into the online store. Most ecommerce platforms offer add-ons that enable these
capabilities and it should be considered by PFBC.
Example: A customer has elected to purchase an Annual Resident License. Before moving to the
checkout, another window asks if they plan to fish for trout or use an unpowered boat. The
system will then recommend they also purchase a trout permit and/or a boat launch permit.
Search Engine Optimization
We noticed several improvements that could be made to help “fishing and boating” have more
prominence for persons using search engines. Younger generations especially are using search
engines and apps to help guide recreation choices. If the agency does not manage its on-line
presence then fewer people will learn of fishing and boating opportunities with lower odds of
becoming active participants.
We ran several tests with search terms that might be used by consumers. For example, fishing
and boating doesn’t currently make it to the first page of “Things to do in PA” (or even the first
10 pages of results). As most younger customers use search engines and “travelling apps” to
decide about their outdoor activities, this less than ideal.

Penn State- PA Fish and Boat Commission Business Analysis 52
There two ways the Commission can improve its search engine results:
Improve website content: most search engines look for relevant content. To optimize
search engine results, PFBC should adjust the content on its website to correspond to
searches relevant to their activities.
Pay for search engine ads: Most search engine results are accompanied by paid for
advertisement at the top of the page relevant to the search. These ads could guide
consumers to the PFBC’s website and increase exposure. This might also be another
chance to co-market with a large retailer or other firm in the outdoor recreation industry.
Invest in travelling apps: Pull strategies (where customers look for promotional content)
are significantly more effective than push strategies (where companies push the
promotional content to customers). Travelling apps are a very good example where pull
strategies could be utilized. TripAdvisor is one of the most recognized travelling apps
currently in the market (see below). This screen capture shows the results for searches for
fishing and boating conducted in State College, PA. As is clear in the screenshot of the
search results, there are no clear associations with PFBC and most results lead to state
park websites. Here is another example where the PFBC’s activities take a backseat.
These results can be improved by first defining the business on these apps and second by
encouraging fishers and other customers to rate their experience.
This is another example of justifications for co-marketing fishing and boating with
DCNR’s state parks system.

Penn State- PA Fish and Boat Commission Business Analysis 53
Fishing and boating search results in TripAdvisor
Social Media Strategy Formulation and Execution
Organizations engage in social media marketing to improve brand equity through increasing
customer engagement or facilitating community development around the brand. A
comprehensive social media presence can help PFBC create a trustful relationship with anglers,
boaters, conservationists, and non-active Pennsylvania residents.
Some of the important benefits of using a social media strategy are:
Social media platforms have a broad reach. Facebook alone reaches 2 billion people or
two thirds of the population of the world with access to the internet. No other marketing
tool has such a global and direct access to customers. A Facebook post about a new
service can make a traditional press release look arcane in comparison.
Engaging consumers have never been easier. Consumers spend an average of two hours a
day on social media platforms. Studies have shown that millennials watch more YouTube
videos than TV and three out of four customers report that social media posts affect their
spending behavior.

Penn State- PA Fish and Boat Commission Business Analysis 54
Social media platforms can be an important, inexpensive source for consumer and
competitive intelligence with minimal time and effort. Consumers are expressive and
outspoken on social media platforms and competitors’ efforts are public. Setting up filters
to see mentions of fishing/boating on Twitter, for example, are fairly simple while
providing invaluable insight in what satisfies or dissatisfies the stakeholders. Using a
social media platform like Twitter, therefore, doesn’t include posting alone. Monitoring
can be a huge part of a social media strategy.
Social media platforms can be used as PR vehicles, promoting companies’ brands or
managing a crisis. CEOs can react quickly and directly to crisis situations and manage the
consequences before they get out of hand.
On the other hand, the risk in using (or over-using) social media is misusing it. Misusing the
social media platforms can backfire and lead to disgruntled customers, employees, and PR
disasters once the wrong post is broadcast at the wrong time or if the social media presence
contradicts marketing and PR effects at the institution or doesn’t follow a consistent theme.
Some of the risks of non-strategic use of social media platforms include:
Non active or mismanaged accounts: 72% of Twitter users expect responses from brands
and institutions they follow within one hour. Not managing social media accounts
properly can only lead to disappointment and dissatisfaction.
It is important to be consistent and on message. Contradictory messages on social media
platforms can lead to suspicions of inauthenticity and even fraudulent claims.
Social media security and the risk of accounts targeted by internet hackers are becoming
one of most important concerns in using social media platforms. Twitter and Facebook
accounts can be targeted by dissatisfied customers or disgruntled ex-employees or foreign
hackers.
Executive gaffes have become infamous on social media platforms and have hurt
company and leadership reputations.
An article for McKinsey Quarterly concluded that organizational social media literacy is fast
becoming a source of competitive advantage. This kind of literacy requires the skill set to
capitalize on the transformational power of social media while mitigating its risks. It is important
for top leadership who engage in social media execution to understand strategic creativity,
authentic communication and agility. Executives need to lay out the social infrastructure that
allows for an interactive collaborative environment which welcomes a social media strategy.
Deiser and Newton define social media literacy along six dimensions shown in Figure 11.

Penn State- PA Fish and Boat Commission Business Analysis 55
Figure 11 - Six dimensions of social media literacy
Source: Deiser & Newton, McKinsey Quarterly (Feb. 2013)
As is clear in the figure, there are two aspects of social media literacy: personal skills and
organizational capabilities. A description of the six dimensions is as follows:

Penn State- PA Fish and Boat Commission Business Analysis 56
1. Leader as a producer: Leadership needs to provide compelling content. Without content,
social media presence doesn’t result in the kind of results companies are looking for.
2. Leader as a distributor: Leaders need to find the balance between controlling the flow of
information (e.g., through traditional vertical channels) and allowing the system
dynamics to work without intervention (e.g., capitalizing on the horizontal collaboration).
One of the main skills in this role is building a following online that can disseminate the
company’s message.
3. Leader as a recipient: Social media platforms provide a lot of information and noise; the
leaders need to be able to organize and categorize the information, react to those who are
strategically important and use the intelligence to improve image and productivity.
4. Leader as an advisor: Social media capabilities are not fully developed in many
companies and social companies are in their infancy. Leaders need to tutor and
orchestrate the social media activities and develop roles that would facilitate the social
media strategy (e.g., content curators, network analysts, etc.)
5. Leader as an architect: leaders need to create an organizational infrastructure that
provides space for interactions and sharing of information and open communications.
They also need to balance an open space with a sense of responsibility and accountability
in a more horizontal organizational structure.
6. Leader as an analyst: Leaders need to be proactive and ahead of the curve. They need to
monitor and analyze new opportunities and new business models that would fit the social
media age.
What brings all these dimensions together is having a strategy. Without a strategy or purpose,
there will be a lot of time wasted on social media platforms without a measurable outcome. A
social media strategy will guide what needs to be posted and what doesn’t need to broadcast. It
helps identify the appropriate timing of social media activity. It will inform the process to define
roles needed to manage the social media presence and criteria that social media agents need to
decide what to comment on or respond to. Finally, a clear social media strategy helps design a
measure of engagement and improvement.
PFBC Social Media Strategy
All agency strategic communications, including posts to social media, should be designed to
elicit a specific action by the receiver of the message. The can be as simple as creating awareness
of a fishing derby and encouraging parents to take their children to that derby.
PFBC needs to be aware that social media marketing creates conversations between the agency
and the brand. On social media, the brand is expected to show human emotion in responding to

Penn State- PA Fish and Boat Commission Business Analysis 57
the public. Exhibiting emotions like gratefulness, empathy, and excitement will create
connections to between the PBFC and the public.
It is time for PFBC to decide what benefits it will gain from enhancing its social media presence.
Examples could include:
Decreased price sensitivity
Communications with current anglers to give information on fishing opportunities,
stocking locations, etc.
Communications with boaters to give safety information, renewal notices, or co-
marketing with retailers.
Communication with outdoors writers, bloggers, and other key influencers.
Communications with non-customers who PFBC would like to educate about recreation
opportunities.
The agency’s Social Media Strategy Formulation framework could look like this:
1. Identify the people who will be executing the strategy.
2. Determine what the measurable results of the campaign will be.
3. Create a process or guide for how the brand will be experienced through social media.
a. Decide which brand voice can appropriately carry the agency. The customer will
want a consistent experience when interacting with the agency, not several
disjointed voices.
b. Create a guide for relevant PFBC employees to follow when using the PFBC
social media accounts. This guide should be concise, have a small team of leaders,
and include examples of exemplary posts.
4. When PFBC gains traction in key performance indicators, marketing automation software
should be used to track social media responses.
To accomplish this entire process, PFBC should consider contracting a marketing agency that
specializes in social media branding. Currently, the agency doesn’t have a strong competency in
brand building or social media engagement. Acquiring these resources can be expensive, but will
allow PFBC employees to focus on the agency’s core mission. The alternative is to hire
someone new to take over social media duties, or train a current employee(s).

Penn State- PA Fish and Boat Commission Business Analysis 58
Leadership’s role in Social Media
According to a 2016 survey of the Fortune 500 companies, 60% of CEOS have no social
presence at all and only one is present on all six major social media platforms (Linkedin,
Facebook, Twitter, Instagram, Google+ and Youtube). It is important to realize that social media
and video streaming in particular, has a major impact on brand image. Without a social media
presence, institutions risk no clear brand image or worse, leaving their fate to be decided in the
court of public opinion. Presence on social media platforms allows top leadership to participate
and influence the discussion around their institutions and brands.
According to a Harvard Business Review analysis, the correct approach to using social media for
top leadership includes the following:
1. Listening: Monitoring the online conversation about the institution and gauging what is
being said. The “rule of five” applies in this stage: following five other people (e.g.,
colleagues) and five other types of accounts (e.g., trade publications).
2. Choosing the right platform: There are six major social media platforms and many other
secondary platforms that can be explored by the organization. It is important to use the
right platform for the company to accommodate customers, employees and other
stakeholders. Merely using an account on a social media website (or Twitter) does not
mean the company has a social media strategy or is using the social media platform
strategically.
3. Embracing a “media company mindset”: developing a company story and following a
theme in the organization’s social media presence. Moreover, it is important for the chief
executive to be featured regularly as the head of the organization and the main person
who embodies the theme and the story of the company.
4. Do It Yourself: outsourcing social media management can lead to inauthenticity very
fast.
Finally, one of the safest, fastest growing social media vehicles is corporate videos. Corporate
and promotional videos are mostly controlled by the company and thought through and they are
easily consumed and redistributed by consumers. YouTube is the second largest search engine on
internet. It also competes with other streaming platforms like Netflix, Hulu and traditional cable
TV for reaching the customer. PFBC should investigate whether it could benefit by having a
greater presence in the on-line video world.

Penn State- PA Fish and Boat Commission Business Analysis 59
IX. General Suggestions
Multi-Year License Sales
First introduced to Pennsylvania in 2013, multi-year licenses give anglers the option to purchase
a license for the current year and future years. In 2017, a 10-year license was added to the current
line-up of three-year and five-year licenses for residents, non-residents, and seniors. According
to Southwick Associates, the agency captured $1.5 million in additional revenue from 2013-
2015. Anglers receive a small discount because licensing agents only receive royalties for one
license sale and the license processor only receives credit for one sale.
Age Bias in Sales Data: Multi-year licenses are disproportionately purchased by older anglers.
Nearly 55% of all multi-year licenses are purchases by anglers between the ages of 45 and 64.
Anglers in this age range also have the highest likelihood of purchasing a fishing license. The
interpretation is that many multi-year licenses are purchased by anglers who are likely to come
back regardless of the availability of multi-year licenses. A survey conducted by Southwick
Associates revealed that 81% of residents and 77% of non-residents purchased a multi-year
license to avoid annual trips to a licensing agent.
Table 8. 2016 Multi-year License Sales by Age
Angler Age in 2016 16-24 25-34 35-44 45-54 55-64 65+
Three-Year Licenses 7.24% 13.78% 19.50% 27.02% 29.50% 2.95%
Five-Year Licenses 6.52% 17.64% 22.84% 27.50% 24.37% 1.12%
All Multi-year
Licenses 6.97% 15.22% 20.75% 27.20% 27.58% 2.27%
While PFBC can capture additional revenue from the multi-year program, there is a self-
selection bias in the customer decision making process. Gaming the system is evident in the
spike of five-year license sales to 60-year-olds and another for three-year license sales to 62-
year-olds. Figure 12 below illustrates this phenomenon.

Penn State- PA Fish and Boat Commission Business Analysis 60
Figure 12. Multi-year license revenue by angler age
The multi-year license program could be redesigned to capture more high-churn anglers. Anglers
from ages 16 to 34 have some of the highest churn rates. This is attributed to the occurrence of
major life events such as school, careers, marriage, having children, etc. Anglers in this age
bracket purchase in more unpredictable patterns than older ones. Redesigning the multi-year
program to align with the needs of younger anglers will increase overall revenue to PFBC. Slight
discounts should be considered for anglers under 24 years of age. Programs like student
discounts could increase retention rates significantly.
Channel Engagement: An observed flaw in the multi-year license offering is that licensing
agents (retailers) have little to gain by selling high-priced licensing options. As mentioned
before, the angler discount comes with the omission of transaction fees when purchasing
additional years. Regardless of the license type, retailers receive $1.00 per transaction and must
cover credit card processing fees. Smaller retailers were observed discouraging anglers from
purchasing multi-year licenses. A disincentive for these stores is that they receive fewer visits to
capture merchandise sales. Larger retailers approach the situation as a customer service, which
they are willing to provide regardless of the dollars lost. To gain more traction in the multi-year
license program, the sales channel should be incentivized to make the sale.
Eventually, license prices will increase. The chart below shows the retailer income from one
license sale based on a 2% credit card processing fee, a proposed price increase in 2017, and a
3% price increase in the years after. It’s estimated that the breakeven point for retailers is $48.10
per license, a price greatly exceeded by multi-year licenses. A few retailers only accept cash for
license purchases, while others absorb the transaction costs. Across the United States consumers
used credit or debit cards for 90% of transactions.
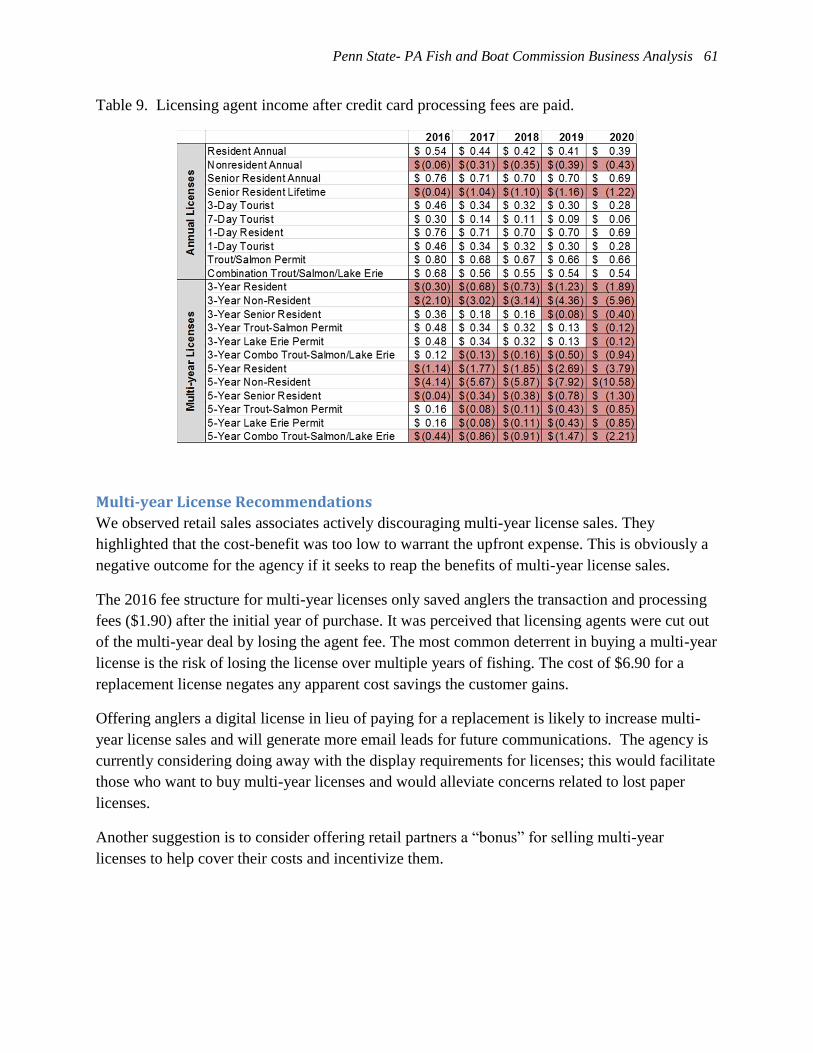
Penn State- PA Fish and Boat Commission Business Analysis 61
Table 9. Licensing agent income after credit card processing fees are paid.
Multi-year License Recommendations
We observed retail sales associates actively discouraging multi-year license sales. They
highlighted that the cost-benefit was too low to warrant the upfront expense. This is obviously a
negative outcome for the agency if it seeks to reap the benefits of multi-year license sales.
The 2016 fee structure for multi-year licenses only saved anglers the transaction and processing
fees ($1.90) after the initial year of purchase. It was perceived that licensing agents were cut out
of the multi-year deal by losing the agent fee. The most common deterrent in buying a multi-year
license is the risk of losing the license over multiple years of fishing. The cost of $6.90 for a
replacement license negates any apparent cost savings the customer gains.
Offering anglers a digital license in lieu of paying for a replacement is likely to increase multi-
year license sales and will generate more email leads for future communications. The agency is
currently considering doing away with the display requirements for licenses; this would facilitate
those who want to buy multi-year licenses and would alleviate concerns related to lost paper
licenses.
Another suggestion is to consider offering retail partners a “bonus” for selling multi-year
licenses to help cover their costs and incentivize them.

Penn State- PA Fish and Boat Commission Business Analysis 62
New Private Boat Fishing Licenses
A member of the Pennsylvania Legislature has initiated conversations about creating a fishing
license class to cover privately-owned boats. This license would allow any Pennsylvania
resident, or non-residents, to fish from a licensed vessel without buying an individual license.
Such a license category would obviously alleviate the need for guests of the boat owner to
purchase a fishing license. While it is possible that the new category of license would increase
participation in angling, we also see the very real possibility that PFBC would suffer a net
revenue loss if the license were priced too low.
Private Boat Fishing Licenses in Chesapeake Bay: Delaware, Maryland, and Virginia are
Mid-Atlantic States offering private vessel fishing licenses which permit anyone to fish from the
licensed vessel if the boat owner is present. This license class applies to tidal waters only. It
appears to be a solution for the cooperatively managed waters of the Chesapeake Bay. Anglers in
these waters fishing license appear to greatly value the reciprocity between the states.
The Chesapeake Bay is managed differently than Pennsylvania’s aquatic resources. The states
surrounding the bay have minimal stocking efforts and larger, consolidated usage areas. Lake
Erie and the Delaware River Basin are the nearest examples of similar resources. The wildlife
and conservation agencies in these states are able and willing to forego revenue enhancements
from individual angler licenses.
There are several down-sides to states using this license category. First is that the states do not
obtain customer data because anglers on these private boats do not purchase a fishing license.
Second is that the private boat fishing licenses are currently not eligible to receive funds from the
federal excise tax program. In addition to collecting fees from individual anglers, these three
states also fail to collect $5.00 per individual.
Threats to PFBC Business Model
PFBC currently funds its operations through the sale of fishing licenses to individuals. License
sales are used to track participation, drive revenue, and receive federal grant funds. Hundreds, if
not thousands, of license sales are likely to be cannibalized by the suggested private boat fishing
license.
Opportunities for PFBC to increase revenues in the short and long term rely on the agency
collecting information and developing connections with active anglers. Throughout this report
strategies have been outlined to increase angler engagement and reconnect with lapsed anglers.
This report outlines strategies for cross-selling fishing licenses and boating permits as viable
means for PFBC to increase revenue streams. The suggested all-boat license is likely to
undermine these strategies and decrease total revenue.
The figure below shows how the proposed license creates an obstruction for new anglers to enter
PFBC’s system of angler retention and development. Any anglers fishing from licensed
motorboats will not become direct customers of PFBC and will thus remain anonymous to the
system.

Penn State- PA Fish and Boat Commission Business Analysis 63
Figure 13. Illustration of anglers remaining outside the PFBC system
Revenue Losses: PFBC and Penn State anticipate that tourist and non-resident licenses are most
likely to be cannibalized by the suggested license; however, we assume that some unknown but
significant number of resident licenses would be lost as well. Annually, PFBC could directly
lose between $87,000 and $350,000 from lost sales in non-resident and tourist categories.
Table 10. Estimated revenue lost based on attrition rates for non-resident and tourist license sales
Pricing Strategy for Private Boat Fishing Licenses
If the PFBC determines that it will offer this new form of license then it must decide what fee to
charge buyers. Maryland and Delaware offer annual private boat fishing licenses priced at $50,
with Virginia charging $126. PFBC should investigate the pricing logic these states used, ask
about volume of licenses sold, etc.
PFBC would need to price the license high enough that it would not suffer a net revenue loss
from persons who no longer need to buy a license. At this time we do not foresee a simple, easy
analysis pointing toward an optimal price for the license. Therefore, we suggest conducting a
market study prior to determining a pricing strategy.
The following research questions are among many that could be answered before a price is
formalized:
1. What percentage of registered boat owners also hold a current fishing license?
Attrition Rate 2.50% 5% 7.50% 10%
Revenue Loss $87,080 $174,160 $261,239 $348,319

Penn State- PA Fish and Boat Commission Business Analysis 64
2. How many fishing licenses holders purchase a license to fish from a boat owned by
another individual?
3. How many unlicensed anglers would be taken as guests on newly-licensed boats? How
many will be residents vs. nonresidents?
4. What percentage of boat owners use their vessels for fishing? What percentage would
fish if the new license is created?
5. What have been the experiences of other states adopting this type of license?
It’s likely that this license scheme will disproportionately help certain groups of people over
others. At this time we cannot state with certainty what the demographics will be of those
persons who would be fishing on a private boat without having to purchase a license. Before
creating a fishing license for privately owned boats, PFBC needs to be sure it will help reach the
agency’s strategic goals.
Figure 14. Overview of the implications for proposed all-boat license
Increased Access to Fishing in Boating
Community
Implications of Proposed Bill
Non-resident AnglersTourists and visiting anglers could bypass licensing system and create a large funding game for PFBC
Resident AnglersHigh churn rates continue to plague fishing participation numbers. This bill could exacerbate the situation and encourage anglers to lapse.
Opportunities Threats
Decreased Angler Transparency on
Resource Use
Cannibalization of license sales, loss of
out of state sales
Training anglers (customers) to bypass
licensing system
Boating is only accessible to small segment of PA
residentsAttrition Rate 2.50% 5% 7.50% 10%
Revenue Loss $87,080 $174,160 $261,239 $348,319
Anticipated Revenue LossesBased on cannibalization of Non-resident license sales. Program will not gather angler information, therefore
measuring success will be limited.

Penn State- PA Fish and Boat Commission Business Analysis 65
Product Management Practices
PFBC has introduced several new products and services over its existence. This includes
stocking programs, license structures, boating permits, and even educational programs. The
activities of the agency continue to evolve to meet the needs of anglers, boaters, residents, and
aquatic resources. Few rigid practices have been observed within PFBC for expanding projects
or reducing the size of programs. Implementing a formal product management process can help
the agency make better decisions for strategic investments and new product development.
The Stage-Gate® Process is a method used by many corporations to ensure that new products
and investments meet the needs of current or future customers and will generate profits over the
product life cycle. Therefore, concepts with little return are abandoned early in the process.
PFBC does commission studies on some its activities, especially in regard to stocking programs.
These reports have been used to inform strategies for stocking muskies, trout, and paddlefish.
We recommend using a process, like the Stage-Gate® Process for investigating strategic
investments like boater access points and new products like a 10-year license.
A product management process will force the agency to ask the right questions and ensure that
the benefits will overcome implementation costs. In the current environment, the agency can be
forced to act on a whim by certain key stakeholders. Having a formalized process can ensure that
all decision makers have the right information before pursuing a project. These processes can
also aid in mitigating internal and external politics (e.g., the process could be used with
stakeholder requests for changes in practices, policies, etc.).
The figure below illustrates the Stage-Gate process used by many manufacturing companies.
Gates are decision points; actions happen in stages.
Figure 15. Stage-Gate process overview

Penn State- PA Fish and Boat Commission Business Analysis 66
Women & Youth Angling
To better communicate with Pennsylvania women and children, the Bureau of Outreach,
Education, and Marketing hired a professional who is dedicated to targeting these groups.
PFBC needs to diversify its revenue from certain angler groups, and there is considerable hope in
attracting more women. In 2010, only 15.2% of fishing license revenues came from females. By
2016, it climbed to 18.45%. There are considerable regional gaps in female participation. The
chart below shows strong growth in the North Central region. The South East is behind in growth
and total revenue from women anglers.
The Bureau of Outreach, Education, and Marketing will need to strategically allocate resources
to diversify and secure revenues for PFBC. The southeast is the region of greatest strategic
importance for PFBC, so the marketing effort should be directed to increasing female
participation in that region.
Calculations above exclude add-on purchases such as trout and Lake Erie permits.
Women purchased 283,184 general fishing licenses in 2016. Assuming linear growth patterns,
Pennsylvania is predicted to only increase licenses sales to women by 8,743 anglers between
2016 and 2021. It’s recommended that PFBC establish aggressive growth goals for participation
by female anglers. Achieving 25% of general license revenue from female anglers by 2021 can
be accomplished by increasing female participation by 19,041 anglers.
The graphic below tells a story of predicable revenue spikes and declines for men and women.
PFBC predominantly benefits on license sales of people between 16 and 65 years of age.
PFBC Region NW NC NE SW SC SE Non-
Resident Total
2016 Revenue
from Women 21.84% 22.57% 20.46% 20.22% 20.23% 15.61% 11.42% 18.45%
5-Year Annual
Growth 0.65% 0.82% 0.65% 0.74% 0.68% 0.49% 0.30% 0.61%
2017 Expected 22.49% 23.39% 21.11% 20.96% 20.91% 16.10% 11.72% 19.06%
Table 11. Percentage of general fishing license revenue from females by region

Penn State- PA Fish and Boat Commission Business Analysis 67
Figure 16. PFBC Revenue by gender and age
Scaling PFBC Outreach and Education
PFBC has observed revenue bumps from increasing outreach activities to youth and women.
PFBC has leveraged partnerships with groups like Trout Unlimited to promote outdoor education
in schools and YMCAs, as well as conduct angling courses for women.
Interviews with children and women who experienced these opportunities showed signs of
increased knowledge and enthusiasm for fishing. One feature that appears to be missing is
scalability of the programs. Because only a few individuals are teaching, interest must be
generated for very specific times and regions. Additionally, nearly all licenses are purchased by
June of every year and plans should be developed to spread out license sales to these groups.
Education Course Recommendations:
1. Recruit larger pool of educators for women and youth by leveraging special interest
groups (Trout Unlimited, B.A.S.S., etc.)
2. Create a state-wide initiative for efficient marketing
3. Use a consistent message to promote regionally offered courses
4. Position course offerings prior to opening day of trout
5. Continue use of targeted social media engagement (already started by PFBC)
Increasing the scale of educational courses will increase the efficiency of marketing efforts and
show noticeable sales spikes for the targeted demographics.

Penn State- PA Fish and Boat Commission Business Analysis 68
First Catch Center Pilot Program
PFBC has proposed a “First Catch Center” as an opportunity to broaden the scope and reach of
its Outreach and Education programs. This Center would be a pilot for RBFF’s First Catch
Center Concept and builds on funds bequeathed to the Commission from the Guan Estate.
Specific programs would include: “I’m a Smart Angler”, “Family Fishing Program”, “Fishing
Skills Instructor Program”, and “Informal Meet-up Events”.
Target Audience: The target audience of the Guan Fishing Center units is the Philadelphia
Census MSA, which includes Philadelphia, Delaware, Chester, Montgomery, and Bucks
counties. Traditional license sales in this MSA have been weak, with anywhere from 1% to
3.5% of the available population purchasing a fishing license.
Activities of the Gaun Fishing Center will focus on Philadelphia County, where 38% of the
population in the PA portion of the MSA resides. As a result, the majority of the time invested in
this project will be spent there, with no less than 50% of the programs and events occurring in
that county. Within the Philadelphia MSA, youth and families are being targeted. Children
between the ages of 8 and 15 along with their families are the target for FFP and SMART
programs.
The instructor program and meet-up events will primarily target adults, but will not exclude
anyone. Unique relationships with existing groups in the Philadelphia MSA are being formed to
capitalize on known programming needs, physical site considerations, and partnership/volunteer
opportunities. These include the Mid-Atlantic Youth Anglers & Outdoors Program and its
school connections, the Philadelphia Health Management Corporation and its 172 sites for after-
school and summer program locations, and assistance/partnership from the Union Sportsmen’s
Alliance.
Other partners within the region will be an important segment of the target audience. These
partners will increase the PFBC’s capacity to provide programs and services in the region, which
will indirectly target the partners’ members in the recruitment, retention, and reactivation
process. These organizations include:
City of Philadelphia Department of Parks and Recreation
Schuylkill Banks/SCHUYLKILL RIVER DEVELOPMENT
CORPORATION
PA DCNR, Bureau of State Parks
US Fish and Wildlife Service, John Heinz National Wildlife Refuge at
Tinicum
County and local parks departments
Get Outdoors Pennsylvania (GOPa) partners
Activities will be held on average 2-3 times per week during the second and third quarters.
Expected reach of the Gaun Fishing Center units would be greater than 9,000 individuals. This
Penn State- PA Fish and Boat Commission Business Analysis 69
proposal could become an excellent avenue to both “scale” Outreach efforts and also do so in
one of the key target markets for PFBC.
Continue to Simplify Fishing Regulations
Considerable efforts have been made by PFBC to simplify regulations for angling. We see
evidence, however, that perceived complexity by current and would-be anglers is a factor in
keeping them from engaging more in fishing as a recreational activity. Our interviews with
lapsed or non-anglers pointed towards fear of making an innocent mistake and getting cited as a
reason for not fishing. It was clear to us that the fishing regulations book is intimidating to many
persons, and perhaps more so to non-English speakers and females.
While it’s agreed that best conservation practices vary by waterway and species, communicating
these laws can be difficult for anglers and non-anglers to interpret. Leadership should examine
all regulations and consider whether they are necessary. This is an instance where employees
should view the challenge through the lens of a customer (or as a marketer) instead of through
the eyes of a biologist or WCO.
Management and Organization
Our observations of the agency over the past 15 months have indicated that operations are
generally well managed. But like any large organization, there are most likely places where
management could be tweaked to improve efficiency, decision-making, etc.
Decision-making is the most important task for leaders and upper managers. Every organization
should have a structure in place that allows for good decision-making. The PFBC is faced with a
very challenging financial future and it will be required to adopt multiple changes, some large
and some small, in order to continue meeting its objectives and fulfilling its mission. These
challenges will require an even greater emphasis on strong management processes, structures and
personnel.
General suggestions:
Clarify and modify role of Commissioners to meet changing needs of agency
Change make-up of Commissioners to better reflect target audiences for PFBC products
and services
Elevate status of managers with experience running a multi-million dollar organization.
If they do not currently exist within the agency then make a priority to hire someone in
the near term.
Clarify roles of managers at all levels so each understands his or her responsibilities as
they relate to key functions. Publicize these roles throughout the agency.

Penn State- PA Fish and Boat Commission Business Analysis 70
All personnel should be clear in terms of who runs what portions of this “business” on a
day-to-day basis.
Revisit current management structure/hierarchy and modify as necessary to meet new and
future challenges
Change Management: We view “change” as one of the biggest challenges facing the agency.
Being able to change to overcome challenges or take advantage of opportunities is one of the key
factors in an organization’s ability to survive over the long term. Management structure, along
with internal policies and procedures, can hinder or facilitate an organization’s ability to
effectively adopt needed changes. We did not delve deeply into this issue at PFBC but from the
outside looking in it seems obvious that the agency is not able to effect change as quickly or
easily as necessary. We would suggest that matters such as organizational structure, policies,
and supervisory roles could be modified to improve the agency’s ability to effect needed
changes.
In other sections of this report we have suggested decreasing or mitigating the influence of
external stakeholders on agency operations and decision-making. One thing to be considered is
whether the Executive Director should take a greater role managing big picture challenges like
this. If so this might require delegation of some leadership responsibilities to a “chief operating
officer” position and movement of the Executive Director to a somewhat different role more like
a corporate chairman who has less time to devote to day-to-day operational decisions.
Management structure and authority is directly related to our next section on strategic investing.
Strategic Investments
A “strategic investment” by a company is one that is intended to make it more successful over
time. Non-profits and government agencies should make strategic investments just as a
corporation would.
We noted several times in our interviews with agency personnel a belief that PFBC could
improve at making strategic investments as they are needed. Investments of funds would range
from infrastructure (fixed assets) to vehicles to hatchery operations. Obviously, a manager
operating a production facility will almost always ask for more investment so they can update
their own operations. This is to be expected and is not necessarily a bad thing, but this makes it
hard for us to know whether certain PFBC operations legitimately needed more investment or
not.
We suggest that bureau directors have more say in making investment decisions; we observed
times when there was a lack of empowerment at the bureau level to make strategic investments.
Leadership should consider whether policies and procedures could change to provide increased
ability to make strategic investments with added flexibility for making investments.

Penn State- PA Fish and Boat Commission Business Analysis 71
However, upper management will have to balance increased power for bureau directors with the
need to make hard decisions at the agency level, which could restrict bureau budgets and
operations. This will be especially relevant with possible closure of hatcheries and cut-backs in
fish production.
Deciding which fish species to raise, and in what volumes, could be considered as a strategic
investment. These decisions could lead to reduced expenses but could also lead to reductions in
hatcheries output that will cause angst with certain stakeholders.
We see several related issues that will need to be deliberated internally to determine if this is a
method that could be used to determine future fish production.
Nearly all fish raised by PFBC are raised for “commercial” reasons. This implies that an
analysis could be done to determine which species are in high/low demand and which
provide a higher return on investment. We would thus suggest that the agency works
toward such an analysis with a goal of understanding which fish provide most “value” to
the customer, which provide low returns on their investment to the agency, etc.
Could the agency stop raising fish that do not have an adequate return on investment?
We suggest that leadership conduct an ROI analysis for each species.
Conducting an ROI on fish species will be difficult to do in large part because there is no
accounting system that can accurately allocate costs per species per hatchery. From the outside
this would appear to be a weakness in the accounting system that should be remedied.
Data Analysis Capabilities
PFBC needs to have personnel dedicated to analyzing current customer data and enriching
transactional data. This position within the Bureau of Outreach, Education, and Marketing would
be responsible for generating insights on customer needs, designing customer surveys, and
executing digital marketing strategies. A person in this position will also identify underserved
markets and suggest methods of connecting to them.
The estimated salary for a specialist in consumer insights, customer relationship management, or
marketing analytics is $57,000-76,000 in Harrisburg without benefits.
This could potentially be a revenue generating position. Selling market reports to private
companies could help fund this position.
Emphasis on Boating
As noted elsewhere in this report, unpowered boating participation is on the upswing while
fishing is flat or declining. It is obvious that the boating side of the Commission is currently

Penn State- PA Fish and Boat Commission Business Analysis 72
smaller in terms of both revenues and overall investments (e.g., no hatcheries), but that does not
mean that boating can’t receive more emphasis going forward.
Our overall suggestion is that the agency put more emphasis on boats and boating as a source of
revenue. This will require additional funds or at the least a strategic shifting of investments with
a goal of increasing boating-related revenues. Leadership may also want to reconsider whether
boating should be under Law Enforcement or whether Outreach and Marketing should have
greater oversight.
Stakeholder Influence
The PFBC is obviously an agency of the Commonwealth and therefore has a goal of meeting the
needs of constituents. We have observed, however, that at times stakeholders have considerable
influence over operations of the agency. This influence can be seen as healthy in that
stakeholders may be acting as “the voice of the customer” but the downside is the potential for
external forces to restrict PFBC’s ability to implement change and/or meet its strategic goals.
A Commissioner reminded us that the Commission itself is supposed to be independent and was
originally designed to keep politics out of the agency. It appears obvious to us, however, that
politicians can occasionally have an impact on the agency.
It is our opinion that agency leadership should make a concerted effort to answer “How do we
change this?”. Below we offer a few suggestions, but this effort will require much greater work
on the part of Commission leadership.
Keep the agency focused on strategic goals and directions while communicating to
stakeholders the importance of not swaying too far from them.
Insulate Commission from micro-management by external stakeholders.
Upfront work should be done to “smooth the way” for proposed changes so that members
of the Legislature are aware and not caught off guard.
Clarify the role of the Commissioners
o Commissioners help to set the direction of the Agency but should follow
guidelines on how to do this.
o Communicate with Commissioners to clarify their role and expectations.
o Should their role be like a board of directors or simply an advisory group with no
specific powers?
Align Commissioners with direction of the Agency
o Commissioners should understand the strategic direction of the agency and be
supportive of leadership’s plans and efforts to meet those goals.
o Alignment with respect to expense reduction strategies, revenue enhancements,
and the 2017 strategic plan will be especially important.

Penn State- PA Fish and Boat Commission Business Analysis 73
o Hold “governance sessions” for current and all future Commissioners to help
them understand the agency and their roles in it.
o Work to communicate early in any change process in order to smooth the waters
and sell any new plan to Commissioners.
Stakeholders also include anglers, and while the agency needs to listen to the voice of the
customer, there seem to be times when anglers have too much influence over actions of
the agency. This influence can pressure the agency to do things it might otherwise not do,
and can restrict the ability to enact needed change.
o How can leadership reduce the undue influence of anglers who, perhaps for
selfish reasons, just want to have more fish stocked in their stream? Is there a
way to insulate decision-making from individual angler pressure?
o This will seemingly require assistance from the Commissioners since they often
are a conduit for the voice of individual anglers.
RBFF “60 in 60” Campaign as Stakeholder: We thought it relevant to add a discussion of the
RBFF as an external stakeholder that is trying to influence actions of the agency.
The Recreational Boating and Fishing Foundation (RBFF) launched the “60 in 60” campaign
starting in April 2016. This is a national marketing campaign to reach 60 million active anglers
and boaters in 60 months. Recruitment, reactivation, and retention tool kits are to be the drivers
for states to increase participation. A full national advertising campaign, including television ads,
leads viewers to TakeMeFishing.org to learn how they can engage in the sport.
The 60 in 60 campaign aims to lift the economic impact of anglers and boaters across America.
By adding 14 million anglers, RBFF aims to increase total fishing license revenue by $500
million across all states and increase economic contributions from anglers by $35 billion.
Additionally, boating participation is to increase by 7.5 million and economic contributions will
increase by $10 billion from new boaters.
Conflicting Goals: Every state agency was asked to participate in the 60 in 60 campaign and
was tasked with a fishing license sales quota. PFBC has been challenged to increase fishing
license sales by 199,166 anglers by 2021. RBFF estimates that PFBC would gain almost $5
million in annual license revenue (more if trout permits are included).
We don’t believe that Pennsylvania could reach its 60 in 60 participation goals if license prices
are increased. Past experience predicts that total participation will drop after a price increase due
to price sensitive anglers leaving the sport. PFBC can guarantee a similar revenue increase by
raising license prices as is currently proposed.

Penn State- PA Fish and Boat Commission Business Analysis 74
In summary we see the following:
a license fee increase is necessary for PFBC to meet its revenue needs
license fee increases result in a decrease in angler participation
decreases in participation are in conflict with the RBFF “60 in 60” campaign
RBFF goals conflict with current direction of participation trends in Pennsylvania and
across the country
PFBC is not obligated or committed to achieving the goals set by RBFF. However, the risk of
increasing license prices and dropping participation is losing favor with a powerful ally in the
sportfishing industry. RBFF is an important representative of fishing and boating agencies,
manufacturers, and retailers.
PFBC leadership will need to consider whether keeping external stakeholders like RBFF happy
is an important objective if it will cause the agency to stray from current objectives and
strategies. In this case it would appear that RBFF objectives for large increases in participation
are competing against agency plans for price increases which would lead to lower participation.
Responding to Trends
As noted above, all organizations should be aware of trends that are currently, or will in the
future, impact their operations and overall viability. The following section will provide
suggestions on how to take advantage of or mitigate each trend.
Trend 1. Urbanization
Pennsylvania’s population is becoming less rural and more urban. The population will continue
to concentrate in the larger metropolitan areas. If the casual angler is unwilling or unable to
travel, or has the perception that cities offer poor opportunities for fishing, then they may not
renew their licenses. Similarly, if city dwellers do not perceive fishing and boating to be viable
recreation options (in their local areas or elsewhere) then they may never even consider those
activities.
It would appear that the Commission will have a difficult road ahead if it continues to depend
largely on rural anglers and boaters to buy licenses and fund operations. Therefore, we believe it
is critical that strategic planning focus on how to bring in more license revenues from urban
areas.
Response 1: PFBC will need to provide urban fishing and boating opportunities if it is to take
advantage of population shifts or the large numbers of urban citizens who do not currently buy
fishing licenses. We would reiterate that many persons may have the perception that the greater
Philadelphia area, for example, is not a good place to fish. Thus, the agency will have to work
on clearing up any such misperceptions.

Penn State- PA Fish and Boat Commission Business Analysis 75
Response 2: Educating urbanites as to the opportunities for and benefits of fishing as a recreation
activity will be necessary. The vast majority of city dwellers has never fished and has few
friends or family members to introduce them to the sport.
Response 3: Urbanization in today’s world also means greater diversity in the population. This
implies that PFBC marketing and outreach programs and materials will have to be designed to
appeal to a much broader audience than they have historically. Promotions may have to be
written in multiple languages. Web sites may have to be redesigned.
Trend 2. Increased Competition for Recreational Time
Sports and recreation are becoming increasingly segmented to suit the needs and desires of its
participants. Youth are exposed to many different choices with which to spend their leisure time
(and they are spending less of it outdoors). Fishing as a recreational activity has been negatively
impacted by this trend and even though RBFF and state-level groups have worked to counteract
the trend there has not been much success on a large scale.
Response 1. Work to understand what is the competition for your “product”. PFBC should focus
marketing research activities on understanding what other activities compete for the time and
money of customers.
Response 2. Can we make fishing more relevant as a recreational option? This would
seemingly require more and different marketing approaches to appeal to potential customers.
Response 3. Increase convenience of fishing. The American Sportfishing Association noted that
inconvenience is one of the main reasons people cite for fishing less or not fishing. Recreational
time is scarce and in decline. Fishing must be convenient. Most potential anglers do not live in
rural areas, so fishing opportunities and access in urban and suburban areas must be provided,
promoted and protected. The promotion of affordable, guided trips where anglers can show up
with minimal equipment or preparation and enjoy a fun fishing experience is another important
tactic. Local programs designed to allow anglers to borrow or rent gear and receive easy,
affordable instruction can also help.
Trend 3. National Participation Trends in Outdoor Recreation
Participation in outdoor recreation activities is decreasing. Fishing participation is on a
downward trend that corresponds with the overall decline.
Response 1. Hire R3 Coordinator
Many stakeholders in the private sector are attempting to counteract the trend toward less
participation in fishing and boating. The Recreational Boating and Fishing Foundation (RBFF) is
spending considerable time and effort to increase recruitment, retention, and reactivation (R3)
activities at the state level. RBFF and its backers are urging states to hire specific R3
coordinators to conduct state-wide programing to reach participation goals in line with its “60 in

Penn State- PA Fish and Boat Commission Business Analysis 76
60” campaign. We are somewhat skeptical about the ability of a new coordinator to make a
tangible difference in sales and meet the “60 in 60” campaign goals.
Trend 4. Customer Digital Engagement and Social Media
Americans in general, and younger generations in particular, are increasingly engaged with their
digital devices as part of what has been termed the “digital life”. We see this trend as having
multiple implications for the agency
Response 1. Enhance social media presence.
PFBC is seeking two-way communication with anglers through Facebook. In addition to
pursuing high rates of engagement, the agency can use social media to change brand perceptions
and build stronger connections with non-anglers. Elsewhere in this report we make suggestions
for how best to engage with customers via Twitter etc.
Response 2. Do away with display requirements and digitize licenses.
Removing license display requirements and digitizing licenses will adapt the product to the
changing needs of Pennsylvania anglers, and should appeal to younger customers who are used
to digital resources instead of paper documents. The display requirement blocks many strategic
options which could increase multi-year license sales and on-demand purchases.
Response 3. Provide on-demand purchases of licenses at waterways.
In the digital world, products and services are available anywhere and at any time. Consumer
behavior has dramatically shifted and PFBC should catch-up. On-demand purchases will allow
PFBC to make license sales at any point in a fishing trip.
Trend 5. Retail disruption
Traditional bricks-and-mortar retail stores are being replaced by on-line organizations. This
trend is directly related to trend #4 above, and while somewhat minor in terms of current impact
on PFBC, it has the potential to cause additional disruption if not dealt with.
Response 1. Diversify license distribution.
Diversifying options for license distribution should be a point of emphasis for PFBC leaders. As
noted elsewhere in this report, online sales of licenses is one way of diversification that also
responds to customer demands for electronic access to licenses.
Response 2. Enhance online sales and marketing capabilities
Direct-to-consumer sales are increasingly important for product manufacturers. While PFBC
does operate a website, it can improve sales by executing digital marketing tactics to encourage
add-on sales. Improving self-promotion is critical for the agency to grow revenues.
Penn State- PA Fish and Boat Commission Business Analysis 77
Readers should see the “online sales” section below for additional information related to this
trend.
Trend 6. Organizational Transparency
The trend toward stakeholder demands for more openness could have an increasing impact on
PFBC. We are not sure what forms this might take but it seems apparent that there will be cases
in the near future when the agency will need to make changes that will not be popular with some
external group.
Response 1. Openly discuss and justify price increases
This response may be especially relevant and necessary if the agency is allowed to significantly
raise fishing license prices in 2018. The goal will be to convince concerned stakeholders that the
agency has no alternative to increase prices.
Response 2. Openly discuss and justify need to cut operating expenses.
From an expense perspective, the agency should have a smoother road if it convinces external
audiences that, for example, cutting a hatchery or total fish volume is necessary.
Trend 7. Increasing popularity of unpowered boating
This is a very positive trend for the agency and is an opportunity that should not be missed.
There are multiple categories of unpowered boats that are rapidly increasing in popularity and
the agency should capture this potential revenue.
Response 1. Increase sales of launch permits.
Strive to sell a launch permit to the vast majority of unpowered boat owners. This will require
additional marketing focus on the many persons who are first-time buyers of kayaks or paddle-
boards. Our limited research in this area suggests that most of these first-time boaters do not
know they need a launch permit (especially for paddle boards).
Working with retailers to inform buyers will be an important step. Kayaks are so popular they
are now being sold by non-traditional retailers such as Tractor Supply, and yet our interviews
revealed that staff at these stores have little or no knowledge about regulations or where to even
buy a launch permit. The agency should have someone working with retailers to change the
status quo.
Further, we believe that PFBC should work with DCNR as partners to increase participation in
boating (and fishing) while targeting an increase in overall sales of launch permits.
Response 2. Co-market fishing opportunities to new boat owners.

Penn State- PA Fish and Boat Commission Business Analysis 78
The agency should promote fishing opportunities to all persons identified as a new boat owner.
At this time the agency’s system is not conducive to co-marketing between boats and anglers, but
this needs to change in the near future.
Co-marketing to the increasing number of new kayak anglers will be also be an important
response.
This would be another opportunity to work with DCNR to co-market opportunities for fishing
and boating on their lakes.

Penn State- PA Fish and Boat Commission Business Analysis 79
X. Strategic Planning
This document will feed into the new strategic plan and help guide PFBC leadership as it
prepares for the next cycle. We have included suggestions within previous sections of the report
but provide a review of specific recommendations below.
As leadership considers planning and goals for the next strategic plan it would be wise to address
several additional considerations. For example, are the SMART goals for strategic planning
primarily written in isolation by a small number of managers? If so this may preclude other key
personnel from taking part in the process and providing feedback. Could this process be done
with earlier feedback from Bureau leaders? Are Bureau leaders in a position to assist with
strategic planning and goal setting and do they always have the “big picture” agency goals in
mind?
It was noted that some staff positions are hard to put into the SMART goal system. Is there a
way that the system could be changed so that more people are engaged with the strategic plan?
Does the agency need all personnel and all departments to fit into the strategic planning process
in some form?
Figure 17 provides a brief overview of how we see the strategic planning process.
Figure 17. Overview of strategic planning process for PFBC
Strategic Planning Process
Review of 2014-2017 Strategic Plan
Organizational Analysis
Recommendations for Future Strategic Plans
Strengths- SMART Goals are a start- Clear objectives are outlined in the plan- Outlines clear financial priorities- Objectives are attainable based on forward insights- Contains milestones
- Create a bold, tangible vision of the organization. Rock the boat.- Incorporate role of each bureau in reaching goals.- Place ownership of milestones on bureaus.- Consider addressing adjacent, large opportunities: environmental protection
and outdoor recreation.- Describe the future beyond the planning cycle, 5-10 years out.
Weaknesses- Lacks strong strategic priorities, such as gaining
participation, specific revenue development, etc.- Fisheries: Environmental monitoring = more anglers- Law Enforcement: Safety and vigilance- Some milestones lack strategic significance due to lack
of strategic priorities. - Financial projections, even if grim, should be included- Paints a picture of a stagnant organization

Penn State- PA Fish and Boat Commission Business Analysis 80
Future Strategic Goals
The following section outlines our suggested strategic goals for the next planning cycle. We
have put quantitative goals/metrics with some of these but for most the agency will have to
consider what goals are possible and then put them into the SMART model.
Across Agency
1) Continue pursuing revenue from state sales tax on fishing and boating equipment
2) Pursue revenues from a statewide “water use fee”
3) Match trout production costs to trout stamp revenues by 2019
a. Use trout stamp sales as index to production
b. Accelerate matching of fish allocation to population centers
4) Decreased reliance on fixed assets for fish production
a. Utilize and grow co-op hatchery program
b. Be open to purchasing commercially produced fish
5) Strategically pursue options for outsourcing to reduce expenses
a. Biological services, education, marketing, etc.
b. Boat registrations to Pennsylvania Department of Motor Vehicles
c. Some Marketing functions to advertising agencies
d. Fisheries to lean on work of interest groups like Trout Unlimited
6) Increase use of Co-op Hatchery Program to outsource fish production
a. Goal is to allow decreasing amount of fish produced at PFBC Hatcheries
7) Increase cross functional coordination with respect to demand planning for number of
fish
8) Establish a process for developing new products, programs, and strategic investments to
ensure the best opportunities are implemented and the least impactful projects are
abandoned early
License Sales
1) Diversify revenue sources by increasing general license sales to female anglers
a. Accelerate annual growth of women anglers to 1.31%.
b. Increase license revenues from female anglers to 25% by 2021
c. Add 19,041 female anglers by 2021
2) Increase revenue from boats/boating by >10% per year
3) Consider a mandatory licensing requirement for unpowered boats
a. PFBC staff in 2012 predicted this change could bring in more than $1million in
revenues. This figure is likely higher today given increasing popularity of
kayaking and paddleboarding.

Penn State- PA Fish and Boat Commission Business Analysis 81
4) Index fish production to fishing license participants
a. A fishing license price increase will decrease the number of anglers in
Pennsylvania, so fish production should also decrease
5) Average Online Sale: Many digital marketing professionals look for 5% conversion rates
for cross-selling and up-selling. Increasing the average receipt by 10%, to $39.20 by the
end of 2018 should be accomplishable.
6) Lead Generation: Roughly 70% of Americans have an email address. PFBC should strive
to have emails from 70% of current anglers by 2019.
7) Incentivize retailers to sell licenses (esp. multi-year)
8) Replace PALS system with one having more capabilities
Marketing
1) Increase budget of Outreach and Marketing by at least 25% over next three fiscal years.
a. Eventual target should be 50% higher than current.
2) Measure demographics of existing angler base
a. Expand on current PALS customer transaction data by sample surveys by 2018.
b. Use this information to target new demographic groups, especially in cities.
3) Create new position in Bureau of Education, Outreach, and Marketing to focus on
customer data
a. Monitor angler and boater demographics
b. Continuously monitor angler and boater needs
c. Advise on methods for connecting to key demographics
d. Create and administer digital surveys
e. Initiate digital marketing tests before large-scale email campaigns or website
designs take place. This is often called A-B testing.
4) Create process for generating customer insights
a. Conduct focus group sessions with current and potential anglers
b. Determine best practices for gaining customer feedback
c. Collect preference information at customer contact points
d. Base strategic decisions on PFBC-generated insights
e. Use frequent digital surveys to capture angler and boater needs
f. Generate market reports to generate revenue
5) Create cross-selling capabilities across angling and boating categories
a. Acquire ability to combine the customer data of fishing license sales and boat
registrations
b. Capture information from Launch Permit holders
6) Increase PFBC conservation brand awareness by 50% by 2019
a. Migrate PFBC brand to include conservation activities
b. Re-position PFBC away from Pennsylvania Game Commission

Penn State- PA Fish and Boat Commission Business Analysis 82
c. Develop conservation product for non-anglers and non-boaters
d. Collaborate more with DCNR
7) Increase emphasis on more boat registration and permit revenue
a. Tie in immediate purchase of boat permit at lake to new online program to
increase revenues
b. Tie into new branding of agency at waterways
c. Improve launch permit sales process to take sales from DCNR
8) Consider strategically outsourcing marketing-related tasks to reduce personnel needs
a. utilize advertising agencies
9) Analytics is an important area that should receive more attention, and may be a candidate
for outsourcing
10) If proposed fee increases are allowed then the agency will need to write a new
marketing/promotions plan to help mitigate the increased costs
11) Continue focus on southeast and southwest Pennsylvania
12) Create marketing materials for non-English speaking audiences and test market those for
effectiveness
13) Increase focus on boats/boating
14) Increase focus on female anglers
15) Create a Social Media strategy by December 31, 2017 and put it in place during 2018
Suggestions from SWOT Analysis
We have provided readers with our view of agency strengths and weaknesses, plus some of the
opportunities and threats. A full SWOT analysis would dig more deeply into the key areas and
strategize about how to deal each.
In sum, we can provide the following advice on how to build strategy from the various
observations and analyses:
Build on the organization's strengths.
Recognize weaknesses and correct, where possible.
Take advantage of opportunities. This is what drives the strategy.
Recognize threats to the organization and take steps to minimize the effects.
We would again emphasize that a major consideration for agency leadership is the influence of
external stakeholders. From a SWOT perspective we see this as both a weakness and a threat.
Some stakeholders may attempt to influence agency practices at the micro level without concern
for impacts on costs, revenues, or other constituents. Some may influence the agency in ways

Penn State- PA Fish and Boat Commission Business Analysis 83
that might push PFBC away from its strategic objectives. Few organizations can survive or
thrive without the ability to pursue strategic objectives unfettered by external stakeholders. This
is especially true when the organization needs to adopt changes and external stakeholders
severely limit the ability to change.
A key goal of leadership, including Commissioners, should thus be to work toward insulating the
agency from undue influence by external parties. We acknowledge that constituents such as
boaters and anglers are the primary customer for the agency and thus PFBC should always
consider the wants and needs of those groups when making decisions.
We also note that the agency’s reserve fund should be seen as a “strategic strength” and should
be maintained as a type of rainy day fund for unforeseen needs. It would weaken the agency if
the reserve fund were depleted to zero.
Penn State- PA Fish and Boat Commission Business Analysis 84
XI. Concluding Thoughts
Some experts have said that the real value of a business plan is not so much the finished plan
itself, but more so in the process necessary to research the organization and think about the
“business” in a systematic way. The act of planning provides value in large part because it
forces leaders to thoroughly consider various options and to look at those options through critical
eyes. We hope that this process has not only provided actionable suggestions but has also helped
leadership to think more critically about its operations.
The agency’s strategic plan is currently written over a two year time horizon. And yet one of the
things we’ve heard in our investigations is that many plans developed by staff could take 3-5
years to put into place. This suggests that leadership should consider a section of each strategic
plan that will consider longer-term strategies and outcomes more in line with other planning
horizons.
PAFBC leadership should ask where the agency is going to be in the future. Examples of
questions to ask include:
Will you be primarily fish farmers?
Should the agency be involved in resource protection?
Will primary sources of revenue remain license fees?
A “futuring” exercise could help personnel to not only surface these key questions but also to
begin the discussion on answers as to how the agency will look in 5 or 10 years.
The Pennsylvania Fish and Boat Commission has a long history of providing a plethora of
opportunities and benefits to the Commonwealth and its citizens. The agency depends primarily
on license and fee revenue to provide these “common goods”, many of which are not
reimbursed. This business model has worked in the past but is at risk given the many factors
impacting agency revenues and expenses. We urge PFBC leadership to make the difficult
decisions and changes necessary in order to maintain its role as a conservation and recreation
leader, and further urge PFBC stakeholders to allow the agency to make the necessary changes.

Penn State- PA Fish and Boat Commission Business Analysis 85
References
Brown, B., Kanagasabai, K., Pant, P., & Pinto, G. S. (2017, March). McKinsey.com. Retrieved from
Capturing value from your customer data: http://www.mckinsey.com/business-
functions/mckinsey-analytics/our-insights/capturing-value-from-your-customer-data
About the Authors
Dr. Judd Michael is a Professor in the Department of Ecosystem Science & Management at Penn
State. He does research and teaches on topics related to business management for natural
resource industries. He has a BS in Marketing and an MBA, and a PhD in Forest Resources.
Ryan Laudermilch was an MBA student in Penn State’s Smeal College of Business during the
writing of this report, graduating in May, 2017. Ryan is an avid fisherman and has extensive
experience in the outdoors industry from both product development and retailing perspectives.
Contact information:
Dr. Judd Michael
211 Forest Resources Bldg
Penn State University
University Park, PA 16802
814-863-2976
Acknowledgements This project was made possible by a grant from the Fish and Boat Commission. Additional funding was
received from Penn State’s Department of Ecosystem Science & Management. We thank both those
groups for the opportunity to conduct this analysis.
We also thank the leadership of PFBC and the many employees and Commissioners who gave us their
time, knowledge and feedback during the project.
Daniel Bellet and John Brodie were additional MBA students who assisted with early portions of the
project. PhD student Maryam Shahri also contributed to portions of the report.