pennsylvania public utility commission · in the first biennial report to the general assembly and...
TRANSCRIPT

PennsylvaniaPublic Utility Commission
Third Biennial Report to the General Assembly and the Governor
pursuant to section 1415
Implementation of Chapter 14
Jan. 14, 2011

Table of Contents Executive Summary ................................................................................................................... i-v Introduction ..................................................................................................................................1 Section I – The Degree to Which the Chapter’s Requirements Have Been Successfully
Implemented ..............................................................................................................................2 Section II – The Effect Upon the Cash Working Capital or Cash Flow, Uncollectible Levels
and Collections of the Affected Public Utilities ......................................................................11 Section III – The Level of Access to Utility Services by Residential Customers, Including
Low-Income Customers ...........................................................................................................34 Section IV – The Effect Upon the Level of Consumer Complaints and Mediations Filed with
and Adjudicated by the Commission .......................................................................................49
Tables Table 1 – 2005 Infractions ...........................................................................................................4 Table 2 – 2006 Infractions ...........................................................................................................4 Table 3 – 2007 Infractions ...........................................................................................................5 Table 4 – 2008 Infractions ...........................................................................................................5 Table 5 – 2009 Infractions ...........................................................................................................6 Table 6 – Annual Residential Billings – Electric ......................................................................16 Table 7 – Annual Residential Billings – Gas ............................................................................17 Table 8 – Percentage of Residential Customers in Debt – Active Accounts – Electric ............18 Table 9 – Percentage of Residential Customers in Debt – Active Accounts – Gas ..................19 Table 10 – Percentage of Billings in Debt – Electric .................................................................21 Table 11 – Percentage of Billings in Debt – Gas .......................................................................22 Table 12 – Weighted Arrearage – Active Accounts – Electric ..................................................24 Table 13 – Weighted Arrearage – Active Accounts – Gas ........................................................25 Table 14 – Percentage of Gross Residential Write-Offs Ratio – Electric ..................................27 Table 15 – Percentage of Gross Residential Write-Offs Ratio – Gas ........................................28 Table 16 – Total Universal Service Program Costs – Electric ...................................................30 Table 17 – Total Universal Service Program Costs – Gas .........................................................31 Table 18 – Summary of Collections Measures – Percent Change 2002-04 and Percent Change 2004-09 – Electric and Gas ........................................................................32 Table 19 – Terminations – Electric ............................................................................................35 Table 20 – Terminations – Gas ..................................................................................................36 Table 21 – Termination Rate – Electric .....................................................................................38 Table 22 – Termination Rate – Gas ............................................................................................39 Table 23 – Reconnections – Electric ..........................................................................................41 Table 24 – Reconnections – Gas ................................................................................................42 Table 25 – Reconnect Ratio – Electric .......................................................................................43 Table 26 – Reconnect Ratio – Gas .............................................................................................44 Table 27 – 2007-09 Cold Weather Survey Results – Electric ....................................................46 Table 28 – 2007-09 Cold Weather Survey Results – Gas ..........................................................47 Table 29 – Consumer Complaints ..............................................................................................50 Table 30 – Payment Agreement Requests ..................................................................................50
Table 31 – Non-CAP Customers Turned Away by Call Center Because of Ineligibility ..........51 Table 32 – CAP Customers Turned Away by Call Center Because of Ineligibility ..................51 Table 33 – Payment Agreement Requests Dismissed Without a Decision ................................52 Table 34 – Complaints from Customers with a Protection from Abuse (PFA) Order ...............52
Appendices Appendix 1 – Collections Data Variables ..................................................................................55 Appendix 2 – When is an Account Considered to be Overdue? ................................................57 Appendix 3 – When Does an Account Move from Active to Inactive Status? ..........................58 Appendix 4 – Gross Residential Write-Offs – Electric ..............................................................59 Appendix 5 – Gross Residential Write-Offs – Gas ....................................................................59 Appendix 6 – Number of Customers in Debt – Active Accounts – Electric..............................60 Appendix 7 – Number of Customers in Debt – Active Accounts – Gas ....................................60 Appendix 8 – Dollars in Debt – Active Accounts – Electric .....................................................61 Appendix 9 – Dollars in Debt – Active Accounts – Gas ............................................................61 Appendix 10 – Average Arrearage – Active Accounts – Electric .............................................62 Appendix 11 – Average Arrearage – Active Accounts – Gas ....................................................62 Appendix 12 – Annual Collections Operating Expenses – Electric ...........................................63 Appendix 13 – Annual Collections Operating Expenses – Gas .................................................63 Appendix 14 – 2009 Collections Operating Expenses as a Percentage of Residential Billings – Electric ..............................................................................................64 Appendix 15 – 2009 Collections Operating Expenses as a Percentage of Residential Billings – Gas ....................................................................................................64 Appendix 16 – 2009 Universal Service Program Costs as a Percentage of Residential Billings – Electric ..............................................................................................65 Appendix 17 – 2009 Universal Service Program Costs as a Percentage of Residential Billings – Gas ....................................................................................................65 Appendix 18 – Annual Total CAP Costs – Electric ...................................................................66 Appendix 19 – Annual Total CAP Costs – Gas .........................................................................66 Appendix 20 – Annual Total LIURP Costs – Electric ...............................................................67 Appendix 21 – Annual Total LIURP Costs – Gas .....................................................................67 Appendix 22 – Summary of 2009 Collections and Universal Service Program Costs – Electric .....................................................................................................................68 Appendix 23 – Summary of 2009 Collections and Universal Service Program Costs – Gas ...........................................................................................................................68 Appendix 24 – 2009 Collections Costs as a Percentage of Billings – Electric ..........................69 Appendix 25 – 2009 Collections Costs as a Percentage of Billings – Gas ................................69 Appendix 26 – 2009 Individual Expense Categories as a Percentage of Billings – Electric .....70 Appendix 27 – 2009 Individual Expense Categories as a Percentage of Billings – Gas ...........70 Appendix 28 – Monthly Average Bill: Heating vs. Non-Heating Accounts – 2002-09 – Electric ................................................................................................................71 Appendix 29 – Monthly Average Bill: Heating vs. Non-Heating Accounts – 2002-09 – Gas .......................................................................................................................71 Appendix 30 – Inactive Accounts ..............................................................................................72 Appendix 31– Security Deposits on Hand .................................................................................73
i
Executive Summary
In the First Biennial Report to the General Assembly and Governor Pursuant to Section 1415 submitted on Dec. 14, 2006, the Pennsylvania Public Utility Commission concluded that a comprehensive evaluation of the impact of Chapter 14 was premature. In the second report submitted on Dec. 14, 2008, the Commission concluded that the electric industry showed some deterioration since the passage of Chapter 14 while the natural gas industry, especially PGW, showed improvement.
Based on the evidence in the Third Biennial Report contained herein, the Pennsylvania
Public Utility Commission (PUC or Commission) concludes that the utilities have successfully implemented Chapter 14 since its passage in Dec. 14, 2004.
Highlights from the Report:
• Despite a prolonged declining economy since the passage of Chapter 14, utilities have
effectively managed residential collections expenses and Universal Service program expenses so that the total costs spread upon the residential rate base have been increasing at a pace that is well below the inflation rate.
• Terminations increased dramatically since the passage of Chapter 14 but have leveled off in recent years. On the positive side, utilities are using termination as a collections tool to effectively manage customer debt. However, more customers now enter the winter without a central heating source and the Commission is concerned about the health and safety of the occupants in these dwellings.
• Low-income customers have fared better since the passage of Chapter 14. The utilities
have adopted the Commission’s request for lenient restoration terms in our annual Prepare Now Campaign. Low-income customers are given every opportunity to have utility service entering the winter time. Most significantly, enrollment in Customer Assistance Programs (CAP) increased by 92 percent from 2004 to 2009.
• The report concludes that, while some instances of non-compliance remain, overall the
utilities have effectively complied with Chapter 14.
• Chapter 14 has had an impact on the number of Payment Agreement Requests (PARs). The Commission has turned away 94,777 customers who are ineligible to receive a PAR since the passage of Chapter 14.
Chapter 14 requires the PUC to report to the General Assembly and Governor every
two years (§ 1415). The reports are to review the implementation of the provisions of Chapter 14, including, but not limited to the following four areas: (1) The degree to which the Chapter’s requirements have been successfully implemented; (2) The effect upon the cash working capital or cash flow, uncollectible levels and collections of the affected public utilities; (3) The level of access to utility services by residential customers including low-

ii
income customers; and (4) The effect upon the level of consumer complaints and mediations filed with and adjudicated by the Commission. (Mediations are currently known as payment agreement requests under § 1415.) Section I – The Degree to Which the Chapter’s Requirements Have Been Successfully Implemented • Chapter 14 has been in effect for six years. The Commission has taken steps to
implement Chapter 14 in a manner that will allow it to achieve the policy goals of increasing utility account collections and eliminating the subsidization of bad debt costs by paying customers.
• Most notably, the Commission has issued a proposed rulemaking to update the provisions
of the Chapter 56 regulations consistent with the mandates of Chapter 14. On a daily basis, the Commission works to implement Chapter 14 as fairly as possible and to ensure that service remains available to all customers on reasonable terms and conditions.
• The Commission concludes that overall the utilities have effectively complied with Chapter 14. While there are some compliance issues apparent from a review of informal complaints filed with the Bureau of Consumer Services (BCS) and informal investigations conducted by the Commission’s prosecutory staff, as discussed on pages 3-10, there is no indication of widespread, systemic violations of the Chapter. For the most part, it appears that the utilities have brought their operations into compliance with the requirements of the Chapter, and the Commission is generally satisfied with the level of compliance demonstrated by the utilities.
• However, there are instances of non-compliance, as evidenced by the number of
informally verified infractions found by the Commission relative to the electric, gas and water industries as shown in Tables 1 through 5 of this report and shown in the list of formal settlements resulting from informal investigations of the Commission’s Prosecutory Staff. Infractions are misapplications or violations of Chapter 14 found by the Commission’s Bureau of Consumer Services as part of an informal complaint investigation. Infractions become verified when BCS staff, after reviewing the informal complaint and information provided by the utility concerning the allegation, is satisfied that there is enough information indicating that a possible violation of the Chapter has occurred. An infraction can also be considered verified if the utility chooses not to contest the allegation, or admits that a violation may have occurred.
Section II – The Effect Upon the Cash Working Capital or Cash Flow, Uncollectible Levels and Collections of the Affected Public Utilities • The overall collections performance for the electric industry continues to show some
deterioration since the passage of Chapter 14.
iii
Specifically, the 28.5 percent increase in residential revenues since 2004 has been offset by an increasing number of customers who are in arrears and who owe an increasing amount of money.
Of particular concern, a larger portion of the customer debt is not covered under a
payment agreement and, as such, poses a greater collections risk.
On the positive side, the gross residential write-offs ratio, which is the percentage of billings written off as uncollectible, declined by 6.5 percent from 2004-09.
• The overall collections performance for the gas industry improved from 2004-09. This
improvement reflects the continuation of a trend that had already begun in the pre-Chapter 14 period from 2002-04.
During the post-Chapter 14 years, the percent of customers in debt declined by 29.7
percent while the total dollars in debt declined by 27.5 percent.
The gross residential write-offs ratio declined by 18.4 percent since the passage of Chapter 14.
• Overall, the analysis of the various collections data continues to show a dramatic pattern
of improvement for PGW since the passage of Chapter 14. Significantly fewer customers owe money to PGW, while the amount of debt has also
significantly declined since 2004.
PGW also stands out for the 26.6 percent decrease in its gross residential write-offs ratio.
PGW’s improved collections performance and overall financial health is reflected by its recently upgraded bond rating.
Section III – The Level of Access to Utility Services by Residential Customers, Including Low-Income Customers • As for access to utility service, the Cold Weather Survey data is the most important
indicator of the level of access to utility service. The companies reported that as of Dec. 15, 2009, there were 17,037 households that
entered the winter season without heat-related service.
An additional 3,992 residences were using potentially unsafe heating sources, bringing the total number of homes not using a central heating system to 21,029. This number is 28 percent higher than the pre-Chapter 14 average from 2001-04 of 14,992.

iv
Terminations increased by 78.6 percent for the electric industry and by 45.5 percent for the gas industry from 2004-09.
Meanwhile, the Commission turned away 94,777 customers seeking PARs who were deemed ineligible under Chapter 14 since its passage (from 2005-09).
• Both the electric and gas industries have seen a significant increase in CAP enrollment
since the passage of Chapter 14. This has led to a corresponding increase in CAP spending, which is borne by all ratepayers. Specifically, the electric industry has increased CAP spending 79.6% and the gas industry has increased cap spending 108.4% since 2004.
• Low-income households that are placed into CAP and successfully manage to pay their CAP bills represent the success of the program.
• The Commission continues to promote energy efficiency and conservation as well as
customer responsibility as tools for maintaining access to utility service. Section IV – The Effect Upon the Level of Consumer Complaints and Mediations Filed with and Adjudicated by the Commission (Mediations are Currently Known as Payment Agreement Requests Under § 1415) • Chapter 14 has had an impact on the number of Payment Agreement Requests (PARs).
PARs decreased 40 percent from 2005-09 and have been well below the 2004 level in each year since then.
The Commission opened 58,672 PAR cases in 2005, but dismissed 14,225 because of Chapter 14 restrictions. The total number of PARs decreased from 2004-06 and have leveled off at over 48,000 in both 2008 and 2009.
The Commission turned away 20,788 customers in 2009 due to the restrictions on its ability to grant payment agreements.
Since the passage of Chapter 14, through the end of 2009, the Commission has turned away 94,777 customers seeking PARs.
However, an annual average of about 6,000 of these cases have been dismissed because in late 2005 the Commission revised its interpretation of Section 1405(d) to permit the issuance of at least one payment agreement for all customers, including those whose service was terminated.
While the Commission continues to issue payment terms for customers whose
service has been terminated, this authority is exercised judiciously and only in instances where the customer has made a good-faith effort to pay the bill.

v
• In addition, informal consumer complaint volume declined by 21 percent from 2004-09. Recommendations by the Commission for Legislative Amendments • The Commission has no legislative amendments to recommend at this time. The
Commission will continue to evaluate what, if any, legislative amendments may be necessary to further promote the goals of the Act and the public interest and will communicate those recommendations to the General Assembly and Governor in the Fourth Biennial Report in Dec. 2012. The Commission appreciates the willingness to continually evaluate Chapter 14 so that the goals of increasing utility account collections and eliminating the subsidization of bad debt costs by paying customers do not erode consumer protections.
Target Dates for Future Biennial Reports • The Commission will issue its fourth biennial report by Dec. 14, 2012, and will include
data from 2010-11. Through the issuance of the Biennial Report, the Commission will keep the General Assembly and Governor abreast of the implementation of Chapter 14. Following the 2012 Report, the final Biennial Report will then be sent to the General Assembly and Governor by Dec. 14, 2014. In recognition of the sunset of Chapter 14 on Dec. 14, 2014, the Commission may target an earlier release date of the final biennial report so that it is available for the legislature to use in its decision-making on whether to allow Chapter 14 to sunset, to modify it, or to continue it without change.
1
Introduction On Nov. 30, 2004, Gov. Edward G. Rendell signed into law Senate Bill 677, also known as Act 201, the Responsible Utility Consumer Protection Act. The Act went into effect on Dec. 14, 2004, and amended Title 66 by adding Chapter 14 (66 Pa. C.S. §§ 1401-1418) (Responsible Utility Customer Protection Act). Chapter 14 is applicable to electric distribution companies, water distribution companies and larger natural gas distribution companies (those having annual operating income in excess of $6 million). Chapter 14 requires the PUC to report to the General Assembly and Governor every two years (§ 1415). The first report was due no later than Dec. 14, 2006, and the final report is due in December 2014. The reports are to review the implementation of the provisions of Chapter 14, including, but not limited to:
1. The degree to which the Chapter’s requirements have been successfully implemented.
2. The effect upon the cash working capital or cash flow, uncollectible levels and
collections of the affected public utilities. 3. The level of access to utility services by residential customers including low-
income customers. 4. The effect upon the level of consumer complaints and mediations filed with and
adjudicated by the Commission. (Mediations are currently known as payment agreement requests under § 1415.)
(Note: These four areas are statutorily-mandated and serve as the basis for the sections of this report.)
Chapter 14 directs public utilities affected by this Chapter to provide data, as required
by this Commission, to complete the reports. The PUC’s report also may contain recommendations to the General Assembly and Governor regarding legislative amendments or other changes that the Commission deems appropriate.
Chapter 14 includes the Philadelphia Gas Works (PGW), a city natural gas distribution
operation, within the category of natural gas distribution utilities. The category specifically excludes natural gas distribution utilities with operational revenues of less than $6 million per year except where the public utility voluntarily petitions the Commission to be included or where the public utility seeks to provide natural gas supply services to retail gas customers outside its service territory. Natural gas distribution utilities that are not connected to an interstate gas pipeline are similarly excluded from the provisions of Chapter 14 under § 1403.

2
Report Sections
Section I - The Degree to Which the Chapter’s Requirements Have Been Successfully Implemented
As part of the first section of this report, the Commission will provide a summary of
the Chapter 14 implementation process by both the Commission and the utilities. This first section also will include a report on verified infractions of Chapter 14 committed by utilities, as determined through a random sampling of informal complaints before the Commission’s BCS,1
On Sept. 25, 2008, the Commission adopted a Notice of Proposed Rulemaking (NOPR) that will amend 52 Pa. Code Chapter 56 to bring it into compliance with Act 201 (Chapter 14 of Title 66). The NOPR was published in the Pennsylvania Bulletin on Jan. 14, 2009.
and possible violations of Chapter 14 from informal PUC investigations resolved in the last two calendar years. Although these violations represent non-compliance with Chapter 14, the violations are, for the most part, isolated occurrences, and the Commission concludes that overall, the relevant utilities have effectively implemented and complied with Chapter 14.
Commission Regulations
While the Commission has addressed and resolved numerous issues involving the
application of Chapter 14 provisions, the Commission must still amend its regulations found in 52 Pa. Code, Chapter 56 (Chapter 56) to comply with the provisions of Chapter 14. Chapter 56 contains the Standards and Billing Practices for Residential Utility Service and includes the regulations governing the termination process, credit, applications, billing, payment, and dispute procedures. The Commission also will use this opportunity to address other issues with Chapter 56, including updates needed due to technological advances such as electronic billing and payments.
An Advance Notice of Proposed Rulemaking (ANOPR) was published in the
Pennsylvania Bulletin on Dec. 16, 2006. Twenty-two sets of comments were received from the industry, consumer groups and the statutory advocates. After carefully reviewing and considering the comments, Commission staff drafted proposed revised Chapter 56 regulations that will make the regulations consistent with the mandates of Chapter 14.
http://www.pabulletin.com/secure/data/vol39/39-7/289.html
Twenty-four parties submitted comments on the proposed regulations by the April 20, 2009 deadline. The comments, along with the proposed regulations, are available on the Commission’s website under “Consumer Concerns.” On May 20, 2009 the Independent Regulatory Review Commission submitted their comments. 1 The random sampling consists of a statistically valid sample, with a reasonable margin of error, of informal complaints opened within the calendar year. The sample is selected by an automated process that sorts through the cases as they are closed and is intended to produce a representative sample of Bureau informal complaint activity. The selected sample is then reviewed for evaluative and compliance purposes. Utilities whose activity with the Bureau is insufficient to produce a valid sample are excluded from sampling.

3
Commission staff is reviewing the comments and drafting a final rulemaking for submission to the Commission (Docket No. L-00060182), which will be done in the first quarter of 2011. In promulgating these regulations, the Commission will strive to balance the needs of both consumers and utilities and protect the public interest.
To further facilitate implementation of the Act, Commission staff met with utility
companies to address specific concerns and questions. Commission staff provided informal written guidance to the utility companies relating to areas of particular concern, such as winter termination rules and the annual change in the federal poverty guidelines.
The PUC’s Bureau of Consumer Services (BCS) informal compliance process has also
facilitated the implementation of the Act by giving utilities specific examples of possible infractions of Chapter 14. The informal compliance process uses consumer complaints to identify, document and notify utilities of possible infractions. A utility that receives notification of a possible infraction has an opportunity to refute the allegation. The utility can use the information to identify and voluntarily correct deficiencies in its customer service operations. Corrective actions may include modifying a computer program; revising the text of a notice, bill, letter or company procedure; or providing additional staff training to ensure the proper use of a procedure. The notification process also allows utilities to receive written clarifications of Chapter 14 and Commission regulations and policies. This is an informal process intended to address compliance deficiencies in a quick, non-punitive manner.
Informal Complaint Infractions
One measure of Chapter 14 compliance that the PUC’s BCS uses is the frequency of
Chapter 14 infractions that are found and verified during an informal complaint investigation. BCS typically keeps track of Chapter 14 infractions against energy and water utilities, including, but not limited to, infractions related to the collection of security deposits, to defective service termination notices, unauthorized service terminations, and untimely reconnections of service.
Upon review of informal complaints filed, the BCS recorded the following verified
infractions of Chapter 14. As the data shows, while there are possible infractions of the Chapter documented, there is no indication of widespread, systemic violations of the Chapter. For the most part, it appears that the utilities have brought their operations into compliance with the requirements of the Chapter.

4
Table 1 – 2005 Infractions
2005
Section of Chapter 14 Electric Utilities
Gas Utilities
Water Utilities
Total
§ 1403 Definitions 2 5 1 8 § 1404 Credit and Deposits 10 11 21 § 1405 Payment Agreements 1 1 § 1406(a) Authorized Termination
14
32
4
50
§ 1406(b) Notice of Termination 9 6 5 20 § 1406(c) Grounds for Immediate Termination
1
2
3
§ 1406(e) Winter Termination 1 1 § 1406 Medical Certificates 1 1 2 § 1407(a) Reconnection Fee 1 1 § 1407(b) Reconnection of Service – Timing
11
14
25
§ 1407(c) Reconnection – Payment to Restore Service
1
4
5
§ 1407(d)(e) Payment of Outstanding Balance at Premise
2
2
4
Total 50 77 14 141
Table 2 – 2006 Infractions
2006
Section of Chapter 14 Electric Utilities
Gas Utilities
Water Utilities
Total
§ 1403 Definitions 4 13 1 18 § 1404 Credit and Deposits 2 14 16 § 1406(a) Authorized Termination
5 25 34
§ 1406(b) Notice of Termination 9 2 4 13 § 1406(c) Grounds for Immediate Termination
2 1
§ 1406 Medical Certificates 1 1 1 § 1407(a) Reconnection Fee 2 2 § 1407(b) Reconnection of Service – Timing
5 13 18
§ 1407(c) Reconnection – Payment to Restore Service
1 3 1 5
§ 1407(d)(e) Payment of Outstanding Balance at Premise
2 11 1 14
Total 28 84 10 122

5
Table 3 – 2007 Infractions
2007
Section of Chapter 14 Electric Utilities
Gas Utilities
Water Utilities
Total
§ 1403 Definitions 4 5 9 § 1404 Credit and Deposits 6 25 31 § 1405 Payment Agreements 1 1 2 § 1406(a) Authorized Termination
7 29 9 45
§ 1406(b) Notice of Termination 4 6 6 16 § 1406(c) Grounds for Immediate Termination
1 2 3
§ 1407(a) Reconnection Fee 1 1 § 1407(b) Reconnection of Service – Timing
3 13 16
§ 1407(c) Reconnection – Payment to Restore Service
1 2 3
§ 1407(d)(e) Payment of Outstanding Balance at Premise
5 12 2 19
§ 1417 Nonapplicability - Protection From Abuse
1 1 2
Total 32 95 20 147
Table 4 – 2008 Infractions
2008
Section of Chapter 14 Electric Utilities
Gas Utilities
Water Utilities
Total
§ 1403 Definitions 8 8 1 17 § 1404 Credit and Deposits 7 21 1 29 § 1406(a) Authorized Termination
8 27 15 50
§ 1406(b) Notice of Termination 2 2 3 7 § 1406(f) Medical Certificates 1 1 § 1407(a) Reconnection Fee 2 4 6 § 1407(b) Reconnection of Service – Timing
4 20 24
§ 1407(c) Reconnection – Payment to Restore Service
6 17 4 27
§ 1407(d)(e) Payment of Outstanding Balance at Premise
5 4 2 11
§ 1410 Complaints 2 2 Total 43 103 28 174
6
Table 5 – 2009 Infractions
2009
Section of Chapter 14
Electric Utilities
Gas Utilities
Water Utilities
Total
§ 1403 Definitions 6 4 10 § 1404 Credit and Deposits 11 8 19 § 1405 Payment Agreements 1 1 § 1406(a) Authorized Termination
13 12 10 35
§ 1406(b) Notice of Termination 1 2 2 5 § 1406(c) Grounds for Immediate Termination
1 1
§ 1407(a) Reconnection Fee 3 3 6 § 1407(b) Reconnection of Service – Timing
1 5 6
§ 1407(c) Reconnection – Payment to Restore Service
2 2
§ 1407(d)(e) Payment of Outstanding Balance at Premise
3 7 1 11
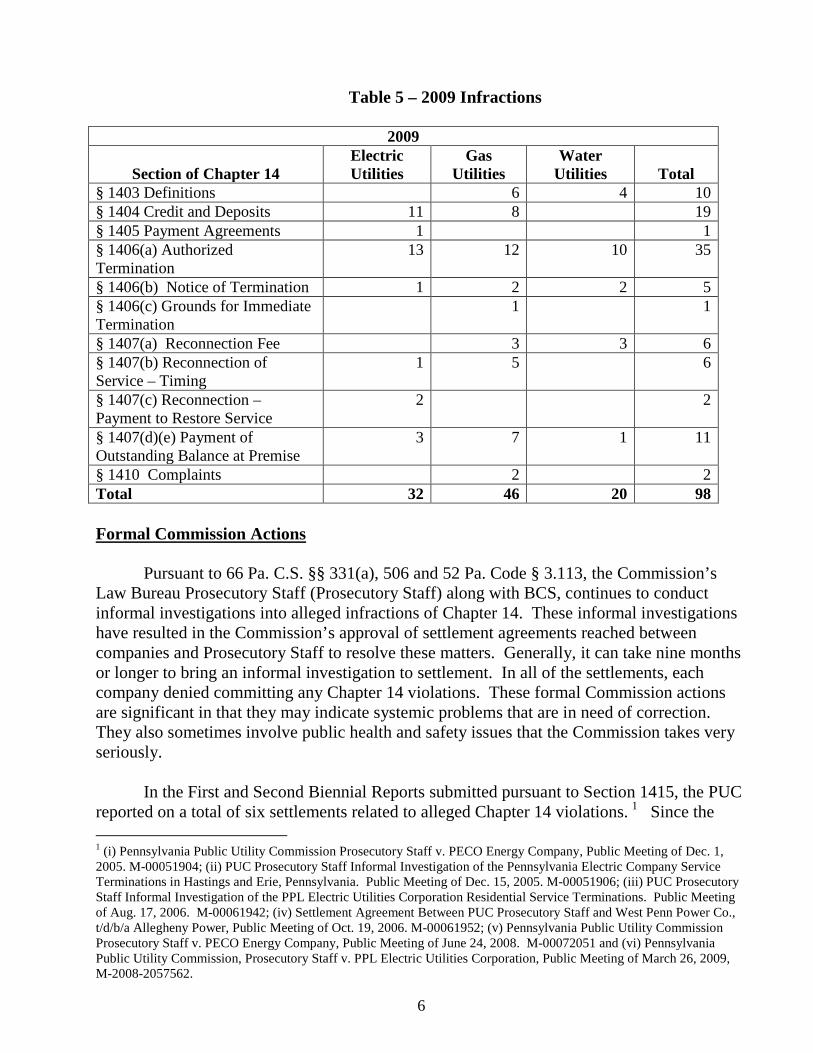
§ 1410 Complaints 2 2 Total 32 46 20 98 Formal Commission Actions
Pursuant to 66 Pa. C.S. §§ 331(a), 506 and 52 Pa. Code § 3.113, the Commission’s Law Bureau Prosecutory Staff (Prosecutory Staff) along with BCS, continues to conduct informal investigations into alleged infractions of Chapter 14. These informal investigations have resulted in the Commission’s approval of settlement agreements reached between companies and Prosecutory Staff to resolve these matters. Generally, it can take nine months or longer to bring an informal investigation to settlement. In all of the settlements, each company denied committing any Chapter 14 violations. These formal Commission actions are significant in that they may indicate systemic problems that are in need of correction. They also sometimes involve public health and safety issues that the Commission takes very seriously.
In the First and Second Biennial Reports submitted pursuant to Section 1415, the PUC
reported on a total of six settlements related to alleged Chapter 14 violations. 1
1 (i) Pennsylvania Public Utility Commission Prosecutory Staff v. PECO Energy Company, Public Meeting of Dec. 1, 2005. M-00051904; (ii) PUC Prosecutory Staff Informal Investigation of the Pennsylvania Electric Company Service Terminations in Hastings and Erie, Pennsylvania. Public Meeting of Dec. 15, 2005. M-00051906; (iii) PUC Prosecutory Staff Informal Investigation of the PPL Electric Utilities Corporation Residential Service Terminations. Public Meeting of Aug. 17, 2006. M-00061942; (iv) Settlement Agreement Between PUC Prosecutory Staff and West Penn Power Co., t/d/b/a Allegheny Power, Public Meeting of Oct. 19, 2006. M-00061952; (v) Pennsylvania Public Utility Commission Prosecutory Staff v. PECO Energy Company, Public Meeting of June 24, 2008. M-00072051 and (vi) Pennsylvania Public Utility Commission, Prosecutory Staff v. PPL Electric Utilities Corporation, Public Meeting of March 26, 2009, M-2008-2057562.
Since the

7
issuance of these reports, the Commission has acted on the following seven settlements that involve possible violations of Chapter 14:
• On Dec. 18, 2008, the Commission finalized a settlement with the Philadelphia Gas Works (PGW) after allegations that the company violated portions of the Public Utility Code and its tariff. The Commission’s Prosecutory Staff initiated an informal investigation alleging that PGW improperly handled the termination of a non-heating resident who died 11 months later in a house fire. The customer was terminated after the company was unable to gain access to install an AMR device. The settlement agreement does not represent an admission of any wrongdoing by the company. The settlement included a $10,000 payment to the company’s pilot conservation program and also required PGW to provide classroom and additional training for its customer service representatives covering topics such as collections, collection practices, payment agreements, bill dispute resolution, shut-off procedures, the automatic meter reading (AMR) exchange program and the Customer Responsibility Program. (Docket No. M-00072017)
• On March 12, 2009, the Commission finalized a settlement with the Pennsylvania Electric Co. (Penelec) that included a $200,000 contribution to a low-income program and ended an informal investigation into an electric termination that preceded a fire in Indiana, Indiana County. The PUC’s Prosecutory Staff initiated an informal investigation into Penelec’s handling of a discontinuance of service request and an application for service at the same residence. Penelec terminated service to the residence on Nov. 1, 2007, with a request for service on file from an occupant. A Nov. 3, 2007, fire at the residence seriously injured an occupant. If the matter had been litigated, Prosecutory Staff would have contended that Penelec violated certain sections of the state’s Public Utility Code and the Commission’s regulations while Penelec would have contested the matter. In addition to the $200,000 payment, the company committed to a variety of procedural changes and corrective actions relating to the transfer of account balances, termination notices, and communicating with customers. (Docket No. M-2008-2027681)
• On April 22, 2010 the Commission (PUC) approved a settlement with Metropolitan Edison Co. (Met-Ed) that included a $100,000 contribution to a fund to help low-income customers, ending an informal investigation of three separate events concerning electricity utility services subject to the Commission’s authority. In addition, Met-Ed was required to implement staff training on several items, including transferring account balances, medical certificates and updating and revising internal procedures. The PUC’s Prosecutory Staff initiated an informal investigation into three separate incidents involving alleged company action or inaction regarding customer service aspects of the provision of their utility service. In one incident, a customer telephoned Met-Ed following the termination of their electric service and was not referred to the utility’s assistance program. According to media reports, a fire at the residence on Nov. 12, 2007, injured three firefighters. In another incident, Met-Ed allegedly failed to provide information on the Commission's regulations regarding service pursuant to a confirmed medical
8
condition. According to media reports, three children were rescued from a fire at the residence on Nov. 6, 2007. In a third instance, the company allegedly did not inquire whether the sale and vacating of the premises by the caller meant that the premises would be vacant or if other occupants would reside there. According to media reports, on Dec. 24, 2007, a 26-year old woman was found dead of carbon monoxide poisoning from a generator used at the residence. Had these matters been litigated, the Commission’s Prosecutory Staff would have alleged that Met-Ed violated sections of the state Public Utility Code and Commission regulations. (Docket No. M-2009-2035436)
• On Nov. 19, 2009, the Commission finalized a settlement with PPL Electric Utilities Inc. that concerned the Aug. 8, 2008, termination of electric service to a residence in Lancaster, Lancaster County. A fire destroyed the home on Aug. 9, 2008, killing Cynthia Glassman. The PUC’s Prosecutory Staff began an informal investigation into PPL’s termination practices and if the issue had been litigated, Prosecutory Staff would have contended the company violated various portions of the Public Utility Code and Commission regulations, including provisions on termination notices, medical certificates, payment agreements, restoration of service and dispute rights. PPL would have contested the matters. As part of the settlement, the company agreed to not terminate service to residential customers on Fridays before Jan. 1, 2013, contribute $400,000 to its Operation HELP program, pay a civil penalty of $50,000; and establish additional customer service procedures and revise additional internal procedures to deal with terminations, medical certificates and disputes. (Docket No. M-2009-2058182)
• On Nov. 19, 2009, the Commission finalized a settlement with PPL Electric Utilities Inc. that involved an April 9, 2008, termination of electric service to an apartment in Mechanicsburg, Cumberland County. A fire destroyed the apartment and six other apartments on May 3, 2008. Following the incident, the PUC’s Prosecutory Staff began an informal investigation into PPL’s termination practices. If the issue had been litigated, Prosecutory Staff would have contended the company violated various portions of the Public Utility Code and Commission regulations including provisions on termination notices, medical certifications and dispute rights. PPL would have contested the matters. Under the settlement, the company agreed to develop updated call scripts for customer service representatives and provide retraining; revise its procedures for customer service representatives receiving calls on terminations; contribute $20,000 to its Operation HELP program; and pay a civil penalty of $1,000. (Docket No. M-2009-2059414)
• On Dec. 3, 2009, the Commission approved a settlement with FirstEnergy
(Penelec, Met Ed, Penn Power) that included a $200,000 contribution and restitution for some customers, ending an informal investigation into terminations that occurred between Aug. 11, 2008, and Aug. 26, 2008. As part of the settlement agreement, FirstEnergy agreed to credit within 30 days $50-$200 to each unlawfully terminated customer’s account depending on the length of their terminations. The PUC’s Prosecutory Staff initiated an informal investigation into

9
FirstEnergy’s handling of 492 unlawful terminations that occurred between Aug. 11, 2008, and Aug. 26, 2008. It was determined that due to a computer system malfunction, FirstEnergy failed to properly deliver the 10-day notice of terminations required by law under Chapter 14 of the Public Utility Code. In addition, 446 of the 492 terminated customers were unable to be reached in the required 3-day notice of termination. If the matter had been litigated, Prosecutory Staff would have contended that FirstEnergy violated certain sections of the state’s Public Utility Code and the Commission’s regulations while FirstEnergy would have contested the matter. (Docket No. M-2009-2112849)
• On March 26, 2009, the Commission finalized a settlement agreement that ended an informal investigation into an alleged failure to provide the required notices of termination at least three days prior to the scheduled terminations of service by Pennsylvania American Water Co. (PAWC). The agreement directs the company to pay a $3,000 civil penalty and to pay individual restitution payments to the affected customers. Commission staff initiated an informal investigation into the company’s alleged failure to provide the required statutory notices of termination at least three days prior to the scheduled terminations of service. As part of the investigation, Commission staff determined that the company violated a section of the Public Utility Code, resulting in 1,666 terminated accounts in August 2007. Additionally, 697 of those affected customers had service restored within 24 hours, and 969 of those customers had service restored over 24 hours later. The company required 1,236 of the affected customers to pay a reconnection fee in order to have their service restored. As part of the settlement, PAWC agreed to pay a $3,000 civil penalty and provided each of the 969 customers who were terminated, but not reinstated within 24 hours, a $150 credit toward their accounts. For each of the 697 customers who were terminated but reinstated within 24 hours, PAWC provided a $125 credit toward their account. Additionally, for each of the 1,236 customers who were improperly charged a reconnection fee, the company refunded or credited the full amount charged to their accounts. Also as part of the settlement, the company instituted new procedures, training, and quality analysis to prevent future occurrences of the same problem. (Docket No. M-2008-2066530)
Conclusion: Section I – The Degree to Which the Chapter’s Requirements Have Been Successfully Implemented
Chapter 14 has been in effect for six years. The Commission has taken steps to
implement Chapter 14 in a manner that will allow it to achieve the policy goals of increasing utility account collections and eliminating the subsidization of bad debt costs by paying customers. Most notably, the Commission has issued a rulemaking that is in its final stages to update the provisions of the Chapter 56 regulations consistent with the mandates of Chapter 14. On a daily basis, the Commission works to implement Chapter 14 as fairly as possible and to ensure that service remains available to all customers on reasonable terms and conditions.

10
The Commission concludes that overall, the utilities have effectively complied with Chapter 14. While there are some compliance issues apparent from a review of informal complaints filed with the Bureau of Consumer Services and informal investigations conducted by the Commission’s prosecutory staff, there is no indication of widespread, systemic violations of the Chapter. For the most part, it appears that the utilities have brought their operations into compliance with the requirements of the Chapter, and the Commission is generally satisfied with the level of compliance demonstrated by the utilities.
However, there are instances of non-compliance, as evidenced by the number of
informally verified infractions found by the Commission relative to the electric, gas and water industries and alleged infractions shown in the list of formal settlements resulting from informal investigations of the Commission’s Prosecutory Staff. The Commission continues to be concerned with unlawful or erroneous terminations, which present serious issues of health and safety for both the individuals directly involved and the surrounding community. The Commission notes that many of these infractions are isolated occurrences, but for those infractions where a systemic failure is involved, appropriate corrective and, if need be, punitive action has been taken. The Commission further notes that prior to the enactment of Chapter 14, the relevant utilities experienced similar compliance issues related to improper service terminations, etc. under the PUC’s Chapter 56 billing regulations and/or Section 1501 of the Code (pertaining to reasonable service). Thus, these types of compliance issues are not unique to Chapter 14. In any event, the Commission takes such matters seriously and continues to work diligently to address these issues with utilities on a case-by-case basis.
11
Section II - The Effect Upon the Cash Working Capital or Cash Flow, Uncollectible Levels and Collections of the Affected Public Utilities
Chapter 14 requires the Commission to report on the effect of Chapter 14 on cash
working capital or cash flow, uncollectible levels and residential collections of the affected utilities. This section of the report will begin with an overview of the collections process followed by a review of the type of collections data that the Commission receives and utilizes to, among other things, assess the impact of Chapter 14 on energy and water utility uncollectible levels and collections, etc. This section concludes with data on the collections impact of Chapter 14 on affected utilities. Based on this data, the overall collections performance for the electric industry continues to show some deterioration since the passage of Chapter 14, while the overall collections performance for the gas industry improved from 2004-09. However, noting the current economic conditions, utilities have effectively managed their overall collection levels during the report period. Overview of the Collections Process
The collections process begins when a customer does not pay his/her bill in full and on time. Active account balances are those accounts with service still on. The number of active accounts in debt and the corresponding dollars in debt are included in this report.
Inactive account balances are those accounts that have been terminated or discontinued
but not yet written-off by the company. Inactive account balances will ultimately either be paid by the customer or written off as uncollectible by the company. Our Collections Reporting Interim Guidelines require utility reporting of inactive accounts beginning with 2007 data (See Appendix 30). Write-offs are accounts that the company determines to be uncollectible.
Companies move accounts from inactive status to write-offs on differing timelines,
varying from two months to one year following termination or discontinuance, according to individual company accounting strategies. Collections Operating Expenses represent the costs to the company for pursuing the dollars that are owed by customers. Universal Service Programs costs reflect the costs associated with those programs that serve as alternative collections devices for low-income customers. Security Deposits on Hand represent a cash asset for utilities and these dollars are treated as an offset to collections costs in the calculation of a company’s Distribution Charges (See Appendix 31).
Collections Data Process
The Commission sought comments from the industry and interested parties on
collections data issues associated with Chapter 14 reporting requirements, including, but not limited to, the following:
• Applicability of the reporting requirements; • Content of the list of collections data variables to be included under the reporting
requirements;

12
• Frequency of utility reporting under the requirements; • Due dates for the utility reporting under the requirements; • Establishment of the Collaborative Process Working Group; • Transfer of historical data from the Commission to the utilities; • Link between the Chapter 56 rulemaking and the Collections Reporting
Requirements; and • Process for making collections data available to the public.
Applicability
Larger Utilities
By order entered July 24, 2006, at Docket No. M-00041802F0003, the Commission established that larger utilities – those electric, gas and water distribution utilities with annual operating revenues greater than or equal to $200 million – are subject to full reporting pursuant to § 1415. The complete list of collections data variables appears in Appendix 1. The electric distribution utilities subject to the Chapter 14 evaluation collections reporting requirements include: Allegheny, Duquesne Light Co. (Duquesne), Metropolitan Edison Co. (Met-Ed), PECO, Penelec, Pennsylvania Power Co. (Penn Power) and PPL.
The natural gas distribution utilities include: Columbia Gas of Pennsylvania
(Columbia), Peoples Gas (formerly Dominion Peoples), Equitable Gas (Equitable), National Fuel Gas Distribution Corp. (NFG), PECO, UGI Penn Natural, PGW and UGI-Gas.
The water distribution utilities include: Aqua Pennsylvania Inc. (Aqua Pennsylvania)
and Pennsylvania -American Water Co. (PA -American).
Smaller Utilities
The Commission established that smaller utilities covered by Chapter 14 are required to report only a limited number of residential collections data variables beginning with 2007 data. This abbreviated list of collections variables includes the number of residential customers, annual residential billings, annual gross residential write-offs, the number of terminations and the number of reconnections.
Number of Years to be Included in the Biennial Report
The historical reporting period for the residential collections data in the Commission’s
Third Biennial Report is 2002-09. Under Commission regulations at 52 Pa. Code § 56.202 (Record Maintenance), utilities are required to maintain a minimum of four years written or recorded disputes and complaints. The water industry was excluded from this reporting until the industry fell under existing reporting requirements for 2007 data due on or before April 1, 2008.

13
Frequency of Utility Reporting
The Commission’s Interim Guidelines require utilities to report data on an annual basis. This reporting frequency is sufficient.
Utility Reporting Due Dates
The Commission set Sept. 1, 2006, as the initial reporting deadline. For subsequent reporting, the Commission established April 1 as the due date for the previous year’s information (i.e. 2009 data is due April 1, 2010). The annual reporting will continue through April 1, 2014, which will cover the year 2013. The Final Order also set utility reporting due dates which are reflected in the Interim Guidelines.
Link between the Chapter 56 Rulemaking and the Collections Reporting Requirements
The Commission issued a Notice of Proposed Rulemaking (L -00060182) initiating a
Rulemaking to revise Chapter 56 of its Regulations to bring those regulations in compliance with the mandates of Chapter 14. Until the Chapter 56 rulemaking is complete, the Commission will follow the Interim Guidelines for the collections data reporting requirements. In the Chapter 56 rulemaking, the Commission will revise § 56.231 to incorporate these Interim Guidelines.
The Interim Guidelines enable the Commission to comply with the requirements for
the Residential Collections Data while the Chapter 56 Rulemaking is completed.
Making Collections Data Available to the Public
The Commission received comments asking that collections data be made available on the PUC website www.puc.state.pa.us. The Commission agreed and placed the initial historical data submission covering the period 2002-05 on its Web site in December 2006. The Commission continues to post annual data submissions to the PUC website by May 31 of each year. Data for the period 2002-09 is now on our website. Collections Data
Residential Collections Data 2002–09
All residential collections data tables presented in this report are based on data previously submitted to the Commission by the affected companies and subsequently validated by the companies. The validation process was set forth in the Commission’s Final Order at Docket No. M-00041802F0003. The historical data set for this report covers 2002-09 and was recently validated and updated by the utilities during 2010 for this report. In some cases, data has been revised since its prior publication in the first two reports and the corrected data is contained herein.

14
Treatment of Electric and Gas Industry Totals and Averages All electric and gas industry totals shown throughout the tables in this report are based on industry totals and do not represent an average of the company scores. This rule applies to all tables, regardless of whether the table shows total lines that are simple additions or whether the table shows totals that are derived from calculated variables.
Gas industry totals in the report tables include PGW beginning in 2004 since the Commission does not have PGW data prior to the implementation of Chapter 14. However, the narrative descriptive highlights below the gas industry tables are based on industry totals excluding PGW. In this way, PGW can better be compared to its industry peers.
Collections Performance Measures and Data
The Commission believes that specific collections performance measures such as the
percent of customers in debt, the percent of billings in debt, the weighted arrearage and the percent of billings written off provide a comprehensive picture of collections performance. These primary collections measures appear in Section II along with annual residential billings and annual Universal Service Program costs. Billings are included because they are used to calculate the percentage of billings in debt and the percentage of billings written off. In addition, the amount of billings shows the magnitude of the dollars involved in residential collections. Universal Service costs are included because Universal Service Programs provide the safety net for low-income customers and, as such, represent a significant part of the utilities’ overall collections strategy.
Other collections data appear in the appendices of this report. While the Commission
views this data as secondary to the performance measures presented in Section II, the Commission considers the data important enough to include in this report. In all cases, the additional data presented in the appendices offers significant supporting and summary data. The Commission’s goal is to provide a comprehensive view of collections performance and the appendices allow us to do so. The appendices include: the dollars in gross write-offs; the number of active accounts in debt; the total dollars in debt for active accounts; average arrearages; annual utility collections operating expenses; collections costs as a percentage of billings; Universal Service Program costs as a percentage of billings; Customer Assistance Program (CAP) Costs; Low Income Usage Reduction Program (LIURP) costs; summaries of select collections and Universal Service costs; monthly average bills; the number of accounts and dollars in debt for inactive accounts; and the number of accounts and total dollars in security deposits on hand.
Definitions for each collections performance measure and data variable are provided
prior to all data tables in Section II and in the various appendices that provide additional supporting collections data.

15
Collections Trend Analysis of Pre-Chapter 14 Data versus Post-Chapter 14 Data The data presented in Tables 6-26 illustrate the Pre-Chapter 14 versus Post-Chapter 14 collections trends. These tables show collections data from 2002-04 for the pre-Chapter 14 period and data from 2004-09 for the post-Chapter 14 period. The line graphs in this section present collections data from 2002 to 2009. Subsequent Biennial Reports will provide multi-year data to show a longer post-Chapter 14 trend line.

16
The annual residential billings shown below represent the cumulative amount of the residential billings for calendar years 2002-09. This includes normal tariff billings and late payment fees.
Table 6 – Annual Residential Billings ($) – Electric
Company
2002
2003
2004
2005
2006
2007
2008
2009
Percent Change 2002-04
Percent Change 2004-09
Allegheny 472,083,703 454,127,871 461,441,708 482,974,436 494,672,069 547,374,217 554,454,172 599,340,971 -2.3 29.9
Duquesne 335,199,000 302,583,153 314,096,238 363,023,022 367,688,569 451,564,521 469,775,020 466,507,432 -6.3 48.5
GPU* 794,398,727
Met-Ed 444,319,062 459,899,488 487,495,533 490,102,735 556,775,006 585,043,618 626,478,569 3.5*** 36.2
PECO** 1,801,779,619 1,923,710,201 1,957,092,865 2,219,005,806 2,281,139,333 2,453,497,423 2,429,827,312 2,366,957,059 8.6 20.9
Penelec 373,227,197 375,076,999 389,251,205 391,403,521 451,605,105 467,879,472 472,113,272 0.5*** 25.9 Penn Power 136,838,297 137,209,360 139,365,836 147,271,058 134,567,931 174,449,198 184,277,941 183,328,312 1.8 31.5
PPL 1,066,109,848 1,113,754,752 1,119,311,100 1,272,490,051 1,300,025,518 1,383,051,077 1,450,626,903 1,487,538,825 5.0 32.9
Total 4,606,409,194 4,748,931,596 4,826,284,234 5,361,511,111 5,459,599,676 6,018,316,547 6,141,884,438 6,202,264,440 4.8 28.5 *Met-Ed and Penelec reported jointly under GPU in 2002. **PECO’s data includes electric and gas. ***Percent change from 2003-04.

17
Table 7 – Annual Residential Billings ($) – Gas
Company
2002
2003
2004
2005
2006
2007
2008
2009
Percent Change 2002-
04
Percent Change 2004-
09
Columbia 188,343,042 349,010,748 334,443,294 422,316,022 418,132,074 402,803,625 481,827,700 387,454,010 77.6 15.9
Peoples 181,078,432 263,961,282 290,778,050 356,078,003 322,086,340 286,731,554 331,893,654 259,501,732 60.6 -10.8
Equitable 217,196,523 264,543,904 283,893,176 312,307,597 287,990,871 302,131,240 363,574,586 308,905,022 30.7 8.8
NFG 184,074,895 228,052,896 244,711,222 281,018,336 287,197,446 262,091,560 292,267,922 259,746,550 32.9 6.1
PGW* 572,312,071 643,044,117 632,699,250 622,743,570 649,689,318 629,654,666 * 10.0
UGI-Gas 232,474,943 244,489,521 260,933,261 314,092,374 310,939,761 333,604,769 343,459,192 311,515,001 12.2 19.4 UGI Penn Natural 149,164,424 178,252,688 184,696,814 212,942,138 199,170,443 220,805,764 233,511,186 239,555,679 23.8 29.7
Total 1,152,332,259 1,528,311,039 2,171,767,888 2,541,798,587 2,458,216,185 2,430,912,082 2,696,223,558 2,396,332,660 * 10.3 *PGW did not come under reporting requirements until 2004.

18
The following tables show the percentage of customers in debt for electric and gas utilities from 2002 through 2009. The
percentage of customers in debt is calculated by dividing the number of residential customers in debt by the total number of residential customers. A company with a low percentage of its residential customers in debt will experience better cash flow than one with a higher percentage of its residential customers in debt.1
Company
Table 8 – Percentage of Residential Customers in Debt – Active Accounts – Electric
2002
2003
2004
2005
2006
2007
2008
2009
Percent Change 2002-04
Percent Change 2004-09
Allegheny 18.68 18.06 17.54 16.72 15.55 16.07 15.89 16.83 -6.1 -4.0
Duquesne 15.85 15.67 11.78 11.31 10.20 9.50 9.50 9.41 -25.7 -20.1
GPU* 20.52
Met-Ed 19.56 18.79 18.46 18.69 18.82 19.12 19.88 -3.9*** 5.8
PECO** 19.78 20.57 19.77 19.40 26.58 23.26 23.80 23.71 0.0 19.9
Penelec 20.60 19.88 19.45 19.79 19.63 19.24 19.46 -3.5*** -2.1
Penn Power 21.44 20.37 19.23 19.39 19.17 19.18 18.76 19.31 -10.3 0.4
PPL 15.62 16.34 15.97 15.59 17.20 17.28 17.28 17.56 2.2 10.0
Total 18.40 18.60 17.59 17.16 19.43 18.47 18.59 18.85 -4.4 7.2 *Met-Ed and Penelec reported jointly under GPU in 2002. **PECO statistics include electric and gas. ***Percent change from 2003-04.
The percentage of residential customers in debt for the electric industry declined by 4.4 percent in the pre-Chapter 14 period from
2002-04 but has since increased by 7.2 percent in the post-Chapter 14 period from 2004-09.
1 These are customers with utility account arrearages.

19
Table 9 – Percentage of Residential Customers in Debt – Active Accounts – Gas
Company
2002
2003
2004
2005
2006
2007
2008
2009
Percent Change 2002-04
Percent Change 2004-09
Columbia 10.44 12.79 14.14 14.23 13.13 12.85 13.34 11.49 35.4 -18.7
Peoples 18.10 17.00 18.03 17.78 15.61 14.61 14.19 12.76 -0.4 -29.2
Equitable 16.99 16.44 27.44 16.09 14.25 13.43 12.31 11.84 61.5 -56.9
NFG 15.03 16.88 16.54 15.18 13.81 12.09 12.33 12.07 10.0 -27.0
PGW* 37.95 30.27 26.41 25.20 24.01 23.73 * -37.5
UGI-Gas 14.15 15.66 15.22 14.48 13.12 16.61 17.52 16.39 7.6 7.7
UGI Penn Natural 16.66 17.86 17.52 16.14 17.02 17.14 17.92 19.20 5.2 9.6
Total 14.93 15.76 22.63 19.09 17.14 16.86 16.68 15.90 * -29.7 *PGW did not come under reporting requirements until 2004.
The percentage of residential customer in debt for the gas industry, excluding PGW, increased by 19.4 percent in the pre-Chapter 14 period from 2002-04 and declined by 24.2 percent in the post-Chapter 14 period from 2004-09. PGW’s improvement since the passage of Chapter 14 was even more dramatic than its industry peers as the percent of customers in debt declined by 37.5 percent from 2004-09.

20
2002 2003 2004 2005 2006 2007 2008 2009
Electric 18.40 18.60 17.59 17.16 19.43 18.47 18.59 18.85Gas Exluding PGW* 14.93 15.76 17.83 15.61 14.26 16.86 14.44 13.52PGW 37.95 30.27 26.41 25.20 24.01 23.73
0.00
5.00
10.00
15.00
20.00
25.00
30.00
35.00
40.00
Perc
ent
*PGW did not come under reporting requirements until 2004
Percentage of Customers in Debt - Active Accounts
Electric Gas Exluding PGW* PGW
21
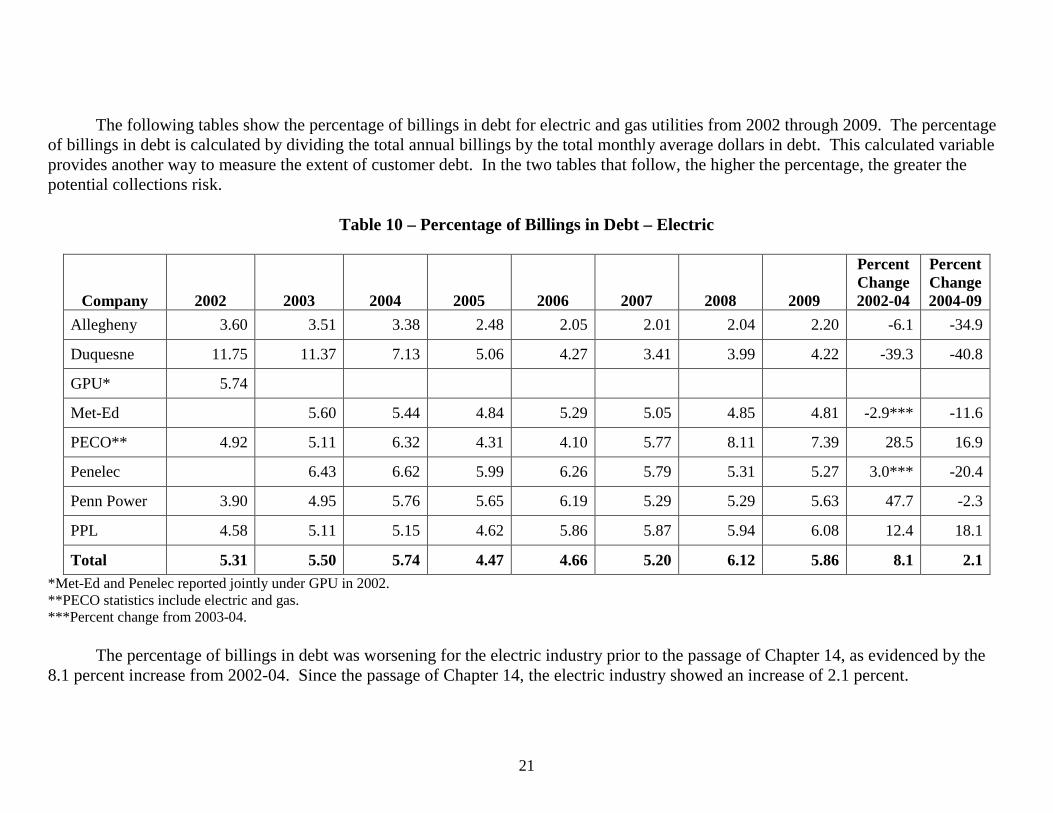
The following tables show the percentage of billings in debt for electric and gas utilities from 2002 through 2009. The percentage
of billings in debt is calculated by dividing the total annual billings by the total monthly average dollars in debt. This calculated variable provides another way to measure the extent of customer debt. In the two tables that follow, the higher the percentage, the greater the potential collections risk.
Table 10 – Percentage of Billings in Debt – Electric
Company
2002
2003
2004
2005
2006
2007
2008
2009
Percent Change 2002-04
Percent Change 2004-09
Allegheny 3.60 3.51 3.38 2.48 2.05 2.01 2.04 2.20 -6.1 -34.9
Duquesne 11.75 11.37 7.13 5.06 4.27 3.41 3.99 4.22 -39.3 -40.8
GPU* 5.74
Met-Ed 5.60 5.44 4.84 5.29 5.05 4.85 4.81 -2.9*** -11.6
PECO** 4.92 5.11 6.32 4.31 4.10 5.77 8.11 7.39 28.5 16.9
Penelec 6.43 6.62 5.99 6.26 5.79 5.31 5.27 3.0*** -20.4
Penn Power 3.90 4.95 5.76 5.65 6.19 5.29 5.29 5.63 47.7 -2.3
PPL 4.58 5.11 5.15 4.62 5.86 5.87 5.94 6.08 12.4 18.1
Total 5.31 5.50 5.74 4.47 4.66 5.20 6.12 5.86 8.1 2.1 *Met-Ed and Penelec reported jointly under GPU in 2002. **PECO statistics include electric and gas. ***Percent change from 2003-04.
The percentage of billings in debt was worsening for the electric industry prior to the passage of Chapter 14, as evidenced by the 8.1 percent increase from 2002-04. Since the passage of Chapter 14, the electric industry showed an increase of 2.1 percent.

22
Table 11 – Percentage of Billings in Debt – Gas
Company
2002
2003
2004
2005
2006
2007
2008
2009
Percent Change 2002-04
Percent Change 2004-09
Columbia 5.61 4.53 4.78 3.93 4.18 3.73 3.53 5.12 -14.8 7.1
Peoples 21.99 13.43 14.48 12.10 15.27 12.92 10.36 12.18 -34.2 -15.9
Equitable 8.50 6.01 9.44 5.09 5.36 4.19 3.23 3.99 11.1 -57.7
NFG 3.09 3.43 3.54 2.85 2.75 2.45 2.31 2.76 14.6 -22.0
PGW* 18.33 12.24 10.80 9.67 9.32 9.96 * -45.7
UGI-Gas 2.17 3.18 3.04 3.18 2.72 3.48 4.06 3.52 40.1 15.8
UGI Penn Natural 3.38 3.97 3.76 2.76 4.07 3.41 3.68 4.18 11.2 11.2
Total 7.34 5.88 9.82 7.01 7.12 6.19 5.67 6.45 * -34.3 *PGW did not come under reporting requirements until 2004.
The percentage of billings in debt decreased by 7.6 percent for the gas industry, excluding PGW, prior to the passage of Chapter 14
from 2002-04 and showed a more dramatic decrease of 23.3 percent since 2004. PGW showed even more dramatic improvement since the passage of Chapter 14, based on the 45.7 percent decrease in the percentage of billings in debt.

23
2002 2003 2004 2005 2006 2007 2008 2009
Electric 5.31 5.50 5.74 4.47 4.66 5.20 6.12 5.86Gas-Excluding PGW* 7.34 5.88 6.78 5.18 5.77 6.19 4.41 5.20PGW 18.33 12.24 10.80 9.67 9.32 9.96
0.00
2.00
4.00
6.00
8.00
10.00
12.00
14.00
16.00
18.00
20.00
Per
cent
*PGW did not come under reporting requirements until 2004
Percentage of Billings in Debt
Electric Gas-Excluding PGW* PGW

24
The following tables show the weighted average of arrearages compared to bills for electric and gas utilities from 2002 through
2009. The weighted arrearage is calculated by dividing the average arrearage by the average bill. It represents the number of average bills in an average arrearage. The larger the number, the greater the collections risk.
Table 12 – Weighted Arrearage – Active Accounts – Electric
Company
2002
2003
2004
2005
2006
2007
2008
2009
Percent Change 2002-04
Percent Change 2004-09
Allegheny 2.48 2.34 2.33 1.79 1.58 1.51 1.51 1.51 -6.0 -35.2
Duquesne 8.81 8.69 7.29 5.36 5.03 4.42 5.07 5.96 -17.3 -18.2
GPU* 3.35
Met-Ed 3.43 3.17 3.14 3.40 3.21 3.04 2.93 -7.6*** -7.6
PECO** 2.98 2.98 3.83 2.66 1.85 4.06 4.09 3.74 42.4 -2.3
Penelec 3.36 3.99 3.69 3.77 3.51 3.32 3.25 18.8*** -18.5
Penn Power 3.53 3.44 3.16 3.49 3.86 3.31 3.38 3.51 -10.5 11.1
PPL 3.58 3.80 3.96 3.60 4.14 4.12 4.09 4.20 10.6 6.1
Total 3.99 3.91 4.13 3.47 3.24 3.91 4.24 4.02 3.5 -2.7 *Met-Ed and Penelec reported jointly under GPU in 2002. **PECO statistics include electric and gas. ***Percent change from 2003-04.
From 2002 to 2004, the weighted arrearage for the electric industry increased by 3.5 percent. It improved somewhat after the
passage of Chapter 14, as reflected by the 2.7 percent decrease from 2004-09.

25
Table 13 – Weighted Arrearage – Active Accounts – Gas
Company
2002
2003
2004
2005
2006
2007
2008
2009
Percent Change 2002-04
Percent Change 2004-09
Columbia 4.73 3.76 3.48 3.05 3.56 3.36 3.04 5.53 -26.4 58.9
Peoples 10.15 6.99 7.21 6.39 8.33 7.64 6.33 7.94 -29.0 10.1
Equitable 5.32 4.00 3.84 3.52 3.87 3.36 2.91 3.39 -27.8 -11.7
NFG 2.50 2.49 2.63 2.32 2.46 2.44 2.24 2.75 5.2 4.6
PGW* 5.85 4.93 5.04 4.56 4.64 4.94 * -15.6
UGI-Gas 2.20 2.39 2.33 2.46 2.19 2.53 2.43 2.48 5.9 6.4
UGI Penn Natural 2.46 2.71 2.61 2.15 2.73 2.48 2.52 2.66 6.1 1.9
Total 5.11 3.99 4.77 4.11 4.45 4.06 3.71 4.38 * -8.2 *PGW did not come under reporting requirements until 2004.
The weighted arrearage for the gas industry, excluding PGW, improved significantly, decreasing by 20.7 percent from 2002-04.
The gas industry showed a very slight improvement following the passage of Chapter 14 as the decline measured 0.7 percent from 2004-09. PGW’s weighted arrearage improved more dramatically than that of its industry peers since the passage of Chapter 14 as the weighted arrearage declined by 15.6 percent from 2004-09.

26
2002 2003 2004 2005 2006 2007 2008 2009
Electric 3.99 3.91 4.13 3.47 3.24 3.91 4.24 4.02Gas-Excluding PGW 5.11 3.99 4.05 3.65 4.22 4.06 3.32 4.02PGW 5.85 4.93 5.04 4.56 4.64 4.94
0.00
1.00
2.00
3.00
4.00
5.00
6.00
7.00P
erce
nt
*PGW did not come under reporting requirements until 2004
Weighted Arrearage - Active Accounts
Electric Gas-Excluding PGW PGW

27
The following tables show the gross residential write-offs ratio for electric and gas utilities from 2002 through 2009. The gross
residential write-off ratio is the percentage of billings written off as uncollectible. The percentage of residential billings written off as uncollectible is the most commonly used long-term measure of collections system performance. This measure is calculated by dividing the annual total gross dollars written off for residential accounts by the annual total dollars of residential billings.
Table 14 – Percentage of Gross Residential Write-Offs Ratio – Electric
Company
2002
2003
2004
2005
2006
2007
2008
2009
Percent Change 2002-04
Percent Change 2004-09
Allegheny 1.65 1.82 1.86 1.58 1.17 1.09 1.01 0.93 12.7 -50.0
Duquesne 5.19 3.69 3.15 2.58 2.62 1.15 1.26 1.76 -39.3 -44.1
GPU* 2.49
Met-Ed 1.80 2.11 2.14 1.89 1.93 1.91 1.71 17.2*** -19.0
PECO** 2.31 2.00 2.12 2.01 1.84 2.24 2.11 2.22 -8.2 4.7
Penelec 2.16 2.33 2.58 2.20 2.07 2.00 1.76 7.9*** -24.5
Penn Power 1.35 1.28 1.69 2.27 1.93 1.74 1.81 1.82 25.2 7.7
PPL 1.51 1.61 1.99 1.50 1.63 1.68 1.78 2.36 31.8 18.6
Total 2.27 1.97 2.14 1.95 1.81 1.87 1.83 2.00 -5.7 -6.5 *Met-Ed and Penelec reported jointly under GPU in 2002. **PECO statistics include electric and gas. ***Percent change from 2003-04.
The percentage of gross residential write-offs ratio for the electric industry declined by 5.7 percent prior to the passage of Chapter
14. The residential write-offs ratio continued to decline after the passage of Chapter 14, as indicated by the 6.5 percent decrease from 2004-09.

28
Table 15 – Percentage of Gross Residential Write-Offs Ratio – Gas
Company
2002
2003
2004
2005
2006
2007
2008
2009
Percent Change 2002-04
Percent Change 2004-09
Columbia 3.87 5.89 4.81 4.07 3.04 2.61 2.26 3.11 24.3 -35.3
Peoples 7.70 5.01 4.79 4.01 3.23 3.86 2.87 4.06 -37.8 -15.2
Equitable 7.44 3.82 2.79 5.00 5.32 3.73 3.46 2.97 -62.5 6.5
NFG 3.61 1.93 2.45 2.69 2.55 3.17 2.09 2.33 -32.1 -4.9
PGW* 11.52 14.60 14.93 8.41 7.08 8.45 * -26.6
UGI-Gas 2.56 2.75 2.60 2.45 2.73 2.93 3.39 3.08 1.6 18.5
UGI Penn Natural 2.17 2.13 2.79 2.85 2.53 2.81 3.57 3.83 28.6 37.3
Total 4.62 3.85 5.61 6.38 6.25 4.51 3.90 4.58 * -18.4 *PGW did not come under reporting requirements until 2004.
The percentage of gross residential write-offs ratio for the gas industry, excluding PGW, declined by 24.5 percent prior to the
passage of Chapter 14 and continued to decline after the passage of Chapter 14, as indicated by the 8.3 percent decrease from 2004-09. PGW did even better than its industry peers following the passage of Chapter 14 as indicated by the decline of 26.6 percent.

29
2002 2003 2004 2005 2006 2007 2008 2009
Electric 2.27 1.97 2.14 1.95 1.81 1.87 1.83 2.00Gas-Excluding PGW 4.62 3.85 3.49 3.60 3.25 4.51 2.89 3.20PGW 11.52 14.60 14.93 8.41 7.08 8.45
0.00
2.00
4.00
6.00
8.00
10.00
12.00
14.00
16.00
Per
cent
*PGW did not come under reporting requirements until 2004
Percentage of Gross Residential Write-Off Ratio
Electric Gas-Excluding PGW PGW
30
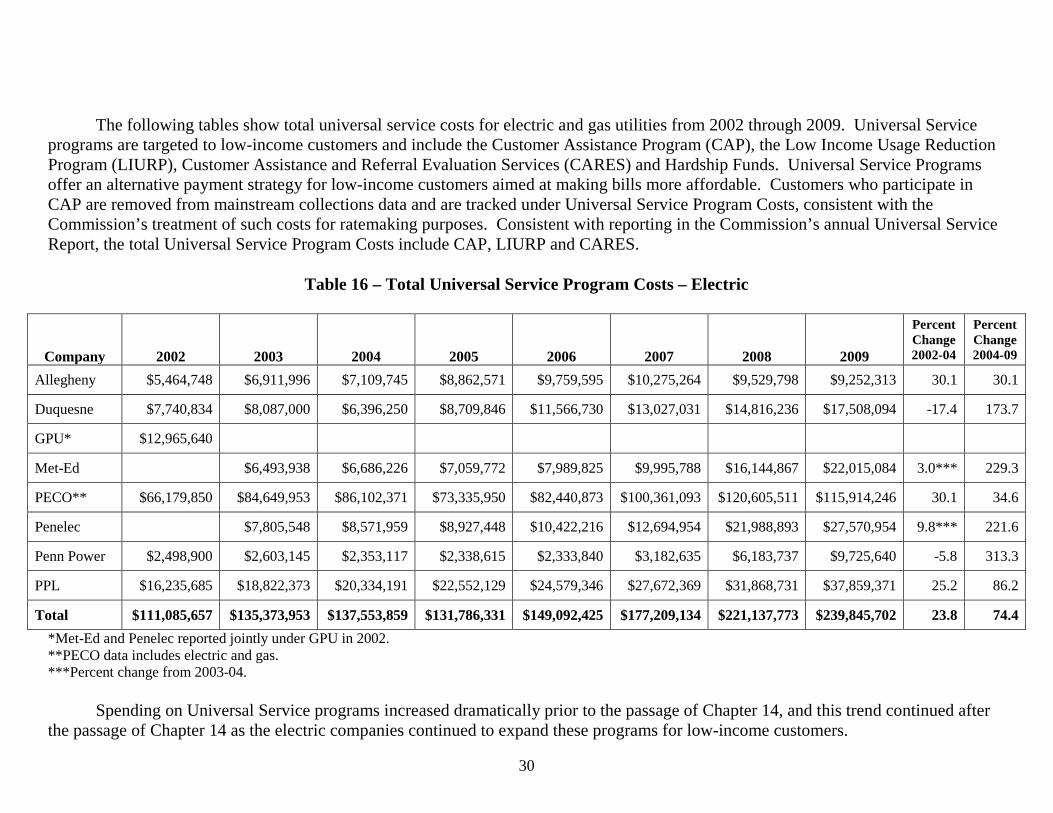
The following tables show total universal service costs for electric and gas utilities from 2002 through 2009. Universal Service
programs are targeted to low-income customers and include the Customer Assistance Program (CAP), the Low Income Usage Reduction Program (LIURP), Customer Assistance and Referral Evaluation Services (CARES) and Hardship Funds. Universal Service Programs offer an alternative payment strategy for low-income customers aimed at making bills more affordable. Customers who participate in CAP are removed from mainstream collections data and are tracked under Universal Service Program Costs, consistent with the Commission’s treatment of such costs for ratemaking purposes. Consistent with reporting in the Commission’s annual Universal Service Report, the total Universal Service Program Costs include CAP, LIURP and CARES.
Table 16 – Total Universal Service Program Costs – Electric
Company
2002
2003
2004
2005
2006
2007
2008
2009
Percent Change 2002-04
Percent Change 2004-09
Allegheny $5,464,748 $6,911,996 $7,109,745 $8,862,571 $9,759,595 $10,275,264 $9,529,798 $9,252,313 30.1 30.1
Duquesne $7,740,834 $8,087,000 $6,396,250 $8,709,846 $11,566,730 $13,027,031 $14,816,236 $17,508,094 -17.4 173.7
GPU* $12,965,640
Met-Ed $6,493,938 $6,686,226 $7,059,772 $7,989,825 $9,995,788 $16,144,867 $22,015,084 3.0*** 229.3
PECO** $66,179,850 $84,649,953 $86,102,371 $73,335,950 $82,440,873 $100,361,093 $120,605,511 $115,914,246 30.1 34.6
Penelec $7,805,548 $8,571,959 $8,927,448 $10,422,216 $12,694,954 $21,988,893 $27,570,954 9.8*** 221.6
Penn Power $2,498,900 $2,603,145 $2,353,117 $2,338,615 $2,333,840 $3,182,635 $6,183,737 $9,725,640 -5.8 313.3
PPL $16,235,685 $18,822,373 $20,334,191 $22,552,129 $24,579,346 $27,672,369 $31,868,731 $37,859,371 25.2 86.2
Total $111,085,657 $135,373,953 $137,553,859 $131,786,331 $149,092,425 $177,209,134 $221,137,773 $239,845,702 23.8 74.4 *Met-Ed and Penelec reported jointly under GPU in 2002. **PECO data includes electric and gas. ***Percent change from 2003-04.
Spending on Universal Service programs increased dramatically prior to the passage of Chapter 14, and this trend continued after the passage of Chapter 14 as the electric companies continued to expand these programs for low-income customers.

31
Table 17 – Total Universal Service Program Costs – Gas
Company
2002
2003
2004
2005
2006
2007
2008
2009
Percent Change 2002-04
Percent Change 2004-09
Columbia $10,408,791 $23,459,213 $16,344,747 $24,467,999 $27,380,104 $24,816,225 $25,879,596 $31,551,847 57.0 93.0
Peoples $2,214,685 $4,166,512 $6,161,196 $6,557,505 $8,389,190 $23,570,907 $9,448,364 $11,046,754 178.2 79.3
Equitable $2,717,462 $4,719,898 $6,596,751 $10,294,719 $16,745,551 $12,506,073 $16,675,577 $30,380,400 142.8 360.5
NFG $3,098,569 $4,543,118 $5,833,965 $7,721,233 $10,015,338 $7,884,198 $9,420,781 $8,119,399 88.3 39.2
PGW* $59,808,697 $86,621,290 $105,440,734 $108,307,951 $105,892,522 $108,636,123 * 81.6
UGI-Gas $1,097,623 $1,461,256 $2,615,634 $2,565,408 $4,119,883 $5,075,209 $5,749,679 $6,781,836 138.3 159.3 UGI Penn Natural $686,930 $923,336 $1,036,120 $1,347,401 $1,763,766 $1,604,466 $2,963,411 $4,450,767 50.8 329.6
Total $20,224,060 $39,273,333 $98,397,110 $139,575,555 $173,854,566 $183,765,029 $176,029,930 $200,967,126 * 104.2 *PGW did not come under reporting requirements until 2004.
Spending on Universal Service programs increased prior to the passage of Chapter 14, and this trend increased dramatically after the passage of Chapter 14 as gas companies expanded these programs for low-income customers during the era of volatile gas prices since 2002.

32
The following table is a summary of various significant collections data variables and collections data performance measures that appear in Section II, Section III and in various appendices in this report. For both the electric and gas industries, the pre-Chapter 14 trend is shown in the columns indicating the change from 2002-04 and the post-Chapter 14 analysis is shown in the columns indicating the change from 2004-09.
Table 18 – Summary of Collections Measures – Percent Change 2002-04 and Percent Change 2004-09
Collections Measure
Electric Industry 2002-04
Electric Industry 2004-09
Gas Industry 2002-04*
Gas Industry 2004-09*
PGW
2004-09
Billings 4.8 28.5 38.8 10.5 10.0
Gross Write-Offs Ratio -5.7 -6.5 -24.5 -8.3 -26.6
Percent of Billings in Debt 8.1 2.1 -7.6 -23.3 -45.7
Percent of Customers in Debt** -4.4 7.2 19.4 -24.2 -37.5
Weighted Arrearage 3.5 -2.7 -20.7 -0.7 -15.6
Universal Service Programs Costs 23.8 74.4 90.8 139.3 81.6
*Excludes PGW – PGW did not come under reporting requirements until 2004. **See Appendix 2 for the explanation of variability among the companies for reporting when they consider an account to be overdue and see Appendix 3 for the explanation of variability of when they move an account from active status to inactive status following a termination or discontinuance of service. Conclusion: Section II – The Effect Upon the Cash Working Capital or Cash Flow, Uncollectible Levels and Collections of the Affected Public Utilities
The overall collections performance for the electric industry continues to show some
deterioration since the passage of Chapter 14. Specifically, the 28.5 percent increase in residential revenues since 2004 has been offset by an increasing number and percentage of customers who are in arrears and who owe an increasing amount of money. On the positive side, the gross residential write-offs ratio declined by 6.5 percent from 2004-09. The electric industry has also expanded CAP spending by 79.6 percent since the passage of Chapter 14.
Looking ahead, the Commission is concerned about the collections performance of the
electric industry as rate caps are lifted for Met-Ed, PECO, Penelec and Allegheny on Dec. 31, 2010. While less than originally predicted, the increases in post-rate cap generation rates combined with additional base-rate increases are cause for concern – especially when combined with diminishing purchasing power for customers in the current economic climate. In support of the evidence of the economic downturn, the Commission offers the increase in the percentage of Pennsylvania households at or below 150 percent of the Federal Poverty

33
Level, as the statewide percentage increased from 19 percent in 2000 to 25 percent in 2008. These factors may make it more challenging and difficult for the electric industry to manage its collections performance and costs.
The overall collections performance for the gas industry improved from 2004-09. This improvement reflects the continuation of a trend that had already begun in the pre-Chapter 14 period from 2002-04. During the post-Chapter 14 years, the percentage of customers in debt declined by 29.7 percent while the total dollars in debt declined by 27.5 percent. The gross residential write-offs ratio declined by 18.4 percent since the passage of Chapter 14. Finally, the gas industry has expanded CAP spending by 108.4 percent since 2004.
Overall, the analysis of the various collections data continues to show a dramatic
pattern of improvement for PGW since the passage of Chapter 14. Significantly fewer customers owe money to PGW while the amount of debt has also significantly declined since 2004. PGW also stands out for the 26.6 percent decrease in its gross residential write-offs ratio. PGW’s improved collections performance and overall financial health is reflected by its recently upgraded bond rating.
As shown above, the impact on residential collections continues to be more developed
since our initial report. The collections data presented in this report do not include CAP accounts, consistent with the Commission’s historical treatment of CAP accounts. For ratemaking purposes, CAP costs are recovered as a Universal Service Program Expense and not as a collections expense. The increase in the enrollment in CAP since the passage of Chapter 14 is a factor in the overall collections trend line. Based on data from the previously released annual reports on Universal Service programs, the corresponding year-end CAP enrollments increased from 305,303 in 2004 to 463,461 in 2009. The net effect in the growth of the CAP programs is that these customer arrearages are removed from the amount of current arrearages.

34
Section III - The Level of Access to Utility Services by Residential Customers, Including Low-Income Customers
This report also is designed to measure the impact of Chapter 14 on access to utility
services by residential customers, including low-income customers.
To help measure access, the PUC uses monthly termination and reconnection data received from the electric and gas distribution companies. The Commission also uses limited information on terminated households through the annual Cold Weather Survey (CWS). The CWS data gathering is conducted by the electric and natural gas distribution companies annually during the fall months. The utilities survey residential properties where heat-related service was terminated during the calendar year and not reconnected. Survey results are reported to the Commission and categorized according to income status. The CWS does not provide any indication as to how long the household has been without utility service. A further limitation of the CWS is that customers whose service was terminated in a prior year will not be in the pool of customers to be surveyed in the current year.

35
Termination of utility service is the most serious consequence of customer nonpayment. The termination of utility service is a last
resort when customers fail to meet their payment obligations. The following tables contain information on the number of terminations for electric and gas utilities from 2002 through 2009.
Table 19 – Terminations – Electric
Company
2002
2003
2004
2005
2006
2007
2008
2009
Percent Change 2002-04
Percent Change 2004-09
Allegheny 8,777 9,941 12,007 19,980 21,514 21,689 19,650 17,057 36.8 42.1
Duquesne 9,307 9,138 10,694 22,132 20,885 22,624 22,081 23,143 14.9 116.4
GPU* 9,268
Met-Ed 3,552 4,506 7,599 8,465 15,432 16,359 12,915 26.9*** 186.6
PECO** 46,040 42,529 55,098 61,063 42,336 53,729 84,323 76,862 19.7 39.5
Penelec 5,247 5,881 11,430 11,307 14,061 13,442 9,878 12.1*** 68.0
Penn Power 1,483 1,110 1,446 2,795 3,016 4,598 4,030 3,196 -2.5 121.0
PPL 7,736 8,174 9,061 17,795 21,221 25,873 38,917 33,247 17.1 266.9
Total 82,611 79,691 98,693 142,794 128,744 158,006 198,802 176,298 19.5 78.6 *Met-Ed and Penelec reported jointly under GPU in 2002. **PECO statistics include electric and gas. ***Percent change from 2003-04.
Terminations for the electric industry were on the rise prior to the passage of Chapter 14. For example, terminations increased by 19.5 percent from 2002-04. Since 2004, terminations have reached record levels, increasing 78.6 percent during the period from 2004 to 2009.

36
Table 20 – Terminations – Gas
Company
2002
2003
2004
2005
2006
2007
2008
2009
Percent Change 2002-04
Percent Change 2004-09
Columbia 5,832 6,153 7,545 18,819 14,571 12,825 12,188 11,662 29.4 54.6
Peoples 5,131 6,529 6,054 6,768 5,083 5,302 7,867 7,640 18.0 26.2
Equitable 11,012 11,106 7,023 13,075 12,793 12,593 11,979 10,836 -36.2 54.3
NFG 5,880 6,051 7,422 14,125 13,243 11,138 11,022 12,290 26.2 65.6
PGW* 29,695 40,663 30,808 23,437 28,674 38,536 * 29.8
UGI-Gas 7,824 10,409 8,911 12,830 13,778 14,571 16,415 14,891 13.9 67.1
UGI Penn Natural 4,041 4,547 5,169 5,334 5,179 7,065 7,735 8,672 27.9 67.8
Total 39,720 44,795 71,819 111,614 95,455 86,931 95,880 104,527 * 45.5 *PGW did not come under reporting requirements until 2004.
Terminations for the gas industry, excluding PGW rose to record levels since the passage of Chapter 14, with an overall increase of 56.7 percent from 2004-09. This followed a period of a more modest increase of 6.1 percent from 2002-04. Meanwhile, PGW has shown a 29.8 percent increase in terminations since 2004, while also showing improvement across the board for the residential collections performance measures presented in this report.

37
2002 2003 2004 2005 2006 2007 2008 2009
Electric 82,611 79,691 98,693 142,794 128,744 158,006 198,802 176,298Gas-Excluding PGW 39,720 44,795 42,124 70,951 64,647 63,494 67,206 65,991PGW 29,695 40,663 30,808 23,437 28,674 38,536
0
50,000
100,000
150,000
200,000
250,000
*PGW did not come under reporting requirements until 2004
Terminations
Electric Gas-Excluding PGW PGW

38
The following tables show termination rates for electric and gas utilities from 2002 through 2009. The termination rate is
calculated by dividing the number of terminations by the number of customers.
Table 21 – Termination Rate – Electric
Company
2002
2003
2004
2005
2006
2007
2008
2009
Percent Change 2002-04
Percent Change 2004-09
Allegheny 1.48 1.66 2.00 3.31 3.54 3.55 3.21 2.78 35.1 39.0
Duquesne 1.77 1.74 2.03 4.22 3.98 4.31 4.21 4.41 14.7 117.2
GPU* 0.98
Met-Ed 0.79 0.98 1.63 1.78 3.22 3.39 2.67 24.1*** 172.4
PECO** 3.32 3.02 3.95 4.36 3.01 3.82 5.95 5.43 19.0 37.5
Penelec 1.04 1.17 2.26 2.24 2.78 2.66 1.96 12.5*** 67.5
Penn Power 1.10 0.81 1.05 2.02 2.17 3.30 2.88 2.29 -4.5 118.1
PPL 0.68 0.71 0.78 1.51 1.79 2.16 3.23 2.75 14.7 252.6
Total 1.75 1.67 2.06 2.97 2.66 3.25 4.07 3.60 17.7 74.8 *Met-Ed and Penelec reported jointly under GPU in 2002. **PECO statistics include electric and gas ***Percent change from 2003-04.
Terminations for the electric industry have risen to record high levels since the passage of Chapter 14, increasing from 2.06 to 3.60 from 2004-09. Overall, the termination rate has increased by 75 percent from 2004-09.

39
Table 22 – Termination Rate – Gas
Company
2002
2003
2004
2005
2006
2007
2008
2009
Percent Change 2002-04
Percent Change 2004-09
Columbia 1.67 1.74 2.11 5.22 4.00 3.48 3.29 3.14 26.3 48.8
Peoples 1.59 2.02 1.87 2.09 1.57 1.63 2.41 2.34 17.6 25.1
Equitable 4.66 4.71 3.00 5.62 5.51 5.28 5.01 4.52 -35.6 50.7
NFG 3.01 3.10 3.81 7.29 6.86 5.62 5.57 6.22 26.6 63.3
PGW* 6.23 8.55 6.44 4.87 5.96 8.01 * 28.6
UGI-Gas 3.06 3.96 3.30 4.64 4.85 4.96 5.50 4.92 7.8 49.1
UGI Penn Natural 2.91 3.26 3.69 3.80 3.68 4.95 5.38 5.99 26.8 62.3
Total 2.65 2.97 3.60 5.57 4.73 4.24 4.66 5.07 * 40.8 *PGW did not come under reporting requirements until 2004.
The termination rate for the gas industry, excluding PGW, has risen to record high levels since the passage of Chapter 14, going from 2.77 in 2004 to 4.17 in 2009. Similarly, PGW reported an increase in the termination rate from 6.23 in 2004 to 8.01 in 2009. Nevertheless, PGW has shown significant improvement in overall collections performance under Chapter 14.
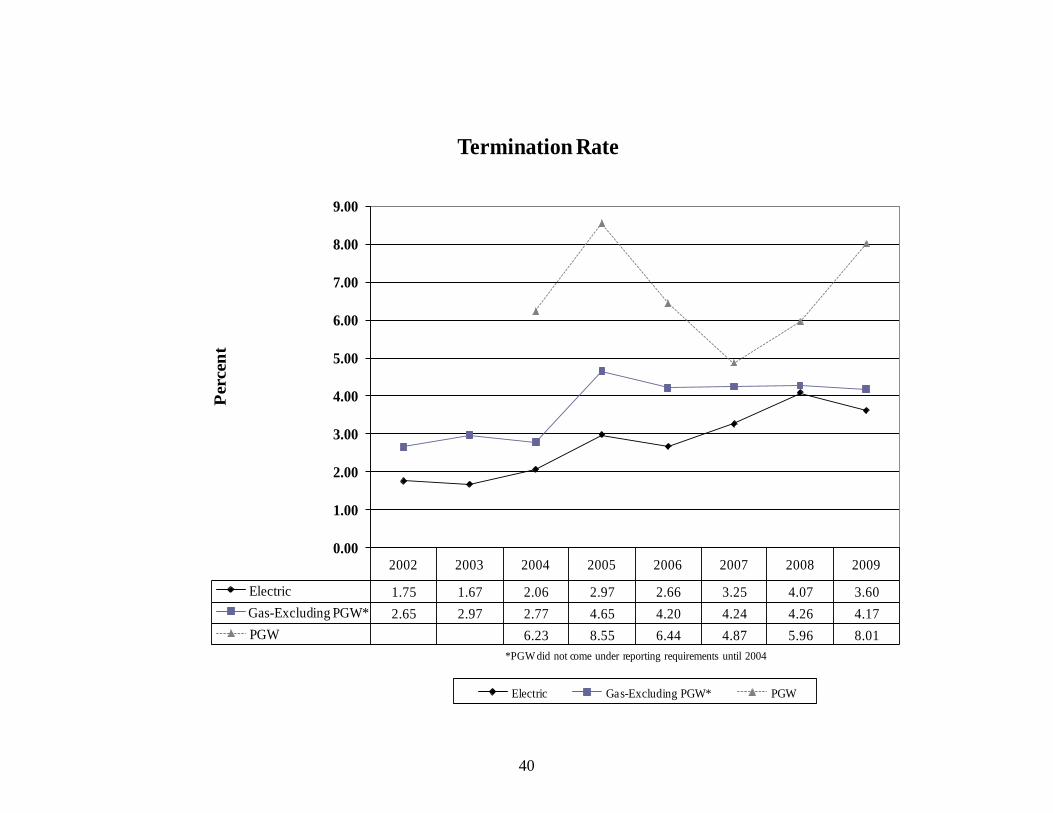
40
2002 2003 2004 2005 2006 2007 2008 2009
Electric 1.75 1.67 2.06 2.97 2.66 3.25 4.07 3.60Gas-Excluding PGW* 2.65 2.97 2.77 4.65 4.20 4.24 4.26 4.17PGW 6.23 8.55 6.44 4.87 5.96 8.01
0.00
1.00
2.00
3.00
4.00
5.00
6.00
7.00
8.00
9.00P
erce
nt
*PGW did not come under reporting requirements until 2004
Termination Rate
Electric Gas-Excluding PGW* PGW
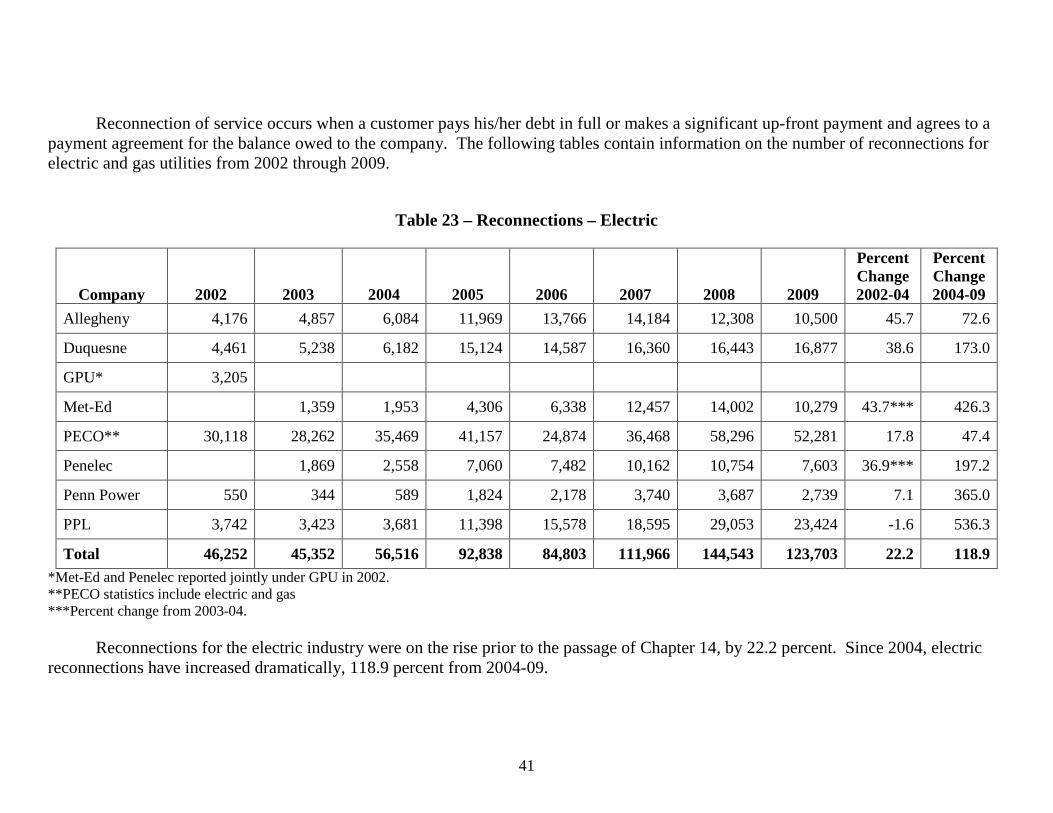
41
Reconnection of service occurs when a customer pays his/her debt in full or makes a significant up-front payment and agrees to a
payment agreement for the balance owed to the company. The following tables contain information on the number of reconnections for electric and gas utilities from 2002 through 2009.
Table 23 – Reconnections – Electric
Company
2002
2003
2004
2005
2006
2007
2008
2009
Percent Change 2002-04
Percent Change 2004-09
Allegheny 4,176 4,857 6,084 11,969 13,766 14,184 12,308 10,500 45.7 72.6
Duquesne 4,461 5,238 6,182 15,124 14,587 16,360 16,443 16,877 38.6 173.0
GPU* 3,205
Met-Ed 1,359 1,953 4,306 6,338 12,457 14,002 10,279 43.7*** 426.3
PECO** 30,118 28,262 35,469 41,157 24,874 36,468 58,296 52,281 17.8 47.4
Penelec 1,869 2,558 7,060 7,482 10,162 10,754 7,603 36.9*** 197.2
Penn Power 550 344 589 1,824 2,178 3,740 3,687 2,739 7.1 365.0
PPL 3,742 3,423 3,681 11,398 15,578 18,595 29,053 23,424 -1.6 536.3
Total 46,252 45,352 56,516 92,838 84,803 111,966 144,543 123,703 22.2 118.9 *Met-Ed and Penelec reported jointly under GPU in 2002. **PECO statistics include electric and gas ***Percent change from 2003-04.
Reconnections for the electric industry were on the rise prior to the passage of Chapter 14, by 22.2 percent. Since 2004, electric reconnections have increased dramatically, 118.9 percent from 2004-09.
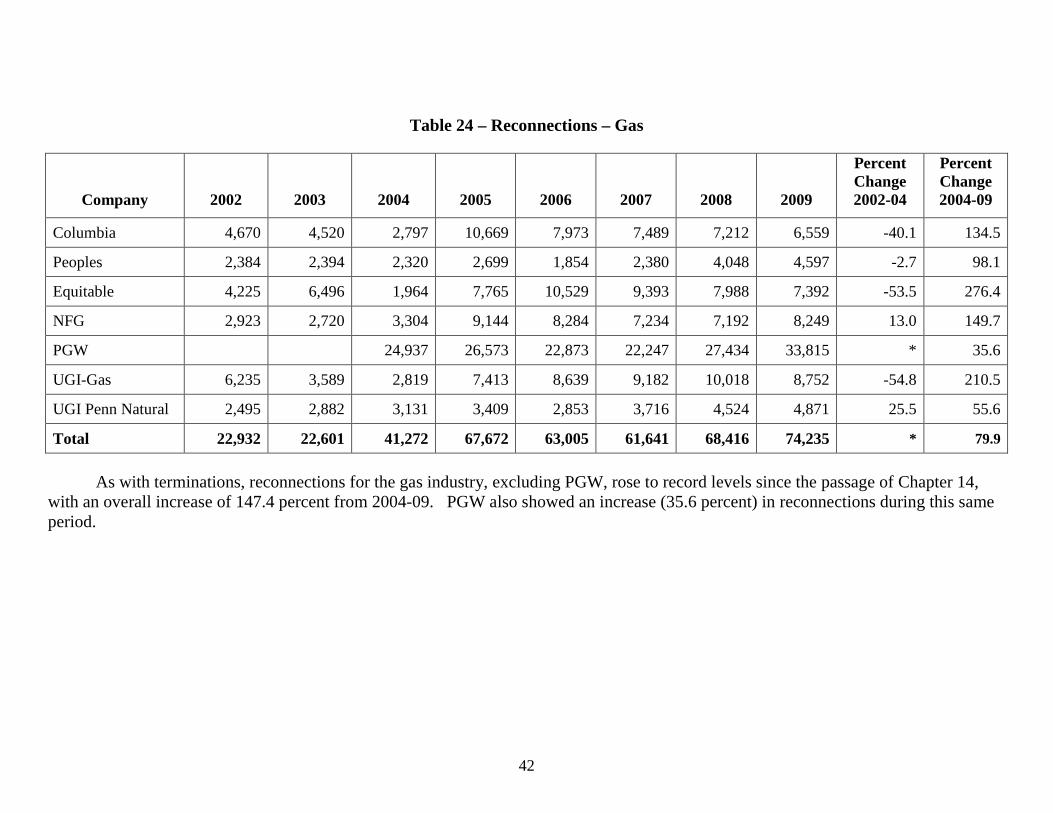
42
Table 24 – Reconnections – Gas
Company
2002
2003
2004
2005
2006
2007
2008
2009
Percent Change 2002-04
Percent Change 2004-09
Columbia 4,670 4,520 2,797 10,669 7,973 7,489 7,212 6,559 -40.1 134.5
Peoples 2,384 2,394 2,320 2,699 1,854 2,380 4,048 4,597 -2.7 98.1
Equitable 4,225 6,496 1,964 7,765 10,529 9,393 7,988 7,392 -53.5 276.4
NFG 2,923 2,720 3,304 9,144 8,284 7,234 7,192 8,249 13.0 149.7
PGW 24,937 26,573 22,873 22,247 27,434 33,815 * 35.6
UGI-Gas 6,235 3,589 2,819 7,413 8,639 9,182 10,018 8,752 -54.8 210.5
UGI Penn Natural 2,495 2,882 3,131 3,409 2,853 3,716 4,524 4,871 25.5 55.6
Total 22,932 22,601 41,272 67,672 63,005 61,641 68,416 74,235 * 79.9
As with terminations, reconnections for the gas industry, excluding PGW, rose to record levels since the passage of Chapter 14, with an overall increase of 147.4 percent from 2004-09. PGW also showed an increase (35.6 percent) in reconnections during this same period.

43
The following tables show the reconnection ratios of electric and gas utilities from 2002 through 2009. The reconnect ratio is calculated by dividing the number of reconnections by the number of terminations in a calendar year.
Table 25 – Reconnect Ratio – Electric
Company
2002
2003
2004
2005
2006
2007
2008
2009
Percent Change 2002-04
Percent Change 2004-09
Allegheny 47.6 48.9 50.7 59.9 64.0 65.4 62.6 61.6 6.5 21.5
Duquesne 47.9 57.3 57.8 68.3 69.8 72.3 74.5 72.9 20.7 26.1
GPU* 34.6
Met-Ed 38.3 43.3 56.7 74.9 80.7 85.6 79.6 13.1*** 83.8
PECO** 65.4 66.5 64.4 67.4 58.8 67.9 69.1 68.0 -1.5 5.6
Penelec 35.6 43.5 61.8 66.2 72.3 80.0 77.0 22.2*** 77.0
Penn Power 37.1 31.0 40.7 65.3 72.2 81.3 91.5 85.7 9.7 110.6
PPL 48.4 41.9 40.6 64.1 73.4 71.9 74.7 70.5 -16.1 73.6
Total 56.0 56.9 57.3 65.0 65.9 70.9 72.7 70.2 2.3 22.5 *Met-Ed and Penelec reported jointly under GPU in 2002. **PECO statistics include electric and gas. **Percent change from 2003-04.
The electric industry’s reconnect ratio showed little improvement prior to the passage of Chapter 14. The overall reconnection ratio for the electric industry improved with a 22.5 percent increase from 2004-09.

44
Table 26 – Reconnect Ratio – Gas
Company
2002
2003
2004
2005
2006
2007
2008
2009
Percent Change 2002-04
Percent Change 2004-09
Columbia 80.1 73.5 37.1 56.7 54.7 58.4 59.2 56.2 -53.7 51.5
Peoples 46.5 36.7 38.3 39.9 36.5 44.9 51.5 60.2 -17.6 57.2
Equitable 38.4 58.5 28.0 59.4 82.3 74.6 66.7 68.2 -27.1 143.6
NFG 49.7 45.0 44.5 64.7 62.6 65.0 65.3 67.1 -10.5 50.8
PGW 84.0 65.4 74.2 94.9 95.7 87.8 * 4.5
UGI-Gas 79.7 34.5 31.6 57.8 62.7 63.0 61.0 58.8 -60.4 86.1
UGI Penn Natural 61.7 63.4 60.6 63.9 55.1 52.6 58.5 56.2 -1.8 -7.3
Total 57.7 50.5 57.5 60.6 66.0 70.9 71.4 71.0 * 23.5
From 2002 to 2004, the reconnection ratio for the gas industry, excluding PGW, declined by 32.8 percent. The reconnection ratio
for the gas industry, excluding PGW, increased 58 percent since the passage of Chapter 14. PGW’s reconnection ratio also increased 4.5 percent during this time.

45
Cold Weather Survey (CWS)
Every December, the PUC releases its CWS results, which assess the number of households without heat-related service entering the winter months. As part of the survey, the PUC requires natural gas and electric utilities to check residential properties where service has been shut off. Contact is attempted through both telephone calls and in-person visits to the homes. In the pre-Chapter 14 period of 2001-04, there was an average of 12,049 households that entered the winter heating season without heat-related utility service. This number peaked in 2005 at 17,057 households. The 2009 number continues to be at a near peak level of 17,037.
Homes using potentially unsafe heating sources also are counted because the home is not relying on a central heating system. According to the National Fire Protection Association, potentially unsafe sources of heat include kerosene heaters, kitchen stoves or ovens, electric space heaters, fireplaces and connecting extension cords to neighbors’ homes. According to the 2009 survey, there were 3,992 residences using potentially unsafe heating sources, bringing the total homes not using a central heating system to 21,029. The total number of homes not using a central heating system continues to be considerably higher than the pre-Chapter 14 average of 14,979.
The 2009 survey results also show that as of Dec. 15, 2009:
• 3,669 residential households were without electric service; 14,332 residences where service was terminated now appear to be vacant; and 80 households are heating with potentially unsafe heating sources. The total electric residences without safe heating are 3,749.
• 13,368 residential households that heat with natural gas are without service; 7,438 residences where service was terminated now appear to be vacant; and 3,912 households are heating with potentially unsafe heating sources. The total natural gas residences without safe heating are 17,280.
• PGW reported that 8,397 households that heat with natural gas are without service - the highest number of all utilities. A total of 10,300 or 49 percent of the total off accounts that have no service live in the Philadelphia area.
The Commission urges customers to call their utility and the PUC for help in getting their service restored.
The CWS Charts that follow show the number of residential properties without service for each of the major, regulated electric and natural gas distribution companies in the Commonwealth. The charts show only post-Chapter 14 results, which include the average of the years 2004-2007 and individual results for 2008 and 2009. The years 2008 and 2009, as shown in Tables 27 and 28, represent the two most recent years of available data.

46
Table 27 4-Year Average, 2008 & 2009 Cold Weather Survey Results – Electric
Survey Outcome Allegheny Duquesne Met-Ed PECO1 Penelec
Penn Power PPL
UGI-Electric Total
Percent Change
from Avg. of 2004-07 to
2008
Percent Change
from Avg. of 2004-07
to 2009
Percent Change 2008-09
Total Vacant Residences
Avg. of 2004-07 1,961 1,524 625 2,335 943 500 1,960 146 9,994 2008 2,218 1,484 1,163 3,391 1,070 613 3,619 37 13,595 36 percent 2009 2,082 1,548 1,582 3,422 1,476 588 3,509 125 14,332 43 percent 5 percent
Total Households Using Potentially Unsafe Heating Sources2
Avg. of 2004-07
35 21 12 26 16 3 3 3 119 2008 40 8 11 1 4 3 0 1 68 -43 percent 2009 50 2 2 8 10 2 0 6 80 -33 percent 18 percent
Total Households Without Service After Completion of the Survey (Excludes Households Using Potentially Unsafe Heating Sources, Other Central Heating Sources and Vacant)
Avg. of 2004-07 130 962 155 1,983 200 69 106 7 3,612 2008 139 703 274 2,505 370 45 0 2 4,038 12 percent 2009 265 906 210 1,895 261 21 0 111 3,669 2 percent -9 percent
Total Households Without a Central Heating Source Due to Termination of Utility Service (Includes Households Using Potentially Unsafe Heating Sources and Excludes Other Central Heating Sources and Vacant Residences)
Avg. of 2004-07 165 983 167 2,009 216 72 109 10 3,731 2008 179 711 285 2,506 374 48 0 3 4,106 10 percent 2009 315 908 212 1,903 271 23 0 117 3,749 0 percent -9 percent
1 PECO statistics include electric and gas. 2 Potentially Unsafe Heating Sources include kerosene heaters, electric space heaters, oil-filled space heaters, fireplaces, kitchen stoves or ovens, and use of extension cords to neighbor’s service.

47
Table 28 4-Year Average, 2008 & 2009 Cold Weather Survey Results – Gas
Survey Outcome Columbia Equitable NFG Peoples PGW1
T.W. Phillips
UGI Central
Penn UGI-Gas
UGI Penn
Natural Total
Percent Change
from Avg. of 2004-07
to 2008
Percent Change
from Avg. of 2004-07
to 2009
Percent Change 2008-09
Total Vacant Residences
Avg. of 2004-07 863 746 977 723 1,775 183 212 553 574 6,606 2008 967 712 921 930 1,225 173 213 706 595 6,442 -2 percent 2009 938 771 877 961 2,153 144 227 849 518 7,438 13 percent 15 percent
Total Households Using Potentially Unsafe Heating Sources2
Avg. of 2004-07
232 416 604 120 951 114 161 319 279 3,196 2008 324 261 468 112 1,110 42 215 379 394 3,305 3 percent 2009 469 356 654 123 1,062 57 308 522 361 3,912 22 percent 18 percent
Total Households Without Service After Completion of the Survey (Excludes Households Using Potentially Unsafe Heating Sources, Other Central Heating Sources and Vacant)
Avg. of 2004-07 1,078 1,563 539 714 6,575 179 106 1,050 55 11,859
2008 926 1,036 457 823 5,187 115 99 1,340 351 10,334 -13
percent 2009 829 931 548 948 7,335 119 508 1,429 721 13,368 13 percent 29 percent
Total Households Without a Central Heating Source Due to Termination of Utility Service (Includes Households Using Potentially Unsafe Heating Sources and Excludes Other Central Heating Sources and Vacant Residences)
Avg. of 2004-07 1,310 1,979 1,143 834 7,526 293 267 1,369 334 15,055 2008 1,250 1,297 925 935 6,297 157 314 1,719 745 13,639 -9 percent 2009 1,298 1,287 1,202 1,071 8,397 176 816 1,951 1,082 17,280 15 percent 27 percent
1 PGW did not come under reporting requirements until 2004. 2 Potentially Unsafe Heating Sources include kerosene heaters, electric space heaters, oil-filled space heaters, fireplaces, kitchen stoves or ovens, and use of extension cords to neighbor’s service.

48
Media Reported Incidents Related to Lack of Utility Service When alerted to a possible utility-related tragedy, historically through media reports, the Commission investigates the incident by contacting the utilities involved, and, if necessary, health and safety officials in the municipality. If it appears that a lack of utility service was involved, staff initiates a preliminary investigation into possible compliance issues. If possible compliance issues are identified staff refers the matter to the appropriate bureau for possible enforcement action. The Commission tracks the incidents as well as subsequent informal and formal investigations and settlements or other outcomes. To make the investigating and reporting of these instances more consistent and comprehensive, on Jan. 16, 2009, the Commission issued a Secretarial Letter instituting an interim reporting requirement. Electric and gas utilities were directed to report to the Commission when, in the normal course of business, they become aware of a household fire, incident of hypothermia or carbon monoxide poisoning or another event that resulted in a death at a residence where the utility service was off at the time of the event. Additionally, the Commission has proposed revising the Chapter 56 regulations to include a requirement that directs utilities to report to the Commission anytime they become aware of a death at a residence lacking utility service. Conclusion: Section III – The Level of Access to Utility Services by Residential Customers, Including Low-Income Customers
As for access to utility service, the CWS data is the most important indicator of the
level of access to utility service because the status of the service is verified through the actual survey. The companies reported that as of Dec. 15, 2009, there were 17,037 households that entered the winter season without heat-related service. This total is comparable to 2005 levels. Terminations increased by 78.6 percent for the electric industry and by 45.5 percent for the gas industry from 2004-09. Reconnections increased by 118.9 percent for the electric industry and by 79.9 percent by the gas industry during this time. While the corresponding increase in reconnections has helped maintain reasonable access to utility service, overall these results show that more Pennsylvanians are without electric and gas service since the passage of Chapter 14.
Low-income households that are placed into a CAP program and that successfully
manage to pay their CAP bills represent the success of the safety net that is in place for our poorest households. Thus, it is essential that utilities design CAP programs to be reasonably affordable. The Commission will examine and focus on CAP affordability on a case-by-case basis as utilities submit their triennial Universal Service Plans to the Commission.
Lastly, the Commission continues to promote energy efficiency and conservation as
well as customer responsibility as tools for maintaining access to utility service.

49
Section IV - The Effect Upon the Level of Consumer Complaints and Mediations Filed with and Adjudicated by the Commission
The Commission measures the effect of Chapter 14 on the level of consumer
complaints and payment agreement requests filed with and adjudicated by the Commission. Generally, customer contacts to BCS fall into three basic categories: consumer
complaints, requests for payment agreements and inquiries. BCS classifies contacts regarding complaints about utilities’ actions - including those related to billing, service delivery and repairs - as consumer complaints. Contacts involving payment negotiations for unpaid utility service are regarded as PARs (payment agreement or payment arrangement requests). Consumer complaints and PARs are often collectively referred to as informal complaints. Inquiries include information requests and opinions from consumers, most of which do not require investigation by BCS.
The fourth section of this report includes a comparison of the number of consumer complaints and PARs received pre-Chapter 14 from 2002-2004 versus post-Chapter 14 from 2004-2009. This report also includes data on the number of non-CAP customers who were denied a PAR by the Commission for eligibility or other reasons, beginning in 2005. As the data shows, the number of consumer complaints and PARs received has decreased significantly since the passage of Chapter 14.

50
Consumer Complaints
The following represents the number of residential consumer complaints to the BCS from 2002-10. As shown by the table, the number of residential customer complaints referred to the BCS since the passage of Chapter 14 has declined significantly.
Table 29 – Consumer Complaints
2002 2003 2004 2005 2006 2007 2008 2009 2010*
Electric 4,680 5,194 5,330 4,720 4,212 5,106 5,214 4,826 3,922
Gas 4,346 5,313 5,992 6,200 5,912 4,666 4,150 3,942 1,882
Water 1,064 1,230 1,189 1,298 1,104 1,261 1,233 1,072 757
Totals 10,090 11,737 12,511 12,218 11,228 11,033 10,597 9,840 6,561 *The 2010 data is based on data as of Oct. 8, 2010. It is included in this report because it provides the most current and comprehensive data as possible. PARs PARs primarily include contacts to the BCS or to utilities involving requests for payment terms in one of the following situations:
• Termination of service is pending; • Service has been terminated and the customer needs payment terms to have
service restored; and • The customer wants to retire an arrearage.
The table below represents the number of PARs to BCS from 2002-10. As with
residential customer complaints, the number of PARs to BCS has declined considerably since the passage of Chapter 14.
Table 30 – Payment Agreement Requests 2002 2003 2004 2005 2006 2007 2008 2009 2010*
Electric 41,735 50,015 45,758 29,636 25,048 28,173 38,661 34,948 30,315
Gas 29,612 36,435 40,378 24,059 18,271 16,112 16,537 14,777 9,845
Water 3,073 4,021 3,805 4,977 3,499 4,171 4,027 4,547 3,952
Totals 74,420 90,471 89,941 58,672 46,818 48,456 59,225 54,272 44,112 *The 2010 data is based on data as of Oct. 8, 2010. It is included in this report because it provides the most current and comprehensive data as possible.

51
Number of Non-Cap Customers Denied a Payment Agreement by the Commission Beginning in 2005, BCS started tracking the number of customers who called the Commission’s termination hotline seeking assistance to avoid termination, but were turned away because the customer was not eligible for assistance. Section 1405(d) of Chapter 14 prohibits the Commission from establishing a second payment agreement if the customer has defaulted on a previous payment agreement. The only permitted exception is if the customer has experienced a change in income since the previous agreement as defined in Section 1403 definitions: “A decrease in household income of 20 percent or more if the customer’s household income level exceeds 200 percent of the federal poverty level or a decrease in household income of 10 percent or more if the customer’s household income level is 200 percent or less of the federal poverty level.” The table below represents the number of customers turned away by the Commission because it was determined that the customer was not eligible for a payment agreement per the above mentioned section of Chapter 14. These customers are not participating in the utility’s CAP.
Table 31
Non-CAP Customers Turned Away by Call Center Because of Ineligibility
2005 2006 2007 2008 2009 2010* TOTAL
Service is on 23,326 6,812 6,888 5,597 6,679 11,547 60,849
Service is off 4,760 523 191 274 221 377 6,346
Totals 28,086 7,335 7,079 5,871 6,900 11,924 67,195 *The 2010 data is based on data as of Oct. 8, 2010. It is included in this report because it provides the most current and comprehensive data possible. In addition to the above noted restrictions, Section 1405(c) forbids the Commission from establishing a payment agreement for customers who participate in a utility’s CAP. The table below represents the number of customers turned away by the Commission because it was determined the customer was not eligible for a payment agreement because they were a participant in the utility’s CAP.
Table 32
CAP Customers Turned Away by Call Center Because of Ineligibility
2005 2006 2007 2008 2009 2010* TOTAL
CAP Customers 5,403 5,240 7,114 7,861 13,888 11,118 50,624 *The 2010 data is based on data as of Oct. 8, 2010. It is included in this report because it provides the most current and comprehensive data possible.

52
PARs Dismissed Without a Decision In addition to those already described as ineligible for a PUC payment agreement, occasions also exist where a PAR will be opened with the BCS but will be subsequently dismissed because the customer is not eligible for a new payment agreement. This is usually for the reasons previously discussed, namely the customer has previously defaulted on a payment agreement and is not eligible for a second.
The table below represents the number of customers that had their BCS case dismissed
because it was determined they were not eligible for a subsequent payment agreement.
Table 33
Payment Agreement Requests Dismissed Without a Decision
2005 2006 2007 2008 2009 2010* TOTAL
Cases Dismissed 14,225 7,328 6,005 6,411 5,969 4,571 44,509 *The 2010 data is based on data as of Oct. 8, 2010. It is included in this report because it provides the most current and comprehensive data possible. Customers Under a Protection From Abuse (PFA) Order Who Received a Payment Agreement from the PUC
Section 1417 of Chapter 14 specifies that the chapter “shall not apply to victims under a PFA Order as provided by 23 Pa. C.S. Ch. 61 (relating to protection from abuse).” In May 2005, the BCS modified its complaint tracking system to allow the tracking of complaints that involved customers with PFA orders. The table below represents the number of such complaints.
Table 34
Complaints From Customers With PFA Order
2005* 2006 2007 2008 2009 2010** TOTAL
Number of Complaints 2 21 14 10 5 0 52 *The Bureau of Consumer Services started tracking PFA cases in mid-2005. **The 2010 data is based on data as of Oct. 8, 2010. It is included in this report because it provides the most current and comprehensive data possible. Conclusion: Section IV – The Effect Upon the Level of Consumer Complaints and Mediations Filed with and Adjudicated by the Commission (Mediations are Currently Known as Payment Agreement Requests Under § 1415)
Chapter 14 has had an impact on the number of PARs. PARs decreased 40 percent from 2005-09 and have been well below the 2004 level in each year since then. The Commission opened 58,672 PAR cases in 2005, but dismissed 14,225 because of Chapter 14
53
restrictions. The total number of PARs decreased from 2004-06 and have leveled off at over 48,000 in both 2008 and 2009. The Commission turned away 20,788 callers in 2009 due to the restrictions on its ability to grant payment agreements. Since the passage of Chapter 14 through the end of 2009, the Commission has turned away 94,777 customers seeking PARs.
However, an annual average of about 6,000 of these cases have been dismissed
because in late 2005 the Commission revised its interpretation of Section 1405(d) to permit the issuance of at least one payment agreement for all customers, including those whose service was terminated. While the Commission continues to issue payment terms for customers whose service has been terminated, this authority is exercised judiciously and only in instances where the customer has made a good-faith effort to pay the bill.
In addition, informal consumer complaint volume has declined by 21 percent from
2004-09.

54
Appendices
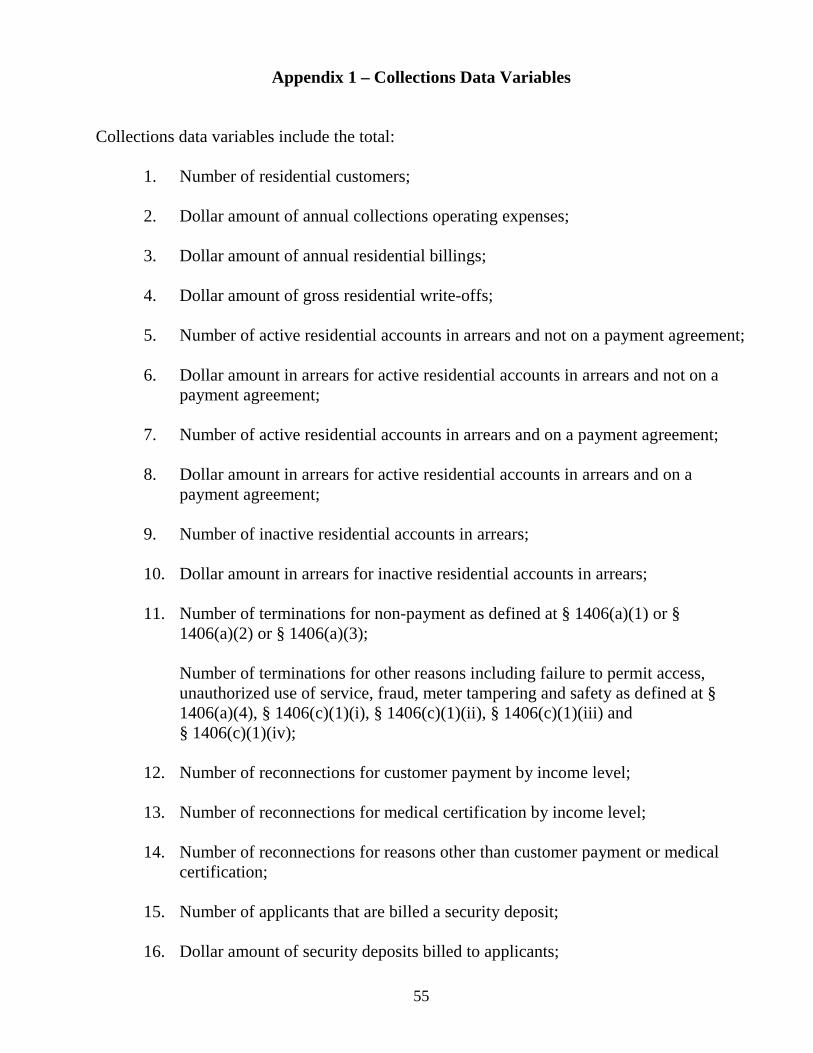
55
Appendix 1 – Collections Data Variables
Collections data variables include the total:
1. Number of residential customers; 2. Dollar amount of annual collections operating expenses; 3. Dollar amount of annual residential billings; 4. Dollar amount of gross residential write-offs; 5. Number of active residential accounts in arrears and not on a payment agreement; 6. Dollar amount in arrears for active residential accounts in arrears and not on a
payment agreement; 7. Number of active residential accounts in arrears and on a payment agreement; 8. Dollar amount in arrears for active residential accounts in arrears and on a
payment agreement; 9. Number of inactive residential accounts in arrears; 10. Dollar amount in arrears for inactive residential accounts in arrears; 11. Number of terminations for non-payment as defined at § 1406(a)(1) or §
1406(a)(2) or § 1406(a)(3);
Number of terminations for other reasons including failure to permit access, unauthorized use of service, fraud, meter tampering and safety as defined at § 1406(a)(4), § 1406(c)(1)(i), § 1406(c)(1)(ii), § 1406(c)(1)(iii) and § 1406(c)(1)(iv);
12. Number of reconnections for customer payment by income level; 13. Number of reconnections for medical certification by income level; 14. Number of reconnections for reasons other than customer payment or medical
certification; 15. Number of applicants that are billed a security deposit; 16. Dollar amount of security deposits billed to applicants;

56
17. Number of customers that are billed a security deposit; 18. Dollar amount of security deposits billed to customers; 19. Number of security deposits on-hand; 20. Dollar amount of security deposits on-hand; 21. Dollar amount of actual LIURP spending for the previous year; 22. Dollar amount of CAP administrative costs for the previous year; 23. Dollar amount of CAP credits for the previous year; 24. Dollar amount of CAP pre-program arrearage forgiveness for the previous year; 25. Dollar amount of Customer Assistance and Referral Evaluation Services
(CARES) program costs for the previous year; and 26. Dollar amount of hardship fund administrative costs assessed to ratepayers for the
year just completed.

57
The BCS has advocated that the bill due date is equal to day zero, the starting point for determining when an account should be considered overdue, and this position is clarified in the Collections Data Dictionary filed at the Docket M-00041802F0003. The table below shows the individual company variations for the historical data set presented in this report and applies to all tables that show overdue customers or overdue dollars.
Appendix 2 – When is an Account Considered to be Overdue?
Company When is Day Zero (0) How Many Days Overdue
Days of Variance from BCS Interpretation
Allegheny Bill Due Date 10 Days 20 Days Sooner
Duquesne Bill Due Date 30 Days 0 Days
Met-Ed and Penelec Bill Due Date 30 Days 0 Days
PECO-Electric Bill Transmittal Date 30 Days 20 Days Sooner
Penn Power Bill Due Date 30 Days 0 Days
PPL Bill Transmittal Date 60 Days 10 Days Later
Columbia Bill Due Date 30 Days 0 Days
Peoples Bill Transmittal Date 30 Days 20 Days Sooner
Equitable Bill Due Date 30 Days 0 Days
NFG Bill Rendition Date* 60 Days 9 Days Later
PECO-Gas Bill Transmittal Date 30 Days 20 Days Sooner
PGW Bill Transmittal Date 30 Days 20 Days Sooner
UGI-Gas Bill Due Date 30 Days 0 Days
UGI Penn Natural Bill Due Date 30 Days 0 Days
*Bill Rendition Date is one day prior to the Bill Transmittal Date.

58
After an account is terminated or discontinued, it is no longer considered to be an
active account. These accounts then become “inactive” accounts. Ultimately, these accounts are either paid or written-off according to each company’s accounting or write-off procedures. The Commission began to quantify the number of inactive accounts and corresponding arrearages beginning with 2007 collections data.
Appendix 3 – When Does an Account Move from Active to Inactive Status?
Company After an Account is Terminated After an Account is Discontinued
Allegheny 10 Days after Termination Date 0 to 1 Day after Final Bill Transmittal Date
Duquesne 7 Days after Termination Date 3 to 5 Days after Discontinuance
Met-Ed and Penelec 10 Days after Termination Date Same Day as Discontinuance
PECO-Electric 30 to 32 Days after Termination Date Same Day as Discontinuance
Penn Power 10 Days after Termination Date Same Day as Discontinuance
PPL 5 to 8 Days after Termination Date Bill Transmittal Date
Columbia 5 to 7 Days after Termination Date Same Day as Discontinuance
Peoples 10 Days after Termination Date 10 Days after Discontinuance
Equitable 3 Days after Termination Date 3 Days after Discontinuance
NFG Same Day as Termination Date Same Day as Discontinuance
PECO-Gas 30 to 32 Days after Termination Date Same Day as Discontinuance
PGW 0 to 30 Days after Termination Date 0 to 1 Day after Final Bill Transmittal Date
UGI-Gas Same Day as Termination Date Same Day as Discontinuance
UGI Penn Natural Same Day as Termination Date Same Day as Discontinuance
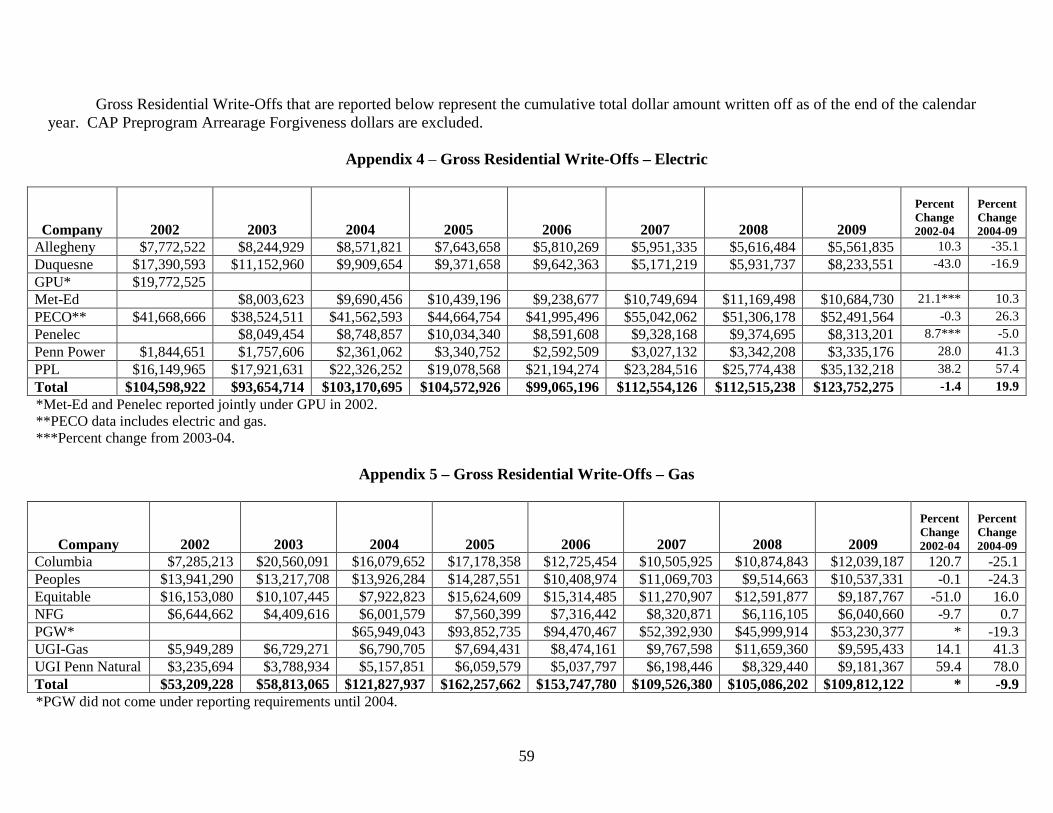
59
Gross Residential Write-Offs that are reported below represent the cumulative total dollar amount written off as of the end of the calendar year. CAP Preprogram Arrearage Forgiveness dollars are excluded.
Appendix 4 – Gross Residential Write-Offs – Electric
Company
2002
2003
2004
2005
2006
2007
2008
2009
Percent Change 2002-04
Percent Change 2004-09
Allegheny $7,772,522 $8,244,929 $8,571,821 $7,643,658 $5,810,269 $5,951,335 $5,616,484 $5,561,835 10.3 -35.1 Duquesne $17,390,593 $11,152,960 $9,909,654 $9,371,658 $9,642,363 $5,171,219 $5,931,737 $8,233,551 -43.0 -16.9 GPU* $19,772,525 Met-Ed $8,003,623 $9,690,456 $10,439,196 $9,238,677 $10,749,694 $11,169,498 $10,684,730 21.1*** 10.3 PECO** $41,668,666 $38,524,511 $41,562,593 $44,664,754 $41,995,496 $55,042,062 $51,306,178 $52,491,564 -0.3 26.3 Penelec $8,049,454 $8,748,857 $10,034,340 $8,591,608 $9,328,168 $9,374,695 $8,313,201 8.7*** -5.0 Penn Power $1,844,651 $1,757,606 $2,361,062 $3,340,752 $2,592,509 $3,027,132 $3,342,208 $3,335,176 28.0 41.3 PPL $16,149,965 $17,921,631 $22,326,252 $19,078,568 $21,194,274 $23,284,516 $25,774,438 $35,132,218 38.2 57.4 Total $104,598,922 $93,654,714 $103,170,695 $104,572,926 $99,065,196 $112,554,126 $112,515,238 $123,752,275 -1.4 19.9 *Met-Ed and Penelec reported jointly under GPU in 2002. **PECO data includes electric and gas. ***Percent change from 2003-04.
Appendix 5 – Gross Residential Write-Offs – Gas
Company
2002
2003
2004
2005
2006
2007
2008
2009
Percent Change 2002-04
Percent Change 2004-09
Columbia $7,285,213 $20,560,091 $16,079,652 $17,178,358 $12,725,454 $10,505,925 $10,874,843 $12,039,187 120.7 -25.1 Peoples $13,941,290 $13,217,708 $13,926,284 $14,287,551 $10,408,974 $11,069,703 $9,514,663 $10,537,331 -0.1 -24.3 Equitable $16,153,080 $10,107,445 $7,922,823 $15,624,609 $15,314,485 $11,270,907 $12,591,877 $9,187,767 -51.0 16.0 NFG $6,644,662 $4,409,616 $6,001,579 $7,560,399 $7,316,442 $8,320,871 $6,116,105 $6,040,660 -9.7 0.7 PGW* $65,949,043 $93,852,735 $94,470,467 $52,392,930 $45,999,914 $53,230,377 * -19.3 UGI-Gas $5,949,289 $6,729,271 $6,790,705 $7,694,431 $8,474,161 $9,767,598 $11,659,360 $9,595,433 14.1 41.3 UGI Penn Natural $3,235,694 $3,788,934 $5,157,851 $6,059,579 $5,037,797 $6,198,446 $8,329,440 $9,181,367 59.4 78.0 Total $53,209,228 $58,813,065 $121,827,937 $162,257,662 $153,747,780 $109,526,380 $105,086,202 $109,812,122 * -9.9 *PGW did not come under reporting requirements until 2004.

60
The number of customers in debt as reported below is a combination of customers in arrears who are on a payment agreement with customers in arrears who are not on a payment agreement. The Commission considers these customers to represent active accounts, i.e., accounts that have not been either discontinued or terminated (the service is still on).
Appendix 6 – Number of Customers in Debt – Active Accounts – Electric
Company
2002
2003
2004
2005
2006
2007
2008
2009
Percent Change 2002-04
Percent Change 2004-09
Allegheny 111,052 107,930 105,331 101,026 94,543 98,215 97,390 103,346 -5.2 -1.9 Duquesne 83,376 82,457 61,960 59,352 53,472 49,799 49,812 49,326 -25.7 -20.4 GPU* 194,607 Met-Ed 88,429 86,297 86,297 88,711 90,217 92,292 96,298 -2.4*** 11.6 PECO** 274,073 289,904 275,634 271,463 373,315 327,346 337,267 336,140 0.6 22.0 Penelec 103,684 100,221 98,282 100,071 99,151 97,151 98,246 -3.3*** -2.0 Penn Power 28,943 27,790 26,442 26,860 26,664 26,753 26,202 26,998 -8.6 2.1 PPL 177,723 187,639 185,375 183,113 204,206 206,966 208,037 212,255 4.3 14.5 Total 869,774 887,833 841,260 826,393 940,982 898,447 908,151 922,609 -3.3 9.7
*Met-Ed and Penelec reported combined under GPU in 2002. **PECO data includes electric and gas. ***Percent change from 2003-04.
Appendix 7 – Number of Customers in Debt – Active Accounts – Gas
Company
2002
2003
2004
2005
2006
2007
2008
2009
Percent Change 2002-04
Percent Change 2004-09
Columbia 36,396 45,201 50,485 51,296 47,845 47,274 49,365 42,606 38.7 -15.6 Peoples 58,298 54,866 58,319 57,610 50,692 47,658 46,357 41,708 0.0 -28.5 Equitable 40,177 38,756 64,152 37,415 33,057 32,007 29,445 28,398 59.7 -55.7 NFG 29,337 32,968 32,266 29,384 26,675 23,935 24,389 23,837 10.0 -26.1 PGW* 180,908 143,992 126,396 121,335 115,559 114,115 * -36.9 UGI-Gas 36,113 41,169 41,142 40,051 37,295 48,773 52,292 49,602 13.9 23.8 UGI Penn Natural 23,137 24,898 24,524 22,636 23,955 24,454 25,755 27,781 6.0 12.7 Total 223,458 237,858 451,796 382,384 345,915 345,436 343,162 328,047 * -27.4
*PGW did not come under reporting requirements until 2004.

61
The total amount of money in debt has an impact on a company’s expenses. The specific expense category is called Cash-Working-Capital and is part of a company’s distribution charge.
Appendix 8 – Dollars in Debt – Active Accounts – Electric
Company
2002
2003
2004
2005
2006
2007
2008
2009
Percent Change 2002-04
Percent Change 2004-09
Allegheny $16,994,925 $15,920,992 $15,613,294 $11,983,193 $10,145,305 $11,000,827 $11,292,516 $13,215,351 -8.1 -15.4 Duquesne $39,381,306 $34,393,745 $22,386,725 $18,362,776 $15,684,578 $15,647,727 $18,753,698 $19,688,979 -43.2 -12.1 GPU* $45,600,237 Met-Ed $24,886,732 $24,996,155 $23,598,693 $25,944,388 $28,116,879 $28,352,528 $30,141,424 0.4*** 20.6 PECO** $88,648,050 $98,388,139 $123,606,844 $95,551,200 $93,578,748 $141,578,061 $196,946,691 $174,966,336 39.4 41.6 Penelec $24,007,204 $24,821,329 $23,305,624 $24,512,581 $26,135,992 $24,843,496 $24,874,089 3.4*** 0.2 Penn Power $5,339,438 $6,791,695 $8,023,260 $8,319,766 $8,328,922 $9,221,929 $9,742,309 $10,319,699 50.3 28.6 PPL $48,804,828 $56,903,599 $57,647,458 $58,759,075 $76,242,112 $81,192,011 $86,117,707 $90,442,588 18.1 56.9 Total $244,768,784 $261,292,106 $277,095,065 $239,880,327 $254,436,634 $312,893,426 $376,048,945 $363,648,466 13.2 31.2 *Met-Ed and Penelec reported jointly under GPU in 2002. **PECO data includes electric and gas. ***Percent change from 2003-04.
Appendix 9 – Dollars in Debt – Active Accounts – Gas
Company
2002
2003
2004
2005
2006
2007
2008
2009
Percent Change 2002-04
Percent Change 2004-09
Columbia $10,573,365 $15,815,881 $15,990,488 $16,586,441 $17,495,368 $15,042,071 $17,009,255 $19,839,351 51.2 24.1 Peoples $39,827,219 $35,462,120 $42,105,099 $43,092,421 $49,198,137 $37,045,039 $34,394,910 $31,599,923 5.7 -24.9 Equitable $18,457,221 $15,908,667 $26,808,380 $15,911,998 $15,436,814 $12,663,147 $11,760,342 $12,335,719 45.2 -54.0 NFG $5,679,036 $7,831,978 $8,664,869 $7,999,265 $7,903,032 $6,410,084 $6,746,330 $7,176,682 52.6 -17.2 PGW* $104,917,102 $78,684,785 $68,349,548 $60,206,779 $60,523,636 $62,740,950 * -40.2 UGI-Gas $5,036,542 $7,764,599 $7,927,107 $8,868,469 $7,263,727 $11,596,233 $11,801,753 $10,968,226 57.4 38.4 UGI Penn Natural $5,040,940 $7,070,736 $6,952,897 $5,868,880 $8,115,685 $7,519,359 $8,588,592 $10,007,648 37.9 37.4 Total $84,614,323 $89,853,981 $213,365,942 $178,127,400 $173,762,311 $150,482,712 $150,824,818 $154,668,499 * -27.5 *PGW did not come under reporting requirements until 2004.

62
Average arrearage is calculated by dividing the total dollars in debt by the number of customers in debt. Larger average arrearages may take more time for customers to pay off and, as such, pose more of an uncollectible risk than smaller arrearages.
Appendix 10 – Average Arrearage – Active Accounts – Electric
Company
2002
2003
2004
2005
2006
2007
2008
2009
Percent Change 2002-04
Percent Change 2004-09
Allegheny $153.04 $147.51 $148.23 $118.61 $107.31 $112.01 $115.95 $127.87 -3.1 -13.7 Duquesne $472.33 $417.11 $361.31 $309.39 $293.32 $314.22 $376.49 $399.16 -23.5 10.5 GPU* $234.32 Met-Ed $281.43 $289.65 $273.46 $292.46 $311.66 $307.20 $313.00 2.9*** 8.1 PECO** $323.45 $339.38 $448.45 $351.99 $250.67 $432.50 $583.95 $520.52 38.6 16.1 Penelec $231.54 $247.67 $237.13 $244.95 $263.60 $255.72 $253.18 7.0*** 2.2 Penn Power $184.48 $244.39 $303.43 $309.75 $312.37 $344.71 $371.82 $382.24 64.5 26.0 PPL $274.61 $303.26 $310.98 $320.89 $373.36 $392.30 $413.95 $426.10 13.2 37.0 Total $281.42 $294.30 $329.38 $290.27 $270.39 $348.26 $414.08 $394.15 17.0 19.7
*Met-Ed and Penelec reported jointly under GPU in 2002. **PECO data includes electric and gas. ***Percent change from 2003-04.
Appendix 11 – Average Arrearage – Active Accounts – Gas
Company
2002
2003
2004
2005
2006
2007
2008
2009
Percent Change 2002-04
Percent Change 2004-09
Columbia $290.51 $349.90 $316.74 $323.35 $365.67 $318.19 $344.56 $465.65 9.0 47.0 Peoples $683.17 $646.34 $721.98 $748.00 $970.53 $777.31 $741.96 $757.65 5.7 4.9 Equitable $459.40 $410.48 $417.89 $425.28 $466.98 $395.64 $399.40 $434.39 -9.0 3.9 NFG $193.58 $237.56 $268.54 $272.23 $296.27 $267.81 $276.61 $301.07 38.7 12.1 PGW* $579.95 $546.45 $540.76 $496.20 $523.75 $549.80 * -5.2 UGI-Gas $139.47 $188.60 $192.68 $221.43 $194.76 $237.76 $225.69 $221.12 38.2 14.8 UGI Penn Natural $217.87 $283.99 $283.51 $259.57 $338.79 $307.49 $333.47 $360.23 30.1 21.9 Total $378.66 $377.76 $472.26 $462.92 $502.33 $435.63 $439.51 $471.48 * -0.2
*PGW did not come under reporting requirements until 2004.

63
Annual collections operating expenses include administrative expenses associated with termination activity, field visits, negotiation of payment agreements, budget counseling, investigation and resolution of informal and formal complaints associated with payment agreements, the securing and maintenance of security deposits, the tracking of delinquent accounts, collection agencies’ expenses, litigation expenses other than those already included, dunning expenses and winter survey expenses.
Appendix 12 – Annual Collections Operating Expenses – Electric
Company
2002
2003
2004
2005
2006
2007
2008
2009
Percent Change 2002-04
Percent Change 2004-09
Allegheny $14,287,272 $14,287,272 $14,313,568 $14,237,964 $13,488,737 $14,498,093 $13,140,612 $13,872,516 0.2 -3.1 Duquesne $28,100,000 $19,317,000 $16,164,612 $23,434,478 $16,221,301 $12,707,668 $16,384,435 $21,347,215 -42.5 32.1 GPU* $26,489,856 Met-Ed $11,147,927 $13,567,289 $13,226,480 $12,131,756 $14,428,576 $14,927,475 $13,874,375 21.7*** 2.3 PECO** $31,173,745 $28,579,370 $9,576,151 $6,699,373 $4,460,572 $7,130,283 $16,112,191 $15,056,392 -69.3 57.2 Penelec $12,158,796 $13,526,387 $13,302,200 $12,313,795 $13,385,070 $13,490,269 $11,592,885 11.2*** -14.3 Penn Power $2,529,787 $2,657,298 $3,619,639 $4,297,228 $3,606,710 $4,280,996 $4,804,770 $4,450,336 43.1 22.9 PPL $3,372,022 $4,340,787 $4,878,365 $7,932,252 $9,403,446 $9,947,961 $9,202,775 $9,455,645 44.7 93.8 Total $105,952,682 $92,488,450 $75,646,011 $83,129,975 $71,626,317 $76,378,647 $88,062,527 $89,649,364 -28.6 18.5
*Met-Ed and Penelec reported jointly under GPU in 2002. **PECO data includes electric and gas. ***Percent change from 2003-04.
Appendix 13 – Annual Collections Operating Expenses – Gas
Company
2002
2003
2004
2005
2006
2007
2008
2009
Percent Change 2002-04
Percent Change 2004-09
Columbia $1,523,315 $2,964,264 $2,463,992 $4,182,531 $3,535,836 $3,636,146 $3,597,442 $3,271,167 61.8 32.8 Peoples $1,963,339 $3,664,471 $3,224,084 $2,844,234 $2,430,649 $1,927,923 $1,125,826 $1,083,342 64.2 -66.4 Equitable $3,817,120 $4,220,428 $3,950,187 $4,438,459 $4,746,027 $3,739,605 $3,317,026 $2,999,286 3.5 -24.1 NFG Not Available $1,166,589 $1,154,535 $1,018,618 $961,454 $945,881 $910,088 $662,580 -1.0* -42.6 PGW** $10,102,014 $10,263,836 $9,629,280 $9,694,140 $9,821,543 $8,884,858 ** -12.0 UGI-Gas $3,108,658 $5,104,519 $3,349,562 $3,211,452 $3,061,646 $2,877,793 $3,035,334 $2,549,522 7.7 -23.9 UGI Penn Natural $1,967,380 $2,391,243 $2,403,614 $2,449,067 $2,673,634 $2,837,916 $3,094,913 $2,483,722 22.2 3.3 Total $12,379,812 $19,511,514 $26,647,988 $28,408,197 $27,038,526 $25,659,404 $24,902,172 $21,934,477 ** -17.7
*Percent change from 2003-04. **PGW did not come under reporting requirements until 2004.

64
Collections operating expenses as a percentage of billings is calculated by dividing the collections operating expenses by the annual residential billings. The higher the percentage the more a company is spending on collections operating expenses. Appendices 14 and 15 show the percentage for the year 2009, which is the most current data available.
Appendix 14 – 2009 Collections Operating Expenses as a Percentage of Residential Billings – Electric
Company
2009
Billings
2009 Collections Operating
Expenses
Collections Operating Expenses as a Percent of
Billings Allegheny $599,340,971 $13,872,516 2.3 Duquesne $466,507,432 $21,347,215 4.6 Met-Ed $626,478,569 $13,874,375 2.2 PECO* $2,366,957,059 $15,056,392 0.6 Penelec $472,113,272 $11,592,885 2.5 Penn Power $183,328,312 $4,450,336 2.4 PPL $1,487,538,825 $9,455,645 0.6 Total $6,202,264,440 $89,649,364 1.4
*PECO data includes electric and gas.
Appendix 15 – 2009 Collections Operating Expenses as a Percentage of Residential Billings – Gas
Company
2009
Billings
2009 Collections Operating
Expenses
Collections Operating Expenses as a Percent
of Billings Columbia $387,454,010 $3,271,167 0.8 Peoples $259,501,732 $1,083,342 0.4 Equitable $308,905,022 $2,999,286 1.0 NFG $259,746,550 $662,580 0.3 PGW $629,654,666 $8,884,858 1.4 UGI-Gas $311,515,001 $2,549,522 0.8 UGI Penn Natural $239,555,679 $2,483,722 1.0 Total $2,396,332,660 $21,934,477 0.9

65
The aggregate spending for Universal Service programs is shown in Appendices 16 and 17 for the year 2009 and that spending is also shown as a percentage of residential billings for 2009.
Appendix 16 – 2009 Universal Service Program Costs* as a Percentage of Residential Billings – Electric
Company
2009 Billings
2009
Universal Service Costs*
Universal Service Costs as a Percent of
Billings Allegheny $599,340,971 $9,252,313 1.5 Duquesne $466,507,432 $17,508,094 3.8 Met-Ed $626,478,569 $22,015,084 3.5 PECO** $2,366,957,059 $115,914,246 4.9 Penelec $472,113,272 $27,570,954 5.8 Penn Power $183,328,312 $9,725,640 5.3 PPL $1,487,538,825 $37,859,371 2.5 Total $6,202,264,440 $239,845,702 3.9
*Includes CAP, LIURP, and CARES. **PECO data includes electric and gas.
Appendix 17– 2009 Universal Service Program Costs* as a Percentage of Residential Billings – Gas
Company
2009 Billings
2009
Universal Service Costs*
Universal Service Costs as a Percent
of Billings Columbia $387,454,010 $31,551,847 8.1 Peoples $259,501,732 $11,046,754 4.3 Equitable $308,905,022 $30,380,400 9.8 NFG $259,746,550 $8,119,399 3.1 PGW $629,654,666 $108,636,123 17.3 UGI-Gas $311,515,001 $6,781,836 2.2 UGI Penn Natural $239,555,679 $4,450,767 1.9 Total $2,396,332,660 $200,967,126 8.4
*Includes CAP, LIURP, and CARES.

66
Customer Assistance Programs (CAPs) provide an alternative to traditional collections methods for low-income, payment troubled customers.
Customers make regular monthly payments, which may be for an amount that is less than the current bill for utility service.
Appendix 18 – Annual Total CAP Costs – Electric
Company
2002
2003
2004
2005
2006
2007
2008
2009
Percent Change 2002-04
Percent Change 2004-09
Allegheny $3,069,116 $5,070,059 $4,987,081 $6,948,175 $7,551281 $8,043,013 $7,680,209 $7,922,756 62.5 58.9 Duquesne $5,275,000 $6,135,000 $5,275,000 $7,517,421 $10,375,795 $11,508,948 $13,460,999 $14,977,956 0.0 183.9 GPU* $9,457,535 Met-Ed $4,897,055 $4,966,221 $5,167,977 $6,149,163 $8,087,480 $14,167,515 $19,321,710 1.4*** 289.1 PECO** $59,078,443 $77,799,717 $79,088,439 $66,373,108 $75,017,655 $93,096,247 $113,300,164 $106,871,181 33.9 35.1 Penelec $6,102,536 $6,914,194 $7,017,094 $8,494,452 $10,683,202 $19,470,323 $24,480,070 13.3*** 254.1 Penn Power $1,882,134 $1,982,273 $1,825,678 $1,743,141 $1,705,114 $2,461,202 $5,346,829 $8,964,942 -3.0 391.0 PPL $10,829,095 $12,851,819 $14,691,811 $16,223,414 $17,090,500 $20,919,308 $24,149,702 $28,929,342 35.7 96.9 Total $89,591,323 $114,838,459 $117,748,424 $110,990,330 $126,383,960 $154,754,400 $197,575,741 $211,467,957 31.4 79.6 *Met-Ed and Penelec reported jointly under GPU in 2002. **PECO data includes electric and gas. ***Percent change from 2003-04.
Appendix 19 – Annual Total CAP Costs – Gas
Company
2002
2003
2004
2005
2006
2007
2008
2009
Percent Change 2002-04
Percent Change 2004-09
Columbia $8,894,938 $21,869,084 $14,708,222 $22,941,685 $25,788,593 $23,214,621 $24,358,427 $28,084,379 65.4 90.9 Peoples $1,399,490 $3,363,454 $5,358,196 $5,754,505 $7,586,249 $22,767,942 $8,645,396 $10,266,754 282.9 91.6 Equitable $2,098,071 $3,829,239 $5,694,802 $9,301,115 $15,801,900 $11,496,437 $15,735,516 $29,451,600 171.4 417.2 NFG $2,137,966 $3,236,087 $4,613,226 $6,507,394 $9,074,207 $6,595,173 $8,118,056 $6,743,167 115.8 46.2 PGW* $57,800,000 $84,498,182 $105,440,734 $106,027,731 $102,525,112 $105,782,371 * 83.0 UGI-Gas $555,482 $926,753 $1,898,609 $1,858,522 $3,396,393 $4,335,537 $4,721,569 $5,051,419 241.8 166.1 UGI Penn Natural $271,454 $430,366 $590,454 $933,642 $1,322,719 $1,131,095 $1,989,428 $3,520,853 117.5 496.3 Total $15,357,401 $33,654,983 $90,663,509 $131,795,045 $165,703,174 $175,568,536 $166,093,504 $188,900,543 * 108.4 *PGW did not come under reporting requirements until 2004.

67
The LIURP is a statewide, utility-sponsored, residential usage reduction program mandated by PUC regulations at 52 Pa. Code, Chapter 58. The primary goal of LIURP is to assist low-income residential customers in lowering energy bills through usage reduction (energy conservation) and thereby making bills more affordable.
Appendix 20 – Annual Total LIURP Costs – Electric
Company
2002
2003
2004
2005
2006
2007
2008
2009
Percent Change 2002-04
Percent Change 2004-09
Allegheny $2,217,965 $1,782,036 $2,053,981 $1,835,729 $2,133,124 $2,125,938 $1,752,070 $1,278,715 -7.4 -37.7 Duquesne $2,365,834 $1,852,000 $1,021,250 $1,092,425 $1,090,935 $1,393,083 $1,230,237 $2,405,138 -56.8 135.5 GPU* $3,508,105 Met-Ed $1,596,863 $1,720,005 $1,891,795 $1,840,662 $1,908,308 $1,977,352 $2,693,374 7.7*** 56.6 PECO** $6,475,000 $6,475,000 $6,475,000 $6,474,315 $6,474,997 $6,475,000 $6,475,000 $7,825,001 0.0 20.8 Penelec $1,703,012 $1,657,765 $1,910,354 $1,927,764 $2,056,752 $2,518,570 $3,090,884 -2.7*** 86.4 Penn Power $599,649 $620,872 $527,439 $595,474 $628,726 $721,433 $836,908 $760,698 -12.0 44.2 PPL $5,406,590 $5,970,554 $5,642,380 $6,328,715 $7,488,846 $6,753,061 $7,719,029 $8,930,029 4.4 58.3 Total $20,573,143 $20,000,537 $19,087,820 $20,128,807 $21,585,054 $21,433,575 $22,509,166 $26,983,839 -7.2 41.4 *Met-Ed and Penelec reported jointly under GPU in 2002. **PECO data includes electric and gas. ***Percent change from 2003-04.
Appendix 21 – Annual Total LIURP Costs – Gas
Company
2002
2003
2004
2005
2006
2007
2008
2009
Percent Change 2002-04
Percent Change 2004-09
Columbia $1,376,403 $1,369,822 $1,399,634 $1,338,772 $1,364,003 $1,326,765 $1,127,535 $3,148,334 1.7 124.9 Peoples $610,856 $610,058 $610,000 $610,000 $609,941 $609,965 $609,968 $610,000 -0.1 0.0 Equitable $393,834 $610,054 $602,699 $637,110 $704,128 $644,006 $542,207 $548,056 53.0 -9.1 NFG $943,743 $1,289,497 $1,199,392 $1,191,073 $924,211 $1,272,306 $1,285,326 $1,364,323 27.1 13.8 PGW* $2,008,697 $2,123,108 $2,118,621 $1,691,250 $2,578,214 $2,046,452 * 1.9 UGI-Gas $460,280 $474,433 $648,025 $671,237 $659,649 $693,374 $989,233 $1,682,262 40.8 159.6 UGI Penn Natural $335,481 $409,247 $365,191 $334,466 $358,619 $393,014 $911,409 $917,614 8.9 151.3 Total $4,120,597 $4,763,111 $6,833,638 $6,905,766 $6,739,172 $6,630,680 $8,043,892 $10,317,041 * 51.0 *PGW did not come under reporting requirements until 2004.

68
The following two appendices show the three major collections cost categories and the Universal Service program costs for the year 2009. The corresponding residential billings are also shown as a basis for comparison against the four cost categories in the tables. Please note that only a fraction of the total dollars in debt is recovered in rates, perhaps up to 10 percent of the total dollars in debt.
Appendix 22 – Summary of 2009 Collections and Universal Service Program Costs* – Electric
Company
2009
Residential Billings
2009 Collections Operating Expenses
2009
Gross Write-Offs
2009
Total Dollars in Debt
2009 Universal
Service Programs*
Allegheny $599,340,971 $13,872,516 $5,561,835 $13,215,351 $9,252,313 Duquesne $466,507,432 $21,347,215 $8,233,551 $19,688,979 $17,508,094 Met-Ed $626,478,569 $13,874,375 $10,684,730 $30,141,424 $22,015,084 PECO** $2,366,957,059 $15,056,392 $52,491,564 $174,966,336 $115,914,246 Penelec $472,113,272 $11,592,885 $8,313,201 $24,874,089 $27,570,954 Penn Power $183,328,312 $4,450,336 $3,335,176 $10,319,699 $9,725,640 PPL $1,487,538,825 $9,455,645 $35,132,218 $90,442,588 $37,859,371 Total $6,202,264,440 $89,649,364 $123,752,275 $363,648,466 $239,845,702
*Includes CAP, LIURP, and CARES. ** PECO data includes electric and gas.
Appendix 23 – Summary of 2009 Collections and Universal Service Program Costs* – Gas
Company
2009
Residential Billings
2009 Collections Operating Expenses
2009
Gross Write-Offs
2009
Total Dollars in Debt
2009 Universal Service
Programs* Columbia $387,454,010 $3,271,167 $12,039,187 $19,839,351 $31,551,847 Peoples $259,501,732 $1,083,342 $10,537,331 $31,599,923 $11,046,754 Equitable $308,905,022 $2,999,286 $9,187,767 $12,335,719 $30,380,400 NFG $259,746,550 $662,580 $6,040,660 $7,176,682 $8,119,399 PGW $629,654,666 $8,884,858 $53,230,377 $62,740,950 $108,636,123 UGI-Gas $311,515,001 $2,549,522 $9,595,433 $10,968,226 $6,781,836 UGI Penn Natural $239,555,679 $2,483,722 $9,181,367 10,007,648 $4,450,767 Total $2,396,332,660 $21,934,477 $109,812,122 $154,668,499 $200,967,126
*Includes CAP, LIURP, and CARES.

69
For the purpose of showing individual company variations and differences in collections costs, collections operating expenses, gross write-offs and Universal Service program costs are added together and shown as a percentage of the residential billings.
Appendix 24 – 2009 Collections Costs* as a Percentage of Billings – Electric
Company
2009 Billings
2009 Collections Operating Expenses
2009
Gross Write-Offs
2009 Universal Service
Programs
2009 Total
Collections Costs*
Collections Costs* as a Percent of
Billings Allegheny $599,340,971 $13,872,516 $5,561,835 $9,252,313 $28,686,664 4.8 Duquesne $466,507,432 $21,347,215 $8,233,551 $17,508,094 $47,088,860 10.1 Met-Ed $626,478,569 $13,874,375 $10,684,730 $22,015,084 $46,574,189 7.4 PECO** $2,366,957,059 $15,056,392 $52,491,564 $115,914,246 $183,462,202 7.8 Penelec $472,113,272 $11,592,885 $8,313,201 $27,570,954 $47,477,040 10.1 Penn Power $183,328,312 $4,450,336 $3,335,176 $9,725,640 $17,511,152 9.6 PPL $1,487,538,825 $9,455,645 $35,132,218 $37,859,371 $82,447,234 5.5 Total $6,202,264,440 $89,649,364 $123,752,275 $239,845,702 $453,247,341 7.3
*Includes collections operating expenses, gross write-offs and Universal Service program costs. ** PECO data includes electric and gas.
Appendix 25 – 2009 Collections Costs* as a Percentage of Billings – Gas
Company
2009 Billings
2009 Collections Operating Expenses
2009
Gross Write-Offs
2009 Universal Service
Programs
2009 Total
Collections Costs*
Collections Costs* as a Percent of
Billings Columbia $387,454,010 $3,271,167 $12,039,187 $31,551,847 $46,862,201 12.1 Peoples $259,501,732 $1,083,342 $10,537,331 $11,046,754 $22,667,427 8.7 Equitable $308,905,022 $2,999,286 $9,187,767 $30,380,400 $42,567,453 13.8 NFG $259,746,550 $662,580 $6,040,660 $8,119,399 $14,822,639 5.7 PGW $629,654,666 $8,884,858 $53,230,377 $108,636,123 $170,751,358 27.1 UGI-Gas $311,515,001 $2,549,522 $9,595,433 $6,781,836 $18,926,791 6.1 UGI Penn Natural $239,555,679 $2,483,722 $9,181,367 $4,450,767 $16,115,856 6.7 Total $2,396,332,660 $21,934,477 $109,812,122 $200,967,126 $332,713,725 13.9
*Includes collections operating expenses, gross write-offs and Universal Service program costs.

70
Appendices 26 and 27 show the percentage of billings for collections operating expenses, gross residential write-offs and Universal Service Programs costs. These two tables, though similar to Appendices 28 and 29, differ in that they show the individual contributions to the overall collections costs for the three specific expenses, rather than showing the dollar amounts of each expense category.
Appendix 26 – 2009 Individual Expense Categories as a Percentage of Billings – Electric
Company 2009
Billings
2009 Collections Operating
Expenses as a Percent of Billings
2009 Gross Write-Offs
as a Percent of Billings
2009 Universal Service
Programs as a Percent of Billings
2009 Total
Collections Costs*
2009 Collections Costs*
as a Percent of Billings
Allegheny $599,340,971 2.3 0.9 1.5 $28,686,664 4.8 Duquesne $466,507,432 4.6 1.8 3.8 $47,088,860 10.1 Met-Ed $626,478,569 2.2 1.7 3.5 $46,574,189 7.4 PECO** $2,366,957,059 0.6 2.2 4.9 $183,462,202 7.8 Penelec $472,113,272 2.5 1.8 5.8 $47,477,040 10.1 Penn Power $183,328,312 2.4 1.8 5.3 $17,511,152 9.6 PPL $1,487,538,825 0.6 2.4 2.5 $82,447,234 5.5 Total $6,202,264,440 1.4 2.0 3.9 $453,247,341 7.3
*Includes collections operating expenses, gross write-offs and Universal Service program costs. **PECO data includes electric and gas.
Appendix 27 – 2009 Individual Expense Categories as a Percentage of Billings – Gas
Company 2009
Billings
2009 Collections Operating
Expenses as a Percent of Billings
2009 Gross Write-Offs
as a Percent of Billings
2009 Universal Service
Programs as a Percent of Billings
2009 Total
Collections Costs*
2009 Collections Costs*
as a Percent of Billings
Peoples $387,454,010 0.8 3.1 8.1 $46,862,201 12.1 Dominion $259,501,732 0.4 4.1 4.3 $22,667,427 8.7 Equitable $308,905,022 1.0 3.0 9.8 $42,567,453 13.8 NFG $259,746,550 0.3 2.3 3.1 $14,822,639 5.7 PGW $629,654,666 1.4 8.5 17.3 $170,751,358 27.1 UGI-Gas $311,515,001 0.8 3.1 2.2 $18,926,791 6.1 UGI Penn Natural $239,555,679 1.0 3.8 1.9 $16,115,856 6.7 Total $2,396,332,660 0.9 4.6 8.4 $332,713,725 13.9
*Includes collections operating expenses, gross write-offs and Universal Service program costs.

71
Customers are classified as either heating or non-heating. Heating and non-heating bills are shown for the beginning (2002) and end (2009) of the historical collections data period for this report. The size of customer bills is impacted by both company rates and customer usage levels. Appendices 28 and 29 also show the percent change in bills from 2002-09.
Appendix 28 – Monthly Average Bill: Heating vs. Non-Heating Accounts 2002-09 – Electric
Company
2002 Average Bill –
Heating Customers
2009 Average Bill –
Heating Customers
Percent Change 2002-09
2002 Average Bill – Non Heating Customers
2009 Average Bill – Non Heating Customers
Percent Change 2002-09
Allegheny $94.67 $128.57 35.8 $55.61 $75.55 35.9 Duquesne $95.33 $110.72 16.1 $51.45 $64.20 24.8 Met-Ed* $111.00 $150.00 35.1 $63.00 $96.00 52.4 PECO** $137.86 $118.93 -13.7 $110.87 $101.78 -8.2 Penelec* $111.00 $118.00 6.3 $63.00 $72.00 14.3 Penn Power $87.72 $173.00 97.2 $47.66 $99.00 107.7 PPL $110.42 $138.66 25.6 $61.08 $83.54 36.8
*In 2002 Met-Ed and Penelec were reported jointly under GPU and the 2002 data shown in this table was reported by GPU. This data does not reflect the actual bills for either Met-Ed or Penelec, but rather reflects a combination of the bills for these two companies. **PECO data includes electric and gas.
Appendix 29 - Monthly Average Bill: Heating vs. Non-Heating Accounts 2002-09 – Gas
Company
2002 Average Bill –
Heating Customers
2009 Average Bill –
Heating Customers
Percent Change 2002-09
2002 Average Bill – Non Heating Customers
2009 Average Bill – Non Heating Customers
Percent Change 2002-09
Columbia $62.39 $85.48 37.0 $21.93 $30.32 38.3 Peoples $68.25 $96.58 41.5 $22.32 $29.28 31.2 Equitable $86.88 $128.95 48.4 $27.12 $38.76 42.9 NFG $78.54 $110.81 41.1 $40.15 $59.21 47.5 PGW* * $116.87 * * $41.55 * UGI-Gas $72.89 $98.00 34.4 $21.90 $29.00 32.4 UGI Penn Natural $94.17 $141.80 50.6 $23.17 $38.64 66.8
*PGW did not come under reporting requirements until 2004.

72
Appendix 30 – Inactive Accounts
Company Number of
Inactive Accounts Dollars in Debt Average Debt Allegheny 1,762 $411,550 $234
Duquesne 7,745 $2,702,355 $349
Met-Ed 7,237 $2,666,371 $368
PECO* 16,983 $17,419,202 $1,026
Penelec 7,512 $2,001,507 $266
Penn Power 1,824 $830,024 $455
PPL 17,965 $11,311,471 $630
Electric – Total 61,028 $37,342,480 $612
Columbia 2,735 $1,775,270 $649
Peoples 45,673 $4,777,556 $105
Equitable 942 $484,738 $515
NFG 14,264 $7,707,884 $540
PGW 16,356 $26,074,321 $1,594
UGI-Gas 4,601 $2,273,044 $494
UGI Penn Natural 2,878 $2,306,678 $801
Gas – Total 87,449 $45,399,491 $519
*PECO data includes electric and gas.

73
Appendix 31 – Security Deposits on Hand
Company
Number of Security Deposits Dollars on Hand
Average Deposit on Hand
Allegheny 76,672 $14,488,285 $189
Duquesne 31,978 $4,151,783 $130
Met-Ed 57,928 $5,661,940 $98
PECO* 134,575 $16,064,035 $119
Penelec 49,976 $4,120,987 $82
Penn Power 14,249 $1,501,188 $105
PPL 28,235 $4,445,417 $157
Electric – Total 393,613 $50,433,635 $128
Columbia 8,153 $1,844,270 $226
Peoples 43,030 $5,876,834 $137
Equitable 7,461 $1,697,337 $227
NFG 424 $126,896 $299
PGW 24,883 $4,553,733 $183
UGI-Gas 18,888 $4,184,468 $222
UGI Penn Natural 11,942 $3,049,863 $255
Gas – Total 114,781 $21,333,401 $186
*PECO data includes electric and gas.
