pennsylvania statewide residential end-use and … statewide residential end-use and saturation...
TRANSCRIPT

Pennsylvania Statewide Residential End-Use and Saturation Study Submitted to: The Pennsylvania Public Utility Commission
Submitted by: GDS Associates, Inc In partnership with: Nexant, Inc. & Mondre Energy
2012

ii
Acknowledgements We would like to extend a special thanks to the staff of the seven electric distribution companies
highlighted in this report. Their cooperation and assistance in providing the necessary information to
compile this report was vital to this study’s success and is greatly appreciated. Specifically, we would like
to thank Dave Defide of Duquesne Light, Chris Siebens and Lisa Wolfe of First Energy, Pete Cleff and
Sunil Maheshwari of PPL, and Nick DeDominicis of PECO. Finally, we thank the Bureau of Technical
Utility Services (TUS) staff of the Pennsylvania Public Utility Commission for their guidance and
assistance in writing this report.
iii
CONTENTS
1 EXECUTIVE SUMMARY .................................................................................................................1
1.1 OVERVIEW ..................................................................................................................................................... 1 1.2 METHODOLOGY .............................................................................................................................................. 2 1.3 STATEWIDE RESULTS ........................................................................................................................................ 3
1.3.1 Basic Home Characteristics .............................................................................................................. 3 1.3.2 Building Shell .................................................................................................................................... 5 1.3.3 HVAC Equipment .............................................................................................................................. 6 1.3.4 Lighting ............................................................................................................................................ 8 1.3.5 Water Heating .................................................................................................................................. 9 1.3.6 Appliances and Other ..................................................................................................................... 10
1.4 EDC OVERVIEW ............................................................................................................................................ 12 1.4.1 Electric Fuel Share by End Use ........................................................................................................ 12 1.4.2 Lighting .......................................................................................................................................... 12 1.4.3 ENERGY STAR Saturation for Select Appliances by EDC ................................................................. 13
2 INTRODUCTION ......................................................................................................................... 14
2.1 OVERVIEW ................................................................................................................................................... 14 2.2 ACT 129 BACKGROUND .................................................................................................................................. 14 2.3 STUDY GOALS ............................................................................................................................................... 15 2.4 ORGANIZATION OF THE REPORT........................................................................................................................ 15
3 METHODOLOGY ......................................................................................................................... 16
3.1 STUDY PARAMETERS ...................................................................................................................................... 16 3.2 PRIMARY DATA COLLECTION ............................................................................................................................ 16
3.2.1 Sample Design ................................................................................................................................ 16 3.2.2 Recruitment .................................................................................................................................... 17 3.2.3 On-site Survey ................................................................................................................................ 18 3.2.4 End Uses ......................................................................................................................................... 18
3.3 EXTERNAL DATA COLLECTION ........................................................................................................................... 19 3.3.1 2010 PECO Baseline Study .............................................................................................................. 19 3.3.2 Data Sources .................................................................................................................................. 19
3.4 DATA ANALYSIS ............................................................................................................................................. 19 3.4.1 Data Cleaning ................................................................................................................................. 19 3.4.2 Weighting Factors .......................................................................................................................... 20 3.4.3 Penetration vs. Saturation ............................................................................................................. 22 3.4.4 Significance Testing ........................................................................................................................ 23
3.5 UNCERTAINTY ............................................................................................................................................... 23
4 STATEWIDE RESIDENTIAL FINDINGS ............................................................................................ 26
4.1 INTRODUCTION ............................................................................................................................................. 26 4.2 BASIC HOME CHARACTERISTICS ........................................................................................................................ 26
4.2.1 Usage ............................................................................................................................................. 26 4.2.2 Home Type ..................................................................................................................................... 27 4.2.3 Home Size ....................................................................................................................................... 28 4.2.4 Demographics ................................................................................................................................ 29
4.3 BUILDING SHELL ............................................................................................................................................ 29 4.3.1 Insulation........................................................................................................................................ 29
Contents
iv
4.3.2 Windows ........................................................................................................................................ 34 4.3.1 Roofs .............................................................................................................................................. 35 4.3.2 Air Sealing ...................................................................................................................................... 35 4.3.3 Duct Sealing ................................................................................................................................... 36
4.4 RESIDENTIAL HVAC ....................................................................................................................................... 37 4.4.1 Equipment Saturations by Fuel/Type – Heating ............................................................................. 37 4.4.2 Equipment Saturations by Type – Cooling ...................................................................................... 39 4.4.3 Efficiency Levels .............................................................................................................................. 41 4.4.4 Other .............................................................................................................................................. 42
4.5 LIGHTING ..................................................................................................................................................... 44 4.5.1 Sockets per Home ........................................................................................................................... 44 4.5.2 Bulb Type ........................................................................................................................................ 45 4.5.3 Lighting Saturations by Room ........................................................................................................ 47
4.6 DOMESTIC WATER HEATING ............................................................................................................................ 48 4.6.1 Equipment Saturations by Fuel/Type ............................................................................................. 48 4.6.2 Water Heater Energy Efficiency Levels ........................................................................................... 49 4.6.3 Other .............................................................................................................................................. 50
4.7 OTHER APPLIANCES ....................................................................................................................................... 51 4.7.1 Refrigerators/Freezers ................................................................................................................... 51 4.7.2 Clothes Washers/Dryers ................................................................................................................. 54 4.7.3 Dishwashers ................................................................................................................................... 56 4.7.4 Consumer Electronics ..................................................................................................................... 57 4.7.5 Other .............................................................................................................................................. 60
5 EDC SPECIFIC FINDINGS .............................................................................................................. 62
5.1 INTRODUCTION ............................................................................................................................................. 62 5.2 BASIC HOME CHARACTERISTICS ........................................................................................................................ 62
5.2.1 Usage ............................................................................................................................................. 62 5.2.2 Home Type ..................................................................................................................................... 62 5.2.3 Home Size ....................................................................................................................................... 63 5.2.4 Demographics ................................................................................................................................ 64
5.3 BUILDING SHELL ............................................................................................................................................ 65 5.3.1 Insulation........................................................................................................................................ 65 5.3.2 Windows ........................................................................................................................................ 70 5.3.1 Roofs .............................................................................................................................................. 70 5.3.2 Air Sealing ...................................................................................................................................... 71 5.3.3 Duct Sealing ................................................................................................................................... 71
5.4 RESIDENTIAL HVAC ....................................................................................................................................... 72 5.4.1 Equipment Saturations by Fuel/Type – Heating ............................................................................. 72 5.4.2 Equipment Saturations by Type – Cooling ...................................................................................... 74 5.4.3 Efficiency Levels .............................................................................................................................. 76 5.4.4 Other .............................................................................................................................................. 77
5.5 LIGHTING ..................................................................................................................................................... 79 5.5.1 Sockets per Home ........................................................................................................................... 79 5.5.2 Bulb Type ........................................................................................................................................ 79 5.5.3 Lighting Saturations by Room ........................................................................................................ 81
5.6 DOMESTIC WATER HEATING ............................................................................................................................ 82 5.6.1 Equipment Saturations by Fuel/Type ............................................................................................. 82 5.6.2 Efficiency Levels .............................................................................................................................. 83
Contents
v
5.6.3 Water Efficiency Measures ............................................................................................................. 84 5.7 OTHER APPLIANCES/EQUIPMENT...................................................................................................................... 84
5.7.1 Refrigerators/Freezers ................................................................................................................... 85 5.7.2 Clothes Washers/Dryers ................................................................................................................. 87 5.7.3 Dishwashers ................................................................................................................................... 89 5.7.4 Consumer Electronics ..................................................................................................................... 90 5.7.5 Other Equipment ............................................................................................................................ 93
6 CONCLUDING REMARKS ............................................................................................................. 95
APPENDIX A ON-SITE SURVEY INSTRUMENT ............................................................................... A-1
APPENDIX B RECRUITMENT LETTERS .......................................................................................... B-1
APPENDIX C PHONE RECRUITING SCRIPTS .................................................................................. C-1

Contents
vi
LIST OF FIGURES
FIGURE 1-1: STATEWIDE RESIDENCES BY HOUSING TYPE ............................................................................................. 3 FIGURE 1-2: AVERAGE SQUARE FEET OF CONDITIONED SPACE BY HOUSING TYPE ...................................................... 4 FIGURE 1-3: DISTRIBUTION OF AVERAGE MONTHLY KWH CONSUMPTION (BASED ON HISTORICAL BILLING DATA) .. 5 FIGURE 1-4: AVERAGE INSULATION R-VALUE BY LOCATION ......................................................................................... 5 FIGURE 1-5: AIR SEALING AND DUCT SEALING QUALITY ............................................................................................... 6 FIGURE 1-6: PRIMARY HEAT FUEL TYPE (ALL FUELS) ..................................................................................................... 7 FIGURE 1-7: PENETRATION AND SATURATION OF COOLING SYSTEMS ......................................................................... 8 FIGURE 1-8: PENETRATION AND SATURATION OF LIGHTING BY BULB TYPE ................................................................. 9 FIGURE 1-9: WATER HEATING FUEL TYPE ...................................................................................................................... 9 FIGURE 1-10: WATER HEATING EFFICIENCY MEASURES ............................................................................................. 10 FIGURE 1-11: ENERGY STAR APPLIANCES .................................................................................................................... 11 FIGURE 1-12: INTERIOR LIGHTING SOCKET SATURATION BY BULB TYPE .................................................................... 13 FIGURE 1-13: ENERGY STAR SATURATION OF SELECT APPLIANCES BY EDC ................................................................ 13 FIGURE 4-1: AVERAGE HOME SQUARE FOOTAGE (CONDITIONED SPACE) BY STATEWIDE WEIGHTS ......................... 28
LIST OF EQUATIONS
EQUATION 3-1: SAMPLE SIZE DETERMINATION .......................................................................................................... 23
LIST OF TABLES
TABLE 1-1: AVERAGE NUMBER OF WINDOWS, WINDOW AREA, AND GLAZING TYPE .................................................. 6 TABLE 1-2: PENETRATION AND SATURATION OF MAJOR APPLIANCES AND OTHER EQUIPMENT .............................. 10 TABLE 1-3: ELECTRIC FUEL SHARE BY END USE............................................................................................................ 12 TABLE 3-1: OVERALL SURVEY RECRUITMENT RESULTS ............................................................................................... 18 TABLE 3-2: SURVEY WEIGHTING FOR EDC LEVEL RESULTS .......................................................................................... 20 TABLE 3-3: EDC 2011 CUSTOMER COUNTS (INCLUDING PECO) .................................................................................. 21 TABLE 3-4: STATEWIDE WEIGHTS (INCLUDING PECO) ................................................................................................. 22 TABLE 3-5: EDC 2011 CUSTOMER COUNTS (EXCLUDING PECO) .................................................................................. 22 TABLE 3-6: STATEWIDE WEIGHTS (EXCLUDING PECO) ................................................................................................ 22 TABLE 4-1: AVERAGE MONTHLY ELECTRICITY USAGE BY STATEWIDE WEIGHTS ......................................................... 26 TABLE 4-2: HOME TYPE BY STATEWIDE WEIGHTS ....................................................................................................... 27 TABLE 4-3: AVERAGE AGE OF HOME BY STATEWIDE WEIGHTS .................................................................................. 27 TABLE 4-4: YEAR OF CONSTRUCTION BY STATEWIDE WEIGHTS ................................................................................. 27 TABLE 4-5: FOUNDATION TYPE BY STATEWIDE WEIGHTS ........................................................................................... 28 TABLE 4-6: OWN VS. RENT BY STATEWIDE WEIGHTS .................................................................................................. 29 TABLE 4-7: YEAR ROUND RESIDENCES BY STATEWIDE WEIGHTS ................................................................................ 29 TABLE 4-8: NUMBER OF YEAR ROUND OCCUPANTS BY STATEWIDE WEIGHTS........................................................... 29 TABLE 4-9: PRESENCE OF ATTIC INSULATION BY STATEWIDE WEIGHTS ..................................................................... 29 TABLE 4-10: TYPE OF ATTIC INSULATION BY STATEWIDE WEIGHTS ............................................................................ 30 TABLE 4-11: ATTIC INSULATION THICKNESS/R-VALUE BY STATEWIDE WEIGHTS ........................................................ 30 TABLE 4-12: PROPORTION OF ATTIC INSULATION R-VALUE BY STATEWIDE WEIGHTS ............................................... 30 TABLE 4-13: PRESENCE OF WALL INSULATION BY STATEWIDE WEIGHTS ................................................................... 31 TABLE 4-14: TYPE OF WALL INSULATION BY STATEWIDE WEIGHTS ............................................................................ 31 TABLE 4-15: WALL INSULATION THICKNESS/R-VALUE BY STATEWIDE WEIGHTS ........................................................ 31 TABLE 4-16: PROPORTION OF WALL INSULATION R-VALUE BY STATEWIDE WEIGHTS ............................................... 32 TABLE 4-17: PRESENCE OF BASEMENT WALL INSULATION BY STATEWIDE WEIGHTS ................................................ 32 TABLE 4-18: BASEMENT WALL INSULATION TYPE BY STATEWIDE WEIGHTS .............................................................. 32

Contents
vii
TABLE 4-19: BASEMENT WALL INSULATION THICKNESS/R-VALUE BY STATEWIDE WEIGHTS ..................................... 33 TABLE 4-20: PRESENCE OF FLOOR INSULATION BY STATEWIDE WEIGHTS ................................................................. 33 TABLE 4-21: FLOOR INSULATION TYPE BY STATEWIDE WEIGHTS ............................................................................... 33 TABLE 4-22: FLOOR INSULATION THICKNESS/R-VALUE BY STATEWIDE WEIGHTS ...................................................... 34 TABLE 4-23: PROPORTION OF FLOOR INSULATION R-VALUE BY STATEWIDE WEIGHTS ............................................. 34 TABLE 4-24: AVERAGE NUMBER OF WINDOWS PER HOUSEHOLD BY STATEWIDE WEIGHTS ..................................... 34 TABLE 4-25: AVERAGE AREA OF WINDOW GLAZING PER HOUSEHOLD BY STATEWIDE WEIGHTS ............................. 35 TABLE 4-26: WINDOW GLAZING TYPE BY STATEWIDE WEIGHTS ................................................................................ 35 TABLE 4-27: ROOF COLOR BY STATEWIDE WEIGHTS ................................................................................................... 35 TABLE 4-28: QUALITY OF AIR SEALING BY STATEWIDE WEIGHTS ................................................................................ 36 TABLE 4-29: DUCT LOCATION BY STATEWIDE WEIGHTS ............................................................................................. 36 TABLE 4-30: QUALITY OF DUCT SEALING BY STATEWIDE WEIGHTS ............................................................................ 37 TABLE 4-31: FUEL TYPE OF PRIMARY SPACE HEATING SYSTEMS BY STATEWIDE WEIGHTS ........................................ 37 TABLE 4-32: HOMES WITH BACK-UP HEATING SYSTEMS BY STATEWIDE WEIGHTS ................................................... 38 TABLE 4-33: FUEL TYPE OF SECONDARY SPACE HEATING SYSTEMS BY STATEWIDE WEIGHTS ................................... 38 TABLE 4-34: SYSTEM TYPE OF PRIMARY SPACE HEATING SYSTEMS BY STATEWIDE WEIGHTS ................................... 38 TABLE 4-35: SYSTEM TYPE OF PRIMARY ELECTRIC HEATING SYSTEMS BY STATEWIDE WEIGHTS .............................. 39 TABLE 4-36: SYSTEM TYPE OF SECONDARY SPACE HEATING SYSTEMS BY STATEWIDE WEIGHTS .............................. 39 TABLE 4-37: PENETRATION OF CENTRAL AC SYSTEMS BY STATEWIDE WEIGHTS ....................................................... 40 TABLE 4-38: SATURATION OF CENTRAL AC SYSTEMS BY STATEWIDE WEIGHTS ......................................................... 40 TABLE 4-39: CENTRAL AIR CONDITIONING SYSTEM TYPE BY STATEWIDE WEIGHTS ................................................... 40 TABLE 4-40: PENETRATION OF ROOM AIR CONDITIONERS BY STATEWIDE WEIGHTS ................................................ 40 TABLE 4-41: SATURATION OF ROOM AIR CONDITIONERS BY STATEWIDE WEIGHTS .................................................. 41 TABLE 4-42: CENTRAL AC SYSTEM SEER RATINGS BY STATEWIDE WEIGHTS .............................................................. 41 TABLE 4-43: ENERGY STAR ROOM AIR CONDITIONERS BY STATEWIDE WEIGHTS ...................................................... 42 TABLE 4-44: PROGRAMMABLE THERMOSTATS BY STATEWIDE WEIGHTS .................................................................. 42 TABLE 4-45: AVERAGE HEATING SYSTEM AGE BY STATEWIDE WEIGHTS .................................................................... 42 TABLE 4-46: TIME SINCE LAST SEASONAL TUNE-UP (HEATING SYSTEMS) BY STATEWIDE WEIGHTS .......................... 42 TABLE 4-47: HEATING SYSTEM TEMPERATURE SET POINTS BY STATEWIDE WEIGHTS ............................................... 43 TABLE 4-48: AVERAGE CENTRAL AC SYSTEM AGE BY STATEWIDE WEIGHTS .............................................................. 43 TABLE 4-49: CENTRAL AC SYSTEM AGE RANGE BY STATEWIDE WEIGHTS .................................................................. 43 TABLE 4-50: TIME SINCE LAST SEASONAL TUNE-UP (COOLING SYSTEMS) BY STATEWIDE WEIGHTS ......................... 44 TABLE 4-51: COOLING SYSTEM TEMPERATURE SET POINTS BY STATEWIDE WEIGHTS............................................... 44 TABLE 4-52: NUMBER OF INTERIOR SOCKETS PER HOME BY STATEWIDE WEIGHTS .................................................. 44 TABLE 4-53: ADJUSTED NUMBER OF INTERIOR SOCKETS PER HOME BY STATEWIDE WEIGHTS................................. 45 TABLE 4-54: EXTERIOR SOCKETS PER HOME BY STATEWIDE WEIGHTS ....................................................................... 45 TABLE 4-55: PENETRATION OF LIGHTING BY INTERIOR BULB TYPE BY STATEWIDE WEIGHTS .................................... 45 TABLE 4-56: SATURATION OF LIGHTING BY INTERIOR BULB TYPE BY STATEWIDE WEIGHTS...................................... 46 TABLE 4-57: CFL/LED SATURATIONS BASED ON ELIGIBLE SOCKETS BY STATEWIDE WEIGHTS ................................... 46 TABLE 4-58: SATURATION OF LIGHTING BY EXTERIOR BULB TYPE BY STATEWIDE WEIGHTS ..................................... 46 TABLE 4-59: AVERAGE WATTAGE BY BULB TYPE BY STATEWIDE WEIGHTS ................................................................ 47 TABLE 4-60: INTERIOR SOCKET SATURATION BY ROOM TYPE BY STATEWIDE WEIGHTS ............................................ 47 TABLE 4-61: WATER HEATING FUEL TYPE BY STATEWIDE WEIGHTS ........................................................................... 48 TABLE 4-62: ELECTRIC WATER HEATING SYSTEM TYPE BY STATEWIDE WEIGHTS ...................................................... 48 TABLE 4-63: WATER HEATER AGE BY EDC ................................................................................................................... 49 TABLE 4-64: WATER HEATER TANK TEMPERATURE BY EDC ........................................................................................ 49 TABLE 4-65: ELECTRIC WATER HEATER EFFICIENCY BY STATEWIDE WEIGHTS ............................................................ 49 TABLE 4-66: ELECTRIC WATER HEATER PIPE WRAP BY STATEWIDE WEIGHTS ............................................................ 50 TABLE 4-67: ELECTRIC WATER HEATER BLANKETS BY STATEWIDE WEIGHTS ............................................................. 50

Contents
viii
TABLE 4-68: SINKS AND FAUCET AERATORS BY STATEWIDE WEIGHTS ....................................................................... 50 TABLE 4-69: SHOWERS AND LOW FLOW SHOWERHEADS BY STATEWIDE WEIGHTS .................................................. 50 TABLE 4-70: NUMBER OF REFRIGERATORS BY STATEWIDE WEIGHTS ......................................................................... 51 TABLE 4-71: REFRIGERATOR TYPE BY STATEWIDE WEIGHTS ....................................................................................... 51 TABLE 4-72: AVERAGE REFRIGERATOR SIZE BY STATEWIDE WEIGHTS ........................................................................ 51 TABLE 4-73: AVERAGE PRIMARY REFRIGERATOR AGE BY STATEWIDE WEIGHTS........................................................ 52 TABLE 4-74: AVERAGE SECONDARY REFRIGERATOR AGE BY STATEWIDE WEIGHTS ................................................... 52 TABLE 4-75: ENERGY STAR PRIMARY REFRIGERATORS BY STATEWIDE WEIGHTS ....................................................... 52 TABLE 4-76: ENERGY STAR SECONDARY REFRIGERATORS BY STATEWIDE WEIGHTS .................................................. 52 TABLE 4-77: NUMBER OF STAND-ALONE FREEZERS BY STATEWIDE WEIGHTS ........................................................... 53 TABLE 4-78: STAND-ALONE FREEZER TYPE BY STATEWIDE WEIGHTS ......................................................................... 53 TABLE 4-79: STAND-ALONE FREEZER AGE BY EDC BY STATEWIDE WEIGHTS .............................................................. 53 TABLE 4-80: ENERGY STAR STAND-ALONE FREEZERS BY STATEWIDE WEIGHTS ......................................................... 53 TABLE 4-81: NUMBER OF CLOTHES WASHERS BY STATEWIDE WEIGHTS ................................................................... 54 TABLE 4-82: TOP-LOADING VS. FRONT-LOADING CLOTHES WASHERS BY STATEWIDE WEIGHTS .............................. 54 TABLE 4-83: CLOTHES WASHER/WATER HEATING FUEL TYPE BY STATEWIDE WEIGHTS ............................................ 54 TABLE 4-84: CLOTHES WASHER AGE BY STATEWIDE WEIGHTS ................................................................................... 55 TABLE 4-85: CLOTHES WASHER LOADS PER WEEK BY STATEWIDE WEIGHTS ............................................................. 55 TABLE 4-86: ENERGY STAR CLOTHES WASHERS BY STATEWIDE WEIGHTS ................................................................. 55 TABLE 4-87: DRYER FUEL TYPE BY STATEWIDE WEIGHTS ............................................................................................ 55 TABLE 4-88: DISHWASHER SATURATION BY STATEWIDE WEIGHTS ............................................................................ 56 TABLE 4-89: DISHWASHER/WATER HEATING TYPE BY STATEWIDE WEIGHTS ............................................................ 56 TABLE 4-90: DISHWASHER AGE BY STATEWIDE WEIGHTS .......................................................................................... 56 TABLE 4-91: ENERGY STAR DISHWASHERS BY STATEWIDE WEIGHTS ......................................................................... 57 TABLE 4-92: PENETRATION/SATURATION OF TELEVISIONS BY STATEWIDE WEIGHTS ................................................ 57 TABLE 4-93: SCREEN SIZE OF TELEVISIONS BY STATEWIDE WEIGHTS ......................................................................... 57 TABLE 4-94: TYPE OF TELEVISION (GREATER THAN 36") BY STATEWIDE WEIGHTS .................................................... 57 TABLE 4-95: TYPE OF TELEVISION (LESS THAN 36") BY STATEWIDE WEIGHTS ............................................................ 57 TABLE 4-96: PENETRATION/SATURATION OF PCS BY STATEWIDE WEIGHTS .............................................................. 58 TABLE 4-97: PENETRATION/SATURATION (DESKTOP ONLY) BY STATEWIDE WEIGHTS............................................... 58 TABLE 4-98: PENETRATION/SATURATION (LAPTOP ONLY) BY STATEWIDE WEIGHTS ................................................. 58 TABLE 4-99: PC MONITOR TYPE BY EDC ...................................................................................................................... 58 TABLE 4-100: PENETRATION/SATURATION OF TABLET PCS BY STATEWIDE WEIGHTS ............................................... 59 TABLE 4-101: PENETRATION/SATURATION OF MISCELLANEOUS ELECTRONICS BY STATEWIDE WEIGHTS ................ 59 TABLE 4-102: HUMIDIFIER/DEHUMIDIFIERS SATURATION BY STATEWIDE WEIGHTS ................................................. 60 TABLE 4-103: HUMIDIFIER/DEHUMIDIFIER USE (MONTHS/YEAR) BY EDC .................................................................. 60 TABLE 4-104: PENETRATION/SATURATION OF CEILING FANS BY EDC ........................................................................ 60 TABLE 4-105: CEILING FAN HOURS OF USE BY EDC ..................................................................................................... 61 TABLE 4-106: POOL/SPA SATURATION BY EDC ............................................................................................................ 61 TABLE 5-1: AVERAGE MONTHLY ELECTRICITY USAGE ................................................................................................. 62 TABLE 5-2: HOME TYPE BY EDC ................................................................................................................................... 63 TABLE 5-3: AVERAGE AGE OF HOME BY EDC ............................................................................................................... 63 TABLE 5-4: YEAR OF CONSTRUCTION BY EDC .............................................................................................................. 63 TABLE 5-5: AVERAGE HOME SQUARE FOOTAGE (CONDITIONED SPACE) BY EDC ....................................................... 63 TABLE 5-6: FOUNDATION TYPE BY EDC ....................................................................................................................... 64 TABLE 5-7: OWN VS. RENT BY EDC .............................................................................................................................. 64 TABLE 5-8: YEAR ROUND RESIDENCES BY EDC ............................................................................................................ 64 TABLE 5-9: NUMBER OF YEAR ROUND OCCUPANTS BY EDC ....................................................................................... 65 TABLE 5-10: PRESENCE OF ATTIC INSULATION BY EDC................................................................................................ 65
Contents
ix
TABLE 5-11: TYPE OF ATTIC INSULATION BY EDC ........................................................................................................ 65 TABLE 5-12: ATTIC INSULATION THICKNESS/R-VALUE BY EDC .................................................................................... 66 TABLE 5-13: PROPORTION OF ATTIC INSULATION R-VALUE BY EDC ........................................................................... 66 TABLE 5-14: PRESENCE OF WALL INSULATION BY EDC ................................................................................................ 66 TABLE 5-15: TYPE OF WALL INSULATION BY EDC ........................................................................................................ 67 TABLE 5-16: WALL INSULATION THICKNESS/R-VALUE BY EDC .................................................................................... 67 TABLE 5-17: PROPORTION OF WALL INSULATION R-VALUE BY EDC ........................................................................... 67 TABLE 5-18: PRESENCE OF BASEMENT WALL INSULATION BY EDC ............................................................................. 67 TABLE 5-19: BASEMENT WALL INSULATION TYPE BY EDC ........................................................................................... 68 TABLE 5-20: BASEMENT WALL INSULATION THICKNESS/R-VALUE BY EDC ................................................................. 68 TABLE 5-21: PRESENCE OF FLOOR INSULATION BY EDC .............................................................................................. 68 TABLE 5-22: FLOOR INSULATION TYPE BY EDC ............................................................................................................ 69 TABLE 5-23: FLOOR INSULATION THICKNESS/R-VALUE BY EDC .................................................................................. 69 TABLE 5-24: PROPORTION OF FLOOR INSULATION R-VALUE BY EDC .......................................................................... 69 TABLE 5-25: AVERAGE NUMBER OF WINDOWS PER HOUSEHOLD BY EDC ................................................................. 70 TABLE 5-26: AVERAGE AREA OF WINDOW AREA PER HOUSEHOLD BY EDC ............................................................... 70 TABLE 5-27: WINDOW GLAZING TYPE BY EDC ............................................................................................................. 70 TABLE 5-28: ROOF COLOR BY EDC ............................................................................................................................... 71 TABLE 5-29: QUALITY OF AIR SEALING BY EDC ............................................................................................................ 71 TABLE 5-30: DUCT LOCATION BY EDC .......................................................................................................................... 71 TABLE 5-31: QUALITY OF DUCT SEALING BY EDC ........................................................................................................ 72 TABLE 5-32: FUEL TYPE OF PRIMARY SPACE HEATING SYSTEMS BY EDC .................................................................... 72 TABLE 5-33: HOMES WITH BACK-UP HEATING SYSTEMS BY EDC ................................................................................ 73 TABLE 5-34: FUEL TYPE OF SECONDARY SPACE HEATING SYSTEMS BY EDC ............................................................... 73 TABLE 5-35: SYSTEM TYPE OF PRIMARY SPACE HEATING SYSTEMS BY EDC ............................................................... 73 TABLE 5-36: SYSTEM TYPE OF PRIMARY ELECTRIC HEATING SYSTEMS BY EDC ........................................................... 73 TABLE 5-37: SYSTEM TYPE OF SECONDARY SPACE HEATING SYSTEMS BY EDC .......................................................... 74 TABLE 5-38: PENETRATION OF CENTRAL AC SYSTEMS BY EDC .................................................................................... 74 TABLE 5-39: SATURATION OF CENTRAL AC SYSTEMS BY EDC...................................................................................... 75 TABLE 5-40: CENTRAL AIR CONDITIONING SYSTEM TYPE BY EDC ............................................................................... 75 TABLE 5-41: PENETRATION OF ROOM AIR CONDITIONERS BY EDC ............................................................................ 75 TABLE 5-42: SATURATION OF ROOM AIR CONDITIONERS BY EDC .............................................................................. 75 TABLE 5-43: CENTRAL AC SYSTEM SEER RATINGS BY EDC ........................................................................................... 76 TABLE 5-44: ENERGY STAR ROOM AIR CONDITIONERS BY EDC ................................................................................... 76 TABLE 5-45: PROGRAMMABLE THERMOSTATS BY EDC ............................................................................................... 77 TABLE 5-46: AVERAGE HEATING SYSTEM AGE BY EDC ................................................................................................ 77 TABLE 5-47: TIME SINCE LAST SEASONAL TUNE-UP (HEATING SYSTEMS) BY EDC ...................................................... 77 TABLE 5-48: HEATING SYSTEM TEMPERATURE SET POINTS BY EDC ........................................................................... 77 TABLE 5-49: AVERAGE CENTRAL AC SYSTEM AGE BY EDC ........................................................................................... 78 TABLE 5-50: CENTRAL AC SYSTEM AGE RANGE BY EDC ............................................................................................... 78 TABLE 5-51: TIME SINCE LAST SEASONAL TUNE-UP (COOLING SYSTEMS) BY EDC ...................................................... 78 TABLE 5-52: COOLING SYSTEM TEMPERATURE SET POINTS BY EDC ........................................................................... 78 TABLE 5-53: NUMBER OF INTERIOR SOCKETS PER HOME BY EDC............................................................................... 79 TABLE 5-54: ADJUSTED NUMBER OF INTERIOR SOCKETS PER HOME BY EDC ............................................................. 79 TABLE 5-55: EXTERIOR SOCKETS PER HOME BY EDC ................................................................................................... 79 TABLE 5-56: PENETRATION OF LIGHTING BY INTERIOR BULB TYPE BY EDC ................................................................ 80 TABLE 5-57: SATURATION OF LIGHTING BY INTERIOR BULB TYPE BY EDC .................................................................. 80 TABLE 5-58: CFL/LED SATURATIONS BASED ON ELIGIBLE SOCKETS BY EDC ................................................................ 80 TABLE 5-59: SATURATION OF LIGHTING BY EXTERIOR BULB TYPE BY EDC.................................................................. 81

Contents
x
TABLE 5-60: AVERAGE WATTAGE BY BULB TYPE BY EDC ............................................................................................. 81 TABLE 5-61: INTERIOR SOCKET SATURATION BY ROOM TYPE BY EDC ........................................................................ 81 TABLE 5-62: WATER HEATING FUEL TYPE BY EDC ....................................................................................................... 82 TABLE 5-63: ELECTRIC WATER SYSTEM TYPE BY EDC .................................................................................................. 82 TABLE 5-64: ELECTRIC WATER HEATER AGE BY EDC .................................................................................................... 83 TABLE 5-65: ELECTRIC WATER HEATER TANK TEMPERATURE BY EDC ........................................................................ 83 TABLE 5-66: ELECTRIC WATER HEATER EFFICIENCY BY EDC ........................................................................................ 83 TABLE 5-67: WATER HEATER PIPE WRAP BY EDC ........................................................................................................ 83 TABLE 5-68: WATER HEATER BLANKETS BY EDC .......................................................................................................... 84 TABLE 5-69: SINKS AND FAUCET AERATORS BY EDC ................................................................................................... 84 TABLE 5-70: SHOWERS AND LOW FLOW SHOWERHEADS BY EDC .............................................................................. 84 TABLE 5-71: NUMBER OF REFRIGERATORS BY EDC ..................................................................................................... 85 TABLE 5-72: REFRIGERATOR TYPE BY EDC ................................................................................................................... 85 TABLE 5-73: AVERAGE REFRIGERATOR VOLUME BY EDC ............................................................................................ 85 TABLE 5-74: AVERAGE PRIMARY REFRIGERATOR AGE BY EDC .................................................................................... 85 TABLE 5-75: AVERAGE SECONDARY REFRIGERATOR AGE BY EDC ............................................................................... 86 TABLE 5-76: ENERGY STAR PRIMARY REFRIGERATORS BY EDC ................................................................................... 86 TABLE 5-77: ENERGY STAR SECONDARY REFRIGERATORS BY EDC .............................................................................. 86 TABLE 5-78: NUMBER OF STAND-ALONE FREEZERS BY EDC ........................................................................................ 86 TABLE 5-79: STAND-ALONE FREEZER TYPE BY EDC ...................................................................................................... 87 TABLE 5-80: STAND-ALONE FREEZER AGE BY EDC ....................................................................................................... 87 TABLE 5-81: ENERGY STAR STAND-ALONE FREEZERS BY EDC...................................................................................... 87 TABLE 5-82: NUMBER OF CLOTHES WASHERS BY EDC ................................................................................................ 87 TABLE 5-83: TOP-LOADING VS. FRONT-LOADING CLOTHES WASHERS BY EDC ........................................................... 87 TABLE 5-84: CLOTHES WASHER/WATER HEATING FUEL TYPE BY EDC ........................................................................ 88 TABLE 5-85: CLOTHES WASHER AGE BY EDC ............................................................................................................... 88 TABLE 5-86: CLOTHES WASHER LOADS PER WEEK BY EDC .......................................................................................... 88 TABLE 5-87: ENERGY STAR CLOTHES WASHERS BY EDC .............................................................................................. 89 TABLE 5-88: DRYER FUEL TYPE BY EDC ........................................................................................................................ 89 TABLE 5-89: DISHWASHER SATURATION BY EDC ........................................................................................................ 89 TABLE 5-90: DISHWASHER/WATER HEATING TYPE BY EDC ......................................................................................... 89 TABLE 5-91: DISHWASHER AGE BY EDC ....................................................................................................................... 90 TABLE 5-92: ENERGY STAR DISHWASHERS BY EDC ...................................................................................................... 90 TABLE 5-93: PENETRATION/SATURATION OF TELEVISIONS BY EDC ............................................................................ 90 TABLE 5-94: SCREEN SIZE OF TELEVISIONS BY EDC ...................................................................................................... 90 TABLE 5-95: TYPE OF TELEVISION (GREATER THAN 36”) BY EDC ................................................................................. 90 TABLE 5-96: TYPE OF TELEVISION (LESS THAN 36”) BY EDC ........................................................................................ 91 TABLE 5-97: PENETRATION/SATURATION OF PCS BY EDC ........................................................................................... 91 TABLE 5-98: PENETRATION/SATURATION (DESKTOP ONLY) BY EDC ........................................................................... 91 TABLE 5-99: PENETRATION/SATURATION (LAPTOP ONLY) BY EDC ............................................................................. 91 TABLE 5-100: PC MONITOR TYPE BY EDC .................................................................................................................... 91 TABLE 5-101: PENETRATION/SATURATION OF TABLET PCS BY EDC ............................................................................ 92 TABLE 5-102: PENETRATION/SATURATION OF MISCELLANEOUS ELECTRONICS BY EDC ............................................ 92 TABLE 5-103: HUMIDIFIER/DEHUMIDIFIERS SATURATION BY EDC ............................................................................. 93 TABLE 5-104: HUMIDIFIER/DEHUMIDIFIER USE (MONTHS/YEAR) BY EDC .................................................................. 93 TABLE 5-105: PENETRATION/SATURATION OF CEILING FANS BY EDC ........................................................................ 93 TABLE 5-106: CEILING FAN HOURS OF USE BY EDC ..................................................................................................... 93 TABLE 5-107: POOL/SPA SATURATION BY EDC ............................................................................................................ 94

SECTION 1 Executive Summary
1
1 EXECUTIVE SUMMARY
1.1 OVERVIEW
This report presents the results of a residential energy efficiency baseline study for the service areas of seven investor-owned electric utilities in Pennsylvania. GDS Associates (GDS), Nexant, Inc. (Nexant) and Mondre Energy – collectively known as the Statewide Evaluation (SWE) Team – were contracted by the Pennsylvania Public Utility Commission (PUC) to perform an energy efficiency potential assessment for the State of Pennsylvania and its seven largest electric distribution companies (EDCs). The EDCs included as part of this study are below:
Duquesne Light Company (DLC) Metropolitan Edison Company (MetEd) Pennsylvania Electric Company (Penelec) Pennsylvania Power Company (Penn Power) West Penn Power Company (WPP) PPL Electric Utilities (PPL) PECO Energy Company1
The first step in the energy efficiency potential assessment process is to establish baseline energy characteristics for the residential, commercial and industrial sectors. This report documents the findings of that end use and saturation study in the residential sector2, and serves to provide baseline energy equipment saturations as well as electric equipment efficiency levels for the subsequent residential electric energy efficiency potential assessment. This study evaluates the characteristics of the energy using equipment and efficient electric equipment stock present in the residential sector of Pennsylvania for the seven EDC service territories. GDS used its experience working with the Pennsylvania EDCs (as part of the SWE Team evaluating their current energy efficiency programs) and performing previous energy efficiency potential studies to help identify the critical data collection needs from the on-site surveys that will be integral to future resource planning and energy efficiency activities in Pennsylvania. The results found within this residential baseline study rely solely upon primary research conducted in the form of onsite customer surveys. A review of available secondary sources, such as US Census data and manufacturer product data, was also performed in an effort to clarify and compliment primary research efforts in addition to filling in gaps – either in the presence or quality of data.
1 The SWE Team did not collect primary data as part of its onsite survey for PECO, but rather relied on data
collected during Spring 2010 and published as part of the 2011 Baseline Report for PECO published by Navigant
Consulting prepared February 7, 2011. 2 A companion report, issued by Nexant, will detail the findings in the commercial and industrial sectors.
SECTION 1 Executive Summary
2
1.2 METHODOLOGY
The SWE Team performed on-site surveys during Fall 2011 to collect detailed and accurate inventories of residential appliance, equipment, and housing characteristics for residential consumers throughout the state of Pennsylvania. This study captured a variety of energy-related data, including the penetration of electric- and non-electric equipment and appliances, energy efficiency levels of electric equipment and appliances, building shell characteristics, lighting socket counts, and other relevant information.
A total of 488 site surveys (including data from the 2011 PECO Baseline Study) stratified by EDC, housing segment, and annual kWh consumption were conducted. The desired level of precision for EDC specific results, ±10% precision, with 90% confidence, necessitated a total of 70 on-site visits per EDC. The data for all EDC’s were then aggregated to the statewide level, and these estimates carry precision of ±5% precision, with 95% confidence. The sample size was not large enough, nor was it intended, to provide housing segment specific results within each EDC.3 The survey estimates presented in this report are subject to a certain degree of uncertainty. Practical constraints make it impossible for the SWE team to conduct an on-site survey of the entire population of Pennsylvania residences, necessitating the selection of a small sample population from which to collect data. When using a sample to estimate a population metric, factors of uncertainty are introduced, primarily based on the size of the sample and the existence of biases within the sample. The uncertainty can be described by the confidence level and margin of error. As noted above, the targeted confidence level and margin of error in this study was set at 95% and 5%, respectively, for the state-wide residential sector. This means that if this study were repeated multiple times, 95% of the studies would produce estimates to within ±5% of the true population value. Given the different characteristics between single family (SF), multifamily, and manufactured homes, the SWE team developed case weights to control for sample bias when presenting results by EDC.4 Further, in an effort to provide a more inclusive study and to provide estimates for each of the EDC territories, a sample of 70 residential sites was selected for each EDC irrespective of the size of the EDC. Thus, when aggregating the EDCs estimates to the statewide level, it was necessary to create a second set of case weights to control for differences in the number of residential accounts across the seven EDCs. This approach provides more weight to the data for larger EDCs when compared to smaller EDCs in the statewide findings.
3 At the statewide level, there were a significant number of observations to make statistically valid conclusions in
excess of ±10% precision, with 90% confidence for single family-detached housing. For single family-attached and
multifamily housing segments, however there were only enough observations to make assumptions at ±15%
precision, with 90% confidence, and the number of manufactured housing observations was significantly small
enough that the SWE team does not recommend using for statistically reasonable conclusions. 4 EDC case weights also controlled for sample bias related to the age of the head of household. The on-site sample
had a higher proportion of older homeowners than the general population (according to 2010 US Census data).
Additional discussion of the case weights can be found in section 3.4.2
SECTION 1 Executive Summary
3
1.3 STATEWIDE RESULTS
Statewide level findings include data collected from both the 420 on-site surveys conducted by the SWE team throughout six EDCs and, when possible, data from 68 on-site surveys conducted by Navigant for the 2011 PECO Residential Baseline Study. The data presented below represents statewide results for all housing types combined. More detailed data, including a breakdown by housing type is included in section 4 (Statewide Residential Findings) of this report. This report frequently sites two metrics: penetration and saturation. It is important to understand how each is defined in this study. Penetration is the proportion of households that have one or more of a particular appliance (or other piece of equipment). It is calculated by dividing the number of customers with one or more of an appliance (or other piece of equipment) by the total number of surveys with responses to that question. Alternatively, saturation represents how many of a particular appliance/equipment exists among all customers. It is calculated by dividing the total number of a particular appliance/equipment by the total number of surveys with responses to that question. This percentage is typically higher than the corresponding penetration because some households will have more than one of the appliance.
1.3.1 Basic Home Characteristics
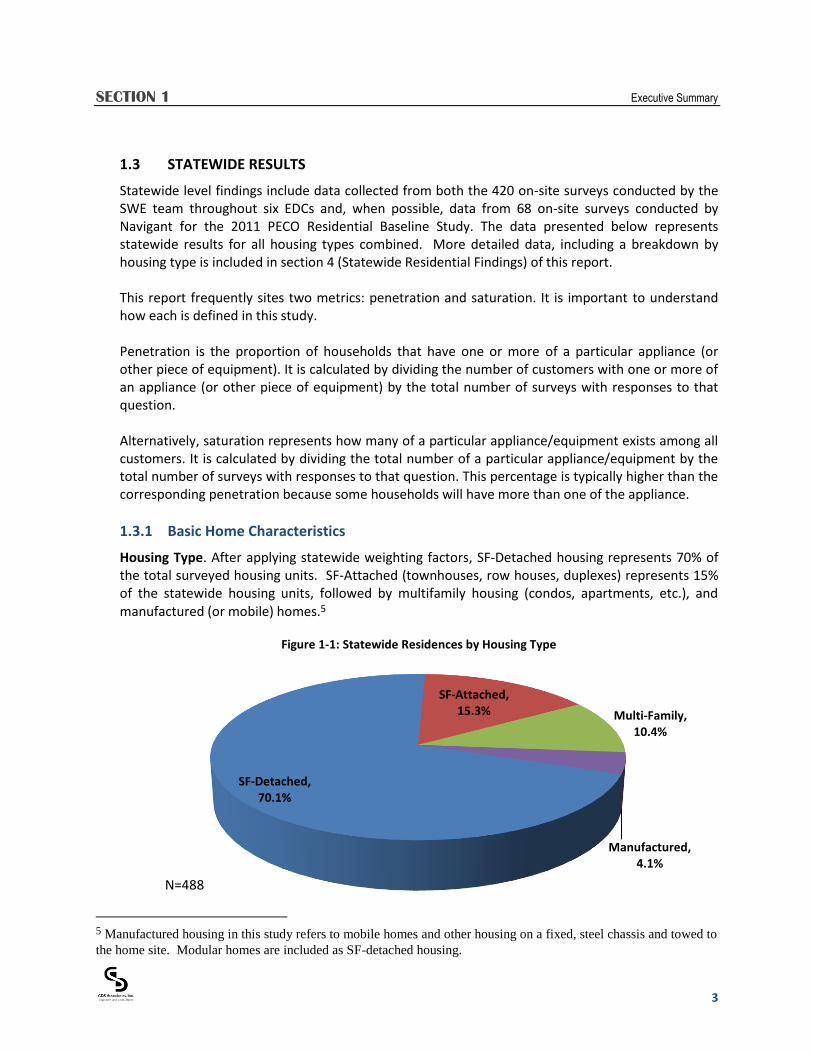
Housing Type. After applying statewide weighting factors, SF-Detached housing represents 70% of the total surveyed housing units. SF-Attached (townhouses, row houses, duplexes) represents 15% of the statewide housing units, followed by multifamily housing (condos, apartments, etc.), and manufactured (or mobile) homes.5
Figure 1-1: Statewide Residences by Housing Type
5 Manufactured housing in this study refers to mobile homes and other housing on a fixed, steel chassis and towed to
the home site. Modular homes are included as SF-detached housing.
SF-Detached, 70.1%
SF-Attached, 15.3% Multi-Family,
10.4%
Manufactured, 4.1%
N=488

SECTION 1 Executive Summary
4
Average Age. The average age of housing units statewide was 50 years old. Approximately 42% of homes were built prior to 1960 while only 8% were built within the last 10 years. Average House Size. The average square footage of conditioned space, including finished basements, for all housing was approximately 1,805 square feet.6 Single family detached housing square footage was approximately 2,070 square feet (N=350). SF-Attached, multifamily, and manufactured housing conditioned space square footage ranged from roughly 925 sq. ft. to 1,325 sq. ft.
Figure 1-2: Average Square Feet of Conditioned Space by Housing Type7
Monthly Energy (kWh) Use. Approximately 22% of surveyed homes statewide consumed less than 500 kWh per month based on historical billing data. 60% of homes consume less than 1,000 kWh per month. Only 16% consume more than 1,500 kWh monthly. In general, SF-Detached and manufactured housing had the highest proportion of 1,500 kWh and above residences. As expected, multifamily units were most likely to consume 500 kWh or less monthly. Foundation. Approximately 47% of surveyed homes statewide had unconditioned basements; an additional 35% had conditioned basements. Only 7% and 8% were slab on-grade or crawlspace foundations, respectively. Other Demographics. Statewide, the average annual number of occupants was 2.6 people per household. Nearly all homes were used as year-round residences (97%) and the majority were owner-occupied (81%).
6 For purposes of this baseline study, conditioned space was generally classified as any area, room, or finished space
being heated and/or cooled by equipment or appliance. 7 “Statewide” refers to all housing types combined throughout this study.
2,071
1,327
923
1,230
1,805
0
500
1,000
1,500
2,000
2,500
SF-Detached SF-Attached Multi-Family Manufactured Statewide
Avg
. Sq
uar
e F
ee
t
SECTION 1 Executive Summary
5
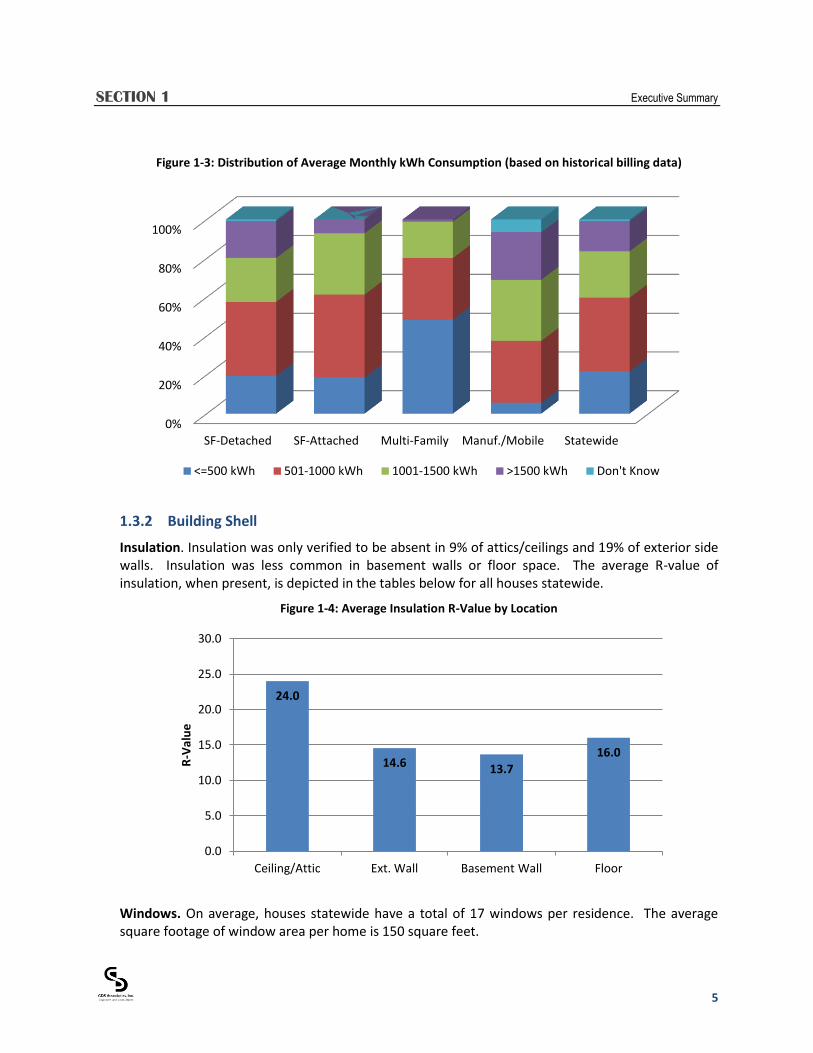
Figure 1-3: Distribution of Average Monthly kWh Consumption (based on historical billing data)
1.3.2 Building Shell
Insulation. Insulation was only verified to be absent in 9% of attics/ceilings and 19% of exterior side walls. Insulation was less common in basement walls or floor space. The average R-value of insulation, when present, is depicted in the tables below for all houses statewide.
Figure 1-4: Average Insulation R-Value by Location
Windows. On average, houses statewide have a total of 17 windows per residence. The average square footage of window area per home is 150 square feet.
0%
20%
40%
60%
80%
100%
SF-Detached SF-Attached Multi-Family Manuf./Mobile Statewide
<=500 kWh 501-1000 kWh 1001-1500 kWh >1500 kWh Don't Know
24.0
14.6 13.7
16.0
0.0
5.0
10.0
15.0
20.0
25.0
30.0
Ceiling/Attic Ext. Wall Basement Wall Floor
R-V
alu
e

SECTION 1 Executive Summary
6
12% of all surveyed windows statewide were single-paned windows. Approximately 19% of surveyed windows were believed to be double-pane low-E or triple-paned windows. The majority of windows were standard double-paned.
Table 1-1: Average Number of Windows, Window Area, and Glazing Type
Average # per Home
Average Window Area per Home
% of All Windows Single-Pane
% of All Windows Double Pane
% of All Windows DP Low-E or Triple Pane
17 150 12% 69% 19%
Air/Duct Sealing. Proper air sealing and duct sealing was qualitatively assessed during the on-site surveys. Surveyors were asked to examine residences for signs of air leakage at or around door and window sills, recessed can lighting, HVAC closets, or other points of entry. Ductwork was also examined for proper sealing techniques, including mastic or rated duct tape around a sampling of joints. In general surveyors found that 17% of all surveyed homes statewide were well sealed in terms of air infiltration and duct-sealing quality. Air sealing was assessed as poor in 22% of surveyed homes, while duct sealing was assessed as poor in 33% of homes, suggesting a sizeable opportunity for proper duct sealing procedures.
Figure 1-5: Air Sealing and Duct Sealing Quality
1.3.3 HVAC Equipment
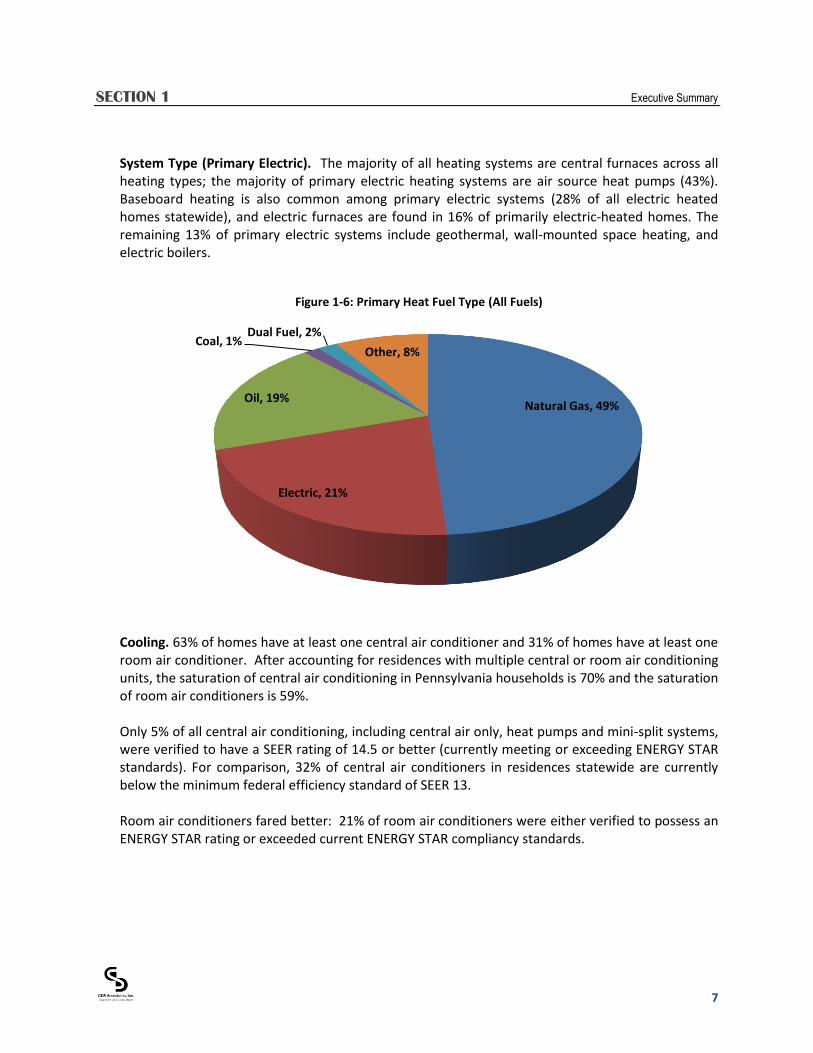
Heating Fuel Type. Natural gas was the most common form of primary heating fuel-type statewide (49%). Electric heating was the primary fuel in 21% of households statewide. Oil heating systems were present in 19% of households. Other category includes propane, kerosene, and wood heating.
17% 17%
22%
33%
0%
5%
10%
15%
20%
25%
30%
35%
Air Sealing Duct Sealing
Well Sealed Poorly Sealed
SECTION 1 Executive Summary
7
System Type (Primary Electric). The majority of all heating systems are central furnaces across all heating types; the majority of primary electric heating systems are air source heat pumps (43%). Baseboard heating is also common among primary electric systems (28% of all electric heated homes statewide), and electric furnaces are found in 16% of primarily electric-heated homes. The remaining 13% of primary electric systems include geothermal, wall-mounted space heating, and electric boilers.
Figure 1-6: Primary Heat Fuel Type (All Fuels)
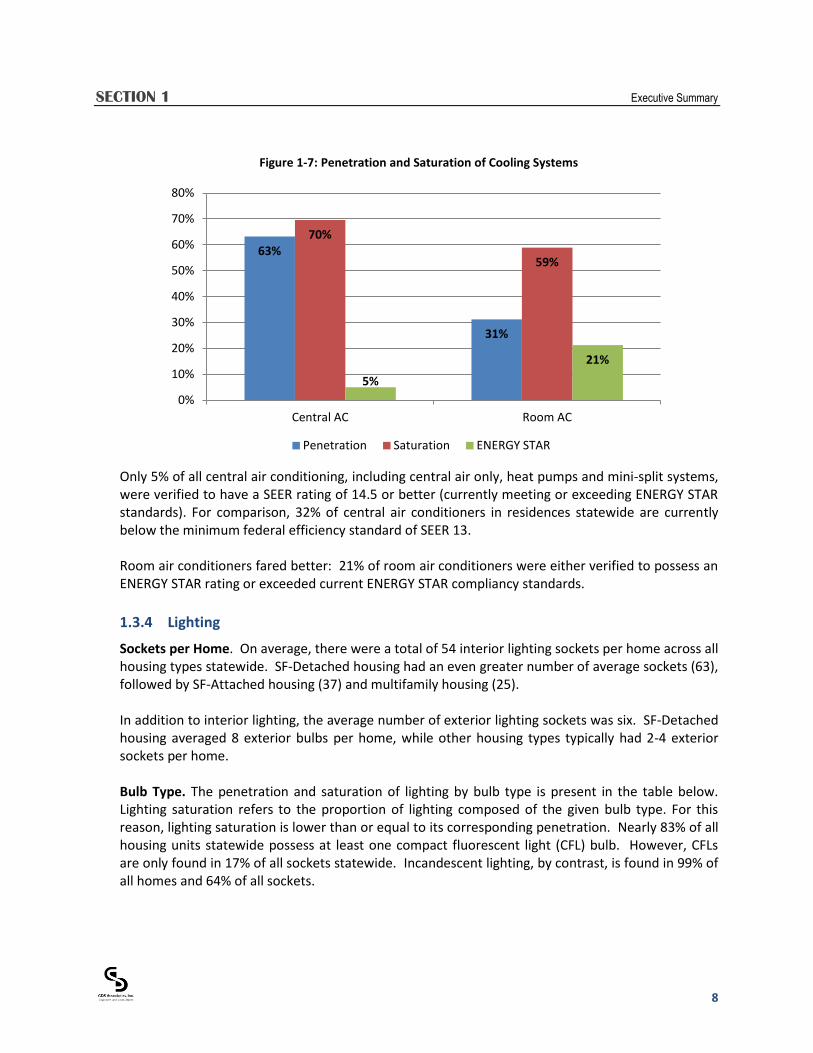
Cooling. 63% of homes have at least one central air conditioner and 31% of homes have at least one room air conditioner. After accounting for residences with multiple central or room air conditioning units, the saturation of central air conditioning in Pennsylvania households is 70% and the saturation of room air conditioners is 59%. Only 5% of all central air conditioning, including central air only, heat pumps and mini-split systems, were verified to have a SEER rating of 14.5 or better (currently meeting or exceeding ENERGY STAR standards). For comparison, 32% of central air conditioners in residences statewide are currently below the minimum federal efficiency standard of SEER 13. Room air conditioners fared better: 21% of room air conditioners were either verified to possess an ENERGY STAR rating or exceeded current ENERGY STAR compliancy standards.
Natural Gas, 49%
Electric, 21%
Oil, 19%
Coal, 1% Dual Fuel, 2%
Other, 8%
SECTION 1 Executive Summary
8
Figure 1-7: Penetration and Saturation of Cooling Systems
Only 5% of all central air conditioning, including central air only, heat pumps and mini-split systems, were verified to have a SEER rating of 14.5 or better (currently meeting or exceeding ENERGY STAR standards). For comparison, 32% of central air conditioners in residences statewide are currently below the minimum federal efficiency standard of SEER 13. Room air conditioners fared better: 21% of room air conditioners were either verified to possess an ENERGY STAR rating or exceeded current ENERGY STAR compliancy standards.
1.3.4 Lighting
Sockets per Home. On average, there were a total of 54 interior lighting sockets per home across all housing types statewide. SF-Detached housing had an even greater number of average sockets (63), followed by SF-Attached housing (37) and multifamily housing (25). In addition to interior lighting, the average number of exterior lighting sockets was six. SF-Detached housing averaged 8 exterior bulbs per home, while other housing types typically had 2-4 exterior sockets per home. Bulb Type. The penetration and saturation of lighting by bulb type is present in the table below. Lighting saturation refers to the proportion of lighting composed of the given bulb type. For this reason, lighting saturation is lower than or equal to its corresponding penetration. Nearly 83% of all housing units statewide possess at least one compact fluorescent light (CFL) bulb. However, CFLs are only found in 17% of all sockets statewide. Incandescent lighting, by contrast, is found in 99% of all homes and 64% of all sockets.
63%
31%
70%
59%
5%
21%
0%
10%
20%
30%
40%
50%
60%
70%
80%
Central AC Room AC
Penetration Saturation ENERGY STAR

SECTION 1 Executive Summary
9
Figure 1-8: Penetration and Saturation of Lighting by Bulb Type
Not all sockets can easily be retrofitted with efficient lighting options. After eliminating current tube fluorescent lighting, certain specialty lighting, and sockets that are currently empty the average number of sockets per home that could reasonably be expected to receive CFL bulbs is reduced to 45 interior sockets. Based on this reduced socket count, current CFL saturation increases to 21%
1.3.5 Water Heating
Fuel Type. The most common fuel type for domestic water heating is natural gas (48%), followed by electric (43%), and oil (8%). Other forms of domestic water heating, such as propane, solar, and wood are relatively uncommon.
Figure 1-9: Water Heating Fuel Type
0%
20%
40%
60%
80%
100%
120%
CFL Halogen Incandescent LED Tube Fluorescent
Other
Penetration Saturation
Natural Gas, 48%
Electric, 43%
Oil, 8% Other, 1%
SECTION 1 Executive Summary
10
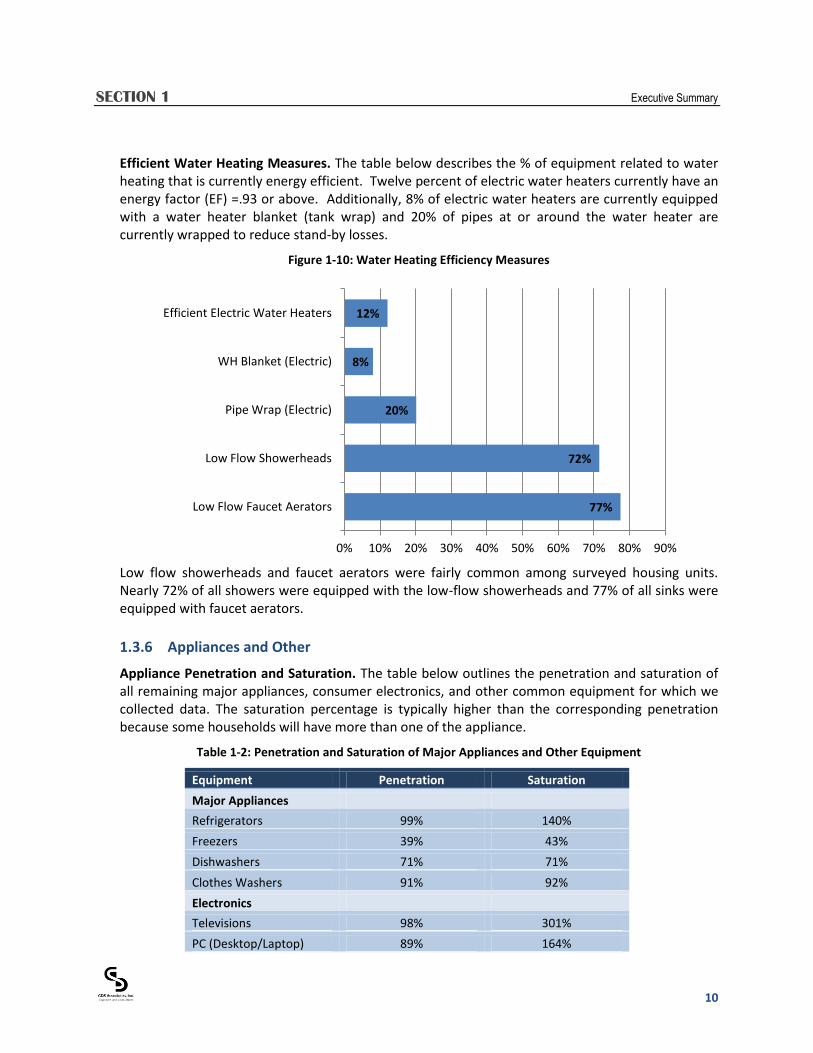
Efficient Water Heating Measures. The table below describes the % of equipment related to water heating that is currently energy efficient. Twelve percent of electric water heaters currently have an energy factor (EF) =.93 or above. Additionally, 8% of electric water heaters are currently equipped with a water heater blanket (tank wrap) and 20% of pipes at or around the water heater are currently wrapped to reduce stand-by losses.
Figure 1-10: Water Heating Efficiency Measures
Low flow showerheads and faucet aerators were fairly common among surveyed housing units. Nearly 72% of all showers were equipped with the low-flow showerheads and 77% of all sinks were equipped with faucet aerators.
1.3.6 Appliances and Other
Appliance Penetration and Saturation. The table below outlines the penetration and saturation of all remaining major appliances, consumer electronics, and other common equipment for which we collected data. The saturation percentage is typically higher than the corresponding penetration because some households will have more than one of the appliance.
Table 1-2: Penetration and Saturation of Major Appliances and Other Equipment
Equipment Penetration Saturation
Major Appliances
Refrigerators 99% 140%
Freezers 39% 43%
Dishwashers 71% 71%
Clothes Washers 91% 92%
Electronics
Televisions 98% 301%
PC (Desktop/Laptop) 89% 164%
77%
72%
20%
8%
12%
0% 10% 20% 30% 40% 50% 60% 70% 80% 90%
Low Flow Faucet Aerators
Low Flow Showerheads
Pipe Wrap (Electric)
WH Blanket (Electric)
Efficient Electric Water Heaters
SECTION 1 Executive Summary
11
Equipment Penetration Saturation
Tablet PCs 11% 11%
DVD Players 87% 132%
VCR 44% 57%
Gaming Systems 41% 57%
Fax Machines 13% 15%
Stereo Systems 58% 73%
Home Theater 24% 26%
Mobile Phone Charger 89% 177%
Seasonal
Dehumidifiers 42% 44%
Humidifiers 17% 19%
Ceiling Fans 79% 257%
Recreational
Pools 10% 10%
Hot Tubs 6% 6%
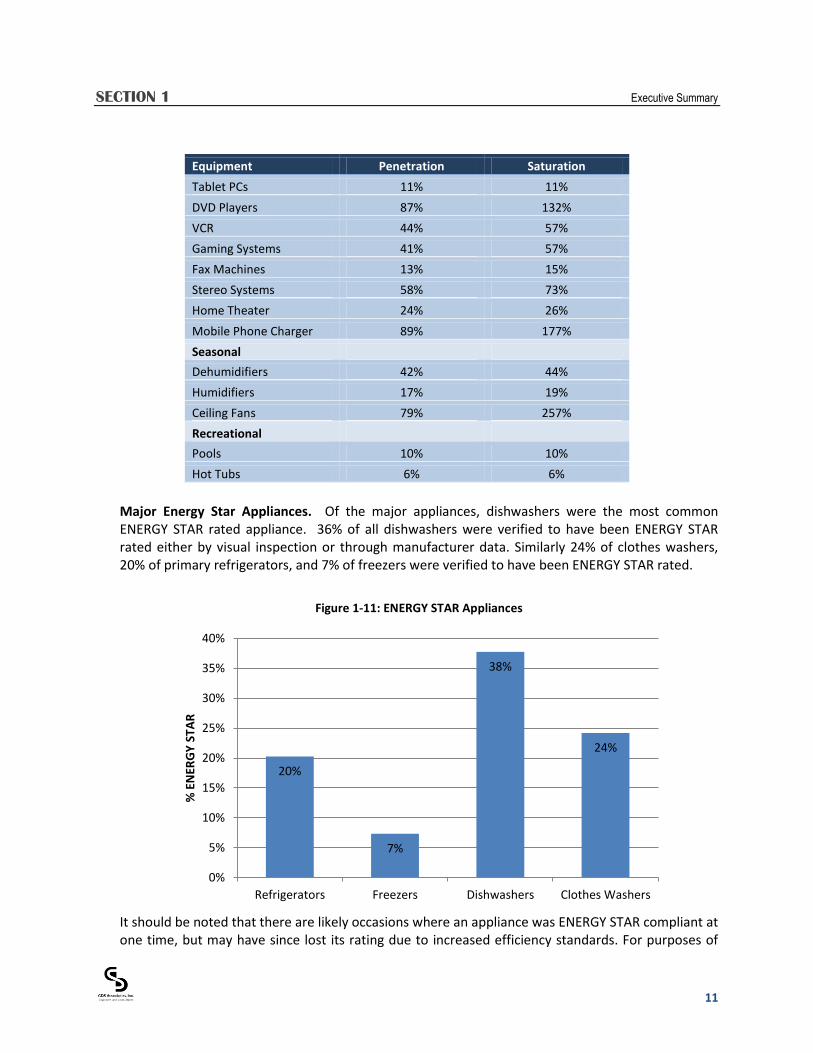
Major Energy Star Appliances. Of the major appliances, dishwashers were the most common ENERGY STAR rated appliance. 36% of all dishwashers were verified to have been ENERGY STAR rated either by visual inspection or through manufacturer data. Similarly 24% of clothes washers, 20% of primary refrigerators, and 7% of freezers were verified to have been ENERGY STAR rated.
Figure 1-11: ENERGY STAR Appliances
It should be noted that there are likely occasions where an appliance was ENERGY STAR compliant at one time, but may have since lost its rating due to increased efficiency standards. For purposes of
20%
7%
38%
24%
0%
5%
10%
15%
20%
25%
30%
35%
40%
Refrigerators Freezers Dishwashers Clothes Washers
% E
NER
GY
STA
R

SECTION 1 Executive Summary
12
this study, appliances that were once designated as ENERGY STAR (but would not meet current and updated standards) were included in the pool of efficient appliances.8
1.4 EDC OVERVIEW
In addition to presenting results at the statewide level, this report also provides the results of the on-site surveys collected for each of the EDCs. EDC level results have been weighted based on housing type and age of head of household. See section 3.4.2 for more details. More detailed and additional data tables are included in section 5 (EDC-Specific Findings) of this report.
1.4.1 Electric Fuel Share by End Use
The percentage of homes that are primarily heated, with electricity, not including dual fuel systems, ranged from 8% in the Duquesne service area to 30% in the MetEd territory. Electric space cooling, either in the form of central cooling systems or room air conditioners, ranged from 69% in the Penelec area to 98% in the MetEd territory. Electric water heating ranged from 11% of surveyed homes (Duquesne) to 57% (MetEd). Other major electric end-uses (lighting, appliances, and electronics) were found in 100% of surveyed homes.
Table 1-3: Electric Fuel Share by End Use
Electric End Use Share Duquesne MetEd Penelec Penn Power WPP PPL PECO
Primary Space Heating 8% 30% 11% 23% 28% 29% 15%
Space Cooling 94% 99% 69% 93% 87% 88% 98%
Water Heating 11% 57% 38% 42% 54% 56% 32%
Lighting 100% 100% 100% 100% 100% 100% 100%
Appliances/Plug Load 100% 100% 100% 100% 100% 100% 100%
1.4.2 Lighting
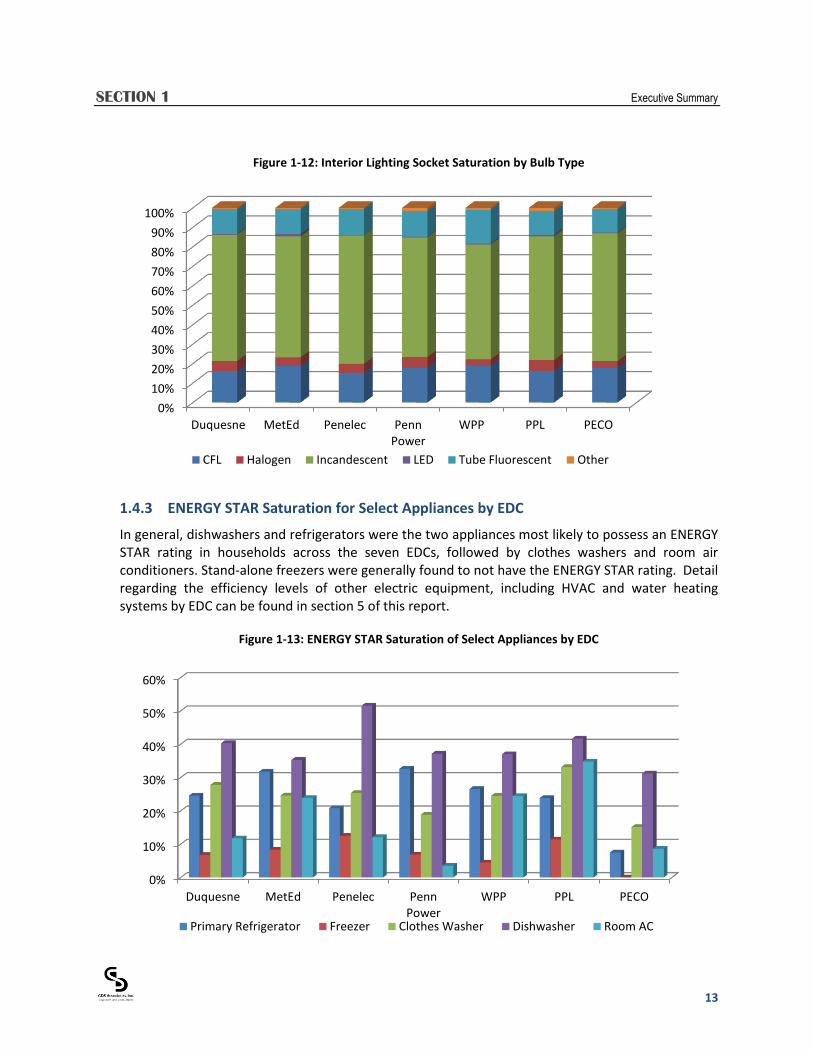
Figure 1-12 demonstrates the saturation of all interior sockets by bulb type. In general, 15%-19% of all interior sockets were fitted with compact fluorescent light (CFL) bulb technology. By contrast, the saturation of incandescent lighting ranged from 59% to 66% of all interior sockets. The saturation of LED bulb technology is almost non-existent (1% or less) across the EDCs. After accounting for interior lighting sockets where CFL bulbs are unlikely to be replaced due to incompatible socket and bulb types (i.e. current fluorescent tube fixtures, pin-based halogens, and other specialty bulbs), the saturation of CFL lighting increases to 18%-23% of all eligible bulb types.
8 This reporting is consistent with the SWE team’s method for estimated energy efficient technology saturations
used in the electric energy efficiency potential study.
SECTION 1 Executive Summary
13
Figure 1-12: Interior Lighting Socket Saturation by Bulb Type
1.4.3 ENERGY STAR Saturation for Select Appliances by EDC
In general, dishwashers and refrigerators were the two appliances most likely to possess an ENERGY STAR rating in households across the seven EDCs, followed by clothes washers and room air conditioners. Stand-alone freezers were generally found to not have the ENERGY STAR rating. Detail regarding the efficiency levels of other electric equipment, including HVAC and water heating systems by EDC can be found in section 5 of this report.
Figure 1-13: ENERGY STAR Saturation of Select Appliances by EDC
0%
10%
20%
30%
40%
50%
60%
70%
80%
90%
100%
Duquesne MetEd Penelec Penn Power
WPP PPL PECO
CFL Halogen Incandescent LED Tube Fluorescent Other
0%
10%
20%
30%
40%
50%
60%
Duquesne MetEd Penelec Penn Power
WPP PPL PECO
Primary Refrigerator Freezer Clothes Washer Dishwasher Room AC
SECTION 2 Introduction
14
2 INTRODUCTION
2.1 OVERVIEW
This report presents research results conducted in the state of Pennsylvania by the Statewide Evaluation (SWE) Team of GDS Associates, Nexant, and Mondre Energy as part of a residential baseline study. The baseline energy study’s objective is to assess a “market baseline” for the energy efficiency level of existing residential building and equipment stock as well as estimates for the saturation of key energy efficiency and conservation (EE&C) measures for the seven EDCs bound by Act 129.9
The seven Electric Distribution Companies (EDCs) represented in this study are:
Duquesne Light Company (DLC) Metropolitan Edison Company (MetEd) Pennsylvania Electric Company (Penelec) Pennsylvania Power Company (Penn Power) West Penn Power Company (WPP) PPL Electric Utilities (PPL) PECO Energy Company
The SWE Team completed seventy on-site surveys within six of the seven EDCs, excluding PECO. In total, the SWE Team conducted 420 residential on-site surveys over a 12-week period in 2011 from late September through mid-December. Using data collected for the 2011 PECO Baseline study where applicable, the SWE Team was able to incorporate 68 additional surveys for a total of 488 surveys statewide.
2.2 ACT 129 BACKGROUND
Pennsylvania ACT 129 was passed in October of 2008 and signed into law. The Act requires that seven of the state’s largest EDCs deliver energy efficiency programs that reduce their electric load by 1% by May 31, 2011 and 3% by May 31, 2013. Act 129 also requires a total peak load reduction of 4.5% by May 31, 2011. The Pennsylvania Public Utility Commission (PUC) is currently considering targets for the possible implementation of Phase 2 of Act 129 starting June 1, 2013. In mid-2009, the SWE team was selected by the PUC to become the State’s first Statewide Evaluator. A key element of the SWE Team’s scope of work is to conduct an electric energy efficiency market potential study to help inform the implementation of Phase 2 of Act 129. As a first step in this process, the SWE team conducted residential, commercial and industrial energy efficiency baseline studies to characterize
9 Note that while PECO results are presented in this study, the SWE team incorporated findings from a prior 2011
PECO Baseline report rather than collect additional primary data. See the 2011 PECO Baseline Study, prepared by
Navigant Consulting, February 7, 2011.
SECTION 2 Introduction
15
the energy usage and electric energy efficiency opportunities in the State of Pennsylvania for the seven EDCs bound by Act 129. The results of the residential sector baseline study are presented within this report. The result of the commercial and industrial sector baseline study are presented in a companion report presented by Nexant.
2.3 STUDY GOALS
While this study aims to assess current residential electric equipment stock and estimate the saturation of key energy efficiency and conservation measures as eventual inputs to the energy efficiency market potential study, it is also designed to serve as a stand-alone residential baseline study presenting contemporary information across the seven largest EDCs in Pennsylvania. These results can supply information that is useful for future energy efficiency and demand response program development, system planning, and obtaining a general understanding of the energy consuming equipment located throughout the state of Pennsylvania. Based on these ultimate considerations, the following goals were identified for this study:
Select a representative stratified random sample of residential customers within each EDC for participation in the baseline study
Determine the current saturation of energy using equipment in residences at the statewide and EDC level
Determine the current saturation of electric efficiency measures in residences at the statewide level by housing type, as well as at the EDC level
2.4 ORGANIZATION OF THE REPORT
The remainder of this report includes the following sections:
Section 3 – Study Methodology Section 4 – Statewide Residential Findings Section 5 – EDC Specific Findings Appendices (On-site Survey Instrument, Initial Recruitment Letter, and Recruitment
Telephone Script)
SECTION 3 Methodology
16
3 METHODOLOGY
3.1 STUDY PARAMETERS
The SWE Team performed on-site surveys from September 2011 through December 2011 to collect detailed and accurate inventories of residential structure and equipment characteristics throughout the state of Pennsylvania. This study captured a variety of energy-related data, including the penetration of electric- and non-electric equipment and appliances, energy efficiency levels of electric equipment and appliances, building shell characteristics, lighting socket counts, and other relevant information. A total of 488 site surveys (including data from the 2011 PECO Baseline Study) stratified by EDC, housing segment, and annual kWh consumption were conducted. The desired level of precision for EDC specific results, ±10% precision, with 90% confidence, necessitated a total of 70 on-site visits per EDC. The data for all EDC’s were aggregated to the statewide level, and these estimates carry precision of ±5% precision, with 95% confidence. The sample size was not large enough, nor was it intended, to provide housing segment specific results within each EDC.10
3.2 PRIMARY DATA COLLECTION
While each EDC routinely captures important demographic and equipment characteristics in their territory through Residential Appliance Saturation Studies and other targeted studies, there is often a notable absence of data specific to the penetration of energy efficient equipment. To overcome this hurdle, the SWE team conducted a survey of Pennsylvania residential electric consumers to gather accurate data that is specific to Pennsylvania and the six EDC service territories included in this study (primary onsite data for PECO from Navigant’s 2011 PECO Baseline Study was also included where possible). In order to maximize the reliability of the survey, the SWE team aimed to gather information through customer site visits.
3.2.1 Sample Design
The target precision and confidence level for the residential on-site survey was ±10% precision, at the 90% confidence interval, for each EDC. To achieve this desired level of precision, a sample of 70 was required for each EDC. To insure proper representation, the sample was designed to include a broad cross-section of residential customers for each EDC. The samples for each EDC were stratified by home type and average electric consumption. Stratifying on home type and energy use insured representation across all levels of consumption, which in turn ensures representation of other key demographic characteristics (i.e., number of occupants, square footage, heating/cooling equipment
10 At the statewide level, there were a significant number of observations to make statistically valid conclusions in
excess of ±10% precision, with 90% confidence for SF-Detached housing. For SF-Attached and multifamily
housing segments, there were only enough observations to make assumptions at ±15% precision, with 90%
confidence, and the number of manufactured housing observations was significantly small enough that the SWE
team does not recommend using for statistically reasonable conclusions.

SECTION 3 Methodology
17
type, and other key metrics), without over-burdening the overall stratification and sampling process. To accurately produce a recruitment sample representative of each EDCs current population, it was important to remove non-premise buildings and inactive accounts from each EDC customer database. Ultimately, the SWE team created a recruitment sample of 700-900 residences within each EDC. The 700-900 recruitment sample mirrored (as closely as possible) the complete customer databases of each EDC. While the SWE team only stratified the recruitment sample based on housing type and electric consumption history, the SWE team also verified that the recruitment sample had similar geographic distribution compared to the customer database. In addition, the recruitment sample distribution of home heating type was also compared to the full customer dataset (when available). Recruitment is discussed in further detail later in this section. The target confidence interval and precision for the residential on-site survey sample for each EDC was a 90% confidence interval with a precision interval of less than 10%. This yielded a final sample size of approximately 70 on-site surveys for each EDC. With a significantly large population, ±5% precision at the 95% confidence level can generally be achieved with a minimum random sample size of 385 observations. The 420 on-site surveys conducted by the SWE team and 68 on-site surveys conducted for the 2011 PECO Baseline study result in 488 on-site surveys. Thus, results presented at the statewide level may achieve higher levels of precision and confidence than can be found at the EDC level.
3.2.2 Recruitment
The first step in the survey process was to design a letter to inform customers in the recruitment sample that an energy survey was to be performed in their respective territory and that a SWE team representative would potentially contact them to request participation in the study. The initial recruitment letter was sent out under the name and letterhead of each respective EDC. Next, a phone recruitment script was designed to introduce the study to the residential homeowner, explain the process and demands of the on-site survey and ask for participation.11 In order to facilitate recruitment, the SWE team was able to offer a $50 incentive to homeowners willing to participate in the survey. In order to ensure an adequate mix of housing types and electric usage, the SWE team sorted each EDC’s recruitment sample of 700-900 residences by housing type and monthly energy usage and divided these residences into 70 select bins per EDC. Once a homeowner in a given bin agreed to the on-site survey, the SWE team did not actively recruit the remaining residences in that bin. This helped to guarantee a final on-site sample that continued to be stratified by both housing type and energy use. Occasionally, if no homeowners within a bin were able to participate in the study, recruiters would circle back to neighboring bins for a second participant. The SWE team would attempt to contact customers a maximum of three times before considering an account not part of the study.
11 A sample copy of the initial recruitment letter and the telephone recruitment script for the residential baseline
study can be found in Appendix B and C, respectively.

SECTION 3 Methodology
18
The SWE team contacted a total of 3,325 residential consumers across the state and performed a total of 420 site visits with an average recruitment rate of 12.6%. The table below provides a breakdown of the total number of customers contacted and recruited for on-site visits.
Table 3-1: Overall Survey Recruitment Results
EDC Customers Contacted Surveys Completed Recruitment Rate
Duquesne 571 70 12.3%
MetEd 619 70 11.3%
Penelec 465 70 15.1%
Penn Power 530 70 13.2%
WPP 641 70 10.9%
PPL 499 70 14.0%
TOTAL 3,325 420 12.6%
3.2.3 On-site Survey
By using an on-site survey instrument and trained staff to review end-use appliances within the home, the data collected has a high level of accuracy. In order to maximize the effectiveness of each site visit and provide results with a high level of detail, the SWE team designed the on-site survey to be as comprehensive as possible without being overly intrusive to the homeowner. The SWE team also reviewed the on-site data collection form used by Navigant for the 2011 PECO Baseline study to ensure the ability to incorporate their results into the statewide analysis. The SWE team also asked EDC personnel and the EDC evaluation teams to review and provide comments on a draft of the survey instrument. The final version of the onsite survey gathers data on the presence of each end-use studied as well as equipment fuel type and efficiency level. The on-site surveys were completed by nine trained site surveyors during a 12-week period from September 2011 through December 2011. In total 420 surveys were completed by the SWE team. Surveyors were equipped with a tablet PC to collect data required by the survey instrument and were typically able to complete each survey within a 2 hour window (excluding the time to travel to and from each site from a central location). To ensure consistent results, the electronic survey form was designed to restrict data entry within selected expected data ranges and was able to confirm the completeness of each survey. A hard copy of the on-site survey instrument is included in Appendix A of this report.
3.2.4 End Uses
The study categorizes energy using equipment in each of the EDC service territories into appropriate end uses. The types of end-uses included in this report are consistent with those typically considered in other regional or national studies. For ease of comparison, the results of this study are presented by end-use in a format consistent with the 2011 PECO Baseline Study. The residential end-uses included in this study are:
Building Envelope Heating Equipment Cooling Equipment
SECTION 3 Methodology
19
Lighting Water Heating Major Appliances Consumer Electronics Other
3.3 EXTERNAL DATA COLLECTION
The data collection and mining effort included a search of available secondary sources in an effort to streamline primary research efforts and identify gaps – either in the presence or quality of the data. In addition to these sources, the SWE team agreed to utilize the 2011 PECO Baseline Study in lieu of conducting additional on-site visits in the PECO area.
3.3.1 2010 PECO Baseline Study
Early on during the development of the market baseline scope of work, the SWE team, Pennsylvania PUC, and PECO decided additional on-site surveys would not be performed in the PECO service territory since a comprehensive baseline study was performed on its residential consumers in 2010. The SWE team has worked with the authors of the PECO Baseline Study Report to review, analyze, and incorporate the findings from the existing study with findings from this study when possible. It was not always possible to incorporate PECO into all statewide findings included in this report due to varying surveying techniques, data ranges, and scopes of work. The SWE team has noted throughout the report when PECO data is absent in statewide totals and EDC-specific results.
3.3.2 Data Sources
The SWE team also examined a number of existing data sources to identify data gaps. For example, additional research was performed to utilize appliance manufacturer information collected onsite to determine the efficiency of the major appliances as well as major end-use equipment. In addition to manufacturer product data, the SWE team collected and utilized ENERGY STAR product lists, Consortium for Energy Efficiency (CEE) product lists, and the Air-Conditioning, Heating and Refrigeration Institute (AHRI) product database in order to help determine specific appliance efficiencies.
3.4 DATA ANALYSIS
3.4.1 Data Cleaning
The SWE team reviewed all collected data fields for validity and completeness to ensure data quality across all responses. All fields were scanned for entry errors as well as outliers, enabling the SWE team to address the majority of errors. In addition to entry errors, the SWE team also checked internal consistency in recorded responses across fields. For example, where the number of televisions did not add up to the television count by screen type, we corrected fields where possible. In addition, select missing or questionable data points were cleaned through follow-up phone calls or through publicly available data sources, such as public property records. Finally, as noted in the prior section, the make/model numbers of various appliances of HVAC equipment were recorded
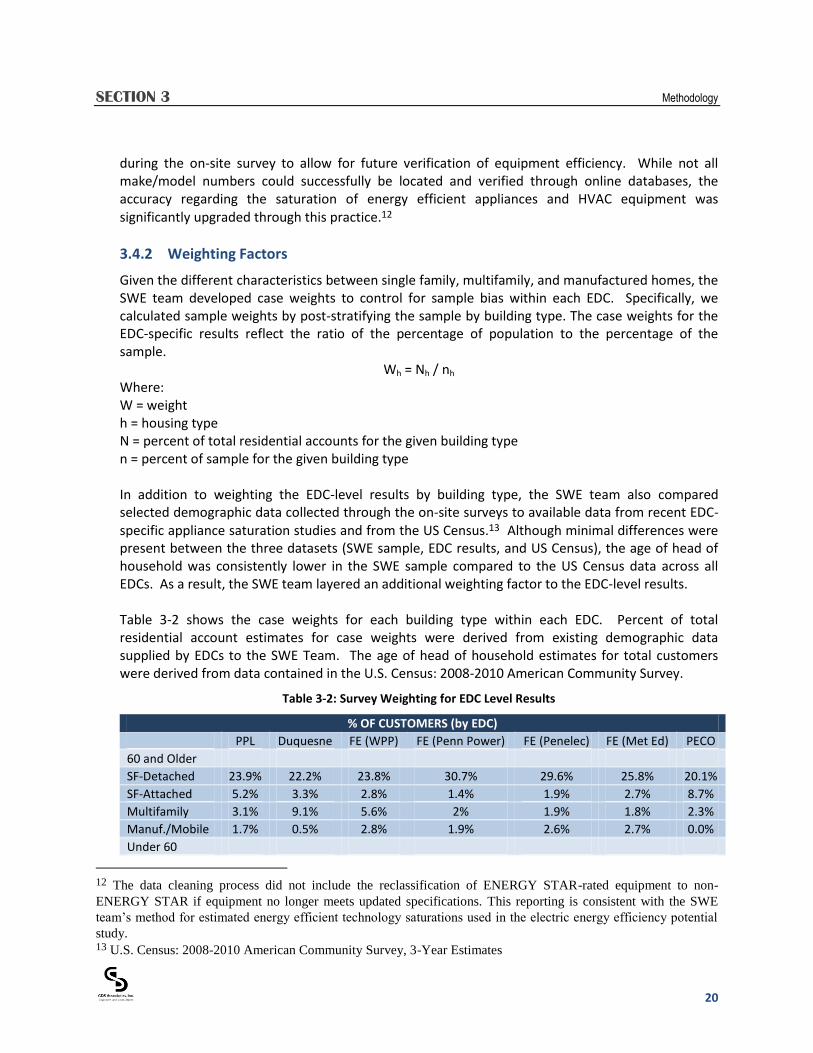
SECTION 3 Methodology
20
during the on-site survey to allow for future verification of equipment efficiency. While not all make/model numbers could successfully be located and verified through online databases, the accuracy regarding the saturation of energy efficient appliances and HVAC equipment was significantly upgraded through this practice.12
3.4.2 Weighting Factors
Given the different characteristics between single family, multifamily, and manufactured homes, the SWE team developed case weights to control for sample bias within each EDC. Specifically, we calculated sample weights by post-stratifying the sample by building type. The case weights for the EDC-specific results reflect the ratio of the percentage of population to the percentage of the sample.
Wh = Nh / nh Where: W = weight h = housing type N = percent of total residential accounts for the given building type n = percent of sample for the given building type In addition to weighting the EDC-level results by building type, the SWE team also compared selected demographic data collected through the on-site surveys to available data from recent EDC-specific appliance saturation studies and from the US Census.13 Although minimal differences were present between the three datasets (SWE sample, EDC results, and US Census), the age of head of household was consistently lower in the SWE sample compared to the US Census data across all EDCs. As a result, the SWE team layered an additional weighting factor to the EDC-level results. Table 3-2 shows the case weights for each building type within each EDC. Percent of total residential account estimates for case weights were derived from existing demographic data supplied by EDCs to the SWE Team. The age of head of household estimates for total customers were derived from data contained in the U.S. Census: 2008-2010 American Community Survey.
Table 3-2: Survey Weighting for EDC Level Results
% OF CUSTOMERS (by EDC)
PPL Duquesne FE (WPP) FE (Penn Power) FE (Penelec) FE (Met Ed) PECO
60 and Older
SF-Detached 23.9% 22.2% 23.8% 30.7% 29.6% 25.8% 20.1%
SF-Attached 5.2% 3.3% 2.8% 1.4% 1.9% 2.7% 8.7%
Multifamily 3.1% 9.1% 5.6% 2% 1.9% 1.8% 2.3%
Manuf./Mobile 1.7% 0.5% 2.8% 1.9% 2.6% 2.7% 0.0%
Under 60
12 The data cleaning process did not include the reclassification of ENERGY STAR-rated equipment to non-
ENERGY STAR if equipment no longer meets updated specifications. This reporting is consistent with the SWE
team’s method for estimated energy efficient technology saturations used in the electric energy efficiency potential
study. 13 U.S. Census: 2008-2010 American Community Survey, 3-Year Estimates

SECTION 3 Methodology
21
SF-Detached 46.5% 41.1% 44.2% 54.5% 52.5% 52.4% 44.6%
SF-Attached 10.1% 6.2% 5.2% 2.5% 3.4% 5.5% 19.3%
Multifamily 6.1% 16.8% 10.4% 3.6% 3.4% 3.6% 5.1%
Manuf./Mobile 3.4% 0.8% 5.2% 3.3% 4.6% 5.6% 0.0%
% OF SAMPLE (by EDC)
PPL Duquesne FE (WPP) FE (Penn Power) FE (Penelec) FE (Met Ed) PECO
60 and Older
SF-Detached 42.9% 27.1% 35.7% 37.1% 37.1% 21.4% 35.3%
SF-Attached 4.3% 2.9% 1.4% 2.9% 2.9% 10.0% 13.2%
Multifamily 1.4% 8.6% 2.9% 1% 5.7% 1.4% 0.0%
Manuf./Mobile 2.9% 0.0% 4.3% 4.3% 4.3% 1.4% 0.0%
Under 60
SF-Detached 30.0% 44.3% 45.7% 40.0% 32.9% 51.4% 29.4%
SF-Attached 7.1% 5.7% 1.4% 4.3% 7.1% 1.4% 14.7%
Multifamily 7.1% 10.0% 5.7% 2.9% 5.7% 8.6% 7.4%
Manuf./Mobile 4.3% 1.4% 2.9% 7.1% 4.3% 4.3% 0.0%
EDC WEIGHTS
PPL Duquesne FE (WPP) FE (Penn Power) FE (Penelec) FE (Met Ed) PECO
60 and Older
SF-Detached 0.56 0.82 0.67 0.83 0.80 1.20 0.57
SF-Attached 1.21 1.16 1.96 0.49 0.67 0.27 0.65
Multifamily 2.19 1.06 1.96 1.43 0.34 1.23 -
Manuf./Mobile 0.61 - 0.65 0.44 0.61 1.92 -
Under 60
SF-Detached 1.55 0.93 0.97 1.36 1.60 1.02 1.52
SF-Attached 1.41 1.08 3.64 0.58 0.47 3.86 1.31
Multifamily 0.85 1.68 1.82 1.27 0.60 0.42 1.00
Manuf./Mobile 0.79 0.91 1.82 0.47 1.08 1.30 -
In an effort to provide a more inclusive study and to provide estimates for each of the EDC territories, a sample of 70 residential sites was selected for each EDC irrespective of the size of the EDC. When aggregating the EDCs estimates to the statewide level, it was necessary to create a second set of case weights to control for differences in the number of residential accounts across the seven EDCs. This approach provides more weight to the data for larger EDCs when compared to smaller EDCs in the statewide findings. Furthermore, depending on the availability of PECO data, weighting factors were calculated with and without PECO data. The tables below detail the customer counts provided by the individual EDCs as well as the weights that were applied throughout the analysis when rolling up EDC data to statewide findings.
Table 3-3: EDC 2011 Customer Counts (Including PECO)
EDC 2011 CUSTOMER COUNT (WITH PECO)
PPL Duquesne FE (WPP) FE
(Penn Power) FE
(Penelec) FE (Met Ed) PECO PA
1,225,825 524,865 620,151 140,200 504,450 486,318 1,413,206 4,915,015
25% 11% 13% 3% 10% 10% 29% -

SECTION 3 Methodology
22
Table 3-4: Statewide Weights (Including PECO)
STATE WEIGHTS (WITH PECO)
PPL Duquesne FE (WPP) FE (Penn Power) FE (Penelec) FE (Met Ed) PECO
60 and Older
SF-Detached 0.97 0.61 0.59 0.16 0.57 0.83 1.17
SF-Attached 2.11 0.87 1.72 0.10 0.48 0.19 1.35
Multifamily 3.81 0.79 1.72 0.28 0.24 0.85 -
Manuf./Mobile 1.06 - 0.57 0.09 0.44 1.32 -
Under 60
SF-Detached 2.69 0.69 0.85 0.27 1.14 0.70 3.13
SF-Attached 2.46 0.80 3.20 0.12 0.34 2.66 2.71
Multifamily 1.48 1.25 1.60 0.25 0.43 0.29 2.06
Manuf./Mobile 1.37 0.68 1.60 0.09 0.77 0.90 -
Table 3-5: EDC 2011 Customer Counts (Excluding PECO)
EDC 2011 CUSTOMER COUNT (WITHOUT PECO)
PPL Duquesne FE (WPP) FE (Penn Power) FE (Penelec) FE (Met Ed) PECO PA
1,225,825 524,865 620,151 140,200 504,450 486,318 0 3,501,809
35% 15% 18% 4% 14% 14% 0% -
Table 3-6: Statewide Weights (Excluding PECO)
STATE WEIGHTS (WITHOUT PECO)
PPL Duquesne FE (WPP) FE (Penn Power) FE (Penelec) FE (Met Ed) PECO
60 and Older
SF-Detached 1.17 0.73 0.71 0.20 0.69 1.00 0.00
SF-Attached 2.55 1.05 2.08 0.12 0.58 0.23 0.00
Multifamily 4.60 0.95 2.08 0.34 0.29 1.02 0.00
Manuf./Mobile 1.27 - 0.69 0.10 0.53 1.60 0.00
Under 60
SF-Detached 3.25 0.84 1.03 0.33 1.38 0.85 0.00
SF-Attached 2.97 0.97 3.87 0.14 0.41 3.21 0.00
Multifamily 1.79 1.51 1.93 0.31 0.52 0.35 0.00
Manuf./Mobile 1.65 0.82 1.93 0.11 0.94 1.08 0.00
3.4.3 Penetration vs. Saturation
This report frequently sites two metrics: penetration and saturation. These metrics merit further explanation. Penetration refers to the proportion of homes assigned a given equipment type or characteristic. For instance, computers in the PPL service area have a penetration of 84%. This means 84% of all homes have at least one PC (though they could have more than one). Saturation refers to the average number of units across all homes (except lighting).14 For instance, a computer saturation of
14 Lighting saturation refers to the proportion of lighting composed of the given bulb type. For this reason, lighting
saturation is lower than or equal to its corresponding penetration.

SECTION 3 Methodology
23
149% in the PPL territory indicates that, on average, there are 1.49 computers in residential households. While saturations indicate the average number of units across all households (including households that do not have the equipment), a third metric, mean units, tells us the average number of units for households with at least one unit. Dividing saturation by the penetration gives us the mean units. In the computer example for PPL above, while the saturation of computers is 149%, only 84% of the households have at least one computer. This indicates that of the households that have at least one computer, there are, on average, 1.77 computers.
3.4.4 Significance Testing
Due to budget and time constraints, no statistical testing was conducted during the course of this research to determine if the estimates (proportion or mean) for a given metric were significantly different across samples or across specific groups within one sample. If such tests were to be performed, the t-Test could be performed to test the differences between means derived from two independent samples. For example, in Table 5-3 on page 63, the average age of home 47.1 and 52.1 years, respectively, in the WPP and PECO service areas. Comparison of the computed t-value using the individual participant data regarding age of home to the critical t-value based on the desired alpha level (e.g., α = .05) and degrees of freedom (n1 + n2 -2) would provide the information needed to accept/reject the null hypothesis that the differences between the two means are not statistically significantly different or to accept the alternative hypothesis that the differences are statistically significant. A similar type analysis could be performed to test the differences between two proportions; however, rather than a t-test, a z-test or Chi-squared test would be the appropriate method.
3.5 UNCERTAINTY
The survey estimates presented in this report are subject to a certain degree of uncertainty. Practical constraints make it impossible for the SWE team to conduct an on-site survey for the entire population of Pennsylvania residences, necessitating the selection of a small sample population from which to collect data. When using a sample to estimate a population metric, factors of uncertainty are introduced, primarily based on the size of the sample and the existence of biases within the sample. The uncertainty can be described by the confidence level and margin of error, targeted in this study at 95% and 5%, respectively, for the state-wide residential sector. This means that if this study were repeated multiple times, 95% of the studies would produce estimates to within ±5% of the true population value. The sample size required to achieve these levels of confidence with a large population is given in the Equation 3.1.
Equation 3-1: Sample Size Determination

SECTION 3 Methodology
24
Where: n = Sample size t = Value for selected confidence level, 95% corresponds to 1.96 p = Expected proportion of responses. Maximum possible proportion of 0.5 yields maximum
sample size d = Margin of error, 0.1 Based on this equation, the minimum sample size required to achieve precisions of ±5%, at 95% confidence, is 384. The SWE team’s targeted sample size of 420 customers (488 with the addition of the PECO dataset) is sufficiently large to achieve this level of confidence. As can be shown by the equation above, a sample size greater than 384 will result in an increased level of confidence and a smaller margin of error. With considerations for sample size it is important to note that the more aggregated findings in this report have the highest confidence, while the confidence decreases as results become more disaggregated (either by housing type or EDC). For example, if 334 customers out of 488 residential sample points across the state have central air conditioning systems, this saturation can be reported with a confidence/precision level of greater than 95/5 due to the sample of 488 data points (well in excess of 384). Likewise if 58 customers out of 70 sample points in an EDC territory have central air conditioning, this saturation can be reported with a confidence/precision level of approximately 90/10. However, the percent of central cooling systems that are of a particular efficiency level will have greater uncertainty because the sample size of central cooling is only 58. Additionally, the amount of uncertainty increases when developing estimates of particular metrics at the housing type level due to the limited sample points. When attempting to analyze the survey responses by EDC and by housing type, the sample sizes became very small; therefore, results at the EDC level were not broken out by housing type. Additionally, while results at the statewide level are disaggregated by housing type, the level of confidence/precision differs by housing type since some segments received fewer observations than others (e.g. single family-attached homes only have 54 observations statewide). Due to differences in the overall mix of equipment within each home, it was not possible to collect data for every characteristic at every site. For example, while all homes have water heating, only a fraction of them are electric water heaters. This report notes when field-specific sample sizes have a limited number of observations. For qualitative comparison purposes, we have included sample sizes for all metrics, even when the number of observations is extremely limited. However, when the number of observations falls below 17, the level of confidence/precision falls below 90/20, and we caution against making any statistical inferences based on such a small sample. While on-site surveys are generally able to achieve more accurate and detailed datasets than self-reported or telephone surveys, it was not possible to collect data for all data fields at all locations. One example is that the make/model number for an end use may have been transcribed incorrectly, was not legible, or the equipment was of significant age, and product data was no longer available from the manufacturer. In these cases, a “Don’t Know” field was specified. The SWE team has included “Don’t Know” responses in our analysis where meaningful; otherwise, we present the

SECTION 3 Methodology
25
percentages after eliminating these unknown responses. The SWE team has also attempted to consistently note where the exclusion of “Don’t Know” responses has resulted in a limited sample size.
Finally, another factor that can influence the accuracy of the results is the extent to which the sample is representative of the population as a whole. Though stratified samples were selected randomly, it is possible that the sample contains some type of bias which can influence results. One such example is a sample with a high percentage of retirement age homeowners (and thus more available for an on-site survey), potentially resulting in different energy consumption habits than the true population. The results found within this study have been reweighted to correct for a known bias toward older head of households. In addition to uncertainty due to sample size or random sampling error, other forms of uncertainty may occur during on-site survey collection. This report combines the results of 420 on-site surveys collected by the SWE team with 68 completed by Navigant Consulting for the 2011 PECO Baseline Study. Although the SWE team reviewed the Navigant data collection instrument in an effort to collect consistent data, differences in data collection procedures may exist. As an example, the estimated distribution of insulation R-value in homes appears different between the PECO territory and the remaining EDCs. It is difficult to determine whether these are actual differences in the distribution of insulation R-value or whether these differences occur due to contrasting collection or R-value determination methods. Where possible, the SWE team took steps to ensure biases were minimized in the samples given the time and budget constraints allotted. Samples were selected randomly from each EDC’s customer database in a manner which eliminated the potential for human error or other biases. The SWE team stratified the recruitment sample to calibrate the 70 on-site surveys based on a known mix of housing types and energy consumption. The SWE team attempted to minimize the potential for systematic uncertainty through consistent surveyor training and data collection materials, with these steps taken, the SWE team believes that the results of the survey can be used to make reasonable assumptions about the characteristics of the overall customer base of the EDCs included in this study.

SECTION 4 Statewide Residential Findings
26
4 STATEWIDE RESIDENTIAL FINDINGS
4.1 INTRODUCTION
This section describes the residential sector findings obtained from the on-site survey collection and analysis activities at the statewide level. As noted in section 3.4.2, statewide results were weighted by EDC to control for differences in the number of residential accounts across the seven EDCs. This approach provides more weight to the data for larger EDCs when compared to smaller EDCs in the statewide findings. Statewide level findings include data collected from both the 420 on-site surveys conducted by the SWE team throughout six EDCs and, when possible, data from 68 on-site surveys conducted by Navigant for the 2011 PECO Baseline Study. In select instances, the SWE team was unable to successfully incorporate results from the PECO Baseline study and these occurrences have been noted throughout the report. When all data fields were available, statewide results are based on a total of 488 observations.15 The total number of observations by housing type is as follows: SF-Detached houses (358), SF-Attached (54), multifamily (48), and manufactured housing (28). Statistical level of confidence falls to 90/15 at 30 observations and 90/20 at 17 observations. Note that throughout this section, number of manufactured housing observations was significantly small enough that the SWE team does not recommend using for statistically reasonable conclusions. Total sample sizes for all metrics have been noted throughout.16
4.2 BASIC HOME CHARACTERISTICS
4.2.1 Usage
As noted earlier in the report, each EDC provided the SWE team with historical billing data for the pool of potential on-site survey recruits. The potential residential recruits were then stratified by average monthly kWh consumption and home type and recruited to attain a representative sample of each EDC territory in terms of average monthly usage and housing type. Table 4-1 shows the representation of electric usage weighted for statewide level results.
Table 4-1: Average Monthly Electricity Usage by Statewide Weights
Occupants SF-Detached SF-Attached Multifamily Manufactured Statewide
<=500 kWh 19% 19% 48% 6% 22%
501-1000 kWh 38% 43% 32% 32% 38%
1001-1500 kWh 23% 32% 19% 31% 24%
>1500 kWh 19% 7% 1% 24% 16%
Don't Know 1% 0% 0% 7% 1%
15 In the data tables presented throughout this section, “Statewide” refers to all housing types combined. 16 To reduce confusion and the appearance of non-integer site visit counts, sample sizes (n) throughout the report
reflect the number of observations prior to any weighting factors.

SECTION 4 Statewide Residential Findings
27
Grand Total 100% 100% 100% 100% 100%
n 356 55 48 29 488
4.2.2 Home Type
Table 4-2 displays the types of residential sites weighted to represent the statewide proportion of housing stock. Single family detached houses are the dominant housing type (70%). Single family attached houses consisting of row houses, townhomes, and duplexes represent 15%, followed by multifamily and manufactured/mobile housing.
Table 4-2: Home Type by Statewide Weights
Home Type SF-Detached SF-Attached Multifamily Manufactured Statewide
% 70.1% 15.3% 10.4% 4.1% 100.0%
n 358 54 48 28 488
Home Age. The average age of the home was 50 years. Table 4-3 displays the distribution of the years of construction. Approximately 50% of housing was built between 1960 and 2000. Only 8% of the total existing housing stock was built after 2000. In general, the multifamily and manufactured housing stock is more recent than single family homes.
Table 4-3: Average Age of Home by Statewide Weights
Age SF-Detached SF-Attached Multifamily Manufactured Statewide
Average Age 49.8 60.2 45.6 24.7 49.9
n 354 55 46 29 484
Table 4-4: Year of Construction by Statewide Weights
Year of Construction SF-Detached SF-Attached Multifamily Manufactured Statewide
Pre-1900 5% 6% 4% 0% 5%
1900-1910 2% 17% 1% 0% 4%
1911-1920 5% 3% 6% 0% 4%
1921-1930 4% 4% 1% 0% 3%
1931-1940 5% 9% 8% 0% 6%
1941-1950 7% 9% 10% 0% 8%
1951-1960 13% 9% 4% 0% 11%
1961-1970 15% 9% 9% 19% 14%
1971-1980 10% 8% 20% 14% 11%
1981-1990 13% 10% 10% 24% 13%
1991-2000 13% 9% 9% 31% 13%
2001-Present 7% 6% 17% 11% 8%
Grand Total 100% 100% 100% 100% 100%
n 354 55 46 29 484

SECTION 4 Statewide Residential Findings
28
4.2.3 Home Size
The average square footage of conditioned space for all housing was approximately 1,805 square feet. Single family detached housing square footage was approximately 2,070 square feet (n=350). SF-Attached, Multifamily, and manufactured conditioned square footage ranged from roughly 920 sq. ft. to 1,325 sq. ft. However these conditioned space area estimates for housing types other than SF-detached are based on a limited number of observations (n=55 or less).
Figure 4-1: Average Home Square Footage (Conditioned Space) by Statewide Weights
Home Foundation. The majority of housing units have either conditioned or unconditioned basements. Crawl space was generally only found in manufactured homes and slab on-grade foundations were relatively uncommon, particularly in SF-Detached residences. Foundation information was not readily available for the 2011 PECO dataset and the statewide weights exclude PECO.
Table 4-5: Foundation Type by Statewide Weights
Foundation Type SF-Detached SF-Attached Multifamily Manufactured Statewide
Slab 2% 19% 14% 30% 7%
Enclosed Crawl 2% 6% 0% 58% 5%
Open Crawl 1% 0% 4% 12% 2%
Uncond. Basement 51% 50% 39% 0% 47%
Conditioned Basement 43% 22% 13% 0% 35%
Unit above Cond. Space 1% 3% 30% 0% 4%
Grand Total 100% 100% 100% 100% 100%
n 312 36 43 29 420 *Data does not include 2011 PECO on-site data
2,071
1,327
923
1,230
1,805
0
500
1,000
1,500
2,000
2,500
SF-Detached SF-Attached Multi-Family Manufactured Statewide
Avg
. Sq
uar
e F
ee
t

SECTION 4 Statewide Residential Findings
29
4.2.4 Demographics
Homeownership. Approximately 81% of all surveyed houses were considered to be owner-occupied. Although based on a limited number of observations (N=48), multifamily homes were predominately rented space.
Table 4-6: Own vs. Rent by Statewide Weights
Homeownership SF-Detached SF-Attached Multifamily Manufactured Statewide
Own 95% 65% 8% 90% 81%
Rent 5% 35% 92% 10% 19%
Grand Total 100% 100% 100% 100% 100%
n 356 55 48 29 488
Type of Residence. Nearly all of surveyed homes are year-round, main residences.
Table 4-7: Year Round Residences by Statewide Weights
Type SF-Detached SF-Attached Multifamily Manufactured Statewide
Year-Round 97% 97% 98% 100% 97%
n 356 55 48 29 488
Occupancy. The average year-round home occupancy was approximately 2.6 persons per household, statewide.
Table 4-8: Number of Year Round Occupants by Statewide Weights
Occupants SF-Detached SF-Attached Multifamily Manufactured Statewide
Avg. # of Occupants 2.7 2.6 1.8 2.3 2.6
Max. # of Occupants 8 5 5 5 8
Min. # of Occupants 1 1 1 1 1
n 356 55 47 29 487
4.3 BUILDING SHELL
4.3.1 Insulation
Attic Insulation. The majority of surveyed homes had some level of attic insulation present. Less than 10% of homes statewide were verified to have no attic insulation present (Less than 5% of SF-Detached housing). Surveyors were unable to verify the presence or absence of insulation in 12% of homes. This was largely the case in multifamily units where access to attic space is limited or not available. N/A refers to homes were attic insulation was not applicable.
Table 4-9: Presence of Attic Insulation by Statewide Weights
Insulation Present? SF-Detached SF-Attached Multifamily Manufactured Statewide
Yes 86% 51% 31% 77% 74%
No 5% 27% 13% 0% 9%

SECTION 4 Statewide Residential Findings
30
Insulation Present? SF-Detached SF-Attached Multifamily Manufactured Statewide
N/A 4% 4% 14% 0% 5%
Don’t Know 5% 19% 43% 23% 12%
Grand Total 100% 100% 100% 100% 100%
n 356 55 48 29 488
Attic Insulation Type. Fiberglass is the predominant form of attic insulation, when insulation is present. Fiberglass batting or loose-fill fiberglass was present in 83% of surveyed attics with insulation. Note that not all attics were verified to possess attic insulation.
Table 4-10: Type of Attic Insulation by Statewide Weights
Type SF-Detached SF-Attached Multifamily Manufactured Statewide
Cellulose Loose Fill 7% 0% 0% 1% 6%
Fiberglass Batting 53% 29% 57% 61% 51%
Fiberglass Loose 30% 62% 11% 19% 32%
Other 7% 9% 15% 0% 7%
Don't Know 2% 0% 17% 19% 3%
Grand Total 100% 100% 100% 100% 100%
n 310 32 15 22 379
Attic Insulation Thickness. The average thickness of attic insulation was 8.0 inches. The average R-value was R-24. Due to limited access to attics, particularly in multifamily units, attic insulation thickness was not able to be determined in all instances where attic insulation was present.
Table 4-11: Attic Insulation Thickness/R-Value by Statewide Weights
Thickness SF-Detached SF-Attached Multifamily Manufactured Statewide
Thickness 8.0 8.4 8.8 6.2 8.0
R-Value 24.0 24.0 30.9 19.0 24.0
n 292 31 9 16 348
For homes where attic insulation was present and insulation levels assessed, the table below indicates the proportion of insulation by R-value. 23% of homes, statewide, had less than R-19 insulation located in their attics. 15% of homes had R-38 or greater. The majority of homes (62%) had at least R-19 but less than R-38 insulation.
Table 4-12: Proportion of Attic Insulation R-Value by Statewide Weights
Attic R-value SF-Detached SF-Attached Multifamily Manufactured Statewide
R1-R12 8% 15% 3% 3% 8%
R13-R18 15% 14% 0% 30% 15%
R19-R37 62% 63% 35% 66% 62%
R38-R59 13% 1% 62% 1% 12%
R60 or above 2% 7% 0% 0% 3%

SECTION 4 Statewide Residential Findings
31
Grand Total 100% 100% 100% 100% 100%
n 292 31 8 16 347
Wall Insulation. The majority of surveyed homes had some level of wall insulation present. Statewide, 19% of homes were verified to have no wall insulation present. Surveyors were unable to verify the presence or absence of insulation in 15% of homes. N/A refers to homes were wall insulation was not applicable.
Table 4-13: Presence of Wall Insulation by Statewide Weights
Insulation Present? SF-Detached SF-Attached Multifamily Manufactured Statewide
Yes 73% 45% 35% 85% 65%
No 18% 36% 12% 0% 19%
N/A 1% 0% 0% 0% 1%
Don’t Know 9% 19% 53% 15% 15%
Grand Total 100% 100% 100% 100% 100%
n 356 55 48 29 488
Wall Insulation Type. Fiberglass batting is the predominant form of wall insulation (57%). Surveyors were not able to determine the type of insulation in 11% of instances. Note that not all homes had wall insulation present and the number of total observations outside of SF-detached homes is limited.
Table 4-14: Type of Wall Insulation by Statewide Weights
Type SF-Detached SF-Attached Multifamily Manufactured Statewide
Cellulose Loose Fill 4% 0% 0% 0% 3%
Fiberglass Batting 58% 41% 48% 81% 57%
Fiberglass Loose 11% 24% 21% 9% 13%
Other 16% 35% 16% 3% 17%
Don't Know 12% 1% 15% 6% 11%
Grand Total 100% 100% 100% 100% 100%
n 256 27 15 25 323
Wall Insulation Thickness. The average thickness of wall insulation was 4.6 inches. The average R-value was R-15. Due to limited access to wall space, particularly in multifamily units, wall insulation thickness was not able to be determined in all instances where wall insulation was present.
Table 4-15: Wall Insulation Thickness/R-Value by Statewide Weights
Thickness SF-Detached SF-Attached Multifamily Manufactured Statewide
Thickness 4.6 5.0 4.0 4.3 4.6
R-Value 14.6 14.9 12.6 13.9 14.6
n 227 25 9 20 281

SECTION 4 Statewide Residential Findings
32
For homes with wall insulation, the table below indicates the proportion of insulation by R-value. 40% of homes, statewide, had less than R-13 insulation located in their attics. An additional 23% of homes with wall insulation have between R-13 and R-18 wall insulation. 36% of homes with wall insulation exceed R-19.
Table 4-16: Proportion of Wall Insulation R-value by Statewide Weights
Wall R-value SF-Detached SF-Attached Multifamily Manufactured Statewide
R1-R12 38% 46% 56% 42% 40%
R13-R18 25% 12% 13% 32% 23%
R19-R37 34% 42% 31% 25% 34%
R38-R59 3% 0% 0% 0% 2%
Grand Total 100% 100% 100% 100% 100%
n 224 26 8 20 278
Basement Wall Insulation. Based on the results of surveyed homes with basements, 25% of homes with basements possessed some level of basement wall insulation. In order to incorporate the 2011 PECO data, the SWE team assumed all homes where basement wall insulation was N/A referred to homes without basements and were excluded from the basement wall analysis.
Table 4-17: Presence of Basement Wall Insulation by Statewide Weights
Insulation Present? SF-Detached SF-Attached Multifamily Manufactured Statewide
Yes 29% 12% 3% 0% 25%
No 69% 88% 73% 0% 72%
Don’t Know 2% 0% 24% 0% 3%
Grand Total 100% 100% 100% - 100%
n 313 34 20 0 367
Basement Wall Insulation Type. When basement wall insulation is present, fiberglass batting is the predominant form of basement wall insulation (53%). Rigid board insulation is also fairly common (27%). Note the limited number of observations available for basement wall insulation for all housing types outside of SF-Detached housing units. These limited observations restrict the level of confidence of reported statistics.
Table 4-18: Basement Wall Insulation Type by Statewide Weights
Type SF-Detached SF-Attached Multifamily Manufactured Statewide
Fiberglass Batting 53% 57% 0% 0% 53%
Fiberglass Loose 8% 0% 0% 0% 8%
Rigid Board 26% 43% 0% 0% 27%
Other 9% 0% 0% 0% 8%
Don't Know 5% 0% 100% 0% 5%
Grand Total 100% 100% 100% - 100%
n 87 5 1 0 93

SECTION 4 Statewide Residential Findings
33
Basement Wall Insulation Thickness. In surveyed homes with basement wall insulation, the average thickness of insulation is 3.8 inches. The average R-value of basement wall insulation was R13.7. Note the limited number of observations available for basement wall insulation based on both the overall number of homes with basement wall insulation present as well as surveyor ability to determine thickness and R-value in these homes. These limited observations restrict the level of confidence of reported statistics.
Table 4-19: Basement Wall Insulation Thickness/R-value by Statewide Weights
Thickness SF-Detached SF-Attached Multifamily Manufactured Statewide
Thickness 3.9 2.3 - - 3.8
R-Value 14.1 8.4 - - 13.7
n 74 5 0 0 79
Floor Insulation. Based on the results of surveyed homes, 31% of homes with basements and or crawlspaces possessed some level of floor insulation. In order to incorporate the 2011 PECO data, the SWE team assumed all homes where floor insulation was N/A referred to homes without basements and/or crawlspaces or other eligible locations for floor insulation and were excluded from this portion of the analysis.
Table 4-20: Presence of Floor Insulation by Statewide Weights
Insulation Present? SF-Detached SF-Attached Multifamily Manufactured Statewide
Yes 32% 19% 33% 58% 31%
No 66% 80% 35% 6% 64%
Don’t Know 2% 1% 32% 35% 5%
Grand Total 100% 100% 100% 100% 100%
n 342 43 24 22 431
Floor Insulation Type. Fiberglass batting is the predominant form of floor insulation (80%). Note that only a subset of the surveyed homes possesses floor insulation. As a result, the number of observations available for this metric is limited from the complete dataset.
Table 4-21: Floor Insulation Type by Statewide Weights
Type SF-Detached SF-Attached Multifamily Manufactured Statewide
Fiberglass Batting 83% 100% 38% 66% 80%
Fiberglass Loose 8% 0% 18% 0% 8%
Rigid Board 2% 0% 0% 0% 2%
Other 1% 0% 0% 0% 1%
Don't Know 6% 0% 43% 34% 10%
Grand Total 100% 100% 100% 100% 100%
n 100 7 7 15 129
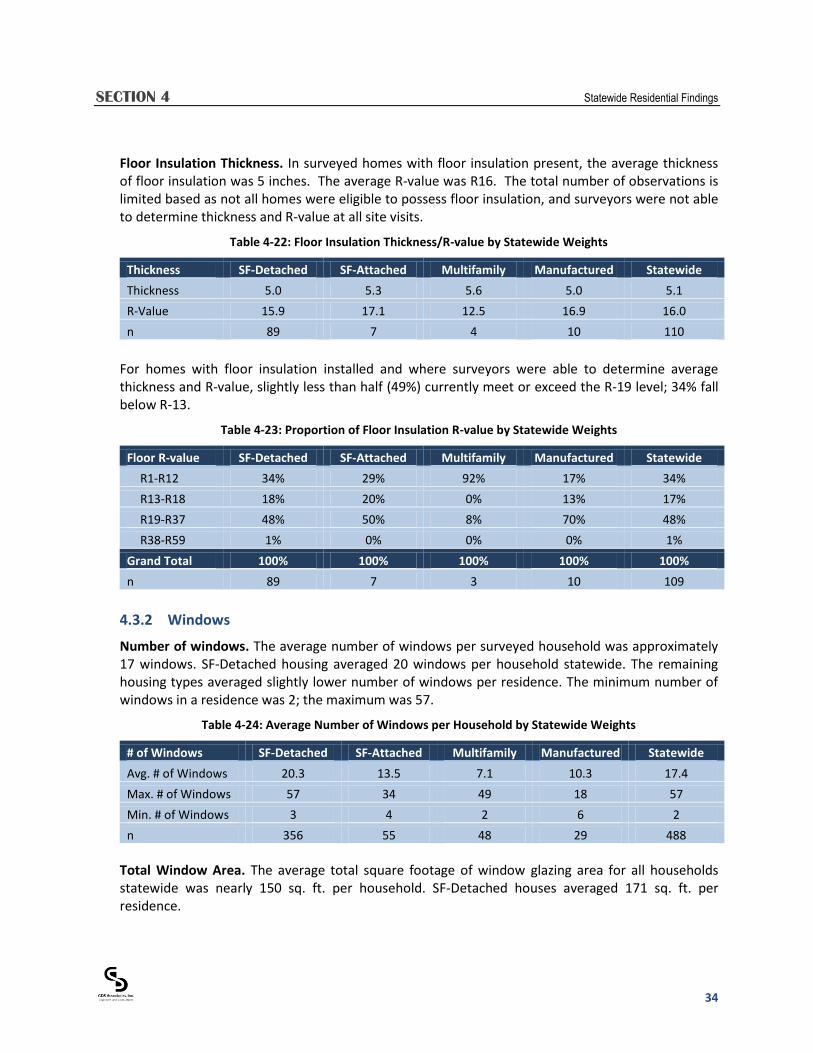
SECTION 4 Statewide Residential Findings
34
Floor Insulation Thickness. In surveyed homes with floor insulation present, the average thickness of floor insulation was 5 inches. The average R-value was R16. The total number of observations is limited based as not all homes were eligible to possess floor insulation, and surveyors were not able to determine thickness and R-value at all site visits.
Table 4-22: Floor Insulation Thickness/R-value by Statewide Weights
Thickness SF-Detached SF-Attached Multifamily Manufactured Statewide
Thickness 5.0 5.3 5.6 5.0 5.1
R-Value 15.9 17.1 12.5 16.9 16.0
n 89 7 4 10 110
For homes with floor insulation installed and where surveyors were able to determine average thickness and R-value, slightly less than half (49%) currently meet or exceed the R-19 level; 34% fall below R-13.
Table 4-23: Proportion of Floor Insulation R-value by Statewide Weights
Floor R-value SF-Detached SF-Attached Multifamily Manufactured Statewide
R1-R12 34% 29% 92% 17% 34%
R13-R18 18% 20% 0% 13% 17%
R19-R37 48% 50% 8% 70% 48%
R38-R59 1% 0% 0% 0% 1%
Grand Total 100% 100% 100% 100% 100%
n 89 7 3 10 109
4.3.2 Windows
Number of windows. The average number of windows per surveyed household was approximately 17 windows. SF-Detached housing averaged 20 windows per household statewide. The remaining housing types averaged slightly lower number of windows per residence. The minimum number of windows in a residence was 2; the maximum was 57.
Table 4-24: Average Number of Windows per Household by Statewide Weights
# of Windows SF-Detached SF-Attached Multifamily Manufactured Statewide
Avg. # of Windows 20.3 13.5 7.1 10.3 17.4
Max. # of Windows 57 34 49 18 57
Min. # of Windows 3 4 2 6 2
n 356 55 48 29 488
Total Window Area. The average total square footage of window glazing area for all households statewide was nearly 150 sq. ft. per household. SF-Detached houses averaged 171 sq. ft. per residence.

SECTION 4 Statewide Residential Findings
35
Table 4-25: Average Area of Window Glazing per Household by Statewide Weights
Avg. Window Area SF-Detached SF-Attached Multifamily Manufactured Statewide
Avg. Sq. Ft. per Home 170.8 115.1 79.0 103.8 149.9
n 356 55 48 29 488
Glazing Type. The table below describes the glazing types present at the surveyed homes. The majority of windows were double-paned. Less than 1% of windows are triple-paned across all housing types statewide. 12% of all windows are still single-paned across all housing types statewide. Where surveyors were unsure of the existence low-E coating, windows were assumed to be standard double-paned.
Table 4-26: Window Glazing Type by Statewide Weights
% of Windows SF-Detached SF-Attached Multifamily Manufactured Statewide
Single-paned 10% 18% 22% 27% 12%
Double-paned 68% 73% 68% 64% 69%
Low-E double-paned 20% 8% 10% 9% 18%
Triple-paned 1% 1% 0% 0% 1%
Grand Total 100% 100% 100% 100% 100%
n 6694 688 340 303 8025
4.3.1 Roofs
Roof Color. The majority of surveyed homes have dark roofs (73%). The remainder of surveyed homes had mostly light colored roofs, with only very small percent (2%) having white roofs. The 2011 PECO dataset did not align with the data collected by the SWE team; however, their dataset reports 81% of homes also had dark-colored roofing.
Table 4-27: Roof Color by Statewide Weights
% SF-Detached SF-Attached Multifamily Manufactured Statewide
White 1% 0% 5% 2% 2%
Light 26% 14% 26% 28% 25%
Dark 73% 86% 70% 70% 73%
Grand Total 100% 100% 100% 100% 100%
n 312 36 43 29 420
*Does not include 2011 PECO on-site data
4.3.2 Air Sealing
Air Sealing. Air Sealing was assessed qualitatively by surveyors by checking for possible areas of leakage around doors, windows, recessed cans, and other gaps in the thermal envelope. Surveyed homes were assessed as either: well-sealed, partially sealed, or poorly sealed. Less than one-quarter of surveyed homes (22%) were assessed as poorly sealed. The majority of homes (53%)

SECTION 4 Statewide Residential Findings
36
were assessed as partially sealed, with a small percent of homes (17%) assessed as well-sealed. Surveyors were unable to assess in approximately 8% of housing statewide. The 2011 PECO Baseline Study dataset did not assess air sealing specifically, and was not included in the statewide weighting.
Table 4-28: Quality of Air Sealing by Statewide Weights
% SF-Detached SF-Attached Multifamily Manufactured Statewide
Well Sealed 16% 27% 16% 16% 17%
Partially Sealed 57% 47% 39% 39% 53%
Poorly Sealed 21% 20% 31% 27% 22%
Unable to Assess 6% 5% 14% 18% 8%
Grand Total 100% 100% 100% 100% 100%
n 312 36 43 29 420
*Does not include 2011 PECO on-site data
4.3.3 Duct Sealing
Duct Location. The majority of duct work (52%) in the surveyed homes statewide was located in unconditioned space (typically basements, crawlspaces, and/or attics). 32% of ductwork was located in conditioned space or conditioned/unconditioned mix. N/A refers to homes without duct work. Responses were omitted when the surveyor was unable to confirm the location of the ductwork; the final number of observations (n) is included below.
Table 4-29: Duct Location by Statewide Weights
% SF-Detached SF-Attached Multifamily Manufactured Statewide
Cond./Uncond. Mix 16% 11% 4% 28% 14%
Conditioned Space 20% 11% 17% 17% 18%
Unconditioned Space 52% 61% 39% 43% 52%
N/A 12% 17% 40% 12% 15%
Grand Total 100% 100% 100% 100% 100%
n 332 53 34 25 444
Duct Sealing. The table below presents a qualitative assessment of duct sealing in homes with existing ductwork. Well sealed ducts refer to existing ductwork sealed with mastic or approved tape and no visible signs of air leakage around inspected HVAC joints. Well sealed refers to minimal gaps, while poorly sealed ducts were assessed when ductwork was not taped or sealed with appropriate materials or significant amounts of leakage were visible. 37% of homes with existing ductwork were assessed to be either partially or well sealed based on statewide weighting. However, an additional 30% of homes had ductwork that was unable to be assessed (i.e. unable to access duct location).

SECTION 4 Statewide Residential Findings
37
Table 4-30: Quality of Duct Sealing by Statewide Weights
% SF-Detached SF-Attached Multifamily Manufactured Statewide
Well Sealed 20% 17% 0% 7% 17%
Partially Sealed 21% 17% 21% 10% 20%
Poorly Sealed 36% 47% 14% 5% 33%
Unable to Assess 23% 19% 65% 78% 30%
Grand Total 100% 100% 100% 100% 100%
n 280 33 31 24 368
*Does not include 2011 PECO on-site data
4.4 RESIDENTIAL HVAC
This section presents details on the residential space heating and cooling systems present at the surveyed homes.
4.4.1 Equipment Saturations by Fuel/Type – Heating
Fuel Type. Natural gas was the most prominent heating fuel found in residential homes (49%) statewide. Electric and oil systems were also fairly common across housing types. The saturation of electric primary heating systems was approximately 21% of all households. The remaining space heating fuel types include coal, propane, wood, etc.
Table 4-31: Fuel Type of Primary Space Heating Systems by Statewide Weights
Fuel Type SF-Detached SF-Attached Multifamily Manufactured Statewide
Natural Gas 49% 59% 49% 11% 49%
Electric 19% 21% 41% 8% 21%
Oil 20% 20% 9% 21% 19%
Coal 2% 0% 0% 0% 1%
Dual Fuel 3% 0% 0% 0% 2%
Kerosene 0% 0% 0% 11% 1%
Propane 3% 0% 1% 49% 4%
Wood 5% 0% 0% 0% 3%
Grand Total 100% 100% 100% 100% 100%
n 353 53 44 29 479
Backup Systems. The saturation of homes with at least one back-up heating system is 27% of households statewide. Across housing types, SF-Detached houses are the most likely to have back-up systems (34%). The tables below also present the fuel type of backup heating systems. However, note the small sample size in all housing types outside of SF-Detached. These limited observations do not meet a reasonable level of statistical confidence.

SECTION 4 Statewide Residential Findings
38
Table 4-32: Homes with Back-Up Heating Systems by Statewide Weights
Back-Up Heating SF-Detached SF-Attached Multifamily Manufactured Statewide
% of Homes 34% 17% 6% 8% 27%
n 356 55 48 29 488
Table 4-33: Fuel Type of Secondary Space Heating Systems by Statewide Weights
Fuel Type SF-Detached SF-Attached Multifamily Manufactured Statewide
Natural Gas 18% 0% 0% 0% 16%
Electric 51% 62% 100% 50% 53%
Oil 6% 16% 0% 0% 6%
Coal 2% 0% 0% 0% 2%
Dual Fuel 1% 0% 0% 0% 1%
Propane 5% 0% 0% 0% 4%
Wood 17% 22% 0% 50% 17%
Other 1% 0% 0% 0% 0%
Grand Total 100% 100% 100% 100% 100%
n 107 6 2 2 117
Primary System Type. 54% of primary heating systems are central furnaces regardless of fuel type. The next most common systems are boilers and heat pump systems.
Table 4-34: System Type of Primary Space Heating Systems by Statewide Weights
System Type SF-Detached SF-Attached Multifamily Manufactured Statewide
Central Furnaces 53% 62% 35% 90% 54%
Boilers 20% 26% 26% 6% 21%
Heat Pumps 12% 5% 13% 0% 11%
Baseboard 7% 0% 16% 2% 7%
Other 1% 0% 5% 0% 1%
Space Heaters 1% 7% 5% 2% 2%
Stoves 6% 0% 0% 0% 4%
Grand Total 100% 100% 100% 100% 100%
n 351 52 40 29 472
Primary Electric Heating System Type. Air Source Heat Pumps are the most common form of primary electric and dual-fuel heating systems (43%). Although there are only a limited number of types of primary electric heating systems, these system types are shown below. Heat Pumps are the most common form of electric heating equipment across SF-Detached housing, followed by base baseboard heating and furnaces.

SECTION 4 Statewide Residential Findings
39
Table 4-35: System Type of Primary Electric Heating Systems by Statewide Weights
System Type SF-Detached SF-Attached Multifamily Manufactured Statewide
Air Source Heat Pump 50% 28% 30% 0% 43%
Baseboard 32% 0% 35% 27% 28%
Furnace 9% 50% 15% 73% 16%
Geothermal Heat Pump 8% 0% 0% 0% 5%
Wall Mounted Space 1% 23% 12% 0% 6%
Boilers 1% 0% 0% 0% 0%
Other 0% 0% 8% 0% 2%
Grand Total 100% 100% 100% 100% 100%
n 71 6 17 3 97
Secondary System Type. Baseboard systems and central furnaces are also common secondary heating systems. Heat Pumps, space heaters, and wood/coal stove heating are also common forms of back-up heating systems statewide and across housing types. Due to the small number of homes with back-up space heating, the number of observations for this data is limited for data outside of SF-Detached homes. These limited observations do not meet a reasonable level of statistical confidence.
Table 4-36: System Type of Secondary Space Heating Systems by Statewide Weights
System Type SF-Detached SF-Attached Multifamily Manufactured Statewide
Baseboard 22% 20% 100% 0% 23%
Central Furnaces 22% 16% 0% 0% 21%
Stoves 19% 22% 0% 50% 19%
Heat Pumps 18% 0% 0% 50% 16%
Space Heaters 12% 42% 0% 0% 14%
Boilers 4% 0% 0% 0% 3%
Other 4% 0% 0% 0% 3%
Grand Total 100% 100% 100% 100% 100%
n 108 6 2 2 118
4.4.2 Equipment Saturations by Type – Cooling
Penetration of Central Air Conditioning (AC) Systems. Statewide, 63% of households have at least one central air conditioning unit (includes heat pumps, and mini-split systems). Across housing types, the penetration of central air conditioning units is fairly stable, with only multifamily units having a lower percent (40%). Of homes with central AC systems, a relatively small number of SF-Detached homes had more than one system.
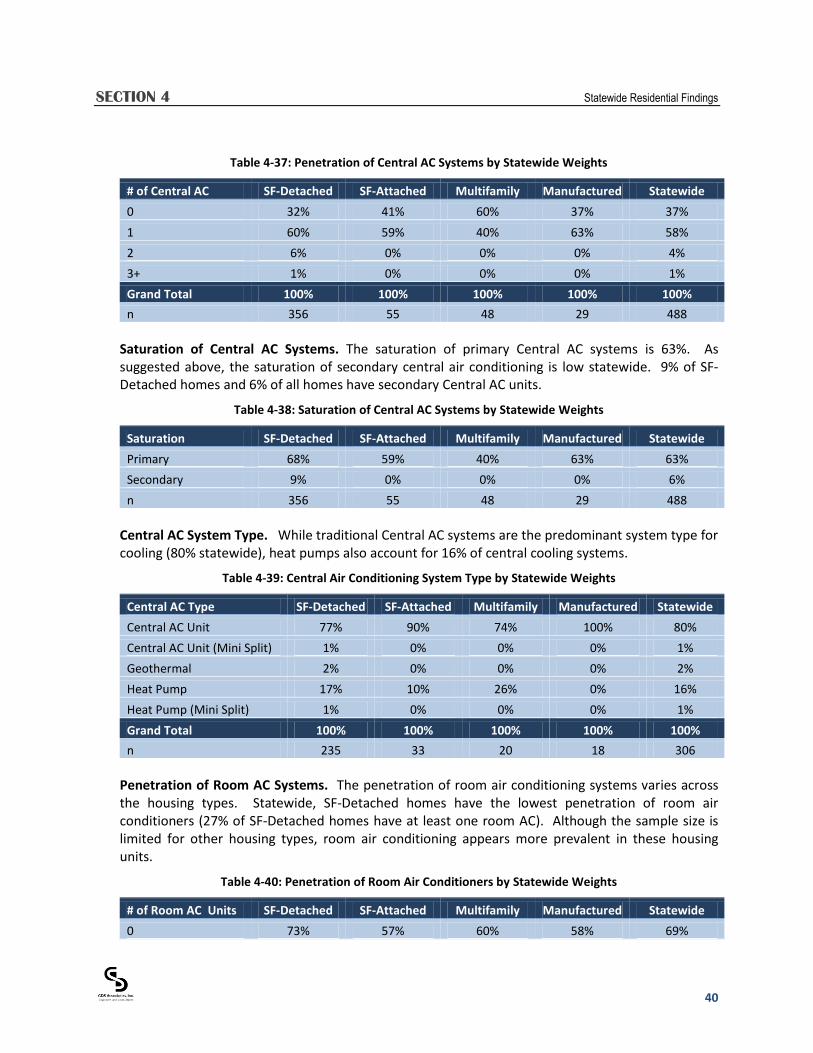
SECTION 4 Statewide Residential Findings
40
Table 4-37: Penetration of Central AC Systems by Statewide Weights
# of Central AC SF-Detached SF-Attached Multifamily Manufactured Statewide
0 32% 41% 60% 37% 37%
1 60% 59% 40% 63% 58%
2 6% 0% 0% 0% 4%
3+ 1% 0% 0% 0% 1%
Grand Total 100% 100% 100% 100% 100%
n 356 55 48 29 488
Saturation of Central AC Systems. The saturation of primary Central AC systems is 63%. As suggested above, the saturation of secondary central air conditioning is low statewide. 9% of SF-Detached homes and 6% of all homes have secondary Central AC units.
Table 4-38: Saturation of Central AC Systems by Statewide Weights
Saturation SF-Detached SF-Attached Multifamily Manufactured Statewide
Primary 68% 59% 40% 63% 63%
Secondary 9% 0% 0% 0% 6%
n 356 55 48 29 488
Central AC System Type. While traditional Central AC systems are the predominant system type for cooling (80% statewide), heat pumps also account for 16% of central cooling systems.
Table 4-39: Central Air Conditioning System Type by Statewide Weights
Central AC Type SF-Detached SF-Attached Multifamily Manufactured Statewide
Central AC Unit 77% 90% 74% 100% 80%
Central AC Unit (Mini Split) 1% 0% 0% 0% 1%
Geothermal 2% 0% 0% 0% 2%
Heat Pump 17% 10% 26% 0% 16%
Heat Pump (Mini Split) 1% 0% 0% 0% 1%
Grand Total 100% 100% 100% 100% 100%
n 235 33 20 18 306
Penetration of Room AC Systems. The penetration of room air conditioning systems varies across the housing types. Statewide, SF-Detached homes have the lowest penetration of room air conditioners (27% of SF-Detached homes have at least one room AC). Although the sample size is limited for other housing types, room air conditioning appears more prevalent in these housing units.
Table 4-40: Penetration of Room Air Conditioners by Statewide Weights
# of Room AC Units SF-Detached SF-Attached Multifamily Manufactured Statewide
0 73% 57% 60% 58% 69%

SECTION 4 Statewide Residential Findings
41
# of Room AC Units SF-Detached SF-Attached Multifamily Manufactured Statewide
1 11% 13% 10% 17% 11%
2 9% 23% 28% 13% 13%
3+ 7% 7% 2% 11% 7%
Grand Total 100% 100% 100% 100% 100%
n 356 55 48 29 488
Saturation of Room AC Systems. As suggested above, the overall saturation for room air conditioning is lowest in SF-Detached housing. Statewide, the saturation of room air conditioners is 59%.
Table 4-41: Saturation of Room Air Conditioners by Statewide Weights
Saturation SF-Detached SF-Attached Multifamily Manufactured Statewide
Room ACs 50% 81% 79% 78% 59%
n 356 55 48 29 488
4.4.3 Efficiency Levels
Central AC SEER Rating. The Central AC energy efficiency level was infrequently provided on the equipment, but where the make and model was available the SWE team recorded and researched manufacturer data. A large portion of Central AC systems were found to currently have a SEER rating below current federal minimum standards (SEER 13). Only 5% of all Central AC systems (including heat pumps, geothermal and mini split systems statewide were found to currently meet ENERGY STAR criteria of 14.5 SEER or better.
Table 4-42: Central AC System SEER Ratings by Statewide Weights
SEER Rating SF-Detached SF-Attached Multifamily Manufactured Statewide
Below 13 32% 28% 41% 23% 32%
13 20% 28% 6% 28% 20%
14 9% 9% 6% 0% 9%
14.5 or above 6% 1% 0% 0% 5%
Don't Know 32% 34% 47% 49% 34%
Grand Total 100% 100% 100% 100% 100%
n 235 33 20 18 306
This table includes the Central AC systems where the SEER rating was unable to be determined. It is probable that a majority of these unknown systems are currently at or below the current minimum standard as manufacturer data was often unavailable for older systems. Additionally, although this data includes the 2011 PECO dataset, the SWE team did not verify equipment efficiency against make/model data for the PECO dataset. Efficiency levels were unknown in nearly 70% of the PECO dataset. Finally, note that the sample size is limited for Central AC systems across housing types currently utilizing Central AC systems for cooling needs.

SECTION 4 Statewide Residential Findings
42
ENERGY STAR Room Air Conditioners. 21% of room air conditioners were ENERGY STAR rated statewide. The SWE team documentation of ENERGY STAR Room ACs was based on the ability to visually detect the label or determine that a particular model was ENERGY STAR rated by searching for the make and model number on the ENERGY STAR website or manufacturer data. The number of room air conditioners with make/model number detail available is listed to demonstrate the limited sample size associated with this metric for housing types other than SF-Detached.
Table 4-43: ENERGY STAR Room Air Conditioners by Statewide Weights
ENERGY STAR Room AC SF-Detached SF-Attached Multifamily Manufactured Statewide
Yes 23% 22% 20% 4% 21%
No 77% 78% 80% 96% 79%
Grand Total 100% 100% 100% 100% 100%
n 172 32 32 17 253
Programmable Thermostats. Roughly 59% of Central AC systems statewide had a programmable
thermostat installed. Homes without central AC systems were not included in this metric.
Table 4-44: Programmable Thermostats by Statewide Weights
Prog. Thermostat SF-Detached SF-Attached Multifamily Manufactured Statewide
Yes 58% 81% 31% 56% 59%
No 42% 19% 69% 44% 41%
Grand Total 100% 100% 100% 100% 100%
n 235 33 20 18 306
4.4.4 Other
Heating System Age. The average heating system is 14 years old. System age is fairly consistent across housing types.17
Table 4-45: Average Heating System Age by Statewide Weights
Avg. Age SF-Detached SF-Attached Multifamily Manufactured Statewide
Years 13.2 15.1 16.4 13.9 13.7
n 444 57 38 31 570
Heating Maintenance. The majority of homeowners reported that they had recently (within the last year) had a seasonal tune-up performed on their heating systems. However, an additional 23% statewide reported they had never had a seasonal tune-up performed on their heating systems.
Table 4-46: Time since Last Seasonal Tune-Up (Heating Systems) by Statewide Weights
Last Tune Up? SF-Detached SF-Attached Multifamily Manufactured Statewide
Equipment is < 1 year old 1% 0% 0% 7% 1%
17 Equipment age for HVAC units, and other major appliances, was typically reported by the homeowner.

SECTION 4 Statewide Residential Findings
43
Last Tune Up? SF-Detached SF-Attached Multifamily Manufactured Statewide
Less than 1 year 50% 43% 54% 40% 49%
1-2 years 16% 14% 9% 34% 16%
More than 2 years 11% 13% 10% 7% 11%
Never 21% 29% 27% 12% 23%
Grand Total 100% 100% 100% 100% 100%
n 330 51 35 27 443
Heating System Set-Points. The average heating set point while homeowners were home and
awake is 68F. While asleep and/or away from home, homeowners generally reduced their heating set point. The 2011 PECO dataset is not represented in these tables as a result of different data collection methods related to heating system temperature set points.
Table 4-47: Heating System Temperature Set Points by Statewide Weights
Heating Set Points SF-Detached SF-Attached Multifamily Manufactured Statewide
Awake 68 69 67 69 68
Asleep 67 67 66 68 67
Away 63 62 64 66 64
n 286 35 37 25 383
*Does not include 2011 PECO on-site data
Central AC System Age. The average cooling system is 10 years old.
Table 4-48: Average Central AC System Age by Statewide Weights
Avg. Age SF-Detached SF-Attached Multifamily Manufactured Statewide
Years 9.8 14.5 7.3 9.4 10.2
n 252 35 16 17 320
The table below presents the age range of central AC systems surveyed statewide. Overall, 40% of current systems are more than 10 years old, while roughly one-quarter are estimated to be 3 years old or less.
Table 4-49: Central AC System Age Range by Statewide Weights
Central AC Age SF-Detached SF-Attached Multifamily Manufactured Statewide
0-3 Years 26% 18% 20% 26% 24%
3-10 Years 35% 31% 56% 25% 35%
11-15 Years 21% 21% 18% 33% 21%
16 Years or Older 18% 30% 7% 16% 19%
Grand Total 100% 100% 100% 100% 100%
n 252 35 16 17 320

SECTION 4 Statewide Residential Findings
44
AC System Maintenance. The majority of homeowners reported that they had recently (within the last year) had a seasonal tune-up performed on their AC system. Similar to heating seasonal tune-ups, roughly 22% of households statewide reported they had never had a seasonal tune-up performed on their AC systems.
Table 4-50: Time since Last Seasonal Tune-Up (Cooling Systems) by Statewide Weights
Last Tune Up? SF-Detached SF-Attached Multifamily Manufactured Statewide
Equipment is < 1 year old 2% 0% 0% 0% 2%
Less than 1 year 48% 27% 65% 21% 45%
1-2 years 14% 31% 9% 32% 16%
More than 2 years 14% 17% 21% 18% 15%
Never 23% 26% 5% 29% 22%
Grand Total 100% 100% 100% 100% 100%
n 232 35 18 18 303
Cooling System Set-Points. The average cooling set point while homeowners were home was 73F with no discernible difference between awake and asleep temperature. While away from home, homeowners generally raised their thermostat to reduce cooling times. The 2011 PECO dataset is not represented in these tables as a result of different data collection methods related to heating system temperature set points.
Table 4-51: Cooling System Temperature Set Points by Statewide Weights
Cooling Set Points SF-Detached SF-Attached Multifamily Manufactured Statewide
Awake 73 74 74 71 73
Asleep 73 73 74 71 73
Away 77 78 77 72 77
n 182 25 17 16 240
*Does not include 2011 PECO on-site data
4.5 LIGHTING
This section presents details on the lighting equipment used in the surveyed residential sites.
4.5.1 Sockets per Home
Interior Sockets per Home. The average number of interior lighting sockets per home is 54 total sockets. These include all Edison-base, candelabra; pin-based and empty sockets found in homes and conditioned spaces. Exterior lighting is not included in this socket count. SF-Detached homes averaged 63 sockets statewide, with fewer sockets across the remaining housing types.
Table 4-52: Number of Interior Sockets per Home by Statewide Weights
Number of Sockets SF-Detached SF-Attached Multifamily Manufactured Statewide
Average per Home 63 37 25 31 54

SECTION 4 Statewide Residential Findings
45
Number of Sockets SF-Detached SF-Attached Multifamily Manufactured Statewide
n 356 55 48 29 488
Adjusted Interior Sockets per Home. After accounting for empty lighting sockets, tube fluorescent
lighting, specialty sockets (i.e. neon lights, xenon, zircon gas), and pin-based halogen bulbs, the total
number of sockets per home reduces to an average of 45 sockets per home statewide. This socket
count aims to represent the total number of sockets eligible for CFL placement by removing sockets
where CFL bulbs cannot easily be retrofitted.
Table 4-53: Adjusted Number of Interior Sockets per Home by Statewide Weights
Number of Sockets SF-Detached SF-Attached Multifamily Manufactured Statewide
Average per Home 52 31 21 29 45
n 356 55 48 29 488
Note that this count represents all sockets where CFL could reasonably be placed, and includes those sockets where daily use is relatively low (i.e. less 3 hours per day), such as closets, utility closets, garages, and other areas. Exterior Sockets per Home. The average number of exterior lighting sockets per home is 6 sockets.
Table 4-54: Exterior Sockets per Home by Statewide Weights
Number of Sockets SF-Detached SF-Attached Multifamily Manufactured Statewide
Average per Home 8 2 2 4 6
n 304 36 29 23 392
4.5.2 Bulb Type
Penetrations by Interior Bulb Type. The table below presents the penetration of interior lighting by bulb type. Nearly all homes have incandescent lighting. At least one compact fluorescent light (CFL) bulb can be found in 83% of residences. Tube fluorescent lighting is found in approximately three-fourths of most residences. Halogen bulbs are found in 35% of all residences statewide. LED bulbs are currently found in less than 10% of all homes. Other bulbs include empty sockets with no bulbs present.
Table 4-55: Penetration of Lighting by Interior Bulb Type by Statewide Weights
Bulb Type (Penetration) SF-Detached SF-Attached Multifamily Manufactured Statewide
CFL 83% 87% 76% 78% 83%
Halogen 38% 31% 28% 7% 35%
Incandescent 99% 100% 100% 100% 99%
LED 7% 15% 9% 7% 9%
Tube Fluorescent 77% 68% 46% 37% 71%
Other 21% 7% 14% 22% 18%
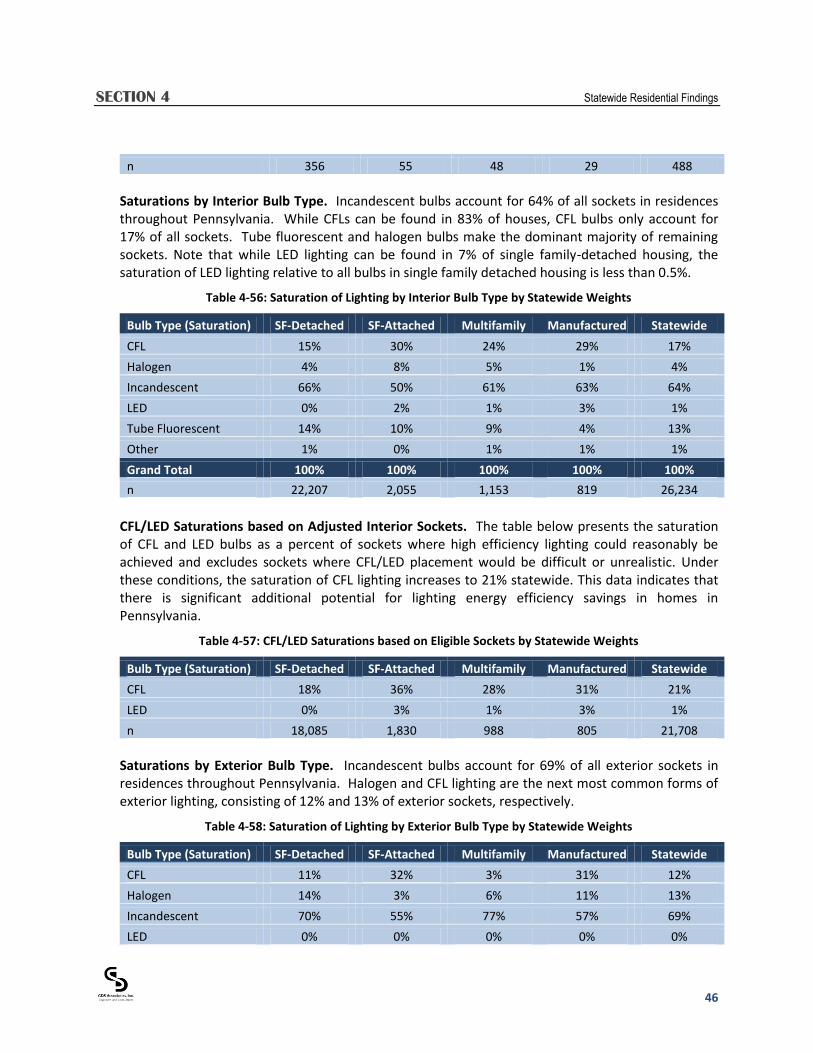
SECTION 4 Statewide Residential Findings
46
n 356 55 48 29 488
Saturations by Interior Bulb Type. Incandescent bulbs account for 64% of all sockets in residences throughout Pennsylvania. While CFLs can be found in 83% of houses, CFL bulbs only account for 17% of all sockets. Tube fluorescent and halogen bulbs make the dominant majority of remaining sockets. Note that while LED lighting can be found in 7% of single family-detached housing, the saturation of LED lighting relative to all bulbs in single family detached housing is less than 0.5%.
Table 4-56: Saturation of Lighting by Interior Bulb Type by Statewide Weights
Bulb Type (Saturation) SF-Detached SF-Attached Multifamily Manufactured Statewide
CFL 15% 30% 24% 29% 17%
Halogen 4% 8% 5% 1% 4%
Incandescent 66% 50% 61% 63% 64%
LED 0% 2% 1% 3% 1%
Tube Fluorescent 14% 10% 9% 4% 13%
Other 1% 0% 1% 1% 1%
Grand Total 100% 100% 100% 100% 100%
n 22,207 2,055 1,153 819 26,234
CFL/LED Saturations based on Adjusted Interior Sockets. The table below presents the saturation of CFL and LED bulbs as a percent of sockets where high efficiency lighting could reasonably be achieved and excludes sockets where CFL/LED placement would be difficult or unrealistic. Under these conditions, the saturation of CFL lighting increases to 21% statewide. This data indicates that there is significant additional potential for lighting energy efficiency savings in homes in Pennsylvania.
Table 4-57: CFL/LED Saturations based on Eligible Sockets by Statewide Weights
Bulb Type (Saturation) SF-Detached SF-Attached Multifamily Manufactured Statewide
CFL 18% 36% 28% 31% 21%
LED 0% 3% 1% 3% 1%
n 18,085 1,830 988 805 21,708
Saturations by Exterior Bulb Type. Incandescent bulbs account for 69% of all exterior sockets in residences throughout Pennsylvania. Halogen and CFL lighting are the next most common forms of exterior lighting, consisting of 12% and 13% of exterior sockets, respectively.
Table 4-58: Saturation of Lighting by Exterior Bulb Type by Statewide Weights
Bulb Type (Saturation) SF-Detached SF-Attached Multifamily Manufactured Statewide
CFL 11% 32% 3% 31% 12%
Halogen 14% 3% 6% 11% 13%
Incandescent 70% 55% 77% 57% 69%
LED 0% 0% 0% 0% 0%

SECTION 4 Statewide Residential Findings
47
Bulb Type (Saturation) SF-Detached SF-Attached Multifamily Manufactured Statewide
Tube Fluorescent 3% 9% 13% 0% 3%
Other 2% 0% 2% 0% 2%
Grand Total 100% 100% 100% 100% 100%
n 2,261 92 60 84 2,497
Average Wattage by Interior Bulb Type. The table below presents the average wattage of interior lighting by bulb type. The average wattage of incandescent bulbs was 55W, suggesting a heavier mix of 40W and 60W bulbs than 75W to 100W bulbs in interior sockets. The average wattage of CFL bulbs was 16W. The number of observations listed refers to CFL bulbs only. There were significantly greater numbers of incandescent bulbs statewide, and significantly less halogen and LED bulbs.
Table 4-59: Average Wattage by Bulb Type by Statewide Weights
Avg. Wattage SF-Detached SF-Attached Multifamily Manufactured Statewide
CFL 17 15 16 16 16
Halogen 51 38 38 49 47
Incandescent 55 56 55 49 55
LED 14 4 8 13 9
Tube Fluorescent 42 36 35 36 41
n (for CFL Wattage) 3,149 427 232 281 4,089
4.5.3 Lighting Saturations by Room
Socket by Room Type. Statewide, the majority of lighting was found in bedrooms, followed closely by other high and medium use areas such as bathrooms, basements, kitchens, and living rooms. Closets, garages, and other rooms (i.e. attics, storage, etc.) are common low daily use areas, and represent 12% of interior sockets.
Table 4-60: Interior Socket Saturation by Room Type by Statewide Weights
Avg. Wattage SF-Detached SF-Attached Multifamily Manufactured Statewide
Basement 16% 12% 6% 0% 14%
Bathroom 14% 14% 18% 19% 14%
Bedroom 17% 20% 22% 23% 17%
Closet 3% 3% 2% 3% 3%
Dining Room 7% 7% 5% 4% 7%
Foyer/Hallway 8% 8% 6% 5% 8%
Garage 6% 1% 0% 2% 5%
Kitchen 12% 15% 17% 13% 12%
Living Room 11% 16% 20% 19% 12%
Office/Den 4% 3% 4% 4% 4%
Other 4% 2% 1% 8% 4%
Grand Total 100% 100% 100% 100% 100%

SECTION 4 Statewide Residential Findings
48
Avg. Wattage SF-Detached SF-Attached Multifamily Manufactured Statewide
n 22,207 2,055 1,153 819 26,234
4.6 DOMESTIC WATER HEATING
4.6.1 Equipment Saturations by Fuel/Type
Water Heating Fuel Type. Natural gas is the most prevalent fuel source for water heating purposes across all housing types and statewide. Electric water heating is also common, found in 43% of housing statewide. Oil water heating is a distant third, found in only 8% of surveyed houses statewide. Solar water heating and wood water heating was found in less than 1% of surveyed households.
Table 4-61: Water Heating Fuel Type by Statewide Weights
Fuel Type SF-Detached SF-Attached Multifamily Manufactured Statewide
Natural Gas 48% 63% 49% 0% 48%
Electric 42% 31% 44% 94% 43%
Oil 9% 6% 7% 5% 8%
Propane 1% 0% 0% 0% 1%
Solar 0% 0% 0% 0% 0%
Wood 0% 0% 0% 0% 0%
Grand Total 100% 100% 100% 100% 100%
n 369 53 41 29 492
Water Heating System Type. Of electric water heaters, the large majority (96%) are traditional storage tank water heaters. Approximately 2% of electric water heaters are considered heat pump water heaters. Note that the number of observations shown below is limited only to those surveyed residences with electric water heating.
Table 4-62: Electric Water Heating System Type by Statewide Weights
System Type SF-Detached SF-Attached Multifamily Manufactured Statewide
Stand Alone Tank 97% 94% 100% 93% 96%
Heat Pump WH 2% 6% 0% 0% 2%
Tankless (On Demand) 1% 0% 0% 0% 0%
Don’t Know 0% 0% 0% 7% 1%
Grand Total 100% 100% 100% 100% 100%
n 147 15 19 26 207
Water Heating Age. Statewide, the average age of electric water heater surveyed statewide is 7.4
years. The number of observations is limited only to those surveyed residences with electric water
heating.

SECTION 4 Statewide Residential Findings
49
Table 4-63: Water Heater Age by EDC
Avg. Age SF-Detached SF-Attached Multifamily Manufactured Statewide
Years 7.8 4.9 6.9 6.6 7.4
n 143.0 13.0 17.0 26.0 199.0
Tank Temperature. The average electric water heater tank temperature set point statewide was
found to be 123F. The number of observations is limited only to those surveyed residences with electric water heating.
Table 4-64: Water Heater Tank Temperature by EDC
Tank Temp. SF-Detached SF-Attached Multifamily Manufactured Statewide
Degrees (F) 124 120 121 121 123
n 140 14 18 26 198
4.6.2 Water Heater Energy Efficiency Levels
Energy Factor. The water heater energy efficiency level was infrequently provided on the name plate, but where the make and model were available the SWE team recorded and researched manufacturer data. The table below presents the percent of water heating systems that do not currently meet the federal standard (units below EF=.90), as well as units that could be considered energy efficient (EF=.93 or above). The efficiency of approximately 1/3 of all electric water heating units statewide could not be determined through make/model look up. These units were retained in the overall analysis because an assumption could be made that these undetermined units were likely to be older units and more likely to be below the current energy efficient threshold. Electric water heater manufacturer efficiency was not readily available in homes surveyed for the 2011 PECO baseline study and were excluded from the statewide weighting. Note the small sample sizes in all housing types outside of SF-Detached homes.
Table 4-65: Electric Water Heater Efficiency by Statewide Weights
Energy Factor (EF) SF-Detached SF-Attached Multifamily Manufactured Statewide
Below .90 12% 0% 0% 0% 9%
.90 - .92 45% 49% 52% 47% 46%
.93 or above 12% 18% 0% 16% 12%
Don't Know 30% 33% 48% 37% 33%
Grand Total 100% 100% 100% 100% 100%
n 131 12 17 26 186
*Does not include 2011 PECO on-site data
Pipe Wrap. 20% of electric water heaters surveyed were found to have pipe wrap located on pipes near the water heater. Note the number of observations is limited only to those surveyed residences with electric water heating.

SECTION 4 Statewide Residential Findings
50
Table 4-66: Electric Water Heater Pipe Wrap by Statewide Weights
Pipe Wrap SF-Detached SF-Attached Multifamily Manufactured Statewide
Yes 24% 16% 2% 11% 20%
No 76% 84% 98% 89% 80%
Grand Total 100% 100% 100% 100% 100%
n 146 14 17 22 199
Water Heater Blanket. Tank wrap was found on less than 8% of electric water heating units surveyed. Note the number of observations is limited only to those surveyed residences with electric water heating.
Table 4-67: Electric Water Heater Blankets by Statewide Weights
Tank Wrap SF-Detached SF-Attached Multifamily Manufactured Statewide
Yes 9% 14% 2% 0% 8%
No 91% 86% 98% 100% 92%
Grand Total 100% 100% 100% 100% 100%
n 146 14 17 22 199
4.6.3 Other
Water efficiency measures aid in energy conservation by reducing hot water usage, and subsequently reducing the overall energy needed to heat water. The most typical water heating efficiency measures are low-flow showerheads and faucet aerators. Faucet Aerators. Statewide, homes have an average of 3.8 sinks per home. As indicated by the saturations, homes average 2.9 faucet aerators. Overall 77% of all sinks in the surveyed homes were equipped with low flow faucet aerators.
Table 4-68: Sinks and Faucet Aerators by Statewide Weights
Faucet Aerators SF-Detached SF-Attached Multifamily Manufactured Statewide
Avg. # of Faucets 4.0 4.5 2.7 2.0 3.8
Avg. # Low Flow 3.0 3.5 2.1 1.7 2.9
% Low Flow 77% 80% 79% 87% 77%
n 356 55 48 29 488
Showerheads. On average, homes have 1.6 showerheads per home statewide. Low flow showerheads were found on 72% of all showerheads.
Table 4-69: Showers and Low Flow Showerheads by Statewide Weights
Showerheads SF-Detached SF-Attached Multifamily Manufactured Statewide
Avg. # of Showers 1.7 1.8 1.3 1.2 1.6
Avg. # Low Flow 1.2 1.4 0.7 0.9 1.2
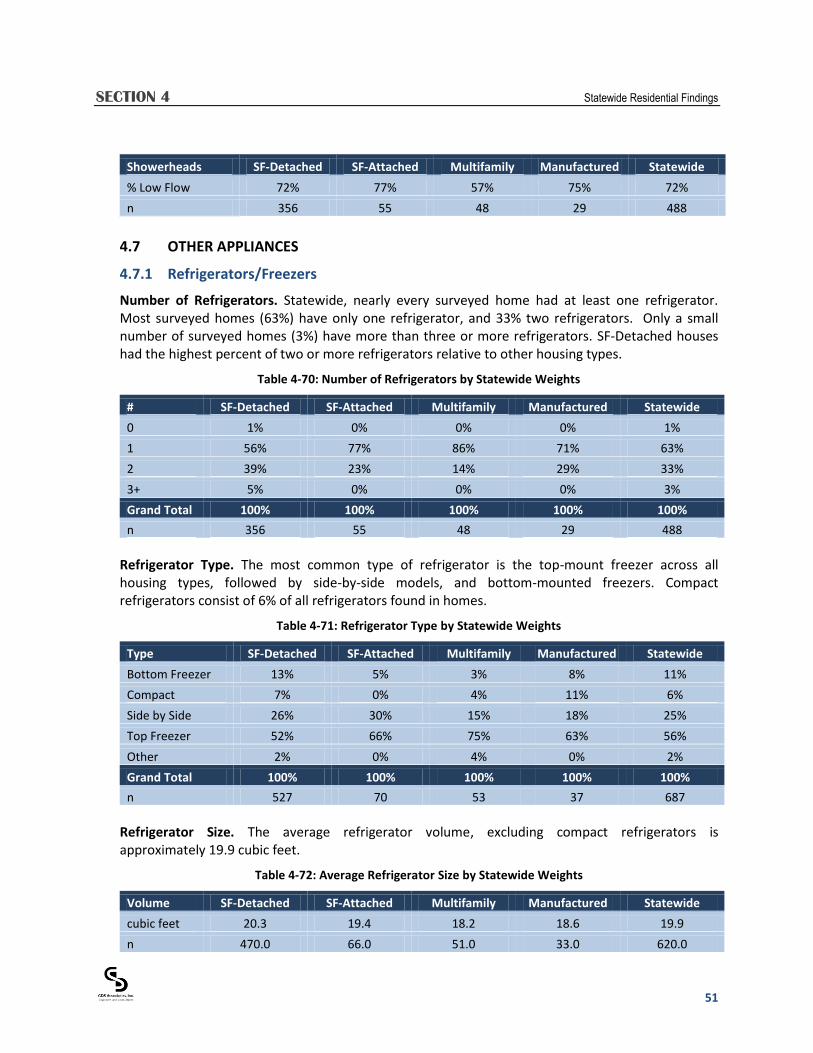
SECTION 4 Statewide Residential Findings
51
Showerheads SF-Detached SF-Attached Multifamily Manufactured Statewide
% Low Flow 72% 77% 57% 75% 72%
n 356 55 48 29 488
4.7 OTHER APPLIANCES
4.7.1 Refrigerators/Freezers
Number of Refrigerators. Statewide, nearly every surveyed home had at least one refrigerator. Most surveyed homes (63%) have only one refrigerator, and 33% two refrigerators. Only a small number of surveyed homes (3%) have more than three or more refrigerators. SF-Detached houses had the highest percent of two or more refrigerators relative to other housing types.
Table 4-70: Number of Refrigerators by Statewide Weights
# SF-Detached SF-Attached Multifamily Manufactured Statewide
0 1% 0% 0% 0% 1%
1 56% 77% 86% 71% 63%
2 39% 23% 14% 29% 33%
3+ 5% 0% 0% 0% 3%
Grand Total 100% 100% 100% 100% 100%
n 356 55 48 29 488
Refrigerator Type. The most common type of refrigerator is the top-mount freezer across all housing types, followed by side-by-side models, and bottom-mounted freezers. Compact refrigerators consist of 6% of all refrigerators found in homes.
Table 4-71: Refrigerator Type by Statewide Weights
Type SF-Detached SF-Attached Multifamily Manufactured Statewide
Bottom Freezer 13% 5% 3% 8% 11%
Compact 7% 0% 4% 11% 6%
Side by Side 26% 30% 15% 18% 25%
Top Freezer 52% 66% 75% 63% 56%
Other 2% 0% 4% 0% 2%
Grand Total 100% 100% 100% 100% 100%
n 527 70 53 37 687
Refrigerator Size. The average refrigerator volume, excluding compact refrigerators is approximately 19.9 cubic feet.
Table 4-72: Average Refrigerator Size by Statewide Weights
Volume SF-Detached SF-Attached Multifamily Manufactured Statewide
cubic feet 20.3 19.4 18.2 18.6 19.9
n 470.0 66.0 51.0 33.0 620.0
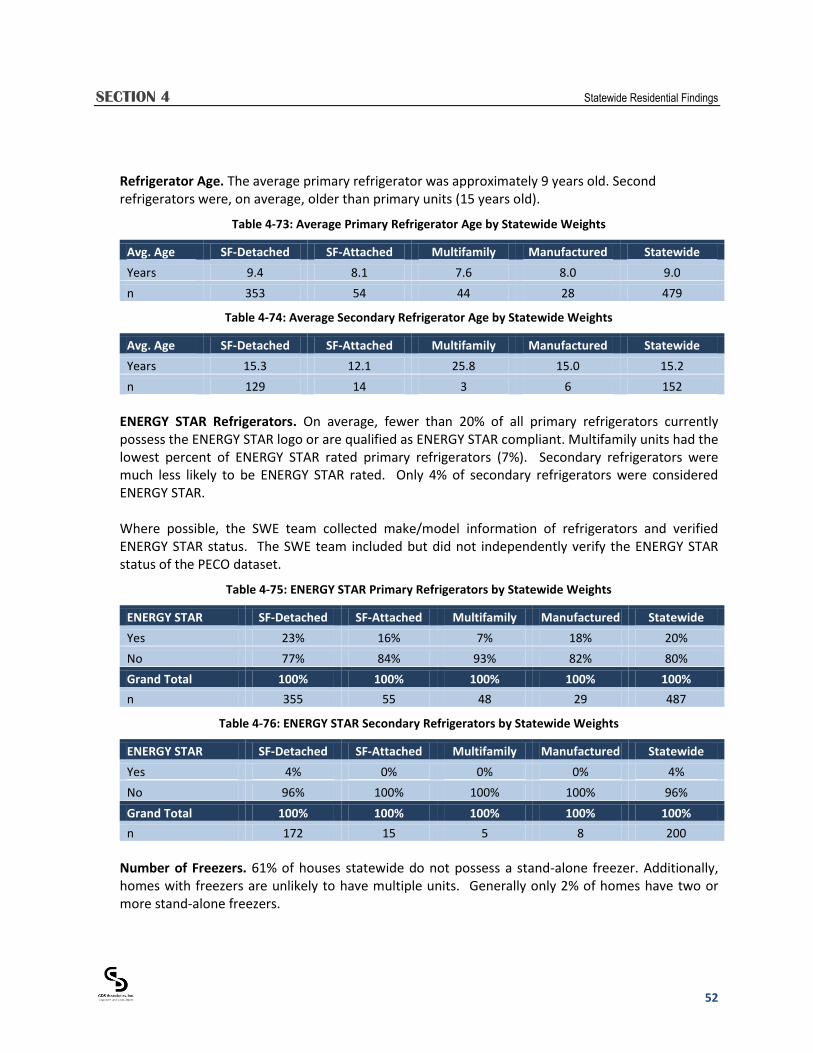
SECTION 4 Statewide Residential Findings
52
Refrigerator Age. The average primary refrigerator was approximately 9 years old. Second refrigerators were, on average, older than primary units (15 years old).
Table 4-73: Average Primary Refrigerator Age by Statewide Weights
Avg. Age SF-Detached SF-Attached Multifamily Manufactured Statewide
Years 9.4 8.1 7.6 8.0 9.0
n 353 54 44 28 479
Table 4-74: Average Secondary Refrigerator Age by Statewide Weights
Avg. Age SF-Detached SF-Attached Multifamily Manufactured Statewide
Years 15.3 12.1 25.8 15.0 15.2
n 129 14 3 6 152
ENERGY STAR Refrigerators. On average, fewer than 20% of all primary refrigerators currently possess the ENERGY STAR logo or are qualified as ENERGY STAR compliant. Multifamily units had the lowest percent of ENERGY STAR rated primary refrigerators (7%). Secondary refrigerators were much less likely to be ENERGY STAR rated. Only 4% of secondary refrigerators were considered ENERGY STAR. Where possible, the SWE team collected make/model information of refrigerators and verified ENERGY STAR status. The SWE team included but did not independently verify the ENERGY STAR status of the PECO dataset.
Table 4-75: ENERGY STAR Primary Refrigerators by Statewide Weights
ENERGY STAR SF-Detached SF-Attached Multifamily Manufactured Statewide
Yes 23% 16% 7% 18% 20%
No 77% 84% 93% 82% 80%
Grand Total 100% 100% 100% 100% 100%
n 355 55 48 29 487
Table 4-76: ENERGY STAR Secondary Refrigerators by Statewide Weights
ENERGY STAR SF-Detached SF-Attached Multifamily Manufactured Statewide
Yes 4% 0% 0% 0% 4%
No 96% 100% 100% 100% 96%
Grand Total 100% 100% 100% 100% 100%
n 172 15 5 8 200
Number of Freezers. 61% of houses statewide do not possess a stand-alone freezer. Additionally, homes with freezers are unlikely to have multiple units. Generally only 2% of homes have two or more stand-alone freezers.

SECTION 4 Statewide Residential Findings
53
Table 4-77: Number of Stand-Alone Freezers by Statewide Weights
# SF-Detached SF-Attached Multifamily Manufactured Statewide
0 51% 86% 97% 41% 61%
1 47% 14% 3% 54% 37%
2 2% 0% 0% 0% 1%
3 1% 0% 0% 5% 1%
Grand Total 100% 100% 100% 100% 100%
n 356 55 48 29 488
Freezer Type. Statewide, there is near even distribution of upright vs. chest freezers in surveyed households. Overall 50% of freezers were upright models, and 50% were chest freezers. Upright models were more common in SF-Attached and multifamily housing units, while chest freezers were more predominant in manufactured homes. However, note that the sample of freezers observed in homes other than SF-Detached housing is limited.
Table 4-78: Stand-Alone Freezer Type by Statewide Weights
Type SF-Detached SF-Attached Multifamily Manufactured Statewide
Upright 49% 85% 79% 35% 50%
Chest 51% 15% 21% 65% 50%
Grand Total 100% 100% 100% 100% 100%
n 203 10 3 21 237
Freezer Age. The statewide average age of stand-alone freezers was 15 years old. As not all homes are equipped with stand-alone freezers, the sample size is limited outside of the SF-Detached data.
Table 4-79: Stand-Alone Freezer Age by EDC by Statewide Weights
Avg. Age SF-Detached SF-Attached Multifamily Manufactured Statewide
Years 15.8 10.3 8.9 9.5 15.0
n 202 10 3 21 236
ENERGY STAR Freezers. Only 7% of stand-alone freezers statewide were considered to be ENERGY STAR compliant. 7% of freezers in SF-Detached houses were ENERGY STAR. Sample sizes in other housing types are outside of the 90/10 confidence interval. Where possible, the SWE team collected make/model information of freezers and verified ENERGY STAR status. Again, the SWE Team did not independently verify the ENERGY STAR status of the refrigerators included in the PECO residential baseline study.
Table 4-80: ENERGY STAR Stand-Alone Freezers by Statewide Weights
ENERGY STAR SF-Detached SF-Attached Multifamily Manufactured Statewide
Yes 7% 8% 0% 11% 7%
No 93% 92% 100% 89% 93%
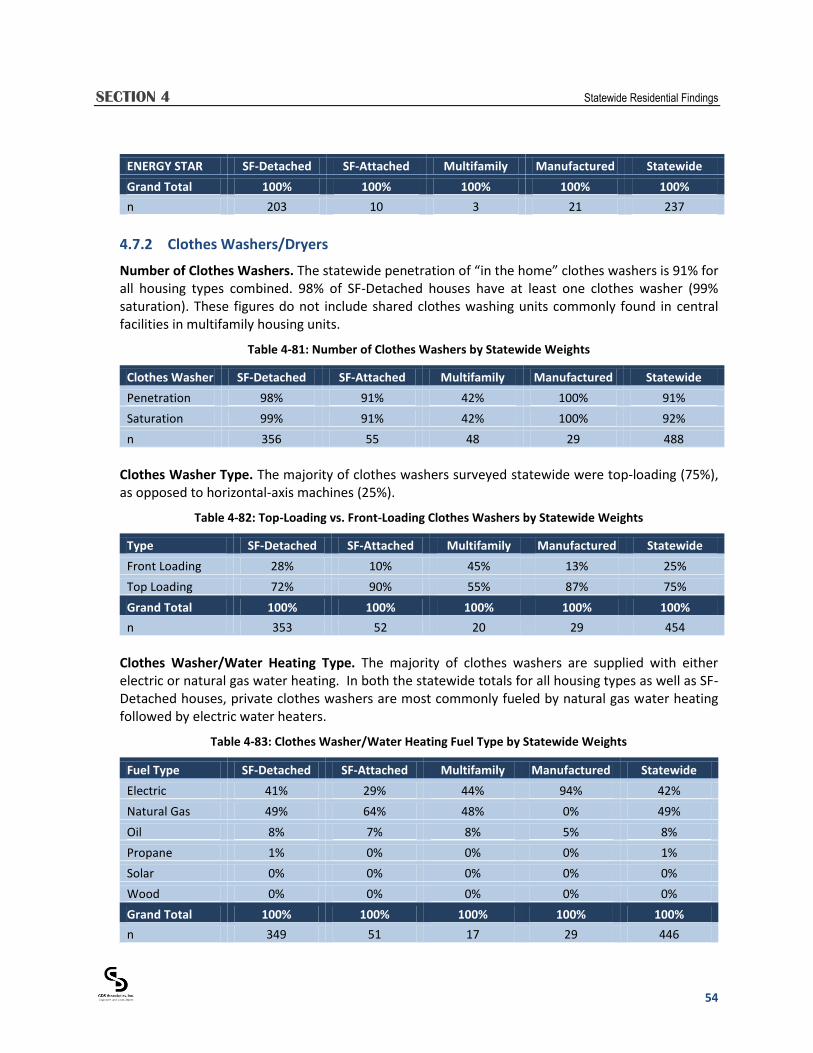
SECTION 4 Statewide Residential Findings
54
ENERGY STAR SF-Detached SF-Attached Multifamily Manufactured Statewide
Grand Total 100% 100% 100% 100% 100%
n 203 10 3 21 237
4.7.2 Clothes Washers/Dryers
Number of Clothes Washers. The statewide penetration of “in the home” clothes washers is 91% for all housing types combined. 98% of SF-Detached houses have at least one clothes washer (99% saturation). These figures do not include shared clothes washing units commonly found in central facilities in multifamily housing units.
Table 4-81: Number of Clothes Washers by Statewide Weights
Clothes Washer SF-Detached SF-Attached Multifamily Manufactured Statewide
Penetration 98% 91% 42% 100% 91%
Saturation 99% 91% 42% 100% 92%
n 356 55 48 29 488
Clothes Washer Type. The majority of clothes washers surveyed statewide were top-loading (75%), as opposed to horizontal-axis machines (25%).
Table 4-82: Top-Loading vs. Front-Loading Clothes Washers by Statewide Weights
Type SF-Detached SF-Attached Multifamily Manufactured Statewide
Front Loading 28% 10% 45% 13% 25%
Top Loading 72% 90% 55% 87% 75%
Grand Total 100% 100% 100% 100% 100%
n 353 52 20 29 454
Clothes Washer/Water Heating Type. The majority of clothes washers are supplied with either electric or natural gas water heating. In both the statewide totals for all housing types as well as SF-Detached houses, private clothes washers are most commonly fueled by natural gas water heating followed by electric water heaters.
Table 4-83: Clothes Washer/Water Heating Fuel Type by Statewide Weights
Fuel Type SF-Detached SF-Attached Multifamily Manufactured Statewide
Electric 41% 29% 44% 94% 42%
Natural Gas 49% 64% 48% 0% 49%
Oil 8% 7% 8% 5% 8%
Propane 1% 0% 0% 0% 1%
Solar 0% 0% 0% 0% 0%
Wood 0% 0% 0% 0% 0%
Grand Total 100% 100% 100% 100% 100%
n 349 51 17 29 446
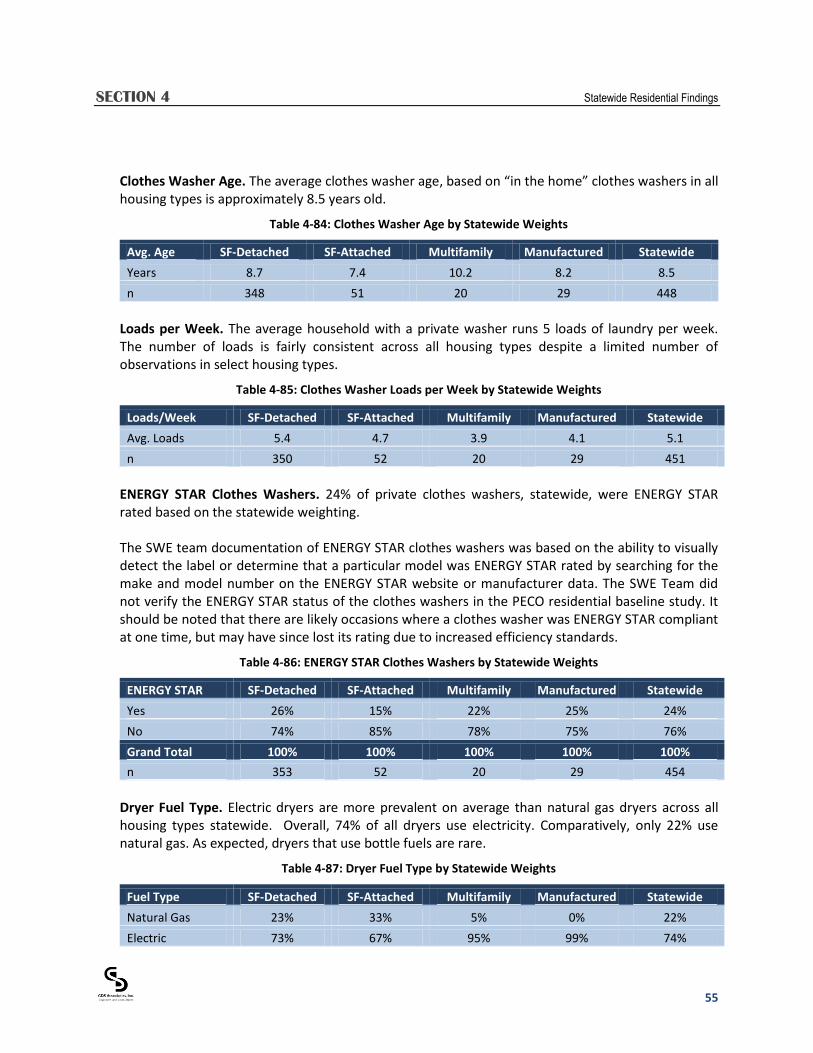
SECTION 4 Statewide Residential Findings
55
Clothes Washer Age. The average clothes washer age, based on “in the home” clothes washers in all housing types is approximately 8.5 years old.
Table 4-84: Clothes Washer Age by Statewide Weights
Avg. Age SF-Detached SF-Attached Multifamily Manufactured Statewide
Years 8.7 7.4 10.2 8.2 8.5
n 348 51 20 29 448
Loads per Week. The average household with a private washer runs 5 loads of laundry per week. The number of loads is fairly consistent across all housing types despite a limited number of observations in select housing types.
Table 4-85: Clothes Washer Loads per Week by Statewide Weights
Loads/Week SF-Detached SF-Attached Multifamily Manufactured Statewide
Avg. Loads 5.4 4.7 3.9 4.1 5.1
n 350 52 20 29 451
ENERGY STAR Clothes Washers. 24% of private clothes washers, statewide, were ENERGY STAR rated based on the statewide weighting. The SWE team documentation of ENERGY STAR clothes washers was based on the ability to visually detect the label or determine that a particular model was ENERGY STAR rated by searching for the make and model number on the ENERGY STAR website or manufacturer data. The SWE Team did not verify the ENERGY STAR status of the clothes washers in the PECO residential baseline study. It should be noted that there are likely occasions where a clothes washer was ENERGY STAR compliant at one time, but may have since lost its rating due to increased efficiency standards.
Table 4-86: ENERGY STAR Clothes Washers by Statewide Weights
ENERGY STAR SF-Detached SF-Attached Multifamily Manufactured Statewide
Yes 26% 15% 22% 25% 24%
No 74% 85% 78% 75% 76%
Grand Total 100% 100% 100% 100% 100%
n 353 52 20 29 454
Dryer Fuel Type. Electric dryers are more prevalent on average than natural gas dryers across all housing types statewide. Overall, 74% of all dryers use electricity. Comparatively, only 22% use natural gas. As expected, dryers that use bottle fuels are rare.
Table 4-87: Dryer Fuel Type by Statewide Weights
Fuel Type SF-Detached SF-Attached Multifamily Manufactured Statewide
Natural Gas 23% 33% 5% 0% 22%
Electric 73% 67% 95% 99% 74%

SECTION 4 Statewide Residential Findings
56
Fuel Type SF-Detached SF-Attached Multifamily Manufactured Statewide
Propane 4% 0% 0% 0% 3%
Grand Total 100% 100% 100% 100% 100%
n 346 48 21 29 444
4.7.3 Dishwashers
Number of Dishwashers. 71% of homes surveyed have a dishwasher, with dishwashers being most common in SF-Detached housing units (82%).
Table 4-88: Dishwasher Saturation by Statewide Weights
Saturation (%) SF-Detached SF-Attached Multifamily Manufactured Statewide
Dishwashers 82% 53% 44% 33% 71%
n 356 55 48 29 488
Dishwasher/Water Heating Type. The percent of dishwashers with electric water heating is 42% of all dishwashers. The majority of the hot water supplied to dishwashers is heated by natural gas (49%).
Table 4-89: Dishwasher/Water Heating Type by Statewide Weights
Fuel Type SF-Detached SF-Attached Multifamily Manufactured Statewide
Electric 42% 32% 50% 97% 42%
Natural Gas 49% 68% 50% 1% 50%
Oil 8% 0% 0% 0% 6%
Propane 1% 0% 0% 0% 1%
Wood 0% 0% 0% 1% 0%
Grand Total 100% 100% 100% 100% 100%
n 282 32 18 11 343
Dishwasher Age. The statewide average age of a dishwasher is 9.1 years.
Table 4-90: Dishwasher Age by Statewide Weights
Avg. Age SF-Detached SF-Attached Multifamily Manufactured Statewide
Years 9.1 9.7 8.6 9.4 9.1
n 283 32 20 11 346
ENERGY STAR Dishwashers. 38% of dishwashers were ENERGY STAR rated across the EDCs. Approximately 36% of SF-Detached houses had ENERGY STAR compliant dishwashers. Other housing types have significantly limited observations of dishwashers present. Where possible, the SWE team collected make/model information of dishwashers and verified ENERGY STAR status. The SWE Team did not independently verify the ENERGY STAR status of the dishwashers included in the PECO residential baseline study.

SECTION 4 Statewide Residential Findings
57
Table 4-91: ENERGY STAR Dishwashers by Statewide Weights
ENERGY STAR SF-Detached SF-Attached Multifamily Manufactured Statewide
Yes 36% 52% 37% 49% 38%
No 64% 48% 63% 51% 62%
Grand Total 100% 100% 100% 100% 100%
n 285 33 21 11 350
4.7.4 Consumer Electronics
Number of Televisions. Nearly every residence surveyed had at least one television. Statewide, the average household had nearly 3 televisions per household. This number was slightly greater (3.2) for the average SF-Detached housing unit.
Table 4-92: Penetration/Saturation of Televisions by Statewide Weights
Televisions SF-Detached SF-Attached Multifamily Manufactured Statewide
Penetration 98% 98% 98% 100% 98%
Saturation 322% 280% 194% 288% 301%
n 356 55 48 29 488
Television Type/Size. Approximately three-quarters of all televisions statewide are currently estimated to have a screen-size of less than 36 inches. Of those televisions with a screen size less than 36 inches, the majority of televisions are cathode ray tube (CRT). As television size increases, the majority of televisions are flat panel screen (LCD and Plasma) technology.
Table 4-93: Screen Size of Televisions by Statewide Weights
Televisions SF-Detached SF-Attached Multifamily Manufactured Statewide
Greater than 36" 29% 21% 38% 33% 28%
Less than 36" 71% 79% 62% 67% 72%
n 1105 152 95 82 1434
Table 4-94: Type of Television (Greater than 36") by Statewide Weights
Greater than 36" SF-Detached SF-Attached Multifamily Manufactured Statewide
CRT 19% 19% 16% 31% 19%
LCD 49% 45% 54% 52% 49%
Plasma 20% 21% 17% 17% 20%
Other 11% 15% 14% 0% 11%
Grand Total 100% 100% 100% 100% 100%
n 336 40 37 27 440
Table 4-95: Type of Television (Less than 36") by Statewide Weights
Less than 36" SF-Detached SF-Attached Multifamily Manufactured Statewide
CRT 67% 68% 76% 57% 68%
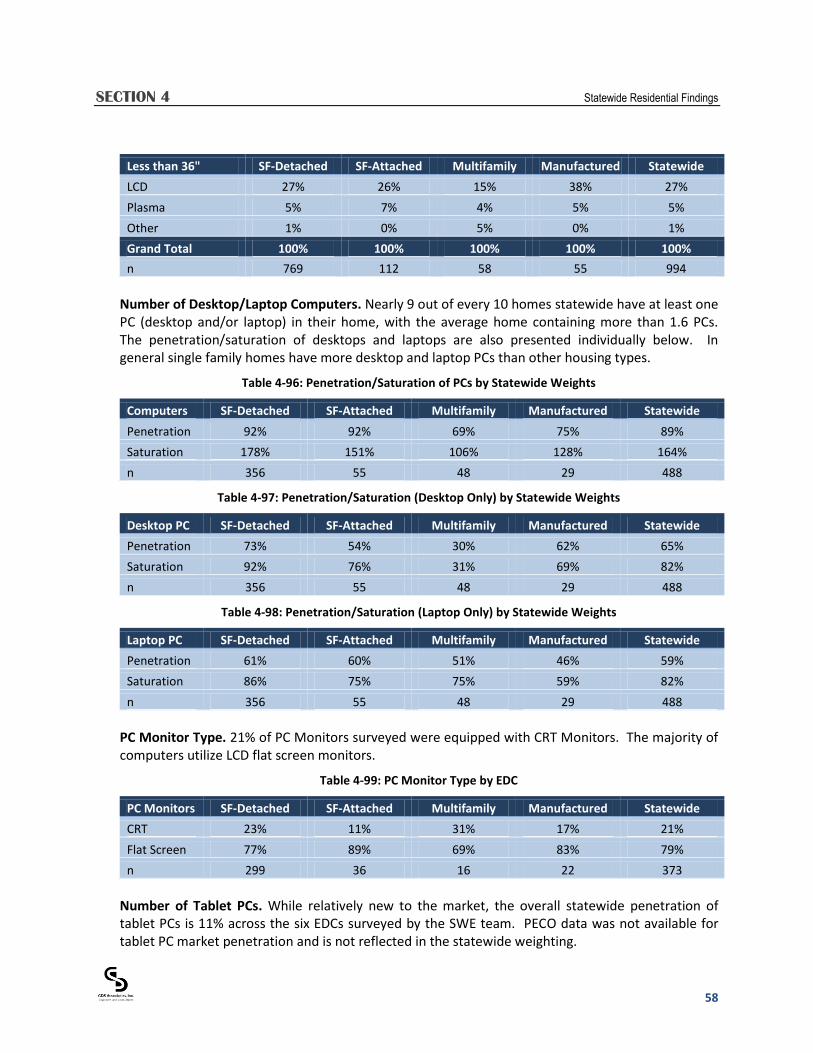
SECTION 4 Statewide Residential Findings
58
Less than 36" SF-Detached SF-Attached Multifamily Manufactured Statewide
LCD 27% 26% 15% 38% 27%
Plasma 5% 7% 4% 5% 5%
Other 1% 0% 5% 0% 1%
Grand Total 100% 100% 100% 100% 100%
n 769 112 58 55 994
Number of Desktop/Laptop Computers. Nearly 9 out of every 10 homes statewide have at least one PC (desktop and/or laptop) in their home, with the average home containing more than 1.6 PCs. The penetration/saturation of desktops and laptops are also presented individually below. In general single family homes have more desktop and laptop PCs than other housing types.
Table 4-96: Penetration/Saturation of PCs by Statewide Weights
Computers SF-Detached SF-Attached Multifamily Manufactured Statewide
Penetration 92% 92% 69% 75% 89%
Saturation 178% 151% 106% 128% 164%
n 356 55 48 29 488
Table 4-97: Penetration/Saturation (Desktop Only) by Statewide Weights
Desktop PC SF-Detached SF-Attached Multifamily Manufactured Statewide
Penetration 73% 54% 30% 62% 65%
Saturation 92% 76% 31% 69% 82%
n 356 55 48 29 488
Table 4-98: Penetration/Saturation (Laptop Only) by Statewide Weights
Laptop PC SF-Detached SF-Attached Multifamily Manufactured Statewide
Penetration 61% 60% 51% 46% 59%
Saturation 86% 75% 75% 59% 82%
n 356 55 48 29 488
PC Monitor Type. 21% of PC Monitors surveyed were equipped with CRT Monitors. The majority of computers utilize LCD flat screen monitors.
Table 4-99: PC Monitor Type by EDC
PC Monitors SF-Detached SF-Attached Multifamily Manufactured Statewide
CRT 23% 11% 31% 17% 21%
Flat Screen 77% 89% 69% 83% 79%
n 299 36 16 22 373
Number of Tablet PCs. While relatively new to the market, the overall statewide penetration of tablet PCs is 11% across the six EDCs surveyed by the SWE team. PECO data was not available for tablet PC market penetration and is not reflected in the statewide weighting.

SECTION 4 Statewide Residential Findings
59
Table 4-100: Penetration/Saturation of Tablet PCs by Statewide Weights
Tablet PC SF-Detached SF-Attached Multifamily Manufactured Statewide
Penetration 11% 10% 7% 15% 11%
Saturation 11% 11% 7% 22% 11%
n 312 36 43 29 420
*Does not include 2011 PECO data
Miscellaneous Consumer Electronics. The statewide penetration and saturation of various small consumer electronics collected by the SWE team is presented below. Similar data from the 2011 PECO baseline study was not available for comparison purposes and are thus not included in the statewide weighting. Of the surveyed equipment, fax machines and home theater systems are the least common items in the surveyed households. The saturation of gaming systems is roughly 57% statewide. On average, homes have an average of more than one DVD player and 1.8 mobile phone chargers and 1.3 DVD players.
Table 4-101: Penetration/Saturation of Miscellaneous Electronics by Statewide Weights
Misc. Electronics SF-Detached SF-Attached Multifamily Manufactured Statewide
DVD
Penetration 88% 76% 86% 92% 87%
Saturation 138% 116% 114% 120% 132%
Fax Machine
Penetration 15% 19% 0% 8% 13%
Saturation 15% 33% 0% 8% 15%
Gaming
Penetration 40% 44% 39% 50% 41%
Saturation 57% 73% 43% 67% 57%
Home Theater
Penetration 27% 14% 9% 33% 24%
Saturation 29% 14% 12% 33% 26%
Phone Charger
Penetration 91% 86% 77% 100% 89%
Saturation 191% 146% 120% 173% 177%
Stereo
Penetration 61% 53% 51% 44% 58%
Saturation 80% 56% 53% 51% 73%
VCR
Penetration 46% 46% 31% 38% 44%
Saturation 62% 55% 35% 42% 57%

SECTION 4 Statewide Residential Findings
60
Misc. Electronics SF-Detached SF-Attached Multifamily Manufactured Statewide
n 312 36 43 29 420
*Does not include 2011 PECO on-site data
4.7.5 Other
Humidifiers/Dehumidifiers. Dehumidifiers are present in 44% of surveyed homes statewide and 58% of SF-Detached housing. Humidifiers are less common, present in only 19% of surveyed homes (22% of SF-Detached residences).
Table 4-102: Humidifier/Dehumidifiers Saturation by Statewide Weights
Saturation SF-Detached SF-Attached Multifamily Manufactured Statewide
Humidifiers 22% 10% 12% 21% 19%
Dehumidifiers 58% 19% 10% 0% 44%
n 356 55 48 29 488
Humidifiers/Dehumidifier Usage. On average, dehumidifiers run 4.8 months per year. Humidifiers run slightly less, an average of 3.5 months per year. It is important to note that many of the surveyed households did not have humidifiers or dehumidifiers or did not provide a response to this usage question creating limited samples sizes across the housing unit types.
Table 4-103: Humidifier/Dehumidifier Use (Months/Year) by EDC
Avg. Months/Year SF-Detached SF-Attached Multifamily Manufactured Statewide
Humidifiers 3.6 3.0 3.7 3.4 3.5
n 85 9 7 6 107
Dehumidifiers 4.8 5.6 5.1 - 4.8
n 198 13 4 0 215
Ceiling Fans. More than three-quarters of homes have at least one ceiling fan at the statewide level. The penetration of ceiling fans is even greater for SF-Detached housing, at 85% of the surveyed homes, the average number of ceiling fans in all home was 2.6 across all housing types, and 3.0 for SF-Detached houses.
Table 4-104: Penetration/Saturation of Ceiling Fans by EDC
Ceiling Fans SF-Detached SF-Attached Multifamily Manufactured Statewide
Penetration 85% 69% 51% 91% 79%
Saturation 295% 206% 98% 209% 257%
n 356 55 48 29 488
Ceiling Fan Usage. Approximately 37% of all ceiling fans are used 6 hours per day or more according to the results available in 6 of the Pennsylvania EDCs. Ceiling fan hours of use were not available for PECO and is not included in the statewide weighting.
SECTION 4 Statewide Residential Findings
61
Table 4-105: Ceiling Fan Hours of Use by EDC
Used 6 hrs or more SF-Detached SF-Attached Multifamily Manufactured Statewide
Yes 35% 45% 51% 33% 37%
n 813 69 42 62 986
*Does not include 2011 PECO on-site data
Pools/Hot Tubs. The vast majority of homes, statewide, do not have any outdoor recreational equipment such as a swimming pool or hot tubs. 90% of households or more have no private swimming pools. Private pools are generally only found in a small number of SF-Detached houses. Similarly, 94% of homes surveyed do not have a hot tub or spa.
Table 4-106: Pool/Spa Saturation by EDC
Pool Type SF-Detached SF-Attached Multifamily Manufactured Statewide
Above Ground 10% 7% 0% 0% 8%
In Ground 3% 0% 0% 0% 2%
Hot Tub/Spa 7% 7% 0% 10% 6%
n 314 35 43 28 420
*Does not include 2011 PECO on-site data
SECTION 5 EDC Specific Findings
62
5 EDC SPECIFIC FINDINGS
5.1 INTRODUCTION
This section describes the residential sector findings obtained from the on-site survey collection and analysis activities for each of the seven EDCs located throughout Pennsylvania. Data was gathered from two primary sources:
1. 70 on-site surveys conducted by the SWE team in each of the following six EDCs: Duquesne Light, Metropolitan Edison, Pennsylvania Electric, Penn Power, West Penn Power, and PPL.
2. 68 on-site surveys of PECO’s residential customers conducted by Navigant for the 2011 PECO Baseline Study
Whenever possible, the SWE Team has included the findings from the 2011 PECO Baseline study with the rest of the EDC specific results for ease of comparison across all seven Pennsylvania EDCs. In select cases, dissimilar data fields prohibited the aggregation of the 2011 PECO Baseline Study. These cases have been noted throughout the following section. As noted earlier in the report, EDC level results have been weighted based on housing type and age of head of household. See section 3.4.2 for more details.
5.2 BASIC HOME CHARACTERISTICS
5.2.1 Usage
The residential customers were stratified and recruited to attain a representative sample of each EDC territory in terms of average monthly usage and housing type. Table 5-1 shows each EDCs representation of usage based on the final on-site sample.
Table 5-1: Average Monthly Electricity Usage
Avg. Monthly kWh Use Duquesne MetEd Penelec Penn Power WPP PPL PECO
<=500 kWh 32% 14% 29% 22% 12% 19% 25%
501-1000 kWh 46% 36% 39% 40% 39% 33% 39%
1001-1500 kWh 14% 28% 15% 17% 31% 25% 26%
>1500 kWh 7% 20% 17% 21% 17% 22% 10%
Don't Know 0% 3% 0% 0% 0% 2% 0%
Grand Total 100% 100% 100% 100% 100% 100% 100%
n 70 70 70 70 70 70 68
5.2.2 Home Type
Table 5-2 displays the types of residential sites surveyed after applying the EDC case weights. Single family detached houses are the dominant housing type across all EDCs. Single family attached houses consist of row houses, townhomes, and duplexes.

SECTION 5 EDC Specific Findings
63
Table 5-2: Home Type by EDC
Home Type Duquesne MetEd Penelec Penn Power WPP PPL PECO
SF-Detached 63% 78% 82% 85% 68% 70% 65%
SF-Attached 10% 8% 5% 4% 8% 15% 28%
Multifamily 26% 5% 5% 6% 16% 9% 7%
Manuf./Mobile 1% 8% 7% 5% 8% 5% 0%
Grand Total 100% 100% 100% 100% 100% 100% 100%
n 70 70 70 70 70 70 68
Home Age. The average age of surveyed homes ranged from 39 years in the MetEd territory to 61 years in the Penelec territory. Table 5-3 displays the distribution of the years of construction across the seven EDCs.
Table 5-3: Average Age of Home by EDC
Age Duquesne MetEd Penelec Penn Power WPP PPL PECO
Average Age 58.0 39.4 60.7 54.5 47.1 44.6 52.1
n 70 68 70 70 70 69 67
Table 5-4: Year of Construction by EDC
Year of Construction Duquesne MetEd Penelec Penn Power WPP PPL PECO
Pre-1900 4% 1% 8% 3% 1% 5% 8%
1900-1910 2% 0% 8% 1% 8% 2% 6%
1911-1920 3% 8% 4% 7% 7% 5% 2%
1921-1930 11% 0% 8% 7% 2% 3% 0%
1931-1940 13% 3% 6% 8% 4% 2% 8%
1941-1950 13% 4% 5% 13% 5% 7% 10%
1951-1960 19% 8% 10% 16% 9% 7% 13%
1961-1970 7% 10% 21% 4% 12% 14% 16%
1971-1980 3% 20% 15% 12% 15% 10% 6%
1981-1990 10% 17% 2% 11% 11% 18% 13%
1991-2000 12% 16% 4% 12% 9% 16% 14%
2001-Present 3% 13% 11% 5% 16% 11% 3%
Grand Total 100% 100% 100% 100% 100% 100% 100%
n 70 68 70 70 70 69 67
5.2.3 Home Size
The average square footage of conditioned space ranged from 1,684 sq. ft. in the PPL territory to 2,007 sq. ft. in the PECO area. Table 5-5 also provides the un-weighted average per home type, broken out by EDC, as well.
Table 5-5: Average Home Square Footage (Conditioned Space) by EDC
Home Type Duquesne MetEd Penelec Penn Power WPP PPL PECO
SF-Detached 1,975 1,978 1,813 1,830 1,999 1,808 2,391
SF-Attached 1,677 1,305 1,270 1,774 1,275 1,577 1,224
SECTION 5 EDC Specific Findings
64
Home Type Duquesne MetEd Penelec Penn Power WPP PPL PECO
Multifamily 1,143 1,033 793 833 858 670 970
Manuf./Mobile 980 1,503 1,084 1,135 1,222 1,055
All Homes 1,726 1,831 1,687 1,760 1,721 1,684 2,007
n 70 69 65 70 70 66 68
Home Foundation. Across six EDCs, greater than 75% of homes are equipped with either conditioned or unconditioned basements. Foundation type was not readily available for the 2011 PECO dataset.
Table 5-6: Foundation Type by EDC
Year of Construction Duquesne MetEd Penelec Penn Power WPP PPL
Slab 7% 16% 5% 6% 6% 4%
Enclosed Crawl 0% 7% 7% 7% 4% 7%
Open Crawl 4% 1% 2% 0% 1% 3%
Uncond. Basement 30% 37% 56% 39% 50% 53%
Conditioned Basement 53% 37% 25% 46% 38% 28%
Unit above Cond. Space 6% 2% 5% 2% 2% 6%
Grand Total 100% 100% 100% 100% 100% 100%
n 70 70 70 70 70 70
*Does not include 2011 PECO on-site data
5.2.4 Demographics
Homeownership. Owner occupied houses range from 72% of all homes in the Duquesne service area to 87% in the Penn Power area.
Table 5-7: Own vs. Rent by EDC
Homeownership Duquesne MetEd Penelec Penn Power WPP PPL PECO
Own 72% 80% 83% 87% 79% 84% 83%
Rent 28% 20% 17% 13% 21% 16% 17%
Grand Total 100% 100% 100% 100% 100% 100% 100%
n 70 70 70 70 70 70 68
Type of Residence. Nearly all of surveyed homes (94-100% across the seven EDCs) are year-round, main residences.
Table 5-8: Year Round Residences by EDC
Type Duquesne MetEd Penelec Penn Power WPP PPL PECO
Year-Round 94% 100% 94% 98% 98% 96% 99%
n 70 70 70 70 70 70 68
Occupancy. The average year-round home occupancy ranges from 2.3 people to 3.0 across each EDC.

SECTION 5 EDC Specific Findings
65
Table 5-9: Number of Year Round Occupants by EDC
Occupants Duquesne MetEd Penelec Penn Power WPP PPL PECO
Avg. # of Occupants 2.3 2.4 2.4 2.4 2.5 2.4 3.0
Max. # of Occupants 6 8 6 5 5 7 8
Min. # of Occupants 1 1 1 1 1 0 0
n 70 70 70 70 69 70 68
5.3 BUILDING SHELL
This section presents information on the characteristics of the building envelope found present at the surveyed residential homes throughout Pennsylvania.
5.3.1 Insulation
Attic Insulation. The majority of surveyed homes had some level of attic insulation present. Typically, less than 14% of homes were verified to have no attic insulation present. Surveyors were unable to verify the presence or absence of insulation in 3% to 22% of homes based on homes with limited or no access to attic space. N/A refers to homes where attic insulation was not applicable.
Table 5-10: Presence of Attic Insulation by EDC
Insulation Present? Duquesne MetEd Penelec Penn Power WPP PPL PECO
Yes 59% 75% 77% 91% 78% 75% 75%
No 14% 7% 1% 6% 3% 12% 12%
N/A 9% 1% 0% 0% 0% 0% 13%
Don’t Know 19% 17% 22% 3% 19% 13% 0%
Grand Total 100% 100% 100% 100% 100% 100% 100%
n 70 70 70 70 70 70 68
Attic Insulation Type. Where insulation was present, fiberglass is the predominant form of attic insulation. Fiberglass batting or loose-fill fiberglass was present in 72% to 93% of surveyed attics with insulation. Other includes rock wool, vermiculate, spray foam, as well as a mixture of fiberglass and other types. Note that not all attics were verified to possess attic insulation.
Table 5-11: Type of Attic Insulation by EDC
Type Duquesne MetEd Penelec Penn Power WPP PPL PECO
Cellulose Loose Fill 8% 2% 6% 13% 9% 6% 3%
Fiberglass Batting 66% 39% 68% 52% 66% 62% 29%
Fiberglass Loose 6% 46% 25% 21% 23% 13% 60%
Other 9% 1% 1% 10% 1% 15% 7%
Don't Know 11% 12% 0% 4% 1% 4% 0%
Grand Total 100% 100% 100% 100% 100% 100% 100%
n 45 53 50 63 60 55 53
Attic Insulation Thickness. The average thickness of attic insulation, in homes with attic insulation present, ranged from 7.1 inches to 9.8 inches. The average R-value ranged from R21 (PECO) to R28

SECTION 5 EDC Specific Findings
66
(MetEd). Due to limited access to attics, particularly in multifamily units, attic insulation thickness was not able to be determined in all instances where attic insulation was present
Table 5-12: Attic Insulation Thickness/R-Value by EDC
Thickness Duquesne MetEd Penelec Penn Power WPP PPL PECO
Thickness 8.1 9.8 8.7 8.4 8.7 7.7 7.1
R-Value 25.7 27.6 25.9 24.7 25.3 24.4 21.2
n 40 42 49 56 57 51 53
For homes with attic insulation, the table below indicates the proportion of insulation by R-value. In general, the majority of homes had attic insulation meeting or exceeding R-19. However, less than 20% (with the exception of Penelec) had R-38 or above. The 2011 PECO dataset found a substantial percent of homes with attic insulation below R-19 levels relative to the EDCs surveyed by the SWE team. It is unknown if there were differences in data collection and R-value calculations between the SWE surveys and those collected by PECO that would serve to explain these differences.
Table 5-13: Proportion of Attic Insulation R-Value by EDC
Attic R-Value Duquesne MetEd Penelec Penn Power WPP PPL PECO
R1-R12 5% 1% 1% 6% 2% 10% 16%
R13-R18 7% 0% 13% 13% 13% 4% 31%
R19-R37 71% 82% 59% 65% 69% 71% 44%
R38-R59 15% 17% 20% 14% 15% 13% 6%
R60 or above 3% 0% 8% 1% 1% 2% 3%
Grand Total 100% 100% 100% 100% 100% 100% 100%
n 32 27 44 49 44 38 44
Wall Insulation. The majority of surveyed homes had some level of wall insulation present. The range of homes verified to have no wall insulation present ranged from 11% to 31%. Surveyors were unable to verify the presence or absence of insulation in 10% to 33% of homes based on homes with no access to wall space. N/A refers to homes where wall insulation was not applicable.
Table 5-14: Presence of Wall Insulation by EDC
Insulation Present? Duquesne MetEd Penelec Penn Power WPP PPL PECO
Yes 50% 57% 72% 77% 63% 69% 67%
No 18% 15% 11% 13% 15% 14% 31%
N/A 0% 0% 0% 0% 0% 0% 2%
Don’t Know 33% 28% 16% 10% 22% 17% 0%
Grand Total 100% 100% 100% 100% 100% 100% 100%
n 70 70 70 70 70 70 68
Wall Insulation Type. Fiberglass batting is the predominant form of wall insulation (35% to 70%). Surveyors were not able to determine the type of wall insulation in 0% to 17% of surveyed homes. Other includes dense pack cellulose, rigid board, spray foam, fiberglass/other mixture, etc. Note that not all homes had wall insulation present and the number of total observations is limited.
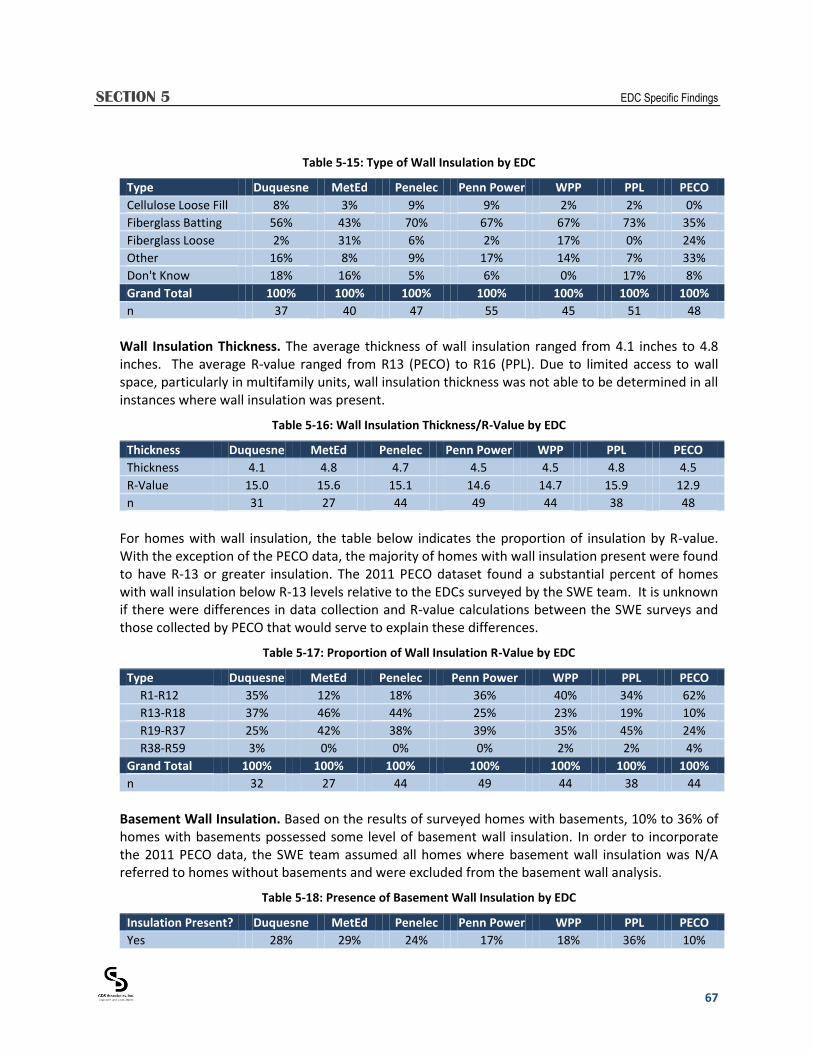
SECTION 5 EDC Specific Findings
67
Table 5-15: Type of Wall Insulation by EDC
Type Duquesne MetEd Penelec Penn Power WPP PPL PECO
Cellulose Loose Fill 8% 3% 9% 9% 2% 2% 0%
Fiberglass Batting 56% 43% 70% 67% 67% 73% 35%
Fiberglass Loose 2% 31% 6% 2% 17% 0% 24%
Other 16% 8% 9% 17% 14% 7% 33%
Don't Know 18% 16% 5% 6% 0% 17% 8%
Grand Total 100% 100% 100% 100% 100% 100% 100%
n 37 40 47 55 45 51 48
Wall Insulation Thickness. The average thickness of wall insulation ranged from 4.1 inches to 4.8 inches. The average R-value ranged from R13 (PECO) to R16 (PPL). Due to limited access to wall space, particularly in multifamily units, wall insulation thickness was not able to be determined in all instances where wall insulation was present.
Table 5-16: Wall Insulation Thickness/R-Value by EDC
Thickness Duquesne MetEd Penelec Penn Power WPP PPL PECO
Thickness 4.1 4.8 4.7 4.5 4.5 4.8 4.5
R-Value 15.0 15.6 15.1 14.6 14.7 15.9 12.9
n 31 27 44 49 44 38 48
For homes with wall insulation, the table below indicates the proportion of insulation by R-value. With the exception of the PECO data, the majority of homes with wall insulation present were found to have R-13 or greater insulation. The 2011 PECO dataset found a substantial percent of homes with wall insulation below R-13 levels relative to the EDCs surveyed by the SWE team. It is unknown if there were differences in data collection and R-value calculations between the SWE surveys and those collected by PECO that would serve to explain these differences.
Table 5-17: Proportion of Wall Insulation R-Value by EDC
Type Duquesne MetEd Penelec Penn Power WPP PPL PECO
R1-R12 35% 12% 18% 36% 40% 34% 62%
R13-R18 37% 46% 44% 25% 23% 19% 10%
R19-R37 25% 42% 38% 39% 35% 45% 24%
R38-R59 3% 0% 0% 0% 2% 2% 4%
Grand Total 100% 100% 100% 100% 100% 100% 100%
n 32 27 44 49 44 38 44
Basement Wall Insulation. Based on the results of surveyed homes with basements, 10% to 36% of homes with basements possessed some level of basement wall insulation. In order to incorporate the 2011 PECO data, the SWE team assumed all homes where basement wall insulation was N/A referred to homes without basements and were excluded from the basement wall analysis.
Table 5-18: Presence of Basement Wall Insulation by EDC
Insulation Present? Duquesne MetEd Penelec Penn Power WPP PPL PECO
Yes 28% 29% 24% 17% 18% 36% 10%

SECTION 5 EDC Specific Findings
68
Insulation Present? Duquesne MetEd Penelec Penn Power WPP PPL PECO
No 67% 68% 74% 78% 75% 61% 90%
Don’t Know 5% 3% 2% 5% 8% 3% 0%
Grand Total 100% 100% 100% 100% 100% 100% 100%
n 60 52 51 55 62 57 30
Basement Wall Insulation Type. Fiberglass batting is the predominant form of basement wall insulation (38% to 87%). Rigid board insulation is also fairly common (13% to 34%). Note the limited number of observations available for basement wall insulation. These limited observations restrict the level of confidence of reported statistics.
Table 5-19: Basement Wall Insulation Type by EDC
Type Duquesne MetEd Penelec Penn Power WPP PPL PECO
Fiberglass Batting 61% 38% 41% 87% 46% 53% 79%
Fiberglass Loose 0% 27% 12% 0% 15% 3% 0%
Rigid Board 16% 14% 35% 13% 24% 34% 21%
Other 11% 7% 6% 0% 6% 10% 0%
Don't Know 12% 14% 6% 0% 9% 0% 0%
Grand Total 100% 100% 100% 100% 100% 100% 100%
n 18 14 11 11 13 23 3
Basement Wall Insulation Thickness. In surveyed homes with basement wall insulation, the average thickness of insulation ranged from 3.2 inches to 5.6 inches. The average R-value ranged from R11 to R19. Note the limited number of observations available for basement wall insulation based on both the overall number of homes with basement wall insulation present as well as surveyor ability to determine thickness and R-value in these homes. These limited observations restrict the level of confidence of reported statistics.
Table 5-20: Basement Wall Insulation Thickness/R-value by EDC
Thickness Duquesne MetEd Penelec Penn Power WPP PPL PECO
Thickness 3.2 4.2 3.3 3.3 4.1 3.6 5.6
R-Value 13.8 14.7 11.0 11.1 14.3 13.3 18.6
n 16 8 10 11 13 18 3
Floor Insulation. Based on the results of surveyed homes, 13% to 46% of homes with basements and or crawlspaces possessed some level of floor insulation. In order to incorporate the 2011 PECO data, the SWE team assumed all homes where floor insulation was N/A referred to homes without basements or crawlspace and were excluded from the floor analysis.
Table 5-21: Presence of Floor Insulation by EDC
Insulation Present? Duquesne MetEd Penelec Penn Power WPP PPL PECO
Yes 30% 43% 13% 20% 40% 46% 18%
No 58% 52% 76% 75% 52% 50% 82%
Don’t Know 12% 5% 11% 6% 8% 4% 0%
Grand Total 100.0% 100.0% 100.0% 100.0% 100.0% 100.0% 100.0%
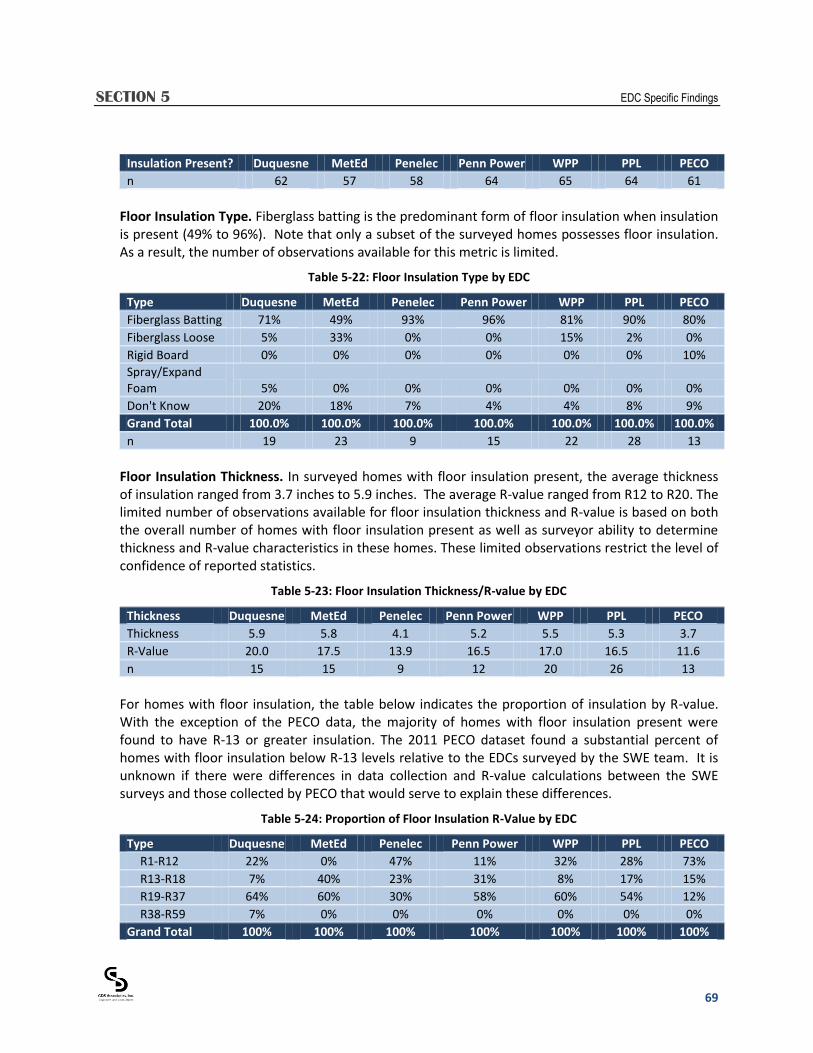
SECTION 5 EDC Specific Findings
69
Insulation Present? Duquesne MetEd Penelec Penn Power WPP PPL PECO
n 62 57 58 64 65 64 61
Floor Insulation Type. Fiberglass batting is the predominant form of floor insulation when insulation is present (49% to 96%). Note that only a subset of the surveyed homes possesses floor insulation. As a result, the number of observations available for this metric is limited.
Table 5-22: Floor Insulation Type by EDC
Type Duquesne MetEd Penelec Penn Power WPP PPL PECO
Fiberglass Batting 71% 49% 93% 96% 81% 90% 80%
Fiberglass Loose 5% 33% 0% 0% 15% 2% 0%
Rigid Board 0% 0% 0% 0% 0% 0% 10%
Spray/Expand Foam 5% 0% 0% 0% 0% 0% 0%
Don't Know 20% 18% 7% 4% 4% 8% 9%
Grand Total 100.0% 100.0% 100.0% 100.0% 100.0% 100.0% 100.0%
n 19 23 9 15 22 28 13
Floor Insulation Thickness. In surveyed homes with floor insulation present, the average thickness of insulation ranged from 3.7 inches to 5.9 inches. The average R-value ranged from R12 to R20. The limited number of observations available for floor insulation thickness and R-value is based on both the overall number of homes with floor insulation present as well as surveyor ability to determine thickness and R-value characteristics in these homes. These limited observations restrict the level of confidence of reported statistics.
Table 5-23: Floor Insulation Thickness/R-value by EDC
Thickness Duquesne MetEd Penelec Penn Power WPP PPL PECO
Thickness 5.9 5.8 4.1 5.2 5.5 5.3 3.7
R-Value 20.0 17.5 13.9 16.5 17.0 16.5 11.6
n 15 15 9 12 20 26 13
For homes with floor insulation, the table below indicates the proportion of insulation by R-value. With the exception of the PECO data, the majority of homes with floor insulation present were found to have R-13 or greater insulation. The 2011 PECO dataset found a substantial percent of homes with floor insulation below R-13 levels relative to the EDCs surveyed by the SWE team. It is unknown if there were differences in data collection and R-value calculations between the SWE surveys and those collected by PECO that would serve to explain these differences.
Table 5-24: Proportion of Floor Insulation R-Value by EDC
Type Duquesne MetEd Penelec Penn Power WPP PPL PECO
R1-R12 22% 0% 47% 11% 32% 28% 73%
R13-R18 7% 40% 23% 31% 8% 17% 15%
R19-R37 64% 60% 30% 58% 60% 54% 12%
R38-R59 7% 0% 0% 0% 0% 0% 0%
Grand Total 100% 100% 100% 100% 100% 100% 100%

SECTION 5 EDC Specific Findings
70
Type Duquesne MetEd Penelec Penn Power WPP PPL PECO
n 15 15 9 12 20 26 12
5.3.2 Windows
Number of Windows. The average number of windows per surveyed household ranged from 15 to 20 windows. The minimum number of windows per household was 2 windows and the maximum was 57 windows.
Table 5-25: Average Number of Windows per Household by EDC
# of Windows Duquesne MetEd Penelec Penn Power WPP PPL PECO
Avg. # of Windows 15.2 16.1 16.8 15.8 15.2 17.2 20.3
Max. # of Windows 49 35 54 57 48 56 54
Min. # of Windows 2 3 2 3 2 2 4
n 70 70 70 70 70 70 68
Total Window Area. The average total square footage of window area per household ranged from 122 sq. ft. (PECO) to 182 sq. ft. (MetEd).
Table 5-26: Average Area of Window Area per Household by EDC
Avg. Sq. Ft. of Windows Duquesne MetEd Penelec Penn Power WPP PPL PECO
Avg. Sq. Ft. per Home 157.1 182.3 170.9 150.5 146.2 158.8 122.4
n 70 70 70 70 70 70 68
Glazing Type. The table below describes the glazing types preset at the surveyed homes. The majority of windows were double-paned. Less than 2% are triple-paned across all EDCs and 9% to 14% were considered single-paned. Where surveyors were unsure of low-E coating, windows were assumed to be standard double-paned.
Table 5-27: Window Glazing Type by EDC
# of Windows Duquesne MetEd Penelec Penn Power WPP PPL PECO
Single-paned 9% 10% 14% 12% 12% 12% 13%
Double-paned 79% 73% 67% 55% 62% 56% 77%
Low-E double-paned 11% 14% 18% 32% 25% 32% 8%
Triple-paned 2% 2% 0% 1% 1% 0% 2%
Grand Total 100.0% 100.0% 100.0% 100.0% 100.0% 100.0% 100.0%
n 1106 1068 1106 1069 1160 1155 1361
5.3.1 Roofs
Roof Color. The majority of surveyed homes have dark roofs (between 67% and 85%). The remainder of surveyed homes had mostly light colored roofs, with only very small percent (0% to 4%) having white roofs. The 2011 PECO dataset did not align with the data collected by the SWE team; however, their dataset reports 81% of homes also had dark-colored roofing.
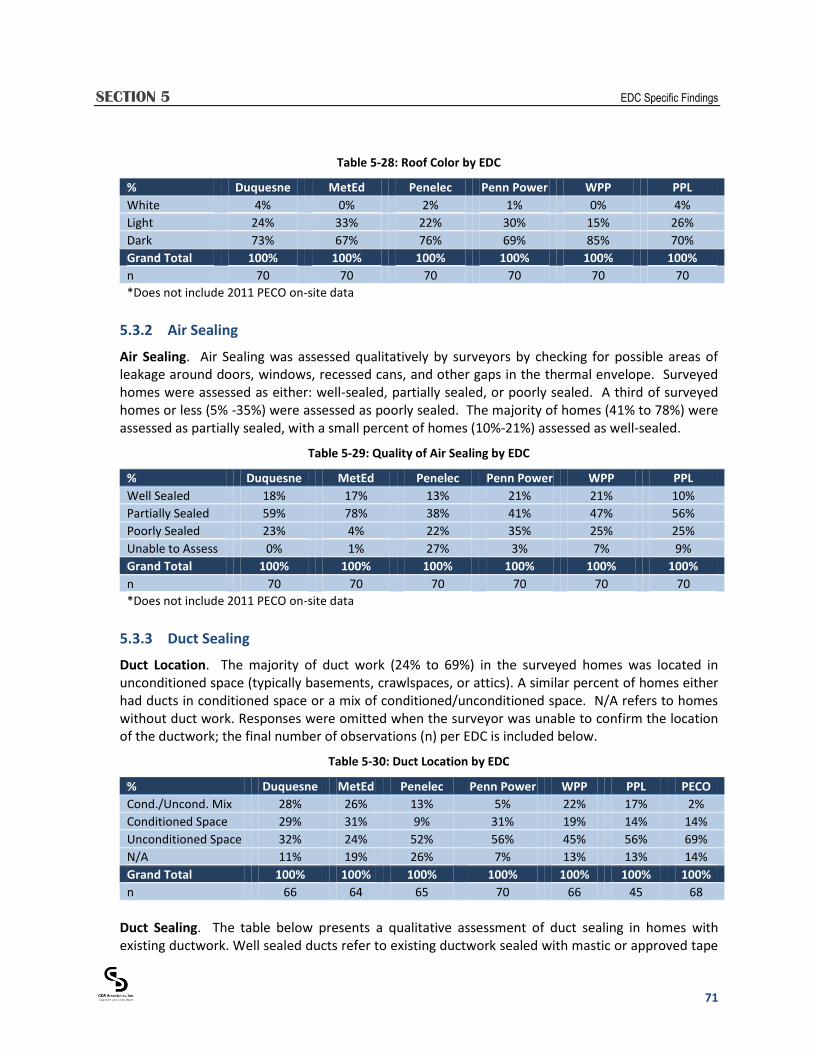
SECTION 5 EDC Specific Findings
71
Table 5-28: Roof Color by EDC
% Duquesne MetEd Penelec Penn Power WPP PPL
White 4% 0% 2% 1% 0% 4%
Light 24% 33% 22% 30% 15% 26%
Dark 73% 67% 76% 69% 85% 70%
Grand Total 100% 100% 100% 100% 100% 100%
n 70 70 70 70 70 70
*Does not include 2011 PECO on-site data
5.3.2 Air Sealing
Air Sealing. Air Sealing was assessed qualitatively by surveyors by checking for possible areas of leakage around doors, windows, recessed cans, and other gaps in the thermal envelope. Surveyed homes were assessed as either: well-sealed, partially sealed, or poorly sealed. A third of surveyed homes or less (5% -35%) were assessed as poorly sealed. The majority of homes (41% to 78%) were assessed as partially sealed, with a small percent of homes (10%-21%) assessed as well-sealed.
Table 5-29: Quality of Air Sealing by EDC
% Duquesne MetEd Penelec Penn Power WPP PPL
Well Sealed 18% 17% 13% 21% 21% 10%
Partially Sealed 59% 78% 38% 41% 47% 56%
Poorly Sealed 23% 4% 22% 35% 25% 25%
Unable to Assess 0% 1% 27% 3% 7% 9%
Grand Total 100% 100% 100% 100% 100% 100%
n 70 70 70 70 70 70
*Does not include 2011 PECO on-site data
5.3.3 Duct Sealing
Duct Location. The majority of duct work (24% to 69%) in the surveyed homes was located in unconditioned space (typically basements, crawlspaces, or attics). A similar percent of homes either had ducts in conditioned space or a mix of conditioned/unconditioned space. N/A refers to homes without duct work. Responses were omitted when the surveyor was unable to confirm the location of the ductwork; the final number of observations (n) per EDC is included below.
Table 5-30: Duct Location by EDC
% Duquesne MetEd Penelec Penn Power WPP PPL PECO
Cond./Uncond. Mix 28% 26% 13% 5% 22% 17% 2%
Conditioned Space 29% 31% 9% 31% 19% 14% 14%
Unconditioned Space 32% 24% 52% 56% 45% 56% 69%
N/A 11% 19% 26% 7% 13% 13% 14%
Grand Total 100% 100% 100% 100% 100% 100% 100%
n 66 64 65 70 66 45 68
Duct Sealing. The table below presents a qualitative assessment of duct sealing in homes with existing ductwork. Well sealed ducts refer to existing ductwork sealed with mastic or approved tape

SECTION 5 EDC Specific Findings
72
and no visible signs of air leakage around inspected HVAC joints. Well sealed refers to minimal gaps, while poorly sealed ducts were assessed when ductwork was not taped or sealed with appropriate materials or significant amounts of leakage were visible. More than half of homes with existing ductwork were assessed to be either partially or well sealed. However, between 12% and 50% of homes had ductwork that was unable to be assessed (i.e. unable to access duct location).
Table 5-31: Quality of Duct Sealing by EDC
% Duquesne MetEd Penelec Penn Power WPP PPL
Well Sealed 9% 21% 24% 4% 15% 19%
Partially Sealed 28% 5% 24% 63% 33% 10%
Poorly Sealed 47% 57% 27% 20% 35% 21%
Unable to Assess 16% 18% 25% 12% 17% 50%
Grand Total 100% 100% 100% 100% 100% 100%
n 64 60 52 65 62 65
*Does not include 2011 PECO on-site data
5.4 RESIDENTIAL HVAC
This section presents details on the residential space heating and cooling systems present at the surveyed homes.
5.4.1 Equipment Saturations by Fuel/Type – Heating
Fuel Type. Natural gas was the most prominent heating fuel found in residential homes (35%-88%), with the exception of PPL (only 21% of primary heating systems). Electric systems and oil systems were also fairly common in select EDCs. The saturation of electric primary heating systems ranged from 8% (Duquesne) to 30% (MetEd). The remaining fuel types include coal, propane, wood, etc.
Table 5-32: Fuel Type of Primary Space Heating Systems by EDC
Fuel Type Duquesne MetEd Penelec Penn Power WPP PPL PECO
Natural Gas 88% 35% 62% 62% 44% 21% 61%
Electric 8% 30% 11% 23% 28% 29% 15%
Oil 0% 21% 17% 6% 10% 32% 19%
Coal 0% 4% 0% 0% 0% 4% 0%
Dual Fuel 1% 0% 0% 2% 6% 3% 0%
Kerosene 0% 2% 2% 0% 3% 0% 0%
Propane 1% 6% 3% 3% 3% 5% 5%
Wood 1% 1% 6% 5% 6% 7% 0%
Grand Total 100% 100% 100% 100% 100% 100% 100%
n 69 70 68 70 70 70 62
Backup Systems. The saturation of homes with at least one back-up heating system ranged between 11% and 38% within the EDCs. The table below presents the fuel type of backup heating systems. However, note the small sample size in most EDCs. Sample sizes below 68 do not meet a 90/10 level of confidence.

SECTION 5 EDC Specific Findings
73
Table 5-33: Homes with Back-Up Heating Systems by EDC
Back-Up Heating Duquesne MetEd Penelec Penn Power WPP PPL PECO
% of Homes 11% 25% 23% 13% 19% 38% 13%
n 70 70 70 70 70 70 68
Table 5-34: Fuel Type of Secondary Space Heating Systems by EDC
Fuel Type Duquesne MetEd Penelec Penn Power WPP PPL PECO
Natural Gas 69% 5% 15% 62% 15% 6% 35%
Electric 31% 41% 43% 30% 39% 66% 48%
Oil 0% 10% 15% 8% 11% 5% 0%
Coal 0% 6% 0% 0% 0% 3% 0%
Dual Fuel 0% 0% 0% 0% 6% 0% 0%
Propane 0% 5% 8% 0% 0% 6% 0%
Wood 0% 32% 15% 0% 28% 14% 17%
Other 0% 0% 4% 0% 0% 0% 0%
Grand Total 100% 100% 100% 100% 100% 100% 100%
n 10 16 18 9 18 40 6
Primary System Type. Between 27% and 75% of primary heating systems are central furnaces. The next most common systems are boilers and heat pump systems.
Table 5-35: System Type of Primary Space Heating Systems by EDC
Fuel Type Duquesne MetEd Penelec Penn Power WPP PPL PECO
Central Furnaces 75% 60% 60% 68% 58% 27% 64%
Heat Pumps 7% 9% 5% 17% 21% 12% 9%
Boilers 15% 15% 20% 10% 8% 32% 22%
Baseboard 0% 10% 8% 2% 7% 15% 0%
Stoves 1% 2% 4% 4% 6% 11% 0%
Space Heaters 0% 2% 1% 0% 0% 2% 5%
Other 2% 3% 2% 0% 0% 1% 0%
Grand Total 100% 100% 100% 100% 100% 100% 100%
n 69 68 66 70 68 68 63
Primary Electric Heating System Type. Although there is only a limited sample of primary electric heating systems within each EDC, the system type among electric space heating is shown below. Air Source Heat Pumps are typically the most common, ranging from 17% (MetEd) to 82% (Duquesne) across the EDCs. Baseboard and central furnaces are also common forms of primary electric heating.
Table 5-36: System Type of Primary Electric Heating Systems by EDC
Fuel Type Duquesne MetEd Penelec Penn Power WPP PPL PECO
Air Source Heat Pump 82% 17% 27% 63% 57% 36% 45%
Baseboard 0% 35% 40% 8% 21% 50% 0%
Furnace 18% 22% 6% 12% 18% 7% 31%
Boiler 0% 0% 0% 12% 0% 0% 0%
Geothermal Heat Pump 0% 19% 27% 5% 4% 3% 0%
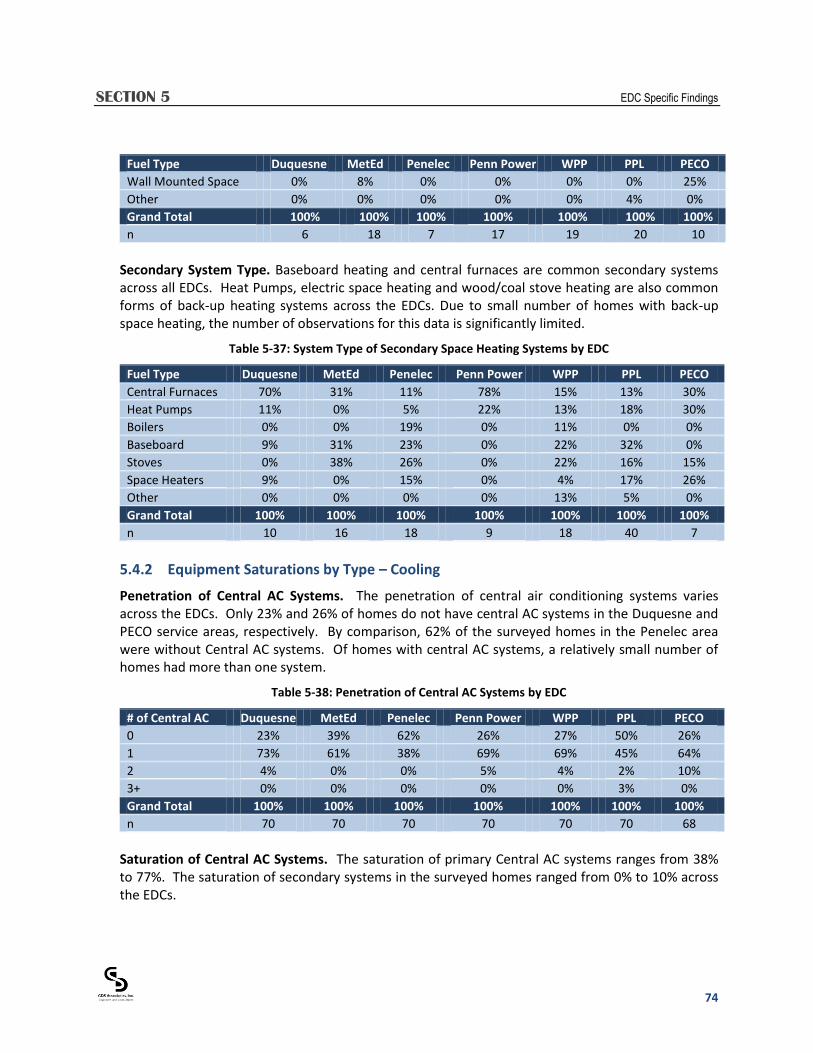
SECTION 5 EDC Specific Findings
74
Fuel Type Duquesne MetEd Penelec Penn Power WPP PPL PECO
Wall Mounted Space 0% 8% 0% 0% 0% 0% 25%
Other 0% 0% 0% 0% 0% 4% 0%
Grand Total 100% 100% 100% 100% 100% 100% 100%
n 6 18 7 17 19 20 10
Secondary System Type. Baseboard heating and central furnaces are common secondary systems across all EDCs. Heat Pumps, electric space heating and wood/coal stove heating are also common forms of back-up heating systems across the EDCs. Due to small number of homes with back-up space heating, the number of observations for this data is significantly limited.
Table 5-37: System Type of Secondary Space Heating Systems by EDC
Fuel Type Duquesne MetEd Penelec Penn Power WPP PPL PECO
Central Furnaces 70% 31% 11% 78% 15% 13% 30%
Heat Pumps 11% 0% 5% 22% 13% 18% 30%
Boilers 0% 0% 19% 0% 11% 0% 0%
Baseboard 9% 31% 23% 0% 22% 32% 0%
Stoves 0% 38% 26% 0% 22% 16% 15%
Space Heaters 9% 0% 15% 0% 4% 17% 26%
Other 0% 0% 0% 0% 13% 5% 0%
Grand Total 100% 100% 100% 100% 100% 100% 100%
n 10 16 18 9 18 40 7
5.4.2 Equipment Saturations by Type – Cooling
Penetration of Central AC Systems. The penetration of central air conditioning systems varies across the EDCs. Only 23% and 26% of homes do not have central AC systems in the Duquesne and PECO service areas, respectively. By comparison, 62% of the surveyed homes in the Penelec area were without Central AC systems. Of homes with central AC systems, a relatively small number of homes had more than one system.
Table 5-38: Penetration of Central AC Systems by EDC
# of Central AC Duquesne MetEd Penelec Penn Power WPP PPL PECO
0 23% 39% 62% 26% 27% 50% 26%
1 73% 61% 38% 69% 69% 45% 64%
2 4% 0% 0% 5% 4% 2% 10%
3+ 0% 0% 0% 0% 0% 3% 0%
Grand Total 100% 100% 100% 100% 100% 100% 100%
n 70 70 70 70 70 70 68
Saturation of Central AC Systems. The saturation of primary Central AC systems ranges from 38% to 77%. The saturation of secondary systems in the surveyed homes ranged from 0% to 10% across the EDCs.

SECTION 5 EDC Specific Findings
75
Table 5-39: Saturation of Central AC Systems by EDC
Saturation Duquesne MetEd Penelec Penn Power WPP PPL PECO
Primary 77% 61% 38% 74% 73% 50% 72%
Secondary 4% 0% 0% 5% 4% 10% 9%
n 70 70 70 70 70 70 68
Central AC System Type. While traditional central AC systems are the predominant system type for cooling (range of 59% to 92% across the seven EDCs), nearly every EDC also demonstrated the presence of air-source heat pump systems, mini-split systems, and geothermal systems.
Table 5-40: Central Air Conditioning System Type by EDC
Central AC Type Duquesne MetEd Penelec Penn Power WPP PPL PECO
Central AC Unit 87% 84% 85% 75% 73% 59% 92%
Central AC Unit (Mini Split) 0% 0% 3% 0% 0% 4% 0%
Geothermal 0% 7% 6% 2% 2% 2% 0%
Heat Pump 13% 9% 0% 24% 25% 32% 8%
Heat Pump (Mini Split) 0% 0% 6% 0% 0% 3% 0%
Grand Total 100% 100% 100% 100% 100% 100% 100%
n 55 44 23 53 51 35 45
Penetration of Room AC Systems. The penetration of room air conditioning systems varies across the EDCs. Between 20% and 46% of homes surveyed have at least one room air conditioner. In addition, a relatively large percent of the surveyed homes have two or more air conditioners per household.
Table 5-41: Penetration of Room Air Conditioners by EDC
# of Room AC Duquesne MetEd Penelec Penn Power WPP PPL PECO
0 80% 54% 70% 73% 77% 58% 75%
1 8% 20% 11% 20% 11% 16% 5%
2 8% 13% 13% 7% 7% 19% 15%
3+ 5% 13% 7% 0% 5% 7% 6%
Grand Total 100% 100% 100% 100% 100% 100% 100%
n 70 70 70 70 70 70 68
Saturation of Room AC Systems. The total saturation of room air conditioners by EDC ranged from 34% (Penn Power) to 88% (Met Ed).
Table 5-42: Saturation of Room Air Conditioners by EDC
Saturation Duquesne MetEd Penelec Penn Power WPP PPL PECO
Room ACs 43% 88% 57% 34% 42% 76% 49%
n 70 70 70 70 70 70 68

SECTION 5 EDC Specific Findings
76
5.4.3 Efficiency Levels
Central AC SEER Rating. The Central AC efficiency was infrequently provided on the equipment, but where the make and model were available the SWE team recorded and researched manufacturer data. The majority of Central AC systems were found to currently have a SEER rating below current federal minimum standards (SEER 13). Less than 18% of all Central AC systems (including heat pumps, geothermal and mini split systems) across all the EDCs were found to currently meet ENERGY STAR criteria of 14.5 SEER or better.
Table 5-43: Central AC System SEER Ratings by EDC
SEER Rating Duquesne MetEd Penelec Penn Power WPP PPL PECO
Below 13 47% 37% 36% 60% 47% 44% 3%
13 22% 32% 14% 13% 21% 29% 13%
14 8% 0% 0% 4% 3% 8% 17%
14.5 or above 3% 3% 18% 8% 9% 6% 0%
Don't Know 20% 28% 33% 14% 20% 13% 67%
Grand Total 100% 100% 100% 100% 100% 100% 100%
n 55 44 23 53 51 35 45
This table includes the Central AC systems where the SEER rating was unable to be determined. It is probable that a majority of these unknown systems are currently at or below the current minimum standard as manufacturer data was often unavailable for older systems. Also, note that the sample size is limited for Central AC systems as not all households currently utilize Central AC systems for cooling needs. ENERGY STAR Room Air Conditioners. 4% - 35% of room air conditioners were ENERGY STAR rated across the EDCs. The SWE team documentation of ENERGY STAR Room ACs was based on the ability to visually detect the label or determine that a particular model was ENERGY STAR rated by searching for the make and model number on the ENERGY STAR website or manufacturer data. The number of room air conditioners with make/model number detail available is listed to demonstrate the limited sample size associated with this metric.
Table 5-44: ENERGY STAR Room Air Conditioners by EDC
ENERGY STAR Room AC Duquesne MetEd Penelec Penn
Power WPP PPL PECO
Yes 12% 24% 12% 4% 24% 35% 9%
No 88% 76% 88% 96% 76% 65% 91%
Grand Total 100% 100% 100% 100% 100% 100% 100%
n 27 57 35 21 28 51 34
Programmable Thermostats. Roughly half of Central HVAC systems had a programmable thermostat
installed, ranging from 39% (Penn Power) to 72% in the PECO service area. Homes without central
systems were not included in this metric.
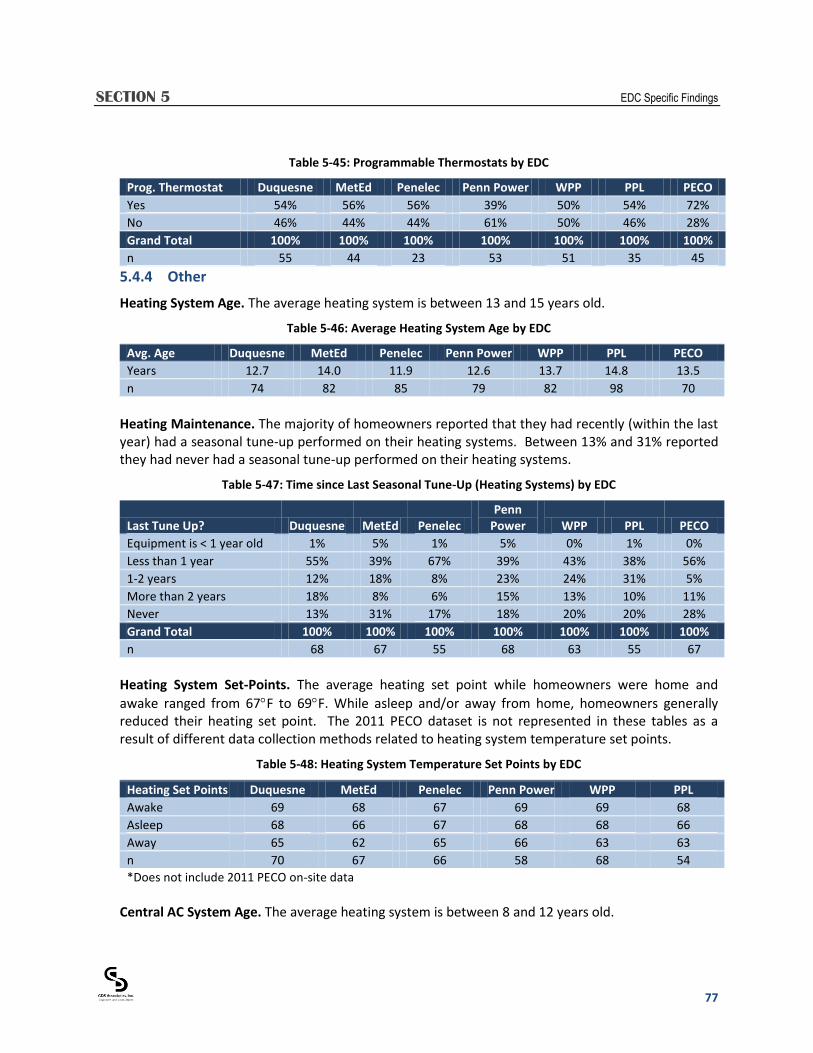
SECTION 5 EDC Specific Findings
77
Table 5-45: Programmable Thermostats by EDC
Prog. Thermostat Duquesne MetEd Penelec Penn Power WPP PPL PECO
Yes 54% 56% 56% 39% 50% 54% 72%
No 46% 44% 44% 61% 50% 46% 28%
Grand Total 100% 100% 100% 100% 100% 100% 100%
n 55 44 23 53 51 35 45
5.4.4 Other
Heating System Age. The average heating system is between 13 and 15 years old.
Table 5-46: Average Heating System Age by EDC
Avg. Age Duquesne MetEd Penelec Penn Power WPP PPL PECO
Years 12.7 14.0 11.9 12.6 13.7 14.8 13.5
n 74 82 85 79 82 98 70
Heating Maintenance. The majority of homeowners reported that they had recently (within the last year) had a seasonal tune-up performed on their heating systems. Between 13% and 31% reported they had never had a seasonal tune-up performed on their heating systems.
Table 5-47: Time since Last Seasonal Tune-Up (Heating Systems) by EDC
Last Tune Up? Duquesne MetEd Penelec Penn
Power WPP PPL PECO
Equipment is < 1 year old 1% 5% 1% 5% 0% 1% 0%
Less than 1 year 55% 39% 67% 39% 43% 38% 56%
1-2 years 12% 18% 8% 23% 24% 31% 5%
More than 2 years 18% 8% 6% 15% 13% 10% 11%
Never 13% 31% 17% 18% 20% 20% 28%
Grand Total 100% 100% 100% 100% 100% 100% 100%
n 68 67 55 68 63 55 67
Heating System Set-Points. The average heating set point while homeowners were home and
awake ranged from 67F to 69F. While asleep and/or away from home, homeowners generally reduced their heating set point. The 2011 PECO dataset is not represented in these tables as a result of different data collection methods related to heating system temperature set points.
Table 5-48: Heating System Temperature Set Points by EDC
Heating Set Points Duquesne MetEd Penelec Penn Power WPP PPL
Awake 69 68 67 69 69 68
Asleep 68 66 67 68 68 66
Away 65 62 65 66 63 63
n 70 67 66 58 68 54
*Does not include 2011 PECO on-site data
Central AC System Age. The average heating system is between 8 and 12 years old.
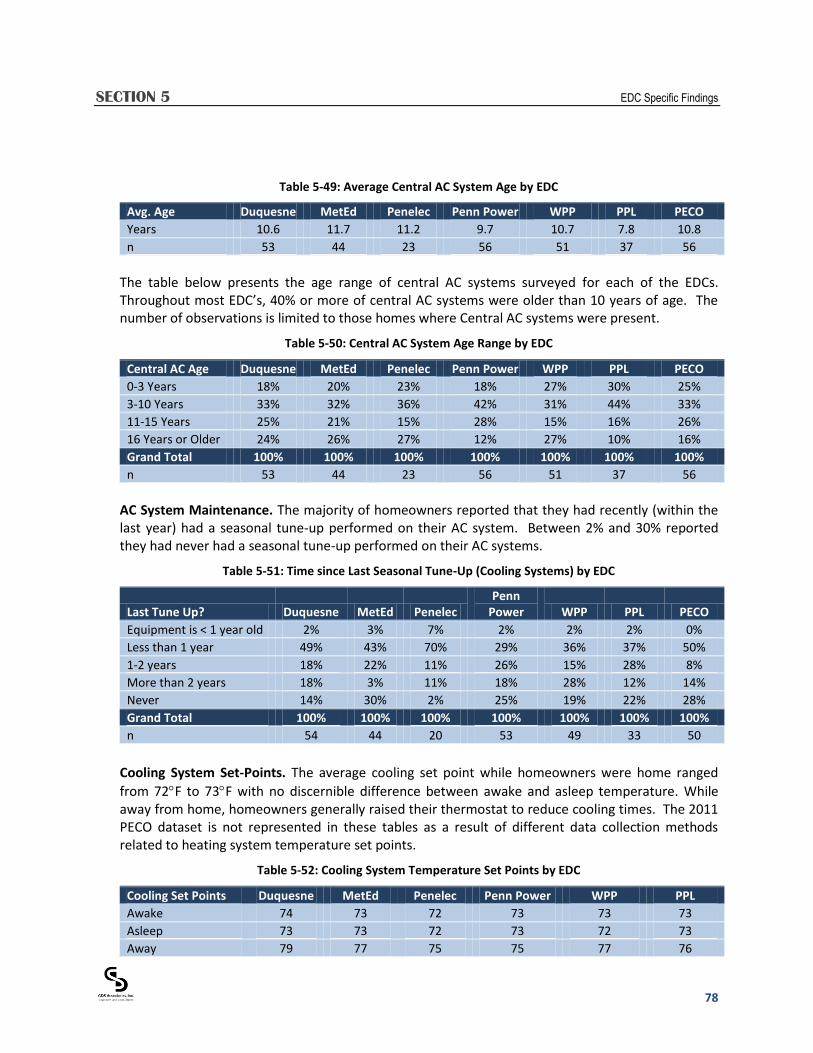
SECTION 5 EDC Specific Findings
78
Table 5-49: Average Central AC System Age by EDC
Avg. Age Duquesne MetEd Penelec Penn Power WPP PPL PECO
Years 10.6 11.7 11.2 9.7 10.7 7.8 10.8
n 53 44 23 56 51 37 56
The table below presents the age range of central AC systems surveyed for each of the EDCs. Throughout most EDC’s, 40% or more of central AC systems were older than 10 years of age. The number of observations is limited to those homes where Central AC systems were present.
Table 5-50: Central AC System Age Range by EDC
Central AC Age Duquesne MetEd Penelec Penn Power WPP PPL PECO
0-3 Years 18% 20% 23% 18% 27% 30% 25%
3-10 Years 33% 32% 36% 42% 31% 44% 33%
11-15 Years 25% 21% 15% 28% 15% 16% 26%
16 Years or Older 24% 26% 27% 12% 27% 10% 16%
Grand Total 100% 100% 100% 100% 100% 100% 100%
n 53 44 23 56 51 37 56
AC System Maintenance. The majority of homeowners reported that they had recently (within the last year) had a seasonal tune-up performed on their AC system. Between 2% and 30% reported they had never had a seasonal tune-up performed on their AC systems.
Table 5-51: Time since Last Seasonal Tune-Up (Cooling Systems) by EDC
Last Tune Up? Duquesne MetEd Penelec Penn
Power WPP PPL PECO
Equipment is < 1 year old 2% 3% 7% 2% 2% 2% 0%
Less than 1 year 49% 43% 70% 29% 36% 37% 50%
1-2 years 18% 22% 11% 26% 15% 28% 8%
More than 2 years 18% 3% 11% 18% 28% 12% 14%
Never 14% 30% 2% 25% 19% 22% 28%
Grand Total 100% 100% 100% 100% 100% 100% 100%
n 54 44 20 53 49 33 50
Cooling System Set-Points. The average cooling set point while homeowners were home ranged
from 72F to 73F with no discernible difference between awake and asleep temperature. While away from home, homeowners generally raised their thermostat to reduce cooling times. The 2011 PECO dataset is not represented in these tables as a result of different data collection methods related to heating system temperature set points.
Table 5-52: Cooling System Temperature Set Points by EDC
Cooling Set Points Duquesne MetEd Penelec Penn Power WPP PPL
Awake 74 73 72 73 73 73
Asleep 73 73 72 73 72 73
Away 79 77 75 75 77 76
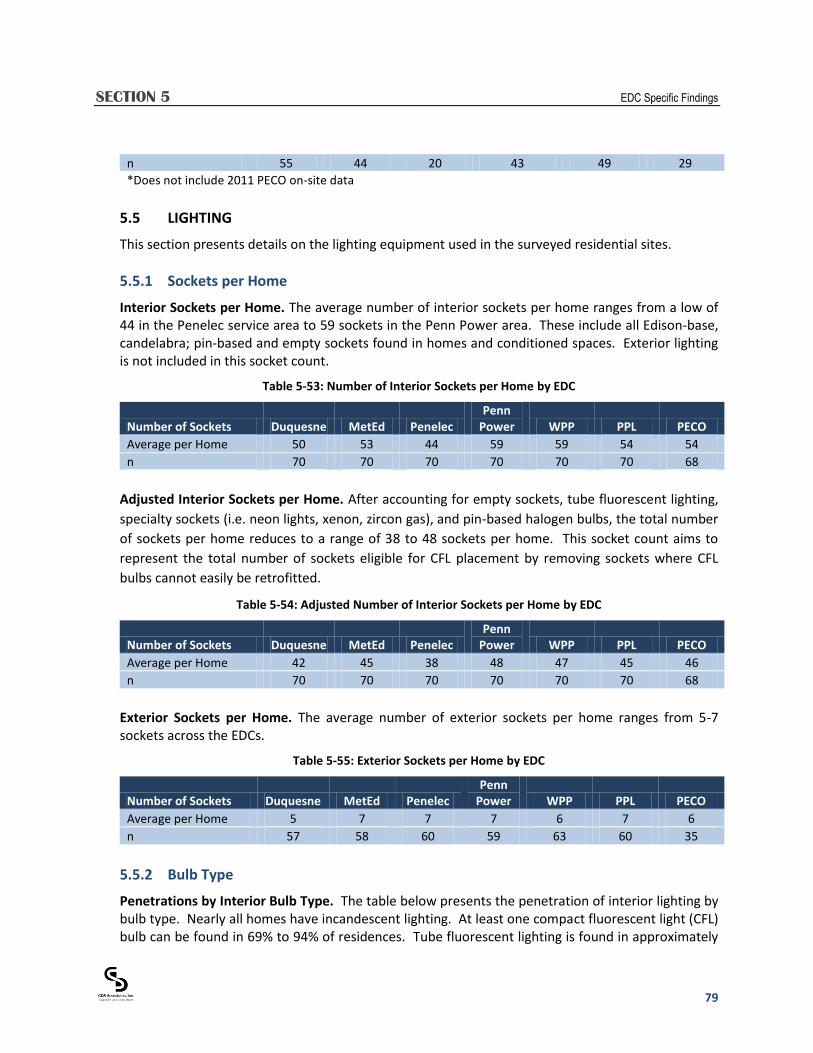
SECTION 5 EDC Specific Findings
79
n 55 44 20 43 49 29
*Does not include 2011 PECO on-site data
5.5 LIGHTING
This section presents details on the lighting equipment used in the surveyed residential sites.
5.5.1 Sockets per Home
Interior Sockets per Home. The average number of interior sockets per home ranges from a low of 44 in the Penelec service area to 59 sockets in the Penn Power area. These include all Edison-base, candelabra; pin-based and empty sockets found in homes and conditioned spaces. Exterior lighting is not included in this socket count.
Table 5-53: Number of Interior Sockets per Home by EDC
Number of Sockets Duquesne MetEd Penelec Penn
Power WPP PPL PECO
Average per Home 50 53 44 59 59 54 54
n 70 70 70 70 70 70 68
Adjusted Interior Sockets per Home. After accounting for empty sockets, tube fluorescent lighting,
specialty sockets (i.e. neon lights, xenon, zircon gas), and pin-based halogen bulbs, the total number
of sockets per home reduces to a range of 38 to 48 sockets per home. This socket count aims to
represent the total number of sockets eligible for CFL placement by removing sockets where CFL
bulbs cannot easily be retrofitted.
Table 5-54: Adjusted Number of Interior Sockets per Home by EDC
Number of Sockets Duquesne MetEd Penelec Penn
Power WPP PPL PECO
Average per Home 42 45 38 48 47 45 46
n 70 70 70 70 70 70 68
Exterior Sockets per Home. The average number of exterior sockets per home ranges from 5-7 sockets across the EDCs.
Table 5-55: Exterior Sockets per Home by EDC
Number of Sockets Duquesne MetEd Penelec Penn
Power WPP PPL PECO
Average per Home 5 7 7 7 6 7 6
n 57 58 60 59 63 60 35
5.5.2 Bulb Type
Penetrations by Interior Bulb Type. The table below presents the penetration of interior lighting by bulb type. Nearly all homes have incandescent lighting. At least one compact fluorescent light (CFL) bulb can be found in 69% to 94% of residences. Tube fluorescent lighting is found in approximately

SECTION 5 EDC Specific Findings
80
three-fourths of most residences. Halogen bulbs are found in less than half of all homes. LED bulbs are currently found in less than 16% of all homes.
Table 5-56: Penetration of Lighting by Interior Bulb Type by EDC
Bulb Type (Penetration) Duquesne MetEd Penelec Penn Power WPP PPL PECO
CFL 77% 94% 69% 91% 88% 83% 82%
Halogen 41% 33% 23% 38% 27% 37% 38%
Incandescent 100% 99% 95% 100% 100% 99% 100%
LED 11% 16% 2% 15% 12% 15% 1%
Tube Fluorescent 72% 77% 72% 78% 76% 64% 71%
Other 16% 11% 7% 27% 28% 34% 6%
n 70 70 70 70 70 70 68
Saturations by Interior Bulb Type. Depending on the EDC, incandescent bulbs account for anywhere between 59% and 66% of all sockets in residences throughout Pennsylvania. While CFLs can be found in over two-thirds of houses (in six out of seven EDCs), CFL bulbs only account for 16% to 19% of all sockets. Tube fluorescent and halogen bulbs make the dominant majority of remaining sockets.
Table 5-57: Saturation of Lighting by Interior Bulb Type by EDC
Bulb Type (Saturation) Duquesne MetEd Penelec Penn Power WPP PPL PECO
CFL 16% 19% 15% 18% 19% 16% 18%
Halogen 5% 4% 5% 6% 3% 6% 3%
Incandescent 65% 62% 66% 61% 59% 64% 66%
LED 0% 1% 0% 0% 0% 1% 0%
Tube Fluorescent 13% 12% 14% 13% 17% 12% 12%
Other 1% 1% 1% 2% 1% 2% 1%
Grand Total 100% 100% 100% 100% 100% 100% 100%
n 3663 3605 2938 4057 4354 3839 3778
CFL/LED Saturations based on Adjusted Interior Sockets. The table below presents the saturation of CFL and LED bulbs as a percent of sockets where high efficiency lighting could reasonably be achieved and excludes sockets where CFL/LED placement would be difficult or unrealistic.
Table 5-58: CFL/LED Saturations based on Eligible Sockets by EDC
Bulb Type (Saturation) Duquesne MetEd Penelec Penn Power WPP PPL PECO
CFL 20% 22% 18% 22% 23% 20% 21%
LED 0% 2% 0% 0% 1% 1% 1%
n 3014 3089 2497 3323 3484 3154 3147
Saturations by Exterior Bulb Type. Incandescent bulbs account for anywhere between 57% and 78% of all exterior sockets in residences throughout Pennsylvania. Halogen and CFL lighting are the next most common forms of exterior lighting, ranging from 6% to 26% and 2% to 18% of exterior sockets, respectively.

SECTION 5 EDC Specific Findings
81
Table 5-59: Saturation of Lighting by Exterior Bulb Type by EDC
Bulb Type (Saturation) Duquesne MetEd Penelec Penn Power WPP PPL PECO
CFL 9% 9% 2% 16% 18% 11% 18%
Halogen 26% 13% 21% 6% 14% 11% 7%
Incandescent 57% 78% 74% 74% 66% 74% 61%
LED 1% 0% 0% 0% 0% 0% 0%
Tube Fluorescent 4% 0% 2% 1% 0% 2% 11%
Other 4% 0% 1% 3% 2% 2% 4%
Grand Total 100% 100% 100% 100% 100% 100% 100%
n 309 344 418 377 447 398 204
Average Wattage by Interior Bulb Type. The table below presents the average wattage of interior lighting by bulb type. The average wattage of incandescent bulbs ranged between 54W and 57W, suggesting a heavier mix of 40W and 60W bulbs than 75W to 100W bulbs in interior sockets. The average wattage of CFL bulbs ranges from 15W to 21W.
Table 5-60: Average Wattage by Bulb Type by EDC
Avg. Wattage Duquesne MetEd Penelec Penn Power WPP PPL PECO
CFL 17 15 21 16 18 16 15
Halogen 44 53 58 49 53 40 50
Incandescent 56 55 57 54 54 56 55
LED 7 14 - 7 28 7 2
Tube Fluorescent 48 34 41 44 40 46 39
n (for CFL Wattage) 575 676 465 741 679 608 345
5.5.3 Lighting Saturations by Room
Socket by Room Type. Across the EDCs the majority of lighting was found in bedrooms, followed closely by other high and medium use areas such as bathrooms, basements, kitchens, and living rooms. Closets, garages, and other rooms (i.e. attics, storage, etc.) are common low daily use areas, and represent anywhere from 7-14% of interior sockets.
Table 5-61: Interior Socket Saturation by Room Type by EDC
Room Type Duquesne MetEd Penelec Penn Power WPP PPL PECO
Basement 11% 14% 17% 11% 14% 14% 16%
Bathroom 14% 13% 14% 15% 14% 14% 14%
Bedroom 20% 18% 17% 17% 17% 17% 17%
Closet 3% 3% 2% 3% 3% 4% 2%
Dining Room 9% 6% 6% 7% 6% 5% 7%
Foyer/Hallway 8% 8% 6% 7% 7% 7% 10%
Garage 6% 5% 6% 6% 8% 5% 2%
Kitchen 13% 12% 12% 11% 11% 13% 12%
Living Room 12% 10% 10% 12% 13% 11% 14%
Office/Den 5% 4% 3% 7% 4% 4% 2%
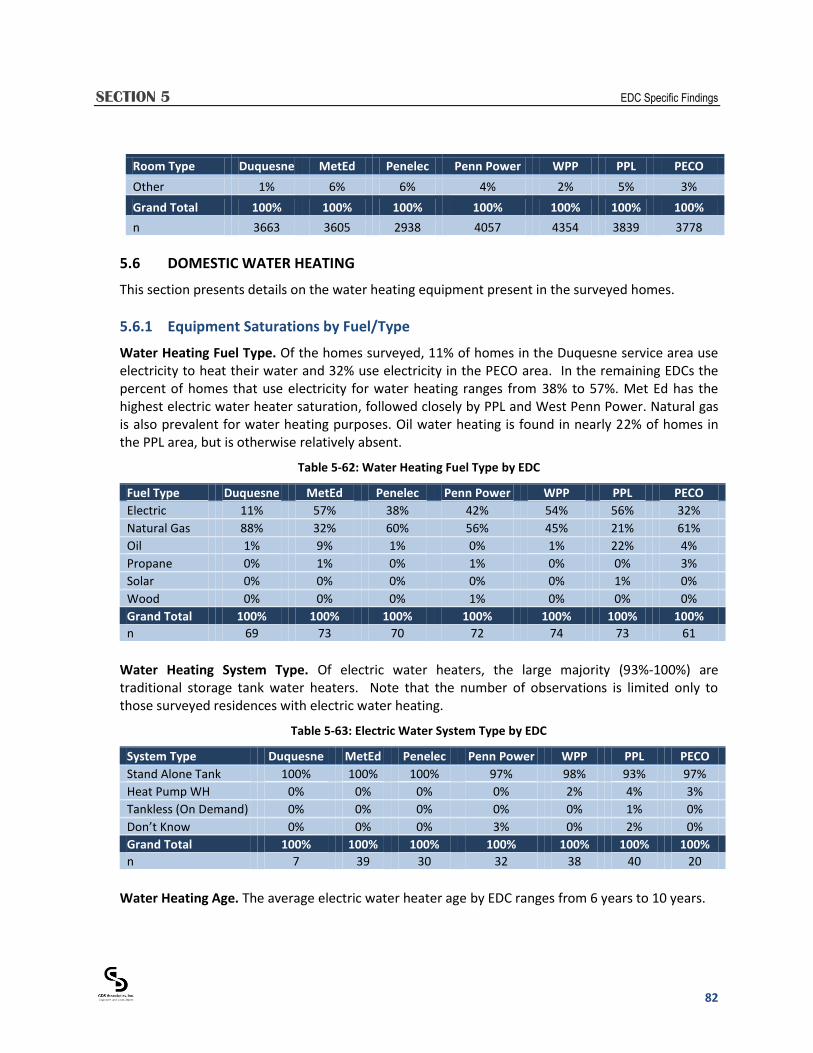
SECTION 5 EDC Specific Findings
82
Room Type Duquesne MetEd Penelec Penn Power WPP PPL PECO
Other 1% 6% 6% 4% 2% 5% 3%
Grand Total 100% 100% 100% 100% 100% 100% 100%
n 3663 3605 2938 4057 4354 3839 3778
5.6 DOMESTIC WATER HEATING
This section presents details on the water heating equipment present in the surveyed homes.
5.6.1 Equipment Saturations by Fuel/Type
Water Heating Fuel Type. Of the homes surveyed, 11% of homes in the Duquesne service area use electricity to heat their water and 32% use electricity in the PECO area. In the remaining EDCs the percent of homes that use electricity for water heating ranges from 38% to 57%. Met Ed has the highest electric water heater saturation, followed closely by PPL and West Penn Power. Natural gas is also prevalent for water heating purposes. Oil water heating is found in nearly 22% of homes in the PPL area, but is otherwise relatively absent.
Table 5-62: Water Heating Fuel Type by EDC
Fuel Type Duquesne MetEd Penelec Penn Power WPP PPL PECO
Electric 11% 57% 38% 42% 54% 56% 32%
Natural Gas 88% 32% 60% 56% 45% 21% 61%
Oil 1% 9% 1% 0% 1% 22% 4%
Propane 0% 1% 0% 1% 0% 0% 3%
Solar 0% 0% 0% 0% 0% 1% 0%
Wood 0% 0% 0% 1% 0% 0% 0%
Grand Total 100% 100% 100% 100% 100% 100% 100%
n 69 73 70 72 74 73 61
Water Heating System Type. Of electric water heaters, the large majority (93%-100%) are traditional storage tank water heaters. Note that the number of observations is limited only to those surveyed residences with electric water heating.
Table 5-63: Electric Water System Type by EDC
System Type Duquesne MetEd Penelec Penn Power WPP PPL PECO
Stand Alone Tank 100% 100% 100% 97% 98% 93% 97%
Heat Pump WH 0% 0% 0% 0% 2% 4% 3%
Tankless (On Demand) 0% 0% 0% 0% 0% 1% 0%
Don’t Know 0% 0% 0% 3% 0% 2% 0%
Grand Total 100% 100% 100% 100% 100% 100% 100%
n 7 39 30 32 38 40 20
Water Heating Age. The average electric water heater age by EDC ranges from 6 years to 10 years.
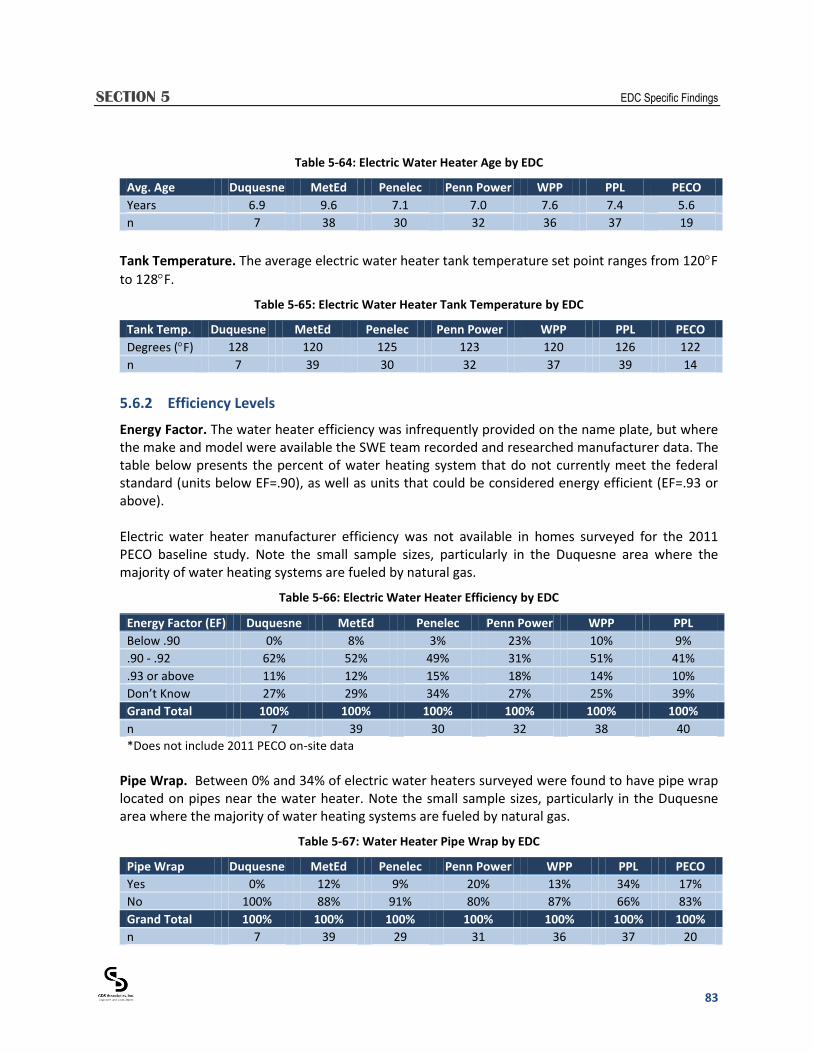
SECTION 5 EDC Specific Findings
83
Table 5-64: Electric Water Heater Age by EDC
Avg. Age Duquesne MetEd Penelec Penn Power WPP PPL PECO
Years 6.9 9.6 7.1 7.0 7.6 7.4 5.6
n 7 38 30 32 36 37 19
Tank Temperature. The average electric water heater tank temperature set point ranges from 120F
to 128F.
Table 5-65: Electric Water Heater Tank Temperature by EDC
Tank Temp. Duquesne MetEd Penelec Penn Power WPP PPL PECO
Degrees (F) 128 120 125 123 120 126 122
n 7 39 30 32 37 39 14
5.6.2 Efficiency Levels
Energy Factor. The water heater efficiency was infrequently provided on the name plate, but where the make and model were available the SWE team recorded and researched manufacturer data. The table below presents the percent of water heating system that do not currently meet the federal standard (units below EF=.90), as well as units that could be considered energy efficient (EF=.93 or above). Electric water heater manufacturer efficiency was not available in homes surveyed for the 2011 PECO baseline study. Note the small sample sizes, particularly in the Duquesne area where the majority of water heating systems are fueled by natural gas.
Table 5-66: Electric Water Heater Efficiency by EDC
Energy Factor (EF) Duquesne MetEd Penelec Penn Power WPP PPL
Below .90 0% 8% 3% 23% 10% 9%
.90 - .92 62% 52% 49% 31% 51% 41%
.93 or above 11% 12% 15% 18% 14% 10%
Don’t Know 27% 29% 34% 27% 25% 39%
Grand Total 100% 100% 100% 100% 100% 100%
n 7 39 30 32 38 40
*Does not include 2011 PECO on-site data
Pipe Wrap. Between 0% and 34% of electric water heaters surveyed were found to have pipe wrap located on pipes near the water heater. Note the small sample sizes, particularly in the Duquesne area where the majority of water heating systems are fueled by natural gas.
Table 5-67: Water Heater Pipe Wrap by EDC
Pipe Wrap Duquesne MetEd Penelec Penn Power WPP PPL PECO
Yes 0% 12% 9% 20% 13% 34% 17%
No 100% 88% 91% 80% 87% 66% 83%
Grand Total 100% 100% 100% 100% 100% 100% 100%
n 7 39 29 31 36 37 20
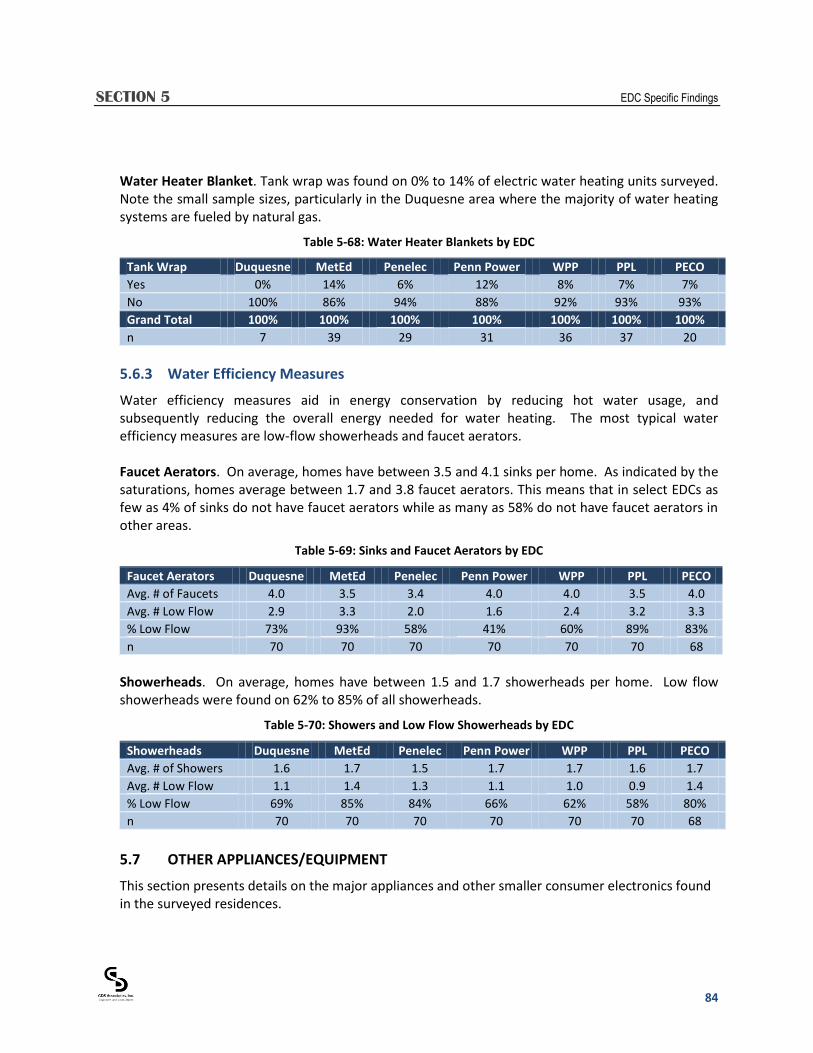
SECTION 5 EDC Specific Findings
84
Water Heater Blanket. Tank wrap was found on 0% to 14% of electric water heating units surveyed. Note the small sample sizes, particularly in the Duquesne area where the majority of water heating systems are fueled by natural gas.
Table 5-68: Water Heater Blankets by EDC
Tank Wrap Duquesne MetEd Penelec Penn Power WPP PPL PECO
Yes 0% 14% 6% 12% 8% 7% 7%
No 100% 86% 94% 88% 92% 93% 93%
Grand Total 100% 100% 100% 100% 100% 100% 100%
n 7 39 29 31 36 37 20
5.6.3 Water Efficiency Measures
Water efficiency measures aid in energy conservation by reducing hot water usage, and subsequently reducing the overall energy needed for water heating. The most typical water efficiency measures are low-flow showerheads and faucet aerators. Faucet Aerators. On average, homes have between 3.5 and 4.1 sinks per home. As indicated by the saturations, homes average between 1.7 and 3.8 faucet aerators. This means that in select EDCs as few as 4% of sinks do not have faucet aerators while as many as 58% do not have faucet aerators in other areas.
Table 5-69: Sinks and Faucet Aerators by EDC
Faucet Aerators Duquesne MetEd Penelec Penn Power WPP PPL PECO
Avg. # of Faucets 4.0 3.5 3.4 4.0 4.0 3.5 4.0
Avg. # Low Flow 2.9 3.3 2.0 1.6 2.4 3.2 3.3
% Low Flow 73% 93% 58% 41% 60% 89% 83%
n 70 70 70 70 70 70 68
Showerheads. On average, homes have between 1.5 and 1.7 showerheads per home. Low flow showerheads were found on 62% to 85% of all showerheads.
Table 5-70: Showers and Low Flow Showerheads by EDC
Showerheads Duquesne MetEd Penelec Penn Power WPP PPL PECO
Avg. # of Showers 1.6 1.7 1.5 1.7 1.7 1.6 1.7
Avg. # Low Flow 1.1 1.4 1.3 1.1 1.0 0.9 1.4
% Low Flow 69% 85% 84% 66% 62% 58% 80%
n 70 70 70 70 70 70 68
5.7 OTHER APPLIANCES/EQUIPMENT
This section presents details on the major appliances and other smaller consumer electronics found in the surveyed residences.
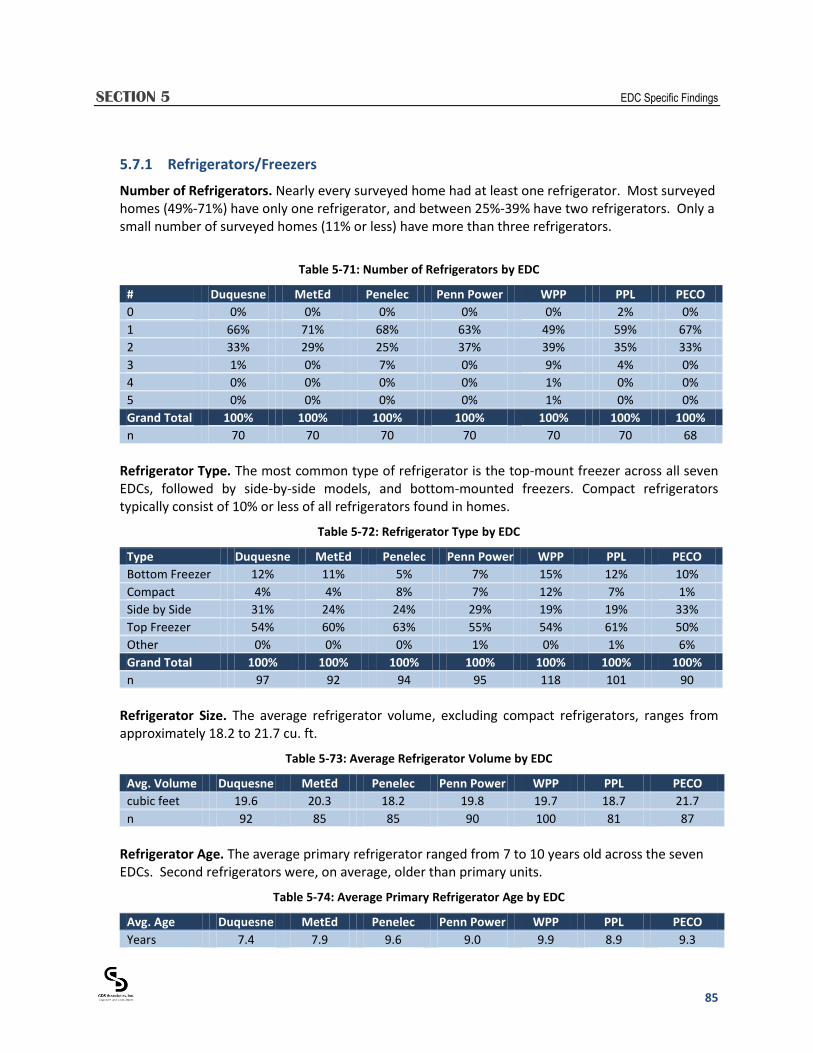
SECTION 5 EDC Specific Findings
85
5.7.1 Refrigerators/Freezers
Number of Refrigerators. Nearly every surveyed home had at least one refrigerator. Most surveyed homes (49%-71%) have only one refrigerator, and between 25%-39% have two refrigerators. Only a small number of surveyed homes (11% or less) have more than three refrigerators.
Table 5-71: Number of Refrigerators by EDC
# Duquesne MetEd Penelec Penn Power WPP PPL PECO
0 0% 0% 0% 0% 0% 2% 0%
1 66% 71% 68% 63% 49% 59% 67%
2 33% 29% 25% 37% 39% 35% 33%
3 1% 0% 7% 0% 9% 4% 0%
4 0% 0% 0% 0% 1% 0% 0%
5 0% 0% 0% 0% 1% 0% 0%
Grand Total 100% 100% 100% 100% 100% 100% 100%
n 70 70 70 70 70 70 68
Refrigerator Type. The most common type of refrigerator is the top-mount freezer across all seven EDCs, followed by side-by-side models, and bottom-mounted freezers. Compact refrigerators typically consist of 10% or less of all refrigerators found in homes.
Table 5-72: Refrigerator Type by EDC
Type Duquesne MetEd Penelec Penn Power WPP PPL PECO
Bottom Freezer 12% 11% 5% 7% 15% 12% 10%
Compact 4% 4% 8% 7% 12% 7% 1%
Side by Side 31% 24% 24% 29% 19% 19% 33%
Top Freezer 54% 60% 63% 55% 54% 61% 50%
Other 0% 0% 0% 1% 0% 1% 6%
Grand Total 100% 100% 100% 100% 100% 100% 100%
n 97 92 94 95 118 101 90
Refrigerator Size. The average refrigerator volume, excluding compact refrigerators, ranges from approximately 18.2 to 21.7 cu. ft.
Table 5-73: Average Refrigerator Volume by EDC
Avg. Volume Duquesne MetEd Penelec Penn Power WPP PPL PECO
cubic feet 19.6 20.3 18.2 19.8 19.7 18.7 21.7
n 92 85 85 90 100 81 87
Refrigerator Age. The average primary refrigerator ranged from 7 to 10 years old across the seven EDCs. Second refrigerators were, on average, older than primary units.
Table 5-74: Average Primary Refrigerator Age by EDC
Avg. Age Duquesne MetEd Penelec Penn Power WPP PPL PECO
Years 7.4 7.9 9.6 9.0 9.9 8.9 9.3
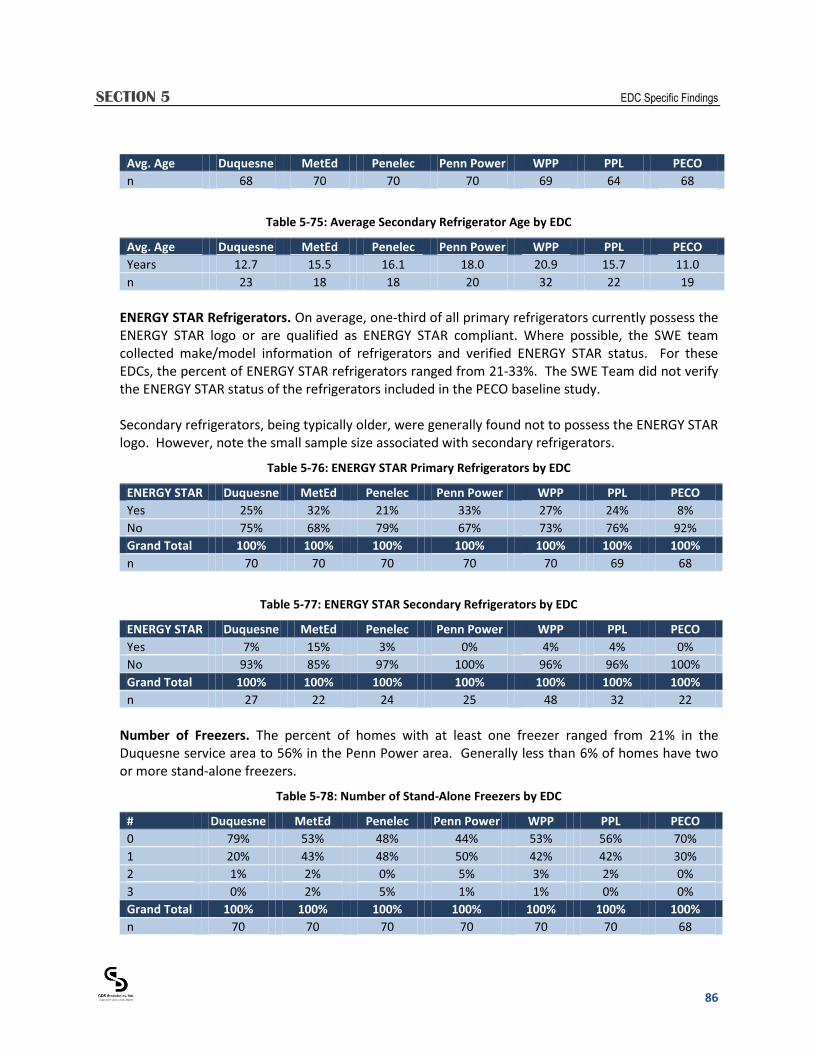
SECTION 5 EDC Specific Findings
86
Avg. Age Duquesne MetEd Penelec Penn Power WPP PPL PECO
n 68 70 70 70 69 64 68
Table 5-75: Average Secondary Refrigerator Age by EDC
Avg. Age Duquesne MetEd Penelec Penn Power WPP PPL PECO
Years 12.7 15.5 16.1 18.0 20.9 15.7 11.0
n 23 18 18 20 32 22 19
ENERGY STAR Refrigerators. On average, one-third of all primary refrigerators currently possess the ENERGY STAR logo or are qualified as ENERGY STAR compliant. Where possible, the SWE team collected make/model information of refrigerators and verified ENERGY STAR status. For these EDCs, the percent of ENERGY STAR refrigerators ranged from 21-33%. The SWE Team did not verify the ENERGY STAR status of the refrigerators included in the PECO baseline study. Secondary refrigerators, being typically older, were generally found not to possess the ENERGY STAR logo. However, note the small sample size associated with secondary refrigerators.
Table 5-76: ENERGY STAR Primary Refrigerators by EDC
ENERGY STAR Duquesne MetEd Penelec Penn Power WPP PPL PECO
Yes 25% 32% 21% 33% 27% 24% 8%
No 75% 68% 79% 67% 73% 76% 92%
Grand Total 100% 100% 100% 100% 100% 100% 100%
n 70 70 70 70 70 69 68
Table 5-77: ENERGY STAR Secondary Refrigerators by EDC
ENERGY STAR Duquesne MetEd Penelec Penn Power WPP PPL PECO
Yes 7% 15% 3% 0% 4% 4% 0%
No 93% 85% 97% 100% 96% 96% 100%
Grand Total 100% 100% 100% 100% 100% 100% 100%
n 27 22 24 25 48 32 22
Number of Freezers. The percent of homes with at least one freezer ranged from 21% in the Duquesne service area to 56% in the Penn Power area. Generally less than 6% of homes have two or more stand-alone freezers.
Table 5-78: Number of Stand-Alone Freezers by EDC
# Duquesne MetEd Penelec Penn Power WPP PPL PECO
0 79% 53% 48% 44% 53% 56% 70%
1 20% 43% 48% 50% 42% 42% 30%
2 1% 2% 0% 5% 3% 2% 0%
3 0% 2% 5% 1% 1% 0% 0%
Grand Total 100% 100% 100% 100% 100% 100% 100%
n 70 70 70 70 70 70 68
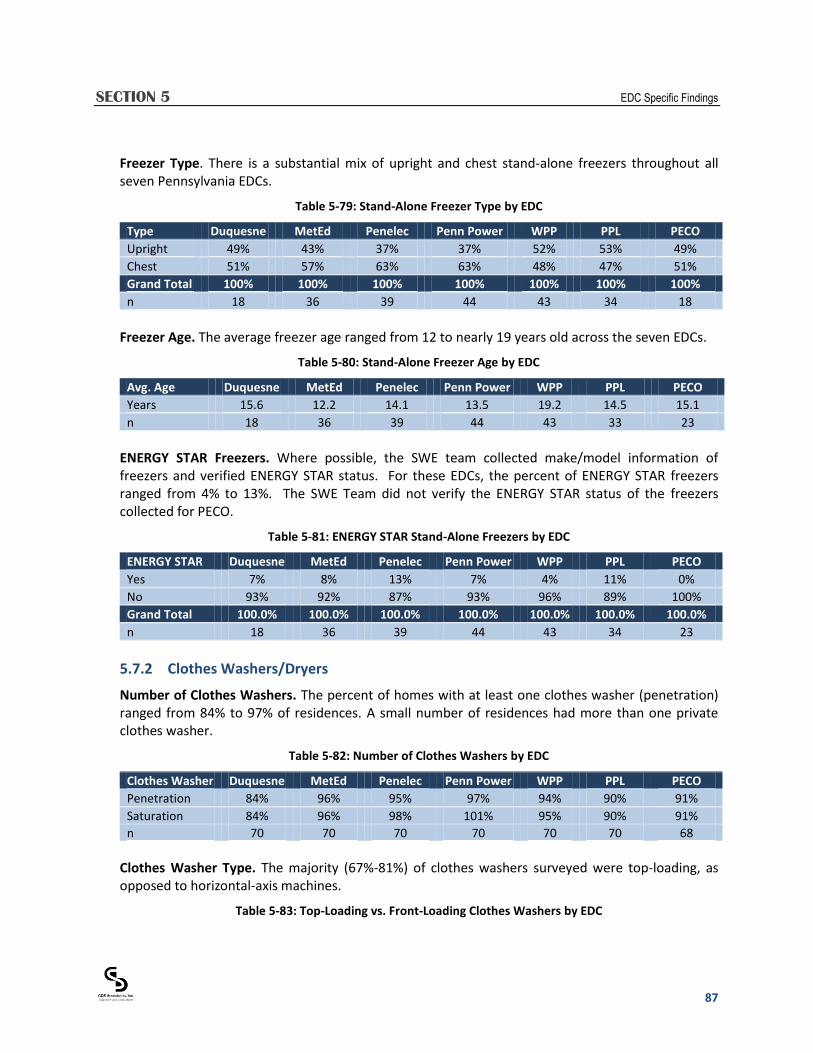
SECTION 5 EDC Specific Findings
87
Freezer Type. There is a substantial mix of upright and chest stand-alone freezers throughout all seven Pennsylvania EDCs.
Table 5-79: Stand-Alone Freezer Type by EDC
Type Duquesne MetEd Penelec Penn Power WPP PPL PECO
Upright 49% 43% 37% 37% 52% 53% 49%
Chest 51% 57% 63% 63% 48% 47% 51%
Grand Total 100% 100% 100% 100% 100% 100% 100%
n 18 36 39 44 43 34 18
Freezer Age. The average freezer age ranged from 12 to nearly 19 years old across the seven EDCs.
Table 5-80: Stand-Alone Freezer Age by EDC
Avg. Age Duquesne MetEd Penelec Penn Power WPP PPL PECO
Years 15.6 12.2 14.1 13.5 19.2 14.5 15.1
n 18 36 39 44 43 33 23
ENERGY STAR Freezers. Where possible, the SWE team collected make/model information of freezers and verified ENERGY STAR status. For these EDCs, the percent of ENERGY STAR freezers ranged from 4% to 13%. The SWE Team did not verify the ENERGY STAR status of the freezers collected for PECO.
Table 5-81: ENERGY STAR Stand-Alone Freezers by EDC
ENERGY STAR Duquesne MetEd Penelec Penn Power WPP PPL PECO
Yes 7% 8% 13% 7% 4% 11% 0%
No 93% 92% 87% 93% 96% 89% 100%
Grand Total 100.0% 100.0% 100.0% 100.0% 100.0% 100.0% 100.0%
n 18 36 39 44 43 34 23
5.7.2 Clothes Washers/Dryers
Number of Clothes Washers. The percent of homes with at least one clothes washer (penetration) ranged from 84% to 97% of residences. A small number of residences had more than one private clothes washer.
Table 5-82: Number of Clothes Washers by EDC
Clothes Washer Duquesne MetEd Penelec Penn Power WPP PPL PECO
Penetration 84% 96% 95% 97% 94% 90% 91%
Saturation 84% 96% 98% 101% 95% 90% 91%
n 70 70 70 70 70 70 68
Clothes Washer Type. The majority (67%-81%) of clothes washers surveyed were top-loading, as opposed to horizontal-axis machines.
Table 5-83: Top-Loading vs. Front-Loading Clothes Washers by EDC

SECTION 5 EDC Specific Findings
88
Type Duquesne MetEd Penelec Penn Power WPP PPL PECO
Front Loading 26% 19% 23% 13% 21% 23% 33%
Top Loading 74% 81% 77% 87% 79% 77% 67%
Grand Total 100% 100% 100% 100% 100% 100% 100%
n 61 65 64 70 68 64 62
Clothes Washer/Water Heating Type. The majority of clothes washers are supplied with either electric or natural gas water heating. The percent of clothes washers with electric water heating ranges from a low of 10% in the Duquesne service area to 57% in the PPL area.
Table 5-84: Clothes Washer/Water Heating Fuel Type by EDC
Fuel Type Duquesne MetEd Penelec Penn Power WPP PPL PECO
Electric 10% 56% 37% 43% 52% 57% 31%
Natural Gas 89% 33% 62% 55% 47% 19% 62%
Oil 2% 9% 1% 0% 1% 23% 4%
Propane 0% 2% 0% 1% 0% 0% 3%
Solar 0% 0% 0% 0% 0% 1% 0%
Wood 0% 0% 0% 1% 0% 0% 0%
Grand Total 100% 100% 100% 100% 100% 100% 100%
n 60 64 63 70 68 64 57
Clothes Washer Age. The average clothes washer ranged from 8 to 11 years old across the seven EDCs.
Table 5-85: Clothes Washer Age by EDC
Avg. Age Duquesne MetEd Penelec Penn Power WPP PPL PECO
Years 9.4 10.1 9.1 10.0 10.7 7.0 7.7
n 58 65 64 69 66 64 62
Loads per Week. The average household washes 5 to 6 loads per week.
Table 5-86: Clothes Washer Loads per Week by EDC
Loads/Week Duquesne MetEd Penelec Penn Power WPP PPL PECO
Avg. Loads 4.7 4.7 5.3 5.0 5.1 5.0 5.6
n 61 65 64 70 68 64 59
ENERGY STAR Clothes Washers. 15% - 33% of clothes washers were ENERGY STAR rated across the EDCs. The SWE team documentation of ENERGY STAR clothes washers was based on the ability to visually detect the label or determine that a particular model was ENERGY STAR rated by searching for the make and model number on the ENERGY STAR website or manufacturer data. The SWE Team did not verify the ENERGY STAR status of the clothes washers included in the PECO baseline study. It should be noted that there are likely occasions where a clothes washer was ENERGY STAR compliant at one time, but may have since lost its rating due to increased efficiency standards.

SECTION 5 EDC Specific Findings
89
Table 5-87: ENERGY STAR Clothes Washers by EDC
ENERGY STAR Duquesne MetEd Penelec Penn Power WPP PPL PECO
Yes 28% 25% 25% 19% 25% 33% 15%
No 72% 75% 75% 81% 75% 67% 85%
Grand Total 100% 100% 100% 100% 100% 100% 100%
n 61 65 64 70 68 64 62
Dryer Fuel Type. Electric dryers are more prevalent on average than natural gas dryers. As expected, dryers that use bottle fuels are rare.
Table 5-88: Dryer Fuel Type by EDC
Fuel Type Duquesne MetEd Penelec Penn Power WPP PPL PECO
Natural Gas 48% 14% 34% 23% 16% 8% 27%
Electric 51% 86% 66% 75% 83% 92% 63%
Propane 2% 0% 0% 2% 1% 0% 10%
Grand Total 100% 100% 100% 100% 100% 100% 100%
n 62 62 62 68 67 61 62
5.7.3 Dishwashers
Number of Dishwashers. 59% to 78% of homes surveyed contained a dishwasher, with a negligible number of homes having more than one.
Table 5-89: Dishwasher Saturation by EDC
Penetration (%) Duquesne MetEd Penelec Penn Power WPP PPL PECO
Dishwashers 78% 75% 59% 78% 71% 66% 76%
n 70 70 70 70 70 70 68
Dishwasher/Water Heating Type. The percent of dishwashers with electric water heating ranges from a low of 10% in the Duquesne service area to 65% in the PPL area.
Table 5-90: Dishwasher/Water Heating Type by EDC
Fuel Type Duquesne MetEd Penelec Penn Power WPP PPL PECO
Electric 10% 52% 35% 47% 53% 65% 30%
Natural Gas 88% 37% 63% 50% 46% 19% 63%
Oil 2% 9% 2% 0% 1% 16% 4%
Propane 0% 2% 0% 2% 0% 0% 3%
Wood 0% 0% 0% 1% 0% 0% 0%
Grand Total 100% 100% 100% 100% 100% 100% 100%
n 55 53 36 52 52 47 48
Dishwasher Age. The average dishwasher age ranged from 8 to 11 years among surveyed residences.

SECTION 5 EDC Specific Findings
90
Table 5-91: Dishwasher Age by EDC
Avg. Age Duquesne MetEd Penelec Penn Power WPP PPL PECO
Years 8.2 11.4 7.7 10.3 8.7 9.2 9.1
n 55 54 36 52 51 45 53
ENERGY STAR Dishwashers. 31% - 52% of dishwashers were ENERGY STAR rated across the EDCs. Where possible, the SWE team collected make/model information of dishwashers and verified ENERGY STAR status. The SWE Team did not verify the ENERGY STAR status of the dishwashers collected for PECO.
Table 5-92: ENERGY STAR Dishwashers by EDC
ENERGY STAR Duquesne MetEd Penelec Penn Power WPP PPL PECO
Yes 40% 35% 52% 37% 37% 42% 31%
No 60% 65% 48% 63% 63% 58% 69%
Grand Total 100% 100% 100% 100% 100% 100% 100%
n 56 54 36 52 52 47 53
5.7.4 Consumer Electronics
Number of Televisions. Nearly every residence surveyed had at least one television. On average, residences had between 2.8 and 3.2 televisions per household.
Table 5-93: Penetration/Saturation of Televisions by EDC
Televisions Duquesne MetEd Penelec Penn Power WPP PPL PECO
Penetration 98% 100% 97% 99% 98% 98% 99%
Saturation 277% 290% 277% 307% 301% 302% 320%
n 70 70 70 70 70 70 68
Television Type/Size. Approximately two-thirds to three-quarters of all televisions are currently estimated to have a screen-size of less than 36 inches. Of televisions with a screen size less than 36 inches, the majority of televisions are cathode ray tube (CRT). As television size increases, the majority of televisions are LCD and Plasma technology.
Table 5-94: Screen Size of Televisions by EDC
Televisions Duquesne MetEd Penelec Penn Power WPP PPL PECO
Greater than 36” 29% 37% 28% 33% 36% 26% 24%
Less than 36” 71% 63% 72% 67% 64% 74% 76%
n 200 198 185 213 220 203 215
Table 5-95: Type of Television (Greater than 36”) by EDC
Greater than 36” Duquesne MetEd Penelec Penn Power WPP PPL PECO
CRT 15% 33% 18% 20% 25% 32% 1%
LCD 64% 34% 69% 55% 47% 37% 55%
Plasma 12% 31% 10% 17% 19% 22% 21%
Other 9% 2% 3% 8% 10% 10% 23%
Grand Total 100% 100% 100% 100% 100% 100% 100%

SECTION 5 EDC Specific Findings
91
n 56 81 50 68 84 51 50
Table 5-96: Type of Television (Less than 36”) by EDC
Less than 36” Duquesne MetEd Penelec Penn Power WPP PPL PECO
CRT 65% 64% 64% 62% 60% 67% 74%
LCD 30% 24% 30% 34% 33% 27% 23%
Plasma 4% 11% 6% 2% 6% 6% 3%
Other 1% 1% 0% 2% 1% 1% 0%
Grand Total 100% 100% 100% 100% 100% 100% 100%
n 144 117 135 145 136 152 165
Number of Desktop/Laptop Computers. 82% or more of homes across the seven Pennsylvania EDCs have at least one PC (desktop and/or laptop) in their home, with the average home containing more than one PC. The penetration/saturation of desktops and laptops are also presented individually below.
Table 5-97: Penetration/Saturation of PCs by EDC
Computers Duquesne MetEd Penelec Penn Power WPP PPL PECO
Penetration 86% 87% 83% 87% 82% 85% 99%
Saturation 161% 141% 150% 169% 130% 154% 202%
n 70 70 70 70 70 70 68
Table 5-98: Penetration/Saturation (Desktop Only) by EDC
Desktop PC Duquesne MetEd Penelec Penn Power WPP PPL PECO
Penetration 55% 70% 64% 61% 60% 66% 70%
Saturation 61% 78% 72% 72% 64% 83% 104%
n 70 70 70 70 70 70 68
Table 5-99: Penetration/Saturation (Laptop Only) by EDC
Laptop PC Duquesne MetEd Penelec Penn Power WPP PPL PECO
Penetration 68% 43% 54% 66% 52% 55% 70%
Saturation 100% 63% 78% 97% 66% 71% 98%
n 70 70 70 70 70 70 68
PC Monitor Type. Twenty-six percent or less of PC Monitors surveyed were equipped with CRT Monitors. The majority of computers utilize LCD flat screen monitors.
Table 5-100: PC Monitor Type by EDC
PC Monitors Duquesne MetEd Penelec Penn Power WPP PPL PECO
CRT 26% 20% 26% 24% 22% 26% 16%
Flat Screen 74% 80% 74% 76% 78% 74% 84%
n 47 53 51 49 46 56 71
Number of Tablet PCs. While relatively new to the market, the overall penetration of tablet PCs ranged from 4% to 15% across the six EDCs surveyed by the SWE team. PECO data was not available for tablet PC market penetration.

SECTION 5 EDC Specific Findings
92
Table 5-101: Penetration/Saturation of Tablet PCs by EDC
Tablet PC Duquesne MetEd Penelec Penn Power WPP PPL
Penetration 12% 4% 14% 8% 15% 10%
Saturation 12% 4% 15% 8% 15% 11%
n 70 70 70 70 70 70
*Does not include 2011 PECO on-site data
Miscellaneous Consumer Electronics. The penetration and saturation data for various small consumer electronics collected by the SWE team are presented below. Similar data from the 2011 PECO baseline study were not available for comparison purposes. Of the surveyed equipment, fax machines and Home Theater systems units are the least common items in the surveyed households. Gaming systems are present in roughly 50% of homes, stereo systems in roughly two-thirds of households. On average, households have at least one DVD player and phone charger.
Table 5-102: Penetration/Saturation of Miscellaneous Electronics by EDC
Misc. Electronics Duquesne MetEd Penelec Penn Power WPP PPL
DVD
Penetration 84% 92% 84% 86% 93% 83%
Saturation 127% 133% 119% 125% 143% 134%
Fax Machine
Penetration 12% 11% 8% 15% 9% 18%
Saturation 12% 11% 8% 15% 9% 23%
Gaming
Penetration 42% 34% 42% 39% 43% 41%
Saturation 52% 46% 55% 61% 62% 63%
Home Theater
Penetration 21% 24% 22% 13% 24% 28%
Saturation 27% 25% 22% 14% 27% 28%
Phone Charger
Penetration 91% 95% 90% 95% 92% 84%
Saturation 171% 188% 182% 198% 177% 169%
Stereo
Penetration 56% 60% 62% 66% 49% 60%
Saturation 67% 86% 83% 86% 58% 72%
VCR
Penetration 39% 42% 59% 49% 47% 38%
Saturation 46% 49% 70% 59% 66% 53%
n 70 70 70 70 70 70
*Does not include 2011 PECO on-site data
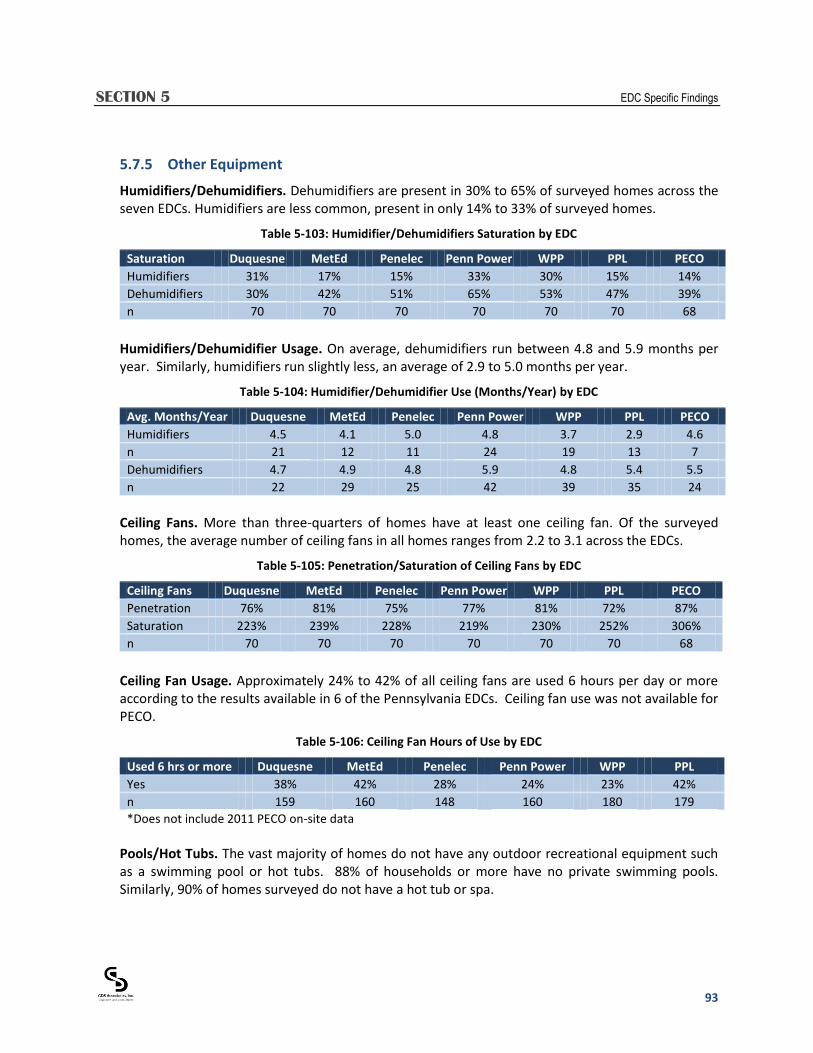
SECTION 5 EDC Specific Findings
93
5.7.5 Other Equipment
Humidifiers/Dehumidifiers. Dehumidifiers are present in 30% to 65% of surveyed homes across the seven EDCs. Humidifiers are less common, present in only 14% to 33% of surveyed homes.
Table 5-103: Humidifier/Dehumidifiers Saturation by EDC
Saturation Duquesne MetEd Penelec Penn Power WPP PPL PECO
Humidifiers 31% 17% 15% 33% 30% 15% 14%
Dehumidifiers 30% 42% 51% 65% 53% 47% 39%
n 70 70 70 70 70 70 68
Humidifiers/Dehumidifier Usage. On average, dehumidifiers run between 4.8 and 5.9 months per year. Similarly, humidifiers run slightly less, an average of 2.9 to 5.0 months per year.
Table 5-104: Humidifier/Dehumidifier Use (Months/Year) by EDC
Avg. Months/Year Duquesne MetEd Penelec Penn Power WPP PPL PECO
Humidifiers 4.5 4.1 5.0 4.8 3.7 2.9 4.6
n 21 12 11 24 19 13 7
Dehumidifiers 4.7 4.9 4.8 5.9 4.8 5.4 5.5
n 22 29 25 42 39 35 24
Ceiling Fans. More than three-quarters of homes have at least one ceiling fan. Of the surveyed homes, the average number of ceiling fans in all homes ranges from 2.2 to 3.1 across the EDCs.
Table 5-105: Penetration/Saturation of Ceiling Fans by EDC
Ceiling Fans Duquesne MetEd Penelec Penn Power WPP PPL PECO
Penetration 76% 81% 75% 77% 81% 72% 87%
Saturation 223% 239% 228% 219% 230% 252% 306%
n 70 70 70 70 70 70 68
Ceiling Fan Usage. Approximately 24% to 42% of all ceiling fans are used 6 hours per day or more according to the results available in 6 of the Pennsylvania EDCs. Ceiling fan use was not available for PECO.
Table 5-106: Ceiling Fan Hours of Use by EDC
Used 6 hrs or more Duquesne MetEd Penelec Penn Power WPP PPL
Yes 38% 42% 28% 24% 23% 42%
n 159 160 148 160 180 179
*Does not include 2011 PECO on-site data
Pools/Hot Tubs. The vast majority of homes do not have any outdoor recreational equipment such as a swimming pool or hot tubs. 88% of households or more have no private swimming pools. Similarly, 90% of homes surveyed do not have a hot tub or spa.

SECTION 5 EDC Specific Findings
94
Table 5-107: Pool/Spa Saturation by EDC
Pool Type Duquesne MetEd Penelec Penn Power WPP PPL
Above Ground 7% 10% 6% 8% 6% 10%
In Ground 0% 1% 3% 2% 2% 2%
Hot Tub/Spa 2% 9% 11% 6% 3% 7%
n 70 70 70 70 70 70
*Does not include 2011 PECO on-site data

SECTION 6 Concluding Remarks
95
6 CONCLUDING REMARKS
Baseline research helps program administrators make educated decisions about the energy end uses and equipment that can be most effectively targeted with energy efficiency programs. Baseline research can also be used to characterize the type and efficiency levels of equipment that are installed in customer homes and businesses. These data serve to confirm program planning assumptions and may also be useful in evaluating energy savings impacts once programs are established. According to the National Energy Efficiency Best Practices Study's Portfolio Best Practices Report, "Objective baseline research reinforces the credibility of the portfolio and its underlying programs with diverse stakeholders and improves the accuracy of savings estimates, cost effectiveness calculations, and goals.18 "
The results of this baseline study effort provide detailed and contemporary information across the seven largest EDCs in the state of Pennsylvania regarding baseline energy equipment saturations as well as electric equipment energy efficiency levels. These findings are intended to feed into the Electric Energy Efficiency Potential Assessment for the State of Pennsylvania conducted by the SWE team. Specifically, the baseline equipment saturation data is anticipated to supplement data collected through recent existing EDC appliance saturation studies, conducted with larger, more robust sample sizes than were possible through this endeavor. However, estimates of electric equipment efficiency levels are typically not a component of traditional appliance saturation assessments and data regarding the current saturation of energy efficient electric equipment is intended to be derived largely from the results of this report.
It was through the use of on-site data collection that the SWE team was able to collect accurate information regarding not only the type of equipment installed in residences throughout the state, but also the efficiency level of various major electric appliances, equipment, or end-uses. The study also collected valuable information on the levels of ceiling, wall, and floor insulation and other building shell characteristics. Finally, the contemporary nature of the data collection effort (SWE data collection occurred during Fall 2011; PECO data collection occurred during Spring 2010) captures these equipment types and efficiency levels during similar periods of EDC energy efficiency program maturity. These factors help to provide justification for the inputs of the energy efficiency potential assessment as well as confidence in the ultimate estimates of electric energy efficiency savings potential.
18 National Energy Efficiency Best Practices Study. Volume P1: Portfolio Best Practices Report. Itron Inc.
2008. Pg. P1-48.
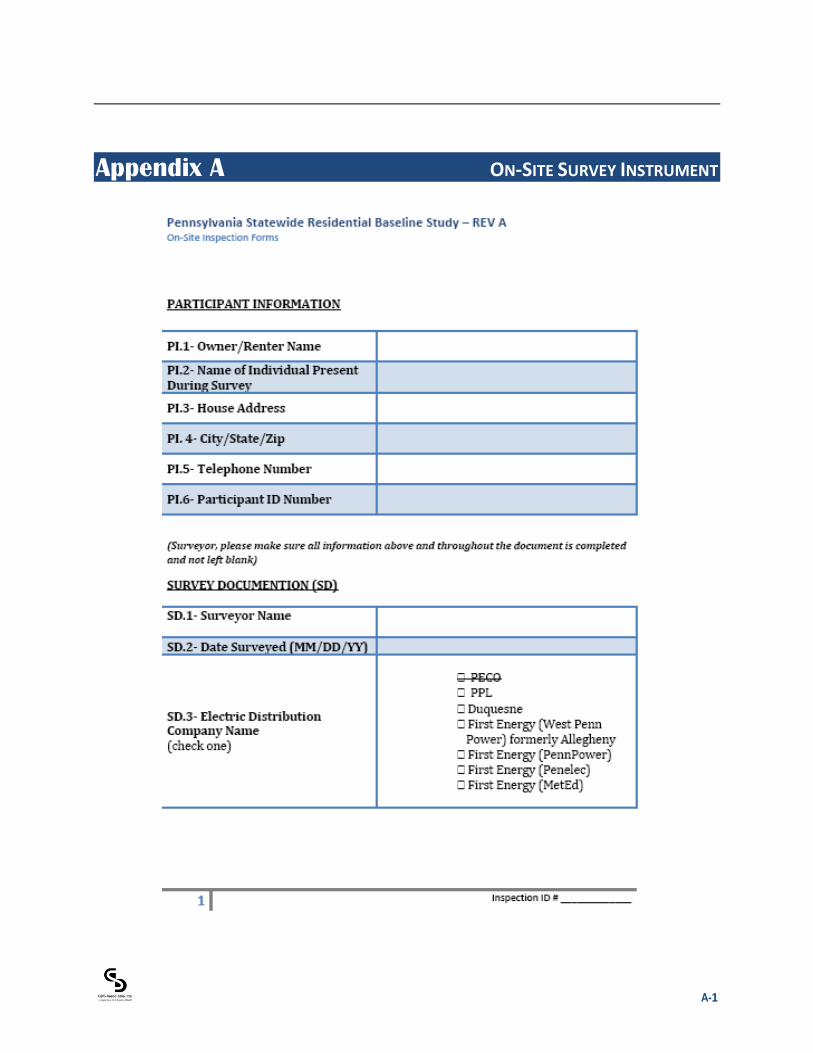
A-1
Appendix A ON-SITE SURVEY INSTRUMENT

APPENDIX A On-Site Survey Instrument
A-2

APPENDIX A On-Site Survey Instrument
A-3
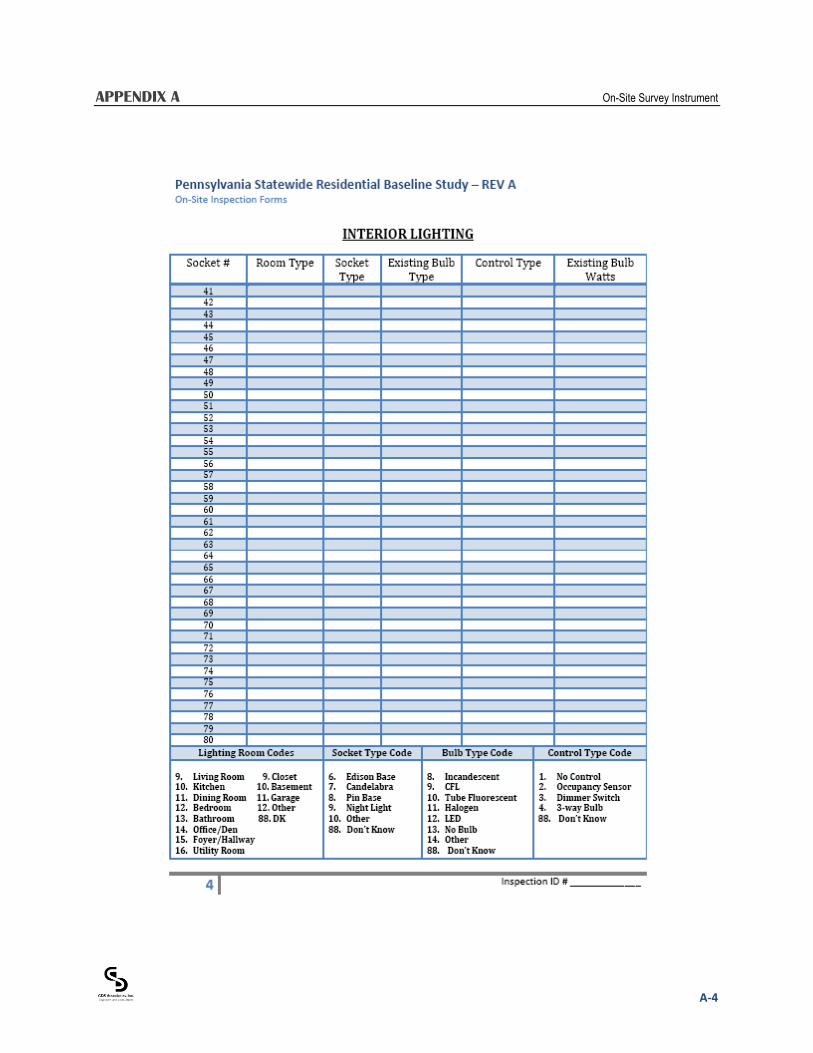
APPENDIX A On-Site Survey Instrument
A-4
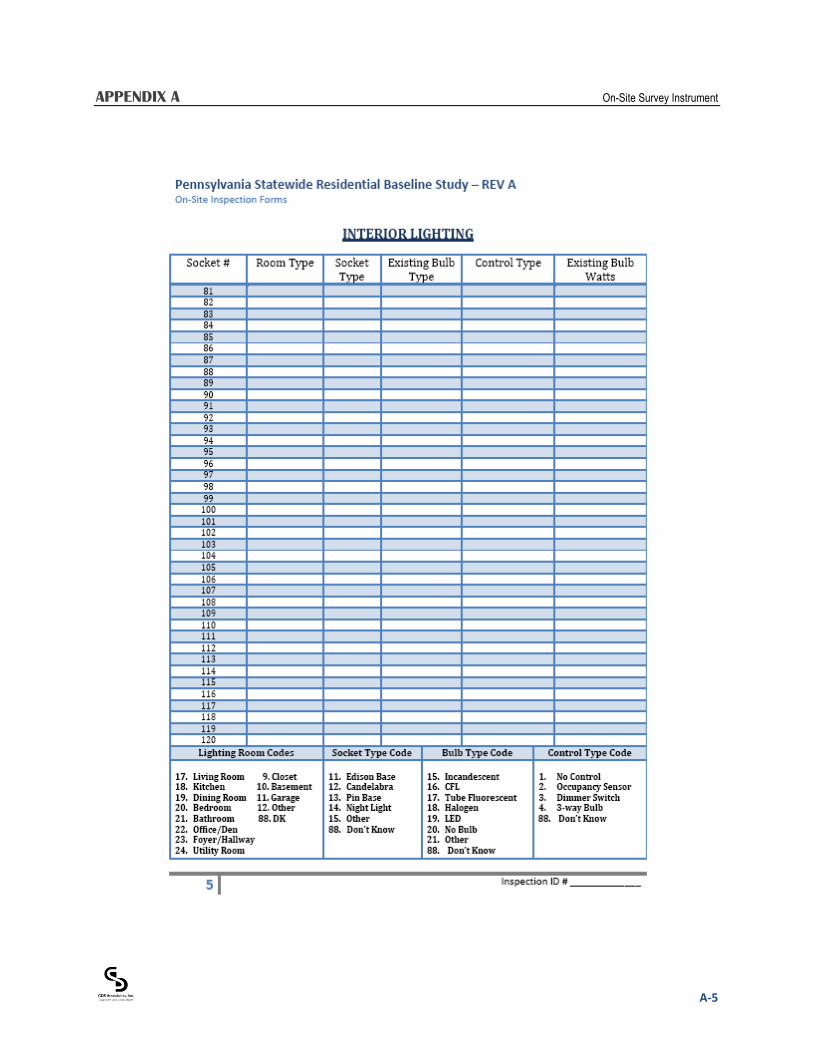
APPENDIX A On-Site Survey Instrument
A-5

APPENDIX A On-Site Survey Instrument
A-6

APPENDIX A On-Site Survey Instrument
A-7
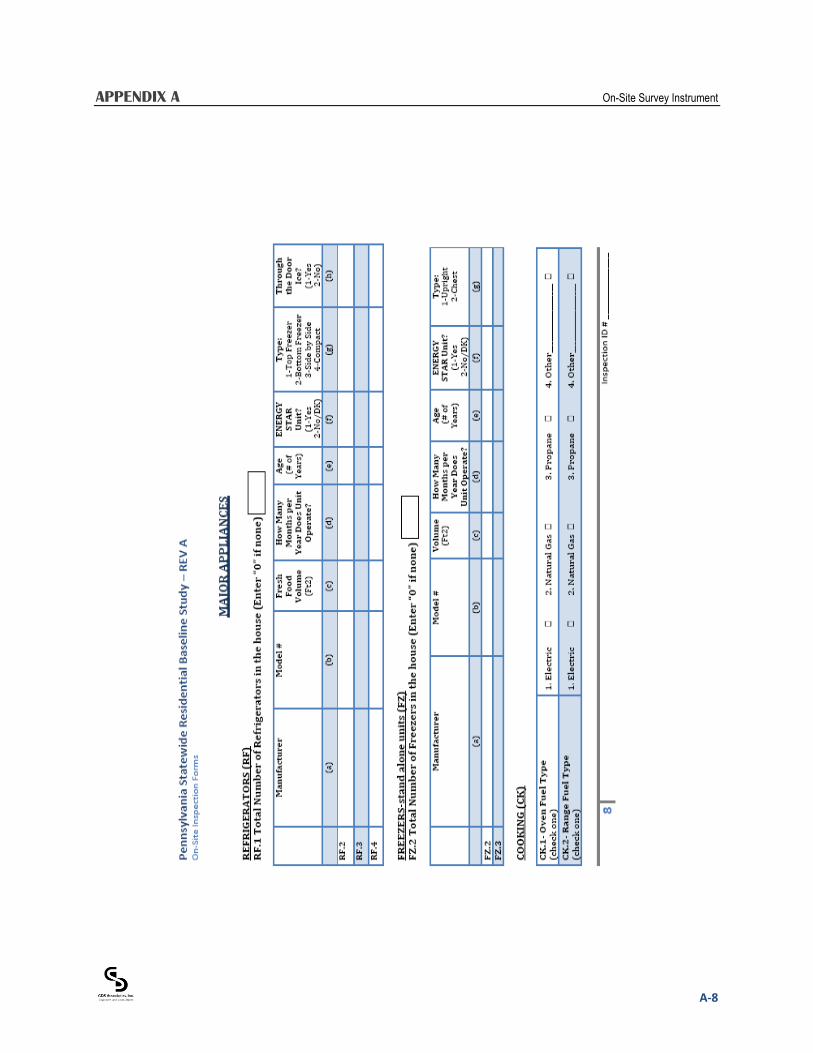
APPENDIX A On-Site Survey Instrument
A-8
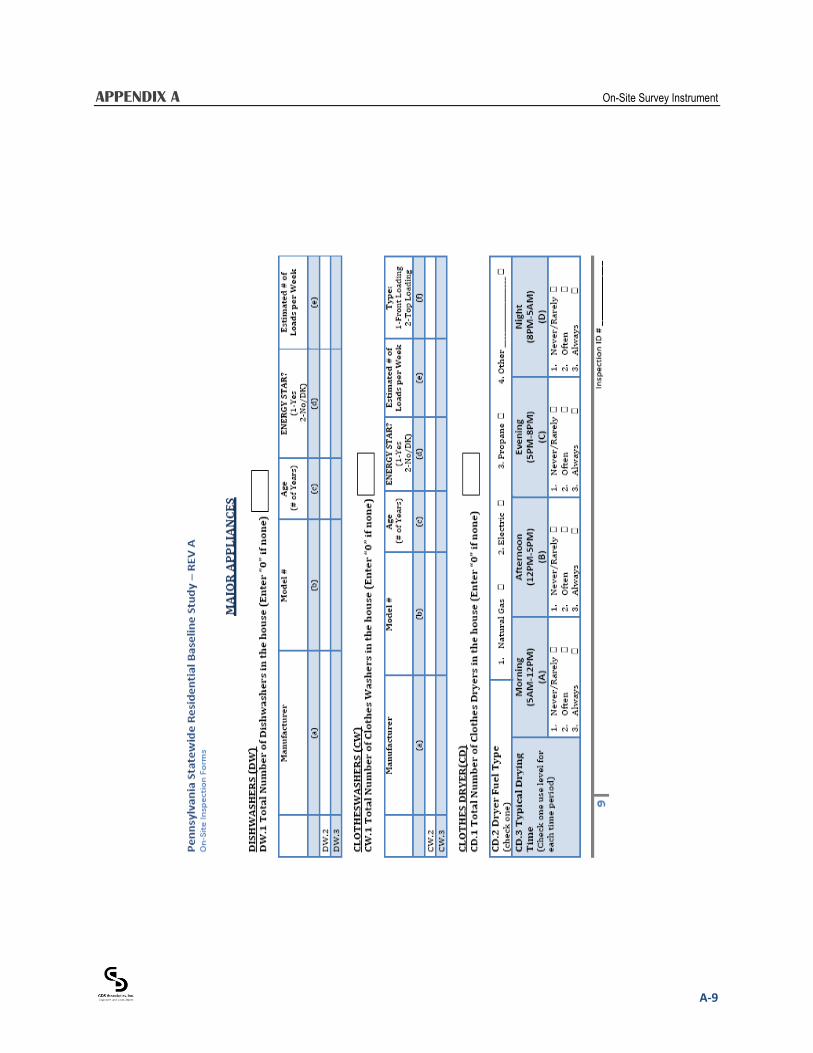
APPENDIX A On-Site Survey Instrument
A-9
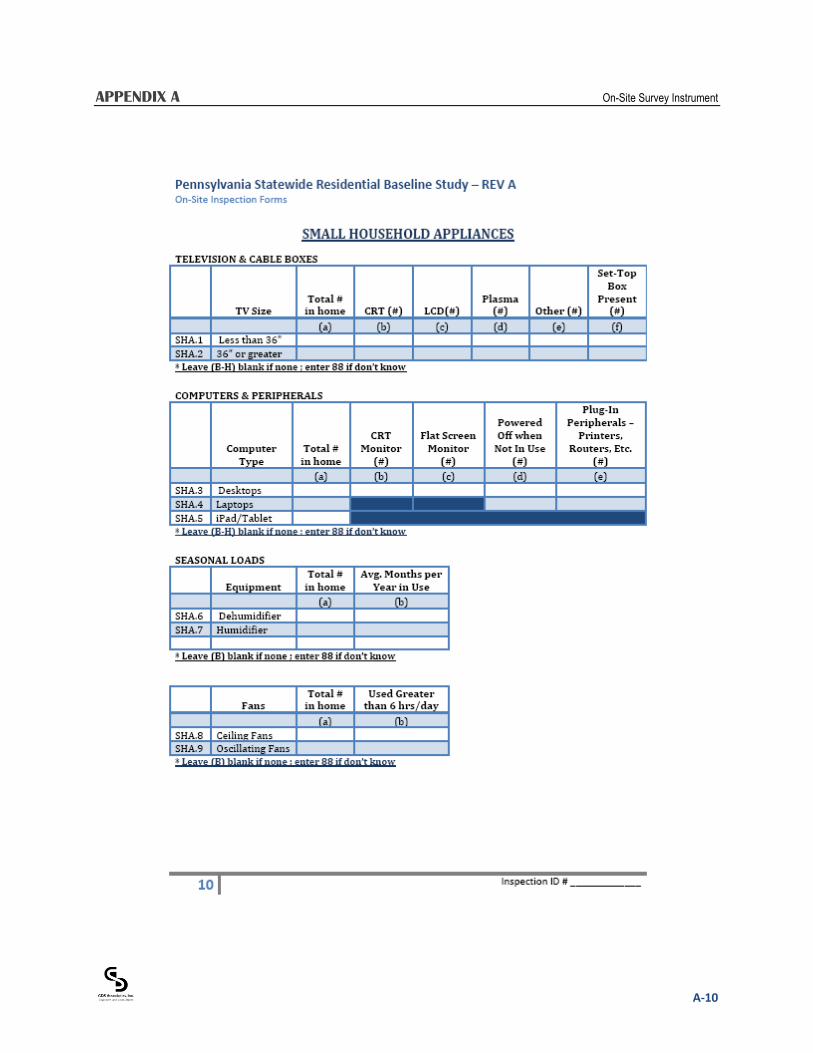
APPENDIX A On-Site Survey Instrument
A-10
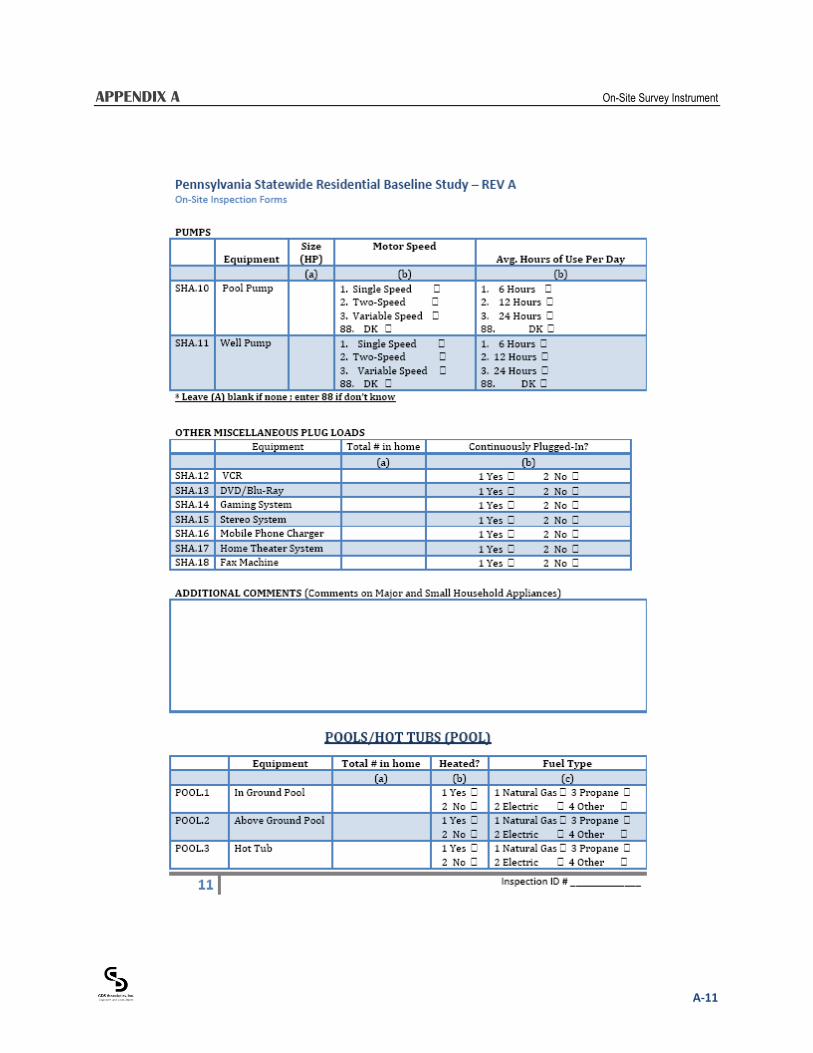
APPENDIX A On-Site Survey Instrument
A-11

APPENDIX A On-Site Survey Instrument
A-12

APPENDIX A On-Site Survey Instrument
A-13

APPENDIX A On-Site Survey Instrument
A-14
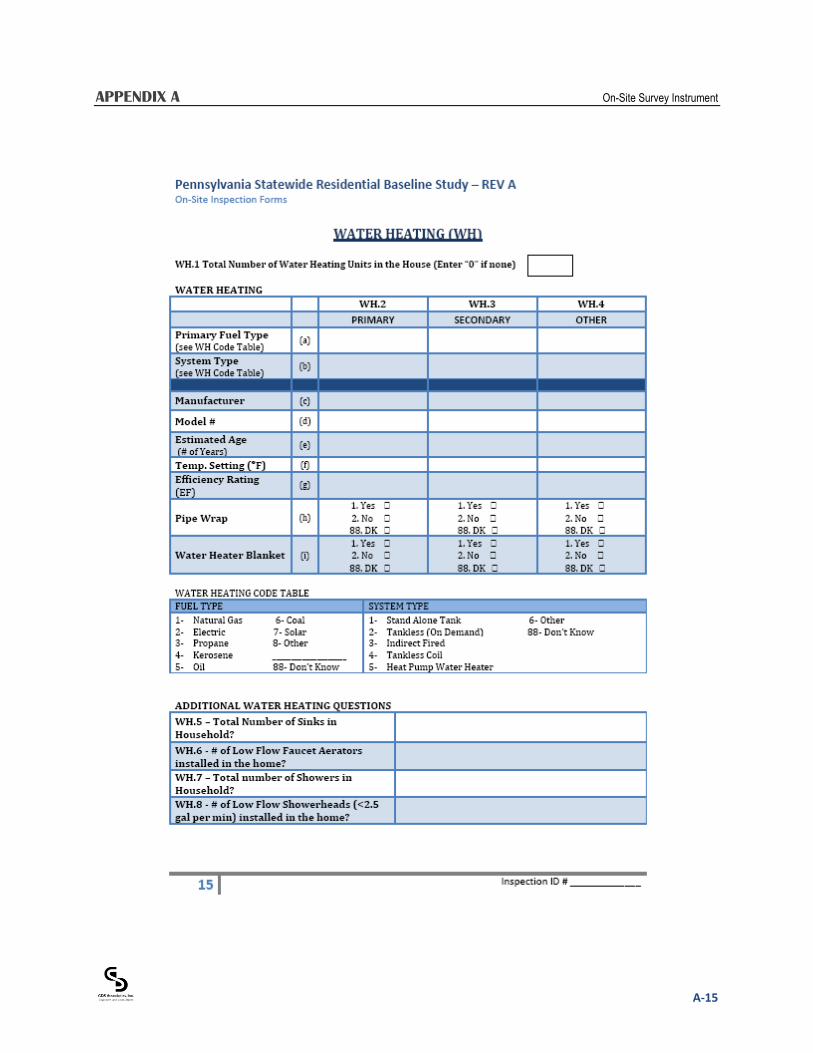
APPENDIX A On-Site Survey Instrument
A-15
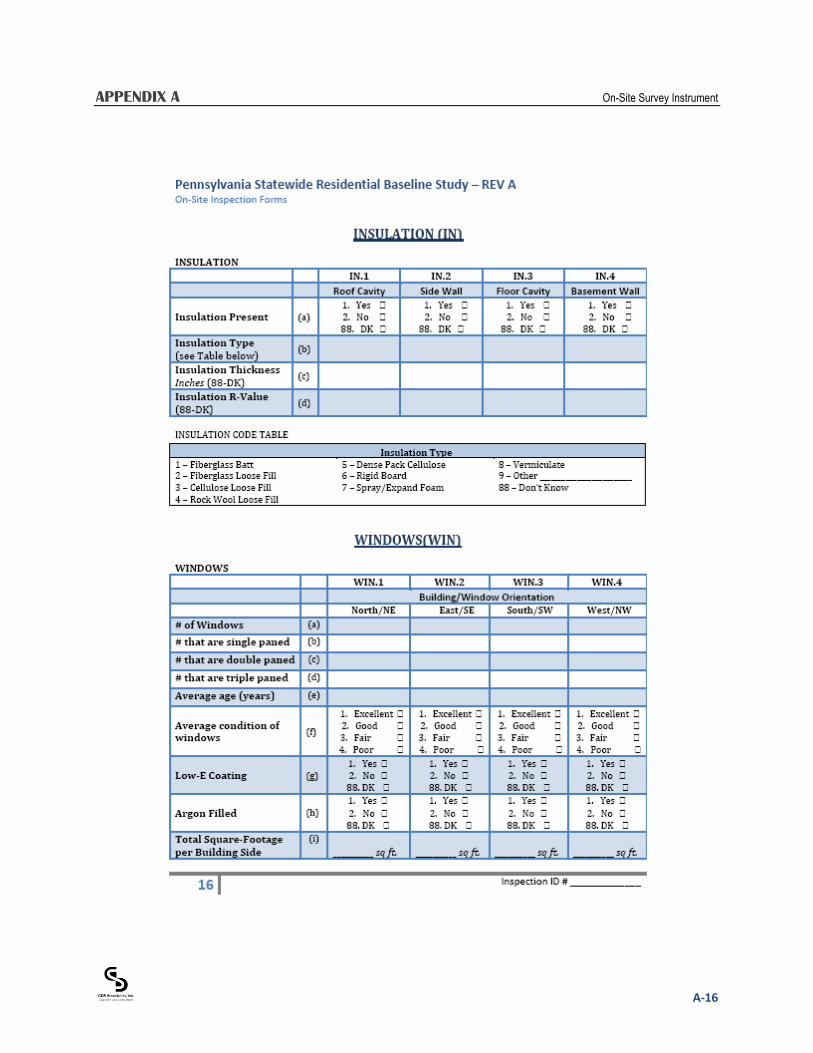
APPENDIX A On-Site Survey Instrument
A-16

APPENDIX A On-Site Survey Instrument
A-17
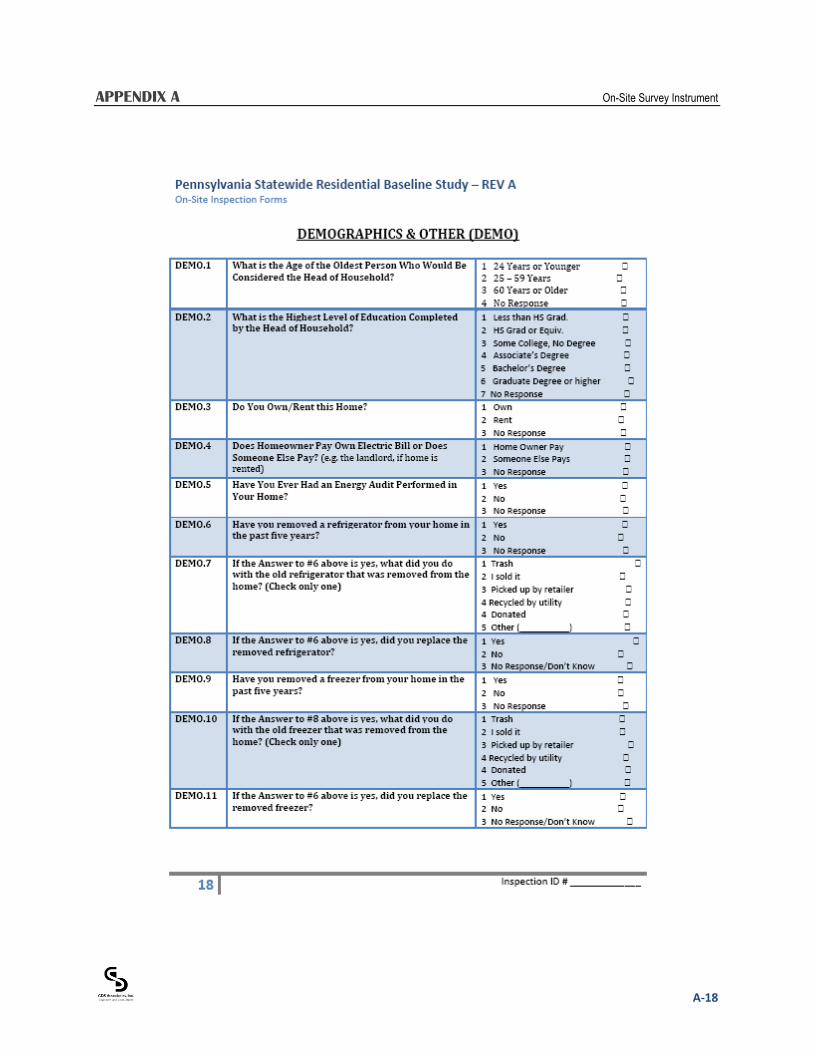
APPENDIX A On-Site Survey Instrument
A-18
B-1
Appendix B RECRUITMENT LETTERS
<DATE> <Customer Name> <Street Address> <City>, <State> <Zip Code> Dear Sir/Madam, Your home has been randomly chosen as a potential participant in a Pennsylvania state-wide study to gather information on the electrically-powered equipment installed in electric customers’ homes. The Pennsylvania Public Utility Commission (PaPUC) is conducting this research to find ways to help PA consumers save energy and money. You will be receiving a call from GDS Associates (the contractor conducting this research for the PaPUC) in the coming days. The GDS Associates representative will conduct a brief three to five minute telephone survey regarding the characteristics of your home. They will then ask your willingness to participate in both the study and permission to conduct an on-site survey at your residence. If you agree to the on-site survey, a GDS Associates representative will personally visit your home to gather additional information about the electrically-powered equipment (e.g., lighting and appliances) located at your residence. A $50 incentive will be offered to all selected participants who agree to participate in the on-site survey. All data collected during this research will be anonymous and will be used only in the aggregate to assist the Commonwealth of Pennsylvania and <EDC Name> develop more effective energy efficiency programs. Your participation in this survey is encouraged, but is entirely optional. If you choose to participate in the on-site survey, we will provide GDS Associates with your customer data (e.g. monthly consumption history) to help them perform the research. If you have any questions or concerns, please feel free to contact the PaPUC at 717-425-7584 or via email ([email protected]). Best regards, <EDC Contact Name> <EDC Contact Title> <EDC Contact Department>
C-1
Appendix C PHONE RECRUITING SCRIPTS
Pennsylvania Residential Baseline Study Recruiting Script General Info: (Do not read this general information to customers) All information for the random sample of residential customers eligible to be recruited will be maintained in an Excel data base. This information will be treated as confidential and will include information on customer name, address, phone number, the dates of the first, second and third recruiting phone calls, the status of the recruiting for each customer, and the name of the GDS employee doing the recruiting for each customer. For each customer contacted, a disposition status will be provided in the Excel data base, as follows:
1. Customer agreed to participate in survey 2. Phone busy 3. Customer busy; Call back later (enter date and time to call back) 4. No answer, left voice mail message 5. No answer; no voicemail 6. Not interested 7. Number no longer in service 8. Other (please specify: ___________________)
In the event that the phone is busy or there was no answer, GDS will make two more attempts to contact the potential participant. When possible, GDS will leave a voice mail message with call back information. If there is no answer but an opportunity to leave a message and call back number, the following script will be used: Phone Message: Hello, my name is from GDS Associates, calling on behalf of the Pennsylvania Public Utility Commission. You may have received a brief letter in the mail from <EDC Name> notifying you in advance of this call. I am contacting you to invite you to participate in a short 5-minute telephone survey or a more in-depth on-site survey of your residence. Only the first seventy respondents will be allowed to participate and you’ll receive a $50 Visa Rewards card for your time. The PUC is conducting this research to find ways to help their Pennsylvania consumers save energy. If you are interested in participating in these surveys, please feel free to call GDS Associates at 800-814-2616 ext. 8405 between the hours of 10AM and 7PM. If you would like to return this call outside of those hours, please leave a message and an appropriate time to return your call and we will call you back at your convenience.

APPENDIX C Phone Recruiting Script
C-2
If you have any questions or concerns about this call, please call the Pennsylvania Public Utility Commission at 717-425-7584 and reference “Energy Usage Survey” Thank you, and have a good day. If homeowner answers or calls back, the following recruiting script will be used: Live Introduction:
Hello, my name is from GDS Associates. You may have received a brief letter in the mail from <EDC Name> notifying the homeowners in advance of this call. I am calling on behalf of the Pennsylvania Public Utility Commission to conduct a brief, 5-minute survey of Pennsylvania consumers about energy usage and equipment. I am not selling anything. May I speak with someone who is familiar with your home’s energy use and appliances? We are working with the PUC to gather information on the appliances and other energy using equipment installed in your home. The PUC is conducting this research to find ways to help their Pennsylvania consumers save energy. Those who are selected for an on-site survey will receive a Visa Rewards card for $50.
The PA PUC and GDS Associates would like to conduct walk-though site visits of a large number of homes to gather further information about appliances, lighting, and other home building characteristics. Each participating homeowner will receive a Visa Reward Card for $50 once the site visit is completed. We expect this site visit will last approximately 1.5 to 2 hours. The information collected from your home and energy use will be kept confidential.
Q1: Would you be willing to let one of our representatives come to your home for this purpose?
If “yes” ask Q2
If “no” : That’s all the questions I have for you today.
Q2: Do you authorize <EDC Name> to release your annual electric usage data to GDS Associates so that we can complete the on-site survey?
If “yes” schedule site survey (below)
If “no” : That’s all the questions I have for you today. [If “yes” to both above questions- surveyor will schedule a site visit]
Thank you for your help. Surveyors will be in your area between [start date] and [end date]. [Recruiter will now schedule an open time/date for a surveyor to conduct an on-site visit]
[Schedule time and date______________________________]. Again, thank you for your help. A surveyor from our office will come to [read address] at [read time] on [read date] and will provide you with proper identification. Who will be the contact for this visit? ____________________________________. If you should need to cancel or reschedule, please
APPENDIX C Phone Recruiting Script
C-3
contact us at 800-814-2616 ext. 8405 and we will be happy to accommodate you. The surveyor will have a letter of introduction and a sign on his/her car and we will confirm this appointment by phone in advance.
In addition to the on-site survey, if you have 5 minutes, I’d like to ask you a few questions about the appliances and heating and cooling equipment in your home. I only have nine short questions. Do you have time to speak now?
a) ‘Yes’: [Proceed to survey].
b) ‘No’: Thank you for your time. General Information
7. What type of home do you have (check one)?
a. Single-family b. Townhouse/Rowhouse/Duplex c. Multifamily Building (2-4 units) d. Multifamily Building (5+ units) e. Mobile home/manufactured home f. Other (specific: ______________
8. When was your home built? __ __ __ __ or don’t know.
9. How many months a year is the home occupied? ___ ___ (number of months)
10. What fuel do you use as your primary heating fuel? (Circle one)
a. Electricity b. Natural Gas c. Oil (#2 fuel oil) d. Kerosene e. Wood f. Solar g. Coal h. Other i. Don’t know
11. What fuel do you use as your primary water heating fuel? (How do you keep your home
warm?) (Circle one)
a. Electricity
APPENDIX C Phone Recruiting Script
C-4
b. Natural Gas c. Oil (#2 fuel oil) d. Kerosene e. Wood f. Solar g. Coal h. Other i. Don’t know
12. What is your home’s primary form of cooling? (Circle one)
a. Central Air Conditioner b. Air Source Heat Pump c. Room Air Conditioner d. No cooling e. Other f. Don’t know
13. How many bedrooms does your home/apartment have? (check one)
a. One b. Two c. Three d. Four e. Five f. Six or more g. Don’t’ know
14. How many people live in the home/apartment 6 months or more?
a. One b. Two c. Three d. Four e. Five f. Six or more
If you have any questions, you can contact the Pennsylvania Public Utility Commission by calling 717-425-7584 and refer to the “PA Home Energy Usage” survey. Again, if you need to cancel or reschedule your site visit, please contact us at 800-814-2616 ext. 8405. In addition, you should receive a letter of confirmation in the next few days confirming the date and time of your appointment. We will call 24 to 48 hours in advance of your site visit to confirm the appointment. {Confirm address for site visit/ remind customer of $50 rewards card} We appreciate your time, have a nice day.
The Power of Experience