penpen accessccess detecting trends in desert tortoise
TRANSCRIPT
ENDANGERED SPECIES RESEARCHEndang Species Res
Vol. 10: 295–304doi: 10.3354/esr00214
Published online September 16, 2009
INTRODUCTION
Desert tortoises Gopherus agassizii are long-livedterrestrial reptiles that live throughout the MojaveDesert in parts of Utah, Nevada, Arizona and Califor-nia, USA (Germano et al. 1994). Due to documenteddeclines in desert tortoise populations, the Mojavepopulation (tortoises north and west of the ColoradoRiver) was emergency listed under the US EndangeredSpecies Act as endangered in 1989, with a subsequentlisting as threatened in 1990 (US Fish and Wildlife Ser-vice 1989, 1990). Desert tortoise populations are char-acterized by having low potential growth rates thatrange from 0.25% to a maximum of 2% yr–1, with atheoretical mean population growth rate of 0.8 to1.15% yr–1 (US Fish and Wildlife Service 1994). In
addition to this very low potential growth rate, the den-sity (and size) of desert tortoise populations affectstheir time to extinction, such that populations with lowdensities are in greater danger of extinction than thosewith higher densities (Green & Young 1993, Lande1993, US Fish and Wildlife Service 1994). Research andmonitoring to assess the status and population dynam-ics of this species were initiated in the late 1970s usingmark-recapture techniques on a few dozen study plots(Berry 1984, Germano et al. 1994, US Fish and WildlifeService 1994), and continues with the addition of arange-wide monitoring program using distance sam-pling methods that were established in 2001 (Andersonet al. 2001, US Fish and Wildlife Service 2006). Deserttortoises have continued to show declining numbers,and in some regions where densities of ≥60 tortoises
© Inter-Research 2009 · www.int-res.com*Corresponding author. Email: [email protected]
Detecting trends in desert tortoise populationgrowth: elusive behavior inflates variance in
estimates of population density
Richard D. Inman1, 2, Kenneth E. Nussear1,*, C. Richard Tracy2
1Western Ecological Research Center, United States Geologic Survey, Las Vegas Field Station, 160 N Stephanie St,Henderson, Nevada 89074-8829, USA
2Department of Biology, University of Nevada, 1664 N. Virginia St., Reno, Nevada 89557-0001, USA
ABSTRACT: Assessing the recovery of the federally listed Mojave population of desert tortoisesGopherus agassizii requires detecting subtle changes in population size over a period of many years.The methods that have been employed by the US Fish and Wildlife Service to estimate populationdensity of desert tortoises are inadequate for detecting modest trends in population density, partlydue to a hidden variance in a parameter (g0) that corrects for the proportion of tortoises that areinactive and thus unavailable for sampling when population density is being assessed. We used smalldataloggers to record the activity of tortoises throughout their active season, and derived daily esti-mates of g0, which we compared with the 2004 estimate published by the US Fish and Wildlife Ser-vice. Due to the substantial variation in animal activity that we found within and among days duringthe active season, we used a daily method to estimate density. We found that this method, while pro-viding a more accurate assessment of g0, translates into estimates of density with coefficients of vari-ation that are 4× larger than previously reported due to the variation in g0 and n (number of animalsencountered). This discrepancy could adversely influence managers’ perceptions of populationrecovery for desert tortoises, and could undermine any ability to monitor the efficacy of recoveryactions for populations.
KEY WORDS: Desert tortoise · Gopherus agassizii · Monitoring · Distance · Population trend · Abundance · Detection probability · Sampling availability · Biologging
Resale or republication not permitted without written consent of the publisher
OPENPEN ACCESSCCESS
Contribution to the Theme Section ‘Biologging technologies: new tools for conservation’
Endang Species Res 10: 295–304
km–2 were once common on study plots (Berry 1984,Tracy et al. 2004), current estimates range from 1 to 12tortoises km–2 (US Fish and Wildlife Service 2006).Measuring recovery of this species requires (amongother things) detecting modest growth in populationdensity (US Fish and Wildlife Service 1994,2008). Thecurrent range-wide program that has been imple-mented to detect population trends relies on knowl-edge of the behavior of individuals in a population(Anderson et al. 2001), which can be difficult to attain.
Desert tortoises are cryptically colored and fossorial,which frequently causes them to be elusive to sam-pling when they are hidden from view in dense vege-tation, in rocky terrain, and in underground burrows(Nussear & Tracy 2007); thus, individuals are oftenmissed during surveys (Corn 1994, Germano et al.1994, Bury & Corn 1995). Because of this, monitoringdesert tortoises requires knowledge of what deter-mines activity patterns in this species (Freilich et al.2000, Anderson et al. 2001). Extensive research on howactivity patterns of individuals are related to the ther-mal environment (Zimmerman et al. 1994, Duda et al.1999, Wilson et al. 1999, Bulova 2002) has shown thatdesert tortoises exploit the heterogeneity of their ther-mal environment to achieve particular body tempera-tures, and avoid thermal extremes by retreating tounderground burrows and dense vegetation (Wood-bury & Hardy 1948, Zimmerman et al. 1994). Althoughthese behaviors are well documented, few studieshave quantified the effects of this elusive behavior onestimates of population densities derived from transectsampling methods.
Transect sampling is currently employed by the USFish and Wildlife Service (hereafter FWS) using theprogram Distance (Buckland et al. 2001) to estimaterange-wide and regional population densities of deserttortoises. This method includes 2 parameters intendedto correct density estimates for (1) the decreasingdetectability of tortoises by surveyors at increasing dis-tances from the transect (Pa; Buckland et al. 2001), and(2) tortoises on the transect that are missed becausethey are in locations where they cannot be seen andsampled, such as in underground burrows (g0; Ander-son et al. 2001). Both g0 and Pa are proportions withfinite ranges from 0 to 1. These 2 parameters fre-quently change in time and space, and impart uncer-tainty in the estimate of population density (Bucklandet al. 2004).
While methods for estimating Pa (and its error) havebeen thoroughly discussed elsewhere (Buckland 1985,Buckland et al. 2001, 2004), methods for estimating theg0 parameter have only been briefly addressed(Thompson 2002, Laake & Borchers 2004), and the g0
parameter is not often used with Distance sampling(Bächler & Liechti 2007). This parameter and its SE
have been estimated in past years (for desert tortoisemonitoring) by assessing the activity of several smallsamples of individuals (groups) in different samplinglocalities, which are monitored periodically using VHFradio-telemetry during the times when transect sam-pling occurs (US Fish and Wildlife Service 2006). Indi-viduals in each of these small groups are radio-trackedand observed 10 to 20 times during the transect sam-pling period (typically 1 April to 1 June, US Fish andWildlife Service 2006). A single range-wide estimate ofg0 is derived by taking the mean of each animal’s aver-aged activity during the entire transect samplingperiod, and the SE is estimated by taking the SD ofactivity estimates of all radio-tracked individuals (USFish and Wildlife Service 2006).
One problem with this approach to estimating g0 isthat the activity of a population of tortoises can be sig-nificantly misrepresented when the sample size ofindividuals is small (Nussear & Tracy 2007). A samplesize of at least 20 ind. may be needed to assess theactivity in a large population (Nussear & Tracy 2007).During the first 5 yr of sampling, FWS used severalsamples with 8 to 12 ind., resulting in imprecise andpotentially inaccurate estimates of g0. However, whileusing larger sample sizes to estimate the activity ofdesert tortoises would produce a more realistic esti-mate of the g0 parameter and its CV, a method thatestimates the variation ‘throughout’ time is likely to bemore important because g0 varies substantially fromday to day and from hour to hour throughout each dayof the sampling period. Unfortunately, the programDistance (Thomas et al. 2004) is currently not designedto incorporate daily estimates of g0. Instead, a singlepooled value of g0 has been used by FWS to scale den-sity estimates, and the SE of this parameter is used(among other sources of variance, such as Pa and n (thenumber of animals encountered along transects)) toestimate the precision of the density estimate (Buck-land et al. 2001).
We used a different approach to quantify g0 by mea-suring the daily activity of 34 tortoises in the WesternMojave Recovery Unit at short time intervals through-out the sampling season in 2004. Data on the nano-climates (the climate immediately surrounding the tor-toise) experienced by tortoises (as measured usingsmall sensors and dataloggers attached to the animals)were used to develop a model that predicted tortoiseactivity during the sampling period from interactionsbetween desert tortoises and their nanoclimates. Usingthe predicted activity data from our study animals, weestimated the g0 parameter and its CV at several timescales for the entire sampling season. We investigatedwhether daily estimates of g0 have a different effect onthe accuracy and precision of density estimates com-pared to pooled estimates of g0 by implementing an
296
Inman et al.: Detection of population trends in desert tortoises
estimate of density for the Western Mojave RecoveryUnit; this estimate is calculated from daily estimates ofdensity with a daily g0 correction being applied.Finally, we assessed the extent to which previousmethods used by the FWS to estimate g0 may be insuf-ficient in accounting for variation in the behavior ofdesert tortoises, and to what extent these methods mayaffect the precision of density estimates.
MATERIALS AND METHODS
Field sites. Tortoises were studied at 2 sites locatedin the western Mojave Desert in the Superior-Croneseand Ord-Rodman desert wildlife management areas(DWMAs) of the Western Mojave Recovery Unit fordesert tortoises. The sites are approximately 16 kmnorthwest and 64 km southeast of Barstow, California,respectively. Each site is located in a valley character-ized by Mojave Desert scrub (Turner 1982) with onlymoderate topographic relief. Populations at these siteswere used to estimate g0 as part of the FWS desert tor-toise monitoring program from 1999 to 2008.
Behavioral observations. Thirty-four adult deserttortoises from the 2 sites described above were pre-viously equipped with radio-transmitters and weremonitored intensively from 1 April to 1 June 2004.Miniature dataloggers (HOBO H8 Temp/RH/Light,Onset) were used to record the nanoclimate experi-enced by each tortoise as it moved among microhabi-tats. Each logger was 4.5 (l) × 3 (w) × 0.75 (h) cm in size,and was ~50 g in mass when epoxy was applied(~0.05% of an individual’s mass). The outer plasticcase of each commercial datalogger was removed andthe circuitry was re-sealed in heat-shrunk tubing todecrease the volume and mass of the datalogger and tostreamline its shape. Each datalogger recorded lightintensity (lm ft–2), absolute humidity (g m–3), and tem-perature (°C) as measured above the tail of the tortoise(Nussear et al. 2002). The datalogger was attached tothe carapace on either the 5th vertebral, 5th right, or5th left costal scute, depending on the size and shapeof the animal. This attachment site was chosen to min-imize interference with the animal’s behavior, and toprovide maximum exposure of each of the sensors tothe environment. No dataloggers were lost prema-turely, and all were recovered at the end of the study.Each datalogger recorded data at 15 min intervals, anddata were retrieved every 2 wk throughout the study.An additional datalogger was placed on the groundsurface to measure the surface conditions that a tor-toise would experience at each site.
Light intensity from the datalogger on the groundsurface was compared to that from each animal andwas reclassified into a multinomial variable indicating
whether or not the sensor was exposed to sunlight,where a value of –1 indicated that the animal was notexposed to light even though the surface was (e.g. itwas daytime and the animal was in a burrow), a valueof 0 indicated that both the animal and the dataloggerexperienced similar light levels (e.g. it was daytimeand the animal was above ground, or it was night timeand the animal was either above or below ground), anda value of +1 indicated that the animal experiencedlight when the datalogger on the ground surface didnot. This last condition was rare and was likely due toshade obscuring the (surface) datalogger from theearly morning or late evening sunlight.
Behavioral observations of each individual weretaken 2 to 6 times per day during each of the 10 obser-vation periods throughout the study, and each obser-vation period lasted from 1 to 3 d at each site. Eachtime an animal was observed, its activity and micro-habitat position (above or below ground) was assessedand recorded. Behavioral observations were madefrom the furthest distance possible (usually rangingfrom 5 to 15 m) to assess the microhabitat position ofeach individual, and animals were observed for <30 sat each encounter to minimize the impact of observerpresence. Behavioral observations similar to thismethod have been used in several previous studieswith little or no effect on animal behavior (Bulova 1994,Zimmerman et al. 1994, Nussear & Tracy 2007).
An artificial neural network (NeuroSolutions 5.0,Neurodimension) was used to classify the nano-climate experienced by each individual into above orbelow ground positions using data pooled from bothsites. A random sample of 40% of all observationswas withheld from the training process of modeldevelopment in order to test each model with theindependent data. The Kappa coefficient of agree-ment was used to measure the overall performance ofthe model (Fielding & Bell 1997), and a confusionmatrix was used to identify which of the microhabi-tats (below ground in a burrow or above ground) wasbetter predicted by the model . The model was usedto predict tortoise activity (above or below ground)for each 15 min interval from 05:00 h to 19:00 h(Pacific daylight saving time, PDST) from 1 April to1 June, resulting in ~57 predictions d–1 of each tor-toise’s microhabitat position.
West Mojave density estimates. We derived an esti-mate of density, D, for the Western Mojave RecoveryUnit using a modified version of the density equationdeveloped for sampling desert tortoise populations(Anderson et al. 2001), where the density estimate wastaken as the average of daily estimates of density cal-culated with daily estimates of the g0 parameter (g0d),the number of tortoises encountered each day (nd) andthe length of transect walked each day (ld):
297
Endang Species Res 10: 295–304
(1)
where N is the total number of days sampled, d1...dN isthe index of unique days over which the mean densityis calculated, w is the effective width of transects, andPa is the detection probability. The CV of the densityestimate was calculated as:
(2)
Each daily estimate of g0 was defined as:
(3)
where a = activity at each observation (o) for eachstudy animal (s) on a given day (d). The coefficient ofvariation of g0,d is denoted as SE(g0,d)/g0d.
The CV(n) for each day (d) was defined as:
(4)
where the length of each transect (lt,d), total length ofall transects for each day (Ld), total number of encoun-ters for each day (nd), and total number of transectssurveyed on a given day (kd) were were calculatedfrom published transect data (US Fish and Wildlife Ser-vice 2006).
Differences between our estimate of density for the2004 sampling year for the Western Mojave RecoveryUnit and that published for the same year (US Fish andWildlife Service 2006) were evaluated using a Z-testfor differences among means. Similarly, the differ-ences between the CVs of these estimates of densitywere compared using a Z-test for CVs (Miller 1991).
Theoretical variance of g0, n, and Pa. We used Eq. (2)to calculate the simultaneous influence of the CVs ofg0, n, and Pa on the CV of D by allowing each of theparameters to vary within an expected range that wasdefined by activity data or published values (US Fishand Wildlife Service 2006) for the first 5 yr of sampling.
The expected range of the CVs of g0 was definedusing the activity data from our study animals to esti-mate the minimum and maximum CVs that wouldresult from sampling on consecutive days of varyinglengths. We assumed that sampling could be com-pleted for the West Mojave in 5 to 25 consecutive daysduring the active season, and therefore took samples ofour activity data during the months of April and May,of N days in length to estimate g0, where N rangedfrom 5 to 25 d. We used the estimated g0 value (fromEq. 3) for each day, and the minimum and maximum
CVs of g0 from all sample sizes of N to represent theminimum and maximum CVs possible under existingsampling conditions, which ranged from 0.16 to 0.74.
We used published transect and encounter data from2004 to estimate the CV of n for each day that transectsampling was conducted; this allowed us to determinethe minimum and maximum CVs of n that were possi-ble under existing sampling conditions. This gave arange of near 0.1 to 0.6, and therefore we held the CVof n constant at 3 levels (0.1, 0.4, and 0.7), whichbounded the range of CVs possible when estimatingdensity.
The upper and lower limits to the expected ranges ofCVs for g0, Pa, and the 3 levels of CV for n were subse-quently used to estimate the upper and lower limits ofthe precision of density estimates that could beexpected under conditions similar to the first 5 yr ofsampling.
Estimates of density with CVs of <0.125, 0.25, 0.35,0.45 or 0.55 were identified previously as the thresh-olds where distance sampling would show sufficientprecision to identify 1, 2, 3, 4 or 5% annual trends indesert tortoise population size over a 25 yr period,respectively (Nussear & Tracy 2007). We used thesethresholds to identify combinations of the CVs of g0
and Pa where distance sampling could detect the same(1, 2, 3, 4 or 5%) annual trends. However, this methodassumed that the covariance between n, g0 and Pa was0, and treated each as an independent random vari-able. While this assumption is probably incorrect (g0,Pa and n are likely to be linked under certain condi-tions), few data are available to estimate their covari-ance across many years and habitat types.
RESULTS
Activity model
An artificial neural network model including bodytemperature (Tb; °C), absolute humidity of the nano-climate of the tortoise (ABSHo; g m–3), light intensity onthe tortoise (Lo; lm ft–2), and the difference in lightintensity between the surface and the tortoise pro-vided the best fit among the models we investigated;this model was subsequently used to classify tortoisenanoclimates for each 15 min interval into above- orbelow-ground microhabitat positions (i.e. presence ofthe tortoise on the surface of the ground, or in a retreatsite such as a burrow or other place not on the surface)suitable for estimating g0. The resulting model pre-dicted below-ground and above-ground activity aboutequally well (91 and 89% accuracy for below-groundand above-ground activity, respectively), and had aKappa of 0.795.
CV n
n n
nd
d t,d t,d t,d d d
d
d
( )
( / / )
/=−
−=
∑L l l L
kt
k2
1
1 dd2
⎛
⎝
⎜⎜⎜⎜
⎞
⎠
⎟⎟⎟⎟
g at
01
34
1
57157
134,d o,s,d
o
===
∑∑
CV CV n CV CVd d dd
DN
P ga( ) = ( )[ ] + ( )[ ] + ( )[ ]1 2 20
2
1....dN
N
∑
dnd
d dd ...d1
=×
⎛⎝
⎞⎠ ×
×⎛⎝
⎞⎠∑1
1
0l w P ga
N
N
298
Inman et al.: Detection of population trends in desert tortoises
Variation in tortoise activity
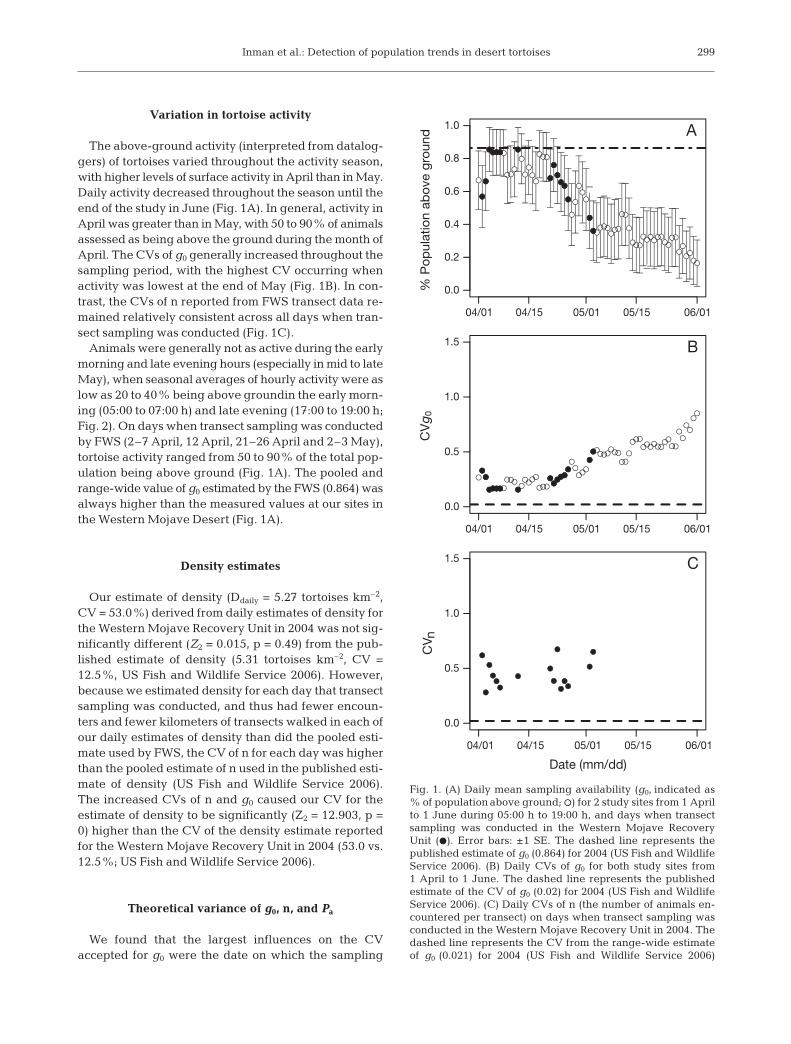
The above-ground activity (interpreted from datalog-gers) of tortoises varied throughout the activity season,with higher levels of surface activity in April than in May.Daily activity decreased throughout the season until theend of the study in June (Fig. 1A). In general, activity inApril was greater than in May, with 50 to 90% of animalsassessed as being above the ground during the month ofApril. The CVs of g0 generally increased throughout thesampling period, with the highest CV occurring whenactivity was lowest at the end of May (Fig. 1B). In con-trast, the CVs of n reported from FWS transect data re-mained relatively consistent across all days when tran-sect sampling was conducted (Fig. 1C).
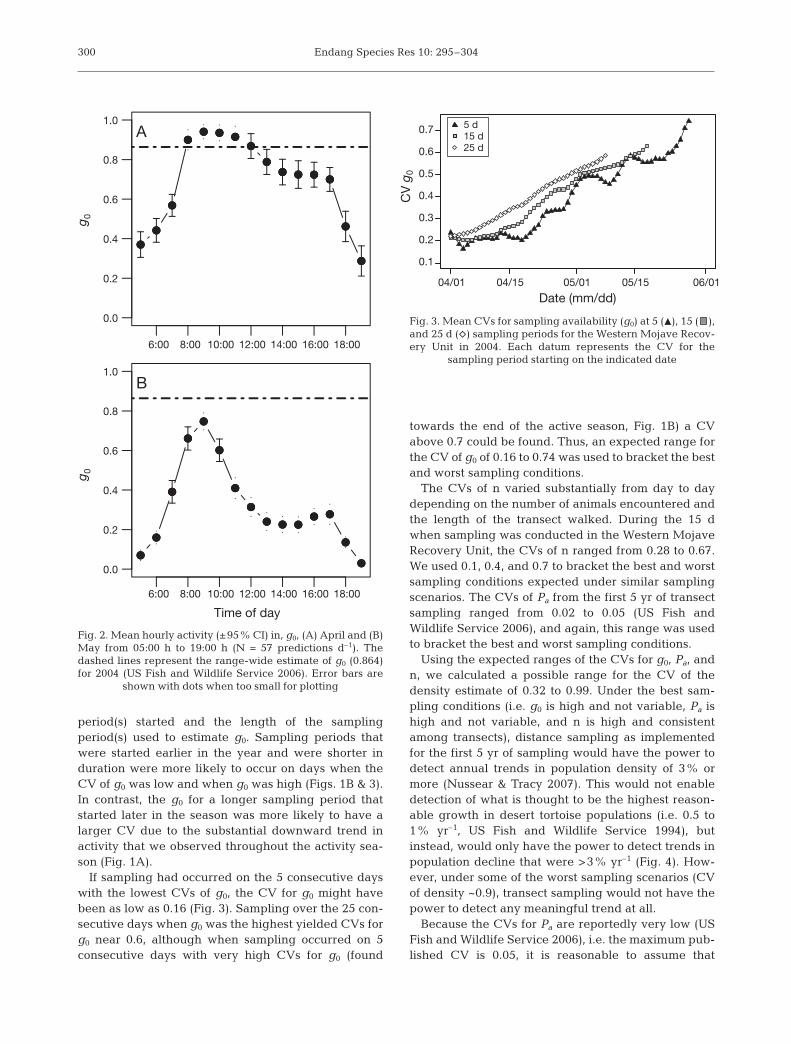
Animals were generally not as active during the earlymorning and late evening hours (especially in mid to lateMay), when seasonal averages of hourly activity were aslow as 20 to 40% being above groundin the early morn-ing (05:00 to 07:00 h) and late evening (17:00 to 19:00 h;Fig. 2). On days when transect sampling was conductedby FWS (2–7 April, 12 April, 21–26 April and 2–3 May),tortoise activity ranged from 50 to 90% of the total pop-ulation being above ground (Fig. 1A). The pooled andrange-wide value of g0 estimated by the FWS (0.864) wasalways higher than the measured values at our sites inthe Western Mojave Desert (Fig. 1A).
Density estimates
Our estimate of density (Ddaily = 5.27 tortoises km–2,CV = 53.0%) derived from daily estimates of density forthe Western Mojave Recovery Unit in 2004 was not sig-nificantly different (Z2 = 0.015, p = 0.49) from the pub-lished estimate of density (5.31 tortoises km–2, CV =12.5%, US Fish and Wildlife Service 2006). However,because we estimated density for each day that transectsampling was conducted, and thus had fewer encoun-ters and fewer kilometers of transects walked in each ofour daily estimates of density than did the pooled esti-mate used by FWS, the CV of n for each day was higherthan the pooled estimate of n used in the published esti-mate of density (US Fish and Wildlife Service 2006).The increased CVs of n and g0 caused our CV for theestimate of density to be significantly (Z2 = 12.903, p =0) higher than the CV of the density estimate reportedfor the Western Mojave Recovery Unit in 2004 (53.0 vs.12.5%; US Fish and Wildlife Service 2006).
Theoretical variance of g0, n, and Pa
We found that the largest influences on the CVaccepted for g0 were the date on which the sampling
299
0.0
0.2
0.4
0.6
0.8
1.0
% P
op
ulat
ion
abo
ve g
roun
d
04/01 04/15 05/01 05/15 06/01
A
0.0
0.5
1.0
1.5
CV
g0
04/01 04/15 05/01 05/15 06/01
B
0.0
0.5
1.0
1.5
CV
n
04/01 04/15 05/01
Date (mm/dd)
05/15 06/01
C
Fig. 1. (A) Daily mean sampling availability (g0, indicated as% of population above ground; s) for 2 study sites from 1 Aprilto 1 June during 05:00 h to 19:00 h, and days when transectsampling was conducted in the Western Mojave RecoveryUnit (d). Error bars: ±1 SE. The dashed line represents thepublished estimate of g0 (0.864) for 2004 (US Fish and WildlifeService 2006). (B) Daily CVs of g0 for both study sites from1 April to 1 June. The dashed line represents the publishedestimate of the CV of g0 (0.02) for 2004 (US Fish and WildlifeService 2006). (C) Daily CVs of n (the number of animals en-countered per transect) on days when transect sampling wasconducted in the Western Mojave Recovery Unit in 2004. Thedashed line represents the CV from the range-wide estimateof g0 (0.021) for 2004 (US Fish and Wildlife Service 2006)
Endang Species Res 10: 295–304
period(s) started and the length of the samplingperiod(s) used to estimate g0. Sampling periods thatwere started earlier in the year and were shorter induration were more likely to occur on days when theCV of g0 was low and when g0 was high (Figs. 1B & 3).In contrast, the g0 for a longer sampling period thatstarted later in the season was more likely to have alarger CV due to the substantial downward trend inactivity that we observed throughout the activity sea-son (Fig. 1A).
If sampling had occurred on the 5 consecutive dayswith the lowest CVs of g0, the CV for g0 might havebeen as low as 0.16 (Fig. 3). Sampling over the 25 con-secutive days when g0 was the highest yielded CVs forg0 near 0.6, although when sampling occurred on 5consecutive days with very high CVs for g0 (found
towards the end of the active season, Fig. 1B) a CVabove 0.7 could be found. Thus, an expected range forthe CV of g0 of 0.16 to 0.74 was used to bracket the bestand worst sampling conditions.
The CVs of n varied substantially from day to daydepending on the number of animals encountered andthe length of the transect walked. During the 15 dwhen sampling was conducted in the Western MojaveRecovery Unit, the CVs of n ranged from 0.28 to 0.67.We used 0.1, 0.4, and 0.7 to bracket the best and worstsampling conditions expected under similar samplingscenarios. The CVs of Pa from the first 5 yr of transectsampling ranged from 0.02 to 0.05 (US Fish andWildlife Service 2006), and again, this range was usedto bracket the best and worst sampling conditions.
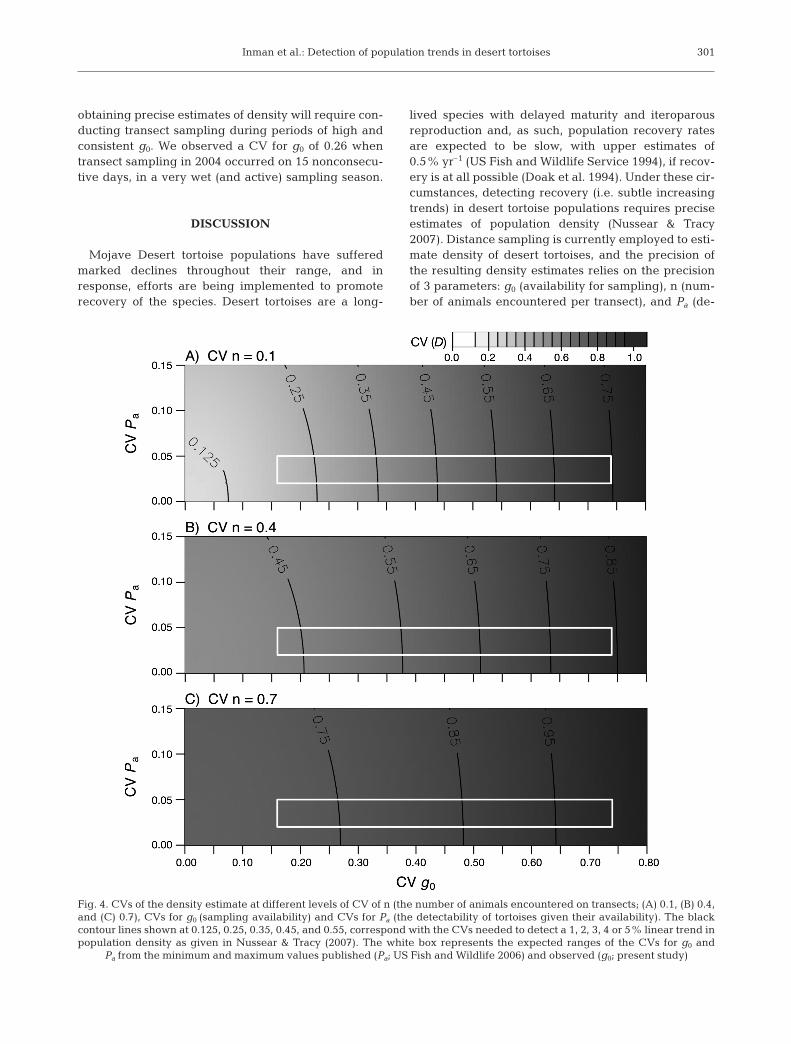
Using the expected ranges of the CVs for g0, Pa, andn, we calculated a possible range for the CV of thedensity estimate of 0.32 to 0.99. Under the best sam-pling conditions (i.e. g0 is high and not variable, Pa ishigh and not variable, and n is high and consistentamong transects), distance sampling as implementedfor the first 5 yr of sampling would have the power todetect annual trends in population density of 3% ormore (Nussear & Tracy 2007). This would not enabledetection of what is thought to be the highest reason-able growth in desert tortoise populations (i.e. 0.5 to1% yr–1, US Fish and Wildlife Service 1994), butinstead, would only have the power to detect trends inpopulation decline that were >3% yr–1 (Fig. 4). How-ever, under some of the worst sampling scenarios (CVof density ~0.9), transect sampling would not have thepower to detect any meaningful trend at all.
Because the CVs for Pa are reportedly very low (USFish and Wildlife Service 2006), i.e. the maximum pub-lished CV is 0.05, it is reasonable to assume that
300
6:00 8:00 10:00 12:00 14:00 16:00 18:00
6:00 8:00 10:00 12:00 14:00 16:00 18:00
0.0
0.2
0.4
0.6
0.8
1.0
g 0g 0
A
0.0
0.2
0.4
0.6
0.8
1.0
Time of day
B
Fig. 2. Mean hourly activity (±95% CI) in, g0, (A) April and (B)May from 05:00 h to 19:00 h (N = 57 predictions d–1). Thedashed lines represent the range-wide estimate of g0 (0.864)for 2004 (US Fish and Wildlife Service 2006). Error bars are
shown with dots when too small for plotting
0.1
0.2
0.3
0.4
0.5
0.6
0.7
CV
g0
04/01 04/15 05/01
Date (mm/dd)05/15 06/01
5 d15 d25 d
Fig. 3. Mean CVs for sampling availability (g0) at 5 (m), 15 ( ),and 25 d (e) sampling periods for the Western Mojave Recov-ery Unit in 2004. Each datum represents the CV for the
sampling period starting on the indicated date
Inman et al.: Detection of population trends in desert tortoises
obtaining precise estimates of density will require con-ducting transect sampling during periods of high andconsistent g0. We observed a CV for g0 of 0.26 whentransect sampling in 2004 occurred on 15 nonconsecu-tive days, in a very wet (and active) sampling season.
DISCUSSION
Mojave Desert tortoise populations have sufferedmarked declines throughout their range, and inresponse, efforts are being implemented to promoterecovery of the species. Desert tortoises are a long-
lived species with delayed maturity and iteroparousreproduction and, as such, population recovery ratesare expected to be slow, with upper estimates of0.5% yr–1 (US Fish and Wildlife Service 1994), if recov-ery is at all possible (Doak et al. 1994). Under these cir-cumstances, detecting recovery (i.e. subtle increasingtrends) in desert tortoise populations requires preciseestimates of population density (Nussear & Tracy2007). Distance sampling is currently employed to esti-mate density of desert tortoises, and the precision ofthe resulting density estimates relies on the precisionof 3 parameters: g0 (availability for sampling), n (num-ber of animals encountered per transect), and Pa (de-
301
Fig. 4. CVs of the density estimate at different levels of CV of n (the number of animals encountered on transects; (A) 0.1, (B) 0.4,and (C) 0.7), CVs for g0 (sampling availability) and CVs for Pa (the detectability of tortoises given their availability). The blackcontour lines shown at 0.125, 0.25, 0.35, 0.45, and 0.55, correspond with the CVs needed to detect a 1, 2, 3, 4 or 5% linear trend inpopulation density as given in Nussear & Tracy (2007). The white box represents the expected ranges of the CVs for g0 and
Pa from the minimum and maximum values published (Pa; US Fish and Wildlife 2006) and observed (g0; present study)
Endang Species Res 10: 295–304
tectability of tortoises given their availability). Theseparameters can be estimated using different methods,all of which impact our ability to obtain precise densityestimates while properly accounting for the observedvariance in behavior, detectability and the numbers oftortoises encountered in a given sampling area.
Because we observed high daily variation in avail-ability as the sampling season progressed, we chose touse a daily method to estimate density and its variance.When comparing the density estimate derived toaccount for this daily variation with the density esti-mate reported by the FWS (US Fish and Wildlife Ser-vice 2006), we found the 2 estimates of density to besimilar, but with significantly different CVs. Thereported CV of the density estimate for the WesternMojave Recovery Unit was substantially lower than theCV that we calculated, indicating a discrepancy in theperceived precision of the density estimates from thepublished report (US Fish and Wildlife Service 2006),which reflects reductions in variation when parameterestimates are pooled for the entire range and season.
The pooled estimates of g0 and its SE (used by FWS)are derived from observations of radio-tracked tor-toises in focal populations throughout the entire rangefor the Mojave population of desert tortoises (asopposed to just the Western Mojave Recovery Unit) forall days of sampling. The pooled estimate of g0 is calcu-lated as the mean of each focal animal’s availability tobe sampled from the 10 to 20 times it is observed dur-ing the entire sampling season, and does not reflect thevariation we observed throughout the samplingperiod. In addition, it ignores temporal and spatial dif-ferences among populations in different regions,which we believe is an important source of variabilityto account for. In general terms, the pooled estimate ofg0 is a measure of the difference among individuals intheir sampling availability.
It is not enough to know that 1 individual was unlikeanother with respect to how much time they wereavailable to be sampled throughout the samplingperiod. Instead, one must know how unlike the firstweek of April is from the last week of April or howunlike 05:00 h is from 13:00 h with respect to the pro-portion of the population that is available to be sam-pled. Tortoises are not the only organisms that exhibitdaily or hourly changes in their availability and subse-quent detectability, which adds difficulty to samplingefforts. Other survey methods (e.g. aerial surveys on avariety of species, ranging from kangaroos to largeranimals including elephants and whales) use behav-ioral models to predict g0 due to changes in daily orseasonal temperature or other environmental condi-tions that relate to sampling availability (Bayliss &Giles 1985, Jachmann 2002, Skaug et al. 2004). How-ever, these behavioral models are often derived from
small samples or incomplete sampling (Southwell et al.2008), which likely adds to the uncertainty of theresulting estimates of density.
In addition, the behavior of individuals is unlikely tobe uniform across the entire range, such that activity insome regions may be lower than that in other regions.This adds error to the estimate of density that is notaccounted for when range-wide and pooled estimatesof g0 are used, and should be considered for furtherstudy. Surely, there are interactions between topogra-phy, habitat type, climate, region and behavior thatinfluence the number of animals observed on tran-sects, which have yet to be enumerated or studied.While we did not find our estimate of density to be dif-ferent from the published estimate (which used pooledvalues), the variance of the estimates differed mark-edly, and was largely attributable to the increasedvariability imparted by the reduced numbers of tor-toises encountered on any given day.
The variation in numbers of encounters on transectscan be caused by many factors including spatial aggre-gation of animals with respect to transects, and tem-poral clustering of availability as when portions oftransects are walked when tortoises are inactive. Ag-gregated dispersions of individuals are known to affectestimates of density in numerous species and samplingsituations (Cochran 1977, Green & Young 1993, Christ-man 2004) and can certainly violate underlyingassumptions of spatially uniform distributions in thecomputation of population density with distance sam-pling. Clumped species distributions can cause artifi-cially reduced estimates of animal density when theclumped groups are missed completely during sam-pling (Thompson 1991, Thompson & Seber 1994). Thedegree of spatial clustering in desert tortoises has onlybeen cursorily investigated in a few localities, but evi-dence suggests spatial aggregation in desert tortoisedistributions at multiple scales (Duda et al. 2002).
Another difference between the 2 methods used toestimate g0 is found in the definition of ‘availability’itself. The FWS defined availability as the visibility ofany tortoise in the open, in vegetation, or even in a bur-row (and often with the aid of a light source), becausesuch as definition increases the total number of poten-tial observations on each transect (thereby increasingn). Including ‘visible’ animals on each transect cer-tainly increases the precision of the detection function,but it also introduces an additional error into g0 by con-founding the effects of g0 with those of Pa. For example,tortoises on the surface would likely have differentdetectability than tortoise burrows, and certainly dif-ferent detectability than tortoises within burrows onceburrows are detected. Unfortunately, the lack of dataon the detectability of burrows precludes quantifyingthis additional error which is not addressed here.
302
Inman et al.: Detection of population trends in desert tortoises
While we did not explore different methods to esti-mate Pa, there are several sources of error that mayinfluence its estimation and its variance that are worthdiscussing. For example, Pa is partly influenced byvegetation density, such that when vegetation is lushor dense, Pa is likely to be reduced due to an observer’sinability to see through or beyond nearby vegetation.This influences observations of animals and their bur-rows, which confounds Pa with g0 especially when ani-mals that are below the ground (but visible) are pooledwith those found above the ground. The reportedrange-wide Pa for 2005 was the lowest for the 5 yrperiod, and also corresponded with the highest winterprecipitation from the year 2000 to 2005. While wetyears may correspond with high g0, they may also cor-respond with depressed Pa. This may translate intoadditional and unmeasured variation in Pa when vege-tation density and lushness decline throughout thesampling period or when vegetation density variesthroughout the sampling area, which is likely to occurwhen sampling over large areas such as the MojaveDesert. There are other factors that add variation to Pa,such as differences among observer experiences(Freilich & LaRue 1998), and climate or site differences(Duda et al. 1999, Freilich et al. 2000), all of whichshould be accounted for to derive accurate estimates ofdetectability and its error.
We estimated the CV of the density estimate for 2004in the Western Mojave Recovery Unit to be 0.53. Thiswould only allow for detection of population trends nosmaller than ~5% yr–1 (and this could only occur aslong as conditions remained the same each year). It ishighly unlikely that sampling conditions better thanthose found in 2004 would persist for multiple yearswithout substantial changes in sampling methods.However, if changes in sampling methods couldensure that transect sampling occurred over shorterperiods when g0 was high and less variable, CVs in g0
as low as 0.16 might be possible. When combined withthe lowest variation in Pa and n (this occurs when sam-pling is conducted on fewer days when g0 is high), esti-mates of density with CVs as low as 0.32 could result.This level of precision under an optimal sampling sce-nario would have sufficient precision to detect popula-tion trends of 3% yr–1. Detecting trends of 3% yr–1 maybe as good as transect sampling can ever achieve whenestimates of density require knowledge of the propor-tion of the population available to be sampled. How-ever, this level of precision provides only a means todetect population declines, which can occur at veryrapid rates (Berry 1984, US Fish and Wildlife Service1994, Longshore et al. 2003, Tracy et al. 2004). This isbecause even under the best population demograph-ics, trends in desert tortoise population growth arethought to be <1% (Doak et al. 1994, US Fish and
Wildlife Service 1994), indicating that if managershope to detect positive population growth, density esti-mates with CVs of <0.125 are needed. This seemsinfeasible using the sampling methods implementedfrom 2001 to 2005.
Acknowledgements. We thank A. Chesley, J. Cook, and C.Kerley for help with fieldwork, and the University of Red-lands, the Clark County Desert Conservation Plan and the USGeological Survey for funding. Earlier versions of this manu-script benefitted from the reviews of S. Jenkins and P. Weis-berg. We also thank the USFWS Desert Tortoise RecoveryOffice for access to the Western Mojave Recovery Unit moni-toring data that we used for comparisons. All research usinganimals was conducted according to IACUC guidelines (Uni-versity of Nevada IACUC Protocols A03/04-41), State (CDFG801167-01) and Federal (TE-0706710-4) permits. Any use oftrade names or specific products is for descriptive purposesonly and does not imply endorsement by the US Government.This research was part of a thesis submitted to the Depart-ment of Biology at the University of Nevada, Reno.
LITERATURE CITED
Anderson DR, Burnham KP, Lubow BC, Thomas L, Corn PS,Medica PA, Marlow RW (2001) Field trials of line transectmethods applied to estimation of desert tortoise abun-dance. J Wildl Manag 65:583–597
Bächler E, Liechti F (2007) On the importance of g(0) for esti-mating bird population densities with standard distance-sampling: implications from a telemetry study and a liter-ature review. Ibis 149:693–700
Bayliss P, Giles J (1985) Factors affecting the visibility of kan-garoos counted during aerial surveys. J Wildl Manag49:686–692
Berry KH (1984) The status of the desert tortoise (Gopherusagassizii) in the United States. Publication No. 11310-0083-81: Report from the Desert Tortoise Council to USFish and Wildlife Service, Sacramento, CA
Buckland ST (1985) Perpendicular distance models for linetransect sampling. Biometrics 41:177–195
Buckland ST, Anderson DR, Burnham KP, Laake JL, BorchersDL, Thomas L (2001) Introduction to distance sampling:estimating abundance of biological populations. OxfordUniversity Press, New York
Buckland ST, Anderson DR, Burnham KP, Laake JL, BorchersDL, Thomas L (2004) Advanced distance sampling: esti-mating abundance of biological populations. Oxford Uni-versity Press, New York
Bulova SJ (1994) Patterns of burrow use by desert tortoises:gender differences and seasonal trends. Herpetol Monogr8:133–143
Bulova SJ (2002) How temperature, humidity, and burrowselection affect evaporative water loss in desert tortoises.J Therm Biol 27:175–189
Bury RB, Corn PS (1995) Have desert tortoises undergone along-term decline in abundance? Wildl Soc Bull 23:41–47
Christman MC (2004) Sequential sampling for rare or geo-graphically clustered populations. In: Thompson WL (ed)Sampling rare or elusive species: concepts, designs, andtechniques for estimating population parameters. IslandPress, Washington, DC, p 134–135
Cochran WG (1977) Sampling techniques. Wiley and Sons,New York
303
Endang Species Res 10: 295–304
Corn PS (1994). Recent trends in desert tortoise populations inthe Mojave Desert. In: Bury RB and Germano DJ (eds)Biology of North American tortoises. US Department ofthe Interior, National Biological Survey, Fish Wildl Res13:85–93
Doak D, Kareiva P, Klepetka B (1994) Modeling populationviability for the desert tortoise in the western MojaveDesert. Ecol Appl 4:446–460
Duda JJ, Krzysik AJ, Freilich JE (1999) Effects of drought ondesert tortoise movement and activity. J Wildl Manag 63:1181–1192
Duda JJ, Krzysik AJ, Meloche JM (2002) Spatial organizationof desert tortoises and their burrows at a landscape scale.Chelonian Conserv Biol 4:387–397
Fielding AH, Bell JF (1997) A review of methods for theassessment of prediction errors in conservation pres-ence/absence models. Environ Conserv 24:38–49
Freilich JE, LaRue EL (1998) Importance of observer experiencein finding desert tortoises. J Wildl Manag 62: 590–596
Freilich JE, Burnham KP, Collins CM, Garry CA (2000) Fac-tors affecting population assessments of desert tortoises.Conserv Biol 14:1479–1489
Germano DJ, Bury RB, Esque TC, Fritts TH, Medica PA (1994)Range and habitats of the desert tortoise. In: Bury RB, Ger-mano DJ (eds) Biology of North American tortoises. USDepartment of the Interior, National Biological Survey,Fish Wildl Res 13:73–84
Green RH, Young RC (1993) Sampling to detect rare species.Ecol Appl 3:351–356
Jachmann H (2002) Comparison of aerial counts with groundcounts for large African herbivores. J Appl Ecol 39: 841–852
Laake JL, Borchers DL (2004) Methods for incomplete detec-tion at distance zero. In: Buckland ST, Anderson DR, Burn-ham KP, Laake LJ, Borchers DL, Thomas L (eds) Advanceddistance sampling: estimating abundance of biologicalpopulations. Oxford University Press, Oxford, p 108–109
Lande R (1993) Risks of population extinction from demo-graphic and environmental stochasticity and random cata-strophes. Am Nat 142:911–927
Longshore KM, Jaeger JR, Sappington JM (2003) Desert tor-toise (Gopherus agassizii) survival at two eastern MojaveDesert sites: death by short-term drought? J Herpetol37:169–177
Miller GE (1991) Asymptotic test statistics for coefficients ofvariation. Commun Stat A-Theor 20:3351–3363
Nussear KE, Tracy CR (2007) Can modeling improve estima-tion of desert tortoise population densities? Ecol Appl 17:579–586
Nussear KE, Esque TC, Tracy CR (2002) A method for contin-uously measuring body temperature in terrestrial cheloni-ans. Herpetol Rev 33:114–116
Skaug HJ, Oien N, Schweder T, Bothun G (2004) Abundanceof minke whales (Balaenoptera acutorostrata) in the north-
east Atlantic: variability in time and space. Can J FishAquat Sci 61:870–886
Southwell C, Paxton CGM, Borchers D, Boveng P, de la MareW (2008) Taking account of dependent species in manage-ment of the Southern Ocean krill fishery: estimatingcrabeater seal abundance off east Antarctica. J Appl Ecol45:622–631
Thomas L, Laake JL, Strindberg S, Marques FFC and others(2004) Distance 5.0. Release 1. Research Unit for WildlifePopulation Assessment, University of St. Andrews
Thompson SK (1991) Stratified adaptive cluster sampling.Biometrika 78:389–397
Thompson WL (2002) Towards reliable bird surveys: account-ing for individuals present but not detected. Auk 119:18–25
Thompson SK, Seber GAF (1994) Detectability in conven-tional and adaptive sampling. Biometrics 50:712–724
Tracy CR, Averill-Murray R, Boarman WI, Delehanty D andothers (2004) Desert tortoise recovery plan assessment.p 217, www.fws.gov/Nevada/desert_tortoise/documents/dtrpac/dtrpac_report.pdf
Turner RM (1982) Mohave desertscrub. In: Brown DE (ed)Biotic communities of the American Southwest – UnitedStates and Mexico. Desert Plants 4:157–168
US Fish and Wildlife Service (1989) Endangered and threat-ened wildlife and plants; emergency determination ofendangered status for the Mojave population of the deserttortoise. Fed Regist 54:32326–32331
US Fish and Wildlife Service (1990) Endangered and threat-ened wildlife and plants; determination of threatened sta-tus for the Mojave population of the desert tortoise. FedRegist 55:12178–12191
US Fish and Wildlife Service (1994) Desert tortoise (Mojavepopulation) recovery plan. US Fish and Wildlife Service,Portland, OR, p 73
US Fish and Wildlife Service (2006) Range-wide monitoring ofthe Mojave population of the desert tortoise: 2001–2005summary report. Report by the Desert Tortoise RecoveryOffice, US Fish and Wildlife Service, Reno, NV
US Fish and Wildlife Service (2008) Draft revised recoveryplan for the Mojave population of the desert tortoise(Gopherus agassizii). US Fish and Wildlife Service, Cali-fornia and Nevada Region, Sacramento, CA, p 209
Wilson DS, Morafka DJ, Tracy CR, Nagy KA (1999) Winteractivity of juvenile desert tortoises (Gopherus agassizii) inthe Mojave Desert. J Herpetol 33:496–501
Woodbury AM, Hardy R (1948) Studies of the desert tortoise,Gopherus agassizii. Ecol Monogr 18:146–200
Zimmerman LC, O’Connor MP, Bulova SJ, Spotila JR, KempSJ, Salice CJ (1994) Thermal ecology of desert tortoises inthe eastern Mojave Desert: seasonal patterns of operativebody temperatures, and microhabitat utilization. HerpetolMonogr 8:45–59
304
Editorial responsibility: David Hodgson,University of Exeter, Cornwall Campus, UK
Submitted: February 3, 2009; Accepted: June 12, 2009Proofs received from author(s): August 31, 2009