penrose, jago (2013) financial development and the...
TRANSCRIPT

Penrose, Jago (2013) Financial development and the financing, funding and liquidity
management of firms: a post‐Keynesian approachwith reference to Vietnam. PhD Thesis.
SOAS, University of London
http://eprints.soas.ac.uk/18068
Copyright © and Moral Rights for this thesis are retained by the author and/or other
copyright owners.
A copy can be downloaded for personal non‐commercial research or study, without prior
permission or charge.
This thesis cannot be reproduced or quoted extensively from without first obtaining
permission in writing from the copyright holder/s.
The content must not be changed in any way or sold commercially in any format or
medium without the formal permission of the copyright holders.
When referring to this thesis, full bibliographic details including the author, title, awarding
institution and date of the thesis must be given e.g. AUTHOR (year of submission) "Full
thesis title", name of the School or Department, PhD Thesis, pagination.

Financial Development and the Financing, Funding and Liquidity
Management of Firms: a post-Keynesian Approach with
Reference to Vietnam
Jago Penrose
Department of Economics,
School of Oriental and African Studies
University of London
August 2013

Declaration for PhD Thesis
I have read and understood regulation 17.9 of the Regulations for students of the School of Oriental and African Studies concerning plagiarism. I undertake that all the material presented for examination is my own work and has not been written for me, in whole or in part, by any other person. I also undertake that any quotation or paraphrase from the published or unpublished work of another person has been duly acknowledged in the work which I present for examination.
Signed: Date:

Acknowledgements
With thanks to Jan Toporowski, Ngoc, Binh Tam, and my father, Perran, who will not now be able to read this.

Abstract
This thesis presents an original analysis of the firm in economic development as a firm that manages a balance sheet from which cash flow may be generated in the usual income and expenditure way that is common to most theories of the firm, but also through balance sheet operations designed also to maintain the liquidity of the firm. This analysis is based on the work of Michal Kalecki, Hyman Minsky and Josef Steindl and extends the post-Keynesian understanding of the firm to take account of balance sheet management, and applies it to firms emerging in a developing country in the transition from a centrally planned economy.
In the Keynesian tradition the banking and finance sectors play three distinct roles for the firm sector: financing, funding (replacing short term with long term liabilities) as well as providing the means for firms to manage their liquidity in order to protect themselves against the unexpected and meet their financial commitments. Hyman Minsky’s balance sheet firm is supplemented with insights from Michal Kalecki, Josef Steindl and others to suggest that firms are heterogenous in their financing, funding and liquidity management strategies, that also vary according to the financial institutions available to the firm. Therefore, the impact of financial development on an economy will depend both on the dynamics of institutional change and the composition of the enterprise sector. A study of Vietnam demonstrates that the approach can help to explain the economic impact of financial development. A flow of funds analysis illustrates developments in financial flows between key sectors as a result of institutional reform and external capital flows. A closer study of the enterprise sector in which firms are organised according to size and ownership demonstrates heterogenous responses to financial development.

ContentsList of Figures 8List of Tables 9Acronyms 11Chapter 1: Introduction 181.1. Methodology 19Chapter 2: The Abstract Firm 322.1. Introduction 322.2. Alfred Marshall and the Reconciliation Problem 332.3. The Firm as an Antidote to Market Failure 37
2.3.1. Coase and Williamson: Transaction Costs 372.3.2. Alchian, Demsetz and the Importance of Teamwork 402.3.3. Evolutionary Theories of the Firm 43
2.4. Capabilities Approach 462.5. Conclusions 52Chapter 3: The Balance Sheet Firm 543.1. Introduction 543.2. Post-Keynesian Firm 553.3. Using Kalecki and Steindl 573.4. Minsky’s Balance Sheet Firm 663.5. Kalecki and Steindl as Minsky’s Balance Sheet Firm 683.6. Summary and Conclusion 74Chapter 4: Financial Development and the Balance Sheet Firm 764.1. Introduction 764.2. Financial Liberalisation Hypothesis 77
4.2.1. Financial deepening and Growth 794.2.2. The elasticity of the interest rate with respect to savings, investment and growth 81
4.3. A post-Keynesian Alternative 824.3.1. Banks 844.3.2. Funding and Financing 874.3.3. Capital Market Inflation and Overcapitalisation 88
4.4. The Balance Sheet Firm and Financial Development 894.4.1. Banks, entrepreneurial capital and the principle of increasing risk 90
............................................................................................................................................................................................................
..............................................................................................................................................................................................
.........................................................................................................................................................................
.......................................................................................................................................
..........................................................................................
................................................................................
................................................................................................................................................................................
.................................................................................................................................................................
...........................................................................................................................................................
...................................................................................................
................................................................................................
..................................................................................................................................................................................................................
........................................................................................................................................................................
..........................................................................................................................................................................
.................................................................
....

4.4.2. Liquidity management in Small and Large firms 914.5. Vision and Propositions 974.5.1. Private Sector Growth 974.5.2. State owned enterprises 100
4.6. Propositions 1034.7. Methodology 1044.8. Conclusion 105Chapter 5: Institutional Reform in Vietnam 1075.1. Introduction 1075.2. Vietnam - Background 1075.3. Doi Moi. 1105.4. Enterprise Reform under Doi Moi 113
5.4.1. State Owned Enterprise Reform 1135.4.2. Private Sector Reform 117
5.5. Financial and Banking Reform 1185.6. Stock Market Reforms 1225.7. Foreign Investment 1235.8. Conclusion 125Chapter 6: Vietnam - Flow of Funds 1266.1. Introduction 1266.2. Flow of Funds 1266.3. Vietnamese Flow of Funds 129
6.3.1. Finance and Banking 1376.3.2. Financial Sector 1466.3.3. Real Estate Investment 1496.3.4. The Enterprise Sector 151
6.4. The Private Sector 1786.4.1. World Bank Enterprise Surveys 1806.4.1.1. Relationship with Banking sector 180
6.5. Conclusion 1907. Chapter 7: Case Studies of Vietnamese Firms 1927.1. Introduction 1927.2. Vietnam’s Largest Firms 1937.2.1. Survey Methodology 1937.2.2. The Firms 198
......................................................................................................................................................................................................................................................
.........................................................................................................................................................................................
...................................................................................................................................................
...........................................................................................................................................................................
..............................................................................................................................................................
..............................................................................................................................
.............................................................................................................................................
.................................................................................................................................................................................
.............................................................................................................................................................
.................................................................................................................................................................
.........................................................................................................................................................
.............................................................................................................................................
............................................................................................................................................
.................................................................................................................................................
..........................................................................................................................................
......................................................................................................................................................
..............................................................................................

7.2.3. General Corporations 1997.2.4. GC Financing 1997.2.4.1. Vinatex 2007.2.4.2. Vinashin 2027.2.5. Subsidiaries 2067.2.6. Parent Child Structure 2107.2.7. Quasi-private SOEs 2147.2.8. Private Companies 220Minh Phu 220Cat Thai 221Fuvi 223Bitis 225
7.3. Listed firms 227Methodology 227Surveyed Firms 228Non-Financial Firms listed in 2007 and 2008 229
7.4. Conclusion 232Chapter 8: Discussion and Conclusion 2368.1. The Balance Sheet Approach in Vietnam 236
8.1.1. Period I 2368.1.1.1. Private Sector 2368.1.1.2. State Owned Sector 2378.1.1.3. Quasi-Private SOEs 2388.1.2. Period II 2398.1.2.1. The Private Sector 2398.1.2.2. State Sector and Quasi-Private SOEs 2408.1.3. Period III 2408.1.3.1. Private Sector 2408.1.3.2. SOE Sector 241
8.2. The Relevance of the Balance Sheet Firm Approach to Understanding Financial Development 2439. Bibliography 247
Appendices 280
...........................................................................................................................................................
...........................................................................................................................................................................................................................................................................
..............................................................................................................................................................................................................................
............................................................................................................................................................................................................
.............................................................................................................
..........................................................................................................................................................................................................................................................................................................
........................................................................................................................................
..........................................................................................................................................................
..............................................................................................................................................
................................................................................................................................................................................................................................
......................................................................................................................................................................
.......................................................................................................................................
......................................................................................................................................................................
.................................................................................................................................................................................
..........................................................................................................

List of FiguresFigure 1: Contribution to GDP by Sector (%) 108Figure 2: Exports of Foreign and Domestic Sector (Mill USD) 109Figure 3: Timeline of the Major Finance and Banking Reforms since 1990. 119Figure 4: Cash in Circulation Outside the Banking System (%) 122Figure 5: Gross Fixed Capital Formation and Savings (% of GDP) 130Figure 6: Government FCF and Net Lending (% of GDP) 131Figure 7: Private Sector FCF, Saving and Net Lending (% of GDP) 132Figure 8: RoW Net Lending (% of GDP) 133Figure 9: Contribution of Foreign Direct and Indirect Investment (% of GDP) 134Figure 10: Sector Uses and Sources 135Figure 11: Deposit Bank Credit and Money (% of GDP) 137Figure 12: State Owned Commercial Bank Loans and JSB Loans (% of GDP) 138Figure 13: Total Bank Loans to SOEs and Non-State Sector (% of GDP) 139Figure 14: SOCB Loans to SOEs and Non-State Sector (% of GDP) 140Figure 15: JSB Loans to SOEs and Non-State Sector (% of GDP) 141Figure 16: Real Estate Share of Total Loans 2008 144Figure 17: Value of Shares Traded (% of GDP) 147Figure 18: Corporate Bonds by Industry 149Figure 19: Real Estate Investment (% of GDP) 150Figure 20: Growth in Real Estate Enterprises 151Figure 21: Firm and Household Savings (% of GDP) 155Figure 22: Profits and Investment of Total Enterprise Sector (% of GDP) 158Figure 23: Profits and Investment of State Sector (% of GDP) 159Figure 24: Profits and Investment of Non-State Sector (% of GDP) 160Figure 25: Savings Gap by Firm Ownership (% of GDP) 161Figure 26: Liability to Equity Ratio 164Figure 27: Total Equity by Sector (Bil VND) 165Figure 28: Total Liabilities by Sector (Bil VND) 166Figure 29: Type of Collateral as Determinant on Value of Collateral Pledged 182Figure 30: Cash as a Proportion of Current Assets (OLS) 186
...........................................................................
...........................
..................................................
..........................................................................
....................................................................................................
.......................
................................................................
...........................................................................................................
.....................................................................................................
..............................................
..........................................
....................................................................................................
..................................................................................................
...................................

List of TablesTable 1: Positivism and Critical Realism 20Table 2: Firms and Financial Institutions 93Table 3: Bank of Investment and Development 144Table 4: Vietcombank 145Table 5: Vietinbank 145Table 6: Corporate Bonds 148Table 7: Net Transfers of SOE Sector to Banks and Budget 153Table 8: Measures of Investment as a Percentage of GDP 156Table 9: Profits as a Proportion of GDP and Profits / Change in assets 157Table 10: Average size of ownership types (Bil VND) 162Table 11: Liabilities/ Total Capital 163Table 12: Current Assets/ Total Liabilities 167Table 13: Share of Total Revenues 167Table 14: Average Profit Margins by Ownership Type 168Table 15: Some Indicators for Non-State Firms by Size (Employees) 169Table 16: Some Indicators for State Firms by Size (Employees) 173Table 17: Difference Between Non-State and State Firms ((-) indicates greater value for state sector). 177Table 18: Collateral and interest in a JSB 179Table 19: Proportion of Firms with Bank Account 180Table 20: Surveyed Firms with Loans that Pledged Collateral 181Table 21: Ratio of Collateral to Loans 181Table 22: Types of Collateral (2005) 184Table 23: Types of Collateral (%) (2009) 184Table 24: Sources of Working Capital (%) (2005) 184Table 25: Sources of Working Capital (%) (2009) 185Table 26: 2005 Ratio of Cash to Current Assets, Total Assets and ST Liabilities. (Averages of 2003 and 2004) 185Table 28: Cash as a Proportion of Current Assets for Various Diversified Firms188Table 29: Impact of Being a Member of a GC on Cash Held as Proportion of Current Assets 189Table 30: Sources of Investment Capital (%) (2005) 189
.........................................................................................................................
.........................................................................................................................................
..............................................................................................................................................................................
.............................................................
..................................................
..............................................................................................................................
.........................................................................................................
....................................
...................................................................................................................................................
.....................................................................
...............................................................................................................................
....................................................................................................................................................
..................................................................................
..............................................................................................................................................

Table 31: Sources of Investment Capital (%) (2009) 190Table 32: Top 200 share of labour, assets and turnover 195Table 33: General Corporation Affiliates 196Table 34: Vinashin Liabilities 205Table 35: Proportion of Firms with Acid Ratios above 1 by Ownership 230Table 36: Proportion of Firms with Acid ratio over 1 by Size (Charter Capital) 230Table 37: Uses of stock issues by firm size (Charter capital billions) 231Table 38: Uses of stock issues by firm ownership (Charter capital billions) 231Table 39: Short term to Long Term Liabilities 232
..............................................................................
.......................................................................................................................................
................
....................
..................................................

Acronyms
ABL Asset Based Lending
ADB Asian Development Bank
Agribank Bank for Agricultural and Rural Development
Agtex Company No. 28
ANZ Australia and New Zealand Banking Group Limited
APEC Asia-Pacific Economic Cooperation
ASEAN Association of Southeast Asian Nations
BCA Bank Central Asia
Bao Viet Vietnam Insurance Corporation
BIDV Bank for Investment and Development of Vietnam
Biti’s Binh Tien Consumer Goods Production Ltd
Cadivi Vietnam Electric Wire and Cable Company
Casumina Southern Rubber Industry Company
CEO Chief Executive Officer
Cholimex Cho Lon Investment and Import Export Corporation
CIEM Central Institute for Economic Management
CIT Corporate Income Tax
CNC Computer Numerical Control
Comecon Council for Mutual Economic Assistance
CPV Communist Party of Vietnam
Dakruco Dak Lak Rubber Company
DAF Development Assistance Fund

DFID Department for International Development
Biti’s Binh Tien Dong Nai Import Export Corporation Ltd
DRC Danang Rubber Company
DRV Democratic Republic of Vietnam
EVN Electricity of Vietnam
FDI Foreign Direct Investment
FETP Fulbright Economics Teaching Program
FIE Foreign Invested Enterprise
FLH Financial Liberalisation Hypothesis
FoFs Flow of Funds
FPT Corporation for Financing and Promoting Technology
FYP Five Year Plan
Garco 10 Garments Company No. 10
GC General Corporation
GDP Gross Domestic Product
Geruco Vietnam Rubber Group
GFCF Gross Fixed Capital Formation
GFS Government Financial Statistics
GSO General Statistics Office
HACC Hanoi Construction Corporation
Hanosimex Hanoi Textile and Garment Company
Haprosimex Hanoi General Production and Import Export Company
HASTC Hanoi Stock Trading Centre

HCMC Ho Chi Minh City
HOSE Ho Chi Minh City Stock Exchange
HSBC Hongkong and Shanghai Banking Corporation
IDB Investment and Development Bank
ICBV Industrial and Commercial Bank of Vietnam
ICOR Investment Capital Output Ratio
IFC International Finance Corporation
IFS International Financial Statistics
IPO Initial Public Offering
IMF International Monetary Fund
ISIC International Standard Industrial Classification
IT Information Technology
IZ Industrial Zone
LDC Less Developed Country
LLC Limited Liablity Company
LUC Land Use Certificate
LSS Living Standards Survey
LT Long Term
JICA Japanese International Cooperation Agency
JSB Joint Stock Bank
JSC Joint Stock Company
JV Joint Venture
Lilama Vietnam Machinery Erection Corporation

MARD Ministry of Agriculture and Rural Development
MFN Most Favoured Nation
MITI Ministry of Industry and Trade
MNC Multinational Corporation
Mobiphone Vietnam Mobile Telecom Services Company
MoD Ministry of Defence
MoF Ministry of Finance
MoFD Ministry of Food
MoI Ministry of Industry
MoPT Ministry of Post and Telecommunications
MPC Marginal Product of Capital
MPI Ministry of Planning and Investment
Nhabeco Nha Be Garments Company
NPL Non-performing Loan
NS Non-State
ODA Overseas Development Aid
OECD Organization for Economic Co-operation and Development
OLS Ordinary Least Squares Regression
OTC Over the Counter
PC Parent-Child
PCI Provincial Competitiveness Index
Petrolimex Vietnam National Petroleum Corporation
PVN Vietnam Oil and Gas Group

PIR Principle of Increasing Risk
PPC People’s Committee
Protrade Binh Duong Production and Import Export Company
RBV Resource Based View
ROW Rest of the World
RVN Republic of VietnamSatra Saigon Trading Corporation
SBV State Bank of Vietnam
SCIC State Capital Investment Corporation
Seaprodex Vietnam National Sea Products Corporation
Seaprodex Danang Danang Sea Products Import Export Corporation
SITC Standard International Trade Classification
SME Small and Medium Sized Enterprise
SOAS School of Oriental and African Studies
SOCB State Owned Commercial Bank
SOE State Owned Enterprise
SRV Socialist Republic of Vietnam
ST Short Term
Tacombank Tan Viet Joint Stock Commercial Bank
Tamexco Tan Binh Production Service Trading and Export Company
Techcombank Technological and Commercial Joint Stock Bank
TFC Textile-Garment Financial Co
TVE Township and Village Enterprise
UNDP United Nations Development Programme

UNIDO United Nations Industrial Development Organization
US United States
USBTA United States Bilateral Trade Agreement
USCS United States Commercial Service
USD United States Dollar
USSR Union of Soviet Socialist Republics
Ut Xi Ut Xi Aquatic Products Processing Company
VAT Value Added Tax
VBARD Vietnam Bank for Agriculture and Rural Development
VCCI Vietnam Chamber of Commerce and Industry
VCP Vietnamese Communist Party
VDF Vietnam Development Forum
VEAM Vietnam Engine and Agricultural Machinery Corporation
VGCL Vietnam General Confederation of Labour
VIC Vietnam Investment Group
Vietcombank Bank for Foreign Trade of Vietnam
Vietsovpetro Vietsovpetro Joint Venture Enterprise
Viettel Military Telecom Corporation
Vinacafe Vietnam Coffee Corporation
Vinachem Vietnam National Chemical Corporation
Vinacomin Vietnam Coal and Mineral Industries Group
Vinaconex Vietnam Construction and Import Export Corporation
Vinafood 1 Northern Food Corporation

Vinafood 2 Southern Food Corporation
Vinaincon Vietnam Industrial Construction Corporation
Vinalines Vietnam National Shipping Corporation
Vinamilk Vietnam Dairy Products Company
Vinapaco Vietnam Paper Corporation
Vinaphone Vietnam Telecom Services Company
Vinapimex Vietnam Paper Corporation
Vinashin Vietnam Shipbuilding Industry Group
Vinataba Vietnam Tobacco Corporation
Vinatex Vietnam National Textile and Garment Group
VNCC Vietnam Cement Corporation
VND Vietnam Dong
VNPT Vietnam Post and Telecommunications Group
VNR Vietnam Railways
VOSCO Vietnam Ocean Shipping Company
VSC Vietnam Steel Corporation
VSIC Vietnam Standard Industrial Classification
VSIP Vietnam Singapore Industrial Park
WDI World Development Indicators
WTO World Trade Organization

Chapter 1: Introduction
This thesis will present an original analysis of the firm in economic development as both a firm that manages a balance sheet from which cash flow may be generated in the usual income and expenditure way that is common to most theories of the firm, but also through balance sheet operations designed to maintain the liquidity of the firm. Building on the work of Michal Kalecki, Hyman Minsky and Josef Steindl it will further make the case that as firms may differ in their ability to access outside finance and also manage liquidity then financial deepening and the liberalisation of financial markets and the banking system (financial development) will not affect firms equally, and the overall impact of financial development will depend in part on the composition of the firm sector. Moreover, although the ‘balance sheet firm’ adopted in the thesis is developed from observations on firm behaviour in developed economies with mature financial institutions, key principles behind the approach can be used to elucidate firm behaviour in the absence of mature financial institutions, as well as in periods of development. The approach proposed in this thesis also suggests a role for the state in the absence of mature financial institutions. However, as will be demonstrated in a study of the experience of Vietnam, state intervention may be problematic for reasons predicted by the approach proposed in the thesis.
The thesis proceeds in three stages:
First it will be argued that unlike more orthodox theories of the firm the balance sheet firm developed in this thesis suggests that firms are heterogenous with respect to the financial system in the following ways: the availability of outside finance is a function of the firm’s ‘entrepreneurial capital’, therefore the size of investments is in many ways linked to the size of the firm. Moreover, in the presence of ‘fundamental uncertainty’ firms will seek to manage their liquidity such that they can meet their commitments in the event of a shock to their primary business activities. It will be argued after Steindl and Kalecki that ‘small’ and ‘large’ firms are able to manage liquidity in different ways, with larger firms better able to survive the impact of shocks.

Chapter 1: Introduction 19
Second, it will be argued that firms, therefore, interact with the finance and banking sector in different ways. This is particularly the case in developing countries where finance and banking sectors are under development. Moreover, it may be the case that the strategies of firms in developing countries may differ from firms in developed capitalist economies with mature financial sectors (the concern of Steindl and Kalecki). Firms may also adapt their strategies in response to the development of financial institutions.
Third, as developing countries lack large concentrations of entrepreneurial capital, and financial services are underdeveloped then there is a case for government intervention in the allocation of rents and the financing of large firms undertaking capital intensive projects. Assuming that the distinctions between large and small firms are valid then this has implications for government policy with respect to the firm sector, and particularly with regard to the financial activities of state supported firms and other large firms as the finance sector develops. As post-Keyensian models tend to invert the relationship between savings and investment this has further implications for the financing of the firm sector, depending on the distribution of profits in the economy.
These ideas will be explored in the context of Vietnam, a country that has gradually undertaken substantial reform of its enterprise sector and finance and banking sector and that has experienced recent large inflows of foreign capital. The Vietnamese government has also supported a state owned enterprise sector that is gradually being granted autonomy. State firms are, over time, being forced to become less reliant on the state for finance and liquidity and begin to operate in response to market signals. Moreover, state firms, themselves, are far from homogenous and are responding to economic and financial development in different ways.
As this thesis is not a straightforward test of a hypothesis, but an exploration of the import of a set of theoretical ideas a particular methodological approach will be followed. This will be presented in the next section and will be followed by an outline of the thesis.
1.1. Methodology
A key methodological debate in economics is that between positivism and critical realism. The debate rests on the epistemological and ontological distinctions between

Chapter 1: Introduction 20
different approaches to the study of economic life. Table 1 presents the differences between positivism and critical realism.
Table 1: Positivism and Critical Realism
Source: Adapted from Courvisanos and Mackenzie (2011)
Critical realism is most closely associated with the work of Roy Bhaskar (1978). A distinctive feature, and the departure from more positivist approaches is the emphasis on the underlying mechanisms that cause events, rather than the events themselves (Courvisanos and Mackenzie 2011).
Rather than locate the field of study in a single, objective reality critical realism asserts that there are three levels to reality - the real, the empirical and the actual. Empirical observations - observed phenomena - are understood to be related to underlying structures that need to be understood if phenomena is to be explained. Positivist approaches, on the other hand, are content with observed relationships between (sense observed) empirical phenomena. Causality is induced from event regularities, and there is no attempt to identify causal mechanisms (Courvisanos and Mackenzie 2011). Second, whilst positivist approaches in economics tend to call upon a limited range of research methods, critical realism advocates that the choice of method should depend on the object of study (Lawson 2003). Third, the analyst brings with them ideology and experience. Whilst the world is considered to be separate and independent of the observer, impartial
Ontology
Epistemology
Axiology
Causation
Generalisation
Primary mode of inference
Positivism
Single objective reality
Knower and knowledge are independent
Inquiry is value free
Detectable through detection of event regularities
Time and context free generalisations from event
observation possible Induction
Critical Realism
Domains of real, actual and empirical
Knower inseparable from transitive dimension of knowledge
Inquiry is value-laden but not value-bound.
Causation unrelated to event regularity, but explained by
underlying causal mechanisms and how they produce observable
events.Generalisations from underlying causal mechanisms more reliable
than from event observationRetroduction

Chapter 1: Introduction 21
observation is impossible. Finally, the social world is assumed to be ‘open’ (‘event regularities are not ubiquitous… due to the multiple, and perpetually shifting mix of, causes of events’ (Lawson 1999)), although event regularities are assumed to occur ‘under specific conditions, in certain realms’ (Lawson 1999). Because the social world is not and cannot be ‘closed’, event regularities cannot be explained using analytical tools that are themselves confined to closed systems. In essence statements of the type ‘if event x, then event y’, are non-sensical (Graca Moura and Martins 2008). Nevertheless, critical realists do not deny that event regularities do occur. They are, ex-post, regularly observed. There may, however, be different causes, and event x need not always and everywhere give rise to event y, for reasons to be found in the underlying structures of the social realm. These are termed ‘demi-regularities’.
The primary objective of critical realist analysis, therefore, is the uncovering of the fundamental causes of phenomena or ‘retroduction’:
‘What emerges as essential in science, then, is not the framing of event regularities but rather the movement from observations on specific phenomena to hypotheses about their underlying causes.’
(Graca Moura and Martins 2008, p. 205)
Despite the emphasis on open systems critical realists do accept that some degree of ‘abstraction’ is often necessary, and have been criticised accordingly (Blaug 2003). Critical realism’s notion of ‘abstraction’ however does not imply the exclusion of that which is not under study. Instead, phenomena of interest is brought ‘into focus’; crucially, what is out of focus is still understood to have influence. Mainstream economics, on the other hand, is criticised for ‘isolating’ aspects of the social world, and so denying the possible impact of excluded phenomena (Lawson 1999). This is defended on the grounds of ceteris paribus, or the need to develop certain concepts prior to their analysis in the social sphere (Blaug 2003). Proponents of critical realism in turn argue that only if ceteris paribus is realistic is this permissible, and it rarely is (Graca Moura and Martins 2008). Moreover, whilst modelling something in an artificial closed system may have some merit it makes no sense then to apply it to an open system (ibid.). This leads

Chapter 1: Introduction 22
proponents of critical realism to deny certain methodologies, in particular econometrics, abstract mathematics and models.
Some post-Keynesians, chiefly Lawson (1999) and Dow (1999) adopt critical realism in order to distinguish themselves methodologically from mainstream economics, and also to provide themselves with greater coherence as a school. This has met with opposition on a number of grounds. Walters and Young (1999) argue that economists such as Davidson and Lavoie included in the post-Keynesian cannon are essentially realist: their concerns are primarily substantive theoretical issues and the relationships between empirical phenomena. For one reason or another they have not engaged in methodological debates or explicitly explored underlying structures in order to explain their observed relationships between empirical variables. Others - Straffa and Kalecki are named - also use deductive techniques, and so would be excluded from the the post-Keynesian school if critical realism was determined to be its methodological basis.
As this thesis draws closely on the work of Kalecki it is worth considering further his merits as a critical realist. Whilst it is true that he did develop mathematical models and make use of econometrics, as Walters and Young (1999) argue he had much in common with critical realist approaches. On one level his analysis of the macro economy drew heavily on manipulation of national accounting identities (also called upon in this thesis). These, whilst essentially empirical observations, can be considered as ‘abstractions’ in the sense described by Lawson (1999). Kalecki himself also understood the parameters of such equations to take on different meaning depending on the institutional structure in question. For example, in responding to Polish critics who argued that his extended Harrod Domar model was an attempt to develop a ‘universal theory of growth’, Kalecki,
‘noted that, on the contrary, ‘to each social system there corresponds an appropriate theory of growth’, a claim that he supported by ‘showing that the same formula for the rate of growth of national income should be interpreted in a different fashion depending on the social system we deal with’. In a socialist economy the three coefficients m, a and u were all determined on the supply side, the first two by the decisions of

Chapter 1: Introduction 23
the planning authorities. In a capitalist economy, in contrast, both u and m were demand-determined, to a greater or lesser degree. ‘The formula will remain entirely correct in a laisser-faire capitalist economy’, he concluded, ‘but the interpretation of the coefficients is quite different”
(Jefferson and King 2011, p. 968)
Jefferson and King go on to identify Kalecki’s ‘basic methodological principles’ as to:
‘always deal explicitly with a capitalist system, not with a classless, non-monetary, simple commodity-producing economy; use formal analysis where it is useful, including mathematics, charts and diagrams and statistical analysis; but never forget that these techniques are employed in connection with the real problems of a real capitalist economy’.
(Jefferson and King 2011, p. 966)
Jan Toporowski (1991) suggests further that Kalecki’s theoretical arguments are ‘directed by plainly empirical considerations’, and deployed in order to ‘identify the determinants of those variables and processes that were of crucial importance to policy-makers’ (Toporowski, 1991, p. 93, quoted in Jefferson and King 2011).
One difficulty adopting Kalecki’s theories in empirical study is that the analyst has a good idea as to underlying causality behind observed relationships, and moreover, as suggested above although Kalecki’s economic models are abstract in the critical realist sense they are intended to represent the capitalist economy as a closed system (as defined by Lawson). This notion that a social system can contain fixed relationships, or event regularities comprises an essential component of Andrew Brown’s critique of critical realism in economics and his concept of ‘systematic abstraction’ (Brown et al. 2002, 2007).

Chapter 1: Introduction 24
Whilst sympathetic to critical realism and its aims Brown et al. argue that there are methodological difficulties in the ‘synthesis stage’ of analysis:
‘Lawson’s account of abstraction is, in our view, highly insightful, offering much to critical realism and to social theory more generally. It is an account that is intimately bound up with, and serves to illuminate from a new angle, the general critical realist approach to method in social science. Our key argument, however, is that the critical realist account of abstraction, and hence the critical realist method in general, is slanted in focus (this applies not just to Lawson, but to all critical realist literature on the topic). Overriding emphasis is given to the ‘abstract’ stage of science, namely the movement from the apparent to the real. The scientist who seeks to reconstruct the concrete using knowledge gained from abstract sciences is little helped by critical realism. In alternative Marxist terminology, critical realism, insofar as it offers insight on method, emphasises the ‘method of enquiry’ to the neglect of the ‘method of presentation’. The aim is to locate the ‘real essence’ of phenomena; the corresponding ‘synthesis’ moment of science involved in reintegrating the concrete is relatively ignored.’
(Brown et al. 2002, p. 779)
Instead, they argue that rather than isolate ‘localised’ demi-regularities the analyst can identify ‘system wide’ event regularities that are ‘defined over a collection of individuals across the capitalist system, rather than being restricted to a particular individual or local group of individuals’ (Brown 2007). The crucial distinction is that such system wide event regularities define the system - Brown is concerned with those that characterise the Capitalist system. In their absence the system would collapse:
‘Collective event regularities can be shown to contradict the critical realist analysis of event regularities. Consider the example of ‘purchasing power’. For any individual commodity, to be sure,

Chapter 1: Introduction 25
the purchasing power that it confers upon its owner need not be actualized, i.e. the commodity may not be sold. Therefore, from the immediate, local perspective of individual commodity owners, the sale of commodities is not an absolutely strict event regularity. But if commodities in general did not exchange at appropriate ratios, for more than but a few days, then the distribution of resources that must occur if the necessities of life are to be maintained, in a commodity producing economy, would not in fact occur and the social system would collapse, the purchasing power of commodities along with it. Thus the collective actualization of purchasing power, i.e. the widespread exchange of commodities across the system as a whole, is a strictly regular occurrence for the duration of the existence of capitalism.’
(Brown 2007, p. 509)
This leads Brown to take issue with the critical realist assertion that social reality is many layered. Instead, ‘the conclusion to be drawn, when taking a system-wide and historical perspective on capitalism, is that the term ‘social structure’ refers both to social relations and to social practices (and vice versa). Contra critical realism, social relations are not ‘deeper’ than, underlying or interacting with, social activities. Rather, there is one single actuality to which concepts of ‘social relation’, ‘social activity’ and ‘social structure’ all refer, albeit with differences in emphasis. This actuality is the capitalist system as a ‘whole in essence’, focused upon by systematic dialectics’ (emphasis in original) (Brown 2007). This leads Brown to take issue with the research agenda implied by a critical realist perspective:
‘…[T]he essential task facing political economy is by no means to uncover multiple essences that are somehow ‘deeper’ than the ongoing activities of day-to-day life within capitalism. The orientation towards the method recommended by critical realism, according to the argument above, is quite wrong in this crucial

Chapter 1: Introduction 26
respect. Instead, political economy must reconstruct or reorder, in thought, familiar commonsense economic activities, relations, monetary forms, etc. so as to fathom their role or function in the self-reproducing capitalist system that they constitute. Activities, relations and forms initially appear in a confused and partial manner within the commonsense notions of everyday capitalistic life. Political economy must go beyond the initial confusion in order to comprehend how the manifold commonsense entities constitute a single, self-reproducing system. Economic theory should reveal that, and how, ongoing actualities function in the workings of capitalism.’
(Brown 2007, p. 514)
This is pursued in Arestis, Brown and Sawyer (2003) who take issue with the critical realist pursuit of ‘yet more hitherto unknown essential structures and mechanisms’ as explanations for observed demi-regularities. Instead, the ‘criterion of science must be the degree to which the theory developed successfully accounts for the many fundamental features of the economy, features already known to the investigator and so in no need of hypothesis.’ (Arestis, Brown and Sawyer 2003, p. 5) The theories are a means to shed light on the system under study:
‘Abstracting the mode of interconnection of structures, mechanisms and events, thus, does yield new knowledge to the investigator, but this is not some previously unknown entity, rather it is a new found comprehension of the function of given entities or aspects within the system that they constitute.’
(Arestis, Brown and Sawyer 2003, p.3)
Such an approach has striking echoes of Josef Schumpeter’s discussions of methodology in economics. Like Kalecki, Schumpeter is also accused of falling short of the requirements of a true proponent of critical realism. Graca Moura points to his attempt to marry concepts confined to a closed system (equilibrium and static models) to a dynamic

Chapter 1: Introduction 27
open system, and argues that the approach is incompatible (Graca Moura 2002). Nevertheless, if one disregards the possible shortcomings in his own analysis of business cycles and entrepreneurship and looks instead at his discussions of ‘pre-analytic’ vision and his ‘instrumentalist’ methodology there are useful insights to be gained, and these will serve to guide the analysis in this thesis.
For Schumpeter any research or analysis stems from the analyst’s ‘vision’ of the world, that is itself derived from personal experience, academic training and so forth. This vision frames the stating of the problem and the method of enquiry. The analyst forms a number of propositions and assumptions and these guide his analysis:
‘[I]n order to be able to posit ourselves any problems at all, we should first have to visualize a distinct set of coherent phenomena as a worthwhile object of our analytical efforts. In other words, analytical effort is of necessity preceded by a preanalytic cognitive act that supplies the raw material for the analytic effort. In this book, this preanalytic cognitive act will be called Vision.’
(Schumpeter 1954, pp. 41)
Shionoya (2004) argues that Schumpeter introduced instrumentalism into economics, although his instrumentalism differs from that associated with the likes of Friedman. The role of the theory is to derive useful results that shed some light on the world:
'[Schumpeter] asserted that fitness to reality is a necessary condition for a theory to be useful. Fitness of theories to reality refers to the ability of theories to describe, organize, and explain a body of phenomena, not the predictive value alone, unlike the contemporary narrow version of instrumentalism.'
(Shionoya 2004, p. 133)
Schumpeter took issue with the notion that the purpose of empirical economic inquiry was the verification of a theory as empirically verifiable or falsifiable:

Chapter 1: Introduction 28
‘We must first agree on what we mean by ‘verification.’ Any judgment of fact that is not analyzed and elaborated cannot actually prove the truth or falsity of a theoretical statement. It would not even be true to say that observations of statistical or historical facts could show us whether or not a specific theory is consistent with them. For a very real relationship may be so concealed by other factors that we can understand nothing about it without an analysis that digs deeply into the situation itself. Therefore only a more modest goal can be attained – namely, to ascertain how the relationships asserted by a theory are perceptible, or to put it differently, how much a theory contributes to an understanding of the situation.’
(Schumpeter 1954, p. xiv)
Theory, therefore, is a means to guide the researcher's exploration of available data. In this Schumpeter has much in common with Brown’s systematic abstraction and Arestis et al’s discussion of the role of the analyst. Moreover, Schumpeter also took a pragmatic approach to empirical analysis, recognising that data are not always comprehensive or reliable. Quantative data, for example, might not always be available. He suggested three criteria when exploring data:
“1. When our theory provides a description that allows quantitative expressions in principle, and when the data required for a test of that description are given, the theory should entail quantitative results that agree with the data.
2. When a theory merely gives a description that does not permit any quantitative expression in principle or because of the limited availability of data, the theory should make us realize that the fact in question is something to be expected by and large on the basis of the theory.

Chapter 1: Introduction 29
3. When neither is the case, a theory should indicate the concrete circumstances or concrete disturbing causes as well as the direction and exact or approximate extent of their influences, so that one can understand the situation by making appropriate modifications.”
(Schumpeter 1954, p. xv)
For Schumpeter, then, theory is not solely intended to predict but to organise, classify and reconstruct 'otherwise chaotic facts'. As for Arestis et al. in applying a ‘vision’ comprised of ‘masses of known structures, mechanisms and events’ the analyst can attempt to ‘see the wood for the trees’ (Arestis, et al. 2003, p. 5). The first step, though, is to select the theory and its components. The analysts then progress to available data.
The general objective of this thesis is to understand the changing relationship between the firm and the financial sector in the process of economic development. However, rather than adopting the propositions (or event regularities) commonly associated with more mainstream approaches it will develop an approach to the firm derived from the works of a number of post-Keynesians, with a particular emphasis on Michal Kalecki and Josef Steindl. It will isolate a series of relationships that are sensitive to institutional developments in the banking sector, asset markets and also those institutions that determine capital flows, and explore their implications for our understanding of financial development in developing countries and its effect on the firm and the enterprise sector as a whole. It is worth emphasising that, in the spirit of critical realist approaches, it will always be born in mind that other factors are at play, and that it cannot be claimed that the topics discussed in this thesis are the only explanatory factors.
This thesis will be structured as follows:
Although the thesis will use a post-Keynesian approach to the firm it is acknowledged that other approaches to the firm are also valid and have explanatory power. However, it will be argued in Chapter 2 that most more mainstream approaches to the firm stem from a set of assumptions and propositions that exclude the possibility of the the approach developed in the remainder of the thesis. Such approaches, it is argued, stem both from a

Chapter 1: Introduction 30
different pre-analytic vision (or visions) and, for the most part, are derived from analysis in closed systems. As such, if Lawson’s critique of mainstream economics is accepted, the application of such models to open systems has limited explanatory value.
Chapter 3 will develop a particular aspect of the post-Keynesian firm from the works of Michal Kalecki and Josef Steindl, also making use of Hyman Minsky’s ‘balance sheet firm’. The objective of the chapter will be to identify a series of ‘event-regularities’ or propositions that are derived from the vision and analysis of Kalecki and Steindl. The chapter will suggest that strategies for liquidity management depend on firm size and market power. These differences are a source of heterogeneity among firm populations that imply the interaction between firms and the finance sector is dependent on the distribution of entrepreneurial capital, the type, size and availability of asset markets and impacts on the size and quality of investments as well as the rates of firm survival.
Chapter 4 will present and critique the financial liberalisation hypothesis from a post-Keynesian perspective. It will then introduce post-Keynesian literature of firm financing and firm funding in developing countries. It will then argue that strategies for financing, funding and liquidity management depend on underlying institutional structures that generally change over time. The outcome of financial liberalisation will depend on the composition of the enterprise sector and firm strategies in response to new asset markets and banking regulations. The outcome of Chapters 3 and 4 will be a series of propositions that will then be explored in an analysis of a Vietnam, a developing country that has undertaken a series of reforms of its enterprise, finance and banking sectors in the context of fluctuating capital inflows.
Chapters 5 to 7 will be an empirical study of Vietnam. The objective is not to ‘explain’ recent Vietnamese economic history, but to adopt Schumpeter’s methodological approach with the objective of exploring the validity and implications of the ‘pre-analytic vision’ and propositions developed in Chapters 3 and 4. Chapter 5 will present the developments in the financial sector, the banking sector and the enterprise sector since 1975. This will serve as an account of the changing institutional structures in Vietnam. Chapter 6 is a flow of funds analysis of Vietnam since the mid-1990s. This will serve two purposes. The first is to illustrate how changing institutions affected aggregate capital flows and the net

Chapter 1: Introduction 31
position of the enterprise sector in relation to the government, banking and foreign sector. It will also explore the funding, financing and liquidity management behaviour of different types of firm in light of institutional developments and foreign capital flows. Chapter 7 will look more closely at the strategies of firms in Vietnam in the context of financial development and enterprise sector reform. Case studies of different categories of firm will be used to identify the means by which firms manage liquidity and finance and fund investments. An analysis of of the balance sheets of firms listed on the Hanoi Stock exchange will explore the uses firms make of the proceeds from stock issues.
Chapter 8 will conclude.

Chapter 2: The Abstract Firm
…‘Economic Evolution is gradual... And though an inventor, or an organiser, or a financier of genius may seem to have modified the economic structure of a people almost as a stroke; yet that part of his influence... [has] done little more than bring to a head a broad constructive movement which had long been in preparation. Those manifestations of nature which occur most frequently, and are so orderly that they can be watched and narrowly studied, are the basis of economic as of most scientific work...’
(Marshall 1997, p. xiv)
‘In the literature of economics the firm of the real world has long lived in that uncomfortable no-man’s-land between the high and dry plateaus of ‘pure theory’ and the tangled forests of ‘empiric-realistic’ research’.
(Penrose 1995, p. 9)
2.
2.1. Introduction
This and the following chapter are intended to introduce contrasting approaches to the firm in order to demonstrate (in Chapter 4) that our understanding of the impact of financial development and financial deepening on the economies of developing countries depends, in part, on the approach to the firm chosen.
This chapter argues that for non post-Keynesian approaches there are no a priori differences between firms in their relationship with the finance sector, and so in the impact of financial development on firms in a developing economy. The resolution of market failures in finance sectors impacts all firms equally, and a posteriori differences

Chapter 2: The Abstract Firm 33
are predominantly the result of entrepreneurial and managerial ability and historical accident. In approaches to the firm that are not built on theories of market failure such as the resource based view difference predominantly lies in the ability of the entrepreneur to negotiate finance with representatives of the banking and finance sectors. This approach, it is argued, is in the Marshallian tradition, in that it posits a ‘representative firm’, whose characteristics can be assumed to apply to all firms, although empirically they may differ. This contrasts with post-Keyensian approaches to the firm discussed in Chapter 3 that point to explicit differences between firms, and in the work of among others, Josef Steindl, Alfred Eichner and Michal Kalecki, differences between firms in the nature of their interaction with the finance sector. These a priori differences suggest that the impact of financial development on an economy will depend in part on the composition of the enterprise sector.
This chapter will be organised as follows. Section 2.2 will introduce Alfred Marshall’s theory of the representative firm, some critiques and Marshall’s own doubts as to its validity. Section 2.3 will discuss three approaches to the firm, which take as their foundation the idea that firms primarily exist as a means for economic agents to overcome market failure. Adopting the terminology of Christos Pitelis and David Teece these are referred to as ‘market superiority’ approaches (Pitelis and Teece 2009). Section 2.4 will outline a number of approaches that will be loosely termed ‘resource based’. Section 2.5 will conclude.
2.2. Alfred Marshall and the Reconciliation Problem
The notion that all firms can be understood with reference to one homogenous model of the firm can be traced at least to Alfred Marshall’s ‘representative firm’. From a methodological perspective Marshall seems to have been caught somewhere between the positivist position and something resembling critical realism. He took the approach that the economist should study the economy with a lens derived from modelling within a closed system. However, he also appears to have recognised that working on economic phenomena were other forces that were difficult to isolate, but that had an observable impact on economic actors.

Chapter 2: The Abstract Firm 34
Marshall believed that an economic theory should be derived from empirical observation. However, the theorist should be careful to distinguish one-off historical events from underlying and universal trends. Marshall himself contrasted his Principles of Economics with Trade and Industry along these lines. Principles was an exploration of the phenomena so frequently recurring they could be incorporated into a general model of economic life. Trade and Industry was an analysis of the ‘superstructure’, which displayed the results of ‘constructive movement’ and historical anomaly in equal measure. Pratten (1998) discusses these tensions in Marshall’s work, arguing that ultimately,
‘Marshall's inability to escape this inappropriate image of science stifles any systematic elaboration of a structured ontology. Regarding the second volume, his initial indecision, frustrated progress, and final abandonment reflect the stalemate Marshall seems to have reached. He appears unable to move forward and address in a sustained manner the issues he identifies as important since he lacks a conception of science that would encourage such elaborations. At the same time he is unwilling to step back because of the limitations he increasingly associates with his statical treatment.’
(Pratten 1998, pp. 159-160)
The capitalist firm presented particular difficulties to Marshall. As a legal entity it clearly existed. However, it was difficult to isolate the forces it represented. Late in Principles it become apparent to Marshall that if firms could benefit from internal economies of scale then it was possible that individual or small groups of firms might come to dominate industries. In the process they would undermine the concept of equilibrium, the key organising principle of Marshall’s model. Economies of scale would ‘give a very great advantage to large producers’ and production could fall ‘entirely into the hands of a few large firms.’ If this happened ‘the normal supply price cannot be isolated’ and prices would instead be ‘influenced by the incidents of the campaign between rival producers, each struggling for an extension of territory, as scarcely to have a true normal

Chapter 2: The Abstract Firm 35
level’ (Marshall 1997, p. 316). Marshall referred to this as the ‘reconciliation problem’: how to reconcile the existence of equilibrium with the implications of large scale internal economies. He developed two solutions to the problem. One was to argue that in most industries firms would face such difficulties expanding the market for their output that the advantages derived from large scale production would disappear. The other was to equate the lifecycle of the firm with that of the entrepreneur. In this way individual firms would be unable to fully exploit any available internal economies (Hart 1996):
‘Nature still presses on the private business by limiting the length of the life of its original founders, and by limiting even more narrowly the part of their lives in which their faculties remain full of vigour. And so, after a while, the guidance of the business falls into the hands of people with less energy and less creative genius, if not with less active interest in its prosperity’.
(Marshall 1997, p. 316)
At any moment ‘one can discern one particular size of firm which is in a sense normal: it is neither a young, growing firm, nor a decaying firm; that it is not a firm of unusually big size or with unusual advantages; that the normal economies that can be got in this industry (with the given size of the industry) are open to firms of such a representative size; and that the representative firm tends to increase in size as the industry expands’ (Marshall 1997, p.316). Marshall elaborates the point with a metaphor of a forest, in which a tree might grow more vigorously than others, but after some time ‘age tells on them all... and [although] the taller ones have better access to light and air than their rivals, they gradually lose vitality; and one after another they give their place to others’ (Marshall 1997, p. 316).
In the 1920s Marshall’s representative firm became the subject of the ‘cost controversy’, in which the implication of scale economies for equilibrium (and so Marshall’s solution to the reconciliation problem) was hotly debated1. In the debate Lionel Robbins argued that Marshall’s representative firm was a superfluous afterthought:
1. See Sraffa et al. (1930) and Harcourt and Blankenburg (2002)

Chapter 2: The Abstract Firm 36
‘There is no more need for us to assume a representative firm or representative producer, than there is for us to assume a representative piece of land, a representative machine, or a representative worker. All that is necessary for equilibrium to prevail is that each factor shall get at least as much in one line of production as it could in any other: as much of course, including all advantages and disadvantages of work, hiring or investment’.
(Robbins 1928, p.28)
Robbins went on to argue that it was not a ‘statistically average firm’. It would ‘only emerge arithmetically under conditions when all present tendencies to change had reached a state of equilibrium’ (Robbins 1928). Moreover, individual firms themselves need not be in equilibrium, as long as in aggregate they are. Marshall himself had allowed for variety within the population of firms in an economy, with respect to entrepreneurial ability, cost structure and innovative performance (Foss 1994).
With regard to theories of the firm the cost controversy allowed for two possible conclusions: that Marshall’s representative firm was excessively abstract, but unnecessary as long as equilibrium conditions were met2. Attention should instead be directed at investigating the characteristics and behaviour of the firm in an equilibrating world. Or, if equilibrium was impossible, and monopolistic competition dominated in a world characterised by internal economies then an altogether new approach should be developed.
Towards the end of his life Marshall grappled with this question, asking whether his representative firm and the owner/ manager firm were a true reflection of the forces at work. Since the emergence of the joint-stock company the entrepreneur had detached himself from the firm, and firms could grow independently of the energies of the owner. ‘Vast joint-stock companies’ can ‘in favourable circumstances... secure a permanent place in the work of production’ (Marshall 1997, p. 316). Marshall seems to have sided in the
2. There is, however, a view that Marshall abandoned the second volume of Principles because he no longer
subscribed to the neo-classical research programme, particularly the implications of internal returns to scale
for static equilibrium. See (Thomas 1991) and (Moss 1990).

Chapter 2: The Abstract Firm 37
end with his initial assessment, arguing that such companies would eventually see their ‘force’ diminish in the face of competition from younger and smaller rivals (Hart 1996).
The significance of Marshall’s representative firm is difficult to measure. In one respect Robbins was right. It was simply an instrument adopted by Marshall to ensure the stability of his model. It was not intended as a theory of the capitalist firm. If, as Robbins maintained, Marshall’s model stands up to scrutiny without it, then it loses much of its significance. On the other hand Marshall’s own fear was that if diversified joint-stock companies that exhibited internal returns to scale proved to be significant manifestations of nature then the model developed in his Principles would require significant revision. The remainder of this chapter will argue that the majority of those who have concerned themselves with developing a theory of the capitalist firm have sided with Marshall. Those that did not, discussed in the following chapter, take as their point of a departure an altogether different economic system, with implications for our understanding of the economic impact of financial development.
2.3. The Firm as an Antidote to Market Failure
This section outlines ‘market superiority’3 approaches to the firm in which the firm is derived from the presence of market failures. It will outline three dominant approaches, each of which has inspired a large literature. Section 2.3.1 will discuss the contributions of Ronald Coase and Oliver Williamson, loosely termed the ‘Transaction Costs’ approach4. Section 2.3.2 will focus on the work of Harold Demsetz and Armen Alchian, who expanded the market superiority approach further. Section 2.3.3 will discuss the evolutionary approach, associated with Nelson and Winters.
2.3.1. Coase and Williamson: Transaction Costs
In 1937 Ronald Coase sought to develop a theory of the firm that was ‘not only realistic in that it corresponds to what is meant by a firm in the real world, but is tractable by two of the most powerful instruments of economic analysis developed by Marshall, the idea
3. The phrase is borrowed from Pitelis and Teece (2009)
4. Also often referred to as ‘managerial theories of the firm’.

Chapter 2: The Abstract Firm 38
of the margin and that of substitution, together giving the idea of substitution at the margin’ (Coase 1937, pp. 386-387). He began his analysis with the observation that the coordinating mechanism at work in the ‘economic system as it is normally treated by the
economist’5 ‘does not apply’ in the firm, where a hierarchy takes precedence over the price system:
‘A firm, therefore, consists of the system of relationships which comes into existence when the direction of resources is dependent on the entrepreneur.’
(Coase 1937, p.393)
According to Coase the entrepreneur is always calculating the costs of ‘exchange transactions’ and asking whether they are greater when conducted within the boundaries of his firm, or according to the market mechanism. Firms exist when the entrepreneur concludes that he can manage transactions more cheaply within the structure of a firm than in the open market. Size then becomes a function of entrepreneurial ability and limits to size subject to ‘diminishing returns to management’:
‘Other things being equal, therefore, a firm will tend to be larger:
a. the less the costs of organising and the slower these costs rise with an increase in the transactions organised.
b. the less likely the entrepreneur is to make mistakes and the smaller the increase in mistakes with an increase in the transactions organised.
c. the greater the lowering (or the less the rise) in the supply price of factors of production to firms of larger size.’
(Coase 1937, p. 397)
Despite claims to realism Coase’s firm is confined to a world defined by its degree of deviation from a perfect neo-classical representation of an abstract economy. Coase’s firm exists as a response to market failure and, like Marshall’s representative firm, it must
5. The ‘economic system’ he referred to was that ‘given by Sir Arthur Salter’.

Chapter 2: The Abstract Firm 39
be subject to the rules that govern economic agents in a neoclassical model, albeit with the possibility that some assumptions are relaxed. Coase pointed to uncertainty, as developed by Frank Knight, as the most prominent market failure. Coase’s most important disciple was Oliver Williamson who sought to explain economic organization using the transaction as his unit of analysis. Williamson built on Coase by exploring the relationship between the characteristics of assets and economic transactions:
‘Although Coase was intrigued with the possibility that the characteristics of assets played a crucial role in the choice of firm or market and in the design of long term contracts, he decided against making this his central feature’.
(Williamson and Winter 1991, p. 6).
Williamson’s analysis was based on three building blocks (each a form of market failure):
A. Humans are opportunistic,
B. Humans are subject to bounded rationality,
C. Certain assets gain their value from combination with other assets. On their own they are worth less. Williamson termed this ‘asset specificity’.
All three give rise to transaction costs, and provide for the possibility that hierarchies are a superior organisational form to the price mechanism. Firms are the archetypal hierarchy and, as a coalition of economic agents bound together by a nexus of contracts, they provide the means to minimise transaction costs. This becomes the raison d’être of the firm, and, for Williamson, most if not all phenomena can be explained with reference to the costs involved in managing the use of assets. For example, the financing structure of a company will be a function of the assets jointly owned by the firm’s owners:
‘If a firm’s assets are plastic and costly to monitor, moral hazard costs arise with debt... Once indebted the equity holders do not bear the full downside losses on projects. Their incentive is to
Chapter 2: The Abstract Firm 40
increase risk taking, because the bondholders will bear part of the risks of the downside losses, but the equity holders get all the gains’.
(Alchian and Woodward 1987, p. 124)
This provides an example of some of the difficulties posed by market failure explanations of the firm. It is undoubtedly true that phenomena such as asset specificity, plasticity and moral hazard must be considered if contracts are to be of any use. Much is to be gained from doing so. However, as will be discussed in Chapter 3 there are other factors that might influence a firm’s debt to equity ratio. Moreover, the ability of a firm to finance an investment on the back of an existing revenue flow from a different bundle of assets may also have an influence. The problem for Williamson is that these other factors also need to be explained within the confines of the model, which can prove problematic if they themselves are developed from assumptions excluded from the model.
Market superiority firms operate in a ‘specialised exchange economy’, in which the act of exchange according to price signals is emphasised. Production is reduced to the outcome of the exchange of assets and forms of knowledge subject to market failure type constraints. Production of goods and services for sale is relevant in as much as exchange transactions embodied in the production process have costs. Size is also determined from within the model. Like Marshall Coase found a way - diminishing returns to management - to play down the impact of internal economies in economic affairs. Ultimately, the firm’s size depends on the physical assets held by the firm and the associated transactions and their costs. Its survival is predicated on the ability of its management to find efficient solutions to the problems of governance of these same transaction costs. This provides a role for management and human agency. Failure to maintain revenues above costs (which may or may not prove to be a function of managerial incompetence) will reveal an alternative form of organisation to be superior.
2.3.2. Alchian, Demsetz and the Importance of Teamwork
Like Williamson, Harold Demsetz agreed with Coase that the relaxation of central neo-classical assumptions is an important contribution to the development of a theory of the

Chapter 2: The Abstract Firm 41
firm, specifically assumptions of perfect knowledge, competent management and functioning markets. However, he took issue with Coase’s opposition between market and firm, arguing that Coase’s non-firm is not neo-classical economics’ non-firm. Coase had implied that firms would only exist in the presence of positive transaction costs. If they were zero then there would only be single person firms responding to price signals to allocate resources for production. Specialisation would reign supreme, and there would be no need for management coordination. According to Demsetz, in the neo-classical system firms and markets do exist along side zero transaction costs:
‘What parades as perfect competition is a model that has much to say about the price system, but little to say about competition or the organisation of firms... what is modelled is not competition but extreme decentralisation.’
(Williamson and Winter 1991, p. 160)
Instead firms and markets complement each other: markets are a space for the exchange of goods produced by firms. If the costs of operating within the price system were to rise the tendency would be toward self-sufficiency, rather than the establishment of firms: production for oneself, rather than for exchange. Demsetz uses this argument to extend the role of management in the presence of an extra class of imperfect information:
“The firm’ in the theory of price is simply a rhetorical devise adopted to facilitate discussion of the price system... The real tasks of management, to devise or discover markets, products and production techniques, and actively to manage the actions of employees, have no place in the perfect decentralisation model because it assumes that all products, markets, production techniques, and prices are fully known at zero cost’.
(Williamson and Winter 1991, p. 161)
Moreover, according to Demsetz, managers’ maximising decisions are not costless, as assumed by Coase and Williamson and the resources required to make such decisions cannot be treated as ‘not scarce’.

Chapter 2: The Abstract Firm 42
Demsetz, along with Armen Alchian (1972) argued instead that the firm is actually the market by another name. To downplay the distinction they suggested firms should actually be referred to as ‘economic organisations’. In certain conditions resource owners are able to increase productivity ‘through cooperative specialisation’: that is they come together to work as ‘teams’. Team members relate to each other through contracts, which, bundled together become the firm. A specialist takes responsibility for ‘monitoring’ team members to guard against shirking. He receives the ‘residual rewards’ in return. To emphasise the absence of power in the system Alchian and Demsetz stated that any other member of the team able to realise the role more capably or at lower cost can usurp the incumbent residual claimant. Alternative structures - the limited liability company, for example - may appear different, however, all are essentially solutions to the shirking problem. Stephen Cheung took this approach to its logical extreme, arguing that the entire economy is in fact a nexus of contracts (Cheung 1970, 1983).
Jensen and Meckling (1976) picked up on Alchian and Demsetz, suggesting that their approach only applied to ‘team based technology’ . They instead introduced principle - agent relations as the most important concept with which to understand the firm. In a partial response Demsetz (1997) whilst agreeing that the emphasis on agency is useful argued that it cannot be the whole story. Agency considerations provide justification for the consideration of management, but so does imperfect knowledge of prices, technology and other phenomena. Managers are required to make decisions to guide the firm in uncertain waters (‘what product should they produce, at what scale and scope, what about marketing and investment?’) However, market failures can still exist and provide a challenge for management in a one person firm or a firm devoid of opportunists6.
Alchian and Demsetz’s approach to the market-superiority firm is a powerful one, but one so firmly rooted in the neo-classical model as to almost deny the existence of the firm. However, in extending the role of management beyond the control of costs and opportunistic behaviour to include more general strategic decisions taken in a world in
6. Demsetz offers an aircraft company as an example. Imagine a aircraft construction company with
accumulated specialist knowledge and the means to expand. It would cost less to move into aircraft
maintenance than transportation, as it would have to acquire unfamiliar knowledge at extra cost. The problem
of which direction to take would still exist in the absence of principle - agent relations.

Chapter 2: The Abstract Firm 43
which prices are not necessarily known, they allow for a more realistic treatment of management. Whereas for Coase and, to a degree Williamson, the firm tended to be a means to overcome market failure, and so bring about a more pareto optimum outcome than would otherwise exist, Alchian and Demsetz suggest that even purely rational residual claimants might make the wrong strategic decisions, leading to sub-optimal outcomes.
2.3.3. Evolutionary Theories of the Firm7
The economic implications of non-optimising firms are most thoroughly explored in evolutionary theories of the firm, which are concerned with explaining how the market ‘selects’8 against some firms, even though no firms necessarily correspond to the pareto optimal ideal. An early proponent of the idea was, again, Armen Alchian (1950) who argued that at any one time firms in existence were those who were in some way consistent with the ‘environment’9:
‘Success (survival) accompanies relative superiority; and, second, it does not require proper motivation but may rather be the result
7. There is something of a debate as to Marshall’s thinking on the role of evolution in economic affairs. See,
for example, (Moss 1990), (Thomas 1991) and (Hart 2003).
8. Using the concept of evolution to explain economic phenomena has proved controversial. An early debate
between Alchian and Penrose (1952) concerned the validity of substituting the ‘market’ for the natural
environment on the grounds that humans, unlike animals and plants, can and do influence their environment
in their favour.
9. Clément Levallois argues that Alchian’s argument was primarily a statistical one. He simply used evolution
as a metaphor to facilitate his argument:
‘Alchian’s handling of the marginal controversy was but one instance of his attempts to reconcile the existing
analytical framework of economics with relevant aspects of economic reality, through the use of statistical
arguments. Once this has been recognised, it is realised that Alchian’s solution to the controversy was chiefly
a statistical one, and secondarily an evolutionary one. The main support to our claim is that Alchian used not
one but two overlapping analogies in his paper, one of which concerned statistical mechanics. The overlap, it
is argued, explains why Alchian’s economic natural selection lent itself so easily both to the advocates of
maximisation and to evolutionary economists.’
(Levallois 2009)

Chapter 2: The Abstract Firm 44
of fortuitous circumstances. Among all competitors, those whose particular conditions happen to be the most appropriate of those offered to the economic system for testing and adoption will be selected as survivors’.
(Alchian 1950, p. 213)
Despite the influence of Alchian’s theory it was, as Cyert and March argue, ‘a defence of orthodoxy’ (Cyert and March 1963, p. 13):
‘...since in the long run firms will survive only if they (by whatever process) make the deviations dictated by economic theory, the theory will predict the behaviour of viable firms. Since only the fittest survive, we need only a theory of fit.’
(Cyert and March 1963, p. 15)
Cyert and March considered their behavioural approach an alternative to the neo-classical mainstream. They argued that firms might be selected against not only because of unfavourable winds, but because the interaction of people (even under contract) within a firm might bring about suboptimal outcomes. They developed a model of the firm that derives a firm’s problem solving ability from its operational procedures and routines, which in turn are embedded in the firm’s ‘interorganisational division of labour and assignments of decision entitlements’ (Dosi and Marengo 2007). In this way the price, output and resource allocation decisions (the primary concern of the study) made by a firm do not necessarily correspond to those of a rational profit maximising entrepreneur of pure neo-classical theory. Cyert and March, like later behavioural theorists, argue that once allowances are made for the real workings of economic organisations then it can be seen that firms as economic units do not behave as they are expected to in a neat neo-classical model. This in turn provides an explanation for the prevalence of disequilibrium in the real world.
Similarly Sydney Nelson and Richard Winters (Nelson and Winter 1982) argue that the orthodox firm sidesteps issues such as the problems of economic organization and the retention of knowledge and falsely assumes ‘fully cooperative relations between diverse

Chapter 2: The Abstract Firm 45
economic interests’ (Williamson and Winter 1993)10. Instead they regard ‘... the understanding of the ongoing, inter-related processes of change in technology and organisations as the central intellectual problem to be confronted by a theory of the firm’ (Williamson 1988, p. 187). The theoretical building block is firms’ ‘routines’, which are the outcome of interaction between people in the firm and over time and became an integral part of a firm. Their emdededness means they are difficult to change, and as a result they might prove incompatible with the changing environment or inferior to competitors’ and so affect a firm’s position in the market. The inability of economic organisations to respond promptly and costlessly to external stimuli also suggests a degree of path dependence in an economy11 and provides the basis for the argument that the establishment of free market institutions will not necessarily lead to the desired results.
Despite its claims the evolutionary theory of the firm can be understood as one more elaboration of the market superiority firm, although omitting less of reality than some of the alternatives discussed above. Indeed Nelson and Winters themselves claim the ‘evolutionary scheme subsumes the orthodox one and delineates its proper uses’ (Nelson and Winter 1982, p. 73). Whilst introducing routines as a new variable with which to understand the operation and survival of firms in an economy Nelson and Winters acknowledge that other factors may play a role in determining a firm’s response to adversity. However, instead of pursuing these and the implications, both for their own theory and for neo-classical theory they ignore them:
‘In reality, a great many factors are involved in determining the consequences of sustained adversity - for example, the degree of owner versus management control, merger opportunities, tax and bankruptcy law considerations, the liquidity or liquidity of a firm’s assets, and the state of a firm’s balance sheet when adversity began. It is beyond the scope of our present discussion to sort out these factors and relate them to the likely persistence
10. And (Williamson and Winter 1993, p. 187) for a more recent critique by Winter’s of the ‘textbook firm’.
11. See, for example, (Nelson 2008)

Chapter 2: The Abstract Firm 46
or change in routines. One point perhaps is worth noting here: a firm without a viable routine is a firm without a viable truce in intraorganisational conflict. That consideration, by itself, affords abundant reason to doubt that firms behave in adversity ‘as if’ they were under the rational control of a single actor.’
(Nelson and Winter 1982, p. 122)
Whereas Marshall’s representative firm was a means to ensure the existence of equilibrium, the market superiority approaches described in this section are derived from the existence of market failure, and as an explanation of the sub-optimal distribution of resources in a market economy. Firm behaviour and economic dynamics become the outcome of a more nuanced understanding of human agency (bounded rationality, imperfect information and opportunism, for example), and sluggish responses to market signals are accounted for. Although the internal workings of the firm are examined, and, particularly in evolutionary models, the findings submitted as an explanation of the differences between firms, the economic functions of firms remain the same: to use and allocate resources efficiently. (Relative) success is a function of a firm’s ability to maintain revenues above costs for an indeterminate period of time. Failure equates to the inability of managers to respond effectively to the challenges proposed by the approach in question. As Nelson and winters hint other factors might come into play, but these are ‘beyond the scope of the discussion’. However, as will be argued below, and in the following chapter such factors cannot simply be ignored.
2.4. Capabilities Approach
One approach that refuses to limit itself to the confines of a model is the ‘resource based view’ (RBV). Originating in the work of Edith Penrose (Penrose 1959) the RBV spawned a large and diverse literature. Penrose’s ‘resources’ have now been joined by ‘capabilities’12 and ‘dynamic capabilities’13. The literature has also generated a large
12. See, (Teece et al. 1997b), (Teece and Pisano 1994), (Grant 1991),
13. Unless otherwise stated the term ‘resource based view’ will refer to all variants of the approach for the
remainder of this chapter.

Chapter 2: The Abstract Firm 47
strategic management literature14. The RBV provides an explanation for how and why firms grow, and has fuelled a wide literature on ‘learning’, which in turn provides a convincing explanation of how economies are able to develop over time. William Lazonick, for example, drew heavily on the approach to argue for the decline and fall of industries and economies15 and to argue for the importance of the firm as a learning institution in capitalist development16.
The resource based approach to the firm, defines firms as administrators of ‘bundles of resources’. Assets bundled together provide greater scope than they would individually. However, less tangible assets such as technological know-how or organizational capabilities can now be considered. By focussing on capabilities, which are as much a ‘social’ as a physical asset, the approach pulls back from an analysis of firms in terms of what they produce, emphasising instead how they produce things. Firms can, therefore, gain competitive advantage in different product markets requiring similar capabilities, and are not constrained by the limits to one industry:
‘...with a different concept of the firm one can recognise that a ‘firm’, when appropriate resources are available, can produce anything for which a demand can be found or created, and it becomes a matter of taste or convenience whether one speaks of the ‘market’ or of the resources of the firm itself as the consideration limiting its expansion’.
(Penrose 1959, p.13)
Penrose herself sought to develop a theory built on empirical observation, recognising that:
‘In the literature of economics the firm of the real world has long lived in that uncomfortable no-man’s-land between the high and
14. See, for example, (Barney 1986; Grant 1991; Barney 1995, 2001; Pitellis and Teece 2009).
15. See (Lazonick 1983; Lazonick and Elbaum 1986)
16. See (Lazonick 2002, 2004)

Chapter 2: The Abstract Firm 48
dry plateaus of ‘pure theory’ and the tangled forests of ‘empiric-realistic’ research’.
(Penrose 1995, p.9)
She famously stated that ‘...we shall not be involved in any quarrel with the theory of the ‘firm’ as part of the theory of price and production, so long as it cultivates its garden and we cultivate ours’, citing Hicks’ proposition that to dislodge the firm from its key position in economic theory would ‘involve the wreckage’ of ‘the greater part of equilibrium theory’. She argued that for the sake of equilibrium theorists of the firm had
required ‘there be something to prevent the indefinite expansion of output’17. Penrose and later theorists undermined the edifices of ‘equilibrium theory’, placing the firm and the results of its actions at the centre of the story:
‘The very nature of the economy is to some extent defined in terms of the kind of firms that compose it, their size, the way in which they are established and grow, their methods of doing business, and the relationships between them’.
(Penrose 1959, p. 9)
The neo-classical approach to addressing the question of the firm is challenged in other ways:
‘That a firm has boundaries follows from the nature of the categories we think in, however, not because we can clearly observe them in reality. The boundary of the firm is what distinguishes it from the market and therefore must ‘exist’ whether or not it is ‘real’ since the firm/ market dichotomy has been perhaps the major building block of an economist’s analytical thinking’.
(Penrose 1959, p. xvi)
17. She included Kalecki’s ‘increasing risk’ as a type of uncertainty.

Chapter 2: The Abstract Firm 49
In challenging the opposition between market and firm RBV theorists developed
explanations for cooperation between firms, rather than pure competition18.
Penrose also took issue with the standard view of firm financing. The RBV assumes firms are committed to profit maximisation (albeit over the long term). However, the assumption of profit maximisation does not follow from a standard maximisation function, rather from the proposition that firms prefer to fund investments and so expansion with retained incomes, a cheaper source of funds, as ‘managers [have] no desire to pay out to shareholders’:
‘If profits are a condition of successful growth, but profits are sought primarily for the sake of the firm, that is to reinvest in the firm rather than to reimburse owners for the use of their capital, or their ‘risk bearing’, then, from the point of view of investment policy, growth and profits become equivalent as the criteria for the selection of investment programmes. Firms will never invest in expansion for the sake of growth if the return on the investment is negative, for that would be self defeating. Firms will never invest outside of the firm except eventually to increase the funds available for the investment in the firm. To increase total long-run profits of the enterprise in the sense discussed here is therefore equivalent to increasing the long run rate of growth. Hence, it does not matter whether we speak of ‘growth’ or ‘profits’ as the goal of a firm’s investment activities.’
(Penrose 1959, p.30)
Penrose went a long way to developing an alternative approach to the theory of the firm. Her followers were able to develop explanations for firm boundaries, existence and
18. See (Best 1990), (Foss 1997).

Chapter 2: The Abstract Firm 50
internal organisation that did not take market failure as their starting point19. Unlike alternative approaches the resource based approach is, on the whole, not explicitly constrained by the parameters of the model it inhabits. As Penrose makes clear firms can and do exploit economies of scale and scope, large firms have the advantage over small firms and diversification serves a purpose. However, there is little suggestion that scale might have implications for the economy at large. In this sense it conforms to Marshall’s own view that ‘the history of the individual firm cannot be made into the history of an industry any more than the history of an individual can be made into the history of mankind’ (Marshall 1997, p. 275). The RBV shares other similarities with Marshall and the approaches discussed above. Despite the possibilities for scale and heterogeneity all firms have the same ‘economic function’, which is:
‘...assumed simply to be that of acquiring and organizing human and other resources in order profitably to supply goods and services to the market.’
(Penrose 1959, p.xi)
Growth and development is assumed to be a function of entrepreneurial success:
‘Enterprise or Entrepreneurship as it is sometimes called, is a slippery concept, not easy to work into formal economic analysis, because it is so closely associated with the temperament or personal qualities of individuals. This extremely personal aspect of the growth of individual firms has undoubtedly been one of the obstacles in the way of the development of a general theory of the growth of firms’’.
(Penrose 1995, p. 2)
Firms fail when they cannot sustain profitability, and maintain revenues above costs. Firms of all sizes in all industries are in the same circumstances. As success is related to
19. See (Barney 1996; Barney and Arikan 2001; Barney et al. 2001), (Teece and Pisano 1994; Teece 1996;
Teece et al. 1997a, a; Loasby 1998; Pitelis 1998; Loasby 2000; Pitelis 2000; Lockett and Thompson 2001;
Winter 2003)

Chapter 2: The Abstract Firm 51
entrepreneurial ability and access to funds is downplayed as a determinant of survival success and entrepreneurial ability have a linear relationship.
The potentially close relationship between the RBV and more mainstream approaches is demonstrated by a number of Penrose’s followers, particularly when applying the approach in more macro studies20. There have also been a number of attempts to consummate the relationship. Montgomery (1995), for example, examines similarities and differences between the evolutionary and capabilities approaches. Pitelis and Teece (2009), is the most far reaching and demonstrates the persistence of the relationship between the neo-classical model and the theory of the firm. Christos Pitelis and David Teece argue that ‘Market-failure - Firm Superiority-based theories of the firm’ fail to ‘explain why firms exist from the situation of ‘no-firms at all’ and fail to ‘capture the role of the firm as a market creator and co-creator, and not just a protector/guardian of value already existing.’ In the absence of markets for ‘know-how’ entrepreneurs in possession of a good idea might instead establish a firm to develop a product and extract maximum value from it. Pitelis and Teece attempt to integrate the essential elements of dominant theories of the firm into one:
‘[the objective, nature and essence of the firm] is to reduce the diagnosis, configuration and leveraging of knowledge assets and organisational capabilities to allow the principals of these organisations to effectuate the capturing of value (profit) from both the creative and routine operations of the business enterprise. While the superiority of organization (the firm) in this context can be partly explicated in terms of its transaction-cost reducing properties, the advantages of organization (over the market) go well beyond savings in transaction costs. They include combining co-specialized assets and capturing value from intangible assets where business models that involve pure market transactions (e.g. licensing) simply won’t work because of the absence of properly functioning markets... ‘the need to
20. See (Montgomery 1995) for a brief discussion. Also see (Barney 1986) and (Best 1990).

Chapter 2: The Abstract Firm 52
orchestrate co-specialised and complementary assets could be seen as a raison d’être and the genesis of the firm, not only because of market failure, but also because the very creation of a credible player (firm) with a chance to realise its objectives by shaping, extending and especially creating markets, presupposes the co-assembly of co-specialised and complementary assets, capabilities and skills.’
(Pitelis and Teece 2009, p.23)
In a similar fashion to the approaches outlined in Section 2.3 Pitelis and Teece look to subsume the dominant aspects of established theories into their own. They accept the market failure based arguments, but claim they do not go far enough. Missing markets are not simply a market failure. They are the ‘raison d’être’ of the firm and the source of value for firms. Nevertheless, the RBV continues to implicitly assume that differences between firms lie in their ability to take advantage of or create market opportunities; and that firms can otherwise be regarded as homogenous, at least when they are considered as abstract economic entities.
2.5. Conclusions
This chapter has outlined two prominent approaches to the firm that have emerged since Marshall developed the concept of the ‘representative firm’. ‘Market-superiority’ approaches are explicitly neo-classical in nature, and although a number of concessions are made to reality, the overall effect is to flesh out the representative firm. Like Marshall, theorists shy away from structural phenomena that, although observable, if included in a general theory of the firm would undermine the logical structure of an economic model with equilibrium as its foundational principle. They do not, for example, challenge assumptions of constant returns to scale and the neutrality of finance. Instead the approaches imply that if a new technology, management technique or managerial talent could overcome or alleviate the market failures that form the basis of the approach in question then the economy would tend closer to its pareto optimal equilibrium. This has very specific policy implications, which will be explored in later chapters. The

Chapter 2: The Abstract Firm 53
second set of approaches is based on the ‘resource based view’ originating in the 1950s and the work of Edith Penrose. Penrose explicitly rejected some of the foundational assumptions of the neo-classical model, and, in emphasising the act of production rather than exchange and introducing the concept of ‘resources’, gave life to a large and vigorous programme of study. However, it is the purpose of this thesis to argue that the theory of the firm should consider a number of alternative factors if the firm and its role in economic affairs are to be properly understood. Whilst the RBV goes some way in this regard, notably in incorporating economies of scale and scope, recent attempts at a synthesis of approaches suggest it too is being used to shed light on the representative firm.
It is the contention of this thesis that the predominant theories of the firm can only make a limited contribution to theories of financial development, as they are essentially Marshallian in nature, or rooted in theories of market failure. The implication is that policies that promote financial deepening - the increased provision of financial instruments and the alleviation of market failure in the finance sector - will affect the firm sector only in as much as all firms will find it easier to perform, and those who had somehow been protected by such market failure would face more accurate price signals. This, it will be argued, is in contrast to post-Keynesian theories of the firm that suggest that there are fundamental differences between firms in terms of their ability to access finance and manage liquidity, and that these differences will affect a firm’s chances of survival and ability to make desired investments. Whilst this approach does not preclude the approaches discussed in this chapter it suggests that some firms will be more able than others to take advantage of opportunities as well as withstand shocks to their primary activities. As such the composition of the firm sector will go some way to determine the impact of financial reform.
3.

Chapter 3: The Balance Sheet Firm
3.1. Introduction
This chapter will develop an approach to the financial behaviour of firms that will then be used in subsequent chapters to analyse the dynamics of the relationship between individual firms and the enterprise sector as a whole during periods of financial development. The approach developed makes use of Hyman Minsky’s ‘balance sheet’ approach, which is used to organise insights from the work of Michal Kalecki, Josef Steindl and other economists working in the post-Keynesian tradition. Post-Keynesian approaches tend to emphasise mark-up pricing, the prevalence of oligopoly in capitalist economies, and fundamental uncertainty as a determinant of firm strategies with regard to the future. With reference to the work of Kalecki, Steindl and Minsky it is argued that firms differ in terms of sources of investment finance and the means by which firms manage liquidity and engage in asset markets over the course of the business cycle. Michal Kalecki and Josef Steindl in both their theoretical and empirical analysis point to substantial differences between ‘small’ firms and ‘large’ firms, and also between firms that have secured a monopolistic or oligopolistic position and more ‘marginal’ firms that have less power to set prices. Although Steindl and Kalecki are chiefly concerned with firms in mature capitalist economies this chapter argues that their insights can also be applied to firms in less developed economies in an effort to determine how firms might behave in the absence of certain financial institutions and as the finance sector develops.
This chapter will first briefly discuss post-Keynesian approaches to the firm, before introducing the work of Kalecki and Steindl. As both argue the firm’s balance sheet evolves over the course of the business cycle, both in response to changing asset and other prices and also to the firm’s operations in asset markets, the chapter will then introduce Minsky’s ‘balance sheet firm’ as a lens through which to organise Steindl’s and Kalecki’s insights. The chapter concludes by arguing that the departures from the Marshallian firm - in particular the rejection of there being a democracy of entrepreneurship, and the importance of the critical relationship between the firm and the finance sector - can prove a useful analytical starting point for our understanding of the

Chapter 3: The Balance Sheet Firm 55
development and behaviour of the enterprise sector in a developing economy at various stages of financial development.
3.2. Post-Keynesian Firm
This section will briefly discuss the ‘post-Keynesian’ approach to the firm. It will provide the basis of a more detailed discussion of the balance sheet firm, an approach that will be derived from the work of Minsky, Steindl and Kalecki. The difference between the two will lie in the emphasis the latter gives to the ability of the firm to manage its liquidity to ensure survival.
Post-Keynesian approaches to the firm tend to emphasise fundamental uncertainty21, the prevalence of oligopolistic competition in most capitalist economies, and the tendency for prices to reflect a mark-up over the costs firms face. Hall and Hitch, in a seminal 1939 paper, reporting the results of interviews with the managers of thirty eight firms (Hitch 1939) demonstrated that firms did not operate according to neo-classical principles (either consciously or unconsciously). Instead, they concluded, that the vast majority of business men, ‘when quoting prices, did not think explicitly in terms of marginal revenues and costs, and that a general method of pricing was to add a margin as for net profit to average short term costs’ (Andrews 1951). One of their more significant contributions was that cost plus pricing was not simply the preserve of large, monopolistic firms but the majority of firms. PWS Andrews conducted a number of similar empirical studies of business across the United Kingdom. He too found that business men made no explicit reference to marginalist economics. Although he accepted this did not necessarily imply the rejection of the doctrine, he found that as his studies progressed ‘this way of thinking became progressively less tolerable’ (Andrews, 1951).
Whilst post-Keynesian firms are assumed to have some power over the prices they set, their long term survival is thought to depend on its ability to control its environment. ‘For any organisation, as for any organism, the goal or the objective that has any a natural assumption of preeminence is the organisation’s survival’ (Galbraith 1972). In an uncertain world the post-Keynesian firm seeks power ‘over its suppliers of materials,
21. See, for example, Lavoie (1992), Davidson (1994, 1996) and Dunn (2008), particularly Chapter 10.

Chapter 3: The Balance Sheet Firm 56
over its customers, over the government, over the kind of technology to be put in use’ (Lavoie 1992). Power stems from size, and size from the rate of growth. The objective, therefore, is to maximise the rate of growth, which, ironically, given the criticism of neo-classical approaches, requires maximising profits. However, this does not necessarily correspond to the neo-classical notion of maximising short run profits (Kregel 1990).
One determinant of a firm’s ability to survive unwelcome and unforeseen shocks is the degree to which it is financially dependent on other economic actors. This need not be a concern to firms operating in a world of certainty. ‘In such a world, for instance, firms always have access to all of the financial capital that they require provided their investment project is expected to be profitable. The source of financing is immaterial’ (Lavoie 1992, p. 99-100). For the entrepreneur envisaged in much post-Keynesian analysis, on the other hand, external finance is complementary to retained earnings, not a substitute for it. ‘Organisations can safeguard their financial independence either by generating themselves the funds which are necessary for their expansion projects, or by staying within the borrowing norms that are set by the system’ (Lavoie 1992, p. 103). In this the post-Keynesian firm resembles the Penrosian firm described in Chapter 1, and similarly Sweezy and Baran’s corporation which also aims at and ‘normally achieves’ financial independence through the internal generation of funds (Sweezy and Baran 1967).
Nevertheless, whilst power and financial independence are objectives for most if not all capitalist firms neither is always attainable. This gives rise to the distinction between firms that have achieved some pre-eminence and smaller, less powerful firms. A number of theorists argue that economics should incorporate such fundamental differences between firms, and model the impact of larger, more powerful firms differently. Albert Eichner, for example, posited that as modern capitalist economies are dominated by large corporations or ‘megacorps’, so economic models should be built with the megacorp as a fundamental unit (Kregel 1990, Shapiro 1990, Eichner 2008). Unlike the neo-classical firm the megacorp is a large, diversified corporation run by salaried professional managers, with a skilled workforce at their command. It’s objective is long term

Chapter 3: The Balance Sheet Firm 57
expansion. As expansion and obtaining market share depended on investment, megacorps set the mark up over costs such that it provides the firm with the funds required for planned investment. One implication of the megacorp’s pursuit of profits is the important role of corporate saving in the economy, which is at least as significant as household saving. In this vein Eichner sought to marry his megacorp with Kaleckian macro economic models in which investment drove savings (Deprez 1991). For Eichner megacorps set prices to generate profits to finance investments. (Kregel 1990). Assuming that oligopolistic sectors dominate the economy, and smaller firms are less able to impose a mark-up over costs due to a lack of market power, then if households do not save, savings is an outcome of the population of megacorps’ decision to invest.
In this thesis the distinction between large and small firms and their economic contribution is crucial, as is the notion, pursued in later chapters, that the level of investment of large firms has a bearing on the level of profits and so savings in an economy. However, this thesis will not specifically adopt Eichner’s megacorp as a means to explore financial development in less developed countries as its distinguishing feature is the sophistication of its management and workforce. Instead, this thesis will build on the work of Michal Kalecki and Josef Steindl, who also emphasise firm size as a determinant of economic behaviour.
3.3. Using Kalecki and Steindl
Like Eichner, Sweezy and Baran and Galbraith, Michal Kalecki and Josef Steindl put large firms centre stage. Kalecki dismisses ‘diseconomies of large scale’ as a limit to the size of the firm as it is ‘rather unrealistic. It has no technological basis because, although every plant has an optimum size, it is still possible to have two, three, or more plants.’ (Kalecki 1971a, p. 105). He accepts that the size of the market can limit the size of the firm, ‘but it leaves unexplained the existence of large and small firms in the same industry’.
Kalecki distinguishes between firms in two main ways. First, in terms of the type of industry they inhabit, and second, in terms of access to finance. Whether a firm inhabits a ‘competitive’ or ‘oligopolistic industry’ determines the sort of pricing policy open to it:

Chapter 3: The Balance Sheet Firm 58
mark-up pricing or demand determined pricing. The policy adopted is a function of the good or service produced, its price elasticity of demand and of market institutions. The ability to mark up prices enables a firm to generate and sustain retained earnings. Again, Kalecki’s view of pricing finds much empirical support from other post-Keynesian studies22. This in turn determines a firm’s access to external finance as well as the size of investment it can undertake. Here, building on the work of Marek Breit, Kalecki introduced the concept of ‘increasing risk’, in which the greater the ratio between debt and equity the greater the risk of a firm’s insolvency, and the more expensive is external credit (Toporowski 2005b). Large firms can both access more credit and make larger and less risky investments:
‘A firm with large a entrepreneurial capital could obtain funds for a
large investment whereas a firm with small entrepreneurial capital could
not. Differences in the position of firms arising out of differences in
their entrepreneurial capital are further enhanced by the fact that firms
below a certain size have no access whatever to the capital market’.
(Kalecki 1971, p. 106)
Expansion is therefore dependent on ‘the accumulation of capital out of current profits’. Firms can then make new investments without ‘encountering the obstacles of the limited capital market or ‘increasing risk” (ibid. p. 107). Savings from current profits can be directly invested in the business and make possible larger loans. The amount of a firm’s entrepreneurial capital will determine the ‘amount of rentier capital’ the firm can access in the capital market:
‘The limitation of the size of the firm by the availability of
entrepreneurial capital goes to the very heart of the capitalist system.
Many economists assume, at least in their abstract theories, a state of
business democracy where anybody endowed with entrepreneurial
capital can obtain capital for starting a business venture. This picture of
the activities of the ‘pure’ entrepreneur is, to put it mildly, unrealistic.
22. See Lavoie (1992) for a discussion of the difference between ‘mark-up’ pricing and ‘full-cost’ or ‘target-
return’ pricing.

Chapter 3: The Balance Sheet Firm 59
The most important prerequisite for becoming an entrepreneur is the
ownership of capital.’
(Kalecki 1971, p. 109)
Josef Steindl develops Kalecki’s ideas in Small and big business: Economic problems of the size of firms (Steindl 1945). In a critique of Marshall’s representative firm Steindl argues that firms need not be restricted by the size of a single industry and that large firms have an inherent advantage over smaller firms. Steindl takes issue with Marshall’s assertion that because ‘the rise from unpropertied worker to small entrepreneur and from then to big entrepreneur is possible’ and ‘ability always finds capital [and] inability loses it’ that there will be a ‘broad movement from below upwards’ (Steindl 1945, p. 9).
Steindl tests Marshall’s propositions in a statistical analysis of the US economy. He finds little to support Marshall: the ‘rate of growth of corporate enterprises will have to be several thousand fold to reach the size of large firms’ (Steindl, 1945, p. 36). This takes time and the ‘high death rate’ makes it unlikely. He also finds in favour of the impact of the principle of ‘increasing risk’ on the growth of firms. Inadequate net worth among small firms, a costly long term credit market and so reliance on short term credit, coupled with the finding that large firms have less difficulty accessing all forms of credit are sufficient for Steindl to proclaim there is no evidence for a ‘broad movement upward’. He had come to a similar conclusion in a statistical analysis of the Austrian economy in the 1930s where he found that small firms struggled to grow beyond a certain size (Steindl 1965).
In this respect Kalecki and Steindl differ from some other post-Keynesians, who essentially see both large and small firms in the same light, although the latter may yet lack the ‘control over future events, its financial requirements, the quality of its labour force, the prices of the industry and the possibility of takeovers (Lavoie 1992). Steindl also emphasises the importance of sufficient entrepreneurial capital and the ability to manage shocks to both the ability to survive and to reach large size (Steindl 1945).
Steindl argued that large firms come into existence either as newly formed joint-stock companies or through merger. The former ‘presupposes’ wealthy entrepreneurs and the latter, whilst an observable fact, includes takeovers, often themselves an expression of

Chapter 3: The Balance Sheet Firm 60
oligopolistic power. PWS Andrews made a similar observation, arguing that most new entrants to specific industries were from ‘other lines of industry’, rather than ‘brand new businesses undertaken with all the uncertainties involved’ (Andrews 1951, p.141). The high turnover of small firms and the large capital required to establish large firms led to Steindl to the conclusion that there is an ‘elastic supply of small entrepreneurs’ and a small and ‘inelastic supply of large entrepreneurs’. Contradicting Marshall and in the spirit of Kalecki large entrepreneurs must be backed by capital. Moreover:
‘If certain economies are available for a certain size of plant then only
those firms that are big enough to afford the capital investment can
make use of these economies; any smaller sized firms - size of a firm is
measured in terms of capital here - will not be able to do so. On the
other hand, if there are economies open to small plants - and a technical
development may sometimes favour small scale equipment - then any
bigger firm may make use of them just as well as a small firm, because
there is nothing to prevent it from investing in a number of smaller
plants. From this asymmetry it follows that small firms can never (in the
long run) earn higher profit rates than big firms - because all technical
advantages which are open to them are open also to big firms; whereas
big firms may earn higher rates of profits than small firms because some
advantages open to them are not open to small firms.’
(Steindl 1945, p. 10)
Steindl does, however, suggest ways in which larger firms can lose their advantage. Large firms might suffer ‘from the existence of imperfect competition (Steindl 1945, p. 11), particularly if the firm has to extend its market in one and the same industry. The way out is to extend into ‘new lines’, however this carries initial costs. A large firm might seek a lower rate of profit because it chooses to do so by the ‘exchange of greater safety against a higher profit rate’ by reducing ‘the proportion of borrowed capital’:
‘The greater safety for bigger firms will, however, mean that the
frequency and extent of their losses will be reduced, and that on the average they will be more successful than the smaller ones.’
(Steindl 1945, p. 11)

Chapter 3: The Balance Sheet Firm 61
If, on the other hand, there are differential lines open to different ‘size classes’ of entrepreneurs and large entrepreneurs ‘are restricted in number’ then ‘a hierarchy of profit rates will be established, with a smooth increase of profit rates as size of the enterprise, measured in capital, increases’ (Steindl 1945, p. 12). Lines with the ‘greatest scale economies available’ will offer entrepreneurs capable of exploiting them a ‘more than ‘normal’ profit’.
Confined only to the small scale lines allowed them small entrepreneurs operate in a very different world. Given the restrictions on access to finance, the importance of maintaining a relatively liquid position and the elastic supply of entrepreneurs threatening entry forcing profits down Steindl is led to the following conclusion:
‘...the small entrepreneur by the very nature of his position conforms to
a gambler; that is he is taking rather high risks for a low expectation of
profit.… He is, however, willing to bear this risk at a very low
remuneration. This is due to the fact that small entrepreneurs are
desperately trying to maintain themselves in their social status, rather
than become employees (to become rentiers is no practical alternative
for them, because their capital is too small for this purpose).’
(Steindl 1945, p. 31)
Steindl even goes so far as to ask ‘what factors make for the continued existence of small firms?’. He cites four reasons. First, the gradual emergence of large entrepreneurs (‘big scale entrepreneurial capital does not spring from the ground’). Second, and in an interesting twist on the creation myth of the neo-classical firm, is the presence of imperfect competition and imperfection in the labour markets. These can include ‘rational factors’ such as transport costs ‘which can hardly be eliminated’, and the ‘irrational factors’:
‘...there may be an individuality of product to which consumers really
attach a significance... the differentiation of the product and attachment
of customers to particular firms may simply be due to irrational factors;
that is force of habit, ignorance of relevant facts, or laziness. The
irrational facts are probably the most important; they account for a

Chapter 3: The Balance Sheet Firm 62
considerable cost to society without offering any advantage (gardening
tools can be standardised without harm to individualists).
(Steindl 1945, p. 59)
Third is the ‘gambling attitude of small entrepreneurs’, and fourth is the state of competition in the industry, which will be discussed below.
Presciently Steindl also discusses the ‘vertical disintegration of certain processes, parts of which can be performed on a small scale’. Again Steindl takes issue with Marshall who claimed the process would provide further opportunities to small firms. Instead small firms, ‘being numerous and small partners in a bargain with a few big firms, are economically quite weak and their independence is largely fictitious’. Steindl concludes that at worst small firms are a ‘waste’ of energy and resources. In another nod to Marshall’s discussion of business groups and the modern literature on industrial agglomeration small firms should seek to eliminate the disadvantages of small scale by ‘some kind of cooperation’.
Steindl (1975) discussed the dynamics of competition in a capitalist system. He argued that the rate of internal accumulation, available productive capacity, the utilisation of that capacity and the rate of growth of the industry relative to the rate of growth of internal accumulation are the crucial variables that explain competitive firm behaviour. He identified four ‘phases’ of competition:
A. If an industry is expanding rapidly marginal firms make little or no profit,
small firms can enter relatively easily and ‘progressive’ firms can expand
without taking market share from marginal firms.
B. If the expansion of the intra-marginal firm (or the progressive firm) is to
exceed the rate of growth of industrial demand then the intra-marginal firm
must make ‘extra sales effort’ to gain market share. Rising costs will reduce
profits, but intra-marginal firms will ‘maintain a differential advantage’. This
‘moderate competitive pressure’ will lead to the relative concentration of the
industry as the marginal firms are squeezed.
C. If the accumulation of large firms surpasses the rate of expansion of the
industry by enough to require diminished absolute size for marginal firms

Chapter 3: The Balance Sheet Firm 63
then large firms’ sales efforts will be so intense smaller firms will lose sales.
In response firms are forced to cut prices or increase costs by engaging in
quality competition or intensive advertising. The highest cost firms are
ultimately eliminated, leading to a state of ‘absolute concentration’.
D. The onset of oligopoly. Competitive pressures and internal accumulation
interact to regulate the level of excess capacity in the industry.
(Steindl, 1975, p. 87)
Although, as Steindl himself, admitted ‘maturity’ did not lead inexorably to ‘stagnation’, his account of competition reinforces the distinction between large and small firms, as well as suggesting firms capable of product or process innovations have both a competitive edge and a greater chance of survival. In the event of falling demand firms are forced to find ways to expand sales to ensure their capacity is utilised, so as to keep average costs down, and to ensure they have sufficient cash flow to cover capital costs. This reveals the level of demand and costs to be the main drivers of competitive behaviour. It also suggests that ‘competition depends on sales effort, rather than the number of firms in the market’:
‘The key question is not what firms do, or what they are forced to do,
competing with each other in a state of relatively constant overall
market demand, but what firms do in response to changes in their
demand, or sales of their respective output’.
(Toporowski 2005, p. 94)
For Steindl large scale economies grant firms an advantage:
‘They are basic, because without them firms would hardly grow to the
size at which they are able to exercise monopoly power, by becoming
‘price leaders’, combining with others in the formation of a cartel, or by
amalgamation’.
(Steindl 1945, p. 21)
Size, or more importantly, access to (preferably internal) finance enables firms to invest in advertising, product differentiation and innovation; all of which should enable it to take more of a share of a diminishing market. This suggests that firms continue to

Chapter 3: The Balance Sheet Firm 64
compete in oligopolistic markets. It also suggests that technical change is an important factor. Steindl identified ‘progressive firms’ (which need not be the largest firms) able to lower costs, increase profit margins and so increase the rate of internal accumulation. Technological investments are also a way for firms to diversify into other markets. However, diversification is a sometimes confused strand running through Steindl’s work. One of Steindl’s critiques of Marshall is the identification of firms with single industries. Firms can instead seek out ‘new lines’ to sidestep the restrictions of falling demand for their products. Steindl argues that this might be difficult because ‘entering a new industry will involve the acquisition of an entirely new market and goodwill, of new experience and new organization. All this is more difficult than expanding an existing business within an industry (Steindl 1975, p. 68). In Steindl (1975) Steindl begins with by assuming that firms operate in single industries. He then relaxes the assumption:
‘The conclusion is that the actual or potential flow of newly formed
funds between industries will indeed do something to limit the
inequality of profit rates between industries; but it will fulfil this
function only slightly.’
(Steindl 1975, p. 68)
In the introduction to the second edition of the book (Steindl 1975) Steindl corrects himself, arguing that one reason the post war economy did not stagnate was firms’ ability to diversify their activities:
‘There are still other elements in the postwar situation that are new. The
big corporations generally have spread their activities to several lines
each. Impediments against the flow of funds between industries would
therefore play no role today. This again favours investment...’
(Steindl 1975, p. xii)
and a few pages later:
‘Oligopolistic firms, in recent years, have had more and more recourse
to other forms of competition:… new products enable firms to transcend
the given market and find the open field for expansion which they are

Chapter 3: The Balance Sheet Firm 65
seeking... Direct investments abroad may again offer an escape from the
narrow oligopolistic situation.’
(Steindl 1975, p. xiv)
This suggests that firms can further mitigate against increased pressure on sales in a given industry by developing the capacity to expand into ‘new lines’.
The work of Kalecki and Steindl leads Toporowski (1993) to argue that different ‘categories’ of firms play differing roles in the economy. Small and medium sized enterprises and households tend to account for the majority of employment. ‘However, the dynamics of an economy, i.e., economic growth and inflation, are determined broadly by the scale of investment undertaken by corporations, which account for the vast majority of investment in an economy’ (Toporowski 2009). Toporowski further distinguishes between capital intensive firms with high price elasticity of demand (Category I) and less capital intensive firms facing inelastic prices (Category II) (Toporowski 2005a). The former, mostly operating in primary and large scale industries tend to expand output rather than increase prices in response to rising demand; whilst the latter raise prices. This is chiefly a consequence of available under-utilised capacity and the need for Category I firms to lower average costs with increased production.
Steindl, Kalecki, Toporowski, like Eichner, emphasise the differences between
large firms and small firms and their impacts on the wider economy. In summary
large firms with access to greater 'entrepreneurial capital' have improved access to
capital markets and bank loans. They are therefore better able to take advantage of
large scale investment opportunities and benefit from economies of scale. The
possession of entrepreneurial capital and the ability to diversify into new lines
also provides large firms with a greater chance of survival in the face of shocks to
their primary markets. As a lack of entrepreneurial capital is assumed to limit the
rate of growth, access to funds and the chances of survival Steindl and Kalecki
argue that large firms are more likely to be born from existing firms or large
concentrations of entrepreneurial capital rather than be the outcome of long term

Chapter 3: The Balance Sheet Firm 66
growth.
The following section will introduce Hyman Minsky’s balance sheet approach to the firm, a useful tool to examine firms’ interaction with the finance sector, and their response to changes in demand.
3.4. Minsky’s Balance Sheet Firm
Hyman Minsky’s account of the importance of balance sheet management provides the framework to best understand the ways in which firms manage cash flow in response to changing circumstances. In his PhD thesis Minsky dismissed profit maximisation as the ‘unique behavioural principle’, and argued that ‘the problem of the financing technique to be used by the firm [or] the problem of balance sheet structure’ was of similar significance (Toporowski 2008). Later Minsky placed ‘the problem of balance sheet structure’ at the centre of his analysis.
Minsky’s primary concern was to explain the source of economic instability. Balance sheets are ‘both a resumé of past economic activity and a reflection of current decisions’, and a ‘statement of [an economic unit’s] assets and liabilities, of its ownership interest in and claims upon other economic units and of other economic units’s ownership interest in and claims upon it’. Financial assets originate as liabilities and so represent ‘past behaviour’, and debt contracts ‘result in a division or partitioning of the risk and uncertainty inherent in any economic activity. The alternative financial techniques by which a unit can acquire control over real assets are significant determinants of how uncertainty is partitioned’ (Minsky 1964, p. 185). Business firms have to decide how to finance investments. They (and households) evaluate possible (un)favourable outcomes and want to protect against them. So ‘in making its decision the economic unit combines its evaluations of the situations, its own attitude toward uncertainty and the price at which it would acquire protection against the unfavourable and its share of favourable outcomes.’ (Minsky 1964, p. 186) An economic unit’s asset and liability structures reflect these choices.
Firms issue debt and liabilities (which households own) in order to acquire control over real and financial assets necessary to carry out activities. Debt is for the risk averse (as

Chapter 3: The Balance Sheet Firm 67
they will always receive payment) and equity is for the risk takers. ‘Corporation finance and private portfolio management are the two anchors for the behaviour of the financial system’. Financial institutions - defined as ‘business organisations whose assets are almost all ‘intangible assets’ - stand between the business firm and the households. They generate liabilities acceptable to the risk averse and purchase liabilities from unsteady firms:
‘The study of finance is the behaviour of economic units when confronted with specified types of uncertainty, and financial institutions and usages are ways in which the uncertainty borne by a unit can be adjusted to the unit preferences’
(Minsky 1964, p. 188)
Minsky defines assets as tangible or real (residential and non-residential structures, land, producers’ durables, and inventories) and intangible or financial (debts and equities). Debts are a commitment to make payments at specified date, at the initiative of the holder of debt or contingent on some future eventuality.
In order to manage its commitments a firm must ensure that it has sufficient money to ‘meet its obligations at the time they are due’. In his analysis of ‘money flows’ Minsky identified three ‘transaction types’, each associated with three ‘accounts’: the balance sheet account, the income account and the portfolio account.
Financial and physical assets are an economic unit’s ‘portfolio’. Economic units are the beneficiaries of commitments of other units on these assets. Financial and tangible assets can be exchanged for money and money for assets. Transactions that involve financial and tangible assets are called portfolio transactions. During a period of growth there are portfolio transactions in existing and new assets. ‘Surplus or portfolio changing units’ acquire financial liabilities from deficit units. As a result two things happen: the ‘value of equity assets changes to reflect expectations that growth will continue’, and ‘deficit units have to finance an increasing portion of their activity by debt instruments acceptable to financial intermediaries’.

Chapter 3: The Balance Sheet Firm 68
A firm’s income account corresponds to receipts from the sale of goods and services, payments on wages and salaries, gross investments and tax payments. For most firms money flows primarily stem from current income producing activities (the sale of goods and services). Economic units receive money as a result of their ‘participation of current income’ (Minsky 1964, 250), and money flows out as purchases of goods and services.
Money inflows on the ‘balance sheet account’ are, for Minsky, ‘not significant for business firms apart from trade credit’. Outgoings correspond to interest and principle paid on debts and dividends on equities. The ability to pay in turn depends on final demand for a firms products. Finally the ‘portfolio account’ corresponds to ‘receipts from bank borrowings and the sale of securities to other units and government securities’.
Minsky used balance sheets to explain how an economic unit could find itself in ‘a situation where it does not have sufficient money on hand to fulfil its currently due commitments and there is no good prospect that it will be able to fulfil its commitments in the near future’ (Minsky 1964, p. 252). He argued the ‘path to financial distress related to the profit and loss statement of an economic unit’ (Minsky 1964, p. 254). A distressed firm’s hope for survival depended on its ability to ‘engage in portfolio transactions’: issue liabilities or dispose of assets. ‘Both have limits; either the acceptability of its liabilities decreases or it runs out of assets’. Minsky identified one exception: a firm ‘investing in the future’ may have expected future earning power sufficient ensure the continued acceptability of its liabilities.
3.5. Kalecki and Steindl as Minsky’s Balance Sheet Firm
Minsky’s distinction between a firm’s income account, balance sheet account and portfolio account provides a useful lens with which to analyse firm differences and the influence of the finance sector on firm behaviour.
Minsky himself was concerned to explain how firms might become distressed in the event of a fall in demand (a reduction in money flows to the income account) and also how the changing values of a firm’s assets and liabilities could both impact on its own

Chapter 3: The Balance Sheet Firm 69
chances of survival and on the stability of the economy at large23. Firms are forced to respond to changes in demand for their output by running down reserves, issuing liabilities and managing or restructuring their portfolio account.
Minsky (1964) spells out the impact of a boom on the balance sheets of households and business firms. A boom driven by increased business and household investment depends on the creation of new money ‘or the substitution of debts (and possibly equities) for money (velocity changes)’. As a result businesses will have a higher proportion of debt to income, and so interest rates will rise. Business firms will be committing a higher proportion of their incomes to servicing their increasing liabilities. Increases in the prices of financial and real estate assets will provide firms with capital gains and the ability to support more debt. In the event of a downturn the value of equity and real estate can fall, ‘wiping out the protection of the lender’. Portfolio transactions will also increase relative to income and balance sheet flows. ‘So systematic changes to the financial structure take place during a sustained boom. Balance sheet money flows increase relative to income. The value of equity and real estate assets rise relative to current income imputed to them, money flows on portfolio account increase relative to money flows on balance sheet and income account, and transaction velocity increases relative to income velocity’ (Minsky 1964).
Minsky distinguished between firms in terms of their vulnerability to falling asset prices and their ability to fulfil financial commitments in the event of reduced cash flows. Firms with a larger debt component in their balance sheets and so a smaller ratio of net worth to total debt will be more likely to face financial distress. This is analogous to Kalecki’s concept of increasing risk. If the market value of assets decline, depending on whether they are forced or required to sell, units will have a realised or unrealised capital loss. A loss in net worth will impact on a firm’s ability to borrow. A forced sale will lower the price of the asset. If a number of units are in the same position then there will be a exaggerated impact on the price of the class of assets sold. The ability to sell and the price received will also depend on the assets are ‘special rather than general purpose’24.
23. See Minsky (1992)
24. This has interesting echoes of Williamson’s accept specificity.

Chapter 3: The Balance Sheet Firm 70
The balance sheet approach provides an opportunity to elaborate the work of Kalecki and Steindl. Both argued financial assets are an alternative to fixed investments (whose attractiveness will wax and wane with the business cycle) as well as a form of indemnity in the event of a fall in demand for goods and services produced (Steindl 1945 and Kalecki 1971).
For Kalecki large size gives firms the opportunity to make large investments and so accumulate large amounts of entrepreneurial capital and to access, if required, larger loans on more favourable terms. However, firms will tend to limit the use of the capital market because ‘of the increasing risk involved in expansion’ (Kalecki 1971, p. 106). The more a firm borrows the greater the danger of insolvency in the event of failure. Large firms with more retained earnings than they care to invest in fixed assets, or who wish to hedge against failure might instead invest a proportion in securities meaning that in the event of failure they will still be able to draw some income (Kalecki 1971). As small firms suffer from inadequate internal reserves they must maintain a selection of liquid assets as security or expose themselves to the possibility of insolvency. Kalecki argued that firms that did attempt to access proportionately large amounts of external capital would struggle. Those, for example, floating a bond issue ‘which was too large in terms of its entrepreneurial capital’, would find it undersubscribed. Raising the interest rate paid would only cause investors to doubt the firm’s solvency (Kalecki 1971, p. 106). Smaller firms attempting to undertake projects with high costs of production and distribution are ‘driven to supplement their own capital by extensive short term borrowing at unfavourable terms’.
Steindl (1945) analyses the impact of holding financial assets on the rate of profit on equity. Steindl utilises the gross and net gearing ratios. The latter being the proportion of business capital to equity. The former being the proportion of total assets to equity. Steindl shows four things. First, that with high gearing ratios firms will make more spectacular losses in the event of failure. Second, both the gross and net gearing ratios decrease with size. Third, larger companies are more likely to invest in interest bearing securities, further offsetting any risk they bear. Fourth,

Chapter 3: The Balance Sheet Firm 71
‘The consequences of a high gearing ratio for small firms are reinforced
by two further factors: the smaller firms often rent buildings etc. (which
would normally be owned by big ones), which means nothing else but a
borrowing of these capital items in natura. The rent provides a fixed
charge, like interest, with similar effects on the risk. More important, the
relatively greater indebtedness of the small firms takes for the most part
the form of short-term debt. This makes the risk even greater (if no
renewal of credit is obtained the firm will have to engage in forced
selling).
(Steindl 1945, p. 45)
Large firms will therefore receive part of their income in dividends, that will be only a part of a company’s total profit. As a result ‘very big companies have greater stability from a large income from dividends which is, however, lower than the profit rate in a successful company, especially in times of good business’ (Steindl 1945, p. 47).
In Minsky’s terminology large firms will expand their portfolio account, enabling firms to mitigate against losses in the event of a downturn. Firms can also either tap income from financial investments (interest or dividends), or they can restructure their portfolio accounts and balance sheet accounts to manage the effects of a fall in revenues in the income account. Although Minsky himself did not explicitly distinguish between firms by size the observations of Kalecki and Steindl indicate that large and small firms will differ in their ability to manage their portfolio and balance sheet accounts. Smaller firms are limited in their ability to manage cash flow; having to rely on the sales of their goods and services (Toporowski 2009). Essentially, their operations are confined to the real economy, with little recourse to the financial sector for loans, equity or alternative income generating investments. Large firms, however, can restructure their balance sheets in order to refinance investments, allowing firms to ‘top up the liquidity of reserves’ and ‘readjust the structure of the financial liabilities that corresponds to [their] productive assets’ (Toporowski 2000). By developing their portfolio account they can generate cash flow (from dividends) and manage liquidity (through the sale of assets). Financial assets can play the role of a hedge against a decline in the firm’s position in the

Chapter 3: The Balance Sheet Firm 72
real economy. However, they can also be a straight (and more liquid) alternative to investments in fixed assets. This will be discussed further below.
As we have seen Steindl and Kalecki differentiate firms in more ways than size alone. Pricing policies, price elasticities, technological capabilities and capital intensities, will all to a greater or lesser degree affect a firms ability and need to accumulate internal reserves, access capital markets and manage a fall in demand through changes in output or price. In oligopolistic industries, for example, in contrast to Steindl’s more secure progressive or intra-marginal firms, marginal firms will struggle to respond to falling market share with cost reducing innovations, sales effort or, by venturing into new lines. Such firms will likely have greater need to restructure their balance sheets and access external loans, but will be less able to do so. Large capital intensive firms are those most likely to face higher debt or equity servicing costs (balance sheet account outflows) in a recession, as they tend to make ‘the largest calls on the capital market in a boom’. Toporowski’s ‘Category II’ firms, on the other hand will have fewer commitments (Toporowski 2005a).
All of this suggests that a distinguishing feature of the large firm that emerges from the work of Kalecki, Steindl, Minsky and Toporowski is its greater autonomy as an economic unit in the face of exogenous dynamics. Such firms are able to respond by managing more than their real economy operations.
This then lead to the possibility that investments by large firms in financial assets has a bearing on the level of investment in the economy and the economic stability. Kalecki and Steindl argue firms are more likely to engage in financial market operations at certain points in the business cycle. Along with Minsky they argue that relative returns to investments in the real economy and the finance sector change as the business cycle progresses. Minsky argued that ‘key to the business cycle is a widening gap between capital asset prices and investment output’ (Minsky 1964). For Minsky, as ‘financial constraints are relaxed’ financial innovation takes hold. In a similar vein to Kalecki and Steindl firms develop an increased dependence on outside finance and debt leveraging for investment. As a result cash flow commitments due to debt grow at a faster pace than investment increases productive capacity. This eventually leads to a shift in incomes from

Chapter 3: The Balance Sheet Firm 73
entrepreneurs to rentiers, that in turn leads to a decrease in investment, and so a reduction in profits. Kalecki suggests that as the business cycle approaches its crest firms themselves (and so entrepreneurs) will begin to purchase higher yielding securities. In Minsky’s terminology, firms will begin to grow their portfolio accounts, possibly at the expense of investments in fixed capital assets. They do this because of both changing relative prices, but also the greater availability of financial instruments, that, according to Minsky, inevitably occurs over the course of a boom.
The investments firms make will therefore have an effect on the structure of the economy. Financial assets need not simply be a means to hedge against any uncertainty attached inherent in real world transactions. Instead they can be an end in themselves. The levels of investment in physical assets can directly impact on the profits of other firms. In developed economies reduced investment in physical assets will impact on levels of employment and profits, with implications for the business cycle. In developing countries the impact can be more serious, as scale investments in physical assets are a driver of the industrialisation process. While Kalecki saw such reductions in fixed investments as a cyclical and so temporary phenomenon Steindl, Minsky and Toporowski laid greater emphasis on the transient nature of institutions. Steindl (1975) saw the investment decisions of firms leading to the decline and stagnation of the US economy. The driver was the behaviour of large firms themselves. Minsky, on the other hand, suggested that changes in the finance sector and the relationship between firms and the finance sector could limit the sorts of investments firms might safely make (Minsky 1991). Toporowski pointed to both developments in the finance system and the behaviour of firms; arguing that with financial development large firms could as profitably invest in financial assets as real assets (Toporowski 2010). Both Minsky and Toporowski raise the possibility that fixed asset investments might be a function of financial institutions and their evolution as well as the mix of firms operating in the economy.
This suggests that both economic analysis and policy should consider the economic functions of different firms. It is not enough, as orthodox economics does, to focus on developing ‘market institutions’, with little consideration (beyond competition and anti-trust law) to the mix of firms existing in the economy and the distribution of ‘large

Chapter 3: The Balance Sheet Firm 74
entrepreneurs’. Firms provide significantly different functions, depending on size, industry and capability. Large scale investments are to come from large firms. Smaller firms are more likely to provide the majority of employment. However, the sorts of investments firms make and the impact on factors such as technology acquisition, investment, employment is as much a function of output demand, the development of the finance sector and relative asset prices as it is a managerial solution to a maximisation problem.
3.6. Summary and Conclusion
For post-Keynesians a world of fundamental uncertainty suggests that firms must prepare for the unexpected and the providers of finance must compensate for the possibility of default. The ability to access finance, achieve financial independence and increase the likelihood of survival is therefore associated with larger firms that both possess entrepreneurial capital, can exploit economies of scale and develop diversified portfolios and alternative sources of income. The investment behaviour of large firms is therefore more likely to determine overall levels of investment, savings and the stability of financial markets. The following chapter will argue that these insights, whilst developed from analysis of mature capitalist economies, can also increase our understanding of the relationship between the enterprise sector and the financial sector. In particular without dedicated services for small sized firms financial sector development will have only a limited impact on the ability for smaller firms to grow and survive. Second, in countries in which there are limited concentrations of entrepreneurial capital large firms are unlikely to emerge in any great number from the private sector, nor, in countries with low levels of development will equity markets be sufficient to bring into being large joint-stock companies. Third, firms can be broadly categorised as those that only operate an income account and those that also operate a portfolio account. In developing countries with under developed asset markets - bond, equity or real estate for example, - large firms will have difficulties building a portfolio of sufficiently liquid assets that also provide a return. The argument developed above is that such assets provide firms with the means to withstand shocks to cashflow from their primary activities, either in the form of diversified cashflow or saleable assets. This suggests that firms will refrain from large

Chapter 3: The Balance Sheet Firm 75
capital investments and instead, if they are able to generate savings, diversify their activities. Fourth, firms need not manage their portfolio account solely to manage their liquidity. Instead, they can in the event of asset market inflation, seek speculative returns through their current account. This has implications for economic stability as financial development takes place.
The next chapter will examine the literature of finance and development more closely. It will argue that more orthodox approaches typified by the financial liberalisation hypothesis are ill-equipped to speak to the issues raised by the discussion in this chapter. Instead, post-Keynesian critiques of the financial liberalisation hypothesis will be followed an attempt to marry the balance sheet firm to a simple Kaleckian model.
4.

76
Chapter 4: Financial Development and the Balance Sheet Firm
4.1. Introduction
This chapter will locate the balance sheet firm in the wider financial development literature. Section 1 will discuss the Financial Liberalisation Hypothesis (FLH), associated with Ronald McKinnon and Edward Shaw. According to the FLH the liberalisation of the banking system and financial markets in developing countries will facilitate the better mobilisation and allocation of savings. As less developed countries (LDCs) are assumed to suffer a savings constraint liberalisation should improve a country’s prospects for economic growth. Section 2 will discuss post-Keynesian approaches to financial development. Post-Keynesian thought inverts a number of the propositions underpinning the orthodox theory. Investment leads to savings, rather than the other way round and in theories of endogenous money bank loans become deposits, thus increasing the money supply. As economies develop banks go through a series of stages in which they progress from the role of simple intermediary - collecting and allocating savings - to extenders of credit that need not have an equivalent backing of prior savings. Although not an essential prerequisite for investment savings takes on a crucial role in ‘funding’ investments. Financial intermediaries - bond markets and stock markets in particular - are used to channel savings to firms looking to convert short term bank debt to long term debt in order to reduce their financial commitments, and so vulnerability to unforeseen shocks. The opportunity to fund investments should reduce levels of risk at both the micro and the macro level. As far as it goes this Keynesian refutal of the orthodox position provides a useful basis for the analysis of finance and development. However, as discussed in Chapter 3 Keynesian theory provides further insights into the behaviour of firms with regard to financing and liquidity management, which can provide further insight into the relationship between financial development and economic growth. These are discussed in Section 3. The principle of increasing risk (PIR) suggests that there will be a limit to the amount of finance extended to firms by banks, and the price at which firms can access credit will be a function of banks’ perception of the riskiness of the loan. More concretely, the more ‘entrepreneurial capital’ available the cheaper and larger the available loan. This suggests that the structure of the

Chapter 4: Financial Development and the Balance Sheet Firm 77
firm sector should have a bearing on the levels of lending and depth and level of investment. The balance sheet firm also suggests that in the absence of formal funding opportunities shallow diversification strategies would be more favourable to firms with the means to grow. Post-Keynesian thinking suggests the development of financial markets provides more than one more intermediary between savers and investors. Issues of stock would, for firms, be a means to recapitalise following fixed capital investments, rather than a direct source of finance for investment. In the event of over-inflated markets firms might also be expected to become ‘over capitalised’, and, for a period of time, seek returns managing current assets on their balance sheet. All of this suggests a role for the state in the early stages of economic development. One strategy for LDCs lacking large concentrations of private capital and the financial institutions capable of funding firms is to create state owned enterprises (SOEs). SOEs could then make large investments with by state sanctioned loans. However, they would still face similar issues to private firms and would require the state to determine the degree to which it intervened to manage firm liquidity. In economies in which the state seeks to divest some part of the state owned enterprise sector and grant firms a degree of autonomy the sorts of behaviour anticipated by the balance sheet approach will have potential ramifications for the wider economy.
Section 4 summarises the discussion in a series of ‘propositions’ that will be explored in Chapters 4-6 in a study of Vietnam. Section 5 concludes.
4.2. Financial Liberalisation Hypothesis
In many macroeconomic models the role of financial institutions is neutral25. Banks and other financial institutions are omitted, and instead a direct link between savers and investors is assumed. The supply of savings by households is determined by their inter-temporal preferences, and is inversely related to the interest rate. The demand for investment is a function of the (diminishing) marginal product of capital (MPC). Equilibrium is at the rate of interest at which the supply of savings is equal to its demand, a function of household thrift and productivity. An excess demand for funds will tend to raise the interest rate above the MPC. Conversely, an excess of savings will confront a
25. See for example Woodford (2002).

Chapter 4: Financial Development and the Balance Sheet Firm 78
falling interest rate. An exogenous shock, such as a technological improvement that raises the marginal product of capital, would bring about an increased demand for capital, and so savings. Assuming that consumers’ preferences remain unchanged, an increase in the interest rate will lead to a concomitant decrease in consumption and increase in savings, so providing producers with required funds.
In a liberalised economy with well working financial institutions savings, regulated by the interest rate, will flow freely to investors. At full employment income will be allocated according to marginal returns to factors of production, a function of relative factor scarcities. There are, however, a number of approaches dating to at least Schumpeter (1911) that propose ways in which the financial sector can have real effects. New Keynesian models, for instance, focus on the impact of market failures on the ability of financial intermediaries to properly perform their economic function. The classic example is Stiglitz and Weiss (1981) who argue that the presence of market failures in the financial and banking system could make a policy of financial liberalisation less efficient than one of repression. The prospect of moral hazard or adverse selection might mean higher interest rates attract less efficient investors. Immature banking systems in LDCs might well be particularly prone to market failure, as they lack the expertise to monitor projects. In particular informational asymmetries between lenders on the one hand and borrowers on the other may impact on the real economy. If lenders cannot determine the riskiness of borrowers they will tend to pay a price for securities that represents the average quality of firms or risk of default - a price that is lower than the market price for reliable firms, and higher than for riskier firms. Alternatively firms with riskier projects will be more willing to pay higher rates, and so discourage lending at higher rates. More recent models concerned primarily with developed economies focus on sticky prices, including interest rates, but also assume a neutral, if not absent financial sector (Woodford 2003).
An alternative, but related proposition is that financial repression can lead to sub-optimal outcomes in already savings starved economies. The financial liberalisation hypothesis (FLH), posits that financial liberalisation leads to a more efficient allocation of scarce capital (Goldsmith 1969). The argument was articulated most fully by McKinnon (1973)

Chapter 4: Financial Development and the Balance Sheet Firm 79
and Shaw26 (1973) in two complementary contributions. ‘Less developed countries’ suffered from financial repression, in which state intervention in banking and finance sectors restricted the opportunities for resource starved economic units to make use of financial services. Financial repression refers to interest rate ceilings, high reserve requirements and quantitive restrictions, all of which enable state favoured firms in ‘urban enclaves’ to benefit from privileged access to cheap credit, resulting in an inefficient allocation of savings, low levels of total savings and ‘fragmented’ economies, in which those with resources have no way of channelling funds to those with viable projects but no funding (McKinnon 1973). Small rural firms are confined to small scale, low technology production as they cannot afford to make the relatively large discrete investments in new technologies and infrastructure27. If they save they tend to save inventory or other physical assets. They would be better off, argued McKinnon, if they saved money balances. He therefore proposed the extension of ‘financial institutions’ to rural areas and the setting of (higher) market determined interest rates, which would serve the dual purpose of attracting savings and discouraging the sorts of inefficient investments that typify the urban enclave. Financial liberalisation further increases economic efficiency in a number of ways: households are presented with a wider selection of financial assets and instruments, financial intermediaries can pool savings and package loans in ways more suited to borrowers, and they can monitor the performance of projects, reducing risk for savers and encouraging specialisation.
A number of studies have sought to test the various facets of the FLH. These have examined the relationship between financial deepening and growth, the elasticity of the interest rate with respect to savings and growth, and the claim that firms treat financial and real assets as ‘complementary’.
4.2.1. Financial deepening and Growth
26. Ed Shaw was an advisor the the Korean government as they underwent financial reform in the 1970s
(Woo 1991).
27. McKinnon’s example was a green revolution; a liberal financial sector would enable farmers to save in
order to purchase new seed varieties or technology.

Chapter 4: Financial Development and the Balance Sheet Firm 80
Such studies tend to find a strong correlation between economic growth and financial development, measured using a proxy or proxies for financial deepening. In a cross country study of 35 countries Goldsmith (1969) found countries that experienced rapid growth tended also to have above average rates of financial development (measured as bank assets to GDP). King and Levine (1993b) analysed 80 countries between 1960 and 1989 and again found economic growth was positively correlated with financial development. They also found that levels of financial development were a predictor of subsequent rates of growth, physical capital accumulation and economic progress, concluding that ‘finance seems importantly to lead economic growth’. Cooley and Smith (1991) found that financial markets promoted specialization and technological innovation. Benhabib and Spiegel (2000) pointed to the relationship between financial development and capital accumulation and productivity growth. Focussing exclusively on dominant manufacturing sectors Rajan and Zingales (1998) find that ‘financial development has a substantial supportive influence on the rate of economic growth and this works, at least partly, by reducing the cost of external finance to financially dependent firms’. Whilst accepting the correlation between financial development and GDP growth a number of studies view financial development as an outcome of the development process, rather than a driver. Robinson (1952), for example, argued that at high rates of economic growth there is a greater demand for new and more sophisticated financial instruments.
Arestis and Demetririades (1996) questioned King and Levine’s claim that finance led growth, arguing that King and Levine’s findings were not as strong as they claimed. They and Demetririades and Hussein (1996) showed that the relationship between financial development and growth is more nuanced and depends on the sorts of financial institutions and policies in place in individual countries.
Manning (2003) re-examines studies that find a relationship between economic growth and financial development, and concludes that the findings are not as robust as claimed. He suggests further that growth can just as easily be correlated with political, legal and institutional factors, particularly in Asian countries where country studies point to the importance of non-financial factors in periods of rapid growth. Similarly, Arestis and

Chapter 4: Financial Development and the Balance Sheet Firm 81
Demetriades (1999) argue that much of the FLH literature ignores or downplays the importance of institutions such as the legal system (for establishing and enforcing contracts and property rights), the state’s role in inspiring ‘confidence in money’s capacity to retain value’, banking supervision, central banks and stock markets. Whilst cross country studies can provide evidence at a general level variations can often be explained by reference to dynamics in individual countries.
4.2.2. The elasticity of the interest rate with respect to savings, investment
and growth
The key claim of McKinnon and Shaw is that financial repression corresponds to a low (relative to equilibrium) real rate of interest (which could be negative) which discourages saving. Higher interest rates, an outcome of liberalisation would encourage units to save by placing money balances in financial institutions. There is substantial evidence money balances and physical assets are complementary28, however other posited relationships are more problematic.
A number of studies have tested the elasticity of the interest rate with respect to either savings, investment or growth, and whether higher interest rates have a positive effect on saving. Modigliani (1986) found there was a relationship between the saving ratio and the interest rate. Fry (1988), in an influential study, also found a relationship. However, this was then questioned by Giovanni (1983) and Gupta (1987), who pointed to regional variations in his results. Fry himself later admitted that ‘if an effect exists at all it is relatively small’ (quoted in Arestis and Demetriades (1997)). The relationship between the interest rate and saving has also been questioned in a number of further studies. Gupta (1987) studied 22 Asian and Latin American countries, and found little to support the relationship, concluding that the most important determinant of savings is income. In a study of Asian countries Giovannini (1983) also found little evidence that higher interest rates called forth higher savings. The World Bank (1989) made similar findings, as did Nissanke in a study of Africa (1990), and De Mel and Tybout (1986) in Uruguay.
28. See Ajewole (1989), Thornton (1990), Khan & Hasan (1998) and more recently Odhiambo (2004) in
Kenya.

Chapter 4: Financial Development and the Balance Sheet Firm 82
Warman and Thirlwall (1994) studied the relationship in Mexico between 1960 and 1990. Whilst higher interest rates were correlated with increased financial saving, savings also grew in periods of negative interest rates. Significantly financial saving was most closely correlated with income, and increases in financial saving did not necessarily imply an increase in total saving. Moreover, an increase in the level of financial savings also might not necessarily lead to increased efficiency (Warman and Thirwell 1994). At lower levels of development alternative modes of saving such as curb markets, or non-money assets such as gold or other non-financial assets may be more efficient. Asking whether financial saving was more efficient bought no firm conclusion: ‘financial saving may remain in the financial sector for speculation purposes and not lead to more productive investment’ (ibid.).
A further criticism is that the FLH ignores the impact of short run capital flows and the spectre of speculation (Arestis 2006). The FLH, at least in its earlier incarnations, tended to assume a closed economy and did not consider the impact of a higher interest rate on foreign capital inflows, which in many countries has proved destabilising (Arestis 2006, Bhaduri 2004). Foreign capital inflows can also lead to stock market expansion, which ‘erodes policy autonomy, and, in the case of a fixed exchange rate policy, it forces monetary authorities to maintain high interest rates to sustain investor confidence and greed’ (Arestis 2006, p. 360). Financial liberalisation may also lead to ‘high risk speculative transactions in the economy and to the increased vulnerability to financial crises’ (Ibid., p.359).
4.3. A post-Keynesian Alternative
New Keynesian and FLH approaches continue to maintain that it is savings that drives the accumulation process, so economic policy should be concerned primarily with maximising the availability of prior savings and ensuring its efficient distribution. The firm appears as the agent in informational principle agent problems, where the market failure is located in the capacity of the banking sector to properly assess the credit-worthiness of borrowers, as a rent seeking member of the urban enclave or as an isolated and small rural firm. Firms are a passive partner in their relationship with the financial

Chapter 4: Financial Development and the Balance Sheet Firm 83
sector. In the absence of serious market failure and in the presence of fully liberalised financial markets the Modigliani-Miller proposition that the financial structure of the firm has no impact on the value or operating decisions is assumed to hold (Modigliani and M. Miller 1958).
The most fundamental critique of the FLH is to be found in the Keynesian and Kaleckian conception of the monetary production economy. The FLH rests on the principle that investment is dependent on ‘prior-saving’, hence the emphasis on attracting savings to the banking system. Schumpeter had long taken issue with the notion that banks simply advanced accumulated savings to finance starved firms, and believed that such a view would be consigned to history:
‘[for a] typical economist, writing around 1900… credit is quite
independent of the existence or non-existence of banks and can be
understood without any reference to them. . . . The public is . . . the true
lender. Bankers are nothing but its agents, middlemen who do the actual
lending on behalf of the public and whose existence is a mere matter of
division of labor. . . . They add nothing to the existing mass of liquid
means, though they make it to do more work.’
(Schumpeter 1954, p.1113)
For Schumpeter in an economy at full capacity banks advanced credit to entrepreneurs who were then able to afford and recombine resources to create innovate products or processes that reconfigured the structure of the economy (Schumpeter 1954).
In Keynesian and Kaleckian models it is investment that leads to saving. Kalecki, manipulating national accounts identities, demonstrates that assuming that households don’t save, wages finance consumption and firm savings are equal to profits. Using the Keynesian savings identity:
(1) S = I + (G-T) + (X-M)
And, distinguishing capitalist (SC) and workers saving (SW), capitalists’ saving is as follows:
(2) SC = I + (G-T) + (X-M) - SW

Chapter 4: Financial Development and the Balance Sheet Firm 84
Profits must equal capitalist saving and consumption (CC) so,
(3) P = SC + CC = I + (G-T) + (X-M) + CC - SW
Capitalists can only determine their levels of consumption and investment, not profits. Therefore, capitalists’ consumption and investment define profits. It is the decision of firms to invest that leads to the accumulation of savings.
Moreover, the distribution of profits among firms will influence the levels of investment by firms and sectors (to the degree that sector characteristics or distribution of firms within a sector determines the level of profits). Firms that command high profits and so can accumulate savings have access to a higher level of both savings and borrowed funds, assuming as will be discussed below that the possession of collateral influences access to credit.
4.3.1. Banks
The decision of capitalists to consume some portion of profits (and workers save, if the assumption is dropped) means firms must turn to bank credit to finance at least some portion of investment. Banks are therefore in a position to put a halt to any expansion in demand (Sawyer 2006). The ‘amount of credit and money follows the demand for credit’, and any economic expansion can be aborted by banks refusing to either provide loans, or raising the price of loans (Sawyer 2006, p. 172)29.
The degree to which banks actually create money is a contentious one. Among post-Keynesians there are a number of different approaches, ranging from those who understand the supply of money to be infinitely elastic with respect to the Central Bank discount rate (Moore 1988), and those who see the banks and other factors as setting a limit on the supply of credit (Arestis and Howells 1996). Empirical studies suggest that the degree of endogeneity is closely related to the level of development of the banking sector (see below) and a country’s financial institutions.
29. Kalecki, therefore, is consistent with theories of endogenous money in arguing that it is loans that
determine deposits (Sawyer 2006).

Chapter 4: Financial Development and the Balance Sheet Firm 85
The ability to finance and fund investments and the direction of causality between savings and investment is determined by the level of development of the finance sector. Two prominent descriptions of the development of the finance and banking sector are provided by Lance Taylor and Victoria Chick. Lance Taylor developed his own ‘stages’ account of the development of finance in developing countries. For Taylor Stage 1 corresponds to an economic structure dominated by bank lending. Private businesses and households borrow from banks, but not from abroad. There are no equity or bond markets to speak of, so private and commercial bank bond holdings are zero. The government’s total borrowing is from the central bank, whose only other asset is foreign reserves. The money supply is the sole liability of the banking system, and the only monetary instrument is the requirement that commercial banks hold reserves against deposits. The only other bank asset is outstanding credit or loans (Ocampo et al 2009). Stage 2 is the development of government or central bank bonds. Stage 3 is the ability of private actors to access external (hard currency) finance. Stage 4 finance features the development of stock markets.
Victoria Chick proposed a ‘stages of banking approach’ (Chick 1992). In the first stage geographically isolated banks operate as ‘conduits’ between savers and investors. Deposits are savings, whose supply stems ‘from an increased supply of high powered money not wanted to be held in cash or from a change in the public’s cash/ deposit preferences as confidence in the banks grew’. An extension of lending ‘would entail a substantial loss of reserves even to the system as a whole’ (Chick 1992). In the second stage banks have won the public’s confidence and branching and consolidated clearing arrangements mean fewer deposits are lost after loan expansion and deposits are now a convenient means of payment. Using deposits for all transactions means they now represent ‘all income whether destined for consumption or saving’. Stage 2 also holds the potential for the savings/ investment causality to be reversed, as banks can lend beyond the level of savings in the economy. At this point loans create deposits. In Stage 3 interbank lending mechanisms are further developed. Stage 4 sees the central bank accept full responsibility for the stability of the banking system, and by operating as the lender of last resort embolden banks further. Stage 5 sees banks develop liability management.

Chapter 4: Financial Development and the Balance Sheet Firm 86
Dow and Ghosh (2008) apply Chick’s stages approach to former Soviet bloc countries. Critiquing banking reforms in sixteen countries they argue that reformers ahistoricism and their inability to take into account the ‘peculiarities of the soviet system’ hampered the successful working of the system. One major problem was the difficulties many countries had in building and maintaining confidence in the banking system. Without such confidence it is difficult to reach Stage 4, or even Stage 3. Dow et al. suggest that there are a further four phases prior to Chick’s Stage 1. Phase 1 is the period under central planning, in which there is a separation of corporate and retail banking. Phase 2 is the beginning of transition, characterised by hyperinflation and a complete loss of confidence in banks. The ‘monetary overhang’ generated under central planning is ‘translated into hyperinflation’, wiping out the purchasing power of bank deposits and eroding the public’s trust in the banking sector’. Households turn to foreign currency and other assets to hold savings, and hold cash money for transactions. The demand for cash money increases following the expansion of the retail trade sector and wholesale markets. Supplies of cash money created by the Central Bank circulate outside of the banking sector. Non-cash money accumulates in the banking sector ‘and a complete collapse of trust in banks meant that achieving immediate convertibility between cash money and non-cash money could only come at the cost of a an undesirably high rate of inflation’. As a result of difficulties attracting cash bank credits shrink affecting the liquidity of the system and a payments crisis in the enterprise sector. As a result enterprises start to use monetary surrogates.
Phases 3 and 4 are essentially the stages banks should pass through to in order to establish a modern banking system. In Phase 3 ‘a sound national currency must be established, usually through currency reform and the maintenance of moderate inflation. Modernisation of the payments system should follow suit, starting from the corporate banking system’. The purpose is to increase confidence in bank liabilities as a safe and liquid asset and to attract households’ cash holdings. Phase 4 sees the maintenance of national currency and the extension of payments systems reforms to the retail banking sector. There will be an increase in deposit based transactions and banks’ ability to create credit. Phase 5 corresponds with Chick’s Phase 2, and ‘[b]ank liabilities will be accepted
Chapter 4: Financial Development and the Balance Sheet Firm 87
as fully-fledged money by both the corporate sector and the household sector. Banks will now be able to create credit endogenously’.
4.3.2. Funding and Financing
Both accounts of the ‘stages’ of financial development suggest that the understanding the relationship between firm financing and investment in a developing country requires a close analysis of the institutional development of the finance and banking sector. They also have implications for the ability off firms to ‘fund’ investments, a concept first discussed by Keynes (1937):
‘The entrepreneur when he decides to invest has to be satisfied on two
points: firstly, that he can obtain sufficient short term finance during the
period of producing the investment; and secondly, that he can eventually
fund his short-term obligations by a long-term issue on satisfactory
conditions.’
(Keynes 1937, p. 217)
Banks finance investments by advancing credit to firms. Firms then seek to fund their liquidity requirements in asset markets. Savings is a crucial requirement for the latter, rather than the former (Studart 1995). Credit expansion is then a function of the demand for finance, the willingness of banks to lend, and any exogenous constraints (by the central bank or government) on bank lending, and savings is primarily dependent on the level of income. All this assumes that the banking sector has reached Stage 2. There can only be a ‘financial constraint’ if, for some reason, banks refuse to advance firms credit (Davidson, 1986, p. 101). Nevertheless, bank financed investment and growth can lead to increased financial fragility and instability (Studart 1995), particularly as firms holding short term debt in need of refinancing will be dependent on future conditions of credit. Minsky’s financial instability hypothesis and distinction between hedged, speculative and ponzi firms provides useful insights into the financial positions of firms (Minsky 1992).
Although limited savings need not constrain expansion its availability still plays a vital role in funding investments, and so managing borrowers’ and lenders’ risk and tempering unwelcome tendencies to financial instability. Financial markets thus play a crucial role

Chapter 4: Financial Development and the Balance Sheet Firm 88
as the loci of funding, and providing information for firms issuing securities, underwriters and those wishing to purchase securities (Studart 1995). In less developed financial systems with smaller and thinner asset markets firms become reliant on bank loans for their liquidity needs, however, loans themselves are more likely to be short term, as banks are reluctant to take on the risks of long term investments (Studart 1995). Such a situation can lead to financial instability, as firms become excessively leveraged and vulnerable to interest rate fluctuations, as well as shocks to other sources of income.
4.3.3. Capital Market Inflation and Overcapitalisation
Stock markets provide firms with the opportunity to both access long term finance and the opportunity to fund existing investments. This enables firms to reduce their reliance on bank debt for both finance and funding, and, in principle, facilitate larger investments at lower risk. However, the concept of ‘funding’ investments implies firms’ interaction with asset markets is directly related to real economy operations. Firms ‘only issue capital up to the point where the return from their commercial and industrial activities would exceed the cost of financing that capital’(Toporowski 2008). However, in practice firms issue capital beyond this point and invest the excess capital in liquid rather than fixed assets. Toporowski (2008) defines this ‘excess capital’ as the excess of a company’s liabilities over its productive capital, i.e., the plant, equipment, materials, and stocks of unsold products and semi-fabricates that a firm holds’. ‘If the return from these assets is less than is necessary to pay the cost of the excess capital, the margin between them is a ‘cost of liquidity” (ibid.) There are a number of benefits of such a strategy. Liquid assets provide firms with extra collateral, or firms can ‘buy and sell companies in balance sheet restructuring that may be profitable as long as capital markets are inflating’ (ibid.). Capital market inflation, induced by increases in domestic credit or foreign inflows, can provide such firms with potential profits that may even be greater than the costs of liquidity.
Drawing on the experience of Eastern European transition economies Toporowski argues that once financial markets become sufficiently liquid capitalists are able to realize capital gains by buying and reselling assets in inflating markets. In most developing

Chapter 4: Financial Development and the Balance Sheet Firm 89
countries markets are limited to real estate and once developed (as an outcome of the privatisation process) the stock market:
‘Once financial markets are established then the obvious assets to use for this kind of speculation are financial assets. Real estate capital can be turned over more rapidly than industrial capital; financial assets can be turned over even more rapidly than real estate.’
(Toporowski 2009, p.237)
This process complicates the balance sheet firm, which, it has been argued thus far, seeks liquidity to manage its survival in its primary productive activities. Toporowski points to the decoupling of finance from production. Firms with access to assets are able to pursue profits in asset markets; in the process further inflating them. Amit Bhaduri (2004) develops a model to discuss capital inflows to developing countries, and shows that the impact on productive investment depends on whether foreign investors ‘purchase equities in the primary markets to finance the issue of new equities’ or secondary markets and instead of calling forth new investments ‘diverts investments more toward the acquisition and merger to create a ‘financial bubble”. Rather than simply facilitating the financing of much needed investments financial deepening can affect firm strategies and economic stability. The concept of managing excess capital in inflated capital markets essentially corresponds to the potential of speculation raised by Arestis (see above) and others.
4.4. The Balance Sheet Firm and Financial Development
There are three elements to the balance sheet firm approach: that the principle of increasing risk is likely to apply in LDCs; that small and large firms will have different approaches to liquidity management, as well as the sorts and size of investments they make; and that the ability to manage liquidity will influence the likelihood of survival and that in managing portfolios firms can critically influence financial and other asset markets and, also, it was suggested move beyond purely liquidity management to the search for profit.

Chapter 4: Financial Development and the Balance Sheet Firm 90
This section will explore some of the theoretical implications of these propositions and provide some empirical support.
4.4.1. Banks, entrepreneurial capital and the principle of increasing risk
The principle of increasing risk (PIR) and the distribution of entrepreneurial capital has substantial implications for both the FLH and Keynesian theories of financial development. The size composition of the firm sector becomes a determinant of the size of individual investments, and so potentially of the level of investment in the economy at large and also the likelihood of firm survival. The survival of firms is important, as in an economy in which firms are expected to grow ‘organically’ over time a proportion of the firm sector will be expected to grow over a substantial period. In a LDC banks tend to lend to firms that can provide collateral. The absence of secondary markets for assets pledged as collateral may provide a further limit to lending.
Such a scenario suggests that it is commonplace for banks to limit loans to the extent of available collateral (however defined), and for banks to charge higher rates of interest to firms they regard to be riskier propositions.
Empirical studies of the relationship between collateral and lending, and the range of interest rates facing firms are mostly testing New Keynesian concepts. In some respects the principle of increasing risk and the importance of collateral to bank lending is similar to the New Keynesian concept of credit rationing (Sawyer 1996). For example, the purpose of collateral was tested by Godlewski et al (2011), who ran a number of regressions testing the relationship between collateral and a risk premium, asking whether collateral is used by quality borrowers to signal their reliability (in which case there will be a negative relationship) or whether banks demand collateral from risky borrowers (a positive relationship). They concluded that the relationship is strongest in the presence of strong information asymmetries, and find some evidence that in developing countries collateral is used by firms to signal their reliability. More generally, their conclusions point to the importance of both the availability of collateral and varying interest payments as a determinant of the size of bank loans.

Chapter 4: Financial Development and the Balance Sheet Firm 91
Others have examined the incidence of ‘asset based lending’ (ABL), in which banks only lend against physical collateral; and others have analysed the interest rates available to firms of different sizes. Tran Dinh Khoi Nguyen, Neelakantan Ramachandran for example, discuss the predominance of ABL, in which banks prefer to make loans backed with ‘tangible’ collateral (Tran Dinh khoi Nguyen and Ramachandran 2006). Queen and Roll (1987) argue that SMEs are likely to have a higher level of business risk, relative to large firms’. Firms with a high proportion of ‘tangible’ collateral are assumed to have better access to credit, as in moments of ‘financial distress’ they will be better able to liquidate their collateral. Wattanapruttipaisan (2003) pointed out that even in developed countries SME loans are regarded as a credit risk, and banks tend to insist on collateral. In one survey in the United States, for example, 92% of SME loans were secured, and 53% of total loans (Berger and Udell 1995). In France 76% of loans are secured, and in Germany 88.5% (Davydenko and Franks 2005). According to Miller (2001) and IFC (2000) many SMEs in LDCs lack collateral and so access to loans. Using a large data set Chakraborty and Mallick (2012) estimate the actual ‘credit gap’ for US firms, the difference between the desired and estimated levels of debt for credit constrained small businesses, to be an average of 20% for all firms, and 46% for manufacturing firms.
A number of studies have looked at the problem of SME financing in developing countries. Hill (2002), for example, examined problems with SME financing in ASEAN countries, and found that the vast majority of SMEs (between 70% and 90%) relied on own savings and short term informal borrowing for investment financing. The IFC (2000) found that in Ghana, Sri Lanka and Tanzania smaller firms had less access to bank loans than larger firms. Similarly, APEC (2003) showed that in Indonesia despite a period of rapid expansion in financial services for firms in the ‘formal’ sector only 12% of firms had access to bank loans.
4.4.2. Liquidity management in Small and Large firms
Liquidity management is closely related to the funding of investments as discussed above, and refers to firms’ efforts to ensure they are able to meet upcoming cash obligations, particularly current costs and financial commitments. Liquidity management enables a firm to cope with unforeseen cash demands, and also to fund investments

Chapter 4: Financial Development and the Balance Sheet Firm 92
financed with short term bank lending. The inability to do the latter increases the firm’s vulnerability and may discourage investments in the first place. It was argued in Chapter 3 that small firms are reliant on their ‘primary activity’ or ‘income account’. As they have limited access to bank credit, face higher borrowing costs and also lack sufficiently liquid assets their liquidity is determined by the success of their business line, and by the availability of retained earnings. This partly affects the high mortality rates among small firms, particularly in developing countries30.
Large firms, on the other hand, tend to develop alternative liquidity management strategies. Essentially, as discussed above, firms need to ‘fund’ their investments, particularly long term investments. Firms tend to wish to limit bank borrowing (Studart 1995b), and instead ensure a functional income account, and otherwise hold a portfolio of assets that provide both a steady income stream, and are sufficiently liquid to ensure they can be sold to meet short term commitments if the need arises.
The FLH ignores this state of affairs entirely. A liberalised and functioning finance and banking system is expected to provide firms with the financing required on the desired terms:
‘[A] perfectly competitive capital market will supply the economy with all its needs of financing, be it short term or long term; the time structure of the rate of interest will accommodate the intertemporal preferences and the risk aversion of the savers.’
(Studart 1995, p. 271)
An alternative post-Keynesian account argues that as bank financing tends to be short term then firms need alternative means to ‘fund’ their investments. In developed economies the stock market, bond market and other markets for liquid financial assets provide this service. In LDCs firms must either rely on cash flow from their real economy activities, short term bank loans or the sale of liquid assets. Of course, firms might also
30. See Wattanapruttipaisan (2003) for a discussion of mortality rates and SME financing in ASEAN
countries.

Chapter 4: Financial Development and the Balance Sheet Firm 93
opt for relatively risk free and small scale investments, that require little prior financing and that will generate a rapid return.
Chapter 3 discussed the potential marriage of Kalecki and Steindl’s distinction between large and small firms and Minsky’s balance sheet approach. Large firms, it was argued, develop a portfolio of assets that can both provide cash flow and liquidity. They are thus able to meet their commitments following investments and also in difficult periods. Table 2 suggests four categories of firm: small, large, conglomerate and SOE, and in the columns possible sources of funding and liquidity.
Table 2: Firms and Financial Institutions
Conglomerates are firms that operate in two or more distinct sectors, and so can draw on different sources of cashflow from their operations in the real economy31. ‘Large’ firms are firms classified as being of large size based on criteria such as capitalisation or
‘Small’ firm
‘Large’ firm
Conglomerate
SOE
Banks
PIR applies; limited collateral;
Access depends on collateral and
relationship
Access depends on collateral and
relationship
Access depends on collateral and
relationship; possible access to
dedicated investment bank.
Stock Market
-
Possible source of finance and
funding
Possible source of finance and
funding
Privatisation;
Bonds
-
Possible source of finance and
funding
Possible source of finance and
funding
Government sanctioned issue
Government
Possible Government programmes
Source of ‘rents’
Source of rents; legislative flexibility
Subsidies; rents; loans; grants; determines autonomy.
OtherInformal finance; owners’
wealth and portfolio.
Portfolio of liquid and
income generating
assets.Establishes subsidiaries
; establishes banks or
other finance
institutions
Depends on government relationship
;
31. The Oxford Dictionary of Economics defines a conglomerate as ‘a business conducting activities in
different industries with very little in common’ (Black 2009).

Chapter 4: Financial Development and the Balance Sheet Firm 94
employees32, but that operate in only one sector. In the absence of asset markets large firms are reliant on retained earnings, bank credit and their income account for liquidity, and for funding investments. Both Kalecki and Steindl suggested that large firms are also able to charge a mark up, something denied ‘marginal firms’, and so generate monopoly profits and retained earnings. Studies of large firms in a number of countries suggest that rents are a source of profits for many firms, lending some support to this assertion. Studart, for example, demonstrated that in the absence of domestic capital markets to fund investments Brazilian firms, benefitting from protected domestic markets, generated liquidity by increasing mark-ups on prices in protected sectors (Studart 1995b).
The literature on the corporate history of South East Asia provides some useful insights into the origins and strategies of large firms, and particularly diversified conglomerates. It demonstrates that the growth of many Southeast Asian conglomerates is underpinned by the state that either explicitly granted firms with access to relatively risk free rents, or, more implicitly, opted against regulating rent seeking behaviour33.
The literature is divided as to whether such firms and their behaviour was a pragmatic response to the absence of formal asset markets that would provide funding opportunities to large firms operating in relatively unstable economic environments or a straightforward rent seeking. Yoshihara (1988) provides the classic argument that large conglomerates who not only pursue monopoly rents, but do so in deliberately low technology sectors requiring low levels of investment, give rise to ‘Ersatz Capitalism’, an economic model that limits productive investment, technological development and growth. Jamie Mackie (2002) and Akira Suehiro (2003), on the other hand, argue that whilst there are problems with the practises of large, politically connected conglomerates, their behaviour is primarily a response to the conditions and institutional environment in which they operated. In other words, in the absence of effective competition and modern
32. A common classifier of firm size is number of employees; however, as ownership of collateral is an
important determinant of access to capital some measure of capital assets is also significant. For the purposes
of this discussion it is only necessary that large firms are not significantly limited in access to credit because
of a shortage of collateral and that they operate in fewer sectors than conglomerates.
33. See, for example, Doner (1992), Gomez (2002), Studwell (2007), Yoshihara (1988), Suhiro (1996),
Hutchcroft (1994) and Hewison (1997),
Chapter 4: Financial Development and the Balance Sheet Firm 95
institutions the diversified conglomerate form designed to maximise cash flow and build a portfolio of assets is an effective strategy. In Indonesia, for example,
‘[M]ost Indonesian conglomerates are highly diversified. This makes
good sense in an uncertain economic or political environment, as a
means of spreading risks, but it has hindered serious industrial
commitment, and long term investment strategy. Liem Sioe Liong…
controls a vast and heterogenous business empire, a rambling collection
of enterprises. Cash flow and control of assets seem to be his primary
aims, not corporate strategy or market dominance, and this is true of the
other Indonesian conglomerate heads’.
(Mackie 2002, p.181)
Brown (2006), on the other hand, in a seminal analysis of the ‘corporate economy’ in Southeast Asia argued that many corporations (the majority of those he studied) used ‘size and diversified growth as a proxy for the fundamental risk of high debt burdens’ (Brown 2006, p.334). Larger firms tended to have a larger debt burden. They diversified because they were highly leveraged. Diverse sources of cashflow lowered the risk of having to renege of repayments.
Other studies demonstrate changing strategies as business environments and, particularly financial institutions, develop. Wailerdsak (2008), in a survey of corporate structures and strategies in Thailand argues that firms that did respond to a changing environment tended to have fared better in the Asian crisis. Similarly, studies of individual corporations point to changing strategies as financial institutions develop (Sato 1994 and 2002). Even so, responses to financial development were not always benign. The most brazen, but not uncommon, strategy to secure cash flow was to establish or purchase a controlling share in lending institutions (Suehiro 1989). A number of firms, for example, exploited lax regulation and government contacts to establish banks whose primary purpose was to provide liquidity to firms within the group. Brown (2006), highlighted the importance of banks to corporate strategies in Indonesia:
‘…[C]orporate empires often had a family bank. Bank Central Asia
(BCA), the largest private commercial bank in Indonesia, formed the

Chapter 4: Financial Development and the Balance Sheet Firm 96
core bank in the Salim Group. It was a major recipient of state revenues,
foreign aid and foreign direct and portfolio investments, and had access
to offshore banks as well as to diverse and innovative sources of finance
such as derivatives. This capital abundance intensified corporate
economic concentration… A further feature of concentration is the high
percentage of loans to single individuals, or select groups of
conglomerates.’
(Brown 2006, p.11)
He goes on to discuss in detail the tendency of conglomerate owned banks to lend primarily to subsidiaries.
Stockmarkets were also a means to further build the diversified conglomerate. Once stockmarkets became firmly established, and in some cases inflated with foreign capital inflows many conglomerates built large stock and real estate portfolios, that were designed to generate speculative profits rather than a diversified source of cashflow (Habir 1999). Brown (2006) discusses the impact of inflows of portfolio capital into Southeast Asian markets in the 1980s and 1990s:
‘The large concentrated positions of portfolio capital in targeting
specific sectors of the economy (property, finance and currency
markets), their herding and manipulative activities, not only increase
speculation but assist in creating large diversified corporations in
Southeast Asia, which are reluctant to specialise because diversification
provided revenues, reduced risks and concealed problems of quality in
subsidiaries and connected firms.’
(Brown 2006, p. 149)
In summary, the corporate history of Southeast Asia suggests that one source of growth for firms in less developed countries is politically determined rents, and that such firms manage risk through diversification into relatively risk-free activities that provide cash flow to meet commitments and retained earnings for investment. Financial development, or more specifically, liberalisation of banking systems and capital markets, can provide the means to fund investments and better manage liquidity. However, it can also provide a

Chapter 4: Financial Development and the Balance Sheet Firm 97
means to generate cash flow and profit from the manipulation of a portfolio account, particularly in periods of capital market inflation.
4.5. Vision and Propositions
The discussion thus far in this chapter and in Chapter 4 suggests a clear ‘vision’ and a series of propositions or event regularities that can be explored in an empirical study of a developing country. This section will elaborate a series of hypothetical scenarios that may play out as an economy and its financial system develop. It will first outline an economy populated solely by small firms, suggesting that investments will depend on savings rates, the availability of collateral and prospects of survival. It will then suggest that in the presence of large firms asset markets might prove destabilising as firms choose to seek returns via their portfolio account. It will then explore the implications of state owned enterprises; one solution to the absence of entrepreneurial capital and less than optimal levels of private investment. It will finally set out a series of propositions that will be explored in the remainder of this thesis.
4.5.1. Private Sector Growth
One way to think through the implications of the balance sheet firm for understanding financial development is to develop a simple model in which firm types and financial institutions are gradually introduced. Beginning with a stationary state in which investment in each period is financed entirely by savings from the previous period, and in which it is assumed that either workers do not save, or that workers’ savings is entirely passed on to firms, and all savings is used by firms. Using this simple framework it is possible to see the implications for a country’s development prospects of the composition of the firm sector.
In such a hypothetical example of an economy populated entirely by ‘small proprietorships’, indeed much the same as that envisaged by McKinnon, Jan Kregel demonstrates that an economy may grow slowly (Kregel 1989). In a closed economy in which small firms are financed by their single owner’s equity, all profits are invested and workers do not save the rate of growth will depend on the ‘distribution of income as

Chapter 4: Financial Development and the Balance Sheet Firm 98
determined by a Kaleckian degree of monopoly within the limits of subsistence’. On the other hand if workers save then firms will need to borrow to finance investment in excess of net profits. ‘But bank lending to small firms will be limited... by the value of the owner’s assets available as collateral’. If workers’ savings exceed the value of assets owned by firms accepted by banks as collateral then there would still be a deficiency of demand. The larger the average size of firms then the more likely the economy will grow over time. The evolution of the debt-equity ratio will ‘depend on the relative size of profits and workers’ savings in national income’ (Kregel 1989). If savings exceed profits then the debt-equity ratio will tend toward unity. However, it is likely lending will cease long before this point is reached as lenders risk becomes too high, and as the interest rate correspondingly rises above the internal rate of return of investments, both increasing the reluctance of entrepreneurs to borrow and also increasing the incomes of lenders, and so increasing the savings rate further.
Although larger firms, in possession of greater collateral may be able to access credit in the absence of funding opportunities they will also limit the size of their investments relative to own capital so as to ensure their liquidity. The implication of the balance sheet firm is that the availability of funding opportunities has a bearing on the size and type of investment. In the absence of financial markets larger firms may choose to diversify sources of cash flow and limit the size and riskiness of investments, in the process limiting borrower’s risk. Diversified cash flow also has the potential to provide a more stable source of financing for investments.
The need to fund investments, or in the absence of funding opportunities to limit financial commitments associated with fixed capital investments stems from the desire to remain sufficiently liquid and avoid insolvency. In perfect markets bankruptcy should have few wider economic implications, as assets can be resold costlessly in secondary markets. However, in developing countries such markets are imperfect. Moreover, although bankruptcy may have little wider economic implications, it will at the level of the firm, and so managers and owners will seek to avoid it. Theories of the firm that stress the accumulation of capabilities and intangible assets also suggest that there are economic losses associated with bankruptcy. If learning is a function of firm survival, and the size

Chapter 4: Financial Development and the Balance Sheet Firm 99
and complexity of investments then the type of firm that makes an investment and the chances of that firm’s survival have a direct bearing on economic development.
The introduction of financial markets gives firms the opportunity to fund investments, and so, limit both borrower’s and lender’s risk. Financial markets then have the possibility of increasing the ‘functionality’ of financing systems and limiting financial instability (Studart 1995b). However, such an outcome also relies on the strategies of firms vis a vis markets. The balance sheet firm suggests that firm strategy can vary according to the buoyancy of markets. During periods of capital market inflation firms may choose to become ‘over capitalised’ and hold a greater portion of current assets - particularly cash and short term financial assets. This, in turn provides opportunities for speculation and accessing further loans, which may serve either to provide the firm with a portfolio of revenue generating liquid assets and so provide extra levels of stability or contribute further to capital market inflation and, in the event of a market downturn, increase the firm’s financial instability.
Over time an economy may develop an enterprise sector with distinct categories of firms with regard to the finance and banking sector. Small firms, running an income account, with limited access to credit or finance markets will generally make smaller, less capital intensive investments. Mortality rates will generally be higher. Larger firms, able to generate greater revenues, will be able to make larger investments depending on profit margins and so available retained earnings. However, to ensure sufficient cash flow to manage commitments and an uncertain business environment they will also refrain from capital intensive investments and diversify their investment portfolio. The South East Asia experience suggests that such firms will likely seek to invest in areas with minimal competition.
The introduction of institutions that enable firms to ‘fund’ investments may facilitate more capital intensive investments, particularly by larger firms. The opportunity to exchange short term debt for equity will reduce commitments and decrease both borrower’s and lender’s risk. Those same institutions will also provide firms with the opportunity to better manage a portfolio account of liquid assets.

Chapter 4: Financial Development and the Balance Sheet Firm 100
One way for developing countries to overcome the absence of large entrepreneurial capital is to directly finance large firm investments. The behaviour of firms will be determined by institutional rules set by the state. However, the state will have to decide the degree to which it manages firm liquidity by supporting firm efforts to fund investments. If the state chooses to allow firms’ autonomy in their financial operations then they must have some means of determining the true intentions of SOEs with regard to diversification and interaction with financial markets. The following section discusses the possible implications of the balance sheet firm for state owned enterprises.
4.5.2. State owned enterprises
Economies undergoing institutional change from command economy to more typically capitalist structures present further complications. Most former members of the Council for Mutual Economic Assistance or Comecon adopted radical reforms, creating new institutions almost overnight. This thesis, however, will look in detail at the experience of Vietnam. Vietnam did not see the need to tear down all existing institutions, and construct what many saw as overtly capitalist institutions. Reform was a more drawn out affair. A commonly used phrase to describe the process is ‘feeling for the stones to cross the river’34. The stated aim was to build an economy that was a mix of market and socialist institutions and attributes.
In a pure command economy all sectors are part of one administered whole, in which prices are primarily an accounting tool. The banking system is a mono-banking system, in which the state bank carries out all banking functions: currency creation, allocation of credit, creation and management of deposits, the management of foreign currency and so on. Firms are in essence factories. They are single productive units that do not possess or manage balance sheets. Using Minsky’s schema they are plant, with the state taking the role of entrepreneur. However, unlike Minksy’s entrepreneur the state is not primarily concerned either with revenues or costs (which are anyway difficult to measure), or with the value of assets and liabilities on the firm’s balance sheet, as they also do not possess a market price, are not tradable and do not affect the firm’s solvency, or liquidity (again an
34. The phrase is originally attributed to Deng Xiaoping.

Chapter 4: Financial Development and the Balance Sheet Firm 101
unimportant concept). Transactions between firms are recorded in the banking system. Interaction with the outside world is typically in the form of barter. If there are private firms, they are typically small traders, possessing little capital.
Households are expected only to consume according to the plan. The state provides essential services such as housing, education and health care. As a result wages are low, and workers are often paid in kind. Households tend not to save, although some do hold accounts in the state bank, and nor do they require loans.
The process of ‘reform’ requires the sectors achieve a degree of separation, goods and asset markets must develop and channels for the flows of profits, wages, interest and transfers must come into being.
At the firm level there are two (or maybe three) distinct processes at work. The first, and most straightforward, is the establishment of new private enterprises. Such firms come into being in the post command economy period, and are not the direct result of some form of organisational transformation. Assuming there is no capitalist class and that equity markets are, if existing, small newly established private firms are likely to be have the following characteristics:
• They are single activity firms.
• They are almost entirely debt financed.
• Owners are likely to also be managers.
The second process is the transformation of state owned enterprises. As suggested above in the planning period SOEs are essentially factories, and do not possess their own balance sheets. Managers are concerned entirely with production, and are not required to consider issues such as strategy or finance. In becoming a functioning economic unit in a market orientated economy the firm takes command of its own balance sheet, and also of what it produces rather than simply how. However, in the absence of any substantive reorganisation of the firm sector SOEs remain single activity firms.
If SOEs are privatised then they effectively join the ranks of newly private firms. If not, and some form of state ownership is maintained then the state must make a number of

Chapter 4: Financial Development and the Balance Sheet Firm 102
decisions. The first is the distribution of profits. Profits can be distributed to investment as retained earnings, to shareholders as dividends and to government as either dividends or taxation, which amount to the same thing. Firms are financed via revenues, bank loans and transfers. Given the importance of SOEs to the success of the economic plan, policy loans are likely to depend less on firms viability as an economic entity, and more on the importance of the objective to the government.
First, it is possible to imagine a scenario identical to private sector led development. The government chooses to finance small, single activity firms that act either autonomously or according to some form of development plan. Either way firms would confront the principle of increasing risk, and the inability to protect themselves in the event of shocks to their primary (only) markets. Extra government expenditure takes the form of higher transfers to the firm sector, funded by taxation and/ or credit creation by state owned banks. The government must decide whether it limits itself solely to financing start up firms, or it also makes some form of commitment to the long term survival of such firms. The latter strategy would involve a commitment to support distressed firms and also to fund long term investments.
The latter commitment is particularly important if the government is pursuing some form of development strategy, as typically the justification for government intervention is large scale investment that might otherwise not be undertaken (Lin et al. 2001). This presents a separate set of issues associated with the government’s stance on monopoly profits and also with strategies to ensure long run liquidity. As argued in Chapter 3 large scale private firms can limit their exposure to borrower’s risk through the accumulation of retained earnings, which they source through mark-up pricing. In other words, such firms both achieve and maintain their large size through their ability to generate supernormal profits. Moreover, such firms are able to manage the vagaries of fluctuations in revenues in primary business lines by building a diversified portfolio of liquid real and financial assets, that both grant revenue streams and can be sold if necessary in asset markets.
A further consideration is the source of such profits. In some ways large firms in developing countries are the ‘marginal’ firms of Chapter 3. They tend to operate in markets with demand determined prices, and lack the capabilities to develop more

Chapter 4: Financial Development and the Balance Sheet Firm 103
profitable activities. As such building monopoly positions without state support is difficult. Moreover, exposure to unpredictable prices increases the risk of insolvency.
The second major attribute of the large balance sheet firm is the propensity to build a portfolio of assets to manage liquidity. This presents the government with a number of difficulties. First, firms are charged with the efficient and productive use of state funds to achieve a defined objective. As such investing in areas outside of the plan is likely to receive some resistance. From the perspective of a government looking to manage scarce resources, such investments look at best like the frivolous use of state funds, and, at worse, attempted theft. However, from the perspective of the firm, investments outside of core activities serve a crucial purpose, as a source of diversity, and as a means to build a liquid portfolio to better manage crisis. If the government insists firms devote the majority of their resources to their primary activity, then the government must in turn take some of the responsibility for the firm’s liquidity. If not, then the government must be able to distinguish between speculative and legitimate projects.
4.6. Propositions
The literature discussed in this chapter, coupled with the discussion of the balance sheet firm of Chapter 3 suggests that any analysis of the relationship between financial development and economic development should incorporate a close study of the firm sector and the sources of both finance and funding for different categories of firm. The remainder of this thesis will undertake such a study in Vietnam, an economy that has undergone recent financial development and in which the state plays a considerable role. The discussion in this chapter can generate a number of propositions that can be explored empirically:
A. That small firms with limited collateral and reliant on their income account will both struggle to attract finance, and have restricted means to manage liquidity and ‘fund’ investments.
B. That large firms will have more liberal access to finance, but in the absence of the opportunity to fund investments will engage in typically small scale investments and/ or seek to diversify their

Chapter 4: Financial Development and the Balance Sheet Firm 104
sources of cash flow, and possibly develop a precautionary portfolio of liquid assets.
C. Following from proposition (B) large firms might choose to diversify into a number of unrelated sectors that require limited capital investment, and if asset markets are available may build a portfolio of liquid assets.
D. In the absence of financial markets firms will limit use to bank loans, as they will struggle to fund their loans, and will choose the ‘conglomerate’ form. Once financial markets are established firms will finance investments with bank loans and retained earnings and fund them with capital issues.
E. In the event of capital market inflation large firms may hold ‘excess capital’ and seek capital gains in capital markets.
F. State owned enterprises will be dependent on government for liquidity management; and/ or they will operate as large firms or conglomerates.
4.7. Methodology
A variety of approaches will be used to explore these propositions in Vietnam. Fundamental to the argument is that the development of financial institutions provides new instruments to firms to both finance and fund investments. Moreover, new financial instruments will stimulate new flows of funds within the economy, as will more liberalised reform of the economy. To this end Chapter 6 will develop a flow of funds analysis of the Vietnamese economy. It will seek to demonstrate the evolution of flows, and how institutional development has affected the change. It will look closely at aggregate flows as well as specific instruments such as bank deposits, bonds and stocks.
The next stage will be to look at the relationship between financial development and the firm sector in light of the discussion in this and the previous chapter. A number of techniques will be used:

Chapter 4: Financial Development and the Balance Sheet Firm 105
• Existing firm studies in Vietnam will be consulted in order to seek insights into the changing relationship between the enterprise sector and the finance sector.
• An analysis of the World Bank enterprise survey for 2005 and 2009 in Vietnam will shed some light on the financial behaviour of smaller firms in Vietnam.
• A series of case studies of some of Vietnam’s largest firms will provide evidence of changing strategies, and in particular strategies unique to the state owned sector.
• To investigate the role of the stockmarket on firm financing and funding behaviour firm balance sheets will be analysed. Listed firms are required to publish quarterly balance sheets, which are publicly available. However, few firms have been listed for longer than five years, and most are equitised state owned enterprises. Nevertheless, it is still possible to see if the general sequence as proposed by Davidson, Studart and others generally holds. Specifically, firms finance investments with retained earnings and bank loans, and later fund them with stock market issues, which would in turn be used to pay down accumulated debt. Such analysis will also enable analysis of whether state firms operate differently to private firms, and whether firms forego banks loans, or issue shares purely for liquidity reasons.
4.8. Conclusion
The Financial Liberalisation Hypothesis suggests that policies to liberalise the finance system in developing economies will serve to improve access to finance for firms that in underdeveloped financial systems and systems characterised by financial repression struggle to secure capital for investment. Empirical studies of the key tenets of the FLH suggest that the relationship between financial liberalisation and economic growth is more complicated and nuanced than its proponents suggests. The causal relationship between financial development and economic growth is questioned in a number of studies, as is the relationship between interest rates and savings. Other critiques emphasise the importance of institutional factors that fall outside of empirical studies of the impact of financial development, as well as the destabilising impact of foreign capital

Chapter 4: Financial Development and the Balance Sheet Firm 106
flows. Post-Keynesian approaches to financial development and the role of the finance sector present more fundamental challenges to the FLH. Specifically, post-Keynesian approaches invert the relationship between savings and investment, and emphasise the role of the finance system as a source of funding as well as financing for firms. Victoria Chick and Lance Taylor propose accounts of economic development that emphasise a series of stages in which key institutions come to influence the economy. This chapter suggested that the ideas developed in Chapter 3 contribute further to post-Keynesian approaches to economic development. It argued that the balance sheet firm implies that in the absence of institutions facilitating liquidity management and the funding of investments firm behaviour might differ according to the level of financial development. Moreover, adapting the insights of Kalecki and Steindl different types of firms might interact with the finance and banking sector in different ways, suggesting that the composition of the enterprise sector will have a bearing on the impact of financial development. The discussion was also extended to economies in which governments sought to compensate for the absence of entrepreneurial capital by supporting enterprise development. As and if state sponsored firms were granted autonomy, funding and liquidity management needs would present challenges to both government and the financial system. These ideas will be explored further in the remainder of this thesis in a study of Vietnam.
5.

107
Chapter 5: Institutional Reform in Vietnam
5.1. Introduction
In this and the following two chapters, the ideas developed in Chapters 3 and 4 are explored in the context of Vietnam. Vietnam is an interesting country of study for a number of reasons. In a period of continuous reform, known as Doi Moi, Vietnam has grown from one of the world’s poorest countries to middle income status (USD 1,000 per capita per annum). As a former command economy reforms in Vietnam have concerned not only the development of the private sector, but also the state sector, enabling analysis of the state owned enterprise as a possible solution to the absence of private entrepreneurial capital in a less developed country. Banking reforms have also encompassed both the dismantling of a mono-banking system and then the liberalisation of the banking sector in line with WTO commitments. In this Vietnam is unusual as it has been slow to adopt the tenets of the Washington consensus. This allows consideration of both the impact of liberalisation of enterprise and banking sectors and policies to retain control of the developmental process through restrictions of both the enterprise and financial sector.
5.2. Vietnam - Background
Vietnam has made remarkable progress since the beginning of the 1990s. GDP growth rates have averaged 7.6 percent. Slowdowns can be directly attributed to the Asian crisis and the more recent global financial crisis. In that time all the significant economic indicators show considerable development. Vietnam’s economic interaction with the outside world grew dramatically, aided in part by a string of trade agreements. Trade (imports plus exports) grew from 23 percent of GDP in 1986, to 97 percent in 1998, to 171 percent in 200835. From a position of near famine in the mid-1980s Vietnam became a net exporter of agricultural output by the mid -1990s, and is now one of the leading exporters of rice, rubber, seafood, coffee, garments and footwear. Vietnam is also an
35. The global financial crisis forced a reduction to 131 percent of GDP in 2009.

Chapter 5: Institutional Reform in Vietnam 108
attractive destination for foreign investment. In 2009 registered FDI capital stood at over USD 29 billion36.
The Vietnamese economy is also undergoing rapid structural change. Distinguishing between a manufacturing sector and an agricultural sector we can see that since the mid-1990s manufacturing output increased as a proportion of total output at the expense of agriculture (Figure 1).
Figure 1: Contribution to GDP by Sector (%)
!"
#!"
$!"
%!"
&!"
'!"
(!"
)!"
*!"
+!"
#!!"
#++!"#++$"#++&"#++("#++*"$!!!"$!!$"$!!&"$!!("$!!*"$!#!"
,-./01-2"
345627.8"9":;427.61<;4"
=>.016?76.-"
Source: GSO.gov.vn37
The manufacturing sector is employing increasing numbers of people every year and the proportion of the labour force working in agriculture is falling. People are moving from the countryside to work in urban areas or semi-urban areas. Although more detailed data are hard to come by there is enough to paint a rough picture of a changing agricultural landscape. According to the Ministry of Agriculture and Rural Development (MARD) since 2001 land devoted to crops has dropped from over 4.3 million ha to 4.13 million ha. In 2007, land devoted to rice cultivation fell by 125,000 ha. By 2020 another 600,000 ha
36. Again, economic difficulties across the world has affected the rate of growth in FDI since 2009.
37. http://www.gso.gov.vn/default_en.aspx?tabid=468&idmid=3&ItemID=12980, accessed 28th June 2012.

Chapter 5: Institutional Reform in Vietnam 109
of land will be converted to nonagricultural uses and a further 300,000 of paddy planted with more lucrative crops (MARD 2008).
A significant proportion of the growth in manufacturing is attributed to the growth in foreign direct investment. The World Bank estimates that 189.6 trillion VND, or 58 percent of total investment by the business sector (including State Owned Enterprises) in 2007 was foreign direct investment, portfolio investment or foreign lending (World Bank 2009). At the same time 53.3 percent of manufacturing sector revenues was from exports. Much of that from foreign firms based in Vietnam.
Foreign and private firms have also become increasingly significant in terms of total output. Figure 2 shows that the foreign invested sector has also come to dominate exports.
Figure 2: Exports of Foreign and Domestic Sector (Mill USD)
!"
#!!!!"
$!!!!"
%!!!!"
&!!!!"
'!!!!!"
'#!!!!"
'(()"'((%"'((*"'((&"'((("#!!!"#!!'"#!!#"#!!+"#!!$"#!!)"#!!%"#!!*"#!!&"#!!("#!'!"#!''"
,-./012"324/56/7"8/96-."
:-;/5<9"8/96-."
Source: GSO.gov.vn38
The rapid changes in the Vietnamese economy have occurred during a period of ongoing reform termed ‘Doi Moi’ (renovation). Reform has touched every aspect of the economy.
38. http://www.gso.gov.vn/default_en.aspx?tabid=471&idmid=3&ItemID=13129, accessed 28th June 2012

Chapter 5: Institutional Reform in Vietnam 110
The following sections will outline the main contours of reform, specifically with regard to enterprise reform, banking and finance and foreign investment.
5.3. Doi Moi.
Few suggest that the objective of Government policy in the 1980s and early 1990s was to create an orthodox market economy consistent with the ‘Washington Consensus’. However, it is unclear to what extent anyone had much of an idea where they were going. Although the outcomes of reform tended to suggest a movement toward a conventional market economy, they were also a movement away from something that wasn’t working. As Dang Phong, one of Vietnam’s more prominent economists, has argued:
‘An interesting feature of the Vietnamese reform is that its leaders aimed to repair the old model; they certainly did not intend to move towards a market economy. But each attempt at repair took them a step further away from that which was to be repaired. Only when one foot was already on the new shore could it be seen that there was nothing dangerous, in fact many things were better, and the new model could be affirmed.’
(Dang Phong 2004, p. 76)
In many ways the last thirty five years of Vietnamese history has been a protracted search for a ‘model’ that both worked and ensured the ‘leaders’, or the Communist Party, remained in power. Following the occupation of the South of Vietnam in 1975 the North Vietnamese government sought to build the institutions of a command economy across the country. However, policy makers soon met with resistance and difficulty. Waging war with Cambodia and then China, and coping with the most destructive monsoon in over eighty years certainly didn’t help matters. Vietnam also suffered from its decision to join the Council for Mutual Economic Assistance (Comecon) in 1978. During the American war Vietnam had received aid from the Soviet Union amounting to approximately one billion dollars a year (Dang Phong 2004). The Vietnamese government used the money to buy supplies for the war effort, inputs into production and essentials for the population. Prior to full accession to Comecon in 1978 Vietnam was entitled to generous discounts on

Chapter 5: Institutional Reform in Vietnam 111
the price of key items. They could, for example, purchase petrol at a fraction of the price paid by Comecon members. Joining Comecon and so paying the full price drastically reduced the quantity of items purchased with Soviet aid. The effect was to handicap attempts to impose the institutions of a command economy, limit the ability of the state to provide inputs to firms and purchase outputs, and, in the process, put firms themselves under severe pressure. By 1979-80 the majority of enterprises across the country were running at fifty or even thirty percent of planned capacity:
‘Every type of good was scarce in the market. This was a period in which coal was often used to run automobiles and tyres had to be retreaded. The state shops had insufficient amounts to sell in relation to the ration coupons for cadres and soldiers. In many months coupons for meat could only buy tofu or Mongolian mutton fat’.
(Dang Phong 2004, p. 56)
Workers were paid in kind and traded their wages on the street. A black market thrived. By 1980 ‘free market’ prices were three times those of 1976; by 1985 three thousand times and by 1986 nineteen thousand times (Pham and Le 2003). Proponents of some form of combination of plan and market began to find they were listened to. Vietnam also saw a resurgence of a phenomenon known as ‘fence breaking’ (pha rao)39, in which the strictures of the plan were tested. Rice was sold at market rather than official prices, unofficial trading took place between industrial units, households signed contracts with SOEs and ‘one price systems’ - in which state prices and market prices became one and the same - were established across the country. Fence breaking appears to have been a considered response to the more unworkable aspects of the command system40. The general outcome was the relaxation of the more intractable planning regulations, the
39. The tradition of fence breaking apparently goes back to the early 1960s. See (Dang Phong 2004).
40. There is some debate as to the significance of fence breaking, the complicity of high ranking officials and
the degree to which reforms were ‘bottom-up’ or ‘top down’. See (Fforde and Vylder 1996) and (Dang Phong
2004).

Chapter 5: Institutional Reform in Vietnam 112
improved productivity of many firms and, for individuals and families, more reliable access to food and other goods. Fence breaking also led to and was accompanied by new legislation that worked to dismantle the more cumbersome and economically damaging aspects of the planning system. The general approach to reform was sanctified in the VI Party Congress in 1986, now regarded as the official launch date of Doi Moi. At the Congress it was proposed that Vietnam should become a ‘multi-sector economy’, involving state, foreign and private business and a ‘commodity economy’ (a euphemism for market economy (Dang Phong 2004); the focus on heavy industry should be abandoned and replaced with the production of food goods, export goods and consumer goods and Vietnam should adopt a more open policy to the outside world. In effect the Plan was abolished and Vietnamese SOEs were able to recruit workers, set wages, purchase their own inputs, sell their own output and borrow capital for investment. They also had access to foreign exchange and direct access to foreign markets was permitted. Nevertheless, the Government maintained significant control over the ‘commanding heights’, and identified industries it wished to maintain some control over.
In dismantling a pure command economy, and enabling firms and individuals to sell and purchase goods and services at market prices the Government began the process of building a ‘market economy with socialist characteristics’. In 1979 a resolution was passed that effectively granted individuals and collectives the right to establish and operate businesses. The state monopoly of foreign trade was gradually relaxed from 1980 onwards. In 1981 the ‘three plan system’, which gave SOEs the legal right to trade at market prices outside of the plan, was established41. From 1981 official prices were gradually bought into line with prices revealed in the unofficial free market and after 1989 SOEs paid world market price for inputs from other state owned units. The official price system was dismantled, and rouble and dollar rates were fixed at market rates. In March 1989 subsidies to state enterprises were abolished, interest rates were brought above the rate of inflation and the savings rate raised to thirteen percent a month. To increase its attractiveness to foreign investors, open potential markets for domestic enterprises and to discipline domestic firms and interest groups the GoV sought
41. Plan A was that of the centre, Plan B an agreement between enterprises and local authorities and Plan C
the right of enterprises to sell excess output in the open market (Dang Phong 2004).

Chapter 5: Institutional Reform in Vietnam 113
membership of major trade organisations and agreements. In 1992 Vietnam signed a trade agreement with the European Union. In 1996 Vietnam joined the Association of Southeast Asian Nations (ASEAN), eliminating tariff and non-tariff barriers with other ASEAN countries. In 1998 Vietnam joined APEC, and in 1999 signed a most favoured nation (MFN) agreement with Japan. In 2000 after several years of negotiation Vietnam signed a bilateral trade agreement with the United States (USBTA) and in January 2007 twelve years after the original working party was established Vietnam finally acceded to the World Trade Organisation (WTO). The USBTA and prospective accession to the WTO called forth new enterprise, investment and competition laws (discussed further below).
5.4. Enterprise Reform under Doi Moi
In Vietnam enterprise reform refers to the restructuring of the state owned enterprise sector and the granting of rights to private enterprise. Both aspects of reform have proved contentious as the relative position and contributions of both sectors has for so long been of political as well as economic significance. The issue is complicated by the sometimes ambiguous status of the private sector, the apparently illegal role of private capital in state enterprises in the 1980s and 1990s, and foreign investment in Vietnamese firms.
5.4.1. State Owned Enterprise Reform
The planning period was not particularly successful. Most SOEs were forced to go outside of the plan for inputs and customers, yet still retained ‘social’ responsibilities42. By the beginning of the 1990s most firms were poorly equipped. A 1992 survey found that there was a direct relationship between the date of an enterprises’ establishment and the vintage of its equipment (Beresford and Dang Phong 2000). Many firms continued to use machinery originally purchased in the 1960s and 1970s. One textile mill used second
42. Many firms were expected to provide a range of services to employees and local communities, and were
discouraged from firing workers. Well into the 2000s firms employed, mostly elderly, workers who had no
hope of adapting to modern production methods.

Chapter 5: Institutional Reform in Vietnam 114
hand equipment originally used in 1930s England. Melanie Beresford recounts a conversation in the mid-1990s:
‘About a decade ago, many of the SOEs were described to me by a retired senior Communist as ‘deformed’ – a textile mill, for example, may have spinning and weaving plants, but be ‘missing a leg’, namely, the dyeing plant. Others had been cobbled together from a range of different (Soviet, Chinese, East European) sources and could not operate as an integrated plant. Further, in explaining why the state was unwilling to privatise, dissolve or break up the SOEs, he argued that ‘they are our children and we cannot eat our children.”
(Beresford 2008, p. 226)
SOEs also suffered from their subordination to state planning. Although the strict planning system had broken down by the late 1980s, firms remained constrained in other ways. Investment was channelled to the establishment of new SOEs, rather than supporting existing ones, which were expected to succeed on their own (Beresford 2008). As late as 1992 firms were still returning their depreciation fund to the state, and submitting applications for new funds (ibid.). Over half of SOE’s fixed assets were depreciated by more than 50 percent and a quarter had fixed assets depreciated by less than 30 percent. Only fifteen percent of output was estimated to be suitable for export, although seventy percent was apparently good enough for domestic consumption (Beresford 2008). The remaining fifteen percent, absorbing approximately ten percent of working capital, could not even be sold on the domestic market (Phan Van Tiem and Thanh 1996). The reform programme was a response to the profound undercapitalisation of state owned companies and an acknowledgement that what capital there was was spread too thin (Beresford 2008). There were three aspects to SOE reform. Firms were liquidated, restructured through a programme of merger, or equitised (a form of privatisation in which a proportion of state assets was sold to enterprise managers and workers). Equitisation would serve to reallocate state capital from ‘sectors and branches of the state sector which are not important to the national economy, do not necessarily

Chapter 5: Institutional Reform in Vietnam 115
need state capital, or require an element of share ownership to be held by the state’ (Phan Van Tiem and Thanh 1996). Equitisation was also designed to break the hold of line ministries on SOEs43. The reform process proceeded in fits and bursts. Between 1991 and 1994 the total number of SOEs fell from over 12,000 to 6,000. Of these around half were liquidated, two thousand combined with other state firms and the rest sold off. Between 2001 and 2005 another three thousand firms were restructured, and two thousand equitised (World Bank 2009).
Another plank of the reform programme was the formation of General Corporations (GCs) in 1994. They were an attempt to consolidate firms in the same or related industries. Firms were brought together under the command of a Head Quarters, which essentially became the head of a holding company. They also had a social objective. General Corporations were expected to turn around failing companies that still employed a significant numbers of working age people. They were also an attempt by the GoV to retain control over the economy’s ‘commanding heights’ and drive the industrialisation process forward. State owned enterprises were increasingly asked to operate on the same terms as private and foreign owned firms. Although firms were not expected to abide by the same legislation until 2010 successive ‘enterprise laws’ (culminating in the 2005 Unified Enterprise Law) and SOE laws dismantled the barriers between them. The objective was to force SOEs to respond to market pressures and was also a response to donor pressure and trade agreement commitments. State owned enterprise reform and restructuring did result in increases in productivity, although this was associated more with reductions of the labour force and consolidation. In 1990 and 1991 for example, approximately 750,000 people lost their jobs. In 2000 and 2001 many more were made redundant following a further round of redundancies. The ability of SOEs to derive productivity gains from more progressive sources has proved more difficult. Explanations as to why have largely focussed on the investment decisions of SOEs, and the efficiency of those decisions. Since the 1980s SOEs have appeared to shun their ‘core business’, preferring instead to pursue side lines in other areas, particularly, and most
43. As a response to the shortages of the 1970s and early 1980s line ministries and provincial authorities
relied on SOEs as a source of revenue.

Chapter 5: Institutional Reform in Vietnam 116
controversially real estate, and more recently financial activities. Beresford saw the strategy as a consequence of the poor quality of firms’ primary assets:
‘Since rent-free access to high-value urban land has been one of the few marketable assets that SOEs could use as a source of revenue, there was much participation by industrial SOEs in the real estate and hotel boom of the early 1990s.’
(Beresford 2008, p. 231)
Beresford (2008) and Phan Van Tiem and Thanh (1996) argued that as most SOEs had limited access to capital many abandoned their main business lines. Instead opting for ‘trading activities, tourism and transport services’. Many even resorted to selling off fixed capital for cash in order to meet short term requirements. Even so:
‘Some of those SOEs with relatively large capital bases have shifted their investment into restaurants, hotels and joint ventures. Yet at present, the government is unable to regulate such shifts in investment and business operations by SOEs.’
(Phan Van Tiem and Nguyen Van Thanh 1996, p. 25)
Given the ease of entry into these areas SOEs faced increasing levels of competition from non-state enterprises, many of which were actually SOEs ‘penetrated’ by private capital:
‘Surveys have shown that many state owned retail commercial centres, transport companies, and tourism enterprises are state-owned in name only with private persons operating the businesses, having rented the premises, equipment, facilities, and even the legal status of the SOEs.’
(Phan Van Tiem and Thanh 1996, p. 28)
Other profitable lines were trading activities, where firms were able to benefit from short term credit. Chi Do Pham and Duc Viet Le (2003) suggest that SOEs had little choice as their primary activities were always bound to be uncompetitive. By the late 1990s, they argue, firms found themselves producing goods for which global and domestic demand

Chapter 5: Institutional Reform in Vietnam 117
was saturated, leading to difficulties exporting, stock piling of inventories and deflation. More recent surveys have demonstrated similar patterns. Cheshier and Penrose (2007), for example, found that SOEs felt duty bound to maintain their core business, but were increasingly seeking to diversify into other apparently non-productive investments. Managers cited the profitability of alternative activities, difficulties mastering advanced technologies and breaking into new markets as the main reasons (Cheshier and Penrose 2007). Such strategies have attracted much hand wringing by senior government and party officials as well as the media. A string of articles have called attention to firms’ speculative practices, asking whether the interests of Vietnam are being well served.
5.4.2. Private Sector Reform
As one might expect the GoV’s attitude to the private sector has always attracted controversy. There are, for example, many anecdotal accounts of local and sometimes central opposition to the private sector. Private enterprise has long been a source of revenue for local authorities, and many, particularly in the 1990s and early 2000s, imposed informal fees and other forms of taxation. Private firms have also suffered from weaker property rights than state owned and foreign firms (Rand et al. 2008). Nevertheless, even during the late 1980s, in a period particularly inhospitable to private enterprise, the ‘non state sector’ produced nearly 40 percent of industrial output (Dang Phong 2004). Subsequent reforms have sought to dismantle barriers to private sector growth. Successive Enterprise Laws (discussed above) have given private entrepreneurs the right to establish and operate firms on the same terms as other forms of enterprise. Private firms can take the form of limited companies, joint-stock companies, partnership companies and private enterprises (Nguyen Dinh Tai 2006). Emphasis has been put on simplifying the procedures involved in establishing privately owned firms, and reducing restrictions on business activities of private firms. A number of studies have demonstrated that reforms designed to improve the business environment have been successful. In a recent survey of firms across Vietnam research project found that private firms now face ‘lower entry costs, better access to land, smaller time costs, reduced informal charges, a more pro-active local government, better private sector development programmes, greater labour flexibility, and a better legal environment’ (McCulloch et. al. 2013, p.21).

Chapter 5: Institutional Reform in Vietnam 118
Similarly, the World Bank, whilst emphasising the continued dominance of the state sector find that most obstacles to private sector development have been dismantled (World Bank 2011). Nevertheless, although the number of private enterprises operating in Vietnam has increased significantly, the majority remain small and struggle to grow:
‘Vietnamese private firms are able to establish operations and may relatively easily grow to employ several tens of people, but reaching the ranks of medium sized and large firms is difficult for those enterprises that are not successful exporters.’
(Hakkala and Kokko 2007, p. 32)
McCulloch et al. (2013) found that the improvements in the business environment and the removal of legal and most institutional obstacles to private sector development do not appear to have contributed to increased levels of private sector investment.
Reforms have, then, tended to dismantle obstacles to private sector development, and at the same time seek to reform the state owned sector. However, as will be demonstrated further in the following chapter, despite the removal of many barriers to growth, private firms remain relatively small, and state owned enterprises, despite a process of equitisation and the removal of some if not all privileges continue to dominate much of the economy (World Bank 2011).
5.5. Financial and Banking Reform
The difficulties of the 1980s highlighted the importance of the ability to raise and direct investment capital. As with enterprise reform it is something of a surprise how conventional banking and finance reform has been. Reforms essentially pursued three objectives. The first was to overcome the shortcomings of the planning system and bolster the country’s state owned sector. The second, was to provide investment for infrastructure. The third, particularly after the 1997 Asian crisis, was to satisfy the requirements of foreign investors, by better managing inflows of foreign capital, and responding to concerns about the number of nonperforming loans held by the state owned banking sector. The commitment appears to be toward the development of conventional

Chapter 5: Institutional Reform in Vietnam 119
financial institutions. This section will outline the main banking and finance sector reforms and then discuss the relationship between firms and the banking and finance sectors. The first major reform was the creation of a two tier banking system in 1988.
Tier 1 was the State Bank of Vietnam (SBV), Tier 2 four State Owned Commercial Banks (SOCBs), themselves spinoffs from the SBV. Originally, the SOCBs had specific roles. The Investment and Development Bank (IDB) of Vietnam focussed on medium and long term financing of SOEs; the Industrial and Commercial Bank of Vietnam (ICBV) offered commercial banking services; the Vietnam Bank for Agriculture and Rural Development (VBARD) offered credit and services to farmers and the Vietcom Bank handled foreign exchange and trade finance. There was however no actual separation between the SBV and the SOCB as the SBV influenced the appointment of SOCB management (Ben Ang Siew Hock et al. 1997). However, more recently banks, although not abandoning their traditional responsibilities have begun to branch into new areas (World Bank 2009).
As Figure 3 illustrates banking reforms in Vietnam were primarily aimed at bringing Vietnamese banking practices in line with developed country standards, gradually liberalising the banking system by allowing the entrance of private (joint-stock) and foreign banks, and relaxing constraints on SOCBs. A 2005 initiative called for the equitisation of SOCBs by 2010. The financial crises means that thus far only two have been equitised. In total there are four major and one minor SOCBs, 37 JCBs, six JVs and two development and policy banks.
Figure 3: Timeline of the Major Finance and Banking Reforms since 1990.
1990: Non-state Joint Stock banks, joint venture banks and representative offices of foreign banks were allowed to set up offices in Vietnam.
1993: Interbank market for VND established.1994: Interbank market for foreign exchange established.1995: Minimum capital requirement of commercial banks established at 6.4 million USD in HCMC and 4.6 million in Hanoi1996-2002: Deregulation of domestic interest rates on both VND and foreign currency deposits and loans.

Chapter 5: Institutional Reform in Vietnam 120
1997: Law on State Bank and Law on Credit Institutions
1999: Government commits to separating policy from commercial lending. 2000: Banks allowed unsecured lending to SOEs, FIEs, Joint ventures between domestic and foreign firms.2001: Banks allowed to use Land User Certificates (LUCs) as collateral. 2000: HCMC stock exchange (HOSE) established2000: Re-Capitalization of banks in response to NPLs following Asian crisis2005: State Owned Commercial Banks (SOCBs) restructured, and commitment to equitise by 2010.2005: Banks have to improve their credit classification system to allow for the calculation of NPLs and loan provisioning closer to international standards. However, by the end of 2008 only two commercial banks had completed the process (Suiwah 2009). 2005: Investment Law: “investors shall be permitted to invest in all sectors and in all industries and businesses which are not prohibited by law,” and “the State shall provide equal treatment before law to all investors from all economic sectors and as between domestic investment and foreign investment.” 2006: Law on Securities to facilitate the development of the securities market. The law covers the regulation of listing and trading securities; the State’s role in administering and inspecting the securities market; the public offer of securities; the disclosure and corporate governance of public companies; the organization of trading markets; depository, clearance and payment facilities; investment management and fund companies; information disclosure; inspections and dispute resolution. 2007: Foreign banks allowed to enter the Vietnamese market according to an agreed timetable.2007: State bank licensed eleven rural institutions to operate in urban areas. As a result credit growth reached 95 percent (Suiwah 2009).2007: Ceilings placed on bank lending to finance share purchases, and an embargo on bank financing of banks’ security trading affiliates.2008: SCIC established

Chapter 5: Institutional Reform in Vietnam 121
Source: Unless otherwise stated Leung (2009), Nguyen Xuan Ngja (2005) and Van Arkadie and Mallon (2003)
The banking system has struggled to mobilise funds from the Vietnamese population. According to the World Bank in 1995 the banks raised only one third of total funding requirements (World Bank 2009) SOCBs borrowed the remaining two thirds from the SBV and foreign banks (Nguyen Xuan Nghia 2005). Van Nhu Dang suggests that banks generally refused to make the effort to tap into the savings of the majority of the population. Small firms and households relied on the substantial informal finance sector:
‘In brief, what went wrong in the financial sector in Vietnam was that the banks, instead of being an intermediary fund from savers to its best users, only acted as a pawn-shop for private borrowers and as a credit distributor for SOEs.’
(Van Nhu Dang 2003, p. 55)
By 2008 the only ten percent of the population were estimated to have a bank account (Leung 2009). Nevertheless, Bank deposits as a share of GDP doubled between 1990 and 2000 (from ten to twenty percent), and bank credits from 13 to 25 percent. There were also substantial changes in the proportion of loans to the private sector. By the mid-2000s the private sector received 60 percent of SOCB credit. More recently there has been an increase in the number of private banks, many associated with SOEs. In 2007 fifteen SOEs submitted banking applications. Three were granted in 2008 (Leung 2009).
Another recent and accelerating trend is foreign banks. There are, at the time of writing, three foreign banks operating in Vietnam: Standard Chartered, HSBC and ANZ. Vietnamese banks have also been taking on ‘strategic investors’. By 2008 five out of the ten largest JSBs had taken on a foreign strategic investor (Bank 2009). The unofficial financial system has always been important in Vietnamese economic life. Rather than diminish in the face of recent reform, it appears to be as significant as ever. Figure 4
2008: Stabilization package, aimed at tightening bank liquidity and raising bank deposit rates.

Chapter 5: Institutional Reform in Vietnam 122
illustrates the amount of cash (VND and foreign currency) circulating outside of the banking system.
Figure 4: Cash in Circulation Outside the Banking System (%)
0%
10%
20%
30%
40%
50%
60%
70%
80%
90%
1996
1997
1998
1999
2000
2001
2002
2003
2004
2005
2006
2007
2008
2009
2010
2011
Source: IFS 2011
Thirty eight billion dollars worth of gold and foreign exchange is currently estimated to reside in private houses, businesses and gold shops. This compares to USD 26 billion worth within the banking sector.
5.6. Stock Market Reforms
There are now, in effect, four stock markets in Vietnam. The Ho Chi Minh City Securities Trading Centre was established in July 2000 with two stocks and a market capitalisation of USD 31.5 million. It was upgraded to the Ho Chi Minh Stock Exchange (HOSE) in August 2007. The Hanoi Stock Trading Centre (HASTC) was opened in March 2005. A parallel, informal, market, the ‘Over the Counter’ or OTC market developed over the course of the decade. In 2009 in an attempt to bridge the gap between the OTC and the HOSE and HASTE a fourth, the UNCOM, more tightly controlled than the OTC was established. There are currently nearly two thousand stocks listed on the OTC market.

Chapter 5: Institutional Reform in Vietnam 123
Both the HOSE and the HASTC are supervised and managed by the State Securities Commission, part of the Ministry of Finance. Companies can list in Hanoi if they have been profitable for one year and in Ho Chi Minh Minh for three years. The State Capital Investment Corporation (SCIC) represents the State as an investor where the state retains a majority interest in SOEs. Approximately twenty percent of equity stock is owned by foreigner investors. The Vietnamese Stock Exchange is scheduled to equitize and go public in 2010. There are approximately one hundred private security companies trading. Many are small, although a few are backed by foreign partners.
5.7. Foreign Investment
To raise capital, upgrade domestic enterprises and drive the industrialisation process Vietnam turned to foreign investment. To some degree Vietnam has always been been dependent on foreign capital and technology. By the late 1980s it had to find a way to replace the Soviet Union as the source of investible funds and technology. The key policy tools were trade agreements which also sought to make it easier for foreign firms to establish plant and operate in Vietnam:
‘WTO accession in early 2007 is the latest significant step in the process of legal and economic reform. In debate in Vietnam on potential WTO impacts, discussion quickly moves from tariff commitments to finance and insurance, telecommunications, wholesale and retail trade, and energy, where foreign firm operation in Vietnam rather than cross border trade is in focus. We keep this in mind as we move on to review existing modelling of Vietnam’s trade agreements.’
(Abbott et al. 2009. p. 347)
The 1987 Law on Foreign Investment (revised in 1990, 1992, 1996 and 2000) first codified the rights of foreign firms settling in Vietnam. Changes in the law have tended to increase the rights of the foreign investor and close the policy gap between domestic and foreign investors. According to the Vietnamese Central Institute for Economic Management (CIEM) changes in the law are a response to an increasing appreciation of

Chapter 5: Institutional Reform in Vietnam 124
the importance of FDI to the Vietnamese economy, increased competition for FDI in the region and international commitments (Nguyen Thi Tue Anh et al. 2006). Key developments included making it easier for FIEs to develop greenfield projects, the removal of foreign currency restrictions, relaxing constraints and fees relate to repatriation of profits and increasing the areas in which foreigners can invest including the proportion of equity in Vietnamese companies. Recalling Vietnam’s objective to create a ‘multi sector’ economy the IX Party Congress in 2001 classified the Foreign Invested Sector as ‘one of the six sectors of the economy’ (Nguyen Thi Tue Anh et al. 2006). This marked a change in official thinking. For much of the 1990s the objective was for FDI to bring capital, technology and managerial skills to the domestic sector through the medium of the joint venture. The 2001 proclamation acknowledged that the operation of foreign firms within Vietnamese borders was an end in itself. Throughout the 2000s the GoV has officially sought to attract high technology firms and large multi-nationals, with little active though given to the transfer of technology or other positive spillovers (Penrose et al. 2010).
Vietnam was an important destination for FDI through the 1990s. Masina (2002) argues that FDI inflows were ‘disproportionately high considering the limited dimensions of the national economy’. In 1996 for example, foreign investments in Vietnam were higher than India, South Korea, Taiwan and Thailand. As a percentage of GDP inflows were higher than the regional average (Masina 2002). Beresford (2008) points to the significance of the East Asia bubble in the 1990s to levels and types of investment in Vietnam. Across the region companies were investing in real estate and other speculative projects. Vietnam was no exception. Real estate investments comprised 40 percent of total investments in 1995, 42 percent in 1996 and 7.6 percent in 1997. Investments in industry also declined (Masina 2002). Moreover, FDI in Vietnam was predominantly regional in origin. Its decline in the late 1990s was due largely to reduced outflows from regional investors, and not necessarily a function of Vietnamese policy. Despite fears following the Asian Crisis accession to the WTO and other trade agreements seems to have attracted further inflows of direct and indirect foreign investment. Before the global financial crisis and Vietnam’s own problems in 2007/2008 foreign direct investment was over USD 29 billion. However, again a high proportion is in real estate and other

Chapter 5: Institutional Reform in Vietnam 125
speculative projects. For example, in 2008 three quarters of total registered FDI comprised of eight large projects, six of which were large property investments (Harvard 2008).
5.8. Conclusion
Since the late 1980s and early 1990s a series of far reaching reforms referred to as Doi Moi have brought profound and far reaching change to the Vietnamese economy. The pace of reform accelerated once Vietnam acceded to the World Trade Organisation in 2007. Reforms of relevance to this thesis concern the liberalisation of the banking sector, the development of stock markets in Hanoi and Ho Chi Minh City and the reform of the state owned and private enterprise sectors. The mono-banking system, the basis of the command economy, was dismantled. In its place increasingly autonomous state owned banks now operate side by side with private joint stock banks and foreign owned banks. State owned enterprises deemed to be unsustainable were liquidated or merged with others, and firms in similar sectors were brought under the umbrella of ‘General Corporations’. A series of ‘enterprise laws’ gradually ensured that most state owned enterprises were subject to the same regulatory system as private enterprise. Although the state retained an ownership share in many firms most were gradually granted increased autonomy, albeit with some constraints. Restrictions on private enterprise were also lifted, and reforms set about encouraging the development of the private sector. Accession to the WTO also coincided with relaxations on foreign capital flows, and the development of stock markets in Hanoi and HCMC. After 2007 the Vietnamese economy, whilst still dominated by the state sector, saw the emergence of an increasingly dynamic private sector, a more autonomous state owned sector, a liberalised finance sector and, as the following chapter will demonstrate, substantial inflows of foreign capital. All of these factors combined, it will be argued, marked the beginning of a new chapter in Vietnam’s economic development and presented firms with the opportunity to adapt their financial strategies.
6.

126
Chapter 6: Vietnam - Flow of Funds
6.1. Introduction
This chapter will present a flow of funds analysis of Vietnam, a fast developing economy undergoing a period of financial development, in which the state has intervened heavily in the enterprise sector. The objective of the chapter is to explore the ideas developed in Chapters 3 and 4. Specifically: the implications of state ownership as a means to overcome the absence of private entrepreneurs; the funding and financing of state enterprise in a period of financial liberalisation; and the impact of financial development on the private sector.
The chapter will be organised as follows. Sections 6.2 and 6.3 will present a flow of funds analysis of Vietnam, arguing that a combination of domestic reforms (as outlined in Chapter 5) and foreign capital inflows have created three distinct periods, each with a different set of financial flows. Sections 6.3.1 to 6.3.3 look more closely at the banking and financial sector. Section 6.3.4, making use of Government Statistics Office (GSO) enterprise survey looks more closely at the firm sector, showing how different firms responded to financial development. Section 6.4, using a World Bank Survey and other studies will look more closely at smaller, private firms. Section 6.5 concludes.
6.2. Flow of Funds
Flow of Funds (FoFs) accounting depicts the flow of financial instruments between sectors, which in turn enables analysis of how sector deficits are financed and how surpluses are used. The top part of flow of funds matrices typically represent income and expenditure flows. The bottom part of the matrix shows balance sheet flows. The columns represent the key economic sectors: Households, Productive Firms, Commercial Banks, the Government and the Central bank. Both rows and columns must sum to zero. The zero-sum rule represents the budget constraint for each sector, describing how ‘the balance between flows of expenditure, factor income and transfers generate counterpart changes in stocks of assets and liabilities’ (Godley and Lavoie 2007). Everything comes from somewhere and everything goes somewhere. A negative sign indicates a flow of

Chapter 6: Vietnam - Flow of Funds 127
funds from the sector, and a positive a flow to the sector. Uses of flows (a negative sign) represent the purchase of a consumption good or financial asset. Sources of funds represent receipt of a money flow from the sale of a good or asset.
Flow of funds analysis has been used in the study of developing countries since at least the 1950s, however, more recently its use has been limited. In the 1990s a number of economists exploring the implications for post-Keynesian ideas in developing countries adopted FoFs models. For instance John Dawson and Stephen Everhart looked at the impact of twin deficits in Kazakhstan (Dawson and Everhart 2000), Stephen Peachey used FoFs analysis to look at the early years of economic transition in Romania (Peachey 2000); Anna Kerekes and John Holsen looked at fiscal imbalances in Hungary and Russia respectively (Kerekes 2000) (Holson 2000); and Lin and Schramm looked at China (Lin and Schramm 2006).
Flow of funds analysis, whilst extremely useful, has some limitations. It is difficult to determine causal relations between data. Flow of Funds is developed from national accounts identities, which are true by definition. As a result any interpretation of FoFs is dependent on the theory employed. In most countries, and particularly developing countries there are data limitations. Ideally actual values at the time of the transaction should be recorded. Often, however, transactions are derived from changes in balance sheet values and the prices of assets are rarely recorded at actual market value. Data are suspect and incomplete. Financial data, in particular, poses a number of problems. Firms are reluctant to reveal too much about the state of business, and banks often have problematic reporting procedures. Smuggling, off balance sheet activities and ‘informal’ markets mean that many transactions are unmonitored and unreported. All of these problems plague Vietnam. Nevertheless, the data are of sufficient quality to provide in, albeit broad brush strokes, the key trends of the last decade or so.
A further problem, that also applies to Vietnam, is that many countries, particularly developing countries, do not break down data into required sectors or units. For example, the enterprise sector includes all enterprises, regardless of ownership, size or sector. Similarly, financial instruments might be grouped together. Nevertheless, despite these limitations FoFs analysis can still shed light on the workings of developing countries:

Chapter 6: Vietnam - Flow of Funds 128
‘In developing economies, where markets are more fragmented, and securities markets are invariably thin and illiquid, prices provide much less useful policy information. More information of quantities, particularly on the flow of funds, would be very valuable for policy makers. Thus, the flow of funds could play an important role in developing countries to aid the study of financial sector development and resource mobilization issues so as to identify the effects of financial sector policies for promoting poverty and reducing economic growth’.
(Green et al. 2002, p.1)
This thesis in particular, is more interested in the broad trends of the developmental process in Vietnam.
The methodology adopted in this chapter is closely based on the work of John Dawson who was a champion of flow of funds analysis in developing countries. In an analysis of the impact of the Asian crisis on Thailand Dawson demonstrated that it is possible to develop a basic flow of funds using the IMF’s International Finance Statistics (IFS)44 and Government Financial Statistics (GFS). Unfortunately, Vietnam no longer adheres to the IMF’s requested format for gathering and presenting National Accounts data45. As a result government statistics are taken from various IMF Article IV publications and statistical appendices. In these the IMF estimates its preferred figures, and these are used to construct government accounts. The approach is to build a series of worksheets, each representing one sector over the time period in question46. Because of the aggregation of the data it is only possible to assemble data for the Government, the Central Bank, Deposit Banks, the Rest of the World (RoW) and the Private Sector. The private sector
44. The most recent data (June 2012) can be downloaded from http://esds80.mcc.ac.uk/wds_ifs/TableViewer/
tableView.aspx?ReportId=41222.
45. Personal correspondence with IMF representative in Vietnam.
46. The worksheets can be found in Appendix ?

Chapter 6: Vietnam - Flow of Funds 129
includes households, firms and any other units not represented elsewhere. This is obviously problematic, particularly for this study.
To attempt to overcome the problem this chapter adopts a number of strategies. The IMF Article IV for Vietnam includes data for bank lending by bank ownership type. It also breaks down lending by sector. The IMF published Article IVs for Vietnam in 2006, 2008 and 2012. This data will be used in Section 3 of this chapter. Recently a number of banks have published annual reports and financial statements on their websites. Many of these give further details of sources of deposits as well as loan portfolios. Where appropriate such data will be used to shed more light on lending practises.
The General Statistics Office (GSO) of Vietnam publishes a range of statistics. Unfortunately, it does not list financial data. However, it does publish data on investments by sector and ownership type. Investment differs from gross fixed capital formation, and cannot be used as a direct substitute. Also under the auspices of GSO Vietnam undertakes an annual enterprise survey, that collects data for ownership of assets and liabilities. The survey breaks down ownership further, by size (in terms of assets, revenues and employment) and by ownership type. The Non-State sector is further broken down into a number of sub-categories.
The World Bank has published the data from two enterprise surveys in Vietnam, one in 2006 and one in 2009. The survey covers predominantly small and medium sized enterprises, and provides further insight into the financing and funding behaviour of firms.
6.3. Vietnamese Flow of Funds
This section will present flow of funds analysis based on the technique adopted by John Dawson in his analysis of the impact of the Asian crisis on the Thai economy (Dawson 2004)47. Figure 5 illustrates gross fixed capital formation (GFCF) in Vietnam, gross domestic savings and the savings of the foreign sector (defined, after Dawson, as the Vietnamese current account deficit with sign reversed). Unfortunately, it is impossible to
47. See Appendix 6 for worksheets used to derive Figures 5 to 15.

Chapter 6: Vietnam - Flow of Funds 130
begin earlier than 1996. Nevertheless, it is possible to find data for all variables between 1996 and 2011.
Over this period annual gross fixed capital formation, as a percentage of GDP, rises at a relatively constant rate, increasing by approximately ten percentage points. The split between domestic and foreign funding, however, oscillates over the same period. Figure 5 suggests three distinct periods that correspond to internal reform and external events. Until 1999 total investment exceeds domestic savings, leading to a deficit with the rest of the world (RoW). Following the Asian crisis the annual rate of capital accumulation steadies at about 25 percent of GDP; the fall in foreign saving is countered by a rise in domestic savings. Over the next few years, as Vietnam embarks on another round of reforms, foreign savings show positive growth, as does the rate of capital accumulation. Accession to the WTO in 2007 brought forth a large inflow of foreign funds in the form of both direct and indirect investment, which corresponds to a fall in domestic savings and a rise in investment.
Figure 5: Gross Fixed Capital Formation and Savings (% of GDP)
Source: International Financial Statistics (IFS)
-10%
0%
10%
20%
30%
40%
50%
1996
19
97
1998
19
99
2000
20
01
2002
20
03
2004
20
05
2006
20
07
2008
20
09
2010
20
11
!"#$%&'()(& *$+",$%&-$./,01& 2"3&-$./,01&

Chapter 6: Vietnam - Flow of Funds 131
Figure 6 represents fixed capital formation and savings for three broad sectors: Government, the rest of the world and the private sector, which is a residual and includes both households and firms. The Government and private sector also include the net lending position. As the rest of the world does not actively carry out investments only the net lending position is represented. Figures 6, 7 and 8 illustrate the three periods in greater detail.
Figure 6: Government FCF and Net Lending (% of GDP)
Source: International Financial Statistics (IFS), IMF Article IV and IMF Statistical Appendix48, GSO National Accounts Statistics49
In the late 1990s Gross Fixed Capital Formation was dominated by the private sector. Government investment remained at approximately five percent of GDP, with little change in the government deficit. Private sector investment, on the other hand, grew faster than savings suggesting a private sector deficit with the RoW. The decline in foreign investment, attributable to the impact on the Asian crisis on the South East Asian
-10%
-5%
0%
5%
10%
15%
1996
19
97
1998
19
99
2000
20
01
2002
20
03
2004
20
05
2006
20
07
2008
20
09
2010
20
11
!"!# $%&'()# *+,#-+(.'()#
48. IMF Article IV 2012, 2010, 2008, 2006. IMF Statistical Appendix for Vietnam 1998, 1999, 2000, 2002,
2003, 2006, 2007. Accessed at http://www.imf.org/external/country/vnm/index.htm.
49. http://www.gso.gov.vn/default_en.aspx?tabid=468&idmid=3, accessed June 22nd 2012.

Chapter 6: Vietnam - Flow of Funds 132
region appears to have prompted an increase in government investment, with a steady expansion of the deficit as a result. The net lending positions of the other two sectors suggest the deficit was funded first by the private sector, which achieved a surplus following a reduction in imports by foreign firms, and then the RoW, as FDI recovered.
The crisis following WTO accession triggered an increase in government investment, which, along with foreign savings, financed private sector capital accumulation. All three sectors are now approaching a zero net lending position, with the private sector apparently in surplus, the result of a decline in investment rather than an increase domestic savings, corresponding to a concomitant fall in foreign funding.
Figure 7: Private Sector FCF, Saving and Net Lending (% of GDP)
Source: International Financial Statistics (IFS), IMF Article IV and IMF Statistical Appendix, GSO National Accounts Statistics. Own calculations.
Rest of the world net lending, the inverse of the current account deficit, closely follows flows of foreign direct and indirect investment (Figure 8), which in turn reflect the response of foreign, particularly regional investors to first the Asian crisis, then Vietnam’s accession to WTO and most recently concerns over the Vietnamese economy, and the impact of the global financial crisis.
-15% -10% -5% 0% 5%
10% 15% 20% 25% 30% 35% 40%
1996
19
97
1998
19
99
2000
20
01
2002
20
03
2004
20
05
2006
20
07
2008
20
09
2010
20
11
!"!# $%&'()# *+,#-+(.'()#

Chapter 6: Vietnam - Flow of Funds 133
Figure 8: RoW Net Lending (% of GDP)
Source: International Financial Statistics (IFS)
Figure 9 illustrates the dramatic increase in the inflow of portfolio capital in the lead up to and following Vietnam’s accession to WTO. Investors sought value in the Hanoi and HCMC stock markets after the Government increased the proportion of domestic equity foreign investors could hold, and the drive to equitise state owned enterprises saw an increase in the number of firms listed on both stock exchanges between 2005 - 2007.
-10% -5% 0% 5%
10% 15% 20% 25% 30% 35% 40%
1996
19
97
1998
19
99
2000
20
01
2002
20
03
2004
20
05
2006
20
07
2008
20
09
2010
20
11
!"#$%"&'(&)$
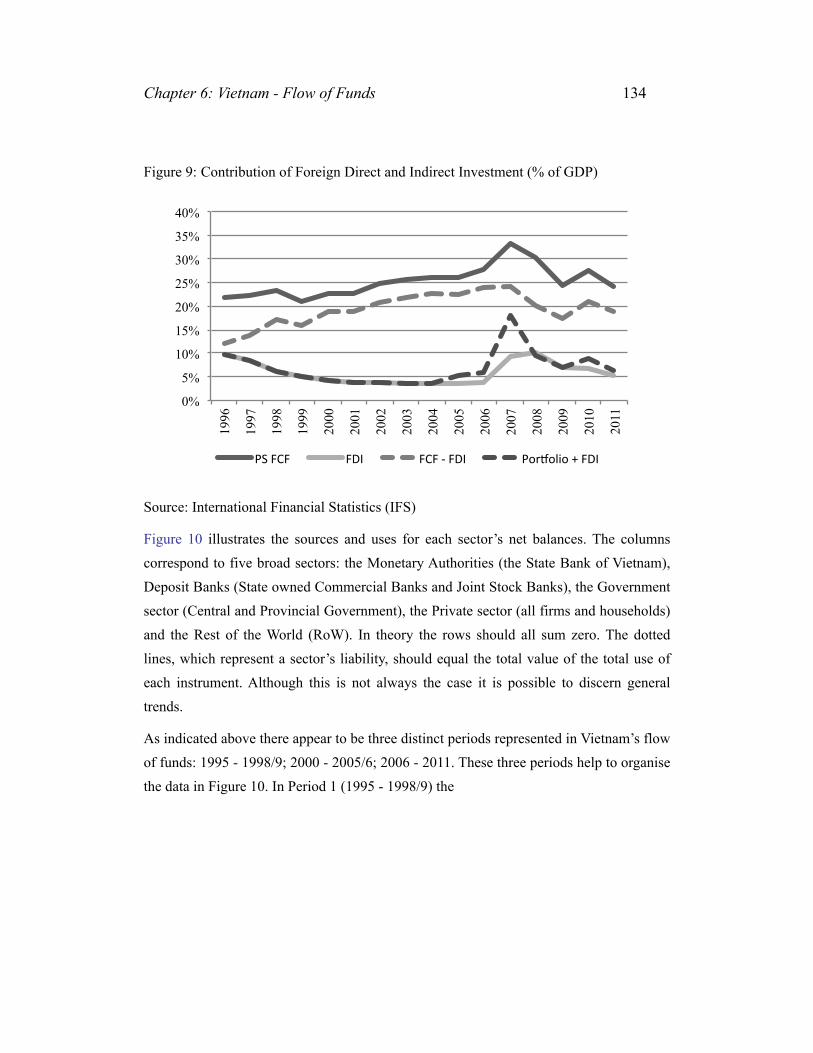
Chapter 6: Vietnam - Flow of Funds 134
Figure 9: Contribution of Foreign Direct and Indirect Investment (% of GDP)
Source: International Financial Statistics (IFS)
Figure 10 illustrates the sources and uses for each sector’s net balances. The columns correspond to five broad sectors: the Monetary Authorities (the State Bank of Vietnam), Deposit Banks (State owned Commercial Banks and Joint Stock Banks), the Government sector (Central and Provincial Government), the Private sector (all firms and households) and the Rest of the World (RoW). In theory the rows should all sum zero. The dotted lines, which represent a sector’s liability, should equal the total value of the total use of each instrument. Although this is not always the case it is possible to discern general trends.
As indicated above there appear to be three distinct periods represented in Vietnam’s flow of funds: 1995 - 1998/9; 2000 - 2005/6; 2006 - 2011. These three periods help to organise the data in Figure 10. In Period 1 (1995 - 1998/9) the
0%
5%
10%
15%
20%
25%
30%
35%
40% 19
96
1997
1998
1999
2000
2001
2002
2003
2004
2005
2006
2007
2008
2009
2010
2011
!"#$%$# $&'# $%$#(#$&'# !)*+),-)#.#$&'#

Figure 10: Sector Uses and SourcesCentral Bank
-10%
-5%
0%
5%
10%
15%
1997
1998
1999
2000
2001
2002
2003
2004
2005
2006
2007
2008
2009
2010
2011
!"#$%&#!'()*+#
-5%
-3%
-1%
1%
3%
5%
7%
9%
11%
1997
1998
1999
2000
2001
2002
2003
2004
2005
2006
2007
2008
2009
2010
2011
!"#$%&#'(&)#
0%
5%
10%
15%
20%
25%
30%
35%
40%
1997
1998
1999
2000
2001
2002
2003
2004
2005
2006
2007
2008
2009
2010
2011
!"#$%&'(#)*+,-#
Deposit Banks
-10%
-5%
0%
5%
10%
15%
1997
1998
1999
2000
2001
2002
2003
2004
2005
2006
2007
2008
2009
2010
2011
!"#$%&'()*#+,-(./#
-5%
-3%
-1%
1%
3%
5%
7%
9%
11%
1997
1998
1999
2000
2001
2002
2003
2004
2005
2006
2007
2008
2009
2010
2011
!"#$%&#!'()#
-5%
5%
15%
25%
35%
45%
55%
1997
1998
1999
2000
2001
2002
2003
2004
2005
2006
2007
2008
2009
2010
2011
!"#$%&'()*#+%*,&)#
0%
5%
10%
15%
20%
25%
30%
35%
40%
1997
1998
1999
2000
2001
2002
2003
2004
2005
2006
2007
2008
2009
2010
2011
!"#$%&'(#)*+,-#
Government
-12%
-7%
-2%
3%
8%
13%
1997
1998
1999
2000
2001
2002
2003
2004
2005
2006
2007
2008
2009
2010
2011
!"#$%&'$(&)*+),$
-5%
-3%
-1%
1%
3%
5%
7%
9%
11%
1997
1998
1999
2000
2001
2002
2003
2004
2005
2006
2007
2008
2009
2010
2011
!"#$%&'($
-5%
5%
15%
25%
35%
45%
55%
1997
1998
1999
2000
2001
2002
2003
2004
2005
2006
2007
2008
2009
2010
2011
!"#$%&'#()*$+&*,')$
Private Sector
-12%
-7%
-2%
3%
8%
13%
1997
1998
1999
2000
2001
2002
2003
2004
2005
2006
2007
2008
2009
2010
2011
!"#$%&'()*(
-5%
5%
15%
25%
35%
45%
55%
1997
1998
1999
2000
2001
2002
2003
2004
2005
2006
2007
2008
2009
2010
2011
!"#$%&'()"'*#&(
0%
5%
10%
15%
20%
25%
30%
35%
40%
1997
1998
1999
2000
2001
2002
2003
2004
2005
2006
2007
2008
2009
2010
2011
!"#$%&'()*%+#(,-.'/(
RoW
-12%
-7%
-2%
3%
8%
13%
1997
1998
1999
2000
2001
2002
2003
2004
2005
2006
2007
2008
2009
2010
2011
!"#$%&$
-10%
-5%
0%
5%
10%
15%
1997
1998
1999
2000
2001
2002
2003
2004
2005
2006
2007
2008
2009
2010
2011
!"#$%"&'()*$+,-(./$
-5%
-3%
-1%
1%
3%
5%
7%
9%
11%
1997
1998
1999
2000
2001
2002
2003
2004
2005
2006
2007
2008
2009
2010
2011
!"#$%"&$'()*$
-5%
5%
15%
25%
35%
45%
55%
1997
1998
1999
2000
2001
2002
2003
2004
2005
2006
2007
2008
2009
2010
2011
!"#$%&'()*+$,&+-'*$

Chapter 6: Vietnam - Flow of Funds 136
private sector is in deficit to the rest of the world. The government is in balance, with minimal increases in debt to either the private or foreign sectors. Foreign savings enters Vietnam as reserves held in the banking sector and State Bank and as direct investment in the private sector. Foreign reserves appear to have been used to run down the government’s debt with the State Bank and the banking sector. The remainder is extended as credit to the private sector via the banking system. Nevertheless, the growth in private sector credit remains below five percent of GDP until 1998.
In the second period (2000 - 2005/6) Vietnam runs a (slight) balance of payments surplus with the rest of the world as firms reduce imports. Increased reserves lead to an increase in the quantity of broad money and quasi money. Foreign direct investment falls as government investment and government lending to the private sector increases. There is also a steady increase in private credit, despite the reduction in foreign lending. This stems directly from the banking sector, and continues despite the continued private sector surplus. The government deficit is now primarily funded from foreign debt. The Asian crisis also triggers rapid and deep reforms of the banking system and the enterprise sector. The impact of these reforms will be discussed below.
The third period begins with anticipation of Vietnam’s accession to the World Trade Organisation (WTO) in January 2007. The private sector’s net lending position reverses relative to that of the rest of the world. A fall in the relative rate of growth of domestic saving corresponds with an increase in foreign funded investment. Vietnam also experiences dramatic increases in portfolio investment, which, unsterilized, corresponds to an increase in the money supply. However, an increase in bank credit also accounts for a large proportion of private credit. Figure 10 indicates that the increase in credit does not fully translate to an increase in real investment. As will be discussed below, a sizeable proportion of credit expansion funded investments in the stock markets, and much real sector investment was in the real estate market.
The boom, triggered by foreign inflows, and leading to extensive capital market, real estate and price inflation created a general economic crisis for Vietnam in 2008 - 2011. The period corresponds to a decline in private credit and foreign inflows as FDI grows wary, and foreign export markets decline. The government, in response to falling

Chapter 6: Vietnam - Flow of Funds 137
investment and general distress sought to stimulate the economy, generating domestic debt.
6.3.1. Finance and Banking
Underlying the flow of funds analysis is institutional change in the banking and finance system, that correspond to a process of financial deepening as measured in terms of the growth of deposits and the increasing use of other financial instruments.
Figure 11: Deposit Bank Credit and Money (% of GDP)
Source: International Monetary Fund, Staff Reports for Article IV Consultations for Vietnam, 1999 to 2012.
Despite the growth in a number of financial markets, Vietnam remains a predominantly bank based system, with deposits and loans as a proportion of GDP doubling between 2002 and 2008. Even so, only between ten and thirty percent of the population make use of the banking system, with the majority of bank users living in urban areas (Leung 2009). The remainder of the sector has shown signs of development, but remains relatively small. Insurance and pension funds have remained stable as a proportion of
0%
5%
10%
15%
20%
25%
30%
35%
40%
1997
1998
1999
2000
2001
2002
2003
2004
2005
2006
2007
2008
2009
2010
2011
!"#$%&'%( )*"+&'(

Chapter 6: Vietnam - Flow of Funds 138
GDP. The bond market has grown, but as will be discussed below, there are limited secondary markets. Like the stock market it grew substantially in 2007, partially as a result of changing regulation and increased confidence in Vietnam as a response to its accession to WTO.
Figure 12: State Owned Commercial Bank Loans and JSB Loans (% of GDP)
Source: International Monetary Fund, Staff Reports for Article IV Consultations for Vietnam, 1999 to 2012.
-10%
-5%
0%
5%
10%
15%
20%
25%
30%
35%
1997
1998
1999
2000
2001
2002
2003
2004
2005
2006
2007
2008
2009
2010
2011
!"#$%&'"#(% )*+!%&'"#(% *,-./%!"#$%&'"#(%

Chapter 6: Vietnam - Flow of Funds 139
Figure 13: Total Bank Loans to SOEs and Non-State Sector (% of GDP)
Source: International Monetary Fund, Staff Reports for Article IV Consultations for Vietnam, 1999 to 2012.
The crisis appears to have hit the SOE sector the hardest. This was due to a cap on credit growth, particularly to the SOE sector, that is regarded to be the primary culprit for speculative investments between 2007 and 2009. A number of SOEs have also been restructured, with the state holding less than fifty percent, suggesting a further reason for the decrease in credit growth.
-10% -5% 0% 5%
10% 15% 20% 25% 30% 35% 40%
1997
1998
1999
2000
2001
2002
2003
2004
2005
2006
2007
2008
2009
2010
2011
!"#$%&'"&()*%& !"#$%&'"&)'+,-&

Chapter 6: Vietnam - Flow of Funds 140
Figure 14: SOCB Loans to SOEs and Non-State Sector (% of GDP)
Source: International Monetary Fund, Staff Reports for Article IV Consultations for Vietnam, 1999 to 2012. Note: Data for non-state and SOE loans 2008-2011 not available.
-30% -25% -20% -15% -10% -5% 0% 5%
10% 15% 20% 25%
1997
1998
1999
2000
2001
2002
2003
2004
2005
2006
2007
2008
2009
2010
2011
!"#$%&'()*% +'%!",*% +'%"-./0%

Chapter 6: Vietnam - Flow of Funds 141
Figure 15: JSB Loans to SOEs and Non-State Sector (% of GDP)
Source: International Monetary Fund, Staff Reports for Article IV Consultations for Vietnam, 1999 to 2012. Note: Data for non-state and SOE loans 2008-2011 not available.
Figures 12 to 15 show flows of bank credit from the banking sector to the private sector. IMF statistics allow a distinction between the state owned banking system and the ‘other’ banking system, which is comprised mostly of joint-stock banks. They also record flows of credit to the state owned system and ‘other sectors’, which includes households and private enterprises. The data are consistent with the three periods discussed above. Bank credit expansion as a percentage of GDP was stable throughout the 1990s. Between 2000 and 2006 flows of bank credit grew by three and a half times, and by two and a half times again between 2006 and 2007. State Owned Commercial Banks (SOCBs) have remained the dominant lenders in the banking system, with loans to ‘other sectors’ showing the highest and most consistent rates of growth. They have also dominated lending to SOEs. Joint Stock Bank lending has also grown, again with the majority of loans to households and private enterprise, who are also the primary recipients of loans during the 2006/7 bubble.
-25% -20% -15% -10% -5% 0% 5%
10% 15% 20% 25%
1997
1998
1999
2000
2001
2002
2003
2004
2005
2006
2007
2008
2009
2010
2011
!"#$%&'()*&+,()-& .,&/,$-& .,&!"#$%&

Chapter 6: Vietnam - Flow of Funds 142
The SBV has played an active role in determining the parameters of credit expansion in Vietnam. The main channel by which state policy has impacted on credit and deposit expansion are moral suasion, reserve requirements, amending regulations for foreign currency deposits and lending requirements. The growth in lending in 1999 was triggered by a administered reductions in lending rates, inspired by Government concern for export orientated and agricultural firms following the Asian crisis. Again in an effort to sustain production and employment the SBV expanded short term credit to SOEs, and reduced bank reserve requirements from ten to seven percent of short term deposits (IMF 1999). According to the IMF the reduction in deposit rates saw a portfolio shift toward foreign currency deposits (IMF 2000). In 2004, this time worried about the expansion of credit growth the government raised reserve requirements with some success (IMF 2004). At the same time an increase in official reserves led to an increase in bank liquidity (IMF 2006). Worried by the growth in bank credit in 2007-2009 the Government imposed limits on bank lending, particularly to large SOEs. However, it is also likely that credit growth slowed because firms cut back on investment in light of a fall in domestic and foreign demand.
The main drivers of credit growth after 2005 appear to have been SOCBs and non-state firms and households. Other bank lending is intimately linked to non-state borrowers, as, to a lesser extent is SOCB lending. Again lending regulations appear to have had some influence on lending patterns. After 1998 SOEs no longer required collateral to borrow from SOCBs. However, non-state firms had to provide security to receive loans up until 2002. From 2002 banks could provide credit to all enterprises on the condition they had been profitable for two years or the enterprise had a feasible project and was financially sound. Nevertheless, banks were still unable to lend to start-ups. Although SOCBs were encouraged to expand lending the loss of state capital remains a capital offence, providing a further brake on bank lending.
A particular problem for the authorities was the impact of the Asian crisis on the banking sector and on firms. Although the crisis was not as destabilising as in other countries a number of firms were dependent on exports and joint ventures with foreign owned firms. SOEs also had social responsibilities, which affected their efficiency and liquidity. They

Chapter 6: Vietnam - Flow of Funds 143
were, for example, expected to maximise employment, as well as take responsibility for employee health care and training. Many firms were as a result unable to meet their obligations to banks in the late 1990s, leading to a dramatic rise in non performing loans (NPLs), which demanded Government intervention. This partly explained the G o v e r n m e n t ’ s d e c i s i o n t o a l l o w
!"#$!"#%!"#&!"#'!"#(!"#)!"#*!"#+!"#
,-./0.#
12/3#
4-3#5/67#
8-/9:;#<-;:/# 5,
#
=;#>/;?#
@6.?:3A-;B#
<C>#
5/67#=#
=D>#
8-.:3A-;B#
S O E s to borrow without collateral. Of the banks joint stock banks appear to have been hit hardest by the increase in non-performing loans. In 1999 two banks collapsed. Most were dangerously undercapitalised, and it was estimated that between 30 and 40 percent of loans in JSBs were non performing (IMF 1999).
Most JSBs were established by one of the major SOCBs, and as Figure 15 illustrates the majority of their lending was to non-state firms, which tended to be smaller. A number of others developed from ‘credit cooperatives’, which were established in rural areas to support agricultural SOEs and farmers. However, these, like other JSBs were undercapitalised and lacked expertise and technology (Leung 2009). Many JSBs found themselves lending to firms to support what was essentially speculative behaviour. The 2007 spike in lending to SOEs was partially funded by JSBs (Leung 2009).
Figure 16 illustrates the exposure of JSBs to real estate loans in 2008. The JSB sector has proved problematic for the authorities, particularly rural credit institutions and state
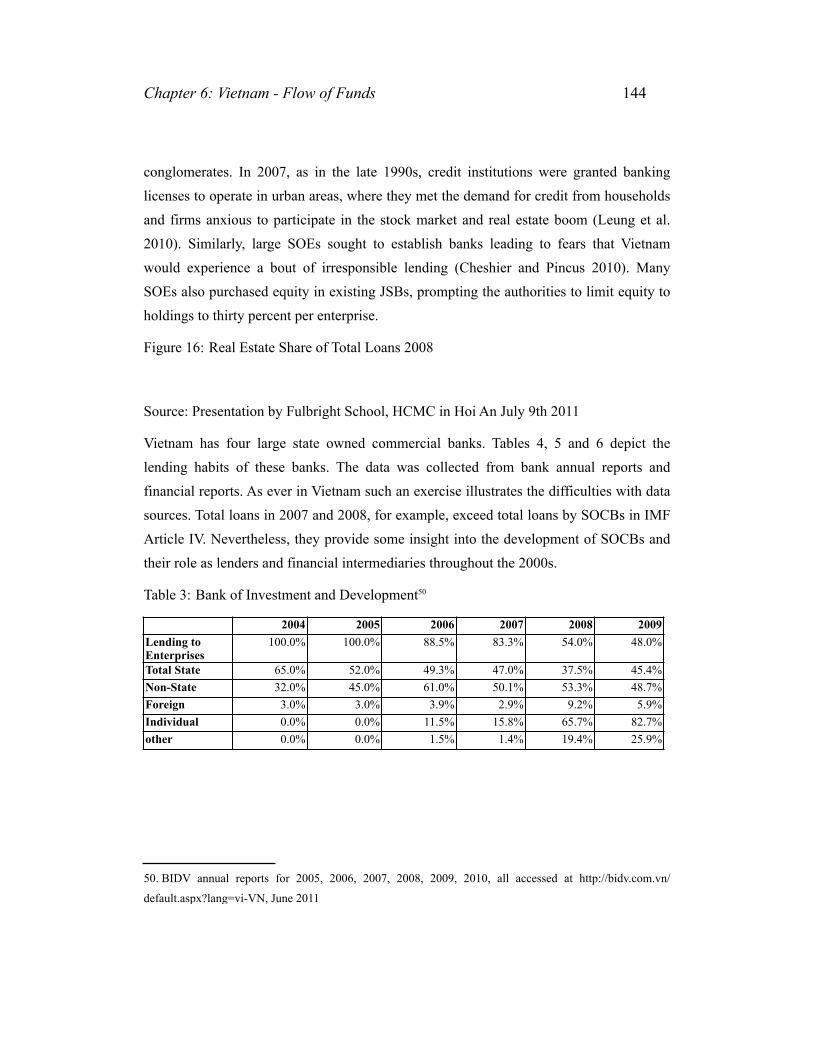
Chapter 6: Vietnam - Flow of Funds 144
conglomerates. In 2007, as in the late 1990s, credit institutions were granted banking licenses to operate in urban areas, where they met the demand for credit from households and firms anxious to participate in the stock market and real estate boom (Leung et al. 2010). Similarly, large SOEs sought to establish banks leading to fears that Vietnam would experience a bout of irresponsible lending (Cheshier and Pincus 2010). Many SOEs also purchased equity in existing JSBs, prompting the authorities to limit equity to holdings to thirty percent per enterprise.
Figure 16: Real Estate Share of Total Loans 2008
Source: Presentation by Fulbright School, HCMC in Hoi An July 9th 2011
Vietnam has four large state owned commercial banks. Tables 4, 5 and 6 depict the lending habits of these banks. The data was collected from bank annual reports and financial reports. As ever in Vietnam such an exercise illustrates the difficulties with data sources. Total loans in 2007 and 2008, for example, exceed total loans by SOCBs in IMF Article IV. Nevertheless, they provide some insight into the development of SOCBs and their role as lenders and financial intermediaries throughout the 2000s.
Table 3: Bank of Investment and Development50
Lending to EnterprisesTotal StateNon-StateForeignIndividualother
2004100.0%
65.0%32.0%3.0%0.0%0.0%
2005100.0%
52.0%45.0%3.0%0.0%0.0%
200688.5%
49.3%61.0%3.9%
11.5%1.5%
200783.3%
47.0%50.1%2.9%
15.8%1.4%
200854.0%
37.5%53.3%9.2%
65.7%19.4%
200948.0%
45.4%48.7%5.9%
82.7%25.9%
50. BIDV annual reports for 2005, 2006, 2007, 2008, 2009, 2010, all accessed at http://bidv.com.vn/
default.aspx?lang=vi-VN, June 2011

Chapter 6: Vietnam - Flow of Funds 145
Table 4: Vietcombank51
Table 5: Vietinbank52
Each bank is traditionally responsible for particular sectors of the economy deemed important by the state. Agribank, is responsible for agriculture and rural areas; the Bank for Investment and Development (BIDV) is responsible for basic infrastructure, Vietinbank for industry and Vietcombank for trade. As such the four banks were central to the Government’s development policy, responsible for policy lending and for taking care of the financial needs of key sectors of the economy. However, over the last decade each of the four banks has adopted more conventional banking operations. Tables 4, 5 and 6 also indicate the changing loan portfolios of banks. The proportion of loans to the state sector is declining, and banks are lending more to ‘individuals’. However, it is likely that many customers are equitised SOEs, and have been reclassified by the banks as limited liability or ‘non state’ companies. Of the four, Agribank remains closest to its roots, lending over half of its total portfolio to farmers and smallholders. Agribank data
Lending to EnterprisesTotal StateNon-StateForeignIndividualOther
2003100.0%
46.0%54.0%0.0%0.0%
-
2004100.0%
42.0%58.0%0.0%0.0%
-
200586.4%
37.7%47.1%1.6%
13.6%-
200682.3%
30.7%49.3%2.3%
17.7%-
200774.0%
46.5%25.5%2.1%
26.0%-
200876.9%
35.6%39.2%2.1%
23.1%-
Lending to EnterprisesTotal StateNon-StateForeignIndividualOther
200488.5%
54.8%11.0%22.7%11.4%0.1%
200586.1%
41.7%37.4%7.1%7.0%6.9%
200677.3%
38.9%24.6%13.8%8.5%
14.2%
200777.6%
48.3%26.5%2.8%9.5%
13.0%
200872.7%
46.9%17.2%8.5%9.6%
17.7%
200967.7%
39.7%19.9%8.1%9.7%
22.6%
51. Vietcombank annual reports for 2005, 2006, 2007, 2008, 2009, 2010. All accessed at http://
www.vietcombank.com.vn/en/About%20VCB.htm, June 2011
52. Vietinbank annual reports for 2004, 2005, 2006, 2007, 2008, 2009, accessed at http://
investor.vietinbank.vn/FinancialReports.aspx, June 2011

Chapter 6: Vietnam - Flow of Funds 146
are only available for 2008 and 200953. According to 2009 figures over ninety percent of lending is to households and individuals. Of these around fifty percent are reported as rural farmers. The remainder is to SOEs and private enterprise also concentrated in rural areas of Vietnam. The banks’ annual reports also suggest a change in lending policy. The 2009 annual report for Vietcombank, for example, claims it was ‘originally established as a specialized bank servicing external economic activities, Vietcombank today has grown into a universal bank with presence in all major cities and provinces throughout the country, as well as branches in Hong Kong and Singapore.’ The change in focus of the banks is also illustrated by the claims in a number of reports that the banks are meeting government targets for lending to small and medium sized enterprise. The four SOCBs also directly fund large state infrastructure projects, or purchase bonds from municipalities, State Owned Enterprises or Economic Groups. In this way banks provide the means for the government to fund infrastructure development and industrial investments. These transfers are included in the IMF accounts, although not in official GoV reports.
6.3.2. Financial Sector
The stock market as a destination for financial investment took off in 2006/2007. A number of factors contributed to the bubble. Accession to WTO brought with it portfolio flows, which in contributing to rising equity prices proved attractive to domestic investors. The Ho Chi Minh City (HCMC) Stock Market Price Index rose by 144.5 percent in 2006 alone, and by another 51 percent in early 2007. A major contribution was tax incentives to firms willing to list on the stock market by the end of 2006. Limits on foreign ownership were also raised from thirty to forty nine percent in 2005. Most of the new listings took place during the last two months of 2006 as companies tried to benefit from tax incentives that were to expire by year end. Total stock market capitalisation went from USD 0.6 billion (one percent of GDP) in 2005 to a peak of US$ 23 billion (34 percent of GDP) by March 2007. Daily stock trading volumes increased from an average of US$10 million in January 2006 to about USD 70 million in late February and early
53. Accessed at http://www.agribank.com.vn/91/848/thu-vien/bao-cao-tai-chinh.aspx, June 2011

Chapter 6: Vietnam - Flow of Funds 147
March 2007 (IMF 2007). The sheer volume of interest is evidenced by the nearly four billion USD of mostly foreign money held by investment firms in search of profitable outlets in 2006 and 2007 (IMF 2007). A further attraction was the anticipation of future equitisation of large state owned enterprises and state owned commercial banks. Figure 8 illustrates the impact of foreign funds on the stock market inflation of 2006/7.
Figure 17: Value of Shares Traded (% of GDP)
Source: World Development Indicators
The official stock market was not the only destination for funds. Until late in the decade the informal market for listed shares was believed to be larger than the formal stock market. A large proportion of the credit expansion found its way to the informal market, which included a large unlicensed stock market conducted in coffee shops, and with the use of web based bulletin boards. An estimated one thousand stocks were traded between over half a million investors. The majority of stocks on all four markets are equitised State Owned Enterprises. Smaller JSBs were the main source of credit sued to purchase equities. According to the IMF some banks were lending up to forty percent of their loan portfolios using stocks as collateral (IMF 2007). In response the SBV raised the risk weighting of loans secured by securities from 100 percent to 150 percent, and moved to
0%
5%
10%
15%
20%
25%
30%
35%
2003
2004
2005
2006
2007
2008
2009
2010
!"#$%&'()*+*&,&-&./0&

Chapter 6: Vietnam - Flow of Funds 148
limit investment by directing banks to reduce this type of lending to no more than three percent of their total loan balances by the end of 2007. The SBV’s Decision 03/2007 issued on January 19 contained new regulations on bank capital adequacy, liquidity ratios, and lending and investment limits, which restricted the scope for new bank lending for the purchase of stocks. In particular: (i) credit institutions were not allowed to extend credit to their securities company affiliates nor grant unsecured loans financing investment or trade in securities; and (ii) the risk weight of securities-related loans was raised from 100 to 150 percent. Credit institutions were given one year to fully conform with the new restrictions (IMF 2007).
The Vietnamese bond market has, legally, been in existence since 1992. However, as Table 5 indicates nearly two decades later it remains small, and the secondary market almost non-existent. In that time only 63 firms have issued a total of 152 bonds, and of these large state owned conglomerates and banks dominate. Electricity Vietnam (EVN), Vinashin, Petrovietnam (PVN) and the Bank of Investment and Development (BIDV) issued 28 percent of bonds but mobilized 48 percent of total funds. Table 5 shows that even of these top five two large economic groups, EVN and Vinashin, dominate.
Table 6: Corporate Bonds
Source: Adapted from Vuong and Tran (2010)
Figure 18 indicates that outside of these firms real estate has proved a significant destination for raised funds. Although it cannot be demonstrated conclusively, concerns over SOE investments suggest that other issues may also have gone to fund similar projects. Activities listed in Figure 18 are based on the reported primary activities of firms, not the actual use of funds.
Issuer
EVNVinashin
BIDVVICPVN
Sub TotalTotal
State Ownership
11101
Listed
00010
Total
151475142152
Value (Mil USD)
734.86660.60472.60284.64219.07
2,371.774,927.49

Chapter 6: Vietnam - Flow of Funds 149
Figure 18: Corporate Bonds by Industry
!"##$%%&'%
()*+*,#%%-'%
.+*/)*0%%12'%
3*45+6"57,"75#%%1'%8)*)*0%%
2'%9:*6"57,;:*%<'%
=#+$%>6"+"#%%-?'%
@"A#56%%B'%
!A)C%.7)$D)*0%-1'%
>$#,"5),6%%-<'%
Source: (Vuong and Tran 2010, p.15)
Of those purchasing bonds the majority are large banks and, more recently, insurance companies and pension funds. The identity of those involved in most exchanges suggests that deals are arranged before bonds are issued.
The weakness of the market can ultimately be attributed to the level of Vietnamese development, and to coordination difficulties among those responsible. Although the development of the stock market and the bond market thus far suggest the bond market might be deep enough, Vietnam has struggled to build the required infrastructure to manage a private debt market. Only recently has the government addressed the problem with the proposed Public Debt Law, however, in practise its success would depend on cooperation among a number of agencies, including the Ministry of Finance, the State Security Commission, the Tax Department and the State Bank (Leung 2009).
6.3.3. Real Estate Investment
The growth in real estate was accompanied by a rapid expansion of the number of firms whose primary activity was real estate. Figure 20 shows the number of firms recorded in

Chapter 6: Vietnam - Flow of Funds 150
annual enterprise surveys between 2000 and 2008. Figure 19 illustrates the growth in real estate investment as a proportion of GDP.
Figure 19: Real Estate Investment (% of GDP)
0.00%
0.50%
1.00%
1.50%
2.00%
2.50%
2002
2003
2004
2005
2006
2007
2008
2009
2010
2011
Source: Gso.gov.vn54
54. Data available at: http://www.gso.gov.vn/default_en.aspx?tabid=471&idmid=3&ItemID=13128

Chapter 6: Vietnam - Flow of Funds 151
Figure 20: Growth in Real Estate Enterprises
0
5000
10000
15000
20000
25000 20
00
2001
2002
2003
2004
2005
2006
2007
2008
Source: (GSO 2010, Part 06)
Whilst many investors claimed they were meeting increased demand for ‘office space’ and urban residential areas the real estate sector in Vietnam was undoubtedly the target of much speculation (Harvard Program Vietnam 2008).
6.3.4. The Enterprise Sector
Early reforms had sought to reduce the reliance of state enterprises on the state (Dang Phong, 2004) and separate SOE financing from state budget expenditures. Ideally all enterprises would borrow capital for investments (Le Dang Doanh 1996). Bereford suggests the GoV was too successful, and SOEs suffered from limited access to capital:
‘The other major source of finance for SOEs came from credit, which, however, provided a progressively lower proportion of their investment. Given generally low profitability, they tended to borrow for working capital rather than for longer-term investments in fixed assets. The structure of interest rates favoured short-term borrowing over long term, partly as a result

Chapter 6: Vietnam - Flow of Funds 152
of risk management by banks and partly because interest rate policy was designed to enable SOEs to survive in the market environment. The latter was not, however, designed in a way that enabled technologically backward firms to upgrade their equipment to globally competitive standards’
(Beresford 2004, p. 56)
Beresford goes so far as to argue that, ‘because of donor pressure’, SOEs were unable to access the credit they required, causing them to cede ground to the private sector and foreign firms (Beresford 2008). Instead, again a result of a donor led strategy, state investment funds were increasingly channelled to infrastructure projects. As a result the SOE sector was reliant on the banking sector and foreign capital. In 1993 SOEs received 55 percent of state investment. By 2000 it had fallen to 14 percent. It is no surprise then, that SOEs began to increasingly rely on self-finance for investments. In terms of SOCB lending, the proportion of credit allocated to SOEs fell from 90 percent in the early 1990s, to 50 percent in 1997 and 40 percent in 2001 (Beresford 2004).
The relationship between the state sector and the banking and government sector can also be estimated. Wolff (1999) calculates the ‘financial relations’ between SOE, banks and the national budget between 1987 and 1994. He demonstrates that after 1990 the SOE sector transferred more to the budget and banks than it received. The net transfer in 1994 was -9.2% of GDP. Table 7 illustrates the net transfer from the Government budget to the SOE sector between 2000 and 2008. Onlending is typically used to finance large infrastructure projects, and SOEs tend to be the major recipients (IMF 2007). As the table indicates only after 2007 and the increased credit growth did the SOE sector as a whole receive more than it contributed.

Chapter 6: Vietnam - Flow of Funds 153
Table 7: Net Transfers of SOE Sector to Banks and Budget
Source: Taxes are reported in the enterprise survey for each year (GSO 2010, Part 06). Onlending is government sanctioned lending through the Development Assistance Fund (DAF) and, after 2005, the Vietnam Development Bank (VDB). The DAF was primarily financed from household savings (via the Postal Savings Postal Company) and Overseas Development Aid (ODA). Onlending and bank credit data are sourced from IMF statistical appendices and Article IV. Own calculations.
Figure 21 provides savings rates for the Government, enterprise and household sectors between 2001 and 2007. The figure illustrates the difficulties inherent in assembling accurate savings data. The private savings rate used in Figure 7 above is a residual after government and RoW savings is subtracted. Unfortunately, accurate estimates of government savings is difficult to establish, largely because until recently the state budget was an official secret, and many expenditures were not published. Government saving in Figure 21 is the sum of government capital expenditure and the government deficit and is the same figure used by the IMF. Like the IMF off balance sheet expenditures are included for some years, so the savings rate differs from estimates using official government figures available from the GSO website55.
The GSO enterprise census provides data for pre-tax profits for the total firm sector, and also by firm ownership and industrial sector. Total profits represent firm savings, and can, in principle be subtracted from private sector savings to arrive at household savings. Figure 21 shows pre-tax profits, and also an estimate for after tax profits, assuming a tax rate of 25% of profits. Two estimates for household savings are also given. The first,
Tax
Onlending
Balance
Bank CreditNet Transfer
2000
7.0%
2.2%
4.7%
3.5%
-1.2%
2001
10.9%
2.2%
8.7%
2.0%
-6.6%
2002
10.7%
2.4%
8.4%
1.8%
-6.5%
2003
8.7%
2.9%
5.8%
2.6%
-3.2%
2004
7.9%
2.4%
5.5%
5.2%
-0.2%
2005
8.1%
2.7%
5.4%
4.6%
-0.8%
2006
7.4%
2.1%
5.3%
3.8%
-1.4%
2007
7.2%
2.1%
5.1%
10.1%
5.0%
2008
5.4%
1.8%
3.6%
5.4%
1.8%
55. Data available at: http://www.gso.gov.vn/default_en.aspx?tabid=468&idmid=3&ItemID=12981

Chapter 6: Vietnam - Flow of Funds 154
falling from 20 percent in 2001 to 8% in 2008 is the residual once after-tax profits are subtracted from total private savings. Whilst it is plausible that household savings did fall between 2005 and 2007, particularly as real incomes rose slower than inflation and household consumption remained relatively constant at around 65 percent of GDP the alternative measure derived from biannual household living standards surveys (LSS) up until 2010 suggest household savings only fell after 2008.
The rather high residual savings rate in 2001 and 2002 is probably partly explained by the fact that many small private enterprises were not registered as such, and so were not surveyed and did not report profits. Similarly, the increase in profits after 2005 will partly be explained increased enterprise registration. Although household savings may well have fallen as a proportion of GDP between 2008 and 2010, it is probably safe to assume it was closer to the LSS estimate between 2004 and 2008 than the residual estimate, suggesting it was somewhere between 12% and 15% of GDP.

Chapter 6: Vietnam - Flow of Funds 155
Figure 21: Firm and Household Savings (% of GDP)
Source: Government Saving: IMF Article IV (Various years) and Statistical Appendix (Various Years) and GSO National Accounts. Firm Saving: GSO Enterprise Survey (GSO 2010, Part 06). GSO Firm Saving - tax: Subtracted 25% of profits, standard corporation tax. Household Saving (residual): Private Sector Saving - Government Saving - Corporate Saving (post-tax). Household Saving (LSS): Biannual Living Standard Surveys 2002-2010: Average income x population - Average expenditure x population. All own calculations.
To further explore the investment and saving behaviour of the enterprise sector it is necessary to derive a figure for investments from the GSO enterprise census. The Government Statistics Office provides a measure of investment that includes Government
0.0%
5.0%
10.0%
15.0%
20.0%
25.0%
2001
2002
2003
2004
2005
2006
2007
2008
2009
2010
!"#$%&#'()$ *'+,$%&#'()$$
*'+,$%&#'()$-./&01$ 22$%&#'()$-+34'56&71$
22$%&#'()$-8%%1$

Chapter 6: Vietnam - Flow of Funds 156
developmental programmes. As Table 8 shows it is approximately five to six percent points of GDP greater than GFCF. However, it has its advantages as GSO breaks the same figure down by firm ownership and by sector.
Table 8: Measures of Investment as a Percentage of GDP
Source: GSO investment figures from http://www.gso.gov.vn/default.aspx?tabid=432&idmid=3, accessed July 2012, GSO Enterprise Survey 2010 Part 06, IFS annual financial statistics for Vietnam56
What is clear is that the figure used will have an impact on any calculation of the savings gap faced by the private sector. The first has the advantage of being verified by the IMF. However, it is a residual, and nowhere broken down into, at the very least, household and corporate constituents. The second depicts a similar trend, and, as a proportion of GDP is of a similar magnitude. It is also broken down by the Government Statistics Office into ‘investment by ownership’, and ‘by sector’. A third measure is derived from from the GSO enterprise census, for which results are available for years 2000 - 2009. Unfortunately, the enterprise survey does not have a figure for investment, or gross fixed capital formation. Instead it lists fixed capital and long term investments as a stock for both sectors and ownership classes. Taking changes in long term investment provides a flow, which can be a proxy for investment. However, it is a valuation of long term assets at a given point in the year, and includes financial investments. Although, the quality of the census is improving annually, there are known to be a number of issues with the quality of the data.
The GSO enterprise sector also provides data for firm profits, and taxes and fees paid to government. Both together are pretax profits. According to Kalecki’s equation in a closed
GFCF - Flow of fundsGSO InvestmentEnt Census Ch Assets
1996
21.8%
25.8%
1997
22.1%
28.3%
1998
23.4%
26.8%
1999
21.0%
26.1%
2000
20.0%
24.6%
2001
20.6%
24.9%
13.5%
2002
21.7%
25.8%
14.2%
2003
22.0%
25.5%
15.2%
2004
22.9%
28.1%
13.8%
2005
21.7%
27.0%
24.8%
2006
26.2%
31.0%
49.0%
2007
32.8%
36.2%
37.0%
2008
29.4%
31.2%
48.9%
2009
25.4%
56. Accessed at http://esds80.mcc.ac.uk/wds_ifs/TableViewer/tableView.aspx?ReportId=48867

Chapter 6: Vietnam - Flow of Funds 157
economy with a balanced budget and no workers’ saving the total will be equal to total investment, and will be split between capitalist consumption and spending. Table 9 shows total profits as a percentage of GDP and as a ratio to total fixed assets.
Table 9: Profits as a Proportion of GDP and Profits / Change in assets
Source: (GSO 2010, Part 06)
Total profits are consistently around 40 percent of GDP, until 2008, which can be attributed to the fall out from the 2007/ 2008 crisis. The reduction in the increase of profits as a proportion of total change in assets (approximately total new investment) can be attributed to the formation and entry of new, particularly small firms, into the economy. As will be demonstrated below profit rates for larger, state firms tend to remain relatively high.
Figure 22 shows profits and investments for the total enterprise sector, and is derived from annual census reports. It has not been possible to access raw enterprise census data as it is not published. A number of books (GSO 2008, 2009, 2010, 2010b) provide aggregated data for ownership classes and sectors.
Profits are pre-tax profits, as they are published. After tax profits, as above, can be estimated to be in the region of 25 percent less. It is difficult to ascertain the impact of taxation, as a significant portion of government tax revenues will constitute demand for the firm sector.
PreTax ProfitsProfits/ ChAssets
2000
40.5%
2001
40.3%
2.99
2002
37.8%
2.67
2003
38.4%
2.53
2004
41.4%
2.99
2005
41.9%
1.69
2006
41.2%
0.84
2007
38.9%
1.05
2008
30.2%
0.62

Chapter 6: Vietnam - Flow of Funds 158
Source: GSO 2010, Part 06
Figure 22 is consistent with other data sources; 2005 - 2008 shows a large increase in investment that does not correspond to an increase in profits. Both profits and investment follow a similar trend between 2001 and 2004, which is approximately consistent with Figure 5. Figure 21, above, suggests that the surplus in Figure 7 can possibly be attributed to a greater share of household savings in private savings. This in turn is probably due to the relatively small size of the enterprise sector and that many enterprises were not registered until after 2004.
Figure 22: Profits and Investment of Total Enterprise Sector (% of GDP)
0%
10%
20%
30%
40%
50%
60% 20
01
2002
2003
2004
2005
2006
2007
2008
!"#$ %&'()$
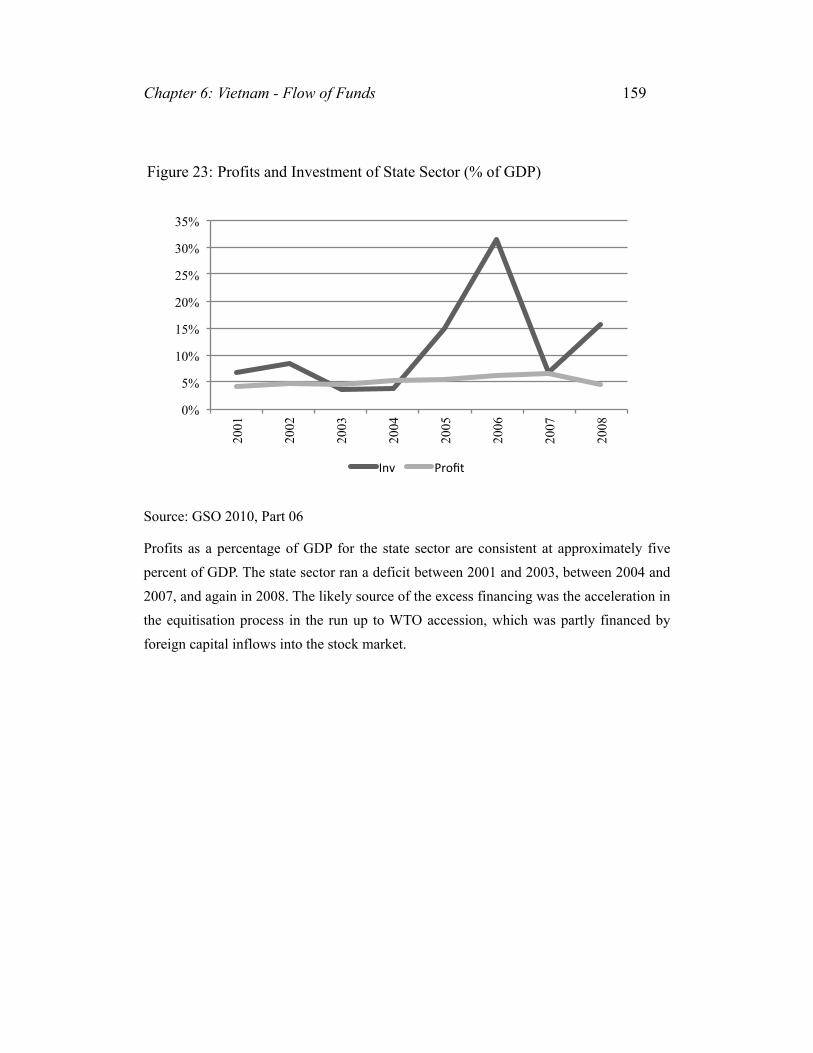
Chapter 6: Vietnam - Flow of Funds 159
Source: GSO 2010, Part 06
Profits as a percentage of GDP for the state sector are consistent at approximately five percent of GDP. The state sector ran a deficit between 2001 and 2003, between 2004 and 2007, and again in 2008. The likely source of the excess financing was the acceleration in the equitisation process in the run up to WTO accession, which was partly financed by foreign capital inflows into the stock market.
Figure 23: Profits and Investment of State Sector (% of GDP)
0%
5%
10%
15%
20%
25%
30%
35% 20
01
2002
2003
2004
2005
2006
2007
2008
!"#$ %&'()$

Chapter 6: Vietnam - Flow of Funds 160
Source: GSO 2010, Part 06
The non-state sector has been in deficit throughout the decade. After 2006 the savings gap widened considerably. Figure 25 enables us to break down the non-state sector further. The first observation is that the breakdown by ownership is consistent with the flow of funds data. Until 2005/6 all sectors with the exception of joint ventures ran only slight deficits. During this period the savings gap was funded by household savings, via the banking system or more informal channels. Most firms relied on retained earnings to finance investments. Recalling Figure 11 credit growth as a proportion of GDP grew at a relatively low level until 2005.
The reforms of 2006/7 appear to have a profound effect on all sectors’ levels of investment and savings gap. It is worth remembering that investments are all long term investments, not just increases in fixed assets. The private sector has the smallest increase. Both forms of joint stock company demonstrate an increase in
Figure 24: Profits and Investment of Non-State Sector (% of GDP)
0%
5%
10%
15%
20%
25%
30%
35% 20
01
2002
2003
2004
2005
2006
2007
2008
!"#$ %&'()$

Chapter 6: Vietnam - Flow of Funds 161
Figure 25: Savings Gap by Firm Ownership (% of GDP) (Source: GSO, Part 06)
Private Companies
0%
5%
10%
15%
20%
25%
30%
35%
2001
2002
2003
2004
2005
2006
2007
2008
!"#$ %&'()$
Foreign Sector
0%
5%
10%
15%
20%
25%
30%
35%
2001
2002
2003
2004
2005
2006
2007
2008
!"#$ %&'()$
Private Ltd Company
0%
5%
10%
15%
20%
25%
30%
35%
2001
2002
2003
2004
2005
2006
2007
2008
!"#$ %&'()$
100% Foreign Sector
-5%
0%
5%
10%
15%
20%
25%
30%
35%
2001
2002
2003
2004
2005
2006
2007
2008
!"#$ %&'()$
JS with State Capital
0%
5%
10%
15%
20%
25%
30%
35%
2001
2002
2003
2004
2005
2006
2007
2008
!"#$ %&'()$
JV Sector
-5%
0%
5%
10%
15%
20%
25%
30%
35%
2001
2002
2003
2004
2005
2006
2007
2008
!"#$ %&'()$
JS without State Capital
0%
5%
10%
15%
20%
25%
30%
35%
2001
2002
2003
2004
2005
2006
2007
2008
!"#$ %&'()$
State/ JV without Oil/ Mining
0%
5%
10%
15%
20%
25%
30%
35%
2001
2002
2003
2004
2005
2006
2007
2008
!"#$ %&'()$

Chapter 6: Vietnam - Flow of Funds 162
financing, as does the foreign sector. However, only joint ventures run a surplus. Few sectors show a marked increase in profits, suggesting that increased investments do not translate to profits in other sectors, and that the trade balance is the primary leakage. The private sector, which is composed primarily of small firms, invested the least as a proportion of GDP, despite having by far the largest population.
After 2006/7 there is a large savings gap in most sectors consistent with the changes in financial institutions and foreign flows. Bank credit, equity investments, foreign inflows - direct and indirect - constitute the largest sources of financing.
Table 10 shows the average size of total fixed and long term assets of firms by by ownership between 2000 and 2008. Although all firm sizes show some increase in size (partly attributable to inflation) state and joint stock companies show the largest increase. The increase in size of the state sector is due to a number of factors. Smaller, loss making firms were liquidated or sold off. Larger firms were recapitalised primarily as a result of equitisation. Joint stock companies with less that 50 percent state capital demonstrate the most dramatic growth in average size. This is also a result of equitisation and improved access to capital. Many firms were large state owned companies that were recategorised following the reduction of the state share to under fifty percent.
Table 10: Average size of ownership types (Bil VND)
Source: GSO 2010, Part 06
AverageStateNon-state enterprisesPrivatePrivate LtdJS with State CapJS without State cap100% foreign capitalJV
20009.739.91.00.31.59.77.452.6153.5
20019.249.11.20.41.515.74.343.3148.1
20028.857.61.30.51.617.83.643.8136.9
20039.068.51.60.61.818.44.644.9163.9
20048.178.31.80.61.926.03.748.0152.7
20058.4
119.11.90.71.922.94.049.5151.9
200610.9214.32.40.82.134.15.859.2158.8
200711.9
249.44.00.92.661.011.960.2157.3
200812.5336.74.91.23.184.513.073.1175.7

Chapter 6: Vietnam - Flow of Funds 163
Table 11 uses liability data from the GSO enterprise survey. Liabilities include more than bank debt, and so don’t correlate with financial data used above. Between 2006 and 2007 both joint stock sectors, as expected, experienced increase in equity as a proportion of total capital. Private and collective firms conversely experience an increase in liabilities, which may indicate increased access to bank credit. The state sector also experiences an increase in equity, also consistent with equitisation.
Table 11: Liabilities/ Total Capital
Source: (GSO 2008, pp. 208-212) and (GSO 2010b, pp. 304-306)
The following graphs tell the same story graphically. The greatest changes in the debt equity ratio over the five year period are, in the ‘private’ firm, and the ‘joint stock with state capital’ firm. The former apparently benefits from an increased access to credit, which probably corresponds to developments in the banking sector. The latter, is the likely outcome of the equitisation process. Otherwise, the debt to equity ratio remains approximately constant.
Total
State
State Central
State Local
Non State
Collective
Private
Private Ltd
JS w State capital
JS w/o State Capital
Foreign
100% foreign
JV
2005
0.70
0.77
0.80
0.54
0.64
0.57
0.42
0.59
0.83
0.69
0.57
0.67
0.43
2006
0.69
0.76
0.79
0.53
0.64
0.59
0.43
0.58
0.81
0.69
0.57
0.66
0.43
2007
0.69
0.77
0.80
0.55
0.63
0.64
0.46
0.56
0.75
0.67
0.60
0.68
0.44
2008
0.68
0.74
0.76
0.56
0.64
0.52
0.53
0.57
0.74
0.67
0.60
0.67
0.46
2009
0.68
0.76
0.78
0.50
0.66
0.60
0.52
0.59
0.79
0.68
0.59
0.64
0.45

Chapter 6: Vietnam - Flow of Funds 164
Figure 26: Liability to Equity Ratio
0.30
0.40
0.50
0.60
0.70
0.80
0.90
1.00
2005
2006
2007
2008
2009
!"#$%& '#$#(&& )*+,$#(&
)*+,$#(&-#.& /'&0&'#$#(&1$2+#$%& /'&03"&'#$#(&4$2+#$%&
5667&8"*(+9:& /;&
Source: (GSO 2008, pp. 208-212) and (GSO 2010b, pp. 304-306)
Figure 27 shows changes in equity in absolute terms over the five year period. It must be remembered the increases also represent equity in new firms, rather than changes in the behaviour of existing firms. Nevertheless, state firms, private limited liability companies and joint stock companies without state capital show the greatest rise. This both represents the equitisation process and increasing ease with which to establish enterprises and seek capital.

Chapter 6: Vietnam - Flow of Funds 165
Figure 27: Total Equity by Sector (Bil VND)
-
100,000
200,000
300,000
400,000
500,000
600,000
700,000
800,000
900,000
2005
2006
2007
2008
2009
!"#"$%% &'()#"$% &'()#"$%*"+%
,!%-%!"#"$%.#/("#0% ,!%-12%!"#"$%3#/("#0% 4556%72'$(89%
,:%
Source: (GSO 2008, pp. 208-212) and (GSO 2010b, pp. 304-306)

Chapter 6: Vietnam - Flow of Funds 166
Figure 28: Total Liabilities by Sector (Bil VND)
-
500,000
1,000,000
1,500,000
2,000,000
2,500,000
3,000,000
2005
2006
2007
2008
2009
!"#"$%% &'()#"$% &'()#"$%*"+%
,!%-%!"#"$%.#/("#0% ,!%-12%!"#"$%3#/("#0% 4556%72'$(89%
,:%
Source: (GSO 2008, pp. 208-212) and (GSO 2010b, pp. 304-306)
The final graph shows the increase in total liabilities. Again the state shows the greatest absolute increase, as firms that are required to remain majority state owned have less access to equity and must rely on debt finance.
Table 12 provides a rough measure of the ability of firms to cover their liabilities with current assets (assets that can be liquidated within one year). State firms are have a significantly lower ratio, particularly when compared to the smaller categories of firm (private and collective firms).

Chapter 6: Vietnam - Flow of Funds 167
Table 12: Current Assets/ Total Liabilities
Source: (GSO 2008, pp. 208-212) and (GSO 2010b, pp. 304-306)
Table 13: Share of Total Revenues
Source: GSO 2007, 2008, 2009, 2010
Total
State
State Central
State Local
Non State
Collective
Private
Private Ltd
JS w State capital
JS w/o State Capital
Foreign
100% foreign
JV
2005
0.93
0.86
0.85
1.00
1.13
1.17
1.59
1.15
0.97
1.10
0.86
0.80
0.97
2006
0.83
0.71
0.69
0.96
1.08
1.14
1.58
1.16
0.93
1.01
0.85
0.77
1.04
2007
0.90
0.77
0.75
1.02
1.07
1.06
1.46
1.21
0.98
0.96
0.91
0.83
1.14
2008
0.86
0.74
0.72
0.96
1.01
1.20
1.25
1.14
0.96
0.91
0.87
0.81
1.06
2009
0.87
0.67
0.65
1.00
1.06
1.11
1.39
1.18
0.92
0.99
0.82
0.77
1.00
State
Collective
Private
Private LL
JS w state cap
JS wo state cap
100% Foreign
JV
Total
2000
54.9%
1.2%
8.8%
13.1%
1.3%
0.8%
7.3%
12.7%
100.0%
2001
51.5%
1.1%
9.4%
14.8%
2.4%
1.6%
7.8%
11.5%
100.0%
2002
51.4%
0.9%
7.6%
16.9%
2.5%
2.0%
8.1%
10.6%
100.0%
2003
46.9%
0.9%
7.2%
18.7%
3.0%
3.0%
9.1%
11.2%
100.0%
2004
41.5%
0.7%
7.8%
20.5%
3.6%
4.2%
10.8%
11.0%
100.0%
2005
38.7%
0.8%
7.8%
20.1%
4.8%
5.3%
10.9%
11.7%
100.0%
2006
36.2%
0.7%
8.0%
21.0%
5.1%
6.8%
12.3%
9.8%
100.0%
2007
31.6%
0.7%
7.3%
22.9%
5.8%
10.4%
12.4%
8.8%
100.0%
2008
25.4%
0.8%
7.3%
26.8%
6.3%
14.7%
11.3%
7.3%
100.0%

Chapter 6: Vietnam - Flow of Funds 168
Table 14: Average Profit Margins by Ownership Type
Source: GSO 2010, Part 06
Table 13 shows the falling share of the state sector in total revenues. Other than the collective sector and private sector all other ownership categories have increased their share. Table 14 shows profit margins (profits as proportion of annual revenues). Profit margins give an indication of the sector’s ability to finance investments from retained earnings and its share of total investments (recalling the Kaleckian equation). Despite the increase in revenue share of the private limited liability sector and JS without state capital sector compared to the state sector profit margins are relatively low.
State
Non-State
Private
Private LL
JS w state cap
JS wo state cap100% Foreign
JV
2000
4.0%
1.0%
1.1%
0.2%
5.4%
2.9%-0.3%
21.2%
2001
4.2%
1.3%
0.9%
0.7%
6.2%
1.9%-0.4%
22.1%
2002
4.2%
1.5%
1.1%
0.7%
6.6%
2.5%2.7%
22.0%
2003
4.2%
1.5%
1.0%
0.9%
5.1%
2.4%2.9%
24.1%
2004
5.3%
1.2%
1.0%
0.6%
4.6%
1.7%3.7%
26.8%
2005
5.4%
1.2%
0.8%
0.4%
3.9%
2.3%2.6%
20.4%
2006
6.1%
1.7%
0.8%
0.7%
4.8%
3.5%2.4%
29.0%
2007
6.8%
2.8%
0.9%
1.4%
6.8%
4.9%4.5%
25.3%
2008
5.2%
1.2%
0.6%
0.2%
5.4%
1.6%2.9%
22.5%

Chapter 6: Vietnam - Flow of Funds 169
Table 15: Some Indicators for Non-State Firms by Size (Employees)57
No. Firms
2004200520062007
% Firms by Size2004200520062007
Net New Firms200420052006
2007
Ave capital (Bil VND)2004
2005
2006
2007
Ave Profit (Bil VND)200420052006
No. Employees
Total
84,003 105,167 123,392 147,316
Total
100%100%100%100%
Total
21,164 18,225
23,924
Total
5.90
6.64
7.99
12.38
Total
0.100.100.16
0-5
17,884 23,034 16,656 34,658
0-5
21%22%13%24%
0-5
24.3%-35.0%
75.2%
0-5
0.95
1.34
1.70
2.01
0-5
0.000.000.02
5-9
26,285 34,394 57,722 50,668
5-9
31%33%47%34%
5-9
38.3%128.0
%-29.5%
5-9
1.93
2.14
2.36
3.76
5-9
-0.030.000.00
10-49
30,849 37,228 37,503 48,533
10-49
37%35%30%33%
10-49
30.1%1.5%
46.1%
10-49
4.06
4.56
5.40
7.80
10-49
0.040.040.05
50-199
7,079 8,254 8,977 10,549
50-199
8%8%7%7%
50-199
5.6%4.0%
6.6%
50-199
15.65
17.19
21.73
31.57
50-199
0.350.250.52
200-299
743 882
1,017 1,178
200-299
1%1%1%1%
200-299
0.7%0.7%
0.7%
200-299
45.43
46.04
53.70
86.32
200-299
1.140.821.36
300-499
628 716 742 870
300-499
1%1%1%1%
300-499
0.4%0.1%
0.5%
300-499
76.82
86.07
68.23
158.09
300-499
1.901.782.53
500-999
369 450 526 558
500-999
0%0%0%0%
500-999
0.4%0.4%
0.1%
500-999
163.54
153.16
222.64
254.19
500-999
4.044.407.23
1000-4999
161 203 238 290
1000-4999
0%0%0%0%
1000-4999
0.2%0.2%
0.2%
1000-4999
300.30
538.11
836.97
1385.78
1000-4999
10.1713.7923.26
5000+
5 6 11 12
5000+
0%0%0%0%
5000+
0.0%0.0%
0.0%
5000+
263.00
347.67
290.64
5732.01
5000+
3.6017.0027.82
57. ‘Net New Firms Total’ is the total number of firms. The remaining figures are the percentage year on year
change in the number of firms of different sizes.

Chapter 6: Vietnam - Flow of Funds 170
2007
Profit/ Capital2004200520062007
Revenue/ Employee2004200520062007
Profit/ Employee2004200520062007
Ch Capital
2004200520062007
Ch Profit
2004200520062007
Ch Profit/ Ch Capital200420052006
0.32
Total
0.020.010.020.03
Total
0.260.290.340.43
Total
0.000.000.010.01
Total
0.130.200.55
Total
-0.620.98
Total
-2.05
0.02
0-5
0.000.000.010.01
0-5
0.540.580.890.82
0-5
0.000.000.010.01
0-5
0.400.270.18
0-5
-5.47-0.16
0-5
-19.29
0.02
5-9
-0.020.000.000.00
5-9
0.510.510.590.65
5-9
0.000.000.000.00
5-9
0.110.100.60
5-9
--1.764.95
5-9
--18.76
0.11
10-49
0.010.010.010.01
10-49
0.350.390.450.57
10-49
0.000.000.000.01
10-49
0.120.180.44
10-49
0.110.151.28
10-49
-0.07-0.19
1.02
50-199
0.020.010.020.03
50-199
0.240.260.300.41
50-199
0.000.000.010.01
50-199
0.100.260.45
50-199
-0.281.050.99
50-199
-3.802.99
3.12
200-299
0.030.020.030.04
200-299
0.170.220.230.32
200-299
0.000.000.010.01
200-299
0.010.170.61
200-299
-0.280.661.30
200-299
-21.932.98
6.61
300-499
0.020.020.040.04
300-499
0.180.200.250.32
300-499
0.010.000.010.02
300-499
0.12-0.211.32
300-499
-0.060.421.61
300-499
-1.51-3.01
11.16
500-999
0.020.030.030.04
500-999
0.150.170.190.24
500-999
0.010.010.010.02
500-999
-0.060.450.14
500-999
0.090.640.54
500-999
-2.430.42
40.14
1000-4999
0.030.030.030.03
1000-4999
0.140.180.230.28
1000-4999
0.010.010.010.02
1000-4999
0.790.560.66
1000-4999
0.360.690.73
1000-4999
-0.550.24
164.16
5000+
0.010.050.100.03
5000+
0.020.050.050.10
5000+
0.000.000.000.02
5000+
0.32-0.1618.72
5000+
3.720.644.90
5000+
10.56-4.88
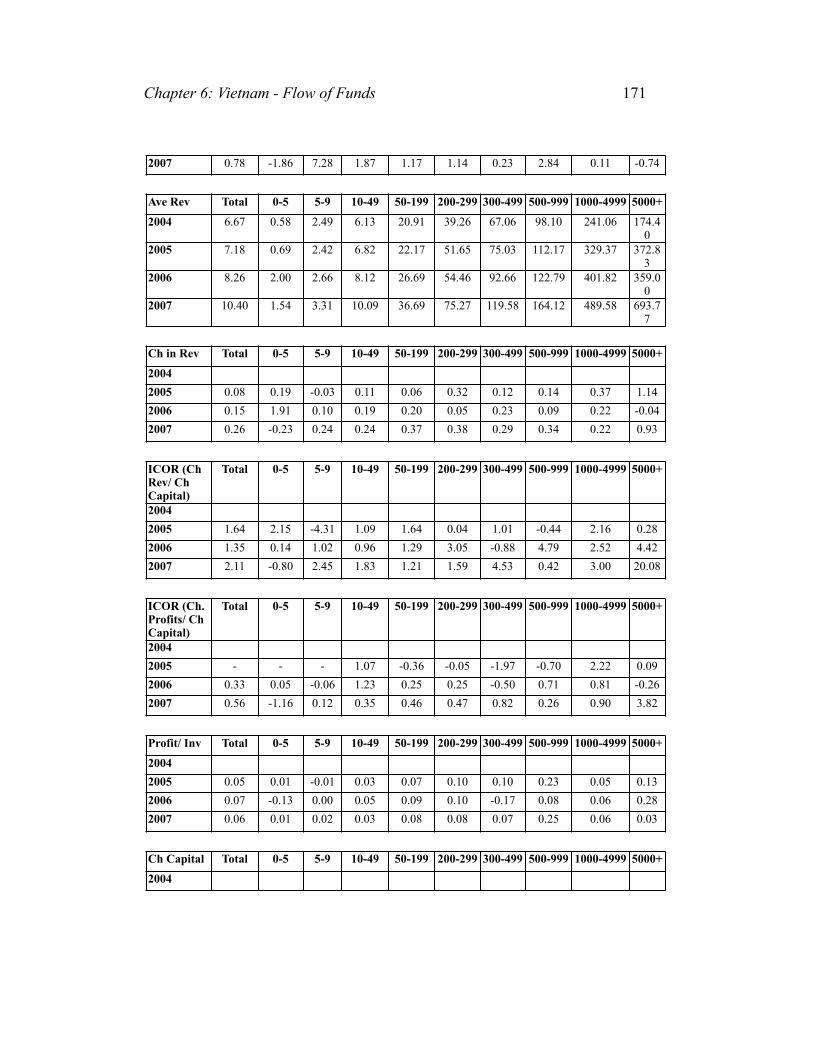
Chapter 6: Vietnam - Flow of Funds 171
2007
Ave Rev
2004
2005
2006
2007
Ch in Rev
2004200520062007
ICOR (Ch Rev/ Ch Capital)2004200520062007
ICOR (Ch. Profits/ Ch Capital)2004200520062007
Profit/ Inv
2004200520062007
Ch Capital
2004
0.78
Total
6.67
7.18
8.26
10.40
Total
0.080.150.26
Total
1.641.352.11
Total
-0.330.56
Total
0.050.070.06
Total
-1.86
0-5
0.58
0.69
2.00
1.54
0-5
0.191.91-0.23
0-5
2.150.14-0.80
0-5
-0.05-1.16
0-5
0.01-0.130.01
0-5
7.28
5-9
2.49
2.42
2.66
3.31
5-9
-0.030.100.24
5-9
-4.311.022.45
5-9
--0.060.12
5-9
-0.010.000.02
5-9
1.87
10-49
6.13
6.82
8.12
10.09
10-49
0.110.190.24
10-49
1.090.961.83
10-49
1.071.230.35
10-49
0.030.050.03
10-49
1.17
50-199
20.91
22.17
26.69
36.69
50-199
0.060.200.37
50-199
1.641.291.21
50-199
-0.360.250.46
50-199
0.070.090.08
50-199
1.14
200-299
39.26
51.65
54.46
75.27
200-299
0.320.050.38
200-299
0.043.051.59
200-299
-0.050.250.47
200-299
0.100.100.08
200-299
0.23
300-499
67.06
75.03
92.66
119.58
300-499
0.120.230.29
300-499
1.01-0.884.53
300-499
-1.97-0.500.82
300-499
0.10-0.170.07
300-499
2.84
500-999
98.10
112.17
122.79
164.12
500-999
0.140.090.34
500-999
-0.444.790.42
500-999
-0.700.710.26
500-999
0.230.080.25
500-999
0.11
1000-4999
241.06
329.37
401.82
489.58
1000-4999
0.370.220.22
1000-4999
2.162.523.00
1000-4999
2.220.810.90
1000-4999
0.050.060.06
1000-4999
-0.74
5000+
174.40
372.83
359.00
693.77
5000+
1.14-0.040.93
5000+
0.284.4220.08
5000+
0.09-0.263.82
5000+
0.130.280.03
5000+

Chapter 6: Vietnam - Flow of Funds 172
Source: GSO 2007 and 2008, own calculations
The data in Table 15 and Table 16 is derived from GSO 2008 and GSO 2007. Unfortunately, whilst enterprise statistics are provided for non-state and state firms by size of employees they are not broken down further, so it is impossible, for example, to know how many large non-state firms possess state capital.
After 2004 there were approximately 20,000 new firms (net) per year. There is no data for the number of firms that ceased trading. The vast majority of firms employed fewer than 50 people, with only around three percent employing more than 200 people. It is likely that many of these firms were equitised state firms. There also appears to have been some growth in firms from the 0-5 employee category to the 5-10 employee category between 2006 and 2007. There appears to have been little growth in the number of large firms. The average capital per firm is small compared to state firms, although it increases over time even when taking inflation into account. Larger firms report greater profits in absolute terms, but when stated as a proportion of available capital (unfortunately, total long term capital was not available as a measure) or per employee there was no discernible difference. Revenues per employee and the ‘ICOR’ measures provide some
200520062007
Ave Ch Capital2004200520062007
Ave Ch Capital/ Av Ch Profits2004200520062007
203,048 287,574 837,138
Total
226
Total
46
13,760 (2,526)41,324
0-5
101
0-5
0-8
23,108 62,237 54,805
5-9
111
5-9
-10
44,585 32,488 176,007
10-49
114
10-49
1063
31,116 53,119
138,026
50-199
4613
50-199
-14613
6,858 13,999 47,072
200-299
81440
200-299
-272131
13,386 (11,004)86,913
300-499
19-15100
300-499
-305-3662
8,576 48,186 24,729
500-999
199244
500-999
21014381
60,888 89,963 202,676
1000-4999
300378699
1000-4999
842550964
771 1,111 65,58
7
5000+
1291015466
5000+
351591115

Chapter 6: Vietnam - Flow of Funds 173
indication of efficiency. In terms of revenues per employee smaller firms appear to be the most efficient. However, the two ICOR measures suggest larger firms make better use of incremental increases in capital. In absolute terms larger firms also have larger increases in available capital year on year. The average change in capital/ average change in profits suggests that larger firms are better able to leverage increases in savings. Moreover, non-state firms appear to extract greater leverage than state firms.
Table 16: Some Indicators for State Firms by Size (Employees)
No. Firms
2004200520062007
No. Firms
2004
20052006
2007
Net New Firms
2004200520062007
Ave capital
2004
2005
2006
No. Employees
Total
4,597 4,086 3,720 3,494
Total
100%
100%100%
100%
Total
(511) (366) (226)
Total
264.73
353.63
475.32
0-5
4 10 19 10
0-5
0%
0%1%
0%
0-5
-1.2%-2.5%4.0%
0-5
2.00
5.00
5.53
5-9
29 32 27 43
5-9
1%
1%1%
1%
5-9
-0.6%1.4%-7.1%
5-9
2.41
9.91
56.70
10-49
720 679 658 631
10-49
16%
17%18%
18%
10-49
8.0%5.7%11.9%
10-49
19.01
18.96
28.64
50-199
1,688 1,507 1,362 1,251
50-199
37%
37%37%
36%
50-199
35.4%39.6%49.1%
50-199
61.00
94.26
129.33
200-299
518 447 398 405
200-299
11%
11%11%
12%
200-299
13.9%13.4%-3.1%
200-299
80.94
114.50
179.64
300-499
609 535 457 438
300-499
13%
13%12%
13%
300-499
14.5%21.3%8.4%
300-499
122.14
158.16
227.64
500-999
575 449 399 357
500-999
13%
11%11%
10%
500-999
24.7%13.7%18.6%
500-999
199.56
264.01
305.46
1000-4999
421 387 359 322
1000-4999
9%
9%10%
9%
1000-4999
6.7%7.7%16.4%
1000-4999
426.01
536.62
724.91
5000+
33 40 41 37
5000+
1%
1%1%
1%
5000+
-1.4%-0.3%1.8%
5000+
20903.09
20691.33
24729.98

Chapter 6: Vietnam - Flow of Funds 174
2007
Average Profit
2004200520062007
Profit/ Capital
2004200520062007
Revenue/ Employee2004200520062007
Profit/ Employee
2004200520062007
Ch Capital
2004200520062007
Ch Profit
200420052006
626.00
Total
8.3311.3616.7421.83
Total
0.030.030.040.03
Total
0.320.420.520.64
Total
0.020.020.030.04
Total
0.340.340.32
Total
-0.47
22.86
0-5
0.00-0.10-0.16-0.04
0-5
0.00-0.02-0.030.00
0-5
2.150.190.800.37
0-5
0.00-0.03-0.06-0.01
0-5
1.500.113.14
0-5
-0.58
35.75
5-9
0.000.660.26-0.07
5-9
0.000.070.000.00
5-9
0.180.395.920.27
5-9
0.000.090.04-0.01
5-9
3.104.72-0.37
5-9
--0.60
33.68
10-49
0.980.761.031.65
10-49
0.050.040.040.05
10-49
0.520.600.600.76
10-49
0.030.030.030.06
10-49
0.000.510.18
10-49
-0.220.36
148.06
50-199
0.512.754.796.70
50-199
0.010.030.040.05
50-199
0.670.851.210.89
50-199
0.000.020.040.06
50-199
0.550.370.14
50-199
4.350.74
347.83
200-299
1.892.963.8820.14
200-299
0.020.030.020.06
200-299
0.360.500.691.83
200-299
0.010.010.020.08
200-299
0.410.570.94
200-299
0.560.31
249.94
300-499
3.083.923.159.61
300-499
0.030.020.010.04
300-499
0.370.470.610.84
300-499
0.010.010.010.02
300-499
0.290.440.10
300-499
0.27-0.20
371.04
500-999
3.414.626.4213.23
500-999
0.020.020.020.04
500-999
0.270.350.360.45
500-999
0.000.010.010.02
500-999
0.320.160.21
500-999
0.360.39
1113.57
1000-4999
29.8942.8162.2358.69
1000-4999
0.070.080.090.05
1000-4999
0.250.330.400.46
1000-4999
0.020.020.030.03
1000-4999
0.260.350.54
1000-4999
0.430.45
33449.21
5000+
585.48491.60663.10834.08
5000+
0.030.020.030.02
5000+
0.310.410.510.58
5000+
0.040.040.060.07
5000+
-0.010.200.35
5000+
-0.160.35

Chapter 6: Vietnam - Flow of Funds 175
2007
Ch Profit/ Ch Capital2004200520062007
Ave Rev
2004200520062007
Ch in Rev
2004200520062007
ICOR (Ch Rev/ Ch Capital)2004200520062007
ICOR (Ch. Profits Ch Capital)2004200520062007
0.30
Total
-0.38-0.04
Total
156.95209.18268.11321.83
Total
0.330.280.20
Total
1.011.221.58
Total
-0.731.04
-0.75
0-5
-4.50-1.24
0-5
6.00-0.401.110.42
0-5
-1.07-3.76-0.62
0-5
-1.41-0.03-5.06
0-5
-0.18-4.20
-1.27
5-9
--1.132.43
5-9
0.311.7841.330.93
5-9
4.7422.20-0.98
5-9
0.650.210.38
5-9
--7.810.29
0.59
10-49
79.63-0.302.37
10-49
14.9716.7116.9921.06
10-49
0.120.020.24
10-49
-0.0229.700.74
10-49
0.011.420.30
0.40
50-199
6.971.001.75
50-199
73.8994.13135.8898.12
50-199
0.270.44-0.28
50-199
1.990.84-0.52
50-199
0.130.500.36
4.19
200-299
0.36-0.463.48
200-299
87.29122.06168.66446.53
200-299
0.400.381.65
200-299
1.041.490.57
200-299
0.741.840.22
2.06
300-499
-0.07-1.4519.98
300-499
140.06179.16235.38323.15
300-499
0.280.310.37
300-499
1.061.400.26
300-499
1.08-2.220.05
1.06
500-999
0.101.483.94
500-999
183.14247.82252.39313.81
500-999
0.350.020.24
500-999
0.918.520.88
500-999
0.910.400.20
-0.06
1000-4999
0.670.29-1.11
1000-4999
497.46641.18760.70870.28
1000-4999
0.290.190.14
1000-4999
0.901.883.72
1000-4999
0.600.77-9.41
0.26
5000+
14.830.79-0.27
5000+
4263.854791.236134.347398.61
5000+
0.120.280.21
5000+
-0.080.701.71
5000+
0.060.561.37

Chapter 6: Vietnam - Flow of Funds 176
Source: GSO 2007, 2008, own calculations
There are far fewer state firms, and the number of firms falls every year as a result of the rationalisation of the state sector. A large proportion of state firms employ more than 200 people. Table 17 illustrates the differences between state and non-state firms. A negative number indicates a greater value for the state sector. The Table demonstrates that state firms are, on average, much larger than non-state firms. However, they don’t appear to be more efficient. Although they generate more revenue per employee, the two ICOR measures suggest that the non-state
Profit/ Inv
2004200520062007
Ch Capital
2004200520062007
Ave Ch Capital
2004200520062007
Ave Ch Capital/ Av Ch Profits2004200520062007
Total
0.200.190.18
Total
228,003 323,257 419,036
Total
5687120
Total
183395
0-5
-0.02-0.050.00
0-5
42 55 124
0-5
4312
0-5
5-17
5-9
0.090.01-0.47
5-9
247 1,214
6
5-9
8450
5-9
-740
10-49
-0.630.110.43
10-49
(815)5,967 2,412
10-49
-194
10-49
5256
50-199
0.110.190.92
50-199
39,075 34,104 9,075
50-199
26257
50-199
63418
200-299
0.140.080.12
200-299
9,257 20,315 69,374
200-299
2151171
200-299
3716541
300-499
0.210.070.77
300-499
10,231 19,415 5,442
300-499
194212
300-499
70-215
6
500-999
0.550.770.45
500-999
3,794 3,341 10,583
500-999
8830
500-999
242128
1000-4999
0.580.430.19
1000-4999
28,322 52,569 98,328
1000-4999
73146305
1000-4999
169323
-5362
5000+
0.140.150.14
5000+
137,851 186,276 223,692
5000+
344645436046
5000+
-214921302323446

Chapter 6: Vietnam - Flow of Funds 177
Table 17: Difference Between Non-State and State Firms ((-) indicates greater value for state sector).
Ave capital
2004200520062007
Ave capital
2004200520062007
Revenue/ Employee
2004
20052006
2007
Ave Rev
2004200520062007
ICOR (Ch Rev/ Ch Capital)
2004200520062007
Total
-258.83-346.99-467.33-613.62
Total
-8.23-11.26-16.58-21.51
Total
-0.06
-0.13-0.19
-0.21
Total
-150.28-202.00-259.85-311.43
Total
0.630.130.53
0-5
-1.05-3.66-3.83-20.85
0-5
0.000.100.180.06
0-5
-1.61
0.380.09
0.45
0-5
-5.421.090.901.12
0-5
3.560.174.26
5-9
-0.49-7.76-54.35-31.99
5-9
-0.03-0.66-0.260.09
5-9
0.33
0.12-5.34
0.38
5-9
2.180.64
-38.682.38
5-9
-4.970.812.08
10-49
-14.95-14.40-23.24-25.89
10-49
-0.94-0.72-0.99-1.54
10-49
-0.17
-0.21-0.16
-0.19
10-49
-8.84-9.88-8.88-10.97
10-49
1.11-28.731.09
50-199
-45.35-77.06-107.60-116.49
50-199
-0.17-2.50-4.28-5.68
50-199
-0.43
-0.60-0.91
-0.48
50-199
-52.98-71.95-109.18-61.43
50-199
-0.350.451.73
200-299
-35.51-68.46-125.95-261.51
200-299
-0.75-2.15-2.52-17.02
200-299
-0.20
-0.29-0.46
-1.51
200-299
-48.04-70.41-114.20-371.26
200-299
-1.001.561.02
300-499
-45.32-72.09-159.41-91.85
300-499
-1.18-2.14-0.62-3.01
300-499
-0.19
-0.27-0.36
-0.52
300-499
-73.00-104.13-142.72-203.56
300-499
-0.04-2.284.27
500-999
-36.02-110.85-82.82-116.86
500-999
0.63-0.220.81-2.06
500-999
-0.12
-0.19-0.18
-0.21
500-999
-85.04-135.65-129.60-149.70
500-999
-1.36-3.73-0.46
1000-4999
-125.711.49
112.07272.21
1000-4999
-19.72-29.02-38.97-18.55
1000-4999
-0.11
-0.15-0.17
-0.18
1000-4999
-256.40-311.81-358.88-380.70
1000-4999
1.260.64-0.72
5000+
-20640.09-20343.66-24439.34-27717.20
5000+
-581.88-474.60-635.28-669.92
5000+
-0.29
-0.36-0.46
-0.48
5000+
-4089.45-4418.39-5775.34-6704.84
5000+
0.363.7218.37

Chapter 6: Vietnam - Flow of Funds 178
Source: GSO 2007, 2008, own calculations
6.4. The Private Sector
A number of surveys carried out by the Government Statistics Office, the World Bank, The Vietnam Chamber of Commerce and others suggest SMEs in Vietnam share a number of characteristics. First, although the number of SMEs is increasing rapidly many new firms are actually existing household enterprises and other small firms that hitherto had chosen not to formally register (Malesky and Taussig 2009). Consequently, Table 17 may not actually accurately depict the number of new SMEs. Second, although actual figures are difficult to come by, the rate of attrition is thought to be high. Individual firms tend to remain small. Although total assets for the sector are rising as a proportion of GDP, per firm the number remains small.
The majority of SMEs are in the retail or service sectors, and those in the manufacturing sector tend to be low skilled, with limited technological capabilities. Surveys of smaller private companies conclude that the majority of firms face difficulties accessing bank credit, and tend to rely, instead, on friends and family (Le Van Su, 2005). In the mid-1990s half of SMEs surveyed did not keep bank accounts, and three quarters did not use banks to settle payments, opting instead for informal credit markets. As a result in 1995 there was four times more cash in circulation in Vietnam than in other ASEAN countries (Nguyen Xuan Nghia, 2005). A 2003 survey by the International Finance Corporation (IFC) found 61 percent of start up funds were personal savings, and a further nine percent borrowed from friends and family (Tenev et. al. 2003). The same study confirmed SOEs tend to dominate borrowing from SOEs, and private firms borrow more from private Joint Stock Banks. Private firms are also likely to depend on a more varied
ICOR (Ch. Profits Ch Capital)
2004200520062007
Total
-0.40-0.48
0-5
-0.133.04
5-9
7.75-0.17
10-49
1.06-0.190.05
50-199
-0.48-0.250.10
200-299
-0.78-1.590.24
300-499
-3.051.730.77
500-999
-1.610.300.06
1000-4999
1.620.0310.32
5000+
0.02-0.822.45

Chapter 6: Vietnam - Flow of Funds 179
source of funds than SOEs. Similarly, Nguyen et. al find that the majority of SMEs rely on informal credit sources (Nguyen et al. 2009).
A recent study of bank lending by one unnamed Vietnamese Joint Stock Bank provides further insight into the lending habits of Vietnamese banks, and so the availability of credit to private enterprise. Hainz et al (2011) had access to the JSB's loan portfolio for June 2006 until March 2009. The data set consisted of 51,161 loans to 'commercial, real-estate, consumer and 'other' borrowers’. Thirteen percent of total loans in the data set were for commercial purposes, predominantly to SMEs or single entrepreneurs - just over half were to consumers. The researchers found that the bank categorised borrowers according to risk. Loans offered without collateral were charged higher interest rates than those with collateral. Collateralised loans were also granted for longer periods and were more likely to be larger than 100 million VND (approximately USD 6,200). Consistent with Figure 13 the number of new loans peaked in 2007 and by 2009 was 41 percent of the 2007 (Quarter 4) level. The study found that borrowers with 'lower credit quality as observed by the bank are more likely to pledge collateral' and concluded that 'observed credit risk is the dominant factor in determining the use of collateral’ and that the higher credit risk observed by the bank the more collateral will be pledged. However they also found that wealthier borrowers pledged collateral to secure lower interest rates. The importance of collateral for commercial loans is illustrated in Table 18.
Table 18: Collateral and interest in a JSB
Source: Adapted from Hainz et al. (2011, p. 27)
Hainz et al. also discovered that larger loans have collateral with a higher absolute value but low value relative to the size of the loan. Moreover, the absolute and relative values
Number of LoansProportion of Collateralised Loans
Average collateral to loan value ratioAverage interest rate (Collateralised loans)
Average interest rate (Un-collateralised loans)
Commercial Loans5,22626,5%
5.014.5%20.8%

Chapter 6: Vietnam - Flow of Funds 180
of collateral increased during the economic crisis in Vietnam (in Quarter 3, 2008) before dropping again.
The study supports the general proposition that bank credit is a function of available collateral, and that the greater the amount of collateral the lower the costs of borrowing and the larger the absolute loan that can be secured.
6.4.1. World Bank Enterprise Surveys
The World Bank conducts enterprise surveys in 135 countries58. In Vietnam surveys were conducted in 2005 and 2009. In 2005 1150 firms were surveyed, and in 2009, 1553. There are substantial differences in the types of firms surveyed. The questionnaire was also different. A number of variables relevant to this study are not reported in the 2009 questionnaire. For example, the 2009 survey does not record any details of firm balance sheets. Similarly, lines of credit and loans become one variable in 2009. Nevertheless, the data from the surveys can add to the analysis.
6.4.1.1. Relationship with Banking sector
The surveys can help shed some more light on the sources of finance and working capital for firms of different sizes and ownership types, and also on the importance of pledging collateral when securing a loan. The 2004 survey provides some balance sheet data, including the amount of ‘cash’ held at the end of the year.
Table 19 displays the proportion of surveyed firms that hold a ‘checking’ or ‘savings account’. If anything we would expect a higher proportion of firms to have an account in 2009. The differences between the figures points to the difficulties making useful comparisons between the two years.
Table 19: Proportion of Firms with Bank Account
2005
Small >=5 and <=19
84%
Medium >= 20 and <=99
90%
Large >=100
95%
58. See http://www.enterprisesurveys.org/.

Chapter 6: Vietnam - Flow of Funds 181
Table 20 shows the proportion of small, medium and large firms that pledged collateral when securing a loan.
Table 20: Surveyed Firms with Loans that Pledged Collateral
In 2009 of the 39% of firms that reported not having a loan the majority (63.4%) did not need a loan. Of the remainder 5.9% found the collateral requirements too high. In 2005 50% of firms that did not have a loan (379) did not need a loan. Of the remainder 11.3% found collateral requirements too strict. Of these 43 firms 12 were small, 21 medium and the remainder over 100 employees. Of the 58 with a loan request turned down the majority (23) lacked the 'accepted' collateral. These figures point to the importance of collateral in accessing credit from banks. Table 21 shows the ratio of collateral to loans in both years.
Table 21: Ratio of Collateral to Loans
The results in Table 21 are difficult to interpret. The 2005 figures are the interviewees response to a direct question asking the value of collateral as a proportion of the loan. No such question is asked in the 2009 survey. However, interviewees are invited to provide an estimate of both the value of the last firm’s last loan and the value of the collateral (if any was pledged) to acquire the loan. In calculating the ratio it becomes clear that one or both values are not accurately reported as some values are extremely high. The values in Table 21 are the means of calculated values under or equal to ten. Nevertheless, although it is difficult to determine whether there has been a change between 2005 and 2009 the fact that the ratio is higher for smaller firms in both years (the ranking remains the same
2009 80.1% 82.2% 84.3%
2005
2009
Small >=5 and <=19
93.3%
94.6%
Medium >= 20 and <=99
93.6%
95.4%
Large >=100
85.2%
89.3%
Ratio of collateral to loan 2005
Ratio of collateral to loan 2009
Small >=5 and <=19
1.76
2.88
Medium >= 20 and <=99
1.66
2.15
Large >=100
1.41
1.92

Chapter 6: Vietnam - Flow of Funds 182
even if outliers are not excluded) suggests that smaller firms are asked to pledge a higher proportion of collateral to loan size than larger firms.
An OLS regression with the ratio of collateral to loan as the dependent variable suggests that the size of the firm and being able to pledge land or fixed assets as collateral is a significant determinant of the size of collateral. State ownership proved not to have a significant impact.
Figure 29: Type of Collateral as Determinant on Value of Collateral Pledged
Model Summary
Model
1
R
Did the loan require
collateral or a
deposit?
.226aR Square
.051
Adjusted R Square
.046
Std. Error of the
Estimate
80.08698
ANOVAb,c
Model
1
a. Predictors: (Constant), sizeover100, If yes, land and buildings were used as collateral, If yes, personal
assests of the owner/manager (e.g. house)
b. Dependent Variable: What was the approximate value of the collateral required as a percentage of the
loan?
c. Selecting only cases for which Did the loan require collateral or a deposit? = Yes
Regression
Residual
Total
Sum of Squares
207367.415
3867596.450
4074963.864
df
3
603
606
Mean Square
69122.472
6413.924
F
10.777
Sig.
.000a

Chapter 6: Vietnam - Flow of Funds 183
Table 22 shows the type of collateral pledged by firms of different size in both 2005 and 2009. Smaller firms pledge a higher proportion of the owner’s assets than larger firms, as might be expected. Larger firms are able to pledge plant and machinery and are less dependent on land.
Coefficientsa,b
Model
1
a. Dependent Variable: What was the approximate value of the collateral required as a percentage of the
b. Selecting only cases for which Did the loan require collateral or a deposit? = Yes
(Constant)
If yes, land and buildings
were used as collateral
If yes, personal assets of
the owner/manager (e.g.
house)
sizeover100
Unstandardized Coefficients
B
238.629
-21.963
-24.522
-17.771
Std. Error
18.748
6.640
8.696
6.776
Standardized
Coefficients
Beta
-.133
-.114
-.108
t
12.728
-3.308
-2.820
-2.623
Sig.
.000
.001
.005
.009
Coefficientsa,b
Model
1
a. Dependent Variable: cashcurrent100
b. Selecting only cases for which Did the loan require collateral or a deposit? = Yes
(Constant)
sizeover100
soe
Unstandardized Coefficients
B
15.920
-6.397
-4.782
Std. Error
.861
1.214
1.668
Standardized
Coefficients
Beta
-.212
-.115
t
18.484
-5.270
-2.867
Sig.
.000
.000
.004

Chapter 6: Vietnam - Flow of Funds 184
Table 22: Types of Collateral (2005)
Table 23: Types of Collateral (%) (2009)
Many firms pledged more than one category of collateral. Percentages represent the proportion of firms in each size category that pledged collateral. Table 24 and Table 25 report the sources of working capital for firms of differing sizes in 2005 and 2009.
Table 24: Sources of Working Capital (%) (2005)
Land and Buildings
Immoveable plant, machinery
Moveable machinery and equipment (incl.vehicles)
Other tangible assets (e.g. accounts receivable, inventory)
Personal assets of the owner/manager (e.g. house)
Other
Small >=5 and <=19
71.4%
33.3%
31.0%
0.0%
35.7%
0.0%
Medium >= 20 and <=99
60.0%
50.2%
40.4%
11.5%
23.4%
4.3%
Large >=100
46.9%
69.6%
56.7%
16.8%
10.6%
5.6%
Land and Buildings
Machinery and equipment including movables
Accounts receivable and inventories
Personal assets of owner (house, etc.)
Other
S m a l l > = 5
and <=19
59.7%
28.1%
2.9%
48.2%
2.9%
Medium >=
20 and <=99
71.7%
41.7%
5.3%
42.1%
3.6%
Large >=100
79.5%
70.1%
20.5%
20.9%
7.3%
Internal funds or retained earnings used for working capital
Private commercial banks (loan, overdraft) used for working capital
Small >=5 and <=19
36.59
1.21
Medium >= 20 and <=99
31.21
3.57
Large >=100
22.19
2.48

Chapter 6: Vietnam - Flow of Funds 185
Table 25: Sources of Working Capital (%) (2009)
In both years own funds are a significant source of working capital for all firms, but more so for smaller firms. The category for 2009 conflates retained earnings and the internal funds of the firm with equity or funds of the owner. Combining both in 2005 provides a similar figure. Large firms are more likely to use state owned banks. Few firms use private banks in 2005. Unfortunately, it is impossible to say for 2009. Again, as might be expected a greater proportion of smaller firms go to informal sources for working capital.
This thesis also asks whether smaller firms hold more cash than larger firms. Table 26 suggests that on average smaller firms hold 15 percentage points more cash than larger firms as a proportion of current assets.
Table 26: 2005 Ratio of Cash to Current Assets, Total Assets and ST Liabilities. (Averages of 2003 and 2004)
State Owned commercial banks used for working capital
Private investment funds used for working capital
Trade credit (supplier or customer credit) used for working capitalEquity or sales of shares used for working capital
Family, friends used for working capital
Corporate bonds used for working capital
9.7
1
3.22
35.57
10.7
0
15.43
1
5.91
29.18
7.74
0
32.05
1
9.44
23.22
2.71
0.14
Internal funds/Retained earnings
Borrowed from banks (private and state-owned)
Borrowed from non-bank financial institutions
Purchases on credit from suppliers and advances from customers
Other (moneylenders, friends, relatives, etc.)
Small >=5 and <=19
68.0
20
0
2
8
Medium >= 20 and <=99
58
28
1
4
6
Large >=100
47
37
0
6
5
Cash/ current
Cash/ Total Assets
cashofstliabx100
Small >=5 and <=19
26.64
11.94
244
Medium >= 20 and <=99
16.73
7.62
65.09
Large >=100
10.06
4.87
27.08
Large >=300
9.63
4.79
25.56

Chapter 6: Vietnam - Flow of Funds 186
Smaller firms do indeed hold more cash as a proportion of both current assets and total assets. Interestingly they also hold, on average, over twice as much in cash as the value of their short term liabilities, a value that also decreases as firms get bigger. An OLS regression (Figure 30) supports this observation, suggesting that larger firms and SOEs tend to hold less cash as a proportion of current assets.
Figure 30: Cash as a Proportion of Current Assets (OLS)
Model
1
a. Predictors: (Constant), soe, sizeover100
R
Did the loan require
collateral or a
deposit? = Yes
(Selected)
.271aR Square
.073
Adjusted R Square
.070
Std. Error of the
Estimate
14.49321
ANOVAb,c
Model
1
a. Predictors: (Constant), soe, sizeover100
b. Dependent Variable: cashcurrent100
c. Selecting only cases for which Did the loan require collateral or a deposit? = Yes
Regression
Residual
Total
Sum of Squares
10576.250
133803.784
144380.034
df
2
637
639
Mean Square
5288.125
210.053
F
25.175
Sig.
.000a

Chapter 6: Vietnam - Flow of Funds 187
This thesis also suggests that diversified firms are better able to manage liquidity and so less likely to hold cash as opposed to other liquid assets or rely on sales revenues to meet commitments. Table 27 presents two variables - ‘two activities’ and ‘two diff activities’. The first represents firms that report revenues of more than thirty percent in two activities. The second is firms that report two distinct SITC numbers. The Table suggests that although the average cash holding is lower than the sample average the difference is not great. This is not necessarily surprising as the data does not allow us to determine the
Coefficientsa,b
Model
1
a. Dependent Variable: cashcurrent100
b. Selecting only cases for which Did the loan require collateral or a deposit? = Yes
(Constant)
sizeover100
soe
Unstandardized Coefficients
B
15.920
-6.397
-4.782
Std. Error
.861
1.214
1.668
Standardized
Coefficients
Beta
-.212
-.115
t
18.484
-5.270
-2.867
Sig.
.000
.000
.004

Chapter 6: Vietnam - Flow of Funds 188
structure of the company, and whether the different activities are carried out by different subsidiaries.
Table 27: Cash as Proportion of Current Assets for Diversified Firms.
Table 28: Cash as a Proportion of Current Assets for Various Diversified Firms
The large diversified firm is a firm that reports operating in two distinct activities (as in Table 27), but which employs at least 300 workers. The cash/ current asset ratio is lower at 7.33 percent. The diversified firm is the average of firms operating in two distinct activities. That such firms operate in more than one activity does not however mean they take a conglomerate structure. The GC structure is, however, a formal conglomerate with the autonomy of subsidiary firms a function of the equity owned by the General Corporation. The 2005 survey records whether a firm that identifies itself as an SOE, a JS Company or One Member Limited Liability Company is a member of a GC. Table 29 records the average cash holding of SOE and JS members of GCs by size and compares them to non-GC SOEs and JS companies.
All
Two activities
Two diff activities
Small >=5 and <=19
Mean
26.64
22.12
22.48
Count
116
43
31
Medium >= 20 and <=99
Mean
16.73
16.23
14.71
Count
427
209
144
Large >=100
Mean
10.06
9.89
9.83
Count
588
320
221
Large Div Firm
Div Firm
300+ workers (single activity)
Mean Cash/ Curr Assets
7.33
12.3
9.75

Chapter 6: Vietnam - Flow of Funds 189
Table 29: Impact of Being a Member of a GC on Cash Held as Proportion of Current Assets
Again smaller firms hold more cash (although only there is only one firm in the sample that is both a member of a GC and employs fewer than 20 people). However, although GCs appear to hold, on average, less cash than other firms there is little difference between GC member JS companies and non-GC JS companies, and similarly between non-GC SOEs and unattached SOEs. With regards to GC members in which the state has a minority stake this can be explained by the fact that such companies tend to operate autonomously, with little need for support from the GC59. As SOEs themselves appear to hold less cash than the population average it is perhaps also not surprising. Table 30 and Table 31 report sources of investment capital in 2005 and 2009.
Table 30: Sources of Investment Capital (%) (2005)
GC MemberSOE non GC
SOE GC
JS non-GC
JS GC
All
Small >=5 and <=19
5.36-
5.36
24.13
-
26.64
Medium >= 20 and <=99
8.4116.26
4.76
11.97
11.06
16.73
Large >=100
7.905.98
5.76
10.67
10.04
10.06
Internal funds or retained earnings used for new investments
Private commercial banks used for new investments
State owned commercial banks used for new investments
International commercial banks used for new investments
Private investment funds used for new investments
Equity or sales of shares used for new investments
Family, friends used for new investments
Informal sources used for new investments
Corporate bonds used for new investments
Small >=5 and <=19
36.19
1
4.89
0
3
45.4
6.93
1
0
Medium >= 20 and <=99
33.14
4
17.35
1
1
30.88
7.81
1
0
Large >=100
26.91
2
32.17
2
0
22.22
2.54
0
0.12
59. See Chapter 7 for further discussion of GC subsidiaries

Chapter 6: Vietnam - Flow of Funds 190
Table 31: Sources of Investment Capital (%) (2009)
As expected smaller firms made greater use of internal funds and retained earnings, and relied less on banks. In 2005 smaller firms called on private equity. The survey reports that very few firms issued equity in 2008. Given that the 2009 survey included more listed firms than the 2005 survey this is difficult to explain, and may be related to the downturn in 2008.
6.5. Conclusion
This Chapter has examined the composition of the firm sector and its investment, funding and financing behaviour over the course of the 1990s and 2000s in Vietnam. The objective was to determine the extent of enterprise sector savings deficits and the consequent sources of financing; how those sources changed as the institutional structure changed; and how firms differed in the financing, funding and liquidity management behaviour in response to changes in the financial sector, which, also corresponds to a period of financial deepening.
It found that firms of all ownership types tended to rely on retained earnings for investment. Until the mid-2000s investments were typically not greater than firm savings. This can partly be attributed to state intervention in the banking sector and the absence of effective capital markets, as well as legislation concerning the private sector. In the run up to accession to the WTO, and corresponding capital inflows, accelerated equitisation of the SOE sector and liberalisation of the banking sector there were changes in enterprise sector behaviour. Notably, firms had greater access to credit on more relaxed
Internal funds or retained earnings
Owners' contribution or issued new equity shares
Borrowed from banks (private and state-owned)
Borrowed from non-banks financial institutions
Purchases on credit from suppliers and advances from customersOther (moneylenders, friends, relatives, bonds)
Small >=5 and <=19
76
3
10
0
2
8
Medium >= 20 and <=99
67
7
18
0
1
5
Large >=100
59
11
20
0
3
3

Chapter 6: Vietnam - Flow of Funds 191
terms as well as to equity markets. Joint-Stock companies tended to experience a greater increase in investments over profits. This can largely be attributed to nascent entrepreneurial capital, and equitisation of state owned enterprises. The small average size of private JSCs suggests that capital contributions from private investors were small.
Kalecki’s equation suggests that investments will return to firms in proportion to profit margins. It might be expected given the objectives of the state that state owned enterprise investments would have lower profit margins, and so would in effect be financing private sector firms. This does not appear to be the case. SOEs and equitised SOEs continue to generate the highest profits and so have the greatest access to retained earnings for subsequent investments.
The evidence appears to confirm that banks lend a proportionate amount of pledged collateral. Bank financed investments will, therefore, be limited in size by the possession of suitable assets. For most category of enterprise liability/ equity ratios have remained constant over the time in which data are available, suggesting that firms are either not able or choose not to increase the incidence of bank based investments.
Studies of smaller firms find the majority do indeed finance investments from retained earnings, although larger firms are able to seek bank credit for working capital. This suggests in turn that smaller firms will need to hold greater cash balances. This is also born out.

192
7. Chapter 7: Case Studies of Vietnamese Firms
7.1. Introduction
Since the early 1990s Vietnam has seen the gradual reform of the institutions and legislation that concern the enterprise sector and the finance and banking sectors. State owned enterprises have been liquidated, merged and reorganised into General Corporations, and they have gained substantially more autonomy in their day to day operations. It has also become easier to establish and run a private business. At the same time the finance and banking system has experienced substantial change, and capital flows into Vietnam, triggered by the equitisation of SOEs and accession to the WTO, have ensured the financial landscape has changed significantly. Chapter 4 looked to marry the balance sheet firm and post-Keynesian approaches to financial development and the relationship between the real and financial sectors and made a series of propositions. Chapter 6 explored these propositions using flow of funds analysis and making use of available firm data. This chapter seeks to look more closely at the concomitant development of the firm and finance sector by using case studies of different types of firm in Vietnam. In Vietnam the vast majority of large firms are conglomerates in the form of General Corporations and their subsidiaries. Of these subsidiaries some concentrate on one main activity, whilst others are developing a more diversified structure. Other large firms in Vietnam have some degree of state ownership but have operated with relative autonomy from the state. A small number are and always have been private.
This Chapter will make use of a survey conducted by the author of Vietnam’s largest firms. The behaviour of these firms in response to developments in the finance sector will be analysed. It will also present analysis of the uses of the proceeds from stock issues of sixty-four non-financial firms that listed on the Hanoi stock market in 2007 and 2008.
Section 7.2 will present the findings of a survey of Vietnam’s largest firms supplemented with secondary sources and, where possible, balance sheet analysis. Section 7.3 will look more closely at the balance sheets of listed firms. Section 7.4 will conclude.

Chapter 7: Case Studies of Vietnamese Firms 193
7.2. Vietnam’s Largest Firms
Chapter 6 pointed to the dominance of the SOE sector in the population of domestically owned large firms in Vietnam. To understand better the relationship between large firms in Vietnam and the finance and banking sector this Chapter will develop case studies of large firms in Vietnam. As the characteristics of the enterprise sector in Vietnam are largely the outcome of Vietnam’s recent economic history firms differ in a number of ways, most obviously in terms of ownership, and the degree to which their activities are determined by the government’s economic plans. This section will organise Vietnam’s largest non-financial firms into three categories: General Corporations (GCs), the subsidiaries of GCs and large private firms. This Section is based on questionnaires and interview notes in a survey designed and conducted by the author of the largest firms in Vietnam in 2007, the year of Vietnam’s accession to WTO. The interview notes will be supplemented with secondary sources and further interviews.
7.2.1. Survey Methodology
The data used in this Chapter was collected as part of a survey conducted by the Country Economist Unit of the United Nations Development Programme (UNDP) in Hanoi. The research data are held by UNDP in Hanoi and are available upon request. Methodological issues were published in UNDP 2007. Participants in the survey all gave their permission for the results of the survey to be published in the public domain. The data used in this chapter are derived from interview notes and survey results. The resulting discussion and argument developed in this chapter are the author’s original interpretation of otherwise publicly available data. However, although the data are publicly available to ensure the discussion in this chapter is in accord with SOAS Research Ethics Policy60 no names of interviewees will be used.
The original survey targeted the two hundred largest non-financial firms in Vietnam. Eighty-eight interviews were conducted. This chapter will make use of a combination of interviews conducted by the author and secondary sources including company websites.
60. Accessed http://www.soas.ac.uk/researchoffice/ethics/file50158.pdf, October 13th 2012.

Chapter 7: Case Studies of Vietnamese Firms 194
As will be explained below the firms will be categorised as General Corporations (GCs), the subsidiaries of General Corporations, firms adopting the ‘Parent-Child Structure’, quasi-private firms and private firms.
In the sections below interviewees are quoted. Quotes are derived from notes taken in English during the interview, and cannot be taken as verbatim. However, they are a fair reflection of what was reported. Quotes are used to reinforce the argument of the chapter. Where they might reveal a sensitive issue for a particular firm they have not been used.
Two hundred firms were selected from the 2006 Enterprise Survey produced by the Government Statistics Office (GSO), developed from enterprises registered with the tax office at the Ministry of Finance. The annual survey covers foreign and domestically owned enterprises employing more than ten people. For the purposes of the study firms with 100 percent foreign ownership were excluded. Joint ventures, or firms in which foreign firms held equity were included.
The enterprise survey was and is problematic in a number of ways. First, the data are known to be unreliable. Many firms deliberately reported incorrect values for ‘turnover’ and other variables. The value of firm assets is also problematic, both because of well known problems valuing assets and also, again because of misreporting. A further issue is the tendency to include all independent accounting enterprises as individual units. For the most part data for General Corporations includes the GC headquarters and affiliates, but excludes joint stock companies. On the other hand some GCs include all the associated enterprises. This results in a degree of double counting, and also in inaccurate representation of GCs. The decision was made to include GCs in the survey as many were and are important actors in the Vietnamese economy. Large subsidiaries that were listed separately were also included. Once foreign enterprises were excluded firms were ranked according to turnover, assets and number of employees. This method was chosen to provide a more complete picture of the economy. Some firms, particularly financial companies, were highly ranked in terms of assets, but not in employment or turnover. Some labour intensive firms with many employees reported low turnover and assets. The firms that were ranked highly in only one of the lists and so excluded were garments or footwear (employment), financial services (assets) and petroleum trading companies

Chapter 7: Case Studies of Vietnamese Firms 195
(turnover). Two hundred firms were chosen so as to include some of the larger private companies that would otherwise be excluded in a ‘Top 100’ or ‘Top 50’. A recent attempt to rank firms by capitalisation includes the majority of firms included in the original survey61.
The top 200 firms (including foreign firms) in the survey commanded a significant proportion of total assets, labour and turnover employed by their ownership type.
Table 32: Top 200 share of labour, assets and turnover
Once forty-one 100% foreign owned firms were excluded thirty four state firms, five private and two joint ventures were included. The majority (120) were GC affiliates (Table 33).
Ownership Type
StatePrivateForeign
No. firms in
Enterprise Survey
4,083105,1673,697
No. firms in Top 200
1222256
Top 200 share of
ownership type %
(Labour)
29.61.915.9
Top 200 share of
ownership type %(Assets)
65.513.710.1
Top 200 share of
ownership type %
(Turnover)
41.94.824.3
61. http://www.emergingmarketsanalysis.com/web/Vietnam/index.htm

Chapter 7: Case Studies of Vietnamese Firms 196
Table 33: General Corporation Affiliates
Two questionnaires were then devised, one for firms and one for General Corporations (Appendices 4 and 5), and distributed. The questionnaire was intended to capture data and also to provide background information for the interview. The questionnaire included sections on labour and skills, finance, technology, and firm history. The Ministry of Planning of Investment, provincial People’s Committees and provincial Departments of Planning and Investment assisted in contacting firms, arranging interviews and obtaining completed questionnaires. Of 200 firms 104 returned questionnaires and eighty eight interviews were conducted with firms and general corporation head offices and five interviews with industry associations. These included eighteen interviews with firms that did not return questionnaires.
General CorporationVietnam National Coal and Mineral Industries GroupVietnam National Textile and Garment GroupVietnam National Cement CorporationVietnam Rubber GroupVietnam National Chemical CorporationVietnam National Shipping LinesVietnam Shipbuilding Industry GroupVietnam Insurance GroupVietnam Oil and Gas GroupVietnam Post and Telecommunications GroupHanoi Construction CorporationVietnam AirlinesVietnam National Petroleum CorporationVietnam Paper CorporationCivil Engineering Construction Corporation No. 5Electricity of VietnamHanoi Electronics CorporationSong Da Construction CorporationVietnam Engine and Agricultural Machinery CorporationVietnam Industrial Construction CorporationVietnam RailwaysVietnam Steel CorporationOther GCs (Head offices)Total
AbbreviationVinacominVinatexVNCCGerucoVinachemVinalinesVinashinBao VietPetrovietnamVNPTHACCVietnam AirlinesPetrolimexVinapacoCienco 5EVNHanelSong DaVEAMVinainconVNRVSC
No. Firms15119885544433332222222219120
Chapter 7: Case Studies of Vietnamese Firms 197
The majority of firms returned the questionnaire before the interview date. Prior to interview firms were researched in the Vietnamese press, and where possible statements made in interview were cross-referenced. Given the relationships between subsidiaries and GCs it was also possible to investigate issues from different perspectives. The interviews themselves were semi-structured and conducted through a translator. Interviewees were senior managers, who were occasionally senior members of accounts and technical departments.
The results of the questionnaire and interviews used in this Chapter concern the sources of finance and liquidity for firms, and the relationships between the firms and the state. This Chapter draws primarily on firm histories and responses concerning financial matters. Financial information was drawn from questions concerning sources of finance (in which interviewees were asked to rank sources now, five years ago, and in five years, the ease of and requirements for accessing finance of different types (and how that had changed) and key financial ratios. In interview interviewees were asked to expand on their answers. They were also asked about how key investment decisions had been made and how they had been financed. In this way firms gave further insight into how financial issues had changed over time. Firms were also asked about relevant issues that had been reported in the press or elsewhere, and also matters unique to individual industries. Where possible industry reports and studies were also consulted. In some cases it was also possible to interview former employees to gain further insight62. For one firm the author was able to interview the manager of one of the company’s larger subsidiaries. A representative of HCMC People’s Committee in the 1980s was able to provide further insight into the origins of another. Various departments of Binh Duong People’s Committee were happy to answer questions about a firm in the province. A number of firms do make balance sheets available to the public, and where possible these have been consulted. Interviews took approximately two hours and were often supplemented with a tour of the firm and plant, where more questions could be asked, and insight gained. A number of firms responded to further questions by email following the interview.
62. These interviews were conducted separately.

Chapter 7: Case Studies of Vietnamese Firms 198
It is possible that the interviews were biased in some respects. The survey was conducted on behalf of the United Nations Development Programme (UNDP) in Vietnam and interviewees were told the results would be relayed to government via a final report. Interviewees may, therefore, have emphasised certain issues they would not have reported to representatives of a state organisation. It is also likely that firms were reluctant to share data or information that would have presented the firm in a bad light. In the months following the interview, one firm, for example, was reported to be dangerously indebted to Cuban banks. Interviewees gave no indication of this. On the other hand a number of interviewees were particularly candid when discussing the relationship with the State and financial reporting. It is unlikely they would have engaged in such discussions with independent or state sponsored researchers.
7.2.2. The Firms
In this Chapter Vietnam’s largest firms are categorised first by ownership, and then whether and when they pursued a diversified conglomerate form. Of the firms surveyed twenty-two are state owned corporations, or ‘General Corporations’. This Chapter will focus on fourteen of the GCs that were interviewed. It will then turn to the twenty-nine subsidiaries of these corporations, distinguishing between those that remain single activity firms and those that have diversified adopting a ‘parent-child’ structure. Twenty-two are state owned firms owned, or previously owned by state bodies such as ministries or people’s committees. A third category of firm is the ‘quasi-private’ SOE. These are firms that are or have been nominally state owned, but throughout their history have demonstrated substantial autonomy. Finally nine privately owned companies, of which three were established in the 1980s will be considered.
All the GCs and their subsidiaries are now equitised. The state holds a majority share in the GCs. Of the subsidiaries the parent GC owns a majority share in all but three. Of the remainder the state owns 100% of 14 firms and a majority share of twelve. Nine firms had adopted a ‘parent-child’ structure in which the firm held a share in a number of subsidiaries. In 2006 and 2007 as part of the equitsation process four GC subsidiaries

Chapter 7: Case Studies of Vietnamese Firms 199
adopted the ‘parent-child’ (PC) model. Four state owned firms have also adopted a similar structure since the 1980s, as has one private company.
All firms employed over 1,000 people. Of the GCs, Vinacomin (Coal) employs over 100,000 people in member companies; VNPT employs 87,000 people; EVN, Petrovietnam, Petolimex, Geruco, Vinashin, Vinalines employ over 20,000 people; Lilama over 12,000 people and the remaining GCs between six and ten thousand people. Three of the remaining firms employed over ten thousand workers; seven firms employed between six and ten thousand people; fifteen between two and six thousand, and the remainder between one and two thousand.
This Chapter will discuss General Corporations, the subsidiaries of GCs, subsidiaries of GCs that have adopted a ‘parent-child- structure’,
7.2.3. General Corporations
General Corporations (GCs) were established by the state to manage state owned enterprises in sectors regarded as economically ‘strategic’. In most cases existing firms in the same or similar industries were grouped together with each reporting to the GC headquarters, which held a share of the company. General findings will be discussed and two case studies, of Vinatex and Vinashin, will be presented. Interviews were with the GC headquarters as well as subsidiaries.
7.2.4. GC Financing
As illustrated in Chapter 6 a number of GCs were able, with government support, to issue bonds to finance investments. Otherwise the eleven GCs that responded to questions on the sources of finance in the questionnaire and interview indicated that there had been very little change in sources of finance between 2002 and 2007. Of these all but two listed retained earnings and loans from SOCBs as the two primary sources of investment finance. Three also listed the Development Assistance Fund (DAF) as a significant source of finance. Two reported that SOCB loans had replaced retained earnings as the most important source of funds in the intervening five years.

Chapter 7: Case Studies of Vietnamese Firms 200
Each GC was asked to score access to capital as a constraint on a scale of one to five (five being no constraint). Three (the smallest corporations) scored ‘two’; nine scored ‘four’ or ‘five’. Fourteen GCs responded when asked if it was easier to secure loans. Of these two reported it was harder, one that there was no change and the rest that it was easier. In interview most of these firms reported that it was easier because there were more banks willing to lend, and that as large firms able to offer collateral banks were willing to lend to them. The two GCs that reported that it was now harder to secure loans said that more collateral was required. The rest reported that no more collateral was required than previously. Unfortunately, only five GCs were able to report the proportion of short term to long term loans. Of these only two reported less than 50%. Three reported 60%, 73% and 91%.
The following are two more in depth case studies of two GCs, Vinatex and Vinashin.
7.2.4.1. Vinatex
Vinatex is responsible for the garments and textiles sector (G&T). It is charged with building the garments and textiles industry, managing state assets in the sector and implementing other aspects of government policy. The garments and textiles industry is particularly valued as an employer. Vinatex’s role in the G&T industry can be dated to 2006, when Vinatex was restructured with the help of PricewaterhouseCoopers and transformed it into a ‘profit-oriented holding company’ (Martin, 2008). Vinatex will itself also be equitised. The plan is for the state to hold 65 percent of the company63. The majority of the capital in Vinatex member companies is, however, privately owned (IBM Belgium et al., 2009).
Vinatex has seven ‘non-productive’ subsidiaries, including trading colleges, design firms and research institutes; ninety-nine joint stock companies, the majority in textile and garments production, but also several in waste water management and infrastructure
63. http://vietnambusiness.asia/tag/vinatex/, accessed 13/ 07/ 2012. As of January 2013 it has not been
equitised.

Chapter 7: Case Studies of Vietnamese Firms 201
development for the G&T industry64. A number of Vinatex’s subsidiaries have their own subsidiaries, creating, in effect, a large pyramid structure. The relationship between layers is, primarily, determined according to ownership and to the Law on Enterprises. The role of Vinatex in a subsidiary joint-stock company, for example, will reflect Vinatex’s ownership share and voting rights on the board. This relationship has evolved with changes in the enterprise law and other relevant legislation.
According to the interviewee once companies had been equitised member firms become more autonomous. Vinatex devises an industry plan, but members are not obliged to follow it. However, firms are encouraged to remain in the G&T industry, as, the interviewee explained if they focussed only on profits and efficiency they might operate in different sectors, for example real estate.
Vinatex ‘trading’ subsidiaries manage internal distribution systems within the group, however, there is no obligation for firms to sell inputs (fibres and fabrics) to other Vinatex members. Nevertheless, firms are encouraged to trade with other members who are facing financial difficulties. Vinatex has also opened showrooms and markets across the country for the use of members and other firms. They are also developing chains of Vinatex branded shops, to sell the group’s higher quality products. Vinatex hopes to have developed an entire supply chain within the group by 2015. Although, in its infancy, there are also moves to expand the distribution system internationally. According to the interviewee Vinatex also intervenes to ‘help members avoid competition [with each other], by providing warnings, information and suggestions for future plans and production activities. [Vinatex] also help firms to avoid overlapping investments.’
Vinatex receives a management fee from its members and does not subsidise them, although it is able to provide them with a credit guarantee if necessary. According to the interviewee a lack of funds was a large constraint on the Group’s, and so industry’s development. The target for 2011, for example was to increase the proportion of inputs into garments production to fifty percent, however, by early 2012 seventy percent of the value of inputs was imported. The company has also forged partnerships with producers
64. http://www.vinatex.com.vn/Intro.aspx, accessed 10/6/2012

Chapter 7: Case Studies of Vietnamese Firms 202
in Cambodia and Myanmar in an attempt to expand its supply chain65. However, according to the interviewee the state does not have the funds to support the group, which instead sought funding from banks and joint ventures with foreign partners.
There are moves to develop the financial capacity of Vinatex. One subsidiary, Textile-Garment Financial Co (TFC) (listed on the Hanoi Stock Exchange in June 2011), whose role is to provide credit to member companies ‘at market rates’ who could not access credit elsewhere, has become a financial trading company, whose role is to invest on behalf of Vinatex in the stock market, as well as to pursue other investment opportunities. The firm can also access credit from other financial institutions66.
7.2.4.2. Vinashin
Vinashin was born as an attempt to replicate the industrial policy of South Korea, and in some respects Japan. Shipbuilding was designed to provide employment, generate supporting industries, attract foreign investment and foreign expertise and enable Vietnam to embark on a rapid period of ‘catch-up’.
Vinashin’s membership consists of the country’s shipyards, ship repair yards and other shipbuilding related businesses. Many predated the establishment of the group in 1996. However, Vinashin and members of the Vinashin group have since established nearly four hundred new subsidiaries, many of which operate in sectors that have nothing to do with shipbuilding. Like Vinatex, Vinashin is charged with building a sector considered important to Vietnam’s economic development. Vinashin shipyards began building progressively larger ships for domestic and foreign clients from 2000, with the intention of being the fourth largest shipbuilder in the world by 2010. A dual objective, like all
65. http://vietnambusiness.asia/Vietnam-vinatex-aims-to-raiselocalization-
rate-to-50-in-2011/ accessed 12/07/2011.
66. One such investment is in a JSB, Navibank. However, since 2010, the Government has restricted the
ability of State Groups to invest in banks and other financial institutions, limiting its share to eleven percent
(http://english.vietnamnet.vn/biz/201009/Small-banks-havetrouble-with-recapitalization-937094/, accessed
12/07/2011)

Chapter 7: Case Studies of Vietnamese Firms 203
GCs, is to increase the proportion of final content produced in Vietnam. Again, like Vinatex, they have struggled.
Vinashin coordinates production across the group, selecting shipyards and other subsidiaries to carry out tenders it has won. It also invests in new subsidiaries, most of which are designed to increase local content and design capabilities. Like Hyundai67 before it Vinashin also benefited from an acquiescent state owned shipping company, instructed by the government to purchase ships produced by Vinashin, including those rejected by foreign clients.
Because shipbuilding is a capital intensive industry debt and debt management is central to the success of the enterprise. As individual shipyards cannot access loans sufficient to meet the costs of large projects, Vinashin jointly with the Vietnamese government releases international and domestic bonds. Funds are then distributed throughout the group by the subsidiary, ‘Vinashin Finance’.
Unfortunately, the recent experience of Vinashin suggests that shipbuilding was a poor policy choice. A state audit of Vinashin in 2010 revealed the company to be USD 4.5 billion in debt. In December 2010 and then in May 2011 the company was unable to repay scheduled tranches of this debt contributing to the downgrading of Vietnam’s credit rating. A number of Vinashin subsidiaries have since been moved to other GCs in an attempt to streamline the company.
Major challenges for Vinashin are financing investment and managing cash flow. At the end of the 1990s Vietnamese shipyards were small and possessed out of date capital equipment and infrastructure. In order to meet the requirements of foreign buyers shipyards needed large capital injections, which neither the firms, Vinashin or the Government could properly afford without securing large loans. Producing ships typically involves the producer borrowing to finance the project, and receiving payment on final delivery. As explained by interviewees in Vinashin and a number of member shipyards this is a risky endeavour. According to one senior manager of Nam Trieu, a Vinashin shipyard:
67. Amsden (1992)

Chapter 7: Case Studies of Vietnamese Firms 204
‘[The client] pays thirty percent up front. Nam Trieu has to get the loan [for the remainder] by itself from commercial banks. At the moment shipbuilding does not bring much profit, but can help solve social issues like providing jobs to large numbers of workers. We have to import most of the components. Most of the profit comes from labour, but not much. This is why Vinashin’s policy is to increase local content… then we can talk about profits’.
Another manager at another Vinashin shipbuilding company said:
‘Before we sign a contract we prepare tentative production costs and submit them to Vinashin. Usually profits are [included] as two percent of this cost. When we sign the contract we usually build a series of ships. So maybe for the first few we make a loss, but we make profits on later ships as we become familiar with the technology and the production process… Profits are very low because we don’t have capital. We have to get bank loans and pay them back. Every year on average we have to pay in interest about 100 billion VND.’
The interviewee at Vinashin cited cash flow as the main difficulty:
‘Cash flow dictates. It is positive or negative, [depending] on the period. When it is negative we need to borrow or find another way to generate cash. One way is to equitise firms. Then we get cash from the stock market, but we lose control of the firm, and are not able to implement the plan in the future. This is why Vinashin [is quite slow] to equitise its member companies, and why Vinashin holds a dominant share [in its subsidiaries]. Stock market investors want a quick return, but Vinashin as a long term plan. We need other sources of finance: domestic and international bonds… [or] government on-lending…’

Chapter 7: Case Studies of Vietnamese Firms 205
A Norwegian financed study into Vinashin and the shipbuilding industry in Vietnam came to a similar conclusion, pointing to the large debt and following the onset of the global financial crisis the cancellation of seventeen percent of Vinashin’s order book (Gille and Bruce 2010). Indeed, the crisis and fall in orders is the principle reason for Vinashin’s ongoing woes. The same study argued that the government led drive to build the shipbuilding industry ‘posed a financial burden on the sector which may hamper the industry in the coming years if the market remains weak’. Vinashin’s financial difficulties were laid bare by first a KPMG audit in 2009 and then in 2011 a state sponsored audit, whose results have been widely reported:
Table 34: Vinashin Liabilities
Source: http://vef.vn/2010-10-30-vinashin-nhung-khoan-no-khong-dia-chi and http://uk.reuters.com/article/2010/11/29/vietnam-baoviet-idUKSGE6AS00Y20101129 for 2010 figure.
Vinashin’s debt included a USD 750 million Government issued bond, and loans from the State Bank of Vietnam. Vinashin’s debts were also misreported by the company. Both charter capital and total liabilities, for example, were reported to be lower than they actually were.
Vinashin is also charged with building the capabilities required for a world standard shipping industry. Gille and Bruce emphasise Vinashin’s weak managerial and technological capacity, as well as the low productivity of most of its shipyards when compared to rivals across the world68. Interviewees from Vinashin shipyards tended to agree that capabilities were a problem, but also stressed that each new project involved a new period of learning, and that firms were improving. Related are the technical challenges inherent in establishing new firms in associated areas of the industry. Attempts
Long Term liabilities (Tril VND)Current liabilities/ Current Assets
200770,700
200888,512
1.024
200996,635
1.040
201086,000
68. This is a familiar refrain. Vietnamese shipyards are compared unfavourably to Indian equivalents in
(Harvard Vietnam Program 2008).

Chapter 7: Case Studies of Vietnamese Firms 206
have been made, including a steel plant and a design company. However, other than issues of quality Gille and Bruce point out that most foreign buyers specify the source of the inputs they require, most of which are established foreign owned companies. The nature of the supply chain appears to be a further obstacle to Vinashin’s attempt to build local content.
In order to secure alternative sources of cashflow Vinashin shipyards established subsidiaries, often in unrelated areas such as real estate, insurance, and tourism. Many suspect the explosion of subsidiaries to be attempts by shipyards to expropriate Vinashin loans allocated to shipbuilding projects. Indeed, the activities of Vinashin and Vinashin members were prominent in causing the government to attempt to restrain investments ‘outside of core areas’ among state-owned conglomerates. Nevertheless, as suggested above, those same investments can also be interpreted as attempts to manage cash flow by indebted companies, in the face of an uncertain future.
7.2.5. Subsidiaries
‘Subsidiaries’ are firms that are wholly or partially owned by a state owned parent company: either a General Corporation or a firm reporting to a People’s Committee or Ministry. Through the equitisation process these firms have all been ‘transformed’ into either joint stock companies (JSCs) or limited liability companies (LLCs), and are all subject to the 2010 Enterprise Law. One hundred percent LLCs are entirely owned by the parent corporation. Joint-stock companies may have a number of owners depending on state policy and the outcome of the equitisation process. In principle shares will be owned by managers and workers, and the proceeds transferred to the parent company. In many cases shares will have been resold on the OTC market or the formal Hanoi or HCMC stock markets.
Northern firms in the survey were established as state owned enterprises in the 1960s. The majority began life as factories reporting to Ministries or to People’s Committees. Southern firms, with a couple of exceptions, were former private firms or foreign owned firms expropriated after the end of the Vietnam war. In most cases firms continued to operate in the same broad activities, although a number moved into associated, but

Chapter 7: Case Studies of Vietnamese Firms 207
different areas. These include: paper production, fertiliser production, metalworks, tyres and other rubber products, shipyards, glass production, apatite and coal mines, seafood, shipping and garments.
In the mid-1990s the majority of firms were placed under the direction of General Corporations. Most firms had little responsibility beyond production. Profits were transferred to the parent company. Goods were produced according to an industry plan initially agreed between the parent and the relevant ministry or people’s committee, and then subject to negotiations between the firm and the parent.
Following equitisation, or in some cases transformation into Limited Liability Companies, firms had greater autonomy and were ultimately subject to the decisions of the board that represented the firm’s shareholders. If the parent company continued to hold the majority share then it held the right of veto. Nevertheless, the interviews indicated that in a number of cases tension existed between the parent company and management. In some cases the firm itself was able to exercise sufficient power. In others, a certain frustration is clearly evident. An interview with a large shipping company under the remit of Vinalines, revealed that the management felt that industry targets were negotiable. The interviewee hinted that the personal relationships between company management and the GCs rendered the plan to be largely meaningless. A tyre producing company, under Vinachem stated that by law permission from Vinachem was required for large investments and personnel issues, however, when discussing Vinachem’s ability to ‘coordinate’ member tyre companies felt Vinachem were ineffective:
‘[It is difficult] for Vinachem to coordinate between members when they produce the same products. Vinachem’s coordination isn’t effective, although they have invited directors to meet to discuss the division of markets between members. Members just operate independently for their own benefits.’
The degree to which subsidiaries are beholden to GCs largely depends on access to loans and the ability to generate retained earnings. Nine of twenty-three subsidiaries reported

Chapter 7: Case Studies of Vietnamese Firms 208
that the main source of investment finance is retained earnings, followed by loans from SOCBs. Eleven placed SOCB loans above retained earnings. Some firms were dependent on GCs for finance and loan guarantees. Shipyards reported that loans from Vinashin were their main source of finance, followed by SOCB loans. One subsidiary of PetroVietnam also reported it its main source of finance was PVN Finance, PetroVietnam’s finance subsidiary. Large investments also required the input of parent companies. Contributions took different forms: direct grants, bank guarantees or loans. The majority of firms in which the GC held a majority share were only required to seek parent approval for the investment expenditures over a certain amount.
Subsidiaries varied substantially in terms of their perceived ability to access capital. Nine reported that access to capital was not a significant constraint on investment (four or five out of five). Three score ‘three’, and ten one or two. Of these all reported that accessing loans is more difficult or ‘the same’ (two responses), and collateral is ‘more frequently required’. In eight interviews with firms that reported access to capital to be a constraint interviewees reported that banks demanded more collateral and paid more attention to business plans and recent financial performance. One firm in which the GC had divested more than 50% reported that as the GC no longer guaranteed loans it had to rely on its own collateral.
The importance of retained earnings is also highlighted by the reported importance of the depreciation fund. A large shipping company, for example, argued that the depreciation fund was the most important source of investment funds:
‘After equitisation we have to lower the depreciation rate to make the company more attractive to investors… Profit has no meaning. Key to the development of the firm is depreciation. The Government’s minimum rate is 7.6 percent a year. We asked the Government for 29.8 percent a year for the whole fleet. Then we would have a big sum to buy or build other ships and reduce profits. From now on [after equitisation], this will have to change. There will have to be a more reasonable depreciation rate, so dividends exist so we are more attractive to shareholders’.

Chapter 7: Case Studies of Vietnamese Firms 209
Another tyre production company pursued a similar policy. Prior to equitisation the company recorded low profits ‘because as an SOE we must pay 32 percent CIT [Corporate Income Tax] to the state, so it is better [to keep the money] and raise the living standards of the staff’. They also deployed a high depreciation rate (and so lower recorded profits) in order to pay off loans as quickly as possible. The interviewee felt the best future strategy would be to continue to declare low profits and issue new shares rather than dividends to existing shareholders as shares were considered to be overvalued.
All subsidiaries were asked to report the ratio of short term to long term liabilities. Ten responded. Of these six reported between 98% and 100% of liabilities were short term. Two reported 44% and 49% and two at 75%. Three firms that subsequently listed had an average of 65%, 83% and 76% short term liabilities between 2008 and 2012.
Subsidiaries of PetroVietnam, Vinashin, Vinatex, Vinacomin and Geruco all reported in interview that the GC guaranteed loans. However, subsidaries of Vinapaco, Vinachem and VEAM claimed they had no support from their GCs, who were thought to be financially weak themselves. Three of the five firms that were listed on the stock market were owned (51%) by Vinachem. After the initial listing none of the three issued further stock. Balance sheet data suggests that the proceeds from the initial sale in all three cases went to paying off short term loans (all three saw a decline in the short term to long term liability ratio and a total fall in liabilities). However, both the short term to long term liability ratio and total liabilities then increased until 2012. The ‘acid ratio’ - the ratio of cash, short term financial investments and short term accounts receivable to short term liabilities - was below one in all three cases. One tyre firm saw an increase in its acid ratio to above one in 2009 as a result of a fall in input costs and rise in output prices69. Cashflow statements and changes in balance sheet data suggest fixed capital investments were all financed from retained earnings and loans.
In contrast two subsidiaries of PetroVietnam that were also listed displayed an acid ratio of over one, and cashflow statements suggested investments were partially financed from capital injections from shareholders. In interview both had claimed to have had to remit
69. Provided as an ‘explanation’ for an increase in the firm’s profits on vndirect.com.vn.

Chapter 7: Case Studies of Vietnamese Firms 210
90 percent of their profits to PetroVietnam, suggesting they were almost entirely dependent on the GC for finance.
7.2.6. Parent Child Structure
A second form of subsidiary takes the ‘parent - child’ structure. These firms essentially operate as a holding company with the parent company having full or part ownership of a number of subsidiaries. The parent company in turn is partially owned by the state corporation. The majority of these companies are garments companies under Vinatex, or shipbuilding companies under Vinashin. Others include Viglacera, a glass production company under Vinachem, and Tan Mai, a paper production company, under Vinapaco. These firms are large employers - Viglacera employs approximately 16,000 people, Phong Phu (a garments company) over 17,000, Nha Be (a garments company) 7,000 and Viet Tien (a garments company) 7,500. All reported that there was no capital constraint on investment (scoring it ‘five’). The primary source of investment was retained earnings followed by SOCB loans. Viglacera, Phong Phu and Nha Be all listed subsidiaries in the stockmarket. Listed subsidiaries maintained a relatively low acid ratio (under one). Closer analysis of the balance sheets suggests that the low acid ratio is the result of holding low cash balances and no short term financial investments suggesting they can depend on their parent companies for emergency liquidity. Phong Phu, Viglacera and Viet Tien have all published balance sheets since 2010, however they are not disaggregated. For all three acid ratios are around one, and short term liabilities are a high proportion of total liabilities.
There are a number of reasons why these firms took on the parent company model. The first, according to interviewees, lay in the firms’ relative success in the 1990s, and in some cases the early 2000s. The GC called on the firm to support ailing GC members so as not to have to fire workers. Most of those interviewed felt that supporting weak firms was in some respects a waste of resources, however, all tended to agree with the manager of Phong Phu, who said: ‘it is ethical. When you have a baby, you have to feed it. You cannot let it die’. In doing so these firms took on a parent - child structure, and were able to manage the cash flow of the firms they controlled. The fact that they were called upon

Chapter 7: Case Studies of Vietnamese Firms 211
to do this points to better quality management. Indeed, interviewees suggested their early achievements learning new technologies or establishing relationships with foreign partners set them apart from other firms, and led to them taking on further responsibilities at the bequest of the state.
The second reason is that firms were successful in areas consistent with Vietnam’s comparative advantage, in particular low wage, low technology activities. As such successful firms were likely to generate higher revenues, and so were able to expand by establishing new factories. Shipbuilding companies appear to be an exception. The majority of subsidiaries were established in 2007 following Vinashin’s securing an international bond. As explained above, money was distributed to subsidiaries, and many in turn established subsidiaries in unrelated areas. Whether this was a genuine attempt to ‘hedge’ against potential price movements as one interviewee argued or straightforward ‘hollowing out’ of state assets is a matter of conjecture (Cheshier and Pincus 2010).
Fourth, the process of equitisation itself, according to the majority of interviewees, provided the firm with greater autonomy. What is striking is that most firms established subsidiaries that specialised in financial investments or real estate investments. Others sought to use excess land to build industrial zones, hotels, or residential areas. Interviewees gave a number of explanations. The first, was that it made sense to use assets available to the firm, particularly land. The second, most clearly articulated by Nha Be, was that the ultimate responsibility of the firm was to generate revenues to satisfy the requirements of the Corporation:
‘Nha Be diversifies into other services to increase revenue. Vinatex simply pays attention to revenue. Nha Be must maintain and develop the capital for Vinatex. Nha Be must diversify to meet this demand’.
The manager is referring to the fact that the loss of state capital is a punishable offence. However, the manager’s comments are supported by another long time manager of the garments company Viet Tien:

Chapter 7: Case Studies of Vietnamese Firms 212
‘The primary business is garments. But the company must stand on its own two feet. Production is the main business but business (trading and small production for trading) is the second leg that depends on opportunities. We started businesses in the 1990s… anything that is allowed by law. Usually [the objective] is to create employment. Trading is to develop and have more revenue...’.
Viet Tien’s early ventures included joint ventures with foreign companies seeking a partner to sell products in Vietnam and with domestic suppliers (buttons, linings and polyester) in order to ensure greater quality. They also ‘traded’ products such as cosmetics and telephones, as well as producing products for the Vietnamese military. Like the manager of Nha Be the manager of Viet Tien argues that the ultimate objective was to meet Vinatex’s targets. However, although the targets stem from the Government’s growth targets for manufacturing, there appears to be little restriction on which activities actually generate revenue.
‘Every year to reach GDP growth of seven to eight percent manufacturing growth must be twice the GDP growth rate. Each manufacturing company must reach a growth rate of at least 15 percent year on year. Each industry must assign targets to each company to achieve the growth rate of the industry. So Viet Tien must try to achieve this growth rate. We must expand our business, open new factories etc. We must consider these orders as law.’
The difficulty for garments companies is that although investments in the garments and textiles sector creates employment and generates foreign exchange profits are small, suggesting a further motivation to diversify into new areas. Phong Phu, another of the larger garments companies, and also transformed into a parent child corporation began diversifying outside of textiles and garments in 2003. According to the manager:

Chapter 7: Case Studies of Vietnamese Firms 213
‘The core business is textiles. The other businesses are property and commercial centres. The future strategy is that textiles remains the core business, but we will try to diversify into others. We hope other businesses will account for forty percent of total revenues and textiles sixty percent of total revenues. Other businesses will bring in more profits than textiles. We will take revenues from other businesses to invest in textiles’.
At the time of writing Phong Phu has eight garments and textiles subsidiaries, three joint ventures in related sectors (threads and textiles), majority shares in eleven related joint stock companies, four subsidiaries engaged in real estate and trading activities, shares in fifteen joint stock companies engaged in real estate and investment, shares in four joint stock companies engaged in unrelated activities as diverse as logistics and ‘providing services related to aircrafts’70. Its investments include holding shares in joint stock banks and investment companies established by other state owned enterprises.
Nam Trieu Shipbuilding Company, a 100 percent limited liability subsidiary of Vinashin, and one of the largest shipyards in Vietnam, has also established over thirty subsidiaries of its own. The majority are in shipbuilding related activities and appear to correspond to the government’s stated objective to increase domestic value added in the shipbuilding industry, however, a number of others operate in the tourism, construction and ‘investment’ sectors.
Each of the ‘parent-child’ companies has also purchased shares in other domestic companies, joint ventures and joint stock banks. In most cases firms play no managerial role. Their objective is both dividends and an expansion of their portfolio account.
In conclusion, subsidiaries of state owned corporations fall into two broad groups: those that remain single activity firms dependent on the corporation for support with financing and strategy, and those that, as part of the ‘transformation process’ have assumed the parent-child structure, and who demonstrate a higher degree of financial autonomy.
70. http://www.phongphucorp.com/ accessed 26 June 2012.

Chapter 7: Case Studies of Vietnamese Firms 214
7.2.7. Quasi-private SOEs
Another category of firm is the ‘quasi private state owned firm’71. These firms are described separately from subsidiary corporations and GCs because, although originally state owned, they were not policy creations (such as the GCs), reported to a state government body, in most cases a People’s Committee (rather than an upper level corporate body) and, as the following paragraphs will suggest, were relatively autonomous. In a number of respects these firms are most similar to the handful of private conglomerates that also have a long history, but for various (mostly unknown) reasons have never been partially or wholly owned by the state. These firms will be described in the next section.
All four firms report that they face no capital constraint and that accessing loans is ‘easier’, although Hanosimex claims that banks now pay more attention. Only FPT is listed on the stockmarket, with a acid ratio of over one, high interest and dividend payments from investments in other companies and banks.
One of the most striking characteristics of these firms is their unusual histories. Hanosimex and Protrade began life as entrepreneurial endeavours. Food Processing Technology (to become Corporation for Financing and Promoting Technology in 1990 and FPT Corporation in 2008) was established in 1988 by the current CEO, and a number of his associates, all of whom had studied Maths and Sciences in Moscow. The company was originally a state owned enterprise under the Ministry of Science of Technology. The interviewee described the company’s movement into software and computers as the result of a chance meeting. The unauthorised version involves the smuggling of computers from Russia to Vietnam (Cheshier 2010). The company’s growth throughout the 1990s was built on its becoming the official distributor of foreign computers and software. From 1997 FPT moved into Telecoms, establishing FPT Telecom and then winning the right to distribute Samsung phones in 2000 and Nokia phones in 2004. In 2003, apparently after a visit to Bangalore, FPT developed FPT software, which after initial teething problems has established itself as a low end regional software producer. In the mid 2000s FPT
71. The emergence of these types of firm is explored in detail in Cheshier (2010)

Chapter 7: Case Studies of Vietnamese Firms 215
cemented its ties with Microsoft and Cisco systems and attracted capital investment from Intel Capital and Texas Pacific Group. It also expanded its operations into, to date, eleven countries (FPT 2010). FPT has also invested in a University dedicated to teaching IT related skills and high tech parks. In 2006 FPT listed on the stock market72. The corporation is separated into two broad sections: ‘Information Technology and Communications’, and ‘Investment’. The majority of companies are JSCs, and FPT holds a majority share in all but FPT Telecom. On the investment side it holds a minority share in Tien Phong Bank, FPT Securities and FPT Capital, FPT’s ‘fund management arm’ managing nearly USD 200 million. According to the annual report the majority of FPT’s real estate operations are building plant for the company.
In 1982 the founder and current CEO of Protrade73 borrowed four million VND from the state owned Animal Husbandry company he had worked for since 1976 to establish a rubber processing company. By law he had to establish the company as an SOE, even though he repaid the loan within four years. He then branched into timber, paper and packaging, bottled water and garments, established joint ventures with a number of foreign companies (to establish, amongst other things, a golf course and potentially a horse racing course and a hospital) and merged with a number of domestic firms. Since 1995 Protrade has held thirty percent of a a large foreign distributor of dairy products in Vietnam. Although an SOE, Protrade regards itself as essentially a private company. The CEO claims the state has no right to the company’s assets since he repaid the state loan in 1986, and since then has received no extra state funds or support. Prior to assuming the parent - child model in 2006 Protrade equitised one of its subsidiaries and had to petition the People’s Committee in order to keep the proceeds of the sale that should, in law, have gone to the State.
72. The state share is listed at seven percent, foreign ownership at forty five percent and ‘others’ at forty eight
percent. Mr Binh’s share places him as the richest man in Vietnam.
73. Information for Protrade comes from an interview with the CEO and also with the Manager of the
garments subsidiary in 2009.

Chapter 7: Case Studies of Vietnamese Firms 216
A third company, Cholimex, was in many ways a solution to the economic chaos of the early years of the unified Vietnamese state74. Cho Lon, four districts in the centre of HCMC, was prior to 1975 the city’s financial and production centre. Most businesses were run and owned by Vietnamese of Chinese ethnicity. According to the Vice Chairman of District 5 People’s Committee in the late 1970s and early 1980s:
‘The HCMC People’s Committee came up with the idea for Cholimex because they realised that… manufacturing equipment had no parts, there were no raw materials, new policies were not promoting a market economy, most entrepreneurs from before 1975 had either left or were in re-education camps. So HCMC had no human capital, no equipment and no capital. The People’s Committee suggested the reorganisation of companies… and looked to people on the ground. Those left were chinese. District 5 officials acted as a bridge with local entrepreneurs’.75
District 5 contributed the equivalent USD 500 thousand from its budget as well as land for factories and office buildings. The company also raised nearly the equivalent amount in gold from private chinese households in the area. Cholimex’s task was to leverage its relationships with Chinese suppliers in Singapore, Taiwan and Hong Kong to import goods required for production by local factories. At first Cholimex effectively bartered Vietnamese produce for foreign goods as foreign exchange was in short supply. Cholimex also operated as an intermediary between producers and farmers in South Vietnam, exchanging goods such as beer, sugar and milk for agricultural produce. In 1983 the government decided to clamp down on private activity demonstrated by Cholimex and nationalised the company, buying out the local share holders. Exports would, until 1989, be channelled through a a state trading company. However, the original management remained, and the company expanded its operations upgrading its existing operations and establishing a new garments factory. In 1993 Cholimex was reformed and its various
74. 74. The initial interview was supplemented and confirmed by an interview with an original member of
HCMC People’s Committee in August 2009.
75. The interview was conducted separately from the UNDP survey.
Chapter 7: Case Studies of Vietnamese Firms 217
workshops and factories became independent accounting units subordinate to Cholimex. Over the next nearly two decades the company expanded into commercial services, aquaculture, timber, seafood trading, producing medical equipment (in which Cholimex held 24 percent), electronics assembly, construction and real estate. The company presently holds fourteen subsidiaries, and regards its primary role as ‘investment’.
Two further companies, Becamex and Dakruco, are provincial SOEs with particular responsibilities: industrial zone construction and rubber cultivation. Becamex was a small SOE established in 1976 in Binh Duong, a relatively unpopulated province with abundant land and close to HCMC. In the early 1990s Singapore was concerned that its small size and population was constraining its growth and so looked to make investments further afield as part of a strategy of ‘regionalization’, which first comprised of Malaysia and Indonesia before expanding to include China, Vietnam and India. The ultimate objective was to create ‘economic space’ for Singapore based companies in lower cost emerging economies, in the process freeing up Singapore for more value added activities. The strategy involved working with foreign governments to build industrial zones with the capacity to house Singaporian firms (Yeoh 2004). The first such park in Vietnam was the Vietnam Singapore Industrial Park (VSIP), a joint-venture between a Singaporean consortium and Becamex. Becamex went on to build either on its own or as a joint venture nine Industrial Parks. It also has interests in a number of real estate projects, including a new town, major infrastructure, as well as shares in a number of companies including a newly established pharmaceutical company. A series of interviews with members of the People’s Committee, employees and former employees of Becamex, revealed that the company has great sway in issues such as planning, infrastructure development and FDI attraction in the province. A large proportion of its revenues are derived from rent paid by foreign firms in the industrial zones76.
The quasi-private firms appear to have fewer ties to the state’s industrial plans and the will of local and central government. Although some continue to operate in areas consistent with their original business license interviews revealed that the companies devised their own business strategies. The firms themselves appear to have grown rapidly
76. An account of Dakruco in Binh Duong can be found in (Penrose et al. 2010)

Chapter 7: Case Studies of Vietnamese Firms 218
with revenues sourced from distribution licenses and access to foreign investors and land. Protrade was, from establishment, devoted only to those businesses that met the CEO’s three rules for investment:
‘One, pick suitable products with no competition, and especially no competition from FDI. Two, it must be within the financial limits of Protrade. Three, investment must be sufficient to ensure acceptable quality and scale’.
The manager also prided himself on ‘never letting an opportunity pass’. Protrade is also an exception in that the company has, arguably, never been reliant on the state. Cholimex, although with a vastly different history to Protrade, is another company whose growth has explicitly been based on establishing factories and firms on the premise that they make money, to the extent that it now regards itself a holding company. Other companies in the survey - Dakruco, Hanosimex - had established similar levels of autonomy. Some, like FPT and Protarde, remained primarily attached to state imposed activities, however, at least according to the interviewee, were not tied to state plans. Others, had, for nearly two decades built portfolios of firms, sometimes at the request of the state, on other occasions based on commercial criteria. The degree to which firms were subservient to state desires varied, and depends in part on the size and the importance of the firm. Becamex and FPT, for example, suggest independence from state interests (the state now only holds seven percent of FPT) based on size and importance. The managers of Protrade and Dakruco implied that actual ownership was still a matter of debate, and would come to a head when, if ever, Protrade would be equitised. For both, the most contentious issue was who had the right to ‘state capital’ and its proceeds. The interviewees’ argument rested on not only ownership rights, but also the assertion that they should receive rewards for their efforts. Cholimex and Hanosimex, on the other hand, operate as if state interests in the company are incidental, although, Hanosimex, at least, suggested it is happy to abide by the wishes of the local people’s committees.
FPT’s equitisation saw the transfer of shares in the company to, initially, staff, workers and managers, and then to foreign buyers and others following its listing on the HCMC stock market. Although senior managers did not receive the initial proceeds - all of which

Chapter 7: Case Studies of Vietnamese Firms 219
were transferred to the central budget - they have benefited from the sale of shares and increased net worth following the period of stock market inflation and FPT’s position as one of the more stable shares. The majority of quasi-private companies have grown on the back of relatively stable revenue streams generated by state allocated rents. It is probable that there exist, or at least have existed, illegal payments designed to acquire or keep access to such rents. There are also, close personal relationships between senior managers and powerful members of the Government or Party. Cheshier (2010), for example, points to the marriage between the CEO of FPT and the daughter of General Vo Nguyen Giap. Interviewees hinted at a close relationship between the CEO of Becamex and senior Party officials in both HCMC and Hanoi. Accounts of systems of patronage in Vietnam suggest that it is unlikely that such firms, and their managers, could not have achieved what they have achieved without ‘playing the game’77.
A history of success has also helped firms access capital. In explaining why ‘collateral was less frequently required’ the manager of Cholimex explained:
‘...banks can see our success on annual audited financial reports, and can see the increase in capital and the expansion of our business. [Because of our] reputation we do not require collateral.’
Protrade and Hanosimex have also developed relationships with SOCBs. However, the predominant source of investment capital for all firms is retained earnings, with bank loans more often used for working capital. FPT and Becamex have also turned to the stock market. FPT listed in 2008. Becamex has listed two of its subsidiary construction companies. A further source of finance is joint ventures with foreign investors, a trend throughout the 1990s, and continuing today. All companies have and continue to diversify and purchase shares of financial institutions and other Vietnamese firms. The majority of FPT’s investments are conducted by its investment subsidiary. It also owns a share of
77. See, for example, Gainsborough (2010) and Fforde (2010).

Chapter 7: Case Studies of Vietnamese Firms 220
Tien Phong Bank. Becamex also holds shares in a number of firms. Dakruco has expanded into at least thirty separate areas78.
7.2.8. Private Companies
The fifth category is private companies. Six of the surveyed firms are in the original ‘Top 200’. A seventh and eighth, Cat Thai and Fuvi, are included as representative of relatively successful medium to large size private firms (both employ approximately 400 people). The majority of companies were established in the early 1990s. In the Top 200 survey, one exception, Bitis, a footwear company, was established in 1982. Three companies are seafood producers, two are parts suppliers and two plastic moulding companies.
Capital is not a constraint for all but one of the larger firms. Sources of finance are loans from Joint Stock Banks (ranked as number one for five companies and two for three) and retained earnings. Short term liabilities comprise 95% to 100% of total liabilities. All reported that it was easier to access bank loans as there were more banks willing to lend, however collateral was always required. Two seafood companies listed on the HCMC stock exchange. Initial proceeds were used to pay off short term loans, although both continue to have a low acid ratio. One issued new stock on two occasions. Balance sheet data suggests the proceeds were used to pay off loans.
Minh Phu
One such firm, Minh Phu, a seafood company, began operations in 1988 as an agent for an SOE ‘as the government didn’t encourage private enterprises’. Between 1988 and 1992 the company ‘hired a factory’ and ‘assigned the SOE to sell its products’. It is likely that Minh Phu is an example of SOE managers using state assets for personal gain. The company was officially established in 1992 following the new Law on Enterprises. According to the manager, there then followed a period of difficulty and confusion as the company still had to rely on provincial SOEs to manage exports as well as interference from SOEs in the province. The company built a number of processing factories in the late 1990s and 2000s, became a LLC in 2002 and a JSC in 2006. In 2004 Minh Phu
78. Information published on the company’s website, and is available on request.

Chapter 7: Case Studies of Vietnamese Firms 221
opened a subsidiary in the US to distribute its products. Minh Phu currently owns nine subsidiaries in seafood production79.
In interview the manager expressed a desire to diversify outside of seafood, ideally into ‘real estate, ports, security, banking and an investment fund’. Apparently other shareholders argued that Minh Phu should continue to focus on their core capabilities (‘Minh Phu is good at seafood so we must focus on this’). One concern was increased and apparently unfair competition from SOEs. The manager argued that the state invested the proceeds from equitisation into SOEs, ‘who didn’t have to pay interest’. He went on: ‘SOEs don’t have to make a profit, only break even. Private companies must make high profits to pay interest rates to the banks, satisfy shareholders and pay dividends. That’s why SOEs can buy [inputs] at high prices and sell low… [However], since 2007 all SOEs have become JSCs. Competitive pressures will reduce and [we] will be able to buy inputs at reasonable prices and sell final products at low prices’. Minh Phu felt it was easier to get loans, ‘as there were more banks competing for clients, especially high prestige companies’. Some banks, particularly those who were unfamiliar with the company, required collateral, however, the company’s reputation meant that loans were relatively easy to come by without collateral. The primary source of investment capital is retained earnings as interest rates are high for long term loans. Occasionally, however, Minh Phu turns over short term loans. Minh Phu did list in 2008 and its balance sheet demonstrates large investments in real estate and short term financial assets (around ten percent of total assets), particularly in 2008 and 2009 suggesting the company’s manager eventually got his way.
Cat Thai
Cat Thai is a plastics injection moulding company that supplies foreign (predominantly Japanese) manufacturers in Vietnam. The company was established in 1999 by the current director who established the company as a 29 year old chemical engineer who had already amassed some experience working for Mitsubishi. In interview he claimed he had at first tried to connect foreign clients looking for Vietnamese suppliers with state owned
79. http://minhphu.com/quan-he-co-dong.

Chapter 7: Case Studies of Vietnamese Firms 222
plastics companies. However, they ‘were not able to make decisions’ so he decided to establish his own company. At first Cat Thai lost money due to inexperience (a mistake producing products for a large multinational company cost USD 50,000). However, over time he managed to improve, purchase new machines and attract new customers. In 2003 Cat Thai moved to a larger location. In 2006 they formed Duy Anh Engineering Technologies in a joint venture with Okumura Corporation, a Japanese construction company.
The history of the company’s growth is a typical story of incremental growth. According to the manager and founder the key to the company’s growth was learning:
‘We need to learn from customers. Some people think it is easy to make [our products], but going from plastic parts for a refrigerator to making a refrigerator is very difficult. Our customers spend lots of money on training… new suppliers, but lots go bankrupt. Chasing stupid ideas means we lose… We can’t jump ahead. We can’t buy expensive and special machines and just use them… They are easy to get but hard to use. We have to know the machines, must feel the machines, know if they are sick, how they are working. Buying the machine and owning the machine are different [things].’
The company tried to accelerate the learning process by trying to make more sophisticated products, and ‘learning from our mistakes’. Banks did not help the process. According to the interviewee it was ‘very difficult to get money from the bank’. The bank required collateral and ‘sent inexperienced young people to evaluate [possible assets to be used as] collateral… We could only get up to seventy percent of the value’. The banks wanted the company to first invest in one machine and then once the company showed a profit to purchase a second. This was ‘too slow’. Ideally Cat Thai would have purchased ‘ten machines at one time’. This was a particular problem with the joint venture, Duy Anh, which despite the presence of the Japanese partner could not access enough bank credit. The solution was for Cat Thai to buy the machines and transfer them to Duy Anh.

Chapter 7: Case Studies of Vietnamese Firms 223
Cat Thai also appeared as a case study for a Japanese study into supporting industries in Vietnam:
‘Cat Thai’s managing director also notes that, while business inquiries from MNCs are increasing rapidly, the most serious problem was difficulty in raising enough capital from local banks to expand production capacity. He laments that banks lack the understanding of how essential it is for MNCs to purchase high-quality plastic parts of which there is an acute shortage in Vietnam, and that his factory can supply them. Banks do not appreciate the value of a large number of long-term supply contracts between Cat Thai and MNCs and are unwilling to finance the purchase of expensive machines. But he believes that, as long as high standards are maintained, the business will be very secure and prosperous.’
(Mori and Ohno 2004, p.21)
Initial start-up capital was the manager’s own savings and the sale of family land. Currently the main source of investment capital is retained earnings. The state and SOEs enter the story primarily as a constraint on firm growth. At one point in the interview the manager makes explicit reference to his independence:
‘I have no ’umbrella’ in the government. We only work with our own knowledge and heart. We do our best, even the things we don’t want to do.’
Fuvi
Fuvi was established in 1994 by former employees of a state-owned plastics company. Like Cat Thai their growth has been based on taking on larger orders of increasing sophistication, primarily from Japanese manufacturers operating in Vietnam:
‘In the first year customers were testing our capacity. At the beginning we bought only small CNC (Computer Numerical

Chapter 7: Case Studies of Vietnamese Firms 224
Control) machines so we could learn to use them. Once we were capable we would buy bigger machines.’
The company bought one new machine every year, and invested in management and technology ‘rather than investing horizontally’. However, Fuvi was concerned that they were relying only on customer orders, which could change quickly. For example, motorbike companies required new moulds only when they had new models, which might be ‘once or twice a year or not at all’. Their diversification strategy was based on a conversation the director had with a friend working in the construction industry:
‘[the friend] was complaining about having to dispose of truck loads of wooden form work. It was a waste of money. So we saw the opportunity to… develop plastic form work’.
It took the company over six years to develop the expertise and purchase the equipment necessary to manage large quantities of plastic and produce large enough moulds. The company worked closely with its Japanese suppliers in order to develop the required capabilities. At the time of interview the company’s strategy was described thus:
‘We don’t rely on mould production for profits. We have to go into product diversification. Producing moulds helps to train workers and build expertise. We prefer to produce difficult moulds rather than cheap moulds at large volume because it is higher value and we develop expertise. We will try to expand in plastic form work production80, which is becoming a strategic product [and so subject to tax reductions]. Some profit from the plastic form work will be used to develop the mould area because we want to be competitive in terms of making difficult and large moulds. For example, for cars, aircraft, ships, construction etc.’
80. Fuvi’s formwork products are used to set concrete in the construction of large buildings. The plastic
panels can be assembled rapidly, are extremely durable, cheap and easily stored and cleans. Fuvi even offers
to recycle the panels once they are no longer needed.

Chapter 7: Case Studies of Vietnamese Firms 225
Fuvi also exports to a number of companies around the region, and has established a distribution office in Thailand. Between 2007 and 2011, however, its copyrighted form work products have become the company’s primary activity, and are ubiquitous in HCMC’s many construction sites.
Bitis
Bitis has a very different history. It was established in 1982 as workshop producing sandals. As rubber was the only input used by Bitis produced in Vietnam, the director was forced to smuggle the majority of inputs into the country. The company began by producing footwear for export to the Soviet Union as part of a programme to repay Soviet loans to Vietnam. A state owned organisation managed exports on behalf of Bitis. In 1986 the company launched its own brand and turned its attention to the domestic market and to Eastern Europe. In 1989 the company became the first private company to win an import and export license. It then branched into France, Germany and Spain and slowly began to build its operations and brand in Vietnam. In 1990 it upgraded its factory with Taiwanese technology, formed a joint venture with a Taiwanese firm in 1991, transformed into a LLC in 1992, established an office in the United States in 1994, and branched into ladies shows and leather footwear in 1995. It has continued to invest in new technology, including technology from Korea in 1996 and Italy in 2006. It has also continued to expand across the world, including China and South East Asia. In 2002 Bitis began to expand into real estate, hotel, tourism and office space rental. Of particular interest and indicative of the firm’s reach it established ‘Trade Centres’ at the border with Cambodia in the Central Highlands, and Lao Cai on the Chinese border.
Unsurprisingly, each of the case studies mentions difficulties engaging in competition with SOEs and establishing the company. All the examples was established in the 1980s or the 1990s, and so were affected by legislation affecting issues such as international trade, and, to an extent, access to finance. Of the firms surveyed only Cat Thai and Utxi have no clear connections to the state sector. Minh Phu initially made use of an SOE’s ability to trade. Fuvi was established by ex employees of an SOE. It is improbable that Bitis had not forged and benefitted from close association with government officials. And

Chapter 7: Case Studies of Vietnamese Firms 226
like Cholimex its early years were closely associated with the efforts of the state to rebuild the economy, and repay the Soviet Union.
All firms were established with entrepreneur’s own capital - either savings, loans from family and friends or the sale of family assets. In all cases the entrepreneurs based the firm on capabilities they had previously learned. Only Bitis benefitted from a state allocated rent, in this case trade licenses. In this regard it closely resembles FPT and other quasi-private SOEs. Even so, like the rest of the sample, the company’s growth was financed from retained earnings. In most of the interviews entrepreneurs described the balance they had to make between managing cash flow and investing beyond their capacity and capabilities. Both banks and potential foreign customers were clearly wary of firms’ capacity to meet orders. This explains entrepreneurs’ emphasis on the learning process, and also on the need to move into progressively more sophisticated production, in the process generating greater revenues, attracting more customers and potentially providing the basis for diversification into new products.
Firms were limited in their investments by the reluctance of banks to provide adequate loans. Banks required collateral, although a number of interviewees did suggest that over time once banks were satisfied with the firms’ ability to repay loans and had developed a knowledge of the business then it was easier to access credit.
Firms were concerned about basing a business on unreliable sources of revenue. The manager of Minh Phu, for example, expressed his own opinion that the company should diversify into real estate and other investments. The manager of Fuvi described the necessity to develop the company’s own products, which could, if necessary, then fund further investments in the main plastic moulding side of the business. The manager of Minh Phu pointed to the potential losses if quality fell short of customer’s requirements.
Ultimately, these five case studies are examples of ‘organic growth’, in which in the absence of outside financing and in a difficult, often hostile environment, entrepreneurs have had to build capabilities and reinvest retained earnings. Each of the companies makes standard, easily copied, products, and only one, Fuvi, has managed to establish a premium product of its own. Recalling the argument of Chapter 3 these firms developed

Chapter 7: Case Studies of Vietnamese Firms 227
strategies to ensure to the best of their ability a constant flow of revenues. The larger firms were happy to diversify into new areas, including real estate and financial assets. They were also less dependent on the expansion of their core business for growth and increased revenues.
7.3. Listed firms
This section will present the findings first of the analysis of the available balance sheets and cash flow statements of original surveyed firms listed on the Hanoi and HCMC stock exchanges and then of sixty-four firms listed in 2007 and 2008 on the Hanoi Stock Exchange.
Methodology
The quarterly balance sheets and annual cash statements of the sixty-four non-financial firms that listed in 2007 and 2008 on the Hanoi Stock exchange were accessed using the website www.vndirect.com.vn. Quarterly cash flow statements are not made available. Although it is easier to extract the data from annual balance sheets, annual balance sheets tend only to report firms’ financial status in Quarter 4 of each year81. Examination of quarterly data suggests that in many cases such annual data misrepresents the position of the company, particularly in regard to the objectives of this chapter. For instance, a company that issues stock in Quarter 4 may display an extraordinary cash balance for that year. By Quarter 1 of the following year the cash may have been used to pay off debt or financed some investment in fixed or other assets. It would be inaccurate, therefore, to conclude that the firm typically held large cash balances, or that a high ratio of current to total assets signified a new strategy for the firm.
The purpose of the study was to determine how firms used the proceeds from stock issues, in particular: were the proceeds used to finance or fund investments?; were the proceeds held as cash or short term assets, and if so was this temporary or did it appear to be an attempt to raise the acid ratio?; were the proceeds used to reduce the debt burden?;
81. Available and easily accessed on datastream, for example.

Chapter 7: Case Studies of Vietnamese Firms 228
and finally is there evidence that firms used the proceeds to diversify into long term financial assets or real estate?
The following methodology was followed for each firm. First, it was determined when firms issued stock and how much was collected. Cash flow statements reported how much was collected in any given year. For each company www.vndirect.com.vn reported in which quarter stock was issued. Available quarterly balance sheet data was then transferred to Excel. For each quarter the ‘acid ratio’ - cash and cash equivalents, short term financial investments and short term accounts receivable divided by current liabilities - was calculated, as was the proportion of short term to long term liabilities. The acid ratio is a commonly used measure of a firm’s ability to meet its current obligations. The proportion of short term liabilities of total liabilities provides an indication of whether firms are able to reduce their dependency on short term debt for working and investment capital. These ratios along with changes in fixed assets and the proportion of long term financial assets (including investments in joint stock companies) and real estate to total assets were then graphed to identify trends. The balance sheet was then examined to determine the uses of the proceeds of stock issues. Unfortunately, the absence of quarterly cash flow data means it is difficult to identify with complete accuracy the uses of the proceeds, particularly for small amounts. However, in many instances stock issues coincided with significant changes in one or more stocks. For example, there might be a significant fall in short term loans, a large increase in fixed assets or holdings in other companies, or in cash balances. Vndirect.com.vn also publishes information released by the company, and in a number of cases companies reported new investments or explained unusual changes in recorded profits or revenues.
Surveyed Firms
Of the original ‘Top 200’ firms twelve firms subsequently listed on the Hanoi or HCMC stock exchanges. Six firms opted to list subsidiaries (Viglacera listed four firms, Vinaconex eight, Lilama, eight, Phonh Phu, two, Nha Be, one, Dakruco, two). Of these the subsidiaries held low cash balances and maintained ‘acid ratios’ well below one.

Chapter 7: Case Studies of Vietnamese Firms 229
Moreover, subsidiaries tended not to hold long term financial assets or real estate, and short term liabilities dominated total liabilities (96% and higher).
Three other companies (Dak Lak, Lam Son and FPT) also listed, and analysis of their balance sheets suggests substantial differences compared to the subsidiaries. Acid ratios are consistently above one, and annual cash flow statements report substantial interest and dividend payments. Moreover, stock listings appear to have served to raise the acid ratio by either increasing the proportion of current assets or reducing the short term debt burden.
Firms that were already diversified into two or more distinct activities and so meet the definition of conglomerate have continued to diversify. FPT, Nha Be, Cholimex, Viet Tien, Phong Phu and Protrade have all moved into new and disparate areas. However, as balance sheets, income and cash flow statements are all aggregated it is impossible to determine the financial breakdown of each company.
As mentioned above two seafood companies, Minh Phu and Cataco, diversified into real estate and increased the ratio of long term to total assets to secure more diversified cashflow revenues. Dividends and interest payments from Minh Phu’s investments82, for example, secured a return of between 8% and 20% of total pre-tax profits between 2009 and 2011.
Non-Financial Firms listed in 2007 and 2008
To look more closely at the uses firms made of the proceeds from listing stock the quarterly balance sheets and annual cash flow statements of sixty-four firms that listed on the Hanoi Stock Exchange 2007 or 2008 were analysed.As might be expected the uses of the proceeds from stock issues are often ambiguous. In some instances it is far from clear how funds have been used, and in others funds have been used in a variety of ways. Studart and Davidson point to the importance of stock issues in ‘funding’ investments, which in practise might result in a reduced burden of short term debt and higher acid ratios as either firms are able to hold more in current assets or lower debt. Of the sixty-
82. Available at vndirect.com.vn
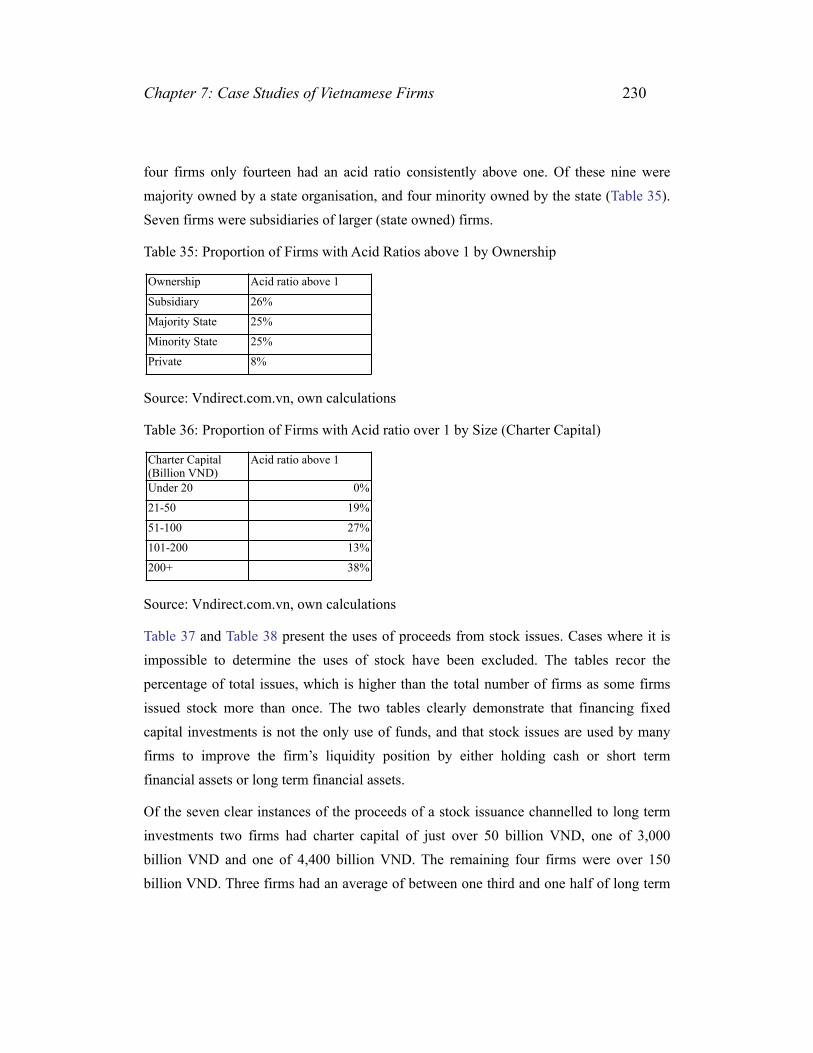
Chapter 7: Case Studies of Vietnamese Firms 230
four firms only fourteen had an acid ratio consistently above one. Of these nine were majority owned by a state organisation, and four minority owned by the state (Table 35). Seven firms were subsidiaries of larger (state owned) firms.
Table 35: Proportion of Firms with Acid Ratios above 1 by Ownership
Source: Vndirect.com.vn, own calculations
Table 36: Proportion of Firms with Acid ratio over 1 by Size (Charter Capital)
Source: Vndirect.com.vn, own calculations
Table 37 and Table 38 present the uses of proceeds from stock issues. Cases where it is impossible to determine the uses of stock have been excluded. The tables recor the percentage of total issues, which is higher than the total number of firms as some firms issued stock more than once. The two tables clearly demonstrate that financing fixed capital investments is not the only use of funds, and that stock issues are used by many firms to improve the firm’s liquidity position by either holding cash or short term financial assets or long term financial assets.
Of the seven clear instances of the proceeds of a stock issuance channelled to long term investments two firms had charter capital of just over 50 billion VND, one of 3,000 billion VND and one of 4,400 billion VND. The remaining four firms were over 150 billion VND. Three firms had an average of between one third and one half of long term
Charter Capital (Billion VND)Under 20
21-50
51-100
101-200
200+
Acid ratio above 1
0%
19%
27%
13%
38%
Ownership
Subsidiary
Majority State
Minority State
Private
Acid ratio above 1
26%
25%
25%
8%

Chapter 7: Case Studies of Vietnamese Firms 231
and short term non-fixed assets as a proportion of total assets. All three also received a significant return from dividends and interest payments from their investments. Three firms invested in joint-stock companies, the remainder in undefined 'long term financial assets' or real estate.
Nevertheless, only two firms with between 40% and 50% of non-fixed assets as a proportion of total assets could be regarded as coming close to being ‘overcapitalised’. However, even these companies did not have an acid ratio of significantly more than one, and two firms with a high proportion of long term assets had an acid ratio of slightly below one.
Table 37: Uses of stock issues by firm size (Charter capital billions)
Source: Vndirect.com.vn, own calculations
Table 38: Uses of stock issues by firm ownership (Charter capital billions)
Source: Vndirect.com.vn, own calculations
Finance
Funding
ST
LT
Pay Off loans
Total Non-financing Uses
Under 20
0%
0%
0%
0%
100%
100%
21-50
33%
20%
20%
0%
27%
47%
51-100
35%
23%
19%
6%
16%
42%
101-200
33%
13%
27%
7%
20%
53%
200+
40%
20%
13%
27%
0%
40%
Total
35%
19%
19%
9%
17%
45%
Pay off Loans
Held in ST
Finance Investment
Fund Investment
LT financial Investment
Total Non-financing Uses
State Maj
20%
10%
35%
25%
10%
40%
State Min
4%
23%
31%
19%
23%
50%
Private
19%
31%
19%
0%
31%
81%
Subsidiaries
19%
15%
35%
23%
8%
42%

Chapter 7: Case Studies of Vietnamese Firms 232
In terms of ownership, subsidiaries and firms with a majority state holding (between which there is substantial overlap) tended to be less likely to hold the proceeds from stock issues as long term or short term assets, and more likely to use the proceeds to invest in or fund fixed capital investments.
Finally, there is little indication that firms are replacing short term loans with long term loans. The average ratio of short term to long term liabilities was 0.81. However, only thirteen firms had a ratio of below 0.65, and 23 had a ratio of above 0.9.
Table 39: Short term to Long Term Liabilities
Source: Vndirect.com.vn, own calculations
In conclusion it appears that, at least for the sampled firms, short term liabilities remain high as a proportion of total liabilities, and few firms are able to cover current liabilities with current assets. As a result many firms use the opportunity to issue stock to improve their liquidity position, either by funding investments, paying off loans or holding the proceeds as cash or financial assets. Larger firms that hold more long term financial assets report higher incomes from dividends and interest payments. Subsidiaries (of unlisted firms) are more likely to use stock issues to finance fixed asset investments.
7.4. Conclusion
This Chapter sought to determine how different firms responded to financial development in Vietnam using case studies, survey data, secondary sources and analysis of balance sheets of firms listed on the Hanoi Stock Exchange.
Firm Size (charter capital (Bil)All
U20
21-50
51-100
101-200
200+
ST/ LT ratio
0.81
0.75
0.85
0.85
0.76
0.75

Chapter 7: Case Studies of Vietnamese Firms 233
Building on the discussion in Chapter 4 it distinguished between firms that adopted the conglomerate form (operated in different and distinct sectors) and those with one main activity. Given the importance of the state owned sector in Vietnam it also distinguished between state firms (and then between members of GCs and those attached to other state bodies) and private firms.
On the whole the Chapter found that distinguishing between firms in this manner helped shed some light on financial behaviour, however, there was substantial difference between firms within categories. GCs differed in terms of size, importance to Government economic strategy and also in access to extraordinary sources of finance for their members (particularly bonds). GCs played an important role for many subsidiaries in guaranteeing loans, managing finance within the group via a designated financial company, which also, in some cases, sought to generate extra revenues through investments in asset markets.
A relatively new development is the emergence of parent-child structures among subsidiaries of GCs. Although such firms continue to operate in their traditional areas they are diversifying in order to generate profits and alternative sources of cash flow. The emphasis on real estate and financial investments suggests that strategies have, in part, been influenced by developments in the financial sector and also the growth of asset markets. In some cases, particularly, the ship building industry, finding alternative sources of cash was essential if firms were to meet the objectives set them by the GC and Government industrial strategies.
By helping to provide domestic and international sales outlets GCs were also able to help reduce risks inherent in their subsidiaries’ primary activities. Attempts to develop domestic industry through generating higher value added activities should in principle serve a similar purpose. Similarly, efforts such as those by Vinatex to improve coordination between firms by advising firms against duplicating investment projects served to reduce investment risks.
The balance sheets of subsidiaries listed on Vietnamese stock exchanges also suggested that GCs played a significant role in the financial lives of firms. Low acid ratios were

Chapter 7: Case Studies of Vietnamese Firms 234
primarily the result of relatively small holdings of current assets. Moreover, subsidiaries tended not to invest in non-productive assets, a strategy followed by a number of other firms.
These examples of the ways in which GCs’ financial support for their subsidiaries has changed also point to the impact of developments in the financial sector and other asset markets. In the 1990s GCs either directly subsidised ailing firms, or called on successful firms to support weaker firms both financially and by providing managerial expertise. The predominance of non-performing loans in the banking system also suggested that SOCBs played an important if implicit role in firms’ attempts to manage liquidity. The findings in this chapter suggest that both GCs and some of their subsidiaries are adopting more market orientated strategies, and are actively responding to developments in financial markets.
Financial development has had a number of impacts on Vietnamese firms. Balance sheet analysis suggests that short term loans remain a significant source of investment finance and working capital. Long term loans remain a small proportion of total liabilities. A number of firms pointed to the increase in the number of banks and so potential sources of finance. Interviewees also suggested that banks were effectively competing to provide loans to the larger more reliable firms. Firms also reported that as banks were more insistent on collateral it was harder to access loans than in the past, particularly if the firm lacked the required assets or long term relationship with a bank. The experiences of smaller private firms illustrate the difficulties firms face if they lack the means to access large loans. Firms both lack the financing they need, and are more vulnerable as they depend on a single source of revenues. Attempts to build portfolio accounts by the larger parent-child firms and single activity private firms suggest that capital market developments can provide firms with the means to manage risk.
As expected many firms make use of the stock market to fund investments or to improve their liquidity. Nevertheless, it is striking how low acid ratios are for most firms. The vast majority of those analysed in Section 7.3 cannot cover current liabilities with current assets.

Chapter 7: Case Studies of Vietnamese Firms 235
The observation that larger firms look to hold shares in other joint stock companies, ‘long term financial assets’ and even banks also informs the flow of funds analysis of the previous chapter, suggesting more complex flows between and within units in the ‘private sector’. There are increasing intra firm transfers as funds are moved between subsidiaries of emerging business groups and, to an extent, General Corporations. From the perspective of the state the management of liquidity has, on the whole, passed to the firms themselves. State owned firms and groups are expected to remain true to their ‘core activities’ as determined by state policy, but also to generate revenues by any means possible. In a sense this suggests little has changed, other than the formalisation of existing firm diversification strategies. However, there is some evidence that with the development of asset markets in Vietnam firms are able to manage liquidity in more conventional ways.
8.

236
Chapter 8: Discussion and Conclusion
This thesis has presented an original analysis of the firm in economic development as a firm that manages a balance sheet from which cash flow may be generated in the usual income and expenditure way that is common to most theories of the firm, but also through balance sheet operations designed also to maintain the liquidity of the firm. This is based on the work of Kalecki, Minsky and Steindl and extends the post-Keynesian understanding of the firm both to take account of balance sheet management, and to apply it to firms emerging in a developing country in the transition from a centrally planned economy. This chapter summarises the applications of the approach to Vietnam and concludes with a discussion of the efficacy of the approach for our understanding of financial development.
8.1. The Balance Sheet Approach in Vietnam
The thesis identified three periods since 1991 in Vietnam, characterised by different institutional structures and stances with capital flows and foreign direct investment. The first, from 1991, until, approximately 1998/ 1999 saw an economy dominated by the state sector, and in which establishing and growing private firms faced regulatory difficulties as well as difficulties accessing credit from the banking system. The second saw a downturn in foreign investment and capital flows, reform of the state owned sector, some liberalisation of the financial and banking sector as well as liberalisation of the private sector. The third, following accession to the WTO saw further liberalisation of the state sector and the private sector, as well as the banking sector and financial markets. Foreign direct and indirect inflows increased significantly.
8.1.1. Period I
8.1.1.1. Private Sector
Throughout the 1990s private sector investment was financed predominantly by retained earnings. Access to bank credit was limited for a number of reasons, and equity markets were effectively non-existent. Many firms were small household enterprises. The

Chapter 8: Discussion and Conclusions 237
majority relied on the entrepreneur’s own savings, and the savings of family and friends for investment. Although there is no enterprise survey data from the period it is likely that the private sector was close to that of the early 2000s. Profit margins were low, as were investments. As a result, firms struggled to make large investments. They lacked collateral and would have had few funding opportunities. Nevertheless, as they faced significant operational risks, it is likely they held relatively high cash balances as a source of liquidity. Low levels of retained earnings, an absence of funding opportunities and the need for high levels of liquidity meant overall investment was low.
The case studies of Chapter 7 suggest that a number of private entrepreneurs managed to use savings and expertise accumulated whilst with working in the state sector. These firms, however, tended to opt for labour intensive sectors with low capital costs.
The private sector in the 1990s closely resembled that described in Chapter 4, although rather than risk long term and debilitating indebtedness (which it was largely denied due to difficulties accessing outside finance), investments tended to be small and risk averse. The availability of funds for reinvestment would have depended on entrepreneurial savings and the ability of the firm to generate retained earnings through its primary (and, likely, only) income account.
8.1.1.2. State Owned Sector
Like the private sector the state sector also relied primarily on retained earnings. However, a privileged role in the economy meant profit margins were relatively high. SOEs also had access to credit extended by state owned banks and other sources of policy lending and subsidy. The majority of foreign direct investment was also channelled to the state owned sector, providing a further source of funds and foreign exchange.
Even so bank credit as a proportion of GDP was relatively low, and the equitisation process was slow. Investment finance was, therefore, predominantly sourced from a revolving fund of firm savings.
There were few, if any, opportunities to formally fund investments - that is exchange long term for short term debt. However, as firms were required to undertake investments as prescribed in relevant industrial plans the level of investment was only loosely related to

Chapter 8: Discussion and Conclusions 238
the firm’s ability to repay it and associated risks. Moreover, SOEs had other responsibilities (policy burdens) providing further demands on cash flow.
The high proportion of non-performing loans in the banking system suggests that the state played a funding role, ensuring investments were carried out - thus adding to general demand and also providing further investible funds in the form of profits that also accrued to the state sector - and that firms that could not meet their commitments were not forced into insolvency.
Those firms that proved difficult or impossible to run as going concerns were, if the social need was deemed sufficiently important, placed under the responsibility of more successful firms.
8.1.1.3. Quasi-Private SOEs
Although strictly speaking state owned firms, these firms were established with a combination of entrepreneurial capital and state finance. The strategies they adopted depended on the degree to which they were beholden to a plan. Of the firms discussed in Chapter 7, Protrade, for example, seemed to have relatively free reign. Becamex, on the other hand, grew as a result of its involvement in the construction of industrial zones. For most of the 1990s it was a small and insignificant firm.
Most investments were relatively small and in sectors that, as one manager admitted, had little competition, required little capital and provided a low level of risk. The nature of some business activities and the close relationship with the state suggested that the primary source of income was a state provided rent - either in the form of a distribution license, responsibility for a particular state policy or export opportunity. Such firms tended to expand by diversifying into low risk areas. There was little need for funding, and capital intensive investments had the support and banking of the state. Diversified sources of cash flow ensured liquidity.

Chapter 8: Discussion and Conclusions 239
8.1.2. Period II
8.1.2.1. The Private Sector
Developments in the private sector stem chiefly from a more liberal and supportive environment, and improved relations with the banking sector. As a result there was rapid growth in the number of private firms - particularly in ‘private firms’ and ‘private limited liability companies’. This is also reflected in a greater share of turnover, and slight increases in the size of firm (in terms of total assets), as well as in average turnover. Even so, available data suggests there were few substantial differences in terms of financing, funding and liquidity management. Finance remained predominantly retained earnings supplemented by informal sources (essentially, household savings) with some access to bank credit. As bank loans remained short term and tied to collateral capital intensive investments were generally beyond the majority of firms. There remained few funding opportunities, were firms willing and able to make large scale loans.
Although there was an increase in private limited liability companies and joint stock companies these too remained small and, debt to equity ratios were approximately constant. All categories of private sector firm tended to rely on retained earnings, and as a sector, had little opportunity or desire to go into deficit. Low profit margins suggest that, as in Period I investments, again predominantly in the state sector, return to the state sector.
Figure 26 also suggested that current assets, as a proportion of liabilities, was higher than in the state sector, and higher for private and private limited liability companies than for joint stock companies. As well as demonstrating the relative lack of long term fixed capital investments the ratio may also support the observation that smaller firms tend to hold a greater proportion of liquid assets, which might otherwise be utilised in fixed asset investments.
Table 15 suggests that some portion of the profits accruing to the private sector stems from greater productive efficiency. Revenues as a proportion of both labour and capital are higher than for the state sector (although the state sector does make more capital intensive investments).

Chapter 8: Discussion and Conclusions 240
8.1.2.2. State Sector and Quasi-Private SOEs
Throughout Period II the state sector underwent restructuring, primarily through the liquidation or equitisation of firms. There were, however, few changes in key indicators before 2005/6, and the stock market remained small and capital inflows low suggesting that, although there were gains in efficiency as well as in the autonomy of a number of firms the financial strategies remained similar to those in the 1990s. One interesting development is the reduced net deficit with the state sector (bank credit and onlending) between 2004 and 2006. Although onlending declined slightly, so did tax receipts (as firms were equitised or liquidated) and bank credit increased. At the same time profit margins for the sector as a whole increased, as apparently did overall profits to the sector. Profit rates appear to have seen little change, although average profits did increase suggesting the state divested itself of weaker firms and the remaining state sector may have reaped in profits investments financed from increased bank credit and proceeds from an accelerating equitisation programme.
With regard to quasi-private SOEs the period up until WTO accession appears to be broadly similar to the 1990s.
8.1.3. Period III
8.1.3.1. Private Sector
The non-state sector as a whole experienced a savings deficit that increased significantly. Breaking down the sector suggests that only the ‘private’ sector saw a significant change in its liability to equity ratio, as it benefitted from a more accommodating banking regime. By definition it was less likely to turn to outside sources of equity. Of the different non-state categories the ‘private’ sector experienced the smallest rise in the savings deficit. Table 15 suggests that new firms remained small. The findings in Section 6.4.1 suggest further that bank loans were linked to collateral, and that smaller firms continued to hold larger cash balances. Even so, there are some indications that private firms held a lower proportion of current assets. Private limited liability companies saw an increase in equity over capital, which seems to have corresponded with a larger average

Chapter 8: Discussion and Conclusions 241
size and an increase in levels of investment, although there was no commensurate increase in profits (although profit rates did rise marginally). Equity was likely sourced from household savings. Firms with state capital saw a significant fall in the liabilities to equity ratio, attributable to equitisation. This was translated into a higher level of investment, largely responsible for the increase in the non-state sector deficit. Joint-stock firms without state capital, on the other hand whilst increasing in average size experienced only a slight increase in their savings deficit, and a small downward change in their liabilities to equity ratio.
The increasing number of private firms listed on the stock exchange and the case studies in Chapter 7 suggest that private firms are finding the means to fund investment and develop portfolio accounts. However, smaller private firms remain virtually untouched by recent developments. The World Bank surveys discussed in Section 6.4.1 suggest that smaller firms rely on retained earnings, hold large cash balances, and, despite a more liberal and market orientated banking system are limited in their access to credit by the availability of collateral.
8.1.3.2. SOE Sector
The impact of developments in Period III on the state sector is difficult to discern, given reform of the state sector itself is integral to institutional developments and financial flows.
In terms of financing SOEs have benefitted from increased credit, both from SOCBs and JSBs. Credit growth, channelled through households, but probably more significantly both private and state owned enterprises combined with large inflows of foreign saving also effectively recapitalised equitised SOEs in OTC and stock market transactions. Joint-stock companies with state capital grew significantly in terms of value of assets, although in relation to joint-stock companies without state capital the savings deficit appears to have been smaller.
There may also have been developments in funding behaviour. Section 7.3 suggests that a number of firms used equity issues to replace debt used to finance fixed investments. However, the evidence is by no means conclusive.

Chapter 8: Discussion and Conclusions 242
Others engaged in the development and manipulation of their portfolio accounts, taking advantage of what were effectively inflated capital markets. As one interviewee suggested as shipbuilding firms were unable to equitise they had to rely on their income account and debt to manage cash flow. The ratio of current assets to liabilities backs other accounts of the difficulties Vinshin members had in meeting their liabilities. Vinashin itself established a subsidiary responsible for both managing the proceeds of bond sales as well as managing an investment fund to provide extra sources of cash flow. Subsidiaries also diversified and themselves invested in real estate markets and equity. Other GCs also established finance companies intended to manage a portfolio of liquid investments that established a source of cashflow.
The predicament of those SOEs unable to either access equity or build a portfolio of liquid assets is perhaps best illustrated by the case studies of the larger and more successful garments firms. These, able to recapitalise via equity markets looked to diversify out of garments to areas with greater returns, and also to invest in asset markets. Such firms also provide a useful comparator to the smaller private firms also described in Chapter 7. These firms were unable to access the bank credit they required for the size of investments desired as they did not possess the level of collateral by banks. It is an easy step to imagine the access a manager would have if part of a larger firm.
Chapter 4 also suggested that firms might become overcapitalised, particularly in times of asset market inflation. The analysis in Section 7.4 suggests that a number of firms did indeed use proceeds from equity issues to create and manage a portfolio of current assets. In some instances it is possible that in holding short term assets for a prolonged period of time the firm was simply waiting until the time to put them to use.
In conclusion the analysis in Chapters 6 and 7 tended to support the propositions proposed in Chapter 4. The exception may, however, be Proposition E. Whilst many firms, particularly large SOEs hold a substantial portfolio of unproductive assets, in many cases with the intention of generating profits, it is not entirely clear that such firms are holding ‘excess capital’, or that they are not pursuing a valid strategy to manage their liquidity.

Chapter 8: Discussion and Conclusions 243
8.2. The Relevance of the Balance Sheet Firm Approach to
Understanding Financial Development
This thesis developed the balance sheet approach to the firm adapted with insights from Kalecki, Steindl and others to suggest that in a mature economy firms are not homogenous in the nature of their relationship with the finance sector. Financing, funding and liquidity management is, in part, determined by factors such as firm size and the capital intensity of investments. As the financial development of less developed countries implies the gradual implementation and development of financial institutions so it also implies that the ability of firms to access financing, funding and liquidity management services also changes over time, with implications for the size and nature of investments firms make, the degree to which firms hold liquid assets in their current account and the use they make of them. As developing countries tend to have few ‘large entrepreneurs’, then the attitude of the state toward the enterprise sector and particularly in compensating for the absence or immaturity of banks and financial markets takes on particular significance. As the financial sector develops then its relationship with different types of firm also evolves with implications for the sorts of investments firms make, the stability of financial markets and opportunities for firm growth and survival.
This thesis has implications for existing approaches to financial development. With respect to the financial liberalisation hypothesis it suggests that financial liberalisation would not be likely to stimulate substantial growth among small enterprises with limited collateral. Indeed, it would be larger firms assumed to operate in an ‘enclave’ who might benefit more substantially. The application of post-Keynesian and Keynesian concepts of funding, liquidity management, the inversion of the relationship between savings and investment and endogenous money suggests that the FLH has limited explanatory power, particularly as the approach outlined in this thesis implies factors unique to individual countries have the most resonance.

Chapter 8: Discussion and Conclusions 244
With regard to the stages of banking approach, one of the few post-Keyensian contributions to development economics, it suggests that the approach can be further developed with reference to the composition of the firm sector in developing countries. Similarly, studies that are concerned with the impact of indirect investment and international capital flows on developing countries could also be supplemented with analysis of the history and composition of the firm sector.
More generally, the approach developed in this thesis could provide some insight into the economic development of countries, particularly African countries, that have failed to develop a cohort of large firms. At present much analysis focuses on the constraints to the growth of small and medium sized enterprises - essentially, assuming, as did Marshall, that there should be growth from below, and that the imposition of business friendly institutions and liberal financial and banking sectors would facilitate economic growth via the mechanism of enterprise investments and growth.
The study of Vietnam in this thesis demonstrated some of the implications of state attempts to compensate for the absence of large concentrations of entrepreneurial capital, as well as the strategies of firms seeking to compensate for the absence of funding opportunities. It demonstrated a clear divide between small firms and large firms, and suggested, although longitudinal data wasn’t available that an economic strategy reliant on the growth of initially small firms will not necessarily result in firms capable of making large scale investments without state support. However, it also suggested that granting large firms the autonomy to engage freely in financial markets may have an adverse impact. In the absence of funding opportunities and asset markets firms capable of generating retained earnings do seek to invest in non-capital intensive, low risk sectors in order to generate diversified cash flow.
Whilst liberalisation of the banking sector did appear to facilitate banking behaviour commensurate with the latter stages of the stages of banking approach the demand driven credit expansion was only partially the result of relatively risk free lending to large firms backed with collateral. Instead, it appears that less risk averse joint stock banks, some connected to SOCBs, and others part owned by large firms made loans to borrowers known to be engaging in speculative activities. That the repayments of both principle and

Chapter 8: Discussion and Conclusions 245
interest would slow in the event of asset market deflation was not anticipated by some banks and large firms themselves, suggesting that unsecured lending is indeed a possibility in insufficiently risk averse banking systems, and liquidity management strategies as conducted by the likes of heavily indebted capital intensive firms such as Vinashin might not prove successful in the event of demand shocks to primary activities. If nothing else this suggests that those who do pursue industrial policies involving large, heavily leveraged capital investments must consider carefully the implications of a fall in demand what liquidity management strategies to pursue.
Another observation that might be made in response to those that see economic development as the outcome of ‘a broad movement from below upwards’, facilitated by liberal financial markets, is that much movement into new industries, or increased levels of investment in existing ones that is manifested in in the form of new enterprises is, at least in Vietnam, the direct result of large firm expansion. These firms both diversified to ensure continued liquidity, and also because they had access to retained earnings, outside finance and funding to ensure the investment projects were both possible and feasible. As some of the case studies of smaller, private, Vietnamese firms indicate although the productive and managerial capabilities might exist smaller firms will struggle to secure the funds required.
Finally, the approach adopted in this thesis sought to suggest a clear link between the micro - the behaviour of firms - and the macro, particularly aggregate levels of investment and, the savings gap in the enterprise sector and its financing. It demonstrated that as investment was financed by firm savings, but at the same time levels of investment determined firm savings then profit rates went some way to determine both the availability of retained earnings, and so the distribution of the proceeds of investment. As investment in turn partially determined the size of the firm then the heterogeneity of the firm sector would explain, in part, the level of investment, the size of the savings gap and funds available to firms to exploit in short term investments. In Vietnam low profit margins in the private sector suggested that the state sector recouped the majority of the proceeds from investment. Moreover, it was larger, predominantly state owned or quasi-

Chapter 8: Discussion and Conclusions 246
private SOEs who were able to source foreign savings in the stockmarket, and more generally use asset markets to fund investments and manage liquidity.

247
9. Bibliography
Abbott, P., Bentzen, J., and Tarp, F. (2009) Trade and Development: Lessons from Vietnam's Past Trade Agreements, World Development, 37 (2), 341-53.
Ajewole, J. O. (1989), Determination of Demand for Money for the Case of the Nigerian Economy, Savings and Development, 13(2), 183–198.
Alchian, A. A. (1950) Uncertainty, Evolution, and Economic Theory, The Journal of Political Economy, 58 (3), 211-21.
Alchian, A. A. (1965) The Basis of Some Recent Advances in the Theory of Management of the Firm, The Journal of Industrial Economics, 14, 30-41.
Alchian, A. A. and Demsetz, H. (1972) Production, Information Costs, and Economic Organization, The American Economic Review, 62, 777-95.
Alchian, A.A. and Woodward, S. (1987) Reflections on the Theory of the Firm, Journal of Institutional and Theoretical Economics, 143, 110-136.
Amsden, A. H. (1992) Asia's Next Giant: South Korea and Late Industrialization, New York and Oxford: Oxford University Press.
Andrews, P. W. S. (1949) Manufacturing Business, London: Macmillan
Andrews, P. W. S . (1951) Indus t r ia l Analys is in Economics , in Wilson , T. and P. W. S. Andrews (Editors), Oxford Studies in the Price Mechanism, Oxford: Oxford University Press.
Andrews, P. W. S. (1958) Competition in the Modern Economy, The Institute of Petroleum.
Anh Pham Mai (2008) Can Vietnam's Economic Growth be explained by investment or exports: A Var analysis, Vietnam Development Forum, Hanoi.
Arestis, P. (2004) Washington Consensus and Financial Liberalisation, Journal of Post Keynesian Economics, 27(2), 251–71.

Bibliography 248
Arestis P. (2006), Financial Liberalization and the Relationship between Finance and Growth, in Arestis, P. and Sawyer, M. (Editors), Handbook of Alternative Monetary Economics, Cheltenham: Edward Elgar.
Arestis, P. and Demetriades, O.P. (1997) Financial Development and Economic Growth: Assessing the Evidence, Economic Journal, 107 (442), 783–99.
Arestis, P and Demetriades, P (1999) Financial Liberalization: The Experience of Developing Countries, Eastern Economic Journal, 25 (4), 441-57.
Arestis, P., Demetriades, O.P. and Luintel, K.B. (2001) Financial Development and Economic Growth: The Role of Stock Markets, Journal of Money, Credit, and Banking, 33(1), 16–41.
Arestis, P. and Howells, P. (1996), Theoretical Reflections on Endogenous Money: the Problem with “Convenience Lending”, Cambridge Journal of Economics, 20(5), 539–51.
Arestis, P. and Glickman, M. (2002) Financial Crisis in Southeast Asia: Dispelling Illusion the Minskyan Way, Cambridge Journal of Economics, 26 (2), 237-60.
Arestis P., Brown, A. and Sawyer, M. (2003) Critical Realism and the Political Economy of the Euro, Levy Institute, Working Paper No.352.
Arrow, K. J. (1974) The Limits of Organization, New York: WW Norton & Company.
Arrow, K. J. (1985) Informational Structure of The Firm, The American Economic Review, 75 (2), 303-307.
Asia-Pacific Economic Cooperation (APEC), (2003) Providing Financial Support for Micro-enterprise Development, Paper presented at the SMEs Ministerial Meeting, Chiang Mai, Thailand, 7-8 August 2003.
Augier, M. and Teece, D. J. (2007) Dynamic Capabilities and Multinational Enterprise: Penrosean Insights and Omissions, Management International Review, 47 (2), 175-192.
Barney, J. B. (1986) Types Of Competition and The Theory of Strategy: Toward An Integrative Framework, Academy Of Management Review, 11 (4), 791-800.

Bibliography 249
Barney, J. B. (1991) Firm Resources and Sustainable Competitive Advantage, Journal Of Management, 17(1), 99-120.
Barney, J. B. (1995) Looking Inside For Competitive Advantage, The Academy Of Management Executive, 9 (4), 49-61.
Barney, J. B. (1996) The Resource-Based Theory Of The Firm, Organization Science, 7 (5), 469-496.
Barney, J. B. (1999) How A Firm's Capabilities Affect Boundary Decisions, Sloan Management Review, 40 (3), 137-145.
Barney, J. B. (2000) Firm Resources And Sustained Competitive Advantage, Advances In Strategic Management, 17 (1), 99-120.
Barney, J. B. (2001) Is The Resource-Based View a Useful Perspective for Strategic Management Research?, The Academy Of Management Review, 26 (1), 41-56.
Barney, J., Wright, M., and Ketchen, D. J. (2001) The Resource-Based View of the Firm: Ten Years After 1991, Journal of Management, 27 (6), 625-641.
Barry, P. J., Sonka, S. T., And Lajili, K. (1992) Vertical Coordination, Financial Structure, and the Changing Theory Of The Firm, American Journal Of Agricultural Economics, 74 (5), 1219-1225.
Beck, T. and Levine, R. (2004), Stock Markets, Banks, and Growth: Panel Evidence, Journal of Banking and Finance, 28, 423-442.
Ben Ang Siew Hock, Leng, L. B., Keong, T. T., and Aik, T. T. (1997) Reforms in Vietnam's Financial and Banking System in Meng, TT., Meng, L. A., Williams, J.J. and Gilbert, L.A. and Trankiem, L. (Editors), Business Opportunities in Vietnam, Singapore: Prentice Hall.
Benhabib J, Spiegel M.M. (2000), The Role of Financial Development in Growth and Investment, Journal of Economic Growth, 5, 341-360.

Bibliography 250
Beresford, M. and Dang Phong (2000) Economic Transition in Vietnam: Trade and A i d , i n B e r e s f o r d , M . a n d D a n g P h o n g , The Demise of a Centrally Planned Economy, London: Edward Elgar.
Beresford, M. (2004) Lessons from the Asian Crisis for the Sustainability of Vietnamese Economic Development in Beresford, M. and Tran Angie Ngoc (Editors), Reaching For The Dream, Copenhagen: NIAS Press
Beresford, M. (2008) Doi Moi in Review: The Challenges Of Building Market Socialism In Vietnam, Journal of Contemporary Asia, 38 (2), 221-243
Best, M. H. (1990) The New Competition, Cambridge: Polity Press.
Berger, A. and Udell, G. (1995), Relationship Lending and Lines of Credit in Small Firm Finance, Journal of Business 68, 351-382.
Besanko, D. and Thakor, A. (1987) Collateral and Rationing: Sorting Equilibria in Monopolistic and Competitive Credit Markets, International Economic Review, 28, 671-689.
Bester, Helmut, (1985), Screening vs. Rationing in Credit Markets with Imperfect Information, American Economic Review, 25, 21-42.
Bhaduri, A. (2004) The Opportunities and Dangers of International Inflows for Developing Countries from an Effective Demand Perspective, in Sadowski Z. and Szeworski A. (Editors) Kalecki's Economics Today, London and New York; Routledge.
Bhaskar, R. (1978) A Realist Theory of Science, Leeds: Leeds Books
Black, J., Hashimzade, N. and Myles, G. (2009) Oxford Dictionary of Economics, Oxford: Oxford University Press.
Blaug, M. (2003) Ugly Currents in Modern Economics, in Maki, U. (Editor.), Fact and Fiction in Economics, Cambridge: Cambridge University Press.
Bloch, H. (2000) Schumpeter and Steindl on the Dynamics of Competition Journal of Evolutionary Economics, 10 (3), 343-353

Bibliography 251
Bloch, H. (2006) Steindl on Imperfect Competition: The Role of Technical Change Metroeconomica, 57, 286-302.
Brown, A (2000) A comment on Dow's 'Post Keynesianism and Critical Realism: What is the Connection?, Journal of Post Keynesian Economics, 23 (2), 349-355.
Brown, A., Slater, G. and Spencer, D. A. (2002) Driven to Abstraction: Critical Realism and the Search for the Inner Connection of Social Phenomena, Cambridge Journal of Economics 26(6): 773–88.
Brown, A (2007), Reorienting Critical Realism: A System-Wide Perspective on the Capitalist Economy, Journal of Economic Methodology, 14 (4), 499-519.
Brown, R.A. (2006), The Rise of the Corporate Economy in Southeast Asia, Oxford: Routledge.
Casson, M. (1984) The Theory Of Vertical Integration: A Survey and Synthesis. Journal of Economic Studies, 11 (2), 3-43.
Casson, M. (1996) The Comparative Organisation of Large and Small Firms: An Information Cost Approach. Small Business Economics, 8 (5), 329-345.
Casson, M. (2005) Entrepreneurship and the Theory of the Firm Journal of Economic Behavior and Organization, 58 (2), 327-48.
Central Institute for Economic Management (CIEM) and World Bank (2005), Report on the Study of Post-Equitization of State-Owned Enterprises, Hanoi: CIEM.
Chakraborty, A. and Mallick, R. (2012), Credit Gap in Small Businesses: Some New Evidence, International Journal of Business, 17(1), 65-80.
Chakravarty, S. (1987) Post-Keynesian Theorists and the Theory of Economic Development, Wider Working Papers, No. 23
Chandler, A. D. (1962) Strategy and Structure: Chapters in The History of American Enterprise, Massachusetts Institute Of Technology, Cambridge.
Chandler, A. D. (1992) Organizational Capabilities and the Economic History Of the Industrial Enterprise, The Journal of Economic Perspectives, 6 (3), 79-100.

Bibliography 252
Cheshier, S. and Penrose, J. (2007) Top 200: Industrial Strategies of Vietnams Largest Firms, UNDP, Hanoi.
Cheshier, S. and Sasges, G. (2011) Competing Legacies: Rupture and Continuity in the Vietnamese Political Economy, Mimeo.
Cheshier, S. (2010) The New Class in Vietnam, Mimeo.
Cheshier, S. and Pincus, J. (2010) Minsky au Vietnam: State Corporations, Financial Instability, and Industrialization, in Tavasci, D. and Toporowski, J. (Editors), Minsky, Crisis and Development, London: Palgrave Macmillan.
Cheung, S. (1970) The Structure of a Contract and the Theory of a Non-Exclusive Resource, Journal Of Law And Economics, 13 (1), 49-70.
Cheung, S. (1983) The Contractual Natural of the Firm, Journal Of Law And Economics, 26 (1), 1-21.
Chi Do Pham and Le Viet Duc (2003) A Decade of Doi Moi, in Binh Tran Nam, Binh Tran Nam and Chi Do Pham (Editors), The Vietnamese Economy: Awakening the Dormant Dragon, London: Routledge.
Chick, V. (1992) The Evolution of the Banking System and the Theory of Saving, I n v e s t m e n t a n d I n t e r e s t , i n A r e s t i s , P. a n d D o w , S . ( E d i t o r s ) , On Money, Method and Keynes, London: St Martin's Press.
Coase, R. H. (1937) The Nature of the Firm, Economica, 4, 386-405.
Coase, R. H. (1960) The Problem of Social Cost, The Journal of Law and Economics, 3, 1-44.
Coase, R. H. (1988) The Nature of the Firm: Influence, The Journal of Law and Economics, 4 (1), 33-47.
Coase, R. H. (1988b) The Nature of the Firm: Meaning, The Journal of Law and Economics, 4 (1), 19-32.
Coase, R. H. (1988c) The Nature of the Firm: Origin, The Journal of Law and Economics, 4 (1), 3-17.

Bibliography 253
Cooley, T.F. and Smith, B.D. (1991) Financial Markets, Specialization, and Learning by Doing, RCER Working Papers No. 276, University of Rochester - Center for Economic Research (RCER).
Courvisanos, J. and Mackenzie, S. (2011), Role of History in Economic Theory: Critical Realism and Joseph Schumpeter's Plea for Entrepreneurial History, 24th Conference of the History of Economic Thought Society of Australia HETSA 2011, RMIT University, Melbourne.
Cowling, K. (1995) Monopoly Capitalism and Stagnation, Review of Political Economy, 7 (4), 430-446.
Cyert, R. M., Feigenbaum, E. A., and March, J. G. (1959) Models in a Behavioral Theory of the Firm, Behavioral Science, 4 (2), 81-95.
Cyert, R. M. and March, J. G. (1963) A Behavioral Theory of the Firm, New York: Englewood Cliffs.
Dang Phong (2004) Stages on the Road to Renovation of the Vietnamese Economy: an His tor ical Perspect ive , in Beresford, M. and Tran Angie Ngoc (Editors), Reaching For The Dream, Copenhagen: NIAS Press.
Dapice, D. (2003) Vietnam’s Economy: Success Story or Weird Dualism? A SWOT Analysis, A Special Report Prepared for United Nations Development Programme (UNDP) and Prime Minister’s Research Commission, June.
Davidson (1994) Post Keynesian Macroeconomic Theory, Cheltenham: Edward Elgar.
Davidson, P. (1996), Reality and Economic Theory, Journal of Post Keynesian Economics, 18 (4), pp. 479-508.
Dawson, J. (1996) Current Saving-Investment Process Analysis: Indonesia in J. Dawson (Editor), Flow of Funds Analysis, New York: M.E. Sharpe.
Dawson, J. (2004) The Asian Crisis and Flow-of-Funds Analysis, Review of Income and Wealth, 50 (2), 243-260.
Bibliography 254
Dawson, J. and Everhart, S. (2000) Kazakhstan - Financial Imbalances in a R e s o u r c e R i c h E c o n o m y , i n F l e m i n g , A . a n d G i u g a l e , M .( E d i t o r s ) , F i n a n c i a l S y s t e m s i n T r a n s i t i o n : A F l o w o f F u n d s Analysis of Financial Evolution in Eastern Europe and Central Asia, Singapore: World Scientific Publishing Co. Ltd.
Davydenko, S. and Franks, J. (2005), Do Bankruptcy Codes Matter? A Study of Defaults in France, Germany and the UK, EFA 2005 Moscow Meetings Paper.
De Melo, J. and Tybout, J. (1986), The Effects of Financial Liberalization on Savings and Investment in Uruguay, Economic Development and Cultural Change, 34 (3), 561-87.
Demetriades, P., and Hussein, K. (1996), Does Financial Development Cause Economic Growth? Evidence for 16 Countries, Journal of Development Economics, 51, 387-411.
Demsetz, H. (1968) The Cost of Transacting , The Quarterly Journal of Economics, 82, 33-53.
Demsetz, H. (1969) Information and Efficiency: Another Viewpoint, Journal of Law and Economics, 12 (1), 1-22.
Demsetz, H. (1970) The Private Production of Public Goods, Journal of Law and Economics, 13 (2), 293 - 306.
Demsetz, H. (1973) Industry Structure, Market Rivalry, and Public Policy, Journal Of Law And Economics, 16 (1), 1-9.
Demsetz, H. (1988), The Structure of Ownership and the Theory of the Firm, in Demsetz, H. (Editor.), Ownership, Control and the Firm; the Organization of Economic Activity, vol. I, Oxford: Basil Blackwell.
Demsetz, H. (1988b) The Theory of the Firm Revisited, Journal of Law , Economics, and Organisation, 4 (1), 141-61
Demsetz, H. (1988c) Ownership, Control, and the Firm, Oxford: Basil Blackwell.
Demsetz, H. (1992) The Emerging Theory of the Firm, Philadelphia: Coronet Books.

Bibliography 255
Demsetz, H. (1997) The Firm In Economic Theory: A Quiet Revolution, The American Economic Review, 87 (2), 423 - 429.
Demsetz, H. And Lehn, K. (1985) The Structure Of Corporate Ownership: Causes and Consequences, The Journal of Political Economy, 93 (6), 1155-77.
Deprez, J. (1991) The Macrodynamics of Advanced Market Economies: The Post-Keynesian Perspective of Alfred Eichner, Social Science Quarterly, 72 (3), 415-430
Dollar, David (1994) Macroeconomic Management and the Transition to the Market in Vietnam, Journal of Comparative Economics, 18, 357-375.
Doner R. (1992), Politics and the Growth of Local Capital in Southeast Asia: Auto Industries in Philippines and Thailand, in Ruth McVey, (Editor), Southeast Asian Capitalists, Cornell Southeast Asia Program.
Dosi, G. and Marengo, L. (2007) On The Evolutionary And Behavioral Theories Of Organizations: A Tentative Roadmap, Organization Science, 18, 491-502
Dow, S. (1999), Post Keynesianism and critical realism: What is the connection?, Journal of Post Keynesian Economics, 22 (1), 15-33
Dow, S. and Ghosh., D. (2008) A Stages Approach To Banking Development In Transition Economies, Journal of Post Keynesian Economics, 31 (1), 3-33.
Dunn, S. (2008), The 'Uncertain' Foundations of Post Keynesian Economics: Essays in Exploration, London: Routledge.
Dzarasov, R (2011) Eichnerian Megacorp and Investment Behaviour of Russian Corporations, Cambridge Journal of Economics, 35, 199–217.
Eichner, A (2008), The Megacorp and Oligopoly: Micro Foundations of Macro Dynamics, Cambridge: Cambridge University Press.
Elzas, B. D. (1998) 'The Nature Of The Firm' After Sixty Years. Research Memorandum
Evans, M. and Hai, B. D. (2005) Embedding Neoliberalism Through Statecraft: the Case of Market Reform in Vietnam, in Soederberg, S., Menz, G. and Cerny, P. G.

Bibliography 256
( E d i t o r s ) , i n T h e R i s e o f N e o l i b e r a l i s m a n d t h e Decline of National Varieties of Capitalism, London: Macmillan
Fforde, A. (1993) The Political Economy of Reform in Vietnam - Some R e f l e c t i o n s , i n L j u n g g r e n , B . ( E d i t o r ) , The Challenge of Reform in Indochina, Harvard Institute for International Development.
Fforde, A. (2004) Vietnamese State-Owned Enterprises: ‘Real Property’, Commercial Performance and Political Economy, Working Papers Series No. 69, City University of Hong Kong.
Fforde, Adam and Vylder, S. (1996) From Plan to Market: The Economic Transition in Vietnam, ,Boulder, Colorado: Westview Press
Foss, N. J. (1994) The Biological Analogy and the Theory of the Firm: Marshall and Monopolistic Competition, Journal of Economic Issues, 28 (4), 1115-1136.
Foss, N. J. (1996) Capabilities and the Theory of the Firm, DRUID Working Paper.
Foss, N. J. (1997) The Classical Theory Of Production And The Capabilities View Of The Firm, Journal of Economic Studies, 24 (4-5), 307-323.
Foss, N. J. (1997b) Resources and Strategy: A Brief Overview of Themes And Contributions, in Resources, Firms, and Strategies: A Reader in the Resource-Based Perspective, Oxford Management Readers Series, Oxford and New York: Oxford University Press.
Fry, M.J, (1978) Money and Capital or Financial Deepening in Economic Development? Journal of Money, Credit and Banking, 10 (4), 464-75.
Fry, M,J, (1980) Saving, Investment, Growth and the Cost of Financial Repression, World Development, 8 (4), 317-27.
Fry, M, J, (1995) Money, Interest and Banking in Economic Development, Baltimore: Johns Hopkins University Press.
FPT (2010) FPT Annual Report (2010), FPT, Hanoi.

Bibliography 257
Gainsborough, M. (2003), Changing Political Economy of Vietnam: The Case of Ho Chi Minh City, London: Routledge.
Gainsborough, M. (2003b), Slow, Quick Quick: Assessing the Course of Equitisation in Vietnam and Its Implications for Future Enterprise Performance, Journal of Communist Studies and Transition Politics, 19 (1), 49-63.
Gainsborough, M. (2004) Ho Chi Minh City’s Post-1975 Political Elite: Continuity and Change in Background and Belief”, in Benedict Tria Kerkvliet and David Marr (eds.) Beyond Hanoi: Local Government in Vietnam”, Singapore: Institute of Southeast Asian Studies (ISEAS) Publications.
Gainsborough, M. (2004b) Key Issues in the Political Economy of post-doi moi Vietnam, in McCargo, D. (ed.) Rethinking Vietnam, London: Routledge Curzon.
Gainsborough, M. (2009), Privatisation as State Advance: Private Indirect Government in Vietnam, New Political Economy, 14 (2), 257-274.
Gainsborough, M. (2010) Vietnam: Rethinking the State, London: Zed Books.
Galbraith, J. K. (1972) The New Industrial State, New American Library/Mentor.
Gerschenkron, A. (1962) Economic Backwardness in Historical Perspective: A Book of Essays, Cambridge: The Belknap Press of Harvard University Press
Gille, J. and Bruce, G. (2010) Study of the Vietnamese Shipbuilding/ Maritime Sector, NORAD Discussion Paper, Oslo
Giovannini, A. (1983) The Interest Rate Elasticity of Savings in Developing Countries: the Existing Evidence, World Development, 11 (7), 601-7.
Godley, W. and Lavoie, M. (2007) Monetary Economics. An Integrated Approach to Credit, Money, Income, Production and Wealth, London: Palgrave Macmillan.
Godlewski, J-C and Weill, L. (2009), Collateral and Adverse Selection in Transition Countries, Eastern European Economics, 47 (1), 29-40.
Godlewski, J-C and Weill, L. (2011), Does Collateral Help Mitigate Adverse Selection? A Cross-Country Analysis, Journal of Financial Services Research, 40 (1-2), 49-78.

Bibliography 258
Goldsmith, R.W. (1969), Financial Structure and Development, New Haven, CT: Yale University Press.
Gomez, E.T. (2002), Political Business in Southeast Asia, Routledge, London.
Government Statistics Office (2007), Statistical Handbook of Vietnam 2006, Hanoi: Statistical Publishing House.
Government Statistics Office (2007b), Results of the Vietnam Household Living Standards Survey 2006, Hanoi: Statistical Publishing House.
Government Statistics Office (2008), The Situation of Enterprises Through the Results of Surveys Conducted in 2005, 2006, 2007, Hanoi: Statistical Publishing House.
Government Statistics Office (2009), The Situation of Enterprises Through the Results of Surveys Conducted in 2006, 2007, 2008, Hanoi: Statistical Publishing House.
Government Statistics Office (2010), Enterprises in Vietnam During the First Nine Year of 21st Century, Hanoi: Statistical Publishing House.
Government Statistics Office (2010b), Business Results of All Enterprises of Vietnam in 2009, Hanoi: Statistical Publishing House.
Government Statistics Office (2011), Statistical Handbook of Vietnam 2010, Hanoi: Statistical Publishing House.
Government Statistics Office (2011b), Statistical Yearbook of Vietnam 2010, Hanoi: Statistical Publishing House.
Government Statistics Office (2011c), Results of the Vietnam Household Living Standards Survey 2010, Hanoi: Statistical Publishing House.
Government Statistics Office (2012), Statistical Handbook of Vietnam 2011, Hanoi: Statistical Publishing House.
Government Statistics Office (2012b), Statistical Yearbook of Vietnam 2011, Hanoi: Statistical Publishing House.
Graca Moura, M. (2002) Metatheory as the Key to Understanding: Schumpeter after Shionoya, Cambridge Journal of Economics, 26, 805-821.

Bibliography 259
Graca Moura, M. (2003) Schumpeter on the Integration of Theory and History, European Journal of the History of Economic Thought, 10:2 279-301.
Graca Moura, M. and Martins, N. (2008) On Some Criticisms of Critical Realism in Economics, Cambridge Journal of Economics, 32, 203-218.
Grant, R. M. (1991) The Resource-Based Theory of Competitive Advantage: Implications for Strategy Formulation, California Management Review, 33 (3), 114-135.
Green, C. J., Murinde, V. and Moore, T. (2002) The Flow of Funds, Finance and Development Briefing Papers, June.
Green, C. J. and Murinde, V. (2003) Flow of Funds: Implications for Research on Financial Sector Development and the Real Economy, Journal of International Development, 15, 1015-1038.
Habir, A. (1999), Conglomerates: All in the Family? in Donald K. Emmerson (Editor), Indonesia beyond Soeharto, New York: M.E. Sharpe.
Hainz, C et. al (2011) Collateral and its Determinants: Evidence from Vietnam, Proceedings of the German Development Economics Conference, Berlin 2011, No. 36.
Hakkala, K and Kokko, A (2007), The State and the Private Sector in Vietnam, Stockholm School of Economics, Working Paper 236
Hall, C. (2002), Profile of SMEs and SME Issues in East Asia, in Charles Harvie and Boon-Chye Lee, eds., The Role of SMEs in National Economies in East Asia, Cheltenham: Edward Elgar.
Hansen, Henrik, John Rand and Finn Tarp (2009) Enterprise Growth and Survival in Vietnam: Does Government Support Matter?, Journal of Development Studies, 45 (7), 1048-1069.
Harcourt, G. C. and Blankenburg, S. (2002) The Debates On The Representative Firm And Increasing Returns: Then And Now, Royal Economic Society Annual Conference 2002.

Bibliography 260
Hart, N. (1991) Returns To Scale And Marshallian Economics, History of Economics Review, 16, 31-79.
Hart, N. (1996) Marshall's Theory Of Value: The Role Of External Economies. Cambridge Journal Of Economics, 20 (3), 353-69.
Hart, N. (2003) From The Representative To The Equilibrium Firm: Why Marshall Was Not A Marshallian, in Arena, R and Quere, M (Eds) The Economics Of Alfred Marshall: Revisiting Marshall's Legacy, 2003, New York: Palgrave.
Hart, N. (2003b) Marshall's Dilemma: Equilibrium versus Evolution, Journal of Economic Issues, 37 (4), 1139-1160.
Hart, O. (1995) Corporate Governance: Some Theory And Implications. Economic Journal, 105 (430), 678-689.
Hart, O. (1996) An Economist's Perspective on the Theory of the Firm, in Buckley, P. and Michie, J. (Editors), Firms, Organizations and Contracts: A Reader in Industrial Organization, Oxford Management Readers, Oxford and New York: Oxford University Press
H a r v a r d P r o g r a m Vietnam (2008), The Structural Roots of Macroeconomic Instabil i ty, Harvard Kennedy School Vietnam Program Policy Discussion Paper no.3
Hewison, K. (1997) Thailand: Capitalist Development and the State, in Rodan, Hewison and Robison, (Editors), The Political Economy of Southeast Asia: An Introduction, Oxford: Oxford University Press.
Hill, H. (1995), Small-Medium Enterprises and Rapid Industrialization: the ASEAN Experience, Journal of Asian Business 11(2), 1-31.
Hill, H. (2002) Old Policy Challenges for a New Administration: SMEs in Indonesia, in Charles Harvie and Boon-Chye Lee, (Editors), The Role of SMEs in National Economies in East Asia. Cheltenham: Edward Elgar.
Hitch, C. J. (1939) Price Theory And Business Behaviour, Oxford Economic Papers, 2, 12-45.

Bibliography 261
Holson, J. A. (2000), Russia - A National Unwillingness to Pay for Government, in Flemming, A. and Giugale, M. (Editors), Financial Systems in Transition: a Flow of Funds Analysis of Financial Evolution in Eastern Europe and Central Asia, Singapore: River World Scientific.
Hutchcroft, P. (1994), Booty Capitalism: Business-Government Relations in the Philippines, in Andrew Macintyre, (Editor), Business and Government in Industrialising Asia, Ithaca: Cornell University Press.
IBM Belgium, Dmi & Ticon & Tac (2009). Economic Integration and Vietnam's Development. Framework Contract Commission 2007, Vietnam: The European Union.
International Finance Corporation, (2000), China’s Emerging Private Enterprises – Prospects for the New Century. Washington, D. C.: IFC.
International Finance Corporation (2002), Donor Report 2002. Washington, D. C.: IFC
IMF (1999) IMF Selected Issues: Vietnam, Hanoi: IMF.
IMF (2000) IMF Article IV Consultation: Staff Report, Hanoi: IMF.
IMF (2003) IMF Article IV Consultation: Staff Report, Hanoi: IMF.
IMF (2004) IMF Article IV Consultation: Staff Report, Hanoi: IMF.
IMF (2006) IMF Article IV Consultation: Staff Report, Hanoi: IMF.
IMF (2007) IMF Article IV Consultation: Staff Report, Hanoi: IMF.
IMF (2007) IMF Selected Issues: Vietnam, Hanoi: IMF.
IMF (2008) IMF Article IV Consultation: Staff Report, Hanoi: IMF.
IMF (2010) IMF Article IV Consultation: Staff Report, Hanoi: IMF.
IMF (2012) IMF Article IV Consultation: Staff Report, Hanoi: IMF.
Jefferson, T and King, J.E. (2011) Michal Kalecki and Critical Realism, Cambridge Journal of Economics, 35, 957-972.

Bibliography 262
Jensen, M. C. and Meckling, W. H. (1976) Theory Of The Firm: Managerial Behavior, Agency Costs And Ownership Structure, Journal Of Financial Economics, 3 (4), 305-360.
Ju, J. And Lin., J. Y. (2009) Endowment Structures, Industrial Dynamics, and Economic Growth, World Bank Policy Research Working Paper, No. 5055.
Kalecki, M. (1933) Outline of a Theory of the Business Cycle. Selected Essays on the Capitalist Economy, Cambridge: Cambridge University Press.
Kalecki, M. (1971) Selected Essays on the Dynamics of the Capitalist Economy, Cambridge: Cambridge University Press.
Kalecki, M. (1993) Observations on Social and Economic Aspects of ' I n t e rmed ia t e Reg imes ' i n Os i a tynsk i , J . (Ed i to r ) , Co l l ec t ed Works o f Michal Kalecki. Volume V, Oxford: Oxford University Press.
Kalecki, M. (1993b) The Difference between Crucial Economic Problems of D e v e l o p e d a n d U n d e r d e v e l o p e d N o n - S o c i a l i s t E c o n o m i e s i n Osiatynski, J. (Editor), Collected Works of Michal Kalecki. Volume V, Oxford: Oxford University Press.
K a l e c k i , M . ( 1 9 9 3 c ) T h e P r o b l e m o f F i n a n c i n g D e v e l o p m e n t , i n Osiatynski, J. (Editor), Collected Works of Michal Kalecki. Volume V, Oxford: Oxford University Press.
K a l e c k i , M . ( 1 9 9 3 d ) U n e m p l o y m e n t i n U n d e r d e v e l o p e d C o u n t r i e s i n Osiatynski, J. (Editor), Collected Works of Michal Kalecki. Volume V, Oxford: Oxford University Press.
Keen, S. (2001) Minsky's Thesis: Keynesian or Marxian? in Bellofiore, R. and Ferri. P. (Editors) Financial Keynesianism and Market Instability, Cheltenham: Edward Elgar.
Kerekes, A. (2000), Hungary - Tapping Resilient Household Savers, in Flemming, A. and Giugale, M. (Editors), Financial Systems in Transition: a Flow of Funds Analysis of Financial Evolution in Eastern Europe and Central Asia, Singapore: River World Scientific.

Bibliography 263
Keynes, J. M. (1936) The General Theory of Employment, Investment, and Money, London: Macmillan.
Keynes, J. M. (1937), The Ex Ante Theory of the Rate of Interest, Economic Journal, 47, 663-668.
Khan, A. H. & Hasan, L. (1998) Financial Liberalization, Savings and Economic Development in Pakistan, Economic Development and Cultural Change, 46 (April), 581–595.
King, R.G. and Levine, R. (1993), Finance and Growth: Schumpeter Might be Right, Quarterly Journal of Economics, VIII, 717–37.
King, R.G. and Levine, R. (1993b) Finance, Entrepreneurship, and Growth: Theory and Evidence, Journal of Monetary Economics, 32 (3), 513–42.
Klein, B., Crawford, R. G., and Alchian, A. A. (1978) Vertical Integration, Appropriable Rents, And The Competitive Contracting Process, The Journal of Law and Economics, 21 (2), 297-326.
Knight, F. H. (1921) Risk, Uncertainty and Profit, Boston: Houghton Mifflin.
Kogut, B. and Zander, U. (1996) What firms do? Coordination, Identity, and Learning Organization Science, 7, 502-518.
Kogut, B. and Zander, U. (2003) Reflection: Knowledge and an Evolutionary Theory of the Multinational Firm 10 Years Later, Journal of International Business Studies, 34, 505-151.
Kokko, A. (2001) Trade and Industrial Policy Reform in Brundenius, C. and Weeks, J. (Editors), Globalization and Third World Socialism, London: Palgrave.
Kokko, A. and Sjöholm, F. (2000) Some Alternative Scenarios For The Role Of The State In Vietnam The Pacific Review, 13 (2), 257-277.
Kokko, A. and Sjöholm, F. (2005) The Internationalization Of Vietnamese Small And Medium-Sized Enterprises, Asian Economic Papers, 4 (1), 152-177.

Bibliography 264
Kornai, J. (1979) Resource-Constrained versus Demand-Constrained Systems Econometrica, 47 (4), 801-819.
Kovsted, J., Rand, J., and Tarp, F. (2005) From Monobank to Commercial Banking: Financial Sector Reforms in Vietnam (1988-2003), Singapore: NIAS Press.
Kregel, J. A. (1989) Operational and Financial Leverage, the Firm, and the Cycle: Reflections on Vickers' Money Capital Constraint, Journal of Post Keynesian Economics, 12 (2), 224-236.
Kregel, J.A. (1990) The Integration of Micro and Macroeconomics through Macrodynamic Megacorps: Eichner and the "Post-Keynesians", Journal of Economic Issues, 24 (2), 523-534
Kulig, J. (2009) Michal Kalecki as a Scholar in Development Economics. A Recollection Note, Economics & Business Administration Journal, Warsaw: Warsaw School of Economics Publishing.
Lawson, T. (1985), Uncertainty and Economic Analysis, Economic Journal, 95, pp. 909-927.
Lawson, T. (1997) Economics and Reality, London: Routledge.
Lawson, T, (1999) Connections and Distinctions: Post Keynesianism and Critical Realism, Journal of Post Keynesian Economics, 22 (1), 3-14.
Lavoie, M. (1992) Foundations of Post-Keynesian Economic Analysis, Cheltenham: Edward Elgar.
Lazonick, W. (1983) Industrial Organization And Technological Change: The Decline Of The British Cotton Industry The Business History Review, 57, 195-236.
Lazonick, W. and Elbaum, B. (1986) The Decline of the British Economy, Clarendon.
Lazonick, W. (2002) Innovative Enterprise And Historical Transformation Enterprise and Society, 3 (1), 35-54.

Bibliography 265
Lazonick, W. (2004) The Innovative Firm, in Fagerberg, J. and Mowery, D. and Nelson, R. (Editors), The Oxford Handbook of Innovation (pp. 29–55), Oxford: Oxford University Press.
Lazonick, W. and O'Sullivan, M. (2008) Finance And Industrial Development. Part I: The United States And The United Kingdom Financial History Review, 4 (1), 7-29.
Leung, S. (2009) Banking and Financial Sector Reforms in Vietnam, ASEAN Economic Bulletin, 26, 44-57.
Le Dang Doang (1996) Legal Consequences of State-Owned Enterprise Reform, in N g C h e e Yu e n , F r e e m a n , N . a n d H u y n h , F. H . ( E d i t o r s ) S t a t e -Owned Enterprise Reform in Vietnam: Lessons from Asia, Institute of South East Asian Studies
Le Van Su (2005) Overview of SME Development in Ten Cities and Provinces and Some Initial Findings, CIEM: Hanoi.
Leung, S., Bingham, B, Davies, M. (2010) Globalization and Development in the Mekong Economies, Cheltenham: Edward Elgar.
Levallois, C. (2009) One Analogy Can Hide Another: Physics and Biology in Alchian's Economic Natural Selection, History of Political Economy, 41 (1), 163-181.
Lewis, W. A. (1954) Economic Development with Unlimited Supplies of Labour, Manchester School of Economic and Social Studies, 22, 139-191.
Lin, G. and Schramm, R. (2006) A Decade of Flow of Funds in China (1995-2005), accessed at http://faculty.washington.edu/karyiu/confer/beijing06/papers/lin-schramm.pdf July 2011.
Lin., J. Y. (2001) Promoting the Growth of Medium and Small-sized Enterprises through the Development of Medium and Small-sized Financial Institutions Economic Research Journal, 2001-01, available at: http://en.cnki.com.cn/Article_en/CJFDTOTAL-JJYJ200101001.htm.

Bibliography 266
Lin, J. (2003) Development Strategy, Viability and Economic Convergence, Economic Development and Cultural Change, 53 (2), 277–308.
Lin, J.Y. (2009) Should Industrial Policy in Developing Countries Conform to Comparative Advantage or Defy it? A Debate Between Justin Lin and Ha Joon Chang. Development Policy Review, 27 (5), 483-502.
Lin, J. Y. (2010) New Structural Economics: A Framework for Rethinking Development, Policy Research Working Paper, No 5197, World Bank.
Lin, J. Y. (2010b) Development and Transition - Idea, Strategy, and Viability Development Economics Working Papers, No 22709 East Asia Bureau of Economic Research.
Lin, J. Y. (2010c) The Growth Report And New Structural Economics, Policy Research Working Paper No 5336, World Bank.
Lin, J. Y. and Cai., F. (1998) Competition, Policy Burdens, And State-Owned Enterprise Reform The American Economic Review, 88 (2), pp. 422-427.
Lin, J. Y. and Sun., X. (2009) Toward A Theory Of Optimal Financial Structure, Policy Research Working Paper, No 5038, World Bank.
Loasby, B. J. (1990) Firms, markets, and The Principle Of Continuity, in Whitaker, J.K. (Editor) Centenary Essays on Alfred Marshall, Cambridge: Cambridge University Press.
Loasby, B. J. (1998) The Organisation of Capabilities. Journal of Economic Behavior and Organization, 35 (2), 139-160.
Lockett, A. and Thompson, S. (2001) The Resource-Based View And Economics, Journal of Management, 27 (60), 723-754.
Mackie, J.A.C. (2002) Changing Patterns of Chinese Big Business in Southeast Asia, in Ruth McVey (Editor), Southeast Asian Capitalists, Cornell Southeast Asia Program..
Malesky, E. J. and Taussig, M. (2008) Where Is Credit Due? Legal Institutions, Connections, and the Efficiency of Bank Lending in Vietnam, The Journal of Law, Economics, & Organization, 25, 535-578.

Bibliography 267
Malesky, E. J. and Taussig, M. (2009) Out of the Gray: The Impact of Provincial Institutions on Business Formalization in Vietnam, Journal of East Asian Studies, 9, 249-290.
Manning, M. J. (2003) Finance Causes Growth: Can We Be So Sure?, Contributions to Macroeconomics, 3(1), n. 12.
MARD (Ministry of Agriculture and Rural Development (2008), Management of Rice Cultivation: Land is the Fundamental Method to Ensure Food Security in Vietnam, MARD, Hanoi
Marshall, A. (1997) Principles of Economics, London: Prometheus Books.
Martin, M. F. (2008) U.S. Clothing Imports from Vietnam: Trade Policies and Performance, Congressional Research Service, Washington.
Masina, P. (2002) Vietnam and the Regional Crisis: The Case of a'Late Late- Comer', European Journal of East Asian Studies, 1 (2), 199-220.
Masina, P. (2006) Vietnam's Development Strategies, London: Routledge.
McKinnon, R.I. (1973) Money and Capital in Economic Development, Washington, DC: Brookings Institution.
Minsky, H. P. (1964) Financial Crisis, Financial Systems, and the Performance of the Economy in The Commission on Money and Credit Private Capital Markets, London: Prentice-Hall.
Minsky, H. (1975) John Maynard Keynes, New York: Columbia University Press.
Minsky, H. P. (1991) Schumpeter: Finance and Evolution, in Heertje, A. and Perlman, M. , E v o l v i n g T e c h n o l o g y a n d M a r k e t S t r u c t u r e : S t u d i e s in Schumpeterian Economics, The University of Michigan Press.
Minsky, H. P. (1992) The Financial Instability Hypothesis, The Jerome Levy Economics Institute Working Paper No. 74.
Modigliani, F. and Miller, M.H. (1958) The Cost of Capital, Corporation Finance, and the Theory of Investment, American Economic Review, 48, 261-97.

Bibliography 268
Modigliani, F. (1986), Life cycle, Individual Thrift and the Wealth of Nations, American Economic Review, 76 (3), 297-313.
Montgomery, C. A. (1995) Resource-Based and Evolutionary Theories of the Firm: Towards a Synthesis, London: Kluwer Academic Publishers.
Mori, J. and Ohno, K. (2004) Optimum Procurement Strategy: Determinants of Parts Localisation under Regional Linkage and Competition, Vientam Development Forum Working Paper, accessed at http://www.grips.ac.jp/vietnam/KOarchives/doc/EB02_IIPF/6EB02_Chapter5.pdf
Moore, B. (1988), Horizontalists and Verticalists: the Macroeconomics of Credit Money, Cambridge: Cambridge University Press.
Moss, L. S. (1990) Evolutionary Change and Marshall's Abandoned Second Volume, Économie Appliquée, 43 (1), 85-98.
MOST (2003) Science and Technology Development Strategy by 2010, Hanoi: Ministry of Science and Technology.
Mott, T. (2010) Kalecki's Principle of Increasing Risk and Keynesian Economics, London: Routledge
Nelson, R. and Winter, S. (1982) An Evolutionary Theory of the Firm, Cambridge: The Belknap Press of Harvard University Press.
Nelson, R. R. and Winter, S. G. (1982b) An Evolutionary Theory of Economic Change, Harvard : Harvard University Press.
Nelson, R. R. (1991) Why Do Firms Differ, And How Does It Matter? Strategic Management Journal, 12 (S2), 61-74.
Nelson, R. R. (2008) Economic Development from the Perspective of Evolutionary Economic Theory Oxford Development Studies.
Nguyen Dinh Cung, Pham Anh Tuan, Bui Van and David Dapice (2004) “History or Policy: Why Don’t Northern Provinces Grow Faster?”, Central Institute for Economic Management (CIEM) and United Nations Development Programme (UNDP), Hanoi.

Bibliography 269
Nguyen Van Thang and Freeman, N. (2009) State-Owned Enterprises in Vietnam: are they ‘crowding out’ the private sector?, Post-Communist Economies, 21 (2), pp.227-247
Nguyen Xuan Nghia (2005) Banking Reform in Vietnam in The Vietnamese Economy and its Transformation to an Open Market System, Sharpe: New York.
Nguyen Ke Tuan, (2011) Kinh te Vietnam 2010: Nhin lai mo hinh tang truong gai doan 2001–2010 [The economy of Vietnam in 2010: A re-examination of the 2001–2010 growth model], Hanoi: Dai hoc Kinh te Quoc dan, National Economic University Publishing.
Nguyen Dinh Tai (2006) Promoting Private Sector Development in Vietnam: The Effectiveness of Supporting Policies, CIEM: Hanoi.
Nguyen Thanh Hai, Alam, Q., Perry, M., and Prajogo, D. (2009) The Entrepreneurial Role Of The State And SME Growth in Vietnam, JOAAG. 4 (1).
Nguyen Thi Tue Anh, Vu Xuan Nguyet Hong, Tran Toan Thang and Nguyen Manh Hai (2006), The Impact of Foreign Direct Investment on Economic Growth in Vietnam, Hanoi: Science and Technology Publishing House.
Nissanke, M. (1990) Mobilising Domestic Resources for African Development and Diversification, Oxford: International Development Centre.
Nolan, P. (1998) Indigenous Large Firms in China's Economic Reform: The Case of Shougang Iron and Steel Corporation, Contemporary China Institute, SOAS.
Nolan, P. (2002) China and the Global Business Revolution, Cambridge Journal of Economics, 26 (1), 119-137.
Nolan, P. and Xiaoqiang, W. (2007) China in the Asian Financial Crisis: 'Cutting the T r e e s t o S a v e t h e F o r e s t ' i n N o l a n , P. (Editor), Integrating China: Towards the Coordinate Market Economy, London: Anthem Press.
Ocampo, J, Rada, C and Taylor, L (2009), Economic Structure, Policy and Growth in Developing Countries, New York: Columbia University Press.

Bibliography 270
Odhiambo, N.M. (2004) Money and Physical Capital are Complementary in Kenya, International Economic Journal, 18 (1), 65-78.
Penrose, E. (1952) Biological Analogies in the Theory of the Firm, The American Economic Review, 42, 804-819.
Penrose, E. (1995) The Theory of the Growth of the Firm, Oxford: Oxford University Press.
Penrose, J., Dinh Minh, and Bui Trang (2010) The Role of Industrial Zones in Promoting Linkages Between Foreign Enterprises and the Vietnamese Private Sector: A Case Study of Binh Duong Hanoi: UNDP.
Phan Van Tiem and Nguyen Van Thanh (1996) Problems & Prospects of State Enterprise Reform, 1996 - 2000, in Ng Chee Yuen, Freeman, N, Frank Hiep Huynh (Editors) State-Owned Enterprise Reform in Vietnam: Lessons from Asia, Singapore: Institute of Southeast Asian Studies.
Pitelis, C. (2000) A Theory Of The (Growth Of The) Transnational Firm: A Penrosean Perspective Contributions To Political Economy, 19 (1), 71-89.
Pitelis, C. and Verbeke, A. (2007) Edith Penrose And The Future Of The Multinational Enterprise: New Research Directions, Management International Review, 47 (2), 139-149.
Pitelis, C. N. (1998) Transaction Costs and the Historical Evolution of the Capitalist Firm, Journal of Economic Issues, 32 (4), 999-1017.
Pitelis, C. N. and Pseiridis, A. N. (1999) Transaction Costs Versus Resource Value?, Journal of Economic Studies, 26 (3), 221-240.
Pitelis, C. N. and Teece, D. J. (2009) The (New) Nature and Essence of the Firm, European Management Review, 6 (1), 5-15
Porter, M. E., (1990) The Competitive Advantage of Nations, New York: Free Press.
Pratten, S. (1998) Marshall on Tendencies, Evolution and Statical Method, History of Political Economy, 30:1, 121-163.

Bibliography 271
Prendergast, R (2006) Schumpeter, Hegel and the Vision of Development, Cambridge Journal of Economics, 30, 253-275.
Queen, M. and Roll, R. (1987) Firm Mortality: Using Market Indicators to Predict Survival, Financial Analysts Journal, 46, 9-26.
Rand, J., Silva, P., Tarp, F., Cuong, T. T., and Tam, T. T. (2008) Characteristics of the Vietnamese Business Environment: Evidence from a SME Survey in 2007, Hanoi: DANIDA.
Rajan, G.R. and Zingales, L. (1998), Financial Dependence and Growth, American Economic Review, 88 (3), 559-86.
Rajan, G.R. and Zingales, L. (2001), Financial Systems, Industrial Structure, and Growth, Oxford Review of Economic Policy, 17 (4), 467-82.
Reinhardt, J. (1993) Industrial Restructuring and Industrial Policy in Vietnam in, Than, M . a n d T a n , J . ( E d i t o r s ) , Vietnam's Dilemmas and Options: The Challenge of Economic Transition in the 1990s, Institute of Southeast Asian Studies.
Richardson, G. B. (1972) The Organisation Of Industry, The Economic Journal, 82 (327), 883-896.
Riedel, J. and Turley, W. S. (1999) Politics And Economics Of Transition To An Open Market Economy In Vietnam, OECD Development Centre, Technical Papers.
Riedel, J. (2009), The Global Economic Crisis and its Long Rn Implications for Vietnam, Discussion Paper for UNDP Vietnam: Hanoi.
Robbins, L. (1928) The Representative Firm, The Economic Journal, 38, 387-404
Robinson, J. (1952) The Generalization of the General Theory in Robinson, J., The Rate of Interest and Other Essays, London: MacMillan
Sachs, I. (1977) Kalecki and Development Planning, Oxford Bulletin of Economics & Statistics, 39 (1), 47-56

Bibliography 272
Sachs, I. (2004) Kalecki's Political Economy of Development of Mixed E c o n o m i e s : E m p l o y m e n t - L e d G r o w t h , i n S a d o w s k i Z . a n d S z e w o r s k i A. (Editors) Kalecki's Economics Today, London and New York: Routledge..
Sato, Y. (1994), The Development of Business Groups in Indonesia: 1967-89, in Takashi Shiraishi, (Editor), Approaching Suharto's Indonesia from the Margins, Ithaca: Cornell University Southeast Asia Programme.
Sato, Y. (2002), The Salim Group in Indonesia: The Development and Behaviour of the Largest Conglomerate in Southeast Asia, in Hal Hill (Editors), The Economic Development of Southeast Asia, Volume 3, Edward Elgar.
Sawyer, M. (1985) Towards a Post-Kaleckian Macroeconomics , in Arestis, P. and Skouras, T. (Editors), Post Keynesian Economic Theory: A Challenge to Neo-classical Economics, ME Sharpe Inc, London.
Sawyer, M. (1985b) The Economics of Industries and Firms, London: Croom Helm.
Sawyer, M. (1998) The Kaleckian Analysis and the New Millennium, Working Paper No. 223, The Levy Economics Institute.
Sawyer, M. (2006) Kalecki on Money and Finance, in Arestis, P. and Sawyer, M. (Editors), A Handbook of Alternative Monetary Economics, Edward Elgar, Cheltenham
Schumpeter (1911) The Theory of Economic Development: An Inquiry into Profits, Capital, Credit, Interest, and Business Cycles, Cambridge, MA: Harvard University Press
Schumpeter, J. A. (1954) History of Economic Analysis, London: Allen & Unwin
Shionoya, Y (2004), Schmupeter's Preface to the Fourth German Edition of The Theory of Economic Development, Journal of Evolutionary Economics 14: 131-142.
Shapiro, N. (1990), The 'Megacorp': Eichner's Contribution to the Theory of the Firm, Journal of Economic Issues, 24 (2), 493-500.
Shapiro, H. (2007) Industrial Policy and Growth, DESA Working Paper. No. 53
Shaw, E.S. (1973), Financial Deepening in Economic Development, New York: Oxford University Press.

Bibliography 273
Simon, H. A. (1979) Rational Decision Making In Business Organizations, The American Economic Review, 69 (4), 493-515.
Simon, H. A. (1995) Organizations And Markets Journal Of Public Administration Research And Theory, 5 (3), 273-294
Sraffa, P., Robertson, D. H., and Shove, G. F. (1930) Increasing Returns And The Representative Firm: A Symposium Economic Journal, 40, 79-116.
Steindl, J. (1945) Small and Big Business: Economic Problems of the Size of Firms, London: Basil Blackwell.
Steindl, J. (1965) Random Process And The Growth Of Firms: A Study Of The Pareto Law, New York: Hafner.
Steindl, J. (1966) On Maturity In Capitalist Economies, in Problems of Economic Dynamics and Planning: Essays in Honour of Michal Kalecki, Oxford: Pergamon.
S t e i n d l , J . ( 1 9 6 8 ) S i z e D i s t r i b u t i o n s I n E c o n o m i c s , i n S i l k s , E (Editor) International Encyclopaedia of the Social Sciences, London: Collier Macmillan.
Steindl, J. (1975) Maturity and Stagnation in the American Economy, Oxford: Blackwell.
Steindl, J. (1980) Technical Progress and Evolution, in Sahal, D (Editor), R&D and Technological Innovation, , Toronto: Lexington Books.
Steindl, J. (1981) Ideas And Concepts Of Long Run Growth, Banca Nazionale del Lavoro Quarterly Review, 34 (136), 35-48.
Steindl, J. (1981b) Some Comments On The Three Versions Of Kalecki's Theory Of The Trade Cycle in Assorodobraj-Kula et al (Editors), Studies in Economic Theory and Practice: Essays in honour of Edward Lipinski, New York: North Holland Publishing Company.
Steindl, J. (1982) The Role Of Household Saving In The Modern Economy, Banca Nazionale del Lavoro Quarterly Review, 35 (140), 69-88.

Bibliography 274
Steindl, J. (1984) Reflections on the Present State of Economics, Banca Nazionale del Lavoro Quarterly Review, 148, 3-14.
Steindl, J. (1987) Kalecki's Theory Of Pricing: Notes On The Margin, in Steindl, J., Economic Papers, 1941-88, St. Martin's Press, New York.
Steindl, J. (1990) Skilled Manpower and Growth, in Economic Papers (1941-88), J. Steindl (Editor), London: Macmillan.
Stiglitz, J. and Weiss, A. (1981) Credit Rationing in Markets with Imperfect Information, American Economic Review, 71, 393-410.
Studart, R. (1993), Financial Repression and Economic Development: Towards a Post-Keynesian Alternative, Review of Political Economy, 5 (3), 277-98.
Studart, R. (1995), The Efficiency of Financial Systems, Liberalization, and Economic Development, Journal of Post Keynesian Economics, 18 (2), 269-92.
Studart, R. (1995b) Investment Finance in Economic Development, London: Routledge.
Studart, R. (2000), Financial Opening and Deregulation in Brazil in the 1990s: Moving towards a New Pattern of Development Financing?, Quarterly Review of Economics and Finance, 40 (1), 25-44.
Studart, R. (2003), Development Finance, in King, J.D. (Editor), The Elgar Companion to Post Keynesian Economics, Cheltenham: Edward Elgar Publishing.
Studwell, J. (2007) Asian Godfathers: Money and Power in Hong Kong and Southeast Asia, New York: Atlantic Monthly Press.
Suehiro, A. (1989) Capital Accumulation in Thailand 1855-1985, Chang Mai: Silkworm Books.
Suehiro, A. (1992) Capitalist Development in Postwar Thailand: Commercial Bankers, Industrial Elite and Agribusiness Groups, in Ruth McVey (Editor)., Southeast Asian Capitalists, Cornell Southeast Asia Program.
Suehiro, A, (1996) Capital Accumulation in Thailand, 1855-1985, Chiang Mai: Silkworm Books.

Bibliography 275
Suehiro, A. (2003) Determinants of Business Capability, in Thailand, Jomo, K.S. and Folk, Brian (Editors), Ethnic Business and Chinese Capitalism in Southeast Asia, London, Routledge
Sweezy, P. M. (1990) Monopoly Capitalism, in Eatwell, J., Milgate, M. and Newman, P. (Editors), The New Palgrave Dictionary of Economics, London: Palgrave.
Sweezy, P. M. and Baran, P. (1967) Monopoly Capitalism: An Essay on the American Economic and Social Order, Monthly Review Press.
Taussig, M. (2005) Domestic Companies in Vietnam: Challenges for Development of Vietnam’s Most Important SMEs, William Davidson Institute Policy Brief No.34, University of Michigan.
Taussig, M. (2009) Business Strategy During Radical Economic Transition: Vietnams First Generation of Larger Private Manufacturers and a Decade of Intensifying Opportunities and Competition, Hanoi: UNDP Vietnam.
Taylor, L. (2009) Growth, Development Policy, Job Creation and Poverty Reduction, DESA Working Paper.
Teece, D. J. and Pisano, G. (1994) The Dynamic Capabilities of Firms: An introduction, Industrial and Corporate Change, 3 (3), 537-556.
Teece, D. J. (1996) Firm Organization, Industrial Structure, And Technological Innovation, Journal of Economic Behavior and Organization, 31, 193-224.
Teece, D. J., Pisano, G., and Shuen, A. (1997) Dynamic Capabilities And Strategic Management, Strategic Management Journal, 18 (7), 509-533.
Teece, D. J., Pisano, G., and Shuen, A. (1997b) Firm Capabilities, Resources And The Concept Of Strategy, Strategic Management Review, 18 (3), 23-40.
Tenev, S., Carlier, A., Chaudry, O. and Nguyen Quynh Trang (2003), Informality and the Playing Field in Vietnam’s Business Sector, Washington: World Bank and IFC.

Bibliography 276
Thang V. Nguyen, Ngoc T.B, L., and Freeman, N. (2006) Trust And Uncertainty: A Study Of Bank Lending To Private SMEs in Vietnam, Asia Pacific Business Review, 12 (4), 547-568.
Thomas, B. (1991) Alfred Marshall on Economic Biology, Review of Political Economy, 3, 1-14.
Thornton, J. (1990) The Demand for Money in India: a Test of McKinnon’s Complementarity Hypothesis, Savings and Development, 14, 153–157.
Toporowski, J. (1991) Two Enigmas in Kalecki’s Methodology, History of Economics Review, Vol. 16, 90–6.
Toporowski, J. (1993) The Economics Of Financial Markets And The 1987 Crash, Cheltenham: Edward Elgar.
Toporowski, J. (2000) The End of Finance: Capital Market Inflation, Financial Derivatives and Pension Fund Capitalism, London: Routledge.
Toporowski, J. (2005) Methodology and Industrial Maturity in Steindl's C a p i t a l i s m i n M o t t , T . a n d S h a p i r o , N . (Editors), Rethinking Capitalist Development: Essays on the Economics of Josef Steindl, London: Routledge.
Toporowski, J. (2005b) Theories of Financial Disturbance: An Examination Of The Critical Theories Of Finance From Adam Smith To The Present Day, Cheltenham: Edward Elgar.
Toporowski, J. (2008) Minsky's' Induced Investment And Business Cycles. Cambridge Journal Of Economics, 32 (5), 725-737.
Toporowski, J. (2009) Corporate Limited Liability and the Financial Liabilities of Firms, Cambridge Journal of Economics, 34 (5), 885-93.
Toporowski, J. (2010) Corporate Liquidity and Financial Fragility: The Role of Investment, Debt and Interest, SOAS Working Paper no. 169, SOAS, London.

Bibliography 277
Tran Angie Ngoc, (2004) Linking Growth with Equity? The Vietnamese Textile and Garment Indus t r i es S ince Doi Moi , in Beres ford , M. and Tran Angie Ngoc (Editors), Reaching For The Dream, Copenhagen: NIAS Press.
Tran Dinh khoi Nguyen and Ramachandran, N. (2006) Capital Structure in Small and Medium-sized Enterprises: The Case of Vietnam, ASEAN Economic Bulletin, 23 (2), 192-211.
UNCTAD (1995), Issues Concerning SMEs’ Access to Finance, Report to the UNCTAD Trade and Development Board by the Ad Hoc Working Group on the Role of Enterprises in Development, Geneva: UNCTAD.
UNDP (2007), Vietnam Top 200 Methodology and Data Issues, United Nations Development Programme (UNDP), Hanoi.
Van Arkadie, B. (1990), Report on the Economy of Vietnam, Socialist Republic of Vietnam (SRV) State Planning Committee and United Nations Development Programme (UNDP), Hanoi.
Van Arkadie, Brian and Raymond Mallon (2003), Vietnam: A Transition Tiger?, The Australian National University: Asia Pacific Press.
Van Nhu Dang, (2002) Investment and Growth: A Simple Macroeconomic Projection for 2001-2010, in Binh Tran Nam and Chi Do Pham (Editors), The Vietnamese Economy: Awakening the Dormant Dragon, London: Routledge.
Vuong, Quan Hoang and Tran, Tri Dung (2010) Corporate Bond Market in the Transition Economy of Vietnam, Centre Emile Bernheim, Working Paper No 10/001.
Vu Quang Viet (2009), Vietnam’s Economic Crisis: Policy Follies and the Role of State-Owned Conglomerates, in Singh, D. (ed.) Southeast Asian Affairs 2009, Singapore: Institute of Southeast Asian Studies (ISEAS) Publications.
Vu Quoc Ngu (2002), The State-Owned Enterprise Reform in Vietnam: Process and Achievements, Institute of Southeast Asian Studies (ISEAS) Visiting Researchers Series No.4., ISEAS: Singapore

Bibliography 278
Vu Thanh Tu Anh (2005) Vietnam – The Long March to Equitization, William Davidson Institute Policy Brief No.33, University of Michigan.
Walters, B. and Young. D, (1999), Is Critical Realism the Appropriate Basis for Post Keynesianism?, Journal of Post Keynesian Economics, 22 (1), 105 - 123.
Wailerdsak, N (2008), Companies in Crisis, in Pasuk Phongpaichit and Chris Baker (Editors), Thai Capital: After the 1997 Crisis, Bangkok: Silkworm Books.
Warman, F. and Thirlwall, A. P. (1994), Interest Rates, Savings, Investment and Growth in Mexico 1960-90: Test of the Financial Liberalization Hypothesis, Journal of Development Studies, 30, 629-649.
Wattanapruttipaisan, T. (2003), Four Proposals for Improved Financing of SME Development in ASEAN, Asian Development Review, 20 (2), 66-104.
Whalen, C (2001), Integrating Schumpeter and Keynes: Hyman Minsky's Theory of Capitalist Development, Journal of Economic Issues, 35 (4), 802-823.
Williamson, O. E. (1973) Markets And Hierarchies: Some Elementary Considerations, The American Economic Review, 63 (2), 316-325.
Williamson, O. E. (1983) Organizational Form, Residual Claimants, And Corporate Control, Journal Of Law And Economics, 26 (2), 351-366.
Williamson, O. E. (1988) Corporate Finance And Corporate Governance, Journal of Finance, 43 (3), 567-591.
Williamson, O. E. and Winter, S. G. (1991) The Nature Of The Firm: Origins, Evolution, And Development, Oxford: Oxford University Press.
Williamson, O. E. and Winter, S. G. (1993) The Nature of the Firm, Oxford: Oxford University Press.
Winter, S. G. (2003) Understanding Dynamic Capabilities, Strategic Management Journal, 15, 143-152.
Woo, J (1991) Race to the Swift: State and Finance in Korean Industrialization, New York: Columbia University Press.

Bibliography 279
Woodford, M. (2003) Interest and Prices: Foundations of a Theory of Monetary Policy, Princeton University Press.
World Bank (1989), World Development Report, Oxford: Oxford University Press
World Bank (1991) Transforming a State Owned Financial System. A Financial Sector Study of Vietnam, Sector Report No. 82, World Bank
World Bank (1995) Vietnam Financial Sector Review: An Agenda for Financial Sector Development, Hanoi: World Bank.
World Bank (1999) Private Companies in Vietnam: A Survey of Public Perceptions, Hanoi: World Bank.
World Bank (2001) Transforming a State Owned Financial System: A Financial Sector Study of Vietnam, Hanoi: World Bank.
World Bank (2009) Vietnam Development Report 2009: Capital Matters, Hanoi: World Bank.
World Bank (2011) Vietnam Development Report: Market Economy for a Middle Income Vietnam, Hanoi: World Bank
Yeoh, Caroline, David, David and Leong, Ai Lin (2004) Embedded Co-Operation In The Context Of Singapore's Investment Enclaves In Indonesia And Vietnam: A Strategy Reconsidered, Research Collection Lee Kong Chian School of Business (Open Access). Paper 2883.http://ink.library.smu.edu.sg/lkcsb_research/2883
Yoshihara, K (1988) The Rise of Ersatz Capitalism in Southeast Asia, Singapore: Oxford University Press.

280
Appendix 1: The Top 200 Firms, All
Rank
1
2
3
4
5
6
7
8
9
10
11
12
13
14
15
16
17
18
19
20
21
22
23
24
25
26
27
English Name
Bank for Agriculture and Rural Development
Vietnam Post and Telecommunications Corporation
Electricity of Vietnam
Bank for Investment and Development of Vietnam
Vietsovpetro JV Enterprise
Bank for Foreign Trade of Vietnam
Pouyen Vietnam Co Ltd
Vietnam Insurance Corporation
HCMC Post and Telecommunications
Military Telecom Corporation
Vietnam Railway Corporation
Thai Nguyen Iron and Steel Co
Canon Vietnam Co Ltd
The Corporation for Financing and Promoting Technology
Vietnam Dairy Products Co.
Southern Steel Corporation
Vietnam Mobile Telecom Services Company
Tae Kwang Vina Industrial Co Ltd
Vietnam Paper Corporation
Fujitsu Vietnam Computer Products Co Ltd
CP Vietnam Livestock Co Ltd
Pouchen Vietnam
Saigon Tobacco Co.
Bao Viet Life Insurance
Honda Vietnam Co Ltd
Chang Shin Co Ltd
Hyundai Vinashin Shipyard Co Ltd

Appendices
28
29
30
31
32
33
34
35
36
37
38
39
40
41
42
43
44
45
46
47
48
49
50
51
52
53
54
55
56
Bao Viet Insurance
Nidec Tosok Vietnam Co Ltd
Petroleum Technical Services Company
Furukawa Automotive Parts Co Ltd
Vietnam Construction Investment Import and Export Holding Corporation
Hwa Seung Vina Co Ltd
Vedan Vietnam
Yazaki EDS Vietnam Co Ltd
Saigon Tourist Holding Company
Dau Tieng Rubber Corp.
Viet Tien Garment Co.
Saigon Thuong Tin Bank
Dong Nai Rubber Co.
Vietnam Airlines
Hanoi Public Service and Transportation Co.
Tainan Spinning Co Ltd
Asia Commercial Bank
Yamaha Motor Vietnam Co Ltd
Saigon Beer Alcohol and Beverage Corporation
Hoang Thach Cement Co
Mabuchi Motor Vietnam Co Ltd
Civil Engineering Construction Corp. No.5
Nissei Electric Vietnam Co Ltd
Hualong Corporation Vietnam
Petrolimex B12
Vietnam Southern Food Corporation
HCMC Water Supply Co
Bim Son Cement Co
Khanh Viet Corporation

Appendices
57
58
59
60
61
62
63
64
65
66
67
68
69
70
71
72
73
74
75
76
77
78
79
80
81
82
83
84
85
Prudential Vietnam
Metro Cash and Carry Vietnam
Nam Trieu Shipbuilding Company
Saigon Newport Co
Hanoi Textile and Garment Co
Dong Bac Coal Co.
Orion-Hanel Picture Tube Co Ltd
Cua Ong Coal Selecting Co.
Lam Thao Fertilizers and Chemicals Co
Petrolimex Region 2
Phong Phu Textile Co.
Chi Hung Joint Venture Co.
Thanh Le Commercial Import Export Co
Industrial and Commercial Bank of Vietnam
Nha Be Garment Co.
Dona Pacific Vietnam Co Ltd
Vietnam Manufacturing and Export Processing Co Ltd
Nam Viet Co Ltd
Binh Long Rubber Co
Kim Anh Co Ltd
Development Investment Construction Corp.
Formosa Vietnam Co Ltd
Construction Company No. 1
Sumitomo Bakelite Vietnam Co Ltd
Vietnam Ocean Shipping Co
Petrovietnam Gas Company
Southern Airport Authority
Construction Company No. 319
Bai Bang Paper Co

Appendices
86
87
88
89
90
91
92
93
94
95
96
97
98
99
100
101
102
103
104
105
106
107
108
109
110
111
112
113
114
Noi Dia Coal Co Ltd
Phuoc Hoa Rubber Co
Lever Vietnam JVC
Dona Victor Moulds MFG Co
Phu Rieng Rubber Co
Ha Long Shipyard
Bach Dang Shipyard
Thanh Cong Textile Co.
Samyang Vietnam Co Ltd
Petrolimex Region 1
Intimex Import Export Co
Quang Ngai Sugar Corp.
Vietnam Acecook Co Ltd
Vietnam Sea Transport and Chartering Co
Southern Rubber Industry Co
Saigon Passenger Railway Transportation Co.
Kinh Do JSC
Saigon Co.opMart
Civil Engineering Construction Corp. No.1
Tan Mai Paper Co.
Ut Xi Aquatic Products Processing Co. Ltd.
Bao Minh Co
Cai Lan Oil and Fats Industries Co Ltd
Can Tho Agricultural and Animal Products Company
Uni President Vietnam Co Ltd
Ha Bac Nitrogen Fertilizers and Chemical Co
Northern Airports Authority
Dona Orion Vietnam Co Ltd
Binh Duong Trading Investment and Development Corporation

Appendices
115
116
117
118
119
120
121
122
123
124
125
126
127
128
129
130
131
132
133
134
135
136
137
138
139
140
141
142
143
Cao Son Coal Co.
Uong Bi Coal Co.
Ha Tu Coal Co.
Saigon Port
Hanoi General Production and Import-Export Company
Vietnam Glass and Ceramics for Construction Corp.
Ha Tien Cement Co No.1
Thai Binh Co Ltd.
Machino Auto Parts Co Ltd
Phu Yen Material Company
Vietnam Air Petrol Co
Seaprodex Danang Co
Scancom Vietnam Co Ltd
Vissan Import Export Corporation
Saigon Agriculture Corporation
Can Tho Sea Product Processing Export Enterprise
Hai Phong Port
Yazaki Haiphong Vietnam Co Ltd
Saigon Post and Telecommunication JSC
Vang Danh Coal Co.
Petrovietnam Fertilizer and Chemicals Co.
Nui Beo Coal Co.
Chutex International Co Ltd
Phy My Hung Joint Venture Co.
Sumi-Hanel Electronics Co.
Construction Company No. 4
Technological and Commercial Joint Stock Bank
Theodore Alexander Co Ltd
Dutch Lady Vietnam
Appendices
144
145
146
147
148
149
150
151
152
153
154
155
156
157
158
159
160
161
162
163
164
165
166
167
168
169
170
171
172
Industrial Explosive Material Company
Freetrend Industrial Vietnam Co Ltd
Holcim Vietnam Ltd.
Vietnam Export Import Commercial Joint Stock Bank
Company No. 28
Green River Wood and Lumber Vietnam Co Ltd
Eastern Asia Commercial Bank
Coc 6 Coal Co.
Triumph International Vietnam Co Ltd
Always Co Ltd
Ha Tien Cement Co No.2
Ha Long Coal Co.
But Son Cement Co
Nam Dinh Textile Co
Binh Duong Production and Import Export Co.
Proconco Producing Animal Feeds JVC
Southern Fertilizers Co
Hanoi Trade Corporation
Ca Mau Frozen Seafood Processing Import Export Corp.
Pangrim Neotex Co Ltd
An Giang Agriculture and Foods Import Export Co.
Hoang Gia Cat Tuong Co. Ltd
Northern Foodstuff Co
Mao Khe Coal Co.
Hoang Mai Cement Co
Kingmaker Footwear Vietnam Co Ltd
Saigon Transportation Mechanical Corporation
Minh Quy Aquatic Products Processing Co Ltd.
Tin Nghia Import Export Co

Appendices
173
174
175
176
177
178
179
180
181
182
183
184
185
186
187
188
189
190
191
192
193
194
195
196
197
198
199
200
Vietnam Apatite Company
Thang Loi Textile and Garment Co
Vietnam Northern Food Corporation
Toyota Vietnam
Vietnam International Bank
Dong Nai Agricultural Products and Food Processing Import Export Co
Thanh An Corporation
Vietnam Construction and Import Export Corporation
Phuong Nam Joint Stock Commercial Bank
Deo Nai Coal Co.
Ninh Thuan Agricultural Products Export Co.
Viet Thang Textile Co.
Phu Nhuan Jewelry Joint Stock Company
Water Electrical Mechanical Installation and Construction Joint Stock Co
Vietnam Industrial Construction Corporation
Electrical Mechanical Appliances and Technology Development Company Co
Aquatic food trading Company
Sanyo Vietnam Home Appliances ASEAN
Lam Son Sugar Joint Stock Corporation
Binh Tien Consumer Goods Production Co. Ltd.
LG Electronics Vietnam Co Ltd
Ajinomoto Vietnam Co Ltd
Petec Trading and Investment Corporation
Cai Doi Vam Import Export Company
Danang Rubber Co
Grobest Industrial Vietnam Co Ltd
Minh Phu Seafood Import Export Co.
Loc Ninh Rubber Co.

Appendices
Appendix 2: The Top 200 Firms, Vietnamese
Rank
1
2
3
4
5
6
7
8
9
10
11
12
13
14
15
16
17
18
19
20
21
22
23
English Name
Bank for Agriculture and Rural Development
Vietnam Post and Telecommunications Corporation
Electricity of Vietnam
Bank for Investment and Development of Vietnam
Vietsovpetro JV Enterprise
Bank for Foreign Trade of Vietnam
Vietnam Insurance Corporation
HCMC Post and Telecommunications
Military Telecom Corporation
Vietnam Railway Corporation
Thai Nguyen Iron and Steel Co
The Corporation for Financing and Promoting Technology
Vietnam Dairy Products Co.
Southern Steel Corporation
Vietnam Mobile Telecom Services Company
Vietnam Paper Corporation
Saigon Tobacco Co.
Bao Viet Life Insurance
Honda Vietnam Co Ltd
Hyundai Vinashin Shipyard Co Ltd
Bao Viet Insurance
Petroleum Technical Services Company
Vietnam Construction Investment Import and Export Holding Corporation
Abbreviation
AGRIBANK
VNPT
EVN
BIDV
VIETSOVPETRO
VIETCOMBANK
BAOVIET
VIETTEL
VNR
TISCO
FPT
VINAMILK
SSC
VMS
VINAPIMEX
V I N A T A B A SAIGON
BAO VIET LIFE
HONDA VIETNAM
HVS
PTSC
C O N S T R E X I M HOLDINGS

Appendices
24
25
26
27
28
29
30
31
32
33
34
35
36
37
38
39
40
41
42
43
44
45
46
47
48
49
Saigon Tourist Holding Company
Viet Tien Garment Co.
Saigon Thuong Tin Bank
Dau Tieng Rubber Corp.
Vietnam Airlines
Hanoi Public Service and Transportation Co.
Dong Nai Rubber Co.
Asia Commercial Bank
Saigon Beer Alcohol and Beverage Corporation
Yamaha Motor Vietnam Co Ltd
Hoang Thach Cement Co
Petrolimex B12
Vietnam Southern Food Corporation
Khanh Viet Corporation
Bim Son Cement Co
Civil Engineering Construction Corp. No.5
HCMC Water Supply Co
Nam Trieu Shipbuilding Company
Hanoi Textile and Garment Co
Orion-Hanel Picture Tube Co Ltd
Dong Bac Coal Co.
Saigon Newport Co
Cua Ong Coal Selecting Co.
Lam Thao Fertilizers and Chemicals Co
Petrolimex Region 2
Phong Phu Textile Co.
SAIGON TOURIST
VTEC
SACOMBANK
V I E T N A M AIRLINES
TRANSERCO
DONARUCO
ACB
SABECO
Y A M A H A VIETNAM
PETROLIMEX B12
VINAFOOD 2
BCC
CIENCO 5
HANOSIMEX
OHPT
NECO
SNP
LAFCHEMCO
P E T R O L I M E X SAIGON
P H O N G P H U TEXCO

Appendices
50
51
52
53
54
55
56
57
58
59
60
61
62
63
64
65
66
67
68
69
70
71
72
73
74
75
76
77
Thanh Le Commercial Import Export Co
Chi Hung Joint Venture Co.
Nha Be Garment Co.
Industrial and Commercial Bank of Vietnam
Development Investment Construction Corp.
Nam Viet Co Ltd
Kim Anh Co Ltd
Binh Long Rubber Co
Petrovietnam Gas Company
Vietnam Ocean Shipping Co
Construction Company No. 1
Southern Airport Authority
Bai Bang Paper Co
Construction Company No. 319
Lever Vietnam JVC
Noi Dia Coal Co Ltd
Phuoc Hoa Rubber Co
Phu Rieng Rubber Co
Ha Long Shipyard
Bach Dang Shipyard
Petrolimex Region 1
Intimex Import Export Co
Thanh Cong Textile Co.
Quang Ngai Sugar Corp.
Vietnam Sea Transport and Chartering Co
Saigon Co.opMart
Southern Rubber Industry Co
Saigon Passenger Railway Transportation Co.
THALEXIM
NHABECO
INCOMBANK
DIC
NAVICO
PVGAS
VOSCO
SAA
BAPACO
U N I L E V E R VIETNAM
P E T R O L I M E X HANOI
INTIMEX
T.CTEX
VITRANSCHART
CASUMINA

Appendices
78
79
80
81
82
83
84
85
86
87
88
89
90
91
92
93
94
95
96
97
98
99
100
101
102
103
104
105
Kinh Do JSC
Civil Engineering Construction Corp. No.1
Tan Mai Paper Co.
Cai Lan Oil and Fats Industries Co Ltd
Bao Minh Co
Ut Xi Aquatic Products Processing Co. Ltd.
Ha Bac Nitrogen Fertilizers and Chemical Co
Can Tho Agricultural and Animal Products Company
Northern Airports Authority
Cao Son Coal Co.
Binh Duong Trading Investment and Development Corporation
Saigon Port
Ha Tu Coal Co.
Vietnam Glass and Ceramics for Construction Corp.
Uong Bi Coal Co.
Hanoi General Production and Import-Export Company
Ha Tien Cement Co No.1
Machino Auto Parts Co Ltd
Vietnam Air Petrol Co
Phu Yen Material Company
Petrovietnam Fertilizer and Chemicals Co.
Seaprodex Danang Co
Vissan Import Export Corporation
Phy My Hung Joint Venture Co.
Thai Binh Co Ltd.
Can Tho Sea Product Processing Export Enterprise
Saigon Post and Telecommunication JSC
Saigon Agriculture Corporation
KIDOCO
CIENCO 1
CALOFIC
BAO MINH
HANICHEMCO
CATACO
NAA
BECAMEX IDC
CSG
VIGLACERA
HAPROSIMEX
MAP
VINAPCO
PYGEMACO
PVFCCo
S E A P R O D E X DANANG
VISSAN
SPT

Appendices
106
107
108
109
110
111
112
113
114
115
116
117
118
119
120
121
122
123
124
125
126
127
128
129
130
131
132
133
Hai Phong Port
Vang Danh Coal Co.
Nui Beo Coal Co.
Technological and Commercial Joint Stock Bank
Holcim Vietnam Ltd.
Sumi-Hanel Electronics Co.
Dutch Lady Vietnam
Vietnam Export Import Commercial Joint Stock Bank
Industrial Explosive Material Company
Construction Company No. 4
Eastern Asia Commercial Bank
Proconco Producing Animal Feeds JVC
Coc 6 Coal Co.
But Son Cement Co
Company No. 28
Ha Tien Cement Co No.2
Southern Fertilizers Co
Ha Long Coal Co.
Binh Duong Production and Import Export Co.
Nam Dinh Textile Co
Ca Mau Frozen Seafood Processing Import Export Corp.
Hanoi Trade Corporation
Hoang Mai Cement Co
Saigon Transportation Mechanical Corporation
Northern Foodstuff Co
An Giang Agriculture and Foods Import Export Co.
Toyota Vietnam
Vietnam Northern Food Corporation
TECHCOMBANK
V I E T N A M EXIMBANK
VIMICCO
PROCONCO
AGTEX
SFC
PROTRADE
NATEXCO
CAMIMEX
HAPRO
SAMCO
FONEXIM
AFIEXCO
TOYOTA VIETNAM
VINAFOOD 1

Appendices
134
135
136
137
138
139
140
141
142
143
144
145
146
147
148
149
150
151
152
153
154
155
156
157
158
159
160
Minh Quy Aquatic Products Processing Co Ltd.
Mao Khe Coal Co.
Tin Nghia Import Export Co
Vietnam International Bank
Hoang Gia Cat Tuong Co. Ltd
Vietnam Construction and Import Export Corporation
Vietnam Apatite Company
Phuong Nam Joint Stock Commercial Bank
Thang Loi Textile and Garment Co
Phu Nhuan Jewelry Joint Stock Company
Ninh Thuan Agricultural Products Export Co.
Dong Nai Agricultural Products and Food Processing Import Export Co
Deo Nai Coal Co.
Petec Trading and Investment Corporation
Vietnam Industrial Construction Corporation
Thanh An Corporation
Electrical Mechanical Appliances and Technology Development Company Co
Viet Thang Textile Co.
Aquatic Food Trading Company
Water Electrical Mechanical Installation and Construction Joint Stock Co
Lam Son Sugar JSC
Minh Phu Seafood Import Export Co.
Cai Doi Vam Import Export Company
Hanoi Beer Alcohol and Beverage Corporation
Binh Tien Consumer Goods Production Co. Ltd.
Danang Rubber Co
Loc Ninh Rubber Co.
TIMEX CO
VIBank
VINACONEX
VINAAPCO
VITEXIM
DONAFOODS
PETEC
VINAINCON
GELIMEX
VICOTEX
APT CO
COWAELMIC
LASUCO
CADOVIMEX
HABECO
BITIS
DRC

Appendices
161
162
163
164
165
166
167
168
169
170
171
172
173
174
175
176
177
178
179
180
181
182
183
184
185
186
187
188
Southern Airport Services Co
Hanoi Clean Water Company
Saigon Petro Co
Dong Phu Rubber Co.
Thang Long Metal Ltd.
HCMC Urban Environment Co
Chinfon Haiphong Cement Co.
1-5 Automobile Mechanics Co.
Pha Rung Shipyard
Dak Lak Rubber Co.
Ba Ria Rubber Co.
Saigon Culture Company
Vietnam Automobile Component Manufacturing Company
Power Construction Engineering Company No. 1
Sao Vang Rubber Co
Power Engineering Consulting Company No. 1
Ba Ria - Vung Tau Post and Telecommunications
Vietnam Food Production Company
Duong Huy Coal Co.
Dong Thap Import Export Trading Co
Vietnam National Tea Corporation
Hai Phong Cement Co
Vietnam Electric Wire and Cable Corporation
Production Service Import Export Co.
Viet Foods Co Ltd
Seafood Import Export JSC
Nha Trang Textile Co.
Housing and Urban Development Corporation
SASCO
SAIGON PETRO
CHC
DAKRUCO
BRC
VAP
PCC1
SRC
VIFON
DOCIMEXCO
VINATEA
CADIVI
VIET FOODS
NHATEXCO
HUD

Appendices
189
190
191
192
193
194
195
196
197
198
199
200
Song Da Co. No. 9
Vietnam National Shipping Lines
Song Da Co. No. 10
Garment Company No. 10
Construction and Investment Development Co
Vietnam National Textile and Garment Corporation
Ben Thanh Tobacco Co
Civil Engineering Construction Co. No.568
Hon Gai Coal Selecting Co.
Communication and Transportation Construction Company
Hoa Phat Steel JSC
Vietnam Joint Stock Commercial Bank for Private Enterprises
VINALINES
GARCO 10
INVESCO
VINATEX
VPBank

Appendices
Appendix 3: Interview Schedule
Company
I. Questionnaire and InterviewHonda Vietnam Co LtdToyota VietnamLam Thao Fertilizers and Chemicals CoHanoi General Production and Import Export CompanyMachino Auto Parts Co LtdVietnam Chemical CorporationLam Son Sugar CoVietnam Coal and Mineral Industries GroupVietnam National Tea CorporationVietnam Apatite CompanyVietnam Automobile Component Manufacturing CoVietnam Paper CorporationRang Dong Light Source and Vacuum Flask CoThe Corporation for Financing and Promoting TechnologyVietnam National Shipping LinesVietnam Post and Telecommunications GroupVietnam Oil and Gas GroupVietnam Glass and Ceramics for Construction CorporationVietnam Shipbuilding Industry GroupVan Dien Fused Magnesium Phosphate CoThang Long Metal LtdVietnam Sea Transport and Chartering CoViet Tien Garment CorporationBinh Dien Fertilizer CoVietnam Electric Wire and Cable Corporation
Coastal Fisheries Development Co
Questionnaire
XXXXXXXXXXXXXXXXXXXXXXXXX
X
D a t e Interviewed
5-Dec-065-Dec-066-Dec-067-Dec-067-Dec-0615-Dec-063-Jan-074-Jan-074-Jan-075-Jan-077-Jan-078-Jan-078-Jan-079-Jan-079-Jan-0710-Jan-0711-Jan-0711-Jan-0712-Jan-0712-Jan-0715-Jan-0716-Jan-0718-Jan-0722-Jan-0722-Jan-07
24-Jan-07

Appendices
Southern Rubber Industry CoPetrovietnam Fertilizer and Chemicals CoDong Nai Rubber CoTan Mai Paper CoChi Hung Joint Venture CoBinh Duong Production and Import Export CoNha Trang Seafood CoNinh Thuan Agricultural Export CoDak Lak Rubber CoHyundai Vinashin Shipyard Co LtdCho Lon Investment and Import Export CorporationFuvi Mechanical Technology CoSouthern Fertilizers CoNha Be Garment CoVietnam Rubber GroupBa Ria Rubber CoPetrovietnam Gas CompanyPhong Phu Textile CorporationSao Ta Food CoUt Xi Aquatic Products Processing Co LtdMinh Phu Seafood Import Export CoCan Tho Agricultural and Animal Products CompanyViet Foods Co LtdQuang Ngai Sugar CorporationDanang Rubber CoSeaprodex Danang Co Nam Trieu Shipbuilding CompanyVietnam Ocean Shipping CoBach Dang ShipyardHa Long Shipyard
Dong Bac Coal Corporation
XXXXXXXXXXXXXXXXXXXXXXXXXXXXXX
X
24-Jan-0725-Jan-0726-Jan-0726-Jan-0729-Jan-0730-Jan-071-Feb-07 1-Feb-072-Feb-072-Feb-073-Feb-075-Feb-076-Feb-076-Feb-077-Feb-078-Feb-079-Feb-0723-Feb-075-Mar-075-Mar-076-Mar-077-Mar-077-Mar-078-Mar-079-Mar-079-Mar-0712-Mar-0712-Mar-0713-Mar-0714-Mar-07
14-Mar-07

Appendices
Industrial Explosive Material CompanyVietnam National Petroleum CorporationSao Vang Rubber CoElectricity of VietnamPetroleum Technical Services Company Electrical Equipment Manufacturing Co1-5 Automobile Mechanics CoGarment Company No.10Company No.28Mercedes Benz Vietnam LtdAn Phu CorporationSouthern Basic Chemicals CoVietsovpetroII. Interview OnlyVietnam Cement AssociationVietnam Steel AssociationVietnam Fertilizer AssociationVietnam Textile and Apparel AssociationVietnam Textile and Garment GroupVietnam Rubber AssociationBinh Long Rubber CoDau Tieng Rubber CorporationHoang Gia Cat Tuong Co Ltd Cat Thai Plastic CoCai Doi Vam Import Export CompanyCai Lan Oil and Fats Industries Co LtdLilama CorporationMilitary Telecom CorporationVietnam Northern Food CorporationMarch 8 Textile Co
Hanoi Textile and Garment Co
XXXXXXXXXXXXX
21-Mar-0723-Mar-0726-Mar-0727-Mar-0728-Mar-0730-Mar-0731-Mar-0731-Mar-072-Apr-074-Apr-075-Apr-079-Apr-0717-May-07
26-Oct-0626-Oct-0627-Oct-0610-Dec-069-Jan-0717-Jan-0730-Jan-0730-Jan-0731-Jan-075-Feb-076-Mar-0713-Mar-0716-Mar-0722-Mar-0727-Mar-0729-Mar-07
29-Mar-07

Appendices
Binh Tien Consumer Goods Production Co LtdVietnam Dairy Products CoVietnam Engine and Agricultural Machinery CorporationIII. Questionnaire OnlyAn Giang Agriculture and Foods Import Export Co.Anvifish Co LtdBridge Construction Company No.12Cao Son Coal CoChinfon Haiphong Cement CoCivil Engineering Construction Corporation No.1Coc 6 Coal CoConstruction and Investment Company No.18Construction and Production Material CoGeneral Production Investment Service Import Export CoHa Long Coal CoHa Tu Coal CoHanoi Clean Water CompanyHanoi Post and TelecommunicationsHoang Thach Cement CoHon Gai Coal CoHon Gai Coal Selecting CoMao Khe Coal CoNorthern Airports AuthorityNorthern Foodstuff CoNui Beo Coal CoPetrolimex B12Petrolimex Region 1Power Construction Engineering Company No.1Proconco Producing Animal Feeds CoSaigon Newport Co
Song Da Company No.10
XXXXXXXXXXXXXXXXXXX
XXXXXXX
X
2-Apr-0710-Apr-0716-May-07

Appendices
Thua Thien Hue Construction CorporationUong Bi Coal CoVang Danh Coal CoVietnam Construction and Import Export CorporationVietnam Construction Investment Import and Export Holding Corp.Vietnam Food Production Company
Vietnam Railway Corporation
XXXX
XX
X

Appendix 4: Firm Questionnaire
UNDP
Questionnaire for Largest Firms in Vietnam
Date: ____________________
Note: This questionnaire is intended for several types of firms and not all questions may be applicable.
Please list values in Vietnam dong
Company Name (English): _________________________________________________ Company Name (Vietnamese): ______________________________________________
Website address: _________________________________________________________
Section 1: General Information
1. When was the firm founded (Year)? _______________________________________2. Current Legal Operating Structure: ________________________________________
3. Division of Ownership:
Owner Percent
1.)
2.)
3.)
4.)
5.)
4. If an SOE please indicate whether: a public utility _____, or a business SOE ______Also please indicate supervising agency ____________________________________
5. Is the firm classified as operating in a state sector (either 100% or 50% or more statecapital) according to Decision 155/QD-TTg of 2004? Yes ___, No ___

6. Please list the firm’s major activities and record the total values for 2003, 2004 and 2005:
Activity 2003 2004 2005
Primary activity: _____________________
Secondary activity: ___________________
Other: _____________________________
* Rank the firm’s activities by total value added. If this is not possible rank according to the value of operations. If both are impossible rank according to net turnover.
7. If the firm’s Primary Activity* is product-diversified please complete the following in
percent for the products which contributed most by value to the Primary Activity in 2005 (if not product-diversified, please complete for Primary Activity as Product 1):
Export Sales Sales to Domestic Customers Percent
of Primary Activity
Trading Agent
Business to
Business FIE SOE Private Other Related
Firm*
Product 1: __________ Product 2: __________ Product 3: __________ Product 4: __________ Product 5: __________
* Subsidiary, affiliate, joint venture, parent company, partner firm, etc.
8. Indicate which of the following are major suppliers of raw materials for your primary product or service and provide percentage of total inputs (Please tick box):
Supplier Major Supplier
Percent total inputs Yes No
SOEs
Domestic private
Joint-ventures
FIEs
Imported directly by firm

9. Indicate which of the following are major suppliers of intermediate inputs for your primary product or service and provide percentage of total inputs (Please tick box):
Supplier Major Supplier
Percent total inputs Yes No
SOEs
Domestic private
Joint-ventures
FIEs
Imported directly by firm
10. Please complete the following table:
Domestic Market Share (percent)
Share of Vietnam Exports (percent)
Primary Activity
of which:
Product 1
Product 2
Product 3
Product 4
Product 5
Secondary Activity
11. Indicate which of the following are your major competitors for your primary activity
and rank their importance (1 – Most Important, 5 – Least Important):
Competitor Major Competitor
Rank Yes No
SOEs
Domestic private
Joint-ventures
FIEs
Imports

12. Please indicate the numbers of staff in the following categories:
Category Male Female Total
Board of Management
Board of Directors
Line Managers
Workers (non-management) with science based university degrees (e.g. Engineer)
Workers (non-management) with non-science based university degrees.
Skilled non-graduate workers (with relevant experience or qualifications)
Unskilled workers
Administrative Staff
Other
Total

Section 2: History of Firm Year Event* Reason
*Please include: Major investments by value (production facilities, capital assets); Change in Senior Management; Organizational expansion (acquisition, subsidiary, joint-venture, domestic branch office, overseas office); Expansion into new markets; Changes

in ownership; New or improved product or service; Financial changes: change in source of credit.

Section 3: Strategy and Planning 1. Is your strategy set out in a business plan which is available as a document?
Yes ___, No ___
2. Is the business plan: a. Available to the public? ____
b. Available to investors only? ____ c. For internal use only? ____
3. How does the business plan reflect the industry development plan? Mostly___ Partially____ Not at all_____ No Industry Plan _____
4. If a member company, how does your business plan relate to the corporation business plan if one exists?
Mostly ___ Partially ____ Not at all ____ No GC plan _____ 5. What are the key performance indicators in your strategy/ business plan? __________
_____________________________________________________________________ 6. Please indicate if any of the following are planned or anticipated in the next five years
and indicate the reason:
Planned Reason Yes No Reorganize
existing production processes
Expand existing production processes
Develop new production processes
Other (Please Detail)
Create subsidiaries
Create affiliates
JV with FIE
JV with VN firm
New Production Facility
Other (Please detail)

Section 4: Capital Equipment 1. When was the majority of your capital equipment made (Please tick box)?
1960s 1970s 1980s 1990s 2000s
Primary Activity
Secondary Activity
2. If capital equipment has been replaced in the last five years please indicate how
quality, output and costs have been effected (Please tick box):
Activity Effects
Same Quality
Increase Quality
Same Output
Increase Output
Same Costs
Reduce Costs
Replaced existing equipment to produce same product or service
Supplemented existing equipment to undertake same product or service
Replaced existing equipment to produce new product or service
Produce new product or service alongside existing product or services

3. If capital equipment will be replaced in the next five years please indicate how quality, output and costs will be effected (Please tick box):
Activity Effects
Same Quality
Increase Quality
Same Output
Increase Output
Same Costs
Reduce Costs
Replace existing equipment to produce same product or service
Supplement existing equipment to undertake same product or service
Replace existing equipment to produce new product or service
Produce new product or service alongside existing product or services
4. Are there incentives to buy capital equipment domestically? Yes ___, No ___
5. Please assess the quality of your main product or service in relation to (Please tick box):
Inferior Equal Superior Don't Know
Vietnamese competitors
State
Domestic Private
Foreign competitors
Imports
FIEs in Vietnam
Competitors in export markets

6. Please assess the price of your main product or service in relation to: (Please tick
box)
Lower Equal Higher Don't Know
Vietnamese competitors
State
Domestic Private
Foreign competitors
Imports
FIEs in Vietnam
Competitors in export markets
7. Indicate which of the following was/ will be associated with purchase of equipment:
a. Reduction/ Increase* of unskilled staff.
b. Reduction/ Increase* of staff with science degree. c. Reduction/ Increase* in skilled staff.
d. No Change _____ *Please delete as appropriate
8. Rate the degree to which each of the following factors affect the acquisition of capital equipment (1 – Very Important, 5 – Not Important):
Factors Importance
1 2 3 4 5
Difficulties finding suitable equipment/ technology
Difficulties licensing suitable technology from foreign firms
Lack of capital
Staff lack skills required to absorb technology into existing business and production processes
Obstacles to laying off workers
Acquiring necessary government approval

Section 5: Innovation (improvements to existing processes, or actions undertaken to incorporate new equipment or processes) 1. Please indicate whether the firm has improved or will improve production processes
and/ or business processes in the last five years/ next five years in response to the following factors (Please tick box):
Last 5 Years Next 5 Years
N/A
* No
Yes
N/A*
No
Yes
Competitive pressure from Vietnamese private firms
Competitive pressure from Vietnamese SOEs
Competitive pressure from FIEs
Competitive pressure from imports
To match quality of competitors in export markets
Quality regulations in new export markets
To meet quality requirements of foreign partner
New government regulation
Government sectoral strategy and development policies
* Not Applicable

2. Please indicate importance of the following when improving production processes,
business processes and product (1-Very Important, 5-Not Important):
Method Importance
1 2 3 4 5
Internal R&D department
Suggestions from workers and managers
Cooperation with domestic R&D institutions
Reverse engineering
Buy technology from domestic sources
Buy technology from foreign sources
Joint venture with domestic enterprises
Joint venture with foreign enterprises
Hiring domestic consultants
Hiring foreign consultants
Domestic training
Training/ study tour abroad
3. Please indicate significance of the following obstacles to desired process
improvements (1 - Very Significant, 5 – Not Significant):
Method Significance
1 2 3 4 5
Lack of capital
Lack of skilled technical staff
Lack of access to technology
Lack of technical knowledge.
Other _______________________

4. Please rank the following activities in order of priority (1 – Most Important, 8 – Least Important) in the last five years and the next five years:
Activities
Last Five Years Next Five Years
Primary
Activity
Secondary Activity
Primary
Activity
Secondary Activity
Product improvement
Improvement of production process
New production facilities
New product models
Upgrade existing production facilities
Increase market share in existing markets
Enter new foreign market
Others

Section 6: Labour 1. Please indicate the length of time staff have been with the firm, and if staff joined the
firm within the last three years please indicate from where they were recruited:
Category
Length of time with firm (Percent of each category)
If recruited within last 3 years recruited from (Percentage of each category):
Over 10 Years
10-5 Years
3-5 Years
Domestic Private
firm
Domestic SOE FIE Gov
Institution
Direct from
University
Board of Management
Board of Directors
Line Managers
Workers (non-management) with science based university degrees (e.g. Engineer)
Workers (non-management) with non-science based university degrees.
Skilled non-graduate workers (with relevant experience or qualifications)
Unskilled workers
Administrative Staff

2. Please complete the following table for members of the Board of Management:
Number
Are full time members?
Has a university degree from a Western University?
Has a university degree from a non-Western (Soviet Bloc, China) University?
Has a science-based university degree?
Has a Vietnamese university degree or equivalent?
Has an MBA from a foreign business school?
Has an MBA from a VN business school?
Has experience working in an FIE?
Has experience working abroad?
Can communicate directly with foreign counterparts in English?
3. Please complete the following table for Board of Directors:
Number
Are full time members?
Has a university degree from a Western University?
Has a university degree from a non-Western (Soviet Bloc, China) University?
Has a science-based university degree?
Has a Vietnamese university degree or equivalent?
Has an MBA from a foreign business school?
Has an MBA from a VN business school?
Has experience working in an FIE?
Has experience working abroad?
Can communicate directly with foreign counterparts in English?
4. What percentage of skilled workers with a science degree (graduate or post-graduate):
a. Has experience working in an FIE in the same field_____
b. Was trained in a foreign University______ 5. What proportion of skilled workers:
Other

a. Has experience working in an FIE in the same field_____ b. Was trained in a foreign University______
6. Please complete the following table (Please tick box):
Category
Average wage (percentage of staff in each category)
<2mil VND
2-5mil VND
5-10mil VND
>10mil VND
Board of Management
Management (e.g. Directors)
Workers (non-management) with science based university degrees (e.g. Engineer)
Workers (non-management) with non-science based university degrees.
Skilled non-graduate workers (with relevant experience or qualifications)
Unskilled workers
Administrative Staff
Other

7. Please record percentage of training budget spent on following categories:
Category In firm Outside of firm in Vietnam
Training courses/ Study Tours in foreign country
Board of Management
Board of Directors
Line Managers
Workers (non-management) with science based university degrees (e.g. Engineer)
Workers (non-management) with non-science based university degrees.
Skilled non-graduate workers (with relevant experience or qualifications)
Unskilled workers
Administrative Staff
Other
8. Please indicate the importance of training for the following (1 – Very important, 5 –
Not important)
1 2 3 4 5
Bring new staff to required level
Raising standard of existing skill sets

Learning to use new equipment
Learning new business processes
Other __________________________
9. Please indicate the availability of the following (Please tick box):
Category Readily Available
Available but expensive Not Available
Board of Management
Board of Directors
Line Managers
Workers (non-management) with science based university degrees (e.g. Engineer)
Workers (non-management) with non-science based university degrees.
Skilled non-graduate workers (with relevant experience or qualifications)
Unskilled workers
Administrative staff
Other

Section 7: Relationship with state institutions 1. Rate state involvement in the following decisions (if member company of a
corporation, please also fill out second column) (Please tick box):
Decision
State Involvement Parent Company Involvement
Very High High Medium Low None Very
High High Medium Low None
Business plan and strategies
Investment
Hiring senior management
Hiring new staff
Firing existing staff
Determining staff wages
Product diversification
Business Diversification
Sourcing raw materials and inputs
Price paid for raw materials and inputs
Importing
Exporting
Determining prices of products

2. Please indicate state involvement in the following activities and if involved, which state institution(s) (Please tick box):
Very High High Medium Low None State institution(s)
Provide brand name
Find business partners
Assist in exporting
Assist in importing
Provide financing
Guarantee firm loans from banks
Provide land
Guarantee buyers of firm output
Assist in acquisition of new technology

3. If a member company of a corporation, please fill out in relation to parent company involvement (Please tick box):
Very High High Medium Low None
Provide brand name
Find business partners
Assist in exporting
Assist in importing
Provide financing
Guarantee firm loans from banks
Provide land
Guarantee buyers of firm output
Assist in acquisition of new technology
4. If an SOE, does the firm have plans to transform into an entity operating under the
Enterprise Law? Yes ___, No ____, Already transformed _____
If yes, what is the anticipated ownership type following transformation?
__________________________________________________________
If yes, is this plan approved? Yes _____, No _____

Section 8: Finances 1. Please complete the following table:
2003 2004 2005
Total Revenues
Total Assets
Turnover from sales, service
of which:
Domestic sales, service
International sales, service
2. How much did the firm remit to the state (taxes, returns to state capital, other) in:
2003 _______________, 2004_______________ and 2005_______________? 3. Did the firm benefit from any tax incentives in (Yes/No):
2003 _______________, 2004_______________ and 2005_______________? 4. If a member company, how much do you remit to the parent company (management
fees, dividends, capital usage fees, other) in: 2003 _______________, 2004_______________ and 2005_______________?
5. If the firm did not pay Corporate Income Tax (CIT) in the following years, please indicate why not:
Year Reason
Made a loss Broke even Tax incentive Other
2003
2004
2005
6. Please complete the following table:
Share of Total Debt (Short and Long should equal 100%) Percent
Short term
% short term debt secured by government
Long term
% long term debt secured by government
7. Is securing a loan easier ____ or more difficult ____ now than five years ago?

8. Please indicate how the importance of the following when securing credit has changed over the last five years (Please tick box):
Never Required Unchanged
Less frequently required
More frequently required
Collateral
Financial statements
Feasibility study
Company audit
9. Please rank the following in order of importance for sourcing funds for capital
investments (1 – Most Important, 11 – Least Important):
Source 5 Years Ago Now In 5 Years
Retained earnings
Central State budget
Local State budget
SOCB loan
JSC bank loan
Foreign bank loan
DAF (VDB)
Sale of assets
Equity offerings
Bonds
Transfer from parent company
10. Please provide the debt/asset ratio for: 1995 ______, 2000 ______, 2005 ______ 11. Please indicate the percentage of state capital in total capital ________
12. If a member company of a corporation, please indicate the percentage of parent company capital in total firm capital ________
13. Does the firm plan to list on the stock market? Yes ___, No ___ If the firm is already listed, please provide the code: _______
14. Do you have investments in other companies? ___________

15. Please complete (percentage not value):
Revenue Source Percentage of total revenues
2003 2004 2005
Sales
Financial investments
Renting, leasing land
Other ______________________
Total (should equal 100%)
16. Please complete (percentage not value):
Expenditures Percentage of total expenditure
2003 2004 2005
Wages
Staff training
Research and development
Marketing
Product distribution
Market research
Raw materials and inputs
Maintenance of equipment
Other _________________
Total (should equal 100%)

Appendix 5: General Corporation Head Office Questionnaire
UNDP
Corporation Questionnaire
Date: _________________ Please list values in Vietnam dong
Definitions: Corporation: all units of the corporation, including: head office, dependent accounting units, independent accounting units Head office: the administrative office and departments of the corporation only
Corporation Name (English): ________________________________________________ Corporation Name (Vietnamese): ____________________________________________
Website address: _________________________________________________________ Section 1: General Information 13. Current Legal Operating Structure of the corporation:
Corporation Type Supervising Agency
GC 90
GC 91
Parent-Subsidiary Model
Economic Group
Other ______________________
14. When was the corporation founded (Year)?
If having been transformed, please indicate the year of transformation?
Does the corporation have plans to transform into an entity operating under the
Enterprise Law?
Yes ___, No ____,
If yes, what is the anticipated transformation year?

If yes, what is the anticipated transformation model?
Parent-children company ________________economic group________________
15. Did the head office exist prior to becoming the head office of the corporation?
Yes ___ No ___, If yes, was it a: SOE ___, Government Agency ___, Other ___ If yes, please provide the name of the former organization: _____________________
16. Which enterprises were the founding members of the corporation?
Enterprise Name
1.)
2.)
3.)
4.)
5.)
17. Is the corporation classified as operating in a state sector according to Decision
155/QD-TTg of 2004? Yes ___, No ___
18. Please list the corporation’s major activities and record total value: (million VND)
Activity 2003 2004 2005
Primary activity: _____________________
Secondary activity: ___________________
Other: _____________________________
* Rank the firm’s activities by total value added. If this is not possible rank according to the value of operations. If both are impossible rank according to net turnover.

19. If the corporation’s Primary Activity is product-diversified please complete the
following in percent for the products which contributed most by value to the Primary Activity in 2005 (if not product-diversified, please complete for Primary Activity as Product 1):
Export Sales Sales to Domestic Customers Percent
of Primary Activity
Trading Agent
Business to
Business FIE SOE Private Other
Product 1: __________ Product 2: __________ Product 3: __________ Product 4: __________ Product 5: __________ 20. If the corporation’s Secondary Activity is product-diversified please complete the
following in percent for the products which contributed most by value to the Secondary Activity in 2005 (if not product-diversified, complete for Secondary Activity as Product 1):
Export Sales Sales to Domestic Customers
Percent of Secondary
Activity
Trading Agent
Business to
Business FIE SOE Private Other
Product 1: __________ Product 2: __________ Product 3: __________ Product 4: __________ Product 5: __________

21. Please complete the following table for the corporation:
Domestic Market Share (percent)
Share of Vietnam Exports (percent)
Primary Activity
of which:
Product 1
Product 2
Product 3
Product 4
Product 5
Domestic Market Share (percent)
Share of Vietnam Exports (percent)
Secondary Activity
of which:
Product 1
Product 2
Product 3
Product 4
Product 5
22. Indicate which of the following are your major competitors for your corporation’s
Primary Activity and rank their importance (1 – Most Important, 5 – Least Important):
Competitor Major Competitor
Rank Yes No
Other state corporations
Domestic private
Joint-ventures

FIEs
Imports
23. Please indicate the numbers of head office staff in the following categories:
Category Male Female Total
Board of Management
Board of Directors
Line Managers
Workers (non-management) with science based university degrees (e.g. Engineer)
Workers (non-management) with non-science based university degrees.
Skilled non-graduate workers (with relevant experience or qualifications)
Unskilled workers
Administrative Staff
Other
Total
24. Please indicate the numbers of corporation staff in the following categories:
Category Male Female Total
Board of Management
Board of Directors
Line Managers
Workers (non-management) with science based university degrees (e.g. Engineer)
Workers (non-management) with non-science based university degrees.
Skilled non-graduate workers (with relevant experience or qualifications)
Unskilled workers
Administrative Staff
Other

Total

Section 2: History of Corporation Year Event* Reason
*Please include: Major investments by value (production facilities, capital assets); Change in Senior Management; Organizational expansion (acquisition, subsidiary, joint-venture, domestic branch office, overseas office); Expansion into new markets; Changes

in ownership; New or improved product or service; Financial changes: change in source of credit.

Section 3: Strategy and Planning 7. Is your strategy set out in a business plan which is available as a document?
Yes ___, No ___
8. Is the business plan: a. Available to the public? ____
b. Available to investors only? ____ c. For internal use only? ____
9. How does the business plan reflect the industry development plan? Mostly___ Partially____ Not at all_____ No Industry Plan _____
10. Does the business plan include subsidiaries and joint venture member companies of the corporation? Yes ___ No ____
11. What are the key performance indicators in your strategy/ business plan? __________ _____________________________________________________________________
12. Please indicate if any of the following are planned or anticipated by the corporation in the next five years and indicate the reason:
Planned Reason Yes No Reorganize
existing production processes
Expand existing production processes
Develop new production processes
Other (Please Detail)
Create subsidiaries
Create affiliates
JV with FIE
JV with VN firm
New Production Facility
Other (Please detail)

Section 4: Capital Equipment (please answer all questions in this section for the corporation) 9. Are there incentives for the corporation to buy capital equipment domestically?
Yes ___, No ___ 10. Please assess the quality of the corporation’s main product or service in relation to
(Please tick box):
Inferior Equal Superior Don't Know
Vietnamese competitors
State
Domestic Private
Foreign competitors
Imports
FIEs in Vietnam
Competitors in export markets
11. Please assess the price of the corporation’s main product or service in relation to
(Please tick box):
Lower Equal Higher Don't Know
Vietnamese competitors
State
Domestic Private
Foreign competitors
Imports
FIEs in Vietnam
Competitors in export markets

Section 5: Innovation (improvements to existing processes, or actions undertaken to incorporate new equipment or processes) 5. Please indicate whether the corporation has improved or will improve production
processes and/ or business processes in the last five years/ next five years in response to the following factors (Please tick box):
Last 5 Years Next 5 Years
N/A* No Yes N/A* No Yes
Competitive pressure from Vietnamese private firms
Competitive pressure from Vietnamese state corporations
Competitive pressure from FIEs
Competitive pressure from imports
To match quality of competitors in export markets
Quality regulations in new export markets
To meet quality requirements of foreign partner
New government regulation
Government sectoral strategy and development policies
* Not Applicable

6. Please indicate importance of the following when improving production processes, business processes and products of the corporation (1-Very Important, 5-Not Important):
Method Importance
1 2 3 4 5
Internal R&D department
Suggestions from workers and managers
Cooperation with domestic R&D institutions
Reverse engineering
Buy technology from domestic sources
Buy technology from foreign sources
Joint venture with domestic enterprises
Joint venture with foreign enterprises
Hiring domestic consultants
Hiring foreign consultants
Domestic training
Training/ study tour abroad
7. Please rank the following activities in order of priority for the corporation (1 – Most
Important, 8 – Least Important) in the last five years and the next five years:
Activities Last Five Years Next Five Years
Primary Activity
Secondary Activity
Primary Activity
Secondary Activity
Product improvement
Improvement of production process
New production facilities
New product models
Upgrade existing production facilities
Increase market share in existing markets
Enter new foreign market
Others

Section 6: Labour (please complete all questions in this section for the head office) 10. Please indicate the percentage of staff who have the following length of time with the
head office, and please indicate the percentage of staff who joined the firm within the last three years and their previous employment with the following institutions (%):
Category
Length of time with firm (Percent of each category)
If recruited within last 3 years recruited from (Percent of each category):
Over 10
Years
10-5 Years
3-5 Years
Member company SOE
Domestic Private
firm FIE Gov
Institution
Direct from
University
Board of Management
Board of Directors
Line Managers
Workers (non-management) with science based university degrees (e.g. Engineer)
Workers (non-management) with non-science based university degrees.
Skilled non-graduate workers (with relevant experience or qualifications)
Unskilled workers
Administrative Staff
Other

11. Please complete the following table for members of the Board of Management of the
head office:
Number
Are full time members?
Has a university degree from a Western University?
Has a university degree from a non-Western (Soviet Bloc, China) University?
Has a science-based university degree?
Has a Vietnamese university degree or equivalent?
Has an MBA from a foreign business school?
Has an MBA from a VN business school?
Has experience working in an FIE?
Has experience working abroad?
Can communicate directly with foreign counterparts in English?
12. Please complete the following table for managers (e.g. Directors) of the head office:
Number
Has a university degree from a Western University?
Has a university degree from a non-Western (Soviet Bloc, China) University?
Has a science-based university degree?
Has a Vietnamese university degree or equivalent?
Has an MBA from a foreign business school?
Has an MBA from a VN business school?
Has experience working in an FIE?
Has experience working abroad?
Can communicate directly with foreign counterparts in English?
13. What percentage of skilled workers of the head office with a science degree (graduate
or post-graduate):
c. Has experience working in an FIE in the same field_____ d. Was trained in a foreign University______

14. Please complete the following table for the head office (Please tick box):
Category
Average wage (percentage of staff in each category)
<2mil VND
2-5mil VND
5-10mil VND
>10mil VND
Board of Management
Board of Directors
Line Managers
Workers (non-management) with science based university degrees (e.g. Engineer)
Workers (non-management) with non-science based university degrees.
Skilled non-graduate workers (with relevant experience or qualifications)
Unskilled workers
Administrative staff
Other

15. Please record percentage of training budget for the head office spent on following
categories:
Category In firm Outside of firm in Vietnam
Training courses/ Study Tours in foreign country
Board of Management
Board of Directors
Line Managers
Workers (non-management) with science based university degrees (e.g. Engineer)
Workers (non-management) with non-science based university degrees.
Skilled non-graduate workers (with relevant experience or qualifications)
Unskilled workers
Administrative staff
Other
16. Please indicate the importance of training for the following (1 – Very important, 5 –
Not important)
1 2 3 4 5
Bring new staff to required level
Raising standard of existing skill sets

Learning to use new equipment
Learning new business processes
Other __________________________
17. Please indicate the availability of the following for the head office (Please tick box):
Category Readily Available
Available but expensive Not Available
Board of Directors
Line Managers
Workers (non-management) with science based university degrees (e.g. Engineer)
Workers (non-management) with non-science based university degrees.
Skilled non-graduate workers (with relevant experience or qualifications)
Unskilled workers
Administrative Staff
Other

Section 7: Relationship between state institutions and the corporation, and the head office and independent accounting member companies 5. Rate state involvement in the following corporation decisions (Please tick box):
Decision
State Involvement
Very High High Medium Low None
Business plan and strategies
Investment
Hiring senior management
Hiring new staff
Firing existing staff
Determining staff wages
Product diversification
Business Diversification
Sourcing raw materials and inputs
Price paid for raw materials and inputs
Importing
Exporting
Determining prices of products

6. Please indicate state involvement in the following corporation activities and if
involved, which state institution(s) (Please tick box):
Very High High Medium Low None State institution(s)
Provide brand name
Find business partners
Assist in exporting
Assist in importing
Provide financing
Guarantee firm loans from banks
Provide land
Guarantee buyers of firm output
Assist in acquisition of new technology

7. Rate head office involvement in the following independent accounting member
company decisions (Please tick box):
Decision
Head Office Involvement
Very High High Medium Low None
Business plan and strategies
Investment
Hiring senior management
Hiring new staff
Firing existing staff
Determining staff wages
Product diversification
Business Diversification
Sourcing raw materials and inputs
Price paid for raw materials and inputs
Importing
Exporting
Determining prices of products

8. Please indicate head office involvement in the following independent accounting
member company activities (Please tick box):
Very High High Medium Low None
Provide brand name
Find business partners
Assist in exporting
Assist in importing
Provide financing
Guarantee firm loans from banks
Provide land
Guarantee buyers of firm output
Assist in acquisition of new technology

Section 8: Finances 1. Does the corporation maintain consolidated accounts for the entire corporation?
Yes ___ No ___
2. Does the corporation have a financial member company(s)? Yes __ No ___ 3. Please complete the following table for the head office and dependent accounting
units: (million VND)
2003 2004 2005
Total Revenues
Total Assets
Turnover from sales, service
of which:
Domestic sales, service
International sales, service
4. Please complete the following table for the corporation: (million VND)
2003 2004 2005
Total Revenues
Total Assets
Turnover from sales, service
of which:
Domestic sales, service
International sales, service
5. How much did the head office and dependent accounting units remit to the state
(taxes, returns to state capital, other) in: (million VND) 2003 _______________, 2004_______________ and 2005 ______________?
6. How much did the corporation remit to the state (taxes, returns to state capital, other) in:
2003 _______________, 2004_______________ and 2005 ______________? 7. Did the corporation benefit from any tax incentives in (Yes/No):
2003 _______________, 2004_______________ and 2005_______________?

8. If the head office and dependent accounting units did not pay Corporate Income Tax (CIT) in the following years, please indicate why not:
Year Reason
Made a loss Broke even Tax incentive Other
2003
2004
2005
9. Please complete the following table for the corporation:
Share of Total Debt (Short and Long should equal 100%) Percent
Short term
% short term debt secured by government
Long term
% long term debt secured by government
10. Is securing a loan easier ____ or more difficult ____ now than five years ago?
11. Please indicate for the corporation how the importance of the following when securing credit has changed over the last five years (Please tick box):
Never Required Unchanged
Less frequently required
More frequently required
Collateral
Financial statements
Feasibility study
Company audit

12. Please rank the following in order of importance for sourcing funds for capital investments for the corporation (1 – Most Important, 11 – Least Important):
Source 5 Years Ago Now In 5 Years
Retained earnings
Central State budget
Local State budget
SOCB loan
JSC bank loan
Foreign bank loan
DAF (VDB)
Sale of assets
Equity offerings
Bonds
Transfers from member companies
13. Please provide corporation debt/asset ratio for: 1995 ____, 2000 ____, 2005 ____ 14. Please indicate the percentage of state capital in the total capital of the corporation
________ 15. Does the corporation plan to list on the stock market? Yes ___, No ___
If the firm is already listed, please provide the code: _______ a. If not plan to list, why not?
16. Does the head office have investments in other companies outside of the corporation? Yes ___ No ___
17. Please complete for the head office and dependent accounting units:
Revenue Source Percentage of total revenues
2003 2004 2005
Sales
Remittances from members
Other financial investments
Renting, leasing land
Other ______________________
Total (should equal 100%)

18. Please complete for the corporation:
Revenue Source Percentage of total revenues
2003 2004 2005
Sales
Contribution from members
Financial investments
Renting, leasing land
Other ______________________
Total (should equal 100%)
19. Please complete for the head office and dependent accounting units:
Expenditures Percentage of total expenditure
2003 2004 2005
Wages
Staff training
Research and development
Marketing
Product distribution
Market research
Other _________________
Total (should equal 100%)

Appendices
Appendix 6: Flow of Funds Worksheets

1999% of GDP Cen Gov (K1) RoW (K2) Mon Auth (K3) Dep Money 'banks flow' (K4) Private Sector (K6,K7) Disc Sources (K5) Total
U S U S U S U S U S U S12 Gross Capital Formation 6.7% 21.0% 27.6%34 Gross Saving 5.9% 0.0% 25.9% 31.7%56 Surplus/ Deficit -0.8% -4.1% 4.9% 0.0%789 Ch Foreign claims, net 7.3% 4.7% 2.8% 7.8% 7.5% 15.1%
1011 Ch Foreign Assets 7.2% 4.7% 2.8% 12.2% 7.5% 19.4%12 Ch Foreign Liabilities -0.1% 0.0% 0.0% 0.0% -4.5% -0.1% -4.4%1314 Ch Interbank Claims 0.4% -0.1% -0.3% -0.1% 0.0%1516 Ch Mon auth credit to DMB 0.9% 1.8% -0.3% 0.9% 1.5%17 Ch Bank Reserves 1.3% 1.7% 0.0% 1.7% 1.3%1819 Ch Central gov debt -0.2% -1.5% 0.6% 0.1% -0.3% 2.2% -0.5%2021 Ch Claims on cen gov -0.2% -0.2% 0.5% 0.1% 3.4% 0.4% 3.2%22 Ch Cen gov deposits -1.0% 1.4% -0.3% -3.7%2324 Ch Private credit, net 1.8% 6.4% 0.0% 10.0% 18.2% 18.2% 18.2%2526 Ch Claims on nonbank FI 0.0% 0.0%27 Ch Other private credit 1.8% 6.4% 0.0% 10.0% 0.0% 0.0% 18.2% 18.2% 18.2%2829 Ch Money and quasi money 3.6% 10.9% 14.5% 14.5% 14.5%3031 Ch Curr and demand deposits 3.6% 2.2% 5.8% 5.8% 5.8%32 Ch Time, savings dep 8.7% 8.7% 8.7% 8.7%3334 Misc and discrepancy 0.0% -3.2% -0.8% 2.9% 1.7% -7.1% -3.2% -3.2%353637 Total 8.5% 5.7% 6.2% 3.2% 3.1% 3.1% 11.4% 13.9% 35.6% 45.8% 0.0%383940

2000% of GDP Cen Gov (K1) RoW (K2) Mon Auth (K3) Dep Money 'banks flow' (K4) Private Sector (K6,K7) Disc Sources (K5) Total
U S U S U S U S U S U S12 Gross Capital Formation 6.7% 22.9% 29.6%34 Gross Saving 4.0% 0.0% 29.2% 33.2%56 Surplus/ Deficit -2.7% -3.5% 6.3% 0.0%789 Ch Foreign claims, net 7.1% 0.7% 7.0% 14.3% 7.7% 21.3%
1011 Ch Foreign Assets 7.0% 0.7% 7.1% 18.4% 7.8% 25.4%12 Ch Foreign Liabilities -0.1% 0.0% 0.0% 0.1% -4.1% -0.1% -4.0%1314 Ch Interbank Claims -0.1% 0.1% -0.1% 0.1% -0.2%1516 Ch Mon auth credit to DMB 0.9% 0.6% 0.0% 0.9% 0.6%17 Ch Bank Reserves 0.8% 0.8% 0.0% 0.8% 0.8%1819 Ch Central gov debt 0.1% 0.9% -1.7% -1.7% -2.3% 1.2% -2.2%2021 Ch Claims on cen gov 0.1% 0.1% 0.2% -1.7% 2.4% -1.4% 2.5%22 Ch Cen gov deposits -1.3% -0.8% 2.1% -4.6%2324 Ch Private credit, net 2.2% 5.7% 0.0% 9.7% 17.7% 17.7% 17.7%2526 Ch Claims on nonbank FI 0.0% 0.0%27 Ch Other private credit 2.2% 5.7% 0.0% 9.7% 0.0% 0.0% 17.7% 17.7% 17.7%2829 Ch Money and quasi money 2.5% 9.2% 11.7% 11.7% 11.7%3031 Ch Curr and demand deposits 2.5% 2.6% 5.1% 5.1% 5.1%32 Ch Time, savings dep 6.5% 6.5% 6.5% 6.5%3334 Misc and discrepancy 0.0% -2.2% -0.8% 2.7% 7.9% -11.9% -2.2% -2.2%353637 Total 8.9% 4.1% 7.2% 3.5% 1.6% 1.6% 10.3% 11.8% 32.9% 54.7% 0.0%383940

2001% of GDP Cen Gov (K1) RoW (K2) Mon Auth (K3) Dep Money 'banks flow' (K4) Private Sector (K6,K7) Disc Sources (K5)Total
U S U S U S U S U S U S12 Gross Capital Formation 8.4% 22.8% 31.2%34 Gross Saving 5.6% 0.0% 27.7% 33.3%56 Surplus/ Deficit -2.8% -2.1% 4.8% 0.0%789 Ch Foreign claims, net 4.3% 1.0% 3.7% 20.0% 4.7% 24.3%
1011 Ch Foreign Assets 4.5% 1.2% 3.8% 23.8% 5.0% 28.3%12 Ch Foreign Liabilities 0.2% 0.2% 0.0% 0.1% -3.8% 0.2% -3.5%1314 Ch Interbank Claims -1.1% -1.1% 0.0% -1.1% -1.2%1516 Ch Mon auth credit to DMB 0.7% 0.7% 0.0% 0.7% 0.7%17 Ch Bank Reserves -0.4% -0.4% 0.0% -0.4% -0.4%1819 Ch Central gov debt 0.1% 0.8% -0.2% -3.4% -5.2% -0.8% -5.0%2021 Ch Claims on cen gov 0.1% 0.1% 0.4% -3.4% -0.9% -2.8% -0.8%22 Ch Cen gov deposits 0.0% -0.6% 0.7% -4.3%2324 Ch Private credit, net 2.2% 4.8% 0.0% 6.9% 13.9% 13.9% 13.9%2526 Ch Claims on nonbank FI 0.0% 0.0%27 Ch Other private credit 2.2% 4.8% 0.0% 6.9% 0.0% 0.0% 13.9% 13.9% 13.9%2829 Ch Money and quasi money 2.9% 8.3% 11.2% 11.2% 11.2%3031 Ch Curr and demand deposits 2.9% 1.5% 4.5% 4.5% 4.5%32 Ch Time, savings dep 6.7% 6.7% 6.7% 6.7%3334 Misc and discrepancy 0.0% -2.6% 0.0% 2.4% 9.7% -14.7% -2.6% -2.6%353637 Total 10.6% 5.7% 4.2% 2.2% 1.8% 1.8% 9.5% 10.7% 30.6% 51.3% 0.0%383940
2002% of GDP Cen Gov (K1) RoW (K2) Mon Auth (K3) Dep Money 'banks flow' (K4) Private Sector (K6,K7) Disc Sources (K5) Total
U S U S U S U S U S U S12 Gross Capital Formation 8.4% 24.8% 33.2%34 Gross Saving 6.3% 0.0% 25.2% 31.5%56 Surplus/ Deficit -2.1% 1.7% 0.4% 0.0%789 Ch Foreign claims, net -0.5% 1.5% -1.6% 22.2% -0.1% 21.7%
1011 Ch Foreign Assets -0.5% 1.6% -1.6% 25.9% -0.1% 25.3%12 Ch Foreign Liabilities 0.0% 0.1% 0.0% -0.1% -3.7% 0.0% -3.6%1314 Ch Interbank Claims 0.2% 0.0% -0.2% 0.0% 0.0%1516 Ch Mon auth credit to DMB 0.3% 0.3% 0.0% 0.3% 0.3%17 Ch Bank Reserves 0.5% 0.3% -0.2% 0.3% 0.3%1819 Ch Central gov debt 0.5% 0.6% 0.7% -4.0% -5.2% -0.8% -4.7%2021 Ch Claims on cen gov 0.5% 0.5% 0.4% -4.0% -0.7% -3.1% -0.2%22 Ch Cen gov deposits -0.6% -0.1% 0.7% -4.5%2324 Ch Private credit, net 2.4% 4.2% 0.0% 7.8% 14.4% 14.4% 14.4%2526 Ch Claims on nonbank FI 0.0% 0.0%27 Ch Other private credit 2.4% 4.2% 0.0% 7.8% 0.0% 0.0% 14.4% 14.4% 14.4%2829 Ch Money and quasi money 1.5% 4.7% 6.2% 6.2% 6.2%3031 Ch Curr and demand deposits 1.5% 0.9% 2.4% 2.4% 2.4%32 Ch Time, savings dep 3.8% 3.8% 3.8% 3.8%3334 Misc and discrepancy 0.0% -3.0% 0.3% 2.2% 11.3% -16.8% -3.0% -3.0%353637 Total 10.8% 6.8% 3.1% 1.2% 2.0% 2.0% 8.5% 6.9% 27.0% 50.9% 0.0%383940

2003% of GDP Cen Gov (K1) RoW (K2) Mon Auth (K3) Dep Money 'banks flow' (K4) Private Sector (K6,K7) Disc Sources (K5) Total
U S U S U S U S U S U S12 Gross Capital Formation 9.7% 25.7% 35.4%34 Gross Saving 5.4% 0.0% 25.1% 30.6%56 Surplus/ Deficit -4.3% 4.9% -0.6% 0.0%789 Ch Foreign claims, net 2.0% 5.6% -3.4% 19.2% 2.2% 21.1%
1011 Ch Foreign Assets 1.8% 5.6% -3.3% 22.6% 2.3% 24.4%12 Ch Foreign Liabilities -0.1% 0.0% 0.0% 0.1% -3.4% -0.1% -3.3%1314 Ch Interbank Claims 2.5% 2.5% -0.2% 2.5% 2.3%1516 Ch Mon auth credit to DMB -0.9% -0.8% -0.2% -0.9% -0.9%17 Ch Bank Reserves 1.6% 1.7% 0.0% 1.7% 1.6%1819 Ch Central gov debt -20.1% -0.1% 2.1% -7.9% 12.6% -3.6% -7.5%2021 Ch Claims on cen gov 0.0% 0.0% 1.2% -7.9% -2.9% -6.7% -2.9%22 Ch Cen gov deposits -0.7% 0.1% 0.6% 15.5%2324 Ch Private credit, net 2.9% 4.8% 0.0% 10.7% 18.4% 18.4% 18.4%2526 Ch Claims on nonbank FI 0.0% 0.0%27 Ch Other private credit 2.9% 4.8% 0.0% 10.7% 0.0% 0.0% 18.4% 18.4% 18.4%2829 Ch Money and quasi money 2.7% 12.6% 15.3% 15.3% 15.3%3031 Ch Curr and demand deposits 2.7% 2.5% 5.2% 5.2% 5.2%32 Ch Time, savings dep 10.1% 10.1% 10.1% 10.1%3334 Misc and discrepancy 20.1% 2.0% 0.4% 1.9% 11.2% -31.6% 2.0% 2.0%353637 Total 12.6% -14.6% 9.1% 6.8% 5.5% 5.5% 7.4% 14.6% 33.2% 54.7% 0.0%383940

2004% of GDP Cen Gov (K1) RoW (K2) Mon Auth (K3) Dep Money 'banks flow' (K4) Private Sector (K6,K7) Disc Sources (K5) Total
U S U S U S U S U S U S12 Gross Capital Formation 9.2% 26.2% 35.5%34 Gross Saving 8.9% 0.0% 24.5% 33.4%56 Surplus/ Deficit -0.4% 2.1% -1.7% 0.0%789 Ch Foreign claims, net 2.0% 2.0% -0.1% 18.1% 2.0% 20.1%
1011 Ch Foreign Assets 1.7% 1.9% 1.1% 22.3% 3.0% 24.0%12 Ch Foreign Liabilities -0.3% -0.1% 0.0% 1.1% -4.2% -0.3% -3.1%1314 Ch Interbank Claims 0.0% -0.2% -0.4% -0.2% -0.4%1516 Ch Mon auth credit to DMB 0.1% 0.3% -0.3% 0.1% 0.0%17 Ch Bank Reserves 0.1% 0.1% -0.1% 0.1% 0.1%1819 Ch Central gov debt 3.5% 0.1% 0.2% -2.3% -7.7% -0.2% -4.1%2021 Ch Claims on cen gov 0.8% 0.8% 2.3% -2.3% 0.9% 0.8% 1.7%22 Ch Cen gov deposits -1.9% 0.7% 1.2% -8.6%2324 Ch Private credit, net 2.4% 6.1% 0.0% 17.2% 25.8% 25.8% 25.8%2526 Ch Claims on nonbank FI 0.0% 0.0%27 Ch Other private credit 2.4% 6.1% 0.0% 17.2% 0.0% 0.0% 25.8% 25.8% 25.8%2829 Ch Money and quasi money 2.6% 13.8% 16.4% 16.4% 16.4%3031 Ch Curr and demand deposits 2.6% 3.1% 5.7% 5.7% 5.7%32 Ch Time, savings dep 10.7% 10.7% 10.7% 10.7%3334 Misc and discrepancy -20.0% -2.0% -0.5% 1.6% 26.9% -10.1% -2.0% -2.0%353637 Total 11.7% 12.4% 5.9% 4.1% 2.1% 2.1% 6.4% 15.5% 40.3% 77.1% 0.0%383940

2005% of GDP Cen Gov (K1) RoW (K2) Mon Auth (K3) Dep Money 'banks flow' (K4) Private Sector (K6,K7) Disc Sources (K5)Total
U S U S U S U S U S U S12 Gross Capital Formation 9.4% 26.1% 35.6%34 Gross Saving 7.3% 0.0% 27.2% 34.5%56 Surplus/ Deficit -2.1% 1.1% 1.1% 0.0%789 Ch Foreign claims, net 5.2% 4.2% 1.0% 17.1% 5.2% 22.3%
1011 Ch Foreign Assets 5.1% 4.0% 1.6% 20.8% 5.5% 26.0%12 Ch Foreign Liabilities -0.1% -0.2% 0.0% 0.5% -3.7% -0.1% -3.4%1314 Ch Interbank Claims 1.7% 0.8% -1.2% 0.8% 0.5%1516 Ch Mon auth credit to DMB -0.4% 0.5% -1.2% -0.4% -0.7%17 Ch Bank Reserves 1.3% 1.3% 0.0% 1.3% 1.3%1819 Ch Central gov debt -0.5% -0.4% 3.0% -6.1% -5.4% -0.9% -5.9%2021 Ch Claims on cen gov -0.5% -0.5% 1.2% -6.1% -0.3% -5.4% -0.8%22 Ch Cen gov deposits -0.1% -0.1% 0.2% -5.1%2324 Ch Private credit, net 2.4% 7.0% 0.0% 15.8% 25.2% 25.2% 25.2%2526 Ch Claims on nonbank FI 0.0% 0.0%27 Ch Other private credit 2.4% 7.0% 0.0% 15.8% 0.0% 0.0% 25.2% 25.2% 25.2%2829 Ch Money and quasi money 2.6% 15.6% 18.2% 18.2% 18.2%3031 Ch Curr and demand deposits 2.6% 2.6% 5.2% 5.2% 5.2%32 Ch Time, savings dep 13.0% 13.0% 13.0% 13.0%3334 Misc and discrepancy 0.0% -0.7% -0.6% 1.4% 8.9% -10.5% -0.7% -0.7%353637 Total 11.8% 6.8% 8.8% 6.3% 3.7% 3.7% 5.4% 17.0% 38.3% 61.4% 0.0%383940

2006% of GDP Cen Gov (K1) RoW (K2) Mon Auth (K3) Dep Money 'banks flow' (K4) Private Sector (K6,K7) Disc Sources (K5) Total
U S U S U S U S U S U S12 Gross Capital Formation 9.1% 27.7% 36.8%34 Gross Saving 9.2% 0.0% 27.4% 36.5%56 Surplus/ Deficit 0.1% 0.3% -0.4% 0.0%789 Ch Foreign claims, net 9.6% 7.3% 1.9% 18.8% 9.2% 28.5%
1011 Ch Foreign Assets 9.6% 7.3% 2.9% 23.0% 10.2% 32.6%12 Ch Foreign Liabilities -0.1% 0.0% 0.0% 1.0% -4.2% -0.1% -3.2%1314 Ch Interbank Claims 3.2% 2.4% -1.9% 2.4% 1.4%1516 Ch Mon auth credit to DMB -0.3% 0.5% -1.8% -0.3% -1.3%17 Ch Bank Reserves 2.9% 2.9% -0.1% 2.9% 2.9%1819 Ch Central gov debt -6.2% -1.5% 1.1% -2.8% 0.0% -1.8% -6.2%2021 Ch Claims on cen gov 0.5% 0.5% 2.8% -2.8% 0.0% 0.5% 0.4%22 Ch Cen gov deposits -2.3% 2.0% 0.3% 0.0%2324 Ch Private credit, net 0.5% 7.6% 0.0% 14.5% 22.6% 22.6% 22.6%2526 Ch Claims on nonbank FI 0.0% 0.0%27 Ch Other private credit 0.5% 7.6% 0.0% 14.5% 0.0% 0.0% 22.6% 22.6% 22.6%2829 Ch Money and quasi money 2.8% 16.9% 19.8% 19.8% 19.8%3031 Ch Curr and demand deposits 2.8% 2.3% 5.2% 5.2% 5.2%32 Ch Time, savings dep 14.6% 14.6% 14.6% 14.6%3334 Misc and discrepancy 6.6% 2.3% -0.4% 1.2% 11.8% -17.0% 2.3% 2.3%353637 Total 9.6% 3.0% 11.3% 9.9% 5.8% 5.6% 4.7% 18.1% 44.7% 61.8% 0.0%383940

2007% of GDP Cen Gov (K1) RoW (K2) Mon Auth (K3) Dep Money 'banks flow' (K4) Private Sector (K6,K7) Disc Sources (K5) Total
U S U S U S U S U S U S12 Gross Capital Formation 9.8% 33.3% 43.1%34 Gross Saving 7.6% 0.0% 25.7% 33.3%56 Surplus/ Deficit -2.2% 9.8% -7.6% 0.0%789 Ch Foreign claims, net 10.7% 14.4% -3.7% 24.3% 10.7% 35.0%
1011 Ch Foreign Assets 10.6% 14.4% -1.7% 29.8% 12.7% 40.5%12 Ch Foreign Liabilities 0.0% 0.0% 0.0% 2.0% -5.6% 0.0% -3.6%1314 Ch Interbank Claims 1.4% 2.1% -0.9% 2.1% 0.5%1516 Ch Mon auth credit to DMB 0.7% -0.1% -0.8% 0.7% -0.9%17 Ch Bank Reserves 2.0% 2.0% -0.1% 2.0% 1.9%1819 Ch Central gov debt -2.9% -2.0% 1.3% -3.8% -5.9% -3.2% -8.9%2021 Ch Claims on cen gov -0.8% -0.8% 1.1% -3.8% -0.3% -3.4% -1.0%22 Ch Cen gov deposits -2.2% 1.2% 1.0% -5.7%2324 Ch Private credit, net -0.3% 21.3% 0.0% 32.7% 53.7% 53.7% 53.7%2526 Ch Claims on nonbank FI 0.0% 0.0%27 Ch Other private credit -0.3% 21.3% 0.0% 32.7% 0.0% 0.0% 53.7% 53.7% 53.7%2829 Ch Money and quasi money 5.4% 30.7% 36.1% 36.1% 36.1%3031 Ch Curr and demand deposits 5.4% 7.1% 12.5% 12.5% 12.5%32 Ch Time, savings dep 23.6% 23.6% 23.6% 23.6%3334 Misc and discrepancy -3.5% -0.8% -0.2% 1.0% 19.3% -17.4% -0.8% -0.8%353637 Total 9.5% 4.7% 21.8% 20.5% 12.4% 6.6% 4.0% 31.7% 65.6% 98.7% 0.0%383940

2008% of GDP Cen Gov (K1) RoW (K2) Mon Auth (K3) Dep Money 'banks flow' (K4) Private Sector (K6,K7) Disc Sources (K5) Total
U S U S U S U S U S U S12 Gross Capital Formation 9.7% 25.7% 35.4%34 Gross Saving 5.4% 0.0% 25.1% 30.6%56 Surplus/ Deficit -4.3% 4.9% -0.6% 0.0%789 Ch Foreign claims, net 2.0% 5.6% -3.4% 19.2% 2.2% 21.1%
1011 Ch Foreign Assets 1.8% 5.6% -3.3% 22.6% 2.3% 24.4%12 Ch Foreign Liabilities -0.1% 0.0% 0.0% 0.1% -3.4% -0.1% -3.3%1314 Ch Interbank Claims 2.5% 2.5% -0.2% 2.5% 2.3%1516 Ch Mon auth credit to DMB -0.9% -0.8% -0.2% -0.9% -0.9%17 Ch Bank Reserves 1.6% 1.7% 0.0% 1.7% 1.6%1819 Ch Central gov debt -20.1% -0.1% 2.1% -7.9% 12.6% -3.6% -7.5%2021 Ch Claims on cen gov 0.0% 0.0% 1.2% -7.9% -2.9% -6.7% -2.9%22 Ch Cen gov deposits -0.7% 0.1% 0.6% 15.5%2324 Ch Private credit, net 2.9% 4.8% 0.0% 10.7% 18.4% 18.4% 18.4%2526 Ch Claims on nonbank FI 0.0% 0.0%27 Ch Other private credit 2.9% 4.8% 0.0% 10.7% 0.0% 0.0% 18.4% 18.4% 18.4%2829 Ch Money and quasi money 2.7% 12.6% 15.3% 15.3% 15.3%3031 Ch Curr and demand deposits 2.7% 2.5% 5.2% 5.2% 5.2%32 Ch Time, savings dep 10.1% 10.1% 10.1% 10.1%3334 Misc and discrepancy 20.1% 2.0% 0.4% 1.9% 11.2% -31.6% 2.0% 2.0%353637 Total 12.6% -14.6% 9.1% 6.8% 5.5% 5.5% 7.4% 14.6% 33.2% 54.7% 0.0%383940

2009% of GDP Cen Gov (K1) RoW (K2) Mon Auth (K3) Dep Money 'banks flow' (K4) Private Sector (K6,K7) Disc Sources (K5) Total
U S U S U S U S U S U S12 Gross Capital Formation 13.6% 24.5% 38.1%34 Gross Saving 6.9% 0.0% 24.4% 31.3%56 Surplus/ Deficit 0.0% 6.8% -0.1% 6.7%789 Ch Foreign claims, net -9.0% -7.5% 0.3% 26.3% -7.1% 17.3%
1011 Ch Foreign Assets -8.6% -6.6% 2.5% 34.7% -4.1% 26.1%12 Ch Foreign Liabilities 0.4% 0.9% 0.0% 2.2% -8.3% 0.4% -5.3%1314 Ch Interbank Claims -3.1% -5.6% -3.0% -5.6% -6.0%1516 Ch Mon auth credit to DMB 2.3% 4.9% -2.9% 2.3% 2.0%17 Ch Bank Reserves -0.8% -0.7% -0.1% -0.7% -0.9%1819 Ch Central gov debt 3.1% 6.0% 0.4% -0.3% -3.1% 6.1% 0.0%2021 Ch Claims on cen gov 3.8% 3.8% 2.6% -0.3% 0.0% 6.1% 3.8%22 Ch Cen gov deposits 0.7% -2.2% -0.1% -3.1%2324 Ch Private credit, net 0.0% 7.1% 0.0% 31.9% 39.0% 39.0% 39.0%2526 Ch Claims on nonbank FI 0.0% 0.0%27 Ch Other private credit 0.0% 7.1% 0.0% 31.9% 0.0% 0.0% 39.0% 39.0% 39.0%2829 Ch Money and quasi money 3.4% 20.5% 23.9% 23.9% 23.9%3031 Ch Curr and demand deposits 3.4% 4.6% 8.0% 8.0% 8.0%32 Ch Time, savings dep 16.0% 16.0% 16.0% 16.0%3334 Misc and discrepancy 0.1% -9.3% -0.3% 0.7% 10.5% -20.3% -9.3% -9.3%353637 Total 13.6% 10.0% -2.2% -2.2% -1.5% 0.0% 2.8% 21.2% 48.1% 74.0% 0.0%383940

2010% of GDP Cen Gov (K1) RoW (K2) Mon Auth (K3) Dep Money 'banks flow' (K4) Private Sector (K6,K7) Disc Sources (K5) Total
U S U S U S U S U S U S12 Gross Capital Formation 13.4% 33.1% 46.4%34 Gross Saving 9.1% 0.0% 32.6% 41.6%56 Surplus/ Deficit 0.0% 4.8% -0.5% 4.3%789 Ch Foreign claims, net -1.4% -3.5% -0.3% 14.9% -3.8% 13.5%
1011 Ch Foreign Assets -1.5% -3.4% 2.7% 26.7% -0.8% 25.3%12 Ch Foreign Liabilities 0.0% 0.0% 0.0% 3.0% -11.8% 0.0% -8.8%1314 Ch Interbank Claims -6.3% -7.2% -3.9% -7.2% -10.2%1516 Ch Mon auth credit to DMB 4.6% 5.5% -3.7% 4.6% 1.7%17 Ch Bank Reserves -1.6% -1.7% -0.1% -1.7% -1.8%1819 Ch Central gov debt 3.0% 0.4% 2.3% -2.6% -6.8% 0.0% -3.8%2021 Ch Claims on cen gov 0.4% 0.4% 2.6% -2.6% 0.0% 0.3% 0.4%22 Ch Cen gov deposits -2.6% 0.0% 0.4% -6.8%2324 Ch Private credit, net 0.0% 7.5% 0.0% 36.6% 44.1% 44.1% 44.1%2526 Ch Claims on nonbank FI 0.0% 0.0%27 Ch Other private credit 0.0% 7.5% 0.0% 36.6% 0.0% 0.0% 44.1% 44.1% 44.1%2829 Ch Money and quasi money 2.7% 31.5% 34.2% 34.2% 34.2%3031 Ch Curr and demand deposits 2.7% 0.9% 3.6% 3.6% 3.6%32 Ch Time, savings dep 30.6% 30.6% 30.6% 30.6%3334 Misc and discrepancy -3.3% -4.1% 0.5% 0.7% 2.2% -4.2% -4.1% -4.1%353637 Total 13.4% 12.1% 3.4% 3.4% -3.1% -3.1% 2.8% 32.2% 64.7% 78.9% 0.0%383940

2011% of GDP Cen Gov (K1) RoW (K2) Mon Auth (K3) Dep Money 'banks flow' (K4) Private Sector (K6,K7) Disc Sources (K5) Total
U S U S U S U S U S U S12 Gross Capital Formation 13.0% 36.9% 49.9%34 Gross Saving 10.0% 0.0% 40.2% 50.2%56 Surplus/ Deficit 0.0% -0.3% 3.3% 3.0%789 Ch Foreign claims, net 0.8% 2.8% -0.3% 15.2% 2.5% 16.1%
1011 Ch Foreign Assets 0.8% 2.9% 1.4% 28.8% 4.3% 29.6%12 Ch Foreign Liabilities 0.0% 0.1% 0.0% 1.7% -13.5% 0.0% -11.8%1314 Ch Interbank Claims 1.5% 1.6% -3.8% 1.6% -2.3%1516 Ch Mon auth credit to DMB 1.5% 1.6% -3.8% 1.5% -2.2%17 Ch Bank Reserves 3.0% 3.2% 0.0% 3.2% 3.0%1819 Ch Central gov debt -1.9% -1.6% 2.8% -3.4% -4.6% -2.3% -6.5%2021 Ch Claims on cen gov -1.6% -1.6% 2.6% -3.4% 0.0% -2.5% -1.6%22 Ch Cen gov deposits 0.3% 0.0% 0.6% -4.6%2324 Ch Private credit, net 0.0% 7.3% 0.0% 21.3% 28.7% 28.7% 28.7%2526 Ch Claims on nonbank FI 0.0% 0.0%27 Ch Other private credit 0.0% 7.3% 0.0% 21.3% 0.0% 0.0% 28.7% 28.7% 28.7%2829 Ch Money and quasi money 2.0% 15.9% 17.8% 17.8% 17.8%3031 Ch Curr and demand deposits 2.0% 1.7% 3.7% 3.7% 3.7%32 Ch Time, savings dep 14.2% 14.2% 14.2% 14.2%3334 Misc and discrepancy 2.9% -6.8% -2.3% 0.7% -1.2% -6.8% -6.8% -6.8%353637 Total 13.0% 8.1% 0.5% 0.5% 1.2% 1.2% 2.8% 16.6% 51.3% 67.6% 0.0%383940