pension facts november 2005o - pensions policy inst · pension facts november 2005o . ... 21 number...
TRANSCRIPT

The PPI has collected this data from a variety of sources,
reflecting the latest available information. The PPI cannot confirm the accuracy of primary source data.
PENSIONS POLICY INSTITUTE
Pension Facts ONovember 2005


PENSIONS POLICY INSTITUTE
Pension Facts The data shown here has been selected by the PPI to answer those questions we are most frequently asked – or those questions which we suggest should be more frequently asked - but where the data is not easily available from other sources. Contents Demographics 1 State pensions 2 Private pensions 8 Working and retirement 14 For further information on any of the statistics contained in this document, please contact: Chris Curry 020 7848 3731 Melanie Greenall 020 7848 4245 [email protected] [email protected] Published by the Pensions Policy Institute © 2005 www.pensionspolicyinstitute.org.uk The PPI is grateful for the continuing support of all its members. A full list of donors is on the PPI’s website. All donations are given independently of the PPI’s research agenda and report content. The Family Resources Survey 2003/4 was supplied by the UK Data Archive, University of Essex, and is funded by the Department of Work and Pensions. The UK Data Archive and the Department for Work and Pensions bear no responsibility for further analysis and interpretation. Crown copyright material is reproduced with the permission of the Controller of HMSO and the Queen’s Printer for Scotland.


PENSIONS POLICY INSTITUTE
Contents
Table Number Title
Page Number
Demographics 1 Projected number of people in the UK of state pension
age or older 1
2 Projected life expectancy at age 65 1 State Pensions 3 Total state spending on pensions and other benefits for
pensioners 2
4 Average proportion of pensioner income paid from state and private pension provision
3
5 Current full amount of Basic State Pension and projected future amounts
4
6 Average amount of Basic State Pension received 4 7 Proportion of pensioners receiving less than the full
amount of Basic State Pension 5
8 Number of working age people who have accrued a qualifying year for the Basic State Pension by method of accrual
5
9 Average amount of SERPS and State Second Pension received per week
6
10 Number of working age people accruing entitlement to State Second Pension
6
11 Number of Pension Credit claimants (overall and by component being received)
7
12 Take-up of beneficiaries receiving different types of Pension Credit
7
13 Average weekly payments of Pension Credit (by component)
7

PENSIONS POLICY INSTITUTE
Table
number Title Page
number Private Pensions 14 Proportion of working-age people currently accruing a
non-state pension 8
15 Proportion of pensioners receiving an occupational or personal pension
8
16 Average amount received by a pensioner from occupational and personal pensions; average of those receiving something more than zero
8
17 Average size of pension fund used to buy an annuity 9 18 Number of occupational pension schemes by status 9 20 Number of occupational pension schemes by size and
sector 9
20 Number of private sector occupational pension schemes by size and type
10
21 Number of members of occupational pension schemes 10
22 Contribution rates to private sector schemes by scheme size
10
23 Average voluntary contribution to a private pension as a proportion of National Average Earnings
11
24 Amount of money in funded pensions by type of investment
11
25 Estimated costs of tax relief on private pensions 12 26 Percentage of tax relief on individual and employee
pension contributions by tax rate 13
Working and retirement 27 Proportion of people working by age group and sex 14 28 Average retirement ages 14

1
PENSIONS POLICY INSTITUTE
Demographics q Table 1: Projected number of people in the UK of state pension age (SPA)
or older1 Projected number of people of SPA or older2 (thousands)
2005 2015 2025 2035 2045 2055 Women 7,103 7,222 7,403 8,804 9,232 9,723 Men 4,147 5,243 6,257 7,458 7,819 8,382 Total 11,250 12,465 13,660 16,261 17,051 18,105 Total % of population 19% 20% 21% 24% 25% 26%
q Table 2: Projected life expectancy at age 653
Cohort life expectancy on reaching age 65 in the year shown (years)4 UK
population 2005 2015 2025 2035 2045 2054 Women 22.1 23.0 23.8 24.7 25.5 26.3 Men 19.4 20.5 21.3 22.2 23.1 23.9 These cohort projected life expectancies allow for future projected changes in mortality rates. They show how long a person is expected to live based on age-specific mortality rates at each age for each relevant future year. There is a wide range of uncertainty in life expectancy projections. For example, in 2005, life expectancy at age 65 for a man can vary +/- 0.9 years and for a woman, +/- 0.7 years.
1 GAD 2004-based principal projections for the UK www.gad.gov.uk/Population/index.asp 2 SPA = 65 for men; 60 for women until 2010, then phased up to 65 to 2020 3 GAD Cohort expectations of life www.gad.gov.uk/Life_Tables/Period_and_cohort_eol.htm 4 Based on actual mortality rates and projected calendar year mortality rates from the interim 2004-based principal population projections

2
PENSIONS POLICY INSTITUTE
State pensions General q Table 3: Total spending on state pensions and other benefits for
pensioners (£ billions)5 Real terms, 2005/6 prices (£ billions)
Type of benefit 2004/5
estimate 2014/5
projection 2024/5
projection 2034/5
projection Basic State Pension 43.4 51.1 59.7 72.9 SERPS/ S2P 7.8 14.2 20.1 27.5 MIG/Pension Credit6 6.5 10.8 15.8 23.8 Other pension benefits7 3.1 1.8 1.9 2.1 Total pensions 60.8 77.9 97.4 126.3 % of GDP 5.1% 5.0% 5.0% 5.4%
Contracted-out rebates8 10.7 11.2 10.9 10.8 Contracted-out rebates as a % of GDP9 0.9% 0.7% 0.6% 0.5%
Total pensions and contracted-out rebates 71.5 89.1 108.3 137.1
% of GDP 6.0% 5.7% 5.6% 5.9%
Housing related benefits10 7.2 8.7 10.2 12.9 Attendance Allowance and Disability Living Allowance
6.7 8.7 10.5 13.2
Total pensions, contracted-out rebates and benefits paid to pensioners
85.4 106.5 129.1 163.2
% of GDP 7.2% 6.9% 6.6% 7.1%
5 DWP (2005) Benefit expenditure tables www.dwp.gov.uk/asd/asd4/long_term.asp. Refer to Table 25 for other state spending on tax relief. These are the official Government projections. For PPI long-term projections of spending on state pensions and contracting-out rebates see Steventon (2005) What will pensions cost in future?, PPI. 6 Minimum Income Guarantee (MIG) was the predecessor of Guarantee Credit. See PPI (2005) The Pensions Primer for more details. 7 ‘Other pension benefits’ comprise Winter Fuel Payments, Over 75s TV Licences and Christmas Bonus 8 PPI estimates based on GAD (2004) Update of the Government Actuary’s Quinquennial Review of the National Insurance Fund as at April 2000 and DWP (2005) Benefit expenditure tables 9 GAD (2004) Update of the Government Actuary’s Quinquennial Review of the National Insurance Fund as at April 2000 10 ‘Housing-related benefits’ comprise Housing Benefit, Council Tax Benefit in Great Britain, Rate Rebate in Northern Ireland, and Discretionary Housing Payments
3
PENSIONS POLICY INSTITUTE
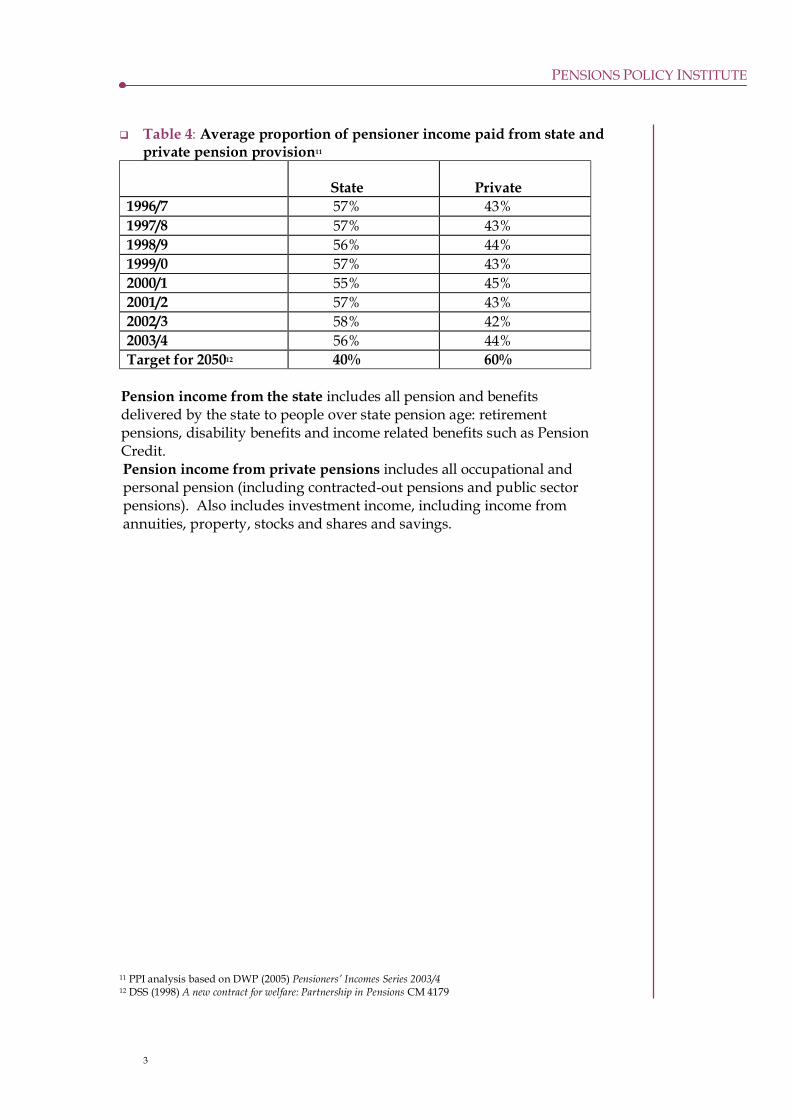
q Table 4: Average proportion of pensioner income paid from state and private pension provision11
State
Private
1996/7 57% 43% 1997/8 57% 43% 1998/9 56% 44% 1999/0 57% 43% 2000/1 55% 45% 2001/2 57% 43% 2002/3 58% 42% 2003/4 56% 44% Target for 205012 40% 60%
Pension income from the state includes all pension and benefits delivered by the state to people over state pension age: retirement pensions, disability benefits and income related benefits such as Pension Credit. Pension income from private pensions includes all occupational and personal pension (including contracted-out pensions and public sector pensions). Also includes investment income, including income from annuities, property, stocks and shares and savings.
11 PPI analysis based on DWP (2005) Pensioners’ Incomes Series 2003/4 12 DSS (1998) A new contract for welfare: Partnership in Pensions CM 4179

4
PENSIONS POLICY INSTITUTE
Basic State Pension q Table 5: Current full amount of Basic State Pension (BSP) and projected
future amounts13
Tax Year
BSP - Weekly Amount
(Projected)
Weekly National Average
Earnings14 (Projected)
Projected BSP as a
percentage of NAE
April 2005 £82.05 £51715 15.9% April 2010 £92.80 £646 14.4% April 2015 £105.00 £807 13.0% April 2020 £118.80 £1,008 11.8% April 2025 £134.40 £1,259 10.7% April 2030 £152.05 £1,573 9.7% April 2035 £172.05 £1,964 8.8% q Table 6: Average amount of Basic State Pension (BSP) received16 Average amount of
BSP received per week (2004/5)
Average amount of BSP as a % of the full
BSP17 Women £60.85 76% Men £74.01 93% All persons £65.79 83%
13 PPI calculation. Assumes inflation of 2.5% per year and real earnings growth of 2% per year. 14 This includes only full time employees 15 ONS (2005) Annual Survey of Hours and Earnings 16 Information provided by the DWP from a 5% sample of administrative records taken March 2005. Excludes increments awarded for deferring the state pension. 17 Full BSP 2004/5 = £79.60. Figures rounded to the nearest 1%.

5
PENSIONS POLICY INSTITUTE
q Table 7: Proportion of pensioners receiving less than the full amount of Basic State Pension (BSP) as at 31 March 200418
Pensioners receiving less
than the full BSP
Pensioners receiving less than 75 per cent of the full
BSP Men 10.2% 2.9% Women 50.9% 42.7% q Table 8: Number of working age people19 who have accrued a qualifying
year for the Basic State Pension (BSP) by method of accrual, UK (2002/3)20 Number of working age people (millions)21
Contributing Credited-in Not qualifying Men 11.4 5.6 2.1 Women 8.8 6.2 2.8 Total 20.2 11.8 4.9 Total as a % of working age people22
55% 32% 13%
18 PQ Jim Cousins, House of Commons Hansard 17 March 2005 Column 424W 19 Between the ages 18 to 59 (women) /64 (men) 20 PPI estimates derived from DWP (2005) Contributions and Qualifying Years for State Pension 1978/79 to 2002/03. ‘Credited-in’ includes people eligible for Home Responsibilities Protection (HRP). 21 Figures rounded to the nearest 0.1 million 22 Figures rounded to the nearest 1%

6
PENSIONS POLICY INSTITUTE
State Second Pension q Table 9: Average amount of SERPS and State Second Pension received
per week in 2004/523 Not including income from
contracted-out pensions Including contracted-out
deductions24 Men £19.16 £39.44 Women £8.16 £12.66 Total £12.29 £22.69 q Table 10: Number of working age people25 accruing entitlement to State
Second Pension (S2P) or contracted-out equivalent, UK (2002/3)26 Number of working age people (millions)27
Contributing Credited-in Not qualifying Men 12.1 1.4 5.7 Women 9.8 2.7 5.5 Total 21.828 4.1 11.2 Total as a % of working age people
59% 11% 30%
23 DWP (2005) State pension summary of statistics September 2004 24 See PPI (2005) The Pensions Primer 25 Between the ages 18 to 59 (women) /64 (men) 26 PPI analysis of DWP (2005) Second tier pension provision 1978/9 to 2003/4 and GAD 2004-based population projections www.gad.gov.uk/Population/index.asp. 27 Figures rounded to the nearest 0.1 million 28 The total number of people qualifying for S2P through earnings in this table is higher than the total number of people qualifying for the BSP through earnings shown in Table 8 despite qualification being wider for BSP than S2P (for example the self-employed can qualify for BSP but not S2P). This is because figures for S2P include a degree of double-counting where some individuals have had more than one job that qualifies in the same year. These figures are subject to revision in future DWP Second tier pension provision releases.
7
PENSIONS POLICY INSTITUTE
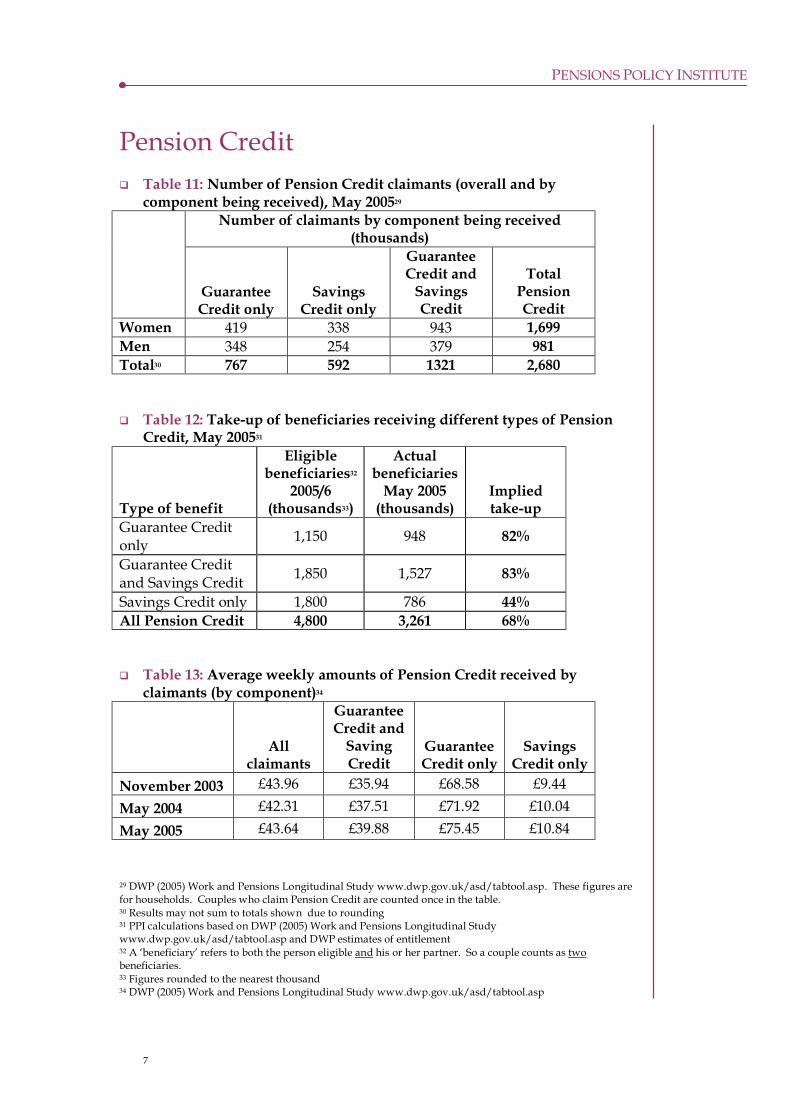
Pension Credit q Table 11: Number of Pension Credit claimants (overall and by
component being received), May 200529 Number of claimants by component being received
(thousands)
Guarantee Credit only
Savings Credit only
Guarantee Credit and
Savings Credit
Total Pension Credit
Women 419 338 943 1,699 Men 348 254 379 981 Total30 767 592 1321 2,680 q Table 12: Take-up of beneficiaries receiving different types of Pension
Credit, May 200531
Type of benefit
Eligible beneficiaries32
2005/6 (thousands33)
Actual beneficiaries
May 2005 (thousands)
Implied take-up
Guarantee Credit only 1,150 948 82%
Guarantee Credit and Savings Credit 1,850 1,527 83%
Savings Credit only 1,800 786 44% All Pension Credit 4,800 3,261 68% q Table 13: Average weekly amounts of Pension Credit received by
claimants (by component)34
All
claimants
Guarantee Credit and
Saving Credit
Guarantee Credit only
Savings Credit only
November 2003 £43.96 £35.94 £68.58 £9.44 May 2004 £42.31 £37.51 £71.92 £10.04 May 2005 £43.64 £39.88 £75.45 £10.84 29 DWP (2005) Work and Pensions Longitudinal Study www.dwp.gov.uk/asd/tabtool.asp. These figures are for households. Couples who claim Pension Credit are counted once in the table. 30 Results may not sum to totals shown due to rounding 31 PPI calculations based on DWP (2005) Work and Pensions Longitudinal Study www.dwp.gov.uk/asd/tabtool.asp and DWP estimates of entitlement 32 A ‘beneficiary’ refers to both the person eligible and his or her partner. So a couple counts as two beneficiaries. 33 Figures rounded to the nearest thousand 34 DWP (2005) Work and Pensions Longitudinal Study www.dwp.gov.uk/asd/tabtool.asp

8
PENSIONS POLICY INSTITUTE
Private Pensions q Table 14: Proportion of working-age people currently accruing35 a non-
state pension (2003/4)36 Age Women Men 18 – 29 24% 23% 30 – 39 43% 57% 40 – 49 46% 62% 50 – SPA37 40% 43% All 38% 46% q Table 15: Proportion of pensioners receiving an occupational or personal
pension (2003/4)38 Occupational pension Personal pension
Single pensioners 55% 6%
Pensioner couples 73% 18%
All pensioners 62% 11%
q Table 16: Average amount received by a pensioner from occupational and
personal pensions; average of those receiving something more than zero39 Average amount received 2003/4 prices (£ per week) Occupational pension Personal pension
Mean Median Mean Median Single pensioners £88 £52 £61 £26
Pensioner couples £176 £118 £84 £37
All pensioners £129 £76 £76 £31
35 ‘Accruing’ refers to the building up of rights in a pension scheme 36 PPI analysis of Family Resources Survey 2003/4 37 State pension age (SPA) = 65 for men; 60 for women 38 DWP (2005) The Pensioners’ Incomes Series 2003/4 39 DWP (2005) The Pensioners’ Incomes Series 2003/4. Averages do not include pensioners who have no income from occupational or personal pensions.

9
PENSIONS POLICY INSTITUTE
q Table 17: Average size of pension fund used to buy an annuity40 Year Average pension annuity purchase price 2000 £22,946 2001 £24,382 2002 £22,047 2003 £21,713 2004 £21,459 2005 (Q1) £23,990 q Table 18: Number of occupational pension schemes by status (2004
estimates)41 Number of schemes by status42
Type of Scheme Open Closed Frozen
Winding up Total
Private (DB and DC) 54,000 19,500 16,600 5,800 95,900
Public 264 * 59 * 338 Total 54,300 19,500 16,700 5,800 96,200 q Table 19: Number of occupational pension schemes by size and sector
(2004 estimates)43 Type of scheme by sector Scheme size
(total membership)
Private Sector (DC and DB) Public Sector Total44
10,000+ 195 114 309 5,000 – 9,999 216 18 234 1,000 - 4,999 1,220 75 1,300 100 – 999 4,980 65 5,050 12 – 99 9,700 39 9,740 2 – 11 79,600 27 79,600 Total 95,900 338 96,200
40 Information supplied by the Association of British Insurers (2005). Estimates are based on the fund used to purchase an annuity, i.e. after any lump-sum available from the fund has been taken. 41 GAD (2005) Occupational Pension Schemes 2004 42 * represents less than 10. Results may not sum to totals shown due to rounding. Results are rounded to three significant figures. 43 GAD (2005) Occupational Pension Schemes 2004 44 Results may not sum to totals shown due to rounding

10
PENSIONS POLICY INSTITUTE
q Table 20: Number of private sector occupational pension schemes by size and type (2004 estimates)45
Scheme size (total membership)
Defined Benefit
Defined Contribution ‘Sectionalised’46 Total47
10,000+ 129 7 58 194 5,000 – 9,999 129 26 56 211 1,000 - 4,999 694 55 360 1,109 100 – 999 2,800 1,060 621 4,481 12 – 99 4,160 4,440 - 8,600 2 – 11 10,200 65,300 - 75,500 Total48 18,100 70,900 1,095 90,095 q Table 21: Number of members of occupational pension schemes (2004
estimates)49 Number of members (millions)
Type of membership 1991 1995 2000 2004 Private sector 6.5 6.2 5.7 4.8 Public sector 4.2 4.1 4.4 5.0 Active
members Total 10.7 10.3 10.1 9.8
Pensions in payment 7.0 8.5 8.2 9.0 Preserved pension entitlements 4.5 7.0 6.7 9.3
q Table 22: Contribution rates to private sector schemes by scheme size (as
a percentage of salary) in 200450 Weighted average contribution rates (% of salary)
Defined Benefit Defined Contribution Scheme size (total membership) Member Employer Total Member Employer Total 10,000+ 4.1 14.5 18.6 2.8 6.5 9.3 5,000 to 9,999 4.0 12.6 16.6 2.0 3.6 5.6 1,000 to 4,999 4.9 15.0 19.9 2.4 6.4 8.8 100 to 999 4.8 15.4 20.3 3.8 6.0 9.7 12 to 99 4.3 15.0 19.3 2.9 6.6 9.5
45 GAD (2005) Occupational Pension Schemes 2004 46 Sectionalised schemes are those where both Defined Benefit and Defined Contribution pensions are available to members in different parts of the scheme. For example a Defined Benefit scheme may be closed to new members, who are in a Defined Contribution part of the scheme. 47 Excludes schemes where type is unknown and public sector schemes 48 Results may not sum to totals shown due to rounding 49 GAD (2005) Occupational Pension Schemes 2004 50 GAD (2005) Occupational Pension Schemes 2004. Includes schemes where contributions are zero. As these contributions are a proportion of salary, they will include any contracted-out rebate received by the employer/employee.

11
PENSIONS POLICY INSTITUTE
q Table 23: Average voluntary contribution to a private pension as a proportion of National Average Earnings51
Year
Excluding contracted-out
rebates
Including contracting-out
rebates Of which: Special
contributions 1997 6.2% 7.7% 0.2% 1998 7.5% 7.5% 0.2% 1999 6.2% 7.7% 0.3% 2000 6.4% 7.8% 0.4% 2001 6.1% 7.6% 0.3% 2002 6.2% 7.9% 0.5% 2003 7.3% 8.8% 0.8% 2004 7.6% 9.3% 1.1% q Table 24: Amount of money in funded pensions by type of investment
(2004/5 prices)52 Amount of money invested in funded pensions
(£ billions) Type of investment 1997 1998 1999 2000 2001 2002 2003 Insurance-company-administered occupational pensions
122 161 196 233 220 206 250
Insurance-company-administered personal pensions
267 316 367 387 373 349 372
Self-administered occupational pensions 775 802 911 847 770 640 709
Total 1,164 1,279 1,475 1,466 1,364 1,195 1,330 % of GDP 122% 130% 145% 139% 126% 109% 118%
51 PPI calculations based on data from the Inland Revenue and Penneck and Tiley (2005) Private Pension contributions: updated estimates 1996 – 2004 in Economic Trends no 622, Office for National Statistics. These are lower than the rates shown in Table 22 as they show the average across all members of the workforce and so includes those making no contributions. Includes special contributions, shown separately in column 3. 52 PPI analysis derived from ABI (2004) How much in funded pensions in 2002 and ABI (2005) Research Update: Money in funded pensions

12
PENSIONS POLICY INSTITUTE
q Table 25: Estimated costs of tax relief on private pensions (2004/5)53 Tax relief on: Estimated cost (£ million)54 Relief paid on contributions into schemes: Employees’ contributions to occupational pension schemes £3,600
Employers’ contributions to occupational pension schemes £11,300
Employees’ contributions to personal pension schemes £1,050
Employers’ contributions to personal pension schemes £860
Employees’ contributions to Free Standing Additional Voluntary Contribution Schemes
£120
Contributions to personal pensions by the self-employed £850
Additional relief at the basic rate on National Insurance contracted-out rebates paid to personal pensions
£214
Relief paid on investment returns: Investment income of funds55 £2,600 Tax not paid on benefits taken as a lump-sum rather than on income stream: Lump sum payments from unfunded schemes56 £300
Total tax relief on private pension contributions £20,900 (1.8% of GDP)
National Insurance that would have been paid had employer pension contributions been paid as salary
£6,600
Higher tax allowances for pensioners £2,100 Total relief (1) £29,600 (2.5% of GDP) Less tax liable on57: Pension payments £8,600 Refunds by funds to employers £23 Total tax received (2) £8,600 (0.7% of GDP) NET TAX RELIEF COST (1 - 2) £21,000 (1.8% of GDP)
53 HMRC (2005) Tax expenditures and structural reliefs www.hmrc.gov.uk/stats/tax_expenditures/table1-5.pdf HMRC (2005) Approved pension schemes: cost of tax relief www.hmrc.gov.uk/stats/pensions/7_9_sep05.xls and HMT (2005) GDP deflators at market prices, and money GDP www.hm-treasury.gov.uk/media/9D4/D7/GDP_Deflators_20050928_NA-update_circ.xls 54 Rounded to the nearest 100 million 55 Assuming relief at the basic rate of tax, which on interest payments is 20% from 1996-97. 56 Assuming relief at the basic rate of tax. On the same assumption the cost of all lump sums would be around £1.4 billion for 2004/5. 57 Tax liabilities on pensions in payment are the tax on pensions paid in the year, not the tax that might eventually be received on pension paid as a result of contributions made in the year

13
PENSIONS POLICY INSTITUTE
q Table 26: Percentage of total tax relief on individual and employee pension contributions by tax rate (2004/5)58
Marginal income tax rate Percentage of total tax relief Higher rate 55% Those that would be higher rate without the tax relief 5%
Others 40%
58 PQ Chris Huhne, House of Commons Hansard 31October 2005 Column 731W
14
PENSIONS POLICY INSTITUTE
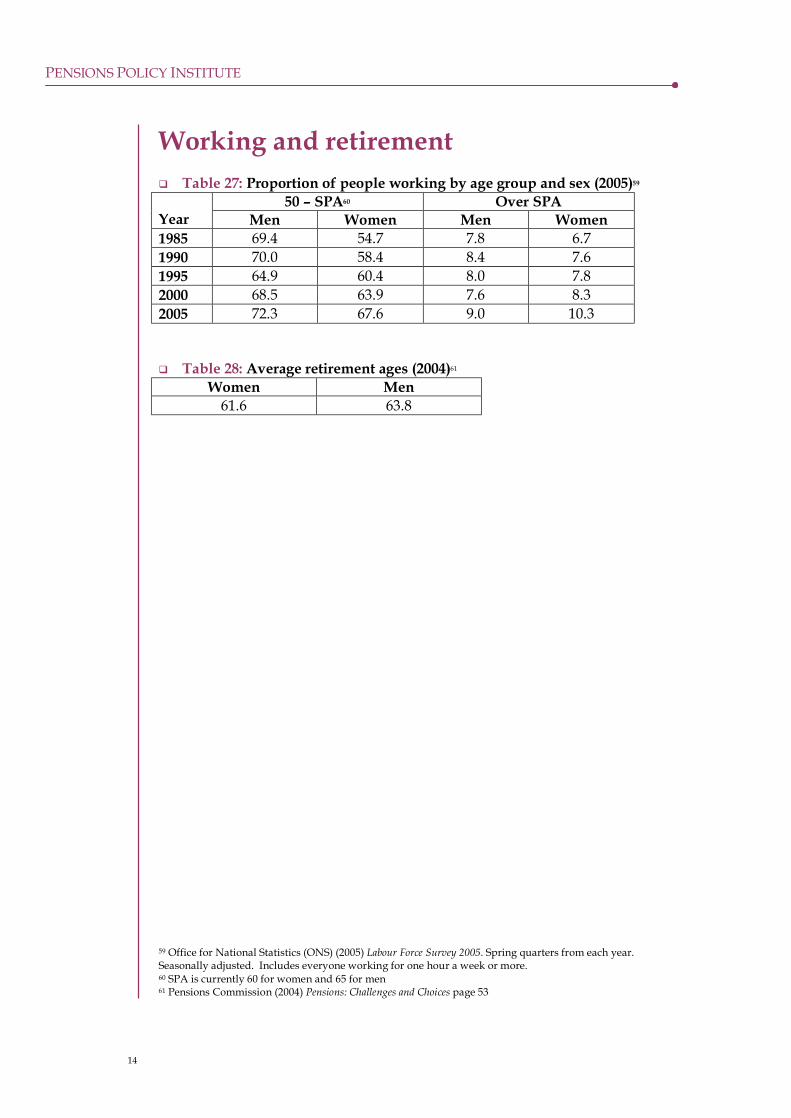
Working and retirement q Table 27: Proportion of people working by age group and sex (2005)59
50 – SPA60 Over SPA Year Men Women Men Women 1985 69.4 54.7 7.8 6.7 1990 70.0 58.4 8.4 7.6 1995 64.9 60.4 8.0 7.8 2000 68.5 63.9 7.6 8.3 2005 72.3 67.6 9.0 10.3 q Table 28: Average retirement ages (2004)61
Women Men 61.6 63.8
59 Office for National Statistics (ONS) (2005) Labour Force Survey 2005. Spring quarters from each year. Seasonally adjusted. Includes everyone working for one hour a week or more. 60 SPA is currently 60 for women and 65 for men 61 Pensions Commission (2004) Pensions: Challenges and Choices page 53

PPI Published by
PENSIONS POLICY INSTITUTE
www.pensionspolicyinstitute.org.uk