pension reform: what can the united states and australia learn from each other? by jon forman alfred...
TRANSCRIPT

Pension Reform: What Can the United States and
Australia Learn from Each Other?
by Jon FormanAlfred P. Murrah Professor of Law
University of Oklahoma
Sixth Annual Labor and Employment Law Colloquium
Los Angeles, CaliforniaSeptember 16, 2011

2
Outline
Life Cycle Model Social Security/ Age Pension Private Pension/ Superannuation Supplemental Savings

3
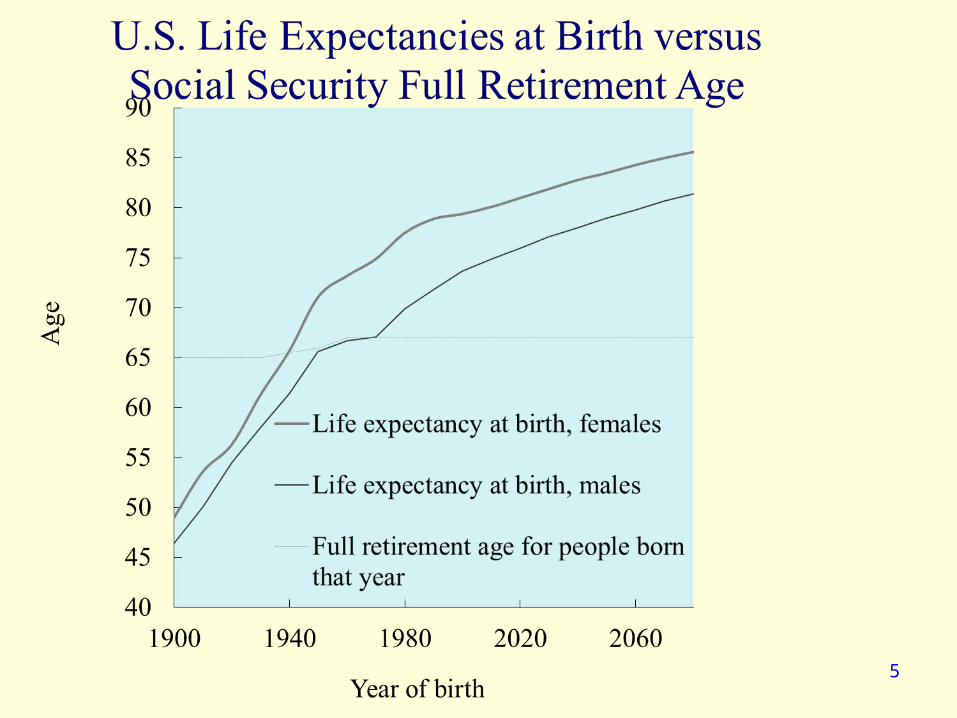
People are Living Longer:Americans
Year Life expectancy
at birth
Life expectancy
at age 65
Men Women Men Women
1960 66.7 73.2 12.9 15.9
2000 74.0 79.4 15.9 19.0
2040 79.0 82.6 18.8 20.9
2080 82.4 85.6 20.8 22.8

4
But People Are Retiring Earlier: Percentage of Workers Electing Social
Security Benefits at Various Ages
Year Age 62 Ages 63-64
Age 65 Ages 66+
Average age
1965 23.0 17.7 23.4 35.9 65.9
1975 35.7 24.5 31.1 8.7 63.9
1985 57.2 21.1 17.7 4.0 63.6
1995 58.3 19.5 16.3 6.0 63.6
2004 57.5 19.0 18.6 4.8 63.7
5

6
$
Stages of the Simple Economic Life Cycle
Birth Age Age Death 20-25 60-65
Income
Consumption

7
U.S. Social Security Social Security taxes Workers pay
6.2% of their earnings for Social Security, and 1.45% of their earnings for Hospital Insurance
under Medicare (Part A)
Employers pay an equal amount The total is 12.4% for Social Security and
2.9% for HI 20011 tax base is $106,800 in 2011
Social Security Administration, 2009 Social Security Changes, http://www.socialsecurity.gov/OACT/COLA/cbb.html.

8
Worker Benefits
Workers over 62 are eligible If they have worked 10 years
Benefits are based on a workers earnings history Career-average earnings Average Indexed Monthly Earnings (AIME)
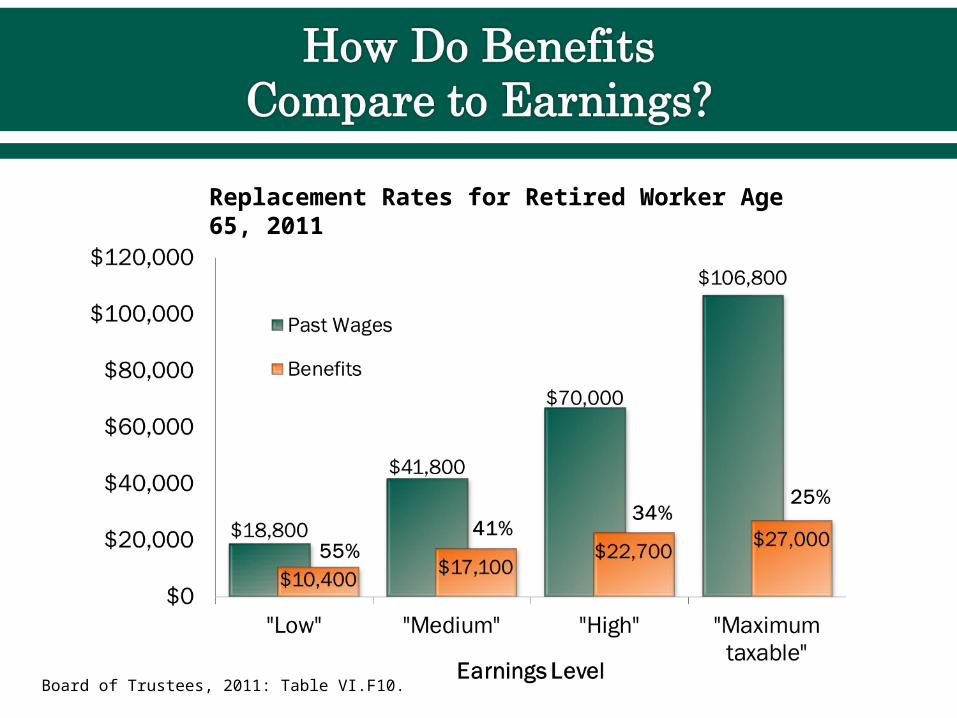
Board of Trustees, 2011: Table VI.F10.
Replacement Rates for Retired Worker Age 65, 2011

90% of people 65 and older get Social Security.
Nearly 2 in 3 (64%) get half or more of their income from Social Security.
About 1 in 3 get almost all (90% or more) of their income from Social Security.
10SSA, 2010a: Table 9.A1.

Ruffing and Van de Water, 2011.
Medium Earner’s Replacement Rate at 65 After Medicare Parts B and D Premiums
11

The Australian Age Pension
funded from general revenues 2011, a maximum of $670.90 every
fortnight for singles and $1,011.40 for couples
The single benefit is designed to provide about 25% of average male earnings
Benefits are reduced by both an asset test and an income test
12

13
Two Basic Types of Pensions
Defined benefit plans Defined contribution plans

14
What is a Defined Benefit Plan?
Employer promises employees a specific benefit at retirement
To provide that benefit, the employer makes payments into a trust fund and makes withdrawals from the trust fund
Employer contributions are based on actuarial valuations

15
Defined Benefit Plan
Employer bears all of the investment risks and responsibilities
Typical plan provides each worker with a specific annual retirement benefit that is tied to the worker’s final average pay and number of years of service

16
Defined Benefit Plan
For example, a plan might provide that a worker’s annual retirement benefit is equal to 2% times years of service, times final average pay
B = 2% × yos × fap Final-average-pay formula

17
Defined Benefit Plan Worker with 30 years of service would
receive 60 percent of her pre-retirement earnings
Worker earning $50,000 would get $30,000-a-year pension B = $30,000 = 60% × $50,000 = 60% × fap = 2 percent × 30 yos × $50,000 fap

18
What is a Defined Contribution Plan?
Individual account plan Employer typically contributes a
specified percentage of the worker’s pay to an individual investment account for the worker
Owned by employee Benefits based on contributions and
investment earnings

Defined Contribution Plans: How Individual Retirement Savings Accounts Work
19
CONTRIBUTIONS
FUND BENEFITS
EARNINGS

20
Defined Contribution Plan
For example, employer might contribute 10% of annual pay
Under such a plan, a worker who earned $30,000 in a given year would have $3,000 contributed to her account $3,000 = 10% × $30,000
Benefit at retirement based on contributions, plus earnings

21
Australia: A Universal Pension
1986—industrial agreements for 3 percent of payroll contributions
1992/1993—superannuation guarantee legislation, mandating 3 percent contributions to individual retirement accounts Higher levels phased in, reaching 9
percent in 2002/2003

Tax Treatment of a Typical Individual Account in Australia – tte
22
CONTRIBUTIONS
FUND BENEFITS
EARNINGS
15% TAX 15% TAX ZERO TAX (payable by the fund) (from age 60)

23
IMPROVING NATIONAL SAVINGS AND SUPERANNUATION ADEQUACY
The Government will increase the superannuation guarantee (SG) rate from 9 to 12 per cent over time.

24
Superannuation GOVERNMENT CONTRIBUTIONS FOR
LOW INCOME EARNERS A new superannuation contribution of up to
$500 will be provided by the Government for workers with income up to $37,000.
CATCH-UP CONTRIBUTIONS FOR OLDER WORKERS The Government will allow individuals aged
50 and over with total superannuation balances below $500,000 to make up to $50,000 in concessional superannuation contributions.

Most elderly don’t receive pensions in the U.S.
Percent with Employer-Sponsored Pensions
All age 65+ 41%Couples 51%Unmarried men 42%Unmarried women 34%
25Social Security Finances: A Primer , at 10.

Tax Treatment of a Typical Individual Account in the U.S. – eet
26
CONTRIBUTIONS
FUND BENEFITS
EARNINGS
ZERO TAX ZERO TAX TAX
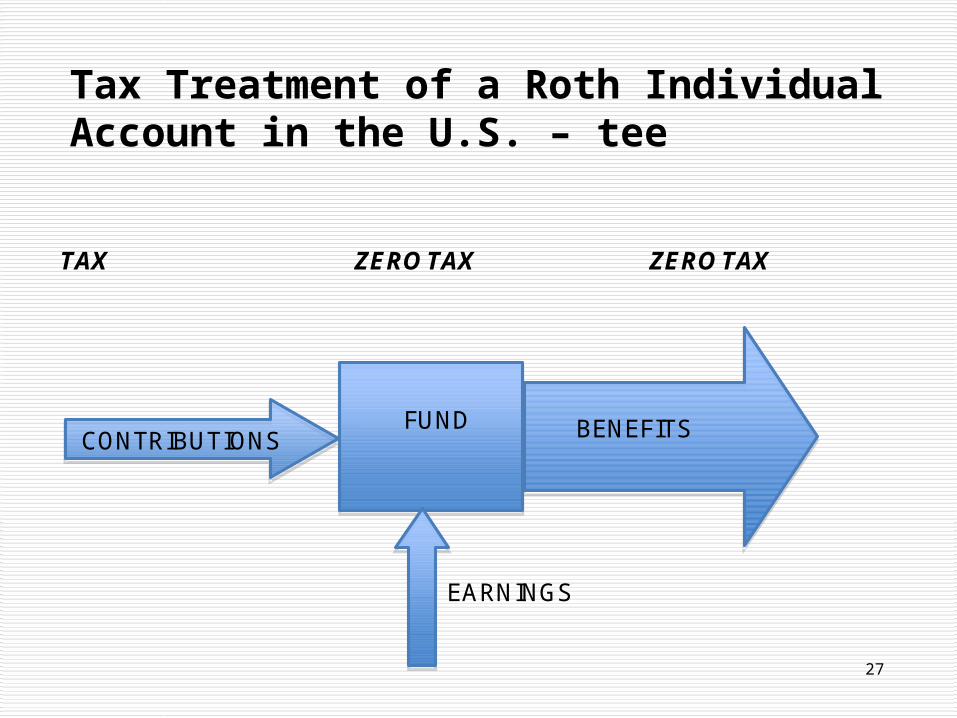
Tax Treatment of a Roth Individual Account in the U.S. – tee
27
CONTRIBUTIONS
FUND BENEFITS
EARNINGS
TAX ZERO TAX ZERO TAX

28
Goals for a Pension Plan First, ensure that every employee
earns a meaningful retirement benefit and that long-time employees are
guaranteed an adequate income throughout their retirement years
Second, have a minimum of work disincentives for employees coming in and out of service
Third, be affordable and well-financed

Optimal Policies for Maximizing Retirement Income
Contributions Accumulation Pay-out (Decumulation)
29

Contributions
Voluntary v. Mandatory Encourage Saving More
Tax incentives? Limits?
Defaults
30

Accumulation
Fiduciary Duties Diversification and Investments Fees
31

Pay-out (decumulation)
Encourage working longer Encourage saving more Encourage life-time income options
Targeted Withdrawals Annuities
32

Preretirement Earnings Replacement Rates, 2011
Source of replacement rate income
Low earners’replacement
rate
High earners’
replacement rate
Social Security 55.2 33.9
Replacement rate needed from other sources to achieve 75 percent replacement rate
19.8 41.1
33


35https://guidance.fidelity.com/living-in-retirement/annual-portfolio-withdrawals?ref_ls=lr3007.


Policy Options
Encourage sponsors to offer a default annuity Require Sponsors to Provide an Estimate
of Lifetime Annuity Income on Benefit Statements
Improve Individuals’ Understanding about Retirement Income
37

About the Author Jonathan Barry Forman (“Jon”) is the Alfred P.
Murrah Professor of Law at the University of Oklahoma College of Law, teaching tax and pension law and the author of Making America Work (Washington, DC: Urban Institute Press, 2006). He was the Professor in Residence at the Internal Revenue Service Office of Chief Counsel for the 2009-2010 academic year.
Jon can be reached at [email protected];www.law.ou.edu/faculty/forman.shtml.
3838