people and corruption: africa survey 2015allafrica.com/download/resource/main/main/idatcs/... ·...
TRANSCRIPT

PEOPLE AND CORRUPTION:AFRICA SURVEY 2015Global Corruption Barometer

Afrobarometer is a pan-African, non-partisan research network that conducts public attitude surveys on democracy, governance, economic conditions, and related issues across more than 30 countries in Africa.
Afrobarometer surveys are implemented by national partners in surveyed countries, with coordination by the Center for Democratic Development (CDD) in Ghana, the Institute for Justice and Reconciliation (IJR) in South Africa, the Institute for Development Studies (IDS) at the University of Nairobi in Kenya, and the Institute for Empirical Research in Political Economy (IREEP) in Benin. Michigan State University (MSU) and the University of Cape Town (UCT) provide technical support to the network.
Afrobarometer publications from six survey rounds (1999-2015) are available at www.afrobarometer.org. To explore data on any survey question from any round, please visit Afrobarometer’s online data analysis facility at www.afrobarometer.org/online-data-analysis.
Author: Coralie Pring, Research Coordinator, Global SurveysISBN: 978-3-943497-93-9© 2015 Transparency International. All rights reserved.
Printed on 100% recycled paper.Infographic design: Sophie Everett © Cover photo: iStock/Peeter Viisimaa
Every effort has been made to verify the accuracy of the information contained in this report. All information was believed to be correct as of November 2015. Nevertheless, Transparency International cannot accept responsibility for the consequences of its use for other purposes or in other contexts.Donor logo
Transparency International is a global movement with one vision: a world in which government, business, civil society and the daily lives of people are free of corruption. With more than 100 chapters worldwide and an international secretariat in Berlin, we are leading the fight against corruption to turn this vision into reality.
www.transparency.org

TABLE OF CONTENTS
EXECUTIVE SUMMARY ............................................................................................................................. 2
KEY FINDINGS ........................................................................................................................................ 3 RECOMMENDATIONS ............................................................................................................................ 4
THE STATE OF CORRUPTION IN AFRICA – CITIZENS’ VIEWS ............................................................. 5 UP OR DOWN? HOW IS THE LEVEL OF NATIONAL CORRUPTION SEEN AS CHANGING OVER TIME? ....................................................................................................................................................... 5 POLITICIANS, PUBLIC OFFICIALS OR BUSINESS EXECUTIVES – WHO IS SEEN AS MOST CORRUPT? .............................................................................................................................................. 8 DOING WELL OR DOING BADLY? HOW AFRICANS RATE THEIR GOVERNMENTS’ ANTI-CORRUPTION EFFORTS ........................................................................................................................ 9
BRIBERY– WHAT SERVICES DO AFRICANS PAY BRIBES FOR? ...................................................... 12 HOW MANY PEOPLE PAID BRIBES? .................................................................................................. 12 WHAT SERVICES ARE AFFECTED BY BRIBERY? ............................................................................. 17
PEOPLE’S ACTIONS – HOW AFRICANS WANT TO STOP CORRUPTION .......................................... 21 CAN PEOPLE MAKE A DIFFERENCE? ................................................................................................ 21 HOW PEOPLE CAN STOP CORRUPTION ........................................................................................... 22
CONCLUSION – HOW AFRICAN COUNTRIES MEASURE UP .............................................................. 25
METHODOLOGY ....................................................................................................................................... 28 CITIZEN’S CORRUPTION SCORECARD RATINGS ............................................................................ 29
QUESTIONNAIRE ..................................................................................................................................... 32
FULL DATA TABLES ................................................................................................................................ 35
ACKNOWLEDGEMENTS .......................................................................................................................... 45
END NOTES .............................................................................................................................................. 46

2 TRANSPARENCY INTERNATIONAL
EXECUTIVE SUMMARY
In many countries you can pay off police officers to ignore any crime, however horrific and devastating – it’s just a matter of price. In Zimbabwe a nine-year old girl was raped on her way to school by a man who infected her with HIV. The police initially arrested her attacker, but then released him in secret. The reason: he paid a bribe. At Transparency International we hear stories like this every day.
That is why we publish research on what people say are the biggest sources of corruption in their lives, so that we can raise awareness of the scale of graft and to drive anti-corruption work to stop it. For the latest African edition of the Global Corruption Barometer, we partnered with the Afrobarometer, which spoke to 43,143 respondents across 28 countries in Sub-Saharan Africa between March 2014 and September 2015 to ask them about their experiences and perceptions of corruption in their country.1
Shockingly, we estimate that nearly 75 million people2 have paid a bribe in the past year – some of these to escape punishment by the police or courts, but many also forced to pay to get access to the basic services that they desperately need. A majority of Africans3 perceive corruption to be on the rise and think that their government is failing in its efforts to fight corruption; and many also feel disempowered as regards to taking action against corruption. In Sierra Leone, Nigeria, Liberia and Ghanai citizens are the most negative about the scale of corruption in their country.
However, the results also highlight that there are a small number of countries in the region that are seen as doing quite well in addressing the scourge of corruption – where only a few people have to pay bribes or where citizens feel that they can contribute to stopping corruption. Citizens in Botswana, Lesotho, Senegal and Burkina Faso tend to have the most positive views compared with citizens from other countries in the region.
The main finding of this report is that there is a clear disparity between a few strong performing countries in regard to anti-corruption and the many weak performers on anti-corruption across the continent. This finding contains both a hopeful message, that addressing corruption is indeed possible, as well as a disappointing message, as most African countries have failed to make headway in stemming the tide of corruption. As corruption can be a major hindrance for development and economic growth, and as it weakens people’s trust in government and the accountability of public institutions, this report calls on governments to act against the corruption which exists in their country.
1 The Afrobarometer conducted the survey in 36 countries in total across the Africa region. Only the results from the following Sub-Saharan African countries are included in this report: Benin, Botswana, Burkina Faso, Burundi, Cameroon, Cape Verde, Cote d’Ivoire, Ghana, Guinea, Kenya, Lesotho, Liberia, Madagascar, Malawi, Mali, Mauritius, Namibia, Niger, Nigeria, Senegal, Sierra Leone, South Africa, Swaziland, Tanzania, Togo, Uganda, Zambia and Zimbabwe. Results from North African countries will be included in a separate Middle East and North Africa report and results from three Sub-Saharan African countries – Mozambique, Gabon and São Tomé and Príncipe – had not been finalised when this report was being published but will be included in subsequent global releases of the results. The survey was carried out face to face. In each country the survey was sampled and weighted to be nationally representative of the adult population aged 18+. A full description of the methodology is contained in the annex. 2 This estimate is made based on the approximate total number of adults aged 18+ living in each of the surveyed countries according to the most recent census or other available population data. See methodology for full details. 3 For the sake of readability, we use the terms “Africans” or “Africa” or “continent” even though the report includes only Sub-Saharan countries.

3 PEOPLE AND CORRUPTION: AFRICA SURVEY 2015
GLOBAL CORRUPTION BAROMETER
KEY FINDINGS The main findings of this report are as follows:
1. CORRUPTION SEEN TO BE ON THE RISE The majority of Africans (58%) say that corruption has increased over the past year. This is particularly the case in South Africa where more than four-in-five citizens (83%) say they have seen corruption rise recently.
2. MOST GOVERNMENTS ARE FAILING TO MEET CITIZENS’ EXPECTATIONS IN REGARD TO FIGHTING CORRUPTION There is no government which is rated positively on its anti-corruption efforts by a clear majority of its citizens. On the contrary, 18 out of 28 governments are seen as fully failing to address corruption by a large majority.
3. POLICE AND PRIVATE SECTOR PERCEIVED AS MOST CORRUPT The survey asked how much corruption there was in 10 key institutions and groups in society. Across the region, the police and business executives are seen to have the highest levels of corruption. While the police have regularly been rated as highly corrupt, the strongly negative assessment of business executives is new compared to previous Transparency International Global Corruption Barometer (GCB) survey rounds.ii
4. BRIBERY AFFECTS MORE THAN ONE-IN-FIVE AFRICANSiii, AND
DISPROPORTIONALLY AFFECTS THE POOR IN URBAN AREAS 22 per cent of people that have come into contact with a public service in the past 12 months in Sub-Saharan Africa have paid a bribe, but the situation is worst in Liberia where nearly seven-in-ten paid a bribe. Across the continent, poor people are twice as likely as rich people to have paid a bribe, and in urban areas they are even more likely to pay bribes.iv
5. POLICE AND THE COURTS HAVE THE HIGHEST RATE OF BRIBERY
Out of six key public services, people who come into contact with the police and the courts are the most likely to have paid a bribe. This is consistent with previous Transparency International surveys and highlights the lack of progress made in addressing bribery in these two institutions, which are crucial for citizen security and the rule of law.
6. MANY PEOPLE FEEL UNABLE TO CONTRIBUTE TO HELPING FIGHT CORRUPTION
People in the region are divided as to whether ordinary people can make a difference in the fight against corruption – just over half of people think that they can (53 per cent), while 38 per cent think they cannot. Reporting incidences when they occur, or saying no when asked to pay a bribe, are seen as the most effective things people can do. However, only roughly one-in-ten people who paid a bribe actually reported it.
7. DESPITE THIS, TURNING BACK CORRUPTION IS POSSIBLE
There are a few countries in which citizens see low levels of corruption in their public institutions and see corruption as on the wane in their own country. The views of citizens in Botswana, Lesotho, Senegal and Burkina Faso are particularly favourable.

4 TRANSPARENCY INTERNATIONAL
RECOMMENDATIONS CORRUPTION SEEN TO BE ON THE RISE
• Governments must finally deliver on their anti-corruption commitments made globally (the UN Convention against Corruption) and regionally (the African Union Convention on Combating Corruption).
• UN Convention signatory countries must actively support and use the results of the next Convention review cycle, which will look at related policies to prevent corruption and support asset recovery.
• The African Union and its members must provide the political will and financing needed to implement the review mechanism established for its anti-corruption convention.
MOST GOVERNMENTS ARE FAILING TO MEET CITIZENS’ EXPECTATIONS IN REGARD TO FIGHTING CORRUPTION
• Governments must end impunity in their countries – whether in government, companies or organisations – by effectively investigating and prosecuting cases and eliminating the abuse of political immunity.
• Governments must strengthen and enforce legislation on politically-exposed persons and anti-money laundering to curb the high volume of illicit flows from the continent.
• Governments must end the secrecy around who owns and controls companies and other arrangements which enable collusion, self-dealing or deception in government processes, such as procurement.
POLICE AND PRIVATE SECTOR PERCEIVED AS MOST CORRUPT
• Governments must show a sustained and deep commitment to acting on police corruption at all levels by promoting reforms that combine punitive measures with structural changes over the short- and medium-term.v
• Companies need to transparently report their operations, activities and revenues on a country-by-country basis to build public trust and dispel perceptions of corruption.
BRIBERY AFFECTS MORE THAN ONE-IN-FIVE AFRICANS, AND DISPROPORTIONALLY AFFECTS THE POOR IN URBAN AREAS
• Governments must effectively include anti-corruption measures and metrics as part of implementing and tracking progress on their Sustainable Development Goals (SDGs) strategies.
POLICE AND THE COURTS HAVE THE HIGHEST RATE OF BRIBERY
• Governments must invest in measures to strengthen access to justice and the rule of law in their countries, such as ensuring an objective and transparent process for appointing judges, protections for judicial salaries and working conditions, and clear criteria for case assignment.
MANY PEOPLE FEEL UNABLE TO CONTRIBUTE TO HELPING FIGHT CORRUPTION
• Governments must create safe and effective conditions for the involvement of civil society in anti-corruption efforts, including their de jure and de facto operational and physical freedom.
• Governments must establish right to information and whistle-blower protection legislation to facilitate the role of civil society in making public institutions more transparent, accountable and corruption-free.

5 PEOPLE AND CORRUPTION: AFRICA SURVEY 2015
GLOBAL CORRUPTION BAROMETER
THE STATE OF CORRUPTION IN AFRICA – CITIZENS’ VIEWS
The Global Corruption Barometer seeks to put citizens’ views front and centre in the corruption debate, and to make governments aware of what their citizens think of their actions in regard to fighting corruption. The survey, which was conducted by the Afrobarometer, found that while many Africans view corruption as being on the rise in their own country, and believe their government is not doing well in tackling the issue, there are a small number of countries that are seen to be quite effective in addressing public sector graft.
UP OR DOWN? HOW IS THE LEVEL OF NATIONAL CORRUPTION SEEN AS CHANGING OVER TIME? The survey asked people how they thought corruption in their country had changed over the past year4 – whether it had increased, decreased or stayed the same – so that we could identify the corruption trend across the continent.
Across the region the survey found that the majority of citizens believe that corruption is on the rise. Over half of people (58 per cent) say that they think corruption has increased either somewhat or a great deal over the past year in their own country, while just under a quarter (22 per cent) think that it has decreased, and just 14 per cent think that it has stayed the same.
When comparing the results of the different countries that were surveyed, people living in South Africa, Ghana and Nigeriavi were the most likely to say that they think corruption has risen in the 12 months prior to when the survey was conducted. In these countries three-quarters or more of respondents said corruption has increased either somewhat or a lot. The three countries which had the smallest proportion of citizens saying corruption has risen were Burkina Faso, Cote D’Ivoire and Mali – less than one-third of respondents answered that corruption has increased in the past 12 months.
4 Respondents were asked “has the level of corruption in this country increased, decreased, or stayed the same?” in the 12 months prior to when the respondent took the survey. For a full list of fieldwork dates for each country, please see the annex.

HOW CITIZENS IN SUB-SAHARAN AFRICA THINK CORRUPTION HAS CHANGED OVER THE LAST 12 MONTHS
3 BEST PERFORMERS 3 WORST PERFORMERS
South Africa
Ghana
Nigeria
Burkina Faso
Mali
Cote D’Ivoire
0-20
20-40
40-60
60-80
80+
Cape Verde
Lowest percentage saying corruption has increased Highest percentage saying corruption has increased
…of people in Africa think corruption
has stayed the same
14% 22%
…of people in Africa think corruption has decreased
58%
…of people in Africa think corruption has increased
83%
76%
28%
31%
32% 75%

Q: In your opinion, over the past year, has the level of corruption in this country increased, decreased, or stayed the same? % who say corruption had either increased somewhat or increased a lot.
0-20
20-40
40-60
60-80
80+
Mali Niger
Nigeria
Cameroon
Burkina Faso
Senegal
Guinea
Sierra Leone
Liberia
Cote d’Ivoire
Ghana
Togo BeninUganda
Kenya
Tanzania
Burundi
ZambiaMalawi
MadagascarNamibia
Zimbabwe
Botswana
South Africa
Swaziland
Lesotho
Mauritius
0-20%
20-40%
40-60%
60-80%
80%+
The percentage of people who say corruption has increased a lot or somewhat over the past 12 months.

8 TRANSPARENCY INTERNATIONAL
POLITICIANS, PUBLIC OFFICIALS OR BUSINESS EXECUTIVES – WHO IS SEEN AS MOST CORRUPT? The survey asked respondents how much corruption there was in 10 different powerful groups in their country – the political and government elite (the president’s office, members of parliament, government officials), public officials who work at the service level (tax officials, the police, judges and magistrates, local government councillors), and those who are not part of the public sector but who often wield strong influence (business executives, religious leaders and traditional leaders).
Looking at the results from across the region, the police are seen as the most corrupt group across the region, which is consistent with previous editions of the GCB. Almost half of respondents (47 per cent) say that they thought either most or all police officers are corrupt. The police are followed by business executives, which are seen as the second most corrupt group (42 per cent say most or all business executives are corrupt).
Government officials and tax officials rank as the third and fourth most corrupt groups (38 per cent and 37 per cent respectively). Judges and magistrates, members of parliament, local government councillors and the office of the presidency all score similarly, with around a third of people saying they are affected by high levels of corruption (between 31 and 34 per cent).
Traditional leaders and religious leaders are seen to be the least affected by corruption in the region, although 21 per cent and 15 per cent, respectively, say that most or all of these leaders are corrupt.
FIGURE 1. HOW CORRUPT ARE DIFFERENT INSTITUTIONS AND GROUPS IN SOCIETY?
Q. How many of the following people do you think are involved in corruption, or haven’t you heard enough about them to say? Base: All respondents, excluding missing responses. Chart shows percentage of respondents who answered either ‘Most’ or ‘All of them’ are corrupt.
When looking at the results from each country, large proportions of citizens in Benin, Ghana, Liberia, Nigeria and Sierra Leone think that their public sector institutions are affected by high levels of
15%
21%
31%
33%
33%
34%
37%
38%
42%
47%
0% 5% 10% 15% 20% 25% 30% 35% 40% 45% 50%
Religious leaders
Traditional leaders
Office of the presidency
Local government councillors
Members of parliament
Judges and magistrates
Tax officials
Government officials
Business executives
Police

9 PEOPLE AND CORRUPTION: AFRICA SURVEY 2015
GLOBAL CORRUPTION BAROMETER
corruption. In these countries, on average across each of the public sector groups,5 half of the population or more said that they thought most or all are corrupt.
In contrast, citizens in Botswana, Cape Verde, Lesotho, Mauritius and Senegal perceive there to be very low levels of corruption in the public sector institutions. On average, less than a quarter of respondents said that most or all officials in these public sector institutions are corrupt.
DOING WELL OR DOING BADLY? HOW AFRICANS RATE THEIR GOVERNMENTS’ ANTI-CORRUPTION EFFORTS Understanding how ordinary people think their government is doing in regard to addressing corruption allows us to assess whether governments are perceived to be making the right steps and if they are communicating these efforts effectively to their citizens.
Across the region the majority of people (64 per cent) think their government is doing a poor job at handling corruption, suggesting greater efforts need to be taken by governments to clean up the public sector and to punish officials for their corrupt actions. Only a third of people (32 per cent) think that their government was doing either fairly or very well at fighting corruption.
Looking specifically at the country-level results, few governments were rated as doing particularly well at cleaning up government. In only three countries did a slightly greater proportion of citizens
5 The public sector groups refer to the president’s office, members of parliament, government officials, tax officials, the police, judges and magistrates and local government councillors. We took a simple average across these seven institutions of the percentage of respondents who said most or all of them are corrupt. See the full tables of results in the annex.
Anti-corruption progress in Senegal
Since President Macky Sall came into office in Senegal in 2012 the country has passed a number of positive anti-corruption reforms, which may have contributed to Senegalese citizens being among some of the most positive in the region – with many saying corruption is on the decline, and people perceiving low levels of corruption across the public sector.
A Ministry for the “Promotion of Good Governance Responsible for Relations with the Institutions” has been created to promote good governance across various government institutions and in the private sector. A National Office for the Fight against Fraud and Corruption has also been established.vii Subsequently, in July 2013 the Government adopted a National Strategy on Good Governance to improve the functioning of government and to improve transparency.viii A national law was also passed in April 2014 which requires elected officials to declare their assets.ix
More recently, there have been signs of effective enforcement of the law: in March 2015 Karim Wade, former cabinet minister and son of former President Abdoulaye Wade, was tried and convicted of illicit enrichment and sentenced to six years’ imprisonment.x

10 TRANSPARENCY INTERNATIONAL
say that their government was doing well than said they were doing badly – Botswana, Lesotho and Senegal. 6
Many governments received very poor ratings on their achievements in stopping corruption but citizens in Madagascar were the most critical, with nine-in-ten (90 per cent) saying their government is doing either fairly or very badly. This result may in part be due to the revelation that as much as 40 per cent of the country's budget is lost to corruption.xi In Benin, Liberia, Nigeria, South Africa and Zimbabwe people think poorly of their governments’ anti-corruption efforts with around four-in-five saying that their government is doing badly.
6 In Botswana 54% answered well, 42% badly; Lesotho 47% well, 41% badly; Senegal 47% well, 46% badly

11 PEOPLE AND CORRUPTION: AFRICA SURVEY 2015
GLOBAL CORRUPTION BAROMETER
FIGURE 2: IS THE GOVERNMENT DOING WELL OR BADLY IN FIGHTING CORRUPTION
Q. How well or badly would you say the current government is handling the following matters, or haven’t you heard enough to say? “Fighting corruption in government”. Base: all respondents, excluding missing responses.
41%
42%
46%
47%
48%
49%
53%
56%
57%
58%
61%
61%
61%
62%
65%
68%
69%
69%
69%
70%
71%
71%
78%
79%
79%
80%
81%
90%
47%
54%
47%
46%
48%
45%
44%
43%
37%
37%
31%
33%
23%
32%
34%
29%
26%
19%
28%
27%
25%
25%
22%
20%
19%
17%
18%
9%
0% 10% 20% 30% 40% 50% 60% 70% 80% 90% 100%
Lesotho
Botswana
Senegal
Niger
Swaziland
Burkina Faso
Cote d'Ivoire
Mali
Cameroon
Tanzania
Togo
Guinea
Cape Verde
Zambia
Namibia
Burundi
Uganda
Sierra Leone
Malawi
Kenya
Mauritius
Ghana
Nigeria
South Africa
Benin
Zimbabwe
Liberia
Madagascar
Badly Well

12 TRANSPARENCY INTERNATIONAL
BRIBERY– WHAT SERVICES DO AFRICANS PAY BRIBES FOR?
Through their contact with public services citizens are being exposed to corruption risks in their daily lives. Nearly 75 million people across the region are estimated to have paid a bribe during the last 12 months but in some countries bribery is far more rampant than in others. Unfortunately it is those who are meant to be upholding the law – the police and courts – who seem to be the most likely to be involved in bribery, and those who are the poorest in society who are the most likely to have to pay.
HOW MANY PEOPLE PAID BRIBES? The survey asked people whether they had come into contact with six key public services – public schools, public healthcare, the police, courts, for official documents or for utilities – in the previous 12 months. For those who had come into contact with these services, they were asked whether they had paid a bribe, given a gift or provided a favour in order to get the services they needed.7
The results show that while there is a big problem with bribery in the region, it is not an endemic feature across the continent, with a small number of countries reporting very low rates of bribery.8
Across the region 22 per cent of people who came into contact with at least one of the six public services in the past 12 months admitted that they paid a bribe. When extrapolating the proportion of bribe payers in each of the surveyed countries to their entire adult population, this suggests that nearly 75 million Africans have paid a bribe. Many people pay bribes on numerous occasions for their public services, making this practice even more of a burden on citizens: the majority of bribe-payers (62 per cent) told us that they have paid bribes multiple times over the past year, either for the same public service or for different services.
However, the risk of having to pay a bribe varies tremendously by country. Liberia has by far the highest rate of bribery of the countries that were surveyed, with 69 per cent of people who came into contact with at least one of these six services having paid a bribe in the past year. This is followed
7 The overall contact rates for each service were: public schools 42%, public healthcare 63%, the police 22%, courts 11%, for official documents 45% and for utilities 21%. 78% of the respondents said that they had come into contact with at least one of the six services. Bribery rates are based on those who had come into contact with at least one of the six services, excluding those who have missing data for all six bribery questions (weighted n= 26,310). 8 For the sake of readability we use the term “bribe” to refer to those who said that they paid a bribe, gave a gift or did a favour for a public service. It is important to note that questionnaire changes for the Global Corruption Barometer bribery question means that the results for previous Global Corruption Barometer surveys cannot be compared with the findings presented here. The question was changed from asking about household to individual bribe payments, and from any service provider to only services provided by the government. Afrobarometer question wording has also changed to more carefully screen for contact before asking about bribe payments, so the results should also not be compared with previous rounds of the Afrobarometer.

13 PEOPLE AND CORRUPTION: AFRICA SURVEY 2015
GLOBAL CORRUPTION BAROMETER
by Cameroon, Nigeria and Sierra Leone which were found to have high bribery rates of between 41 and 48 per cent. Cote d’Ivoire, Ghana, Guinea, Kenya and Uganda also have bribery rates that are far higher than the regional average.
Botswana, Mauritius and Cape Verde have the lowest bribery rates in the region, being on a par with low bribery rate countries on other continents (such as in Europe or the USA).xii Lesotho, Senegal, Swaziland, Namibia and South Africa also have bribery rates that are far lower than the average for the region with less than one-in-ten saying that they paid a bribe. This demonstrates that in a sizeable number of African countries, governments, the public sector and often also vigilant citizens have been able to successfully prevent this problem from significantly affecting public services on an endemic scale. Learning from these countries’ experiences of tackling bribery is key for developing effective anti-bribery approaches that are suitable for the African region.
Corruption and the Ebola crisis
From March 2014 to November 2015, around 11,300 people have died from the Ebola outbreak.xiii The West African countries Liberia and Sierra Leone were the worst hit. With studies showing that corruption contributed to the slow and weak government responses to the crisis, tackling the rampant corruption should be considered a priority, to ensure that services can better handle such crises in the future.
The survey found that in both of these countries there are very high bribery rates and the public sector is perceived to be affected by extensive levels of corruption compared with many other countries in the region. High levels of corruption may have hampered these countries’ responses to the Ebola crisis by illicitly diverting resources away from essential healthcare services in the years preceding the crisis. Relief funds which were dispersed to halt the spread of Ebola may also have been mismanaged, as found in an internal audit report released by the Sierra Leonean Auditor General in February 2015.xiv
There have also been some claims that Liberians were so distrustful of their government that they believed reports about Ebola had been fabricated to enable government employees to enrich themselves from aid from foreign donors and to embezzle funds from the World Health Organisation. This may have caused critical delays in the first response to the crisis.xv

14 TRANSPARENCY INTERNATIONAL
FIGURE 3. HOW MANY PUBLIC SERVICE USERS PAID A BRIBE IN THE PAST 12 MONTHS?
Q. And how often, if ever, did you have to pay a bribe, give a gift, or provide a favour for A. A teacher or school official? B. A health worker or clinic or hospital staff? C. A government official in order to get the document? D. A government official in order to receive the [utilities] services? E. A police officer? F. A judge or court official? Base for the total bribery rate: respondents who had contact with at least one of the six public services in the past 12 months, excluding those who have missing information for all six bribery questions. The percentages presented are for those who said that they had paid a bribe at least once to at least one of the six services.
The following infographic summarises the key socio-demographic results of bribe payers. Those who have not come into contract with any of the six public services has been excluded from the analysis.
[VALUE] [VALUE] [VALUE]
5% 7% 7%
8% 9%
10% 11%
13% 14%
16% 17% 18%
22% 22%
25% 26% 26%
34% 35% 36% 37% 38%
41% 43%
48% 69%
0% 10% 20% 30% 40% 50% 60% 70% 80% 90% 100%
Mauritius Botswana
Cape Verde Lesotho
South Africa Namibia Senegal
Swaziland Niger
Burkina Faso Malawi
Burundi Madagascar
Zambia Mali
Zimbabwe Regional average
Tanzania Togo
Benin Cote d'Ivoire
Guinea Ghana Kenya
Uganda Sierra Leone
Nigeria Cameroon
Liberia
1%1%2%

15 PEOPLE AND CORRUPTION: AFRICA SURVEY 2015
GLOBAL CORRUPTION BAROMETER
WHO HAS TO PAY BRIBES?
Across Sub-Saharan Africa, in the past 12 months, 22% of public service users have paid a bribe, which is equivalent to nearly 75 million people.
People younger than 55 years are more likely to pay a bribe for public services.
YOUNG VS. OLD
Males make up the majority of bribe payers.
MALE VS FEMALE
23% 13%
OF PEOPLE AGED UNDER 55
OF PEOPLE AGED 55+
57% OF BRIBE PAYERS ARE MALE
43% OF BRIBE PAYERS ARE FEMALE

16 TRANSPARENCY INTERNATIONAL
BRIBERY AFFECTS THE POOREST MOST
14%20% 24% 28%
PAID A BRIBE
RURAL URBAN
POVERTY LEVELS
None
Low
Moderate
High
1 IN 4 OF THE POOREST PEOPLE LIV-ING IN RURAL AREAS HAD TO PAY A BRIBE.
THIS ALMOST DOUBLES IN URBAN AREAS, WITH NEARLY 2 IN 5 OF THE POOREST PEOPLE LIVING IN CITIES AND TOWN HAVING PAID A BRIBE.
URBAN VS RURAL
The poorest Africans are hit hardest by bribery: They are twice as likely as the most affluent in the region to have paid a bribe in the past 12 months.
Urban residents are more likely to have bribed: Public service users who live in cities and towns tend to be slightly more likely than rural residents to have paid a bribe.
26%20%
14% 15%24% 39%
RICHEST RICHEST
POOREST POOREST

17 PEOPLE AND CORRUPTION: AFRICA SURVEY 2015
GLOBAL CORRUPTION BAROMETER
WHAT SERVICES ARE AFFECTED BY BRIBERY? Transparency International wanted to find out which of the six key public services are particularly affected by bribery.9 As the services have different levels of usage (ranging from just 11 per cent of Africans coming into contact with the courts, up to 63 per cent for public hospitals),10 the results are based only on the responses of those who have come into contact with each service. This allows us to find out which service puts users at most risk of paying a bribe.
The survey finds a large difference in the reported bribery rates for the various public services. Bribery is most rampant in the courts and police force, with over a quarter of those who come into contact with each of these services saying that they had paid a bribe (28 and 27 per cent respectively).
When coming into contact with utilities services provided by the government (such as water and electricity) or when asking for official documents (such as ID cards and permits), nearly one-in-five Africans paid bribes (19 per cent and 18 per cent, respectively).
Schools and healthcare have the lowest bribery rates of the six services, although over one-in-ten (13 per cent and 12 per cent, respectively) of the people who came into contact with these services paid a bribe which demonstrates that this is still an unacceptable burden on many people in the region who use these essential services.
Many users of these key public services are burdened by having to pay multiple bribes every year, rather than just once or twice. This is especially the case for those who come into contact with public hospitals, public utilities, police and courts – nearly half or more of the bribe-payers for these services had to pay multiple times.
9 The bribery results are for people who came into contact with the services provided by the government, and do not account for bribes paid for private sector providers of services such as education, healthcare or utilities. 10 For full details of the contact rate per service and by country see the annex.

18 TRANSPARENCY INTERNATIONAL
FIGURE 4. SERVICE USERS WHO SAID THAT THEY HAD PAID A BRIBE
Q. And how often, if ever, did you have to pay a bribe, give a gift, or provide a favour for A. A teacher or school official; B. A health worker or clinic or hospital staff; C. A government official in order to get a document; D. A government official in order to receive the [utilities] services; E. A police officer; F. A judge or court official? Base: Respondents who had contact with each service in the past 12 months, excluding missing responses.
The following infographic shows the bribery rates for each service by country, which makes it possible to identify which services in a specific country have done well at preventing bribery and which are doing poorly. The larger the circle, the higher the bribery rate for that service.
Looking at the country-level bribery rates for the different services, the results show that all six services are comparatively clean in Botswana, Burkina Faso, Cape Verde, Lesotho, Mauritius, Namibia, Niger, Senegal and Swaziland, when compared with the regional averages. On the other hand, bribery is reported as rampant across all of the public services in Cameroon, Ghana, Guinea, Liberia, Nigeria, and Sierra Leone, where all the services have much higher bribery rates than the regional average.
14% 14% 9% 11% 8% 6%
8% 7%
6% 4% 3%
3%
6% 6%
4% 2% 2%
2%
0%
10%
20%
30%
40%
50%
Courts Police Household services
Document or permit
Public school
services
Public clinic or hospital
Once or twice A few times Often

19 PEOPLE AND CORRUPTION: AFRICA SURVEY 2015
GLOBAL CORRUPTION BAROMETER
WHAT SERVICES DO PEOPLE PAY BRIBES FOR?
0% 1-15% 16-30% 31-45% 46-60% 61%+
Bribery rate by service; percentage of service users who paid a bribe in the past 12 months.
The size of the circle corresponds to the proportion of service users who paid a bribe.
COUNTRY PUBLIC SCHOOL
PUBLIC HOSPITAL
ID, VOTER’S CARD, PERMIT UTILITIES POLICE COURTS
Regional aver-age
Benin
Botswana
Burkina Faso
Burundi
Cameroon
Cape Verde
Cote d’Ivoire
Ghana
Guinea
Kenya
Lesotho

20 TRANSPARENCY INTERNATIONAL
Q. And how often, if ever, did you have to pay a bribe, give a gift, or do a favour for A. A teacher or school official?; B. A health worker or clinic or hospital staff; C. A government official in order to get the document?; D. A government official in order to get the [Utilities] services?; E. A police officer?; F. A judge or court official?. Base: Respondents who had contact with each service in the past 12 months, excluding missing responses. An asterisk (*) denotes a service which had a base size of less than 60 respondents. These results are not shown as there are too few respondents to be considered statistically reliable.
Liberia
Madagascar
Malawi
Mali
Mauritius
Namibia
Niger
Nigeria
Senegal
Sierra Leone
South Africa
Swaziland
Tanzania
Togo
Uganda
Zambia
Zimbabwe
COUNTRY PUBLIC SCHOOL
PUBLIC HOSPITAL
ID, VOTER’S CARD, PERMIT UTILITIES POLICE COURTS

21 PEOPLE AND CORRUPTION: AFRICA SURVEY 2015
GLOBAL CORRUPTION BAROMETER
PEOPLE’S ACTIONS – HOW AFRICANS WANT TO STOP CORRUPTION
Citizens should be able to play an important role in turning the tide against corruption – either through reporting corruption when they see it, refusing to pay bribes, or demanding governments take action against the corruption that they see in their country. The survey asked people across Africa whether they think that ordinary people can indeed make a difference, and in what ways they can be most effective at preventing graft.
CAN PEOPLE MAKE A DIFFERENCE? Generally speaking, people are divided about the issue of whether or not ordinary people can make a difference in fighting corruption in their country. While just over half (53 per cent) answered in the affirmative, almost two-in-five (38 per cent) feel disempowered.
Citizens feel particularly effective as potential anti-corruption fighters in Botswana and Madagascar. In these countries 70 per cent of more say that they think that ordinary people can make a difference. The result from Madagascar is particularly interesting given that its citizens were the most critical of their government’s anti-corruption performance, which suggests that although the public perceive the authorities to be not doing enough, they still feel that they themselves could have an impact.
The public in Nigeria and Sierra Leone feel the least empowered to help fight corruption in their own countries, with less than two-in-five people agreeing that they can make a difference. People in Benin, Liberia, Niger and Zimbabwe are also very pessimistic.

22 TRANSPARENCY INTERNATIONAL
FIGURE 5. CAN ORDINARY PEOPLE MAKE A DIFFERENCE IN THE FIGHT AGAINST CORRUPTION?
Q. Please tell me whether you agree or disagree with the following statement: ordinary people can make a difference in the fight against corruption? Base: All respondents, excluding missing responses. “Don’t know”, refused and “neither” answers are not displayed, for ease of comparison.
HOW PEOPLE CAN STOP CORRUPTION The survey also asked respondents what they think would be the most effective action that people can take in fighting corruption in their own country.
Across the region, people generally think that reporting corruption incidents is the most effective action that people can take to tackle corruption (28 per cent). The second most popular action is to refuse to pay bribes, which 21 per cent of people say is the most effective action to take. All other actions were named by 5 per cent or fewer people.
32% 39%
42% 42%
42% 43%
46% 47%
49% 50%
53% 53% 53% 54% 55%
55% 55%
56% 56% 56% 58%
59% 60%
61% 64%
69% 70%
72%
0% 10% 20% 30% 40% 50% 60% 70% 80% 90% 100%
Sierra Leone Nigeria
Zimbabwe Niger Benin
Liberia Guinea Uganda Senegal
Mali Zambia
Togo Ghana
Burundi Tanzania
Cote d'Ivoire Cape Verde
South Africa Mauritius
Cameroon Kenya
Swaziland Lesotho
Burkina Faso Malawi
Namibia Madagascar
Botswana
Strongly agree Agree

23 PEOPLE AND CORRUPTION: AFRICA SURVEY 2015
GLOBAL CORRUPTION BAROMETER
Worryingly, almost a quarter of people (23 per cent) were pessimistic about the role people can play in their country in fighting corruption, saying that they thought there was nothing that they could do.
Despite the fact that reporting corruption is seen by citizens as the most effective anti-corruption action, among those who have actually paid a bribe (see previous section), only one-in-ten bribe-payers (12 per cent) said that s/he reported it. While this is a start, it indicates that much more should be done to encourage people to step forward to report graft when they experience it.
To find out what lies behind these low levels of citizen reporting, the survey asked Africans what they think is the main reason why people do not report corruption incidents. The top reasons given were: people are afraid of the consequences (35 per cent) and that it would not make a difference (14 per cent). Reasons indicating a lack of knowledge about how or where to report were collectively mentioned by more than one-in-ten (13 per cent), but reasons regarding lacking resources in terms of time or money were seen as much less relevant. Therefore, resources should be focused on protecting those who report corruption, making existing reporting mechanisms more effective, and awareness raising about how and where to report.
FIGURE 6. WHY PEOPLE DO NOT REPORT INCIDENCES OF CORRUPTION
Q. Some people say that many incidents of corruption are never reported. Based on your experience, what do you think is the main reason why many people do not report corruption when it occurs? Base: all respondents, excluding missing responses. “Other”, “Don’t know” and “refused” responses not shown.
2%
3%
3%
3%
4%
6%
6%
7%
7%
14%
35%
0% 10% 20% 30% 40% 50%
It's too expensive to report
Don't have enough time
They would implicate themselves
Too difficult to prove
Most people do report
Don't know how to report
The officials are also corrupt
Don't know where to report
Corruption is normal
It wouldn't make a difference
Afraid of the consequences

24 TRANSPARENCY INTERNATIONAL
Reporting corruption in Madagascar
In 2010 Transparency International – Initiative Madagascar set up an anti-corruption legal advice centre to provide free support to witnesses and victims of corruption. The Centre works closely with municipal governments, and in one municipality they have helped to hold to account a corrupt official who was supporting illegal logging practices.xvi
In this case a local committee initially used official reporting mechanisms to inform a forest ranger and the police that trees were being felled in the area to make charcoal without the proper permits – a practice that had cause a local spring to dry up, leaving five local villages without their main source of drinking water. However, the charcoal that was seized as evidence for the case disappeared.
The committee then turned to the anti-corruption legal advice centre, which helped support them in filing a complaint with the ministry of forestry. The forest ranger was dismissed as a result.

25 PEOPLE AND CORRUPTION: AFRICA SURVEY 2015
GLOBAL CORRUPTION BAROMETER
CONCLUSION – HOW AFRICAN COUNTRIES MEASURE UP
This report has presented the findings from the latest edition of the GCB in Africa. Transparency International partnered with the Afrobarometer, who spoke to 43,143 people in 28 countries across the Sub-Saharan African region to understand public experiences and perceptions of corruption, and to put the views of ordinary people at the centre of corruption debates.
Overall, the results present a bleak picture, with many Africans critical about the state of corruption in their country. Looking at the corruption scorecard on the next page, only a very few countries are rated green (positive) on any of the measures. Citizens across the continent clearly differ in how serious they deem the extent of the corruption challenge to be, with those in Botswana, Lesotho, Senegal and Burkina Faso giving more positive responses about the state of corruption in their country, while those in Sierra Leone, Nigeria, Liberia, and Ghana hold deeply negative views. In between these two extremes other countries are experiencing specific corruption challenges, such as high prevalence of bribery (for example in Cameroon or Cote d’Ivoire) or extremely negative assessments of the government’s anti-corruption efforts (for example in Benin, Madagascar, South Africa and Zimbabwe).
Across Africa the survey showed that it is the poorest people who are hardest hit by corruption as they are almost twice as likely to pay a bribe compared with more affluent Africans. Public sector graft presents an unacceptable burden for people who are already struggling to afford basic necessities like putting food on the table or accessing medical care. Transparency International thinks that tackling corruption and reducing poverty go hand in hand, and wants governments across the region, and in other parts of the world, to include accurate anti-corruption measures and metrics as part of implementing and tracking progress on their SDGs strategies.
The region faces a serious dilemma in ridding itself of graft, because while people told us that reporting incidents of bribery is one of the best ways to stop corruption from happening, they also told us that many people do not report bribery because they are scared of suffering retribution and think reporting mechanisms are ineffective. In order to effectively prevent corruption in the region greater efforts need to be made to protect whistleblowers from retribution, improve the effectiveness of reporting channels, and educate people about how and where they can report corruption. Transparency International’s Advocacy and Legal Advice Centres can play an important role in providing safe ways to bring the corrupt to justice.
The survey also demonstrated that many people are pessimistic about whether ordinary people can make a difference. The survey comes at a time when many countries in the region have seen a shrinking of the space in which civil society can operate and hold governments to account. It is essential that governments create safe conditions for the effective involvement of civil society in anti-corruption activities, and governments need to guarantee the operational and physical freedom of such organisations. Future editions of the survey will monitor how public attitudes respond to government efforts in improving their transparency and accountability to citizens.

26 TRANSPARENCY INTERNATIONAL
OVERVIEW OF CORRUPTION IN AFRICA – A CITIZEN SCORECARD
COUNTRY How has the level of cor-ruption changed?
How corrupt is the public sector?
How is the government doing at fighting corruption?
How many people paid a bribe?
Do people feel empowered to
fight corruption?
Mali
Mauritius
Namibia
Niger
Senegal
Swaziland
Togo
Botswana
Burkina Faso
Burundi
Cameroon
Cape Verde
Cote d’Ivoire
Lesotho

27 PEOPLE AND CORRUPTION: AFRICA SURVEY 2015
GLOBAL CORRUPTION BAROMETER
COUNTRY How has the level of cor-ruption changed?
How corrupt is the public sector?
How is the government doing at fighting corruption?
How many people paid a bribe?
Do people feel empowered to
fight corruption?
This infographic summarises the country results for five key corruption questions which were presented in this report. For each question, countries were categorised as either red, amber or green depending on how positively or negatively respondents from that country responded to the questions in the survey. Countries are ordered from those who scored the best according to their citizens to those who scored the worst. See the methodology note for the full description of how the colours are assigned.
These groupings are meant to be indicative, and regionally contextual. It is important to keep in mind that they are based on the subjective perceptions and experiences of citizens in each country rather than on an assessment against a common objective benchmark.
Negative/High
Mediocre/Medium
Positive/Low
The anti-corruption performance of the government and the country’s corruption risks are rated by citizens as:
Nigeria
Sierra Leone
South Africa
Tanzania
Uganda
Zambia
Zimbabwe
Benin
Ghana
Guinea
Kenya
Liberia
Madagascar
Malawi
28 TRANSPARENCY INTERNATIONAL
METHODOLOGY
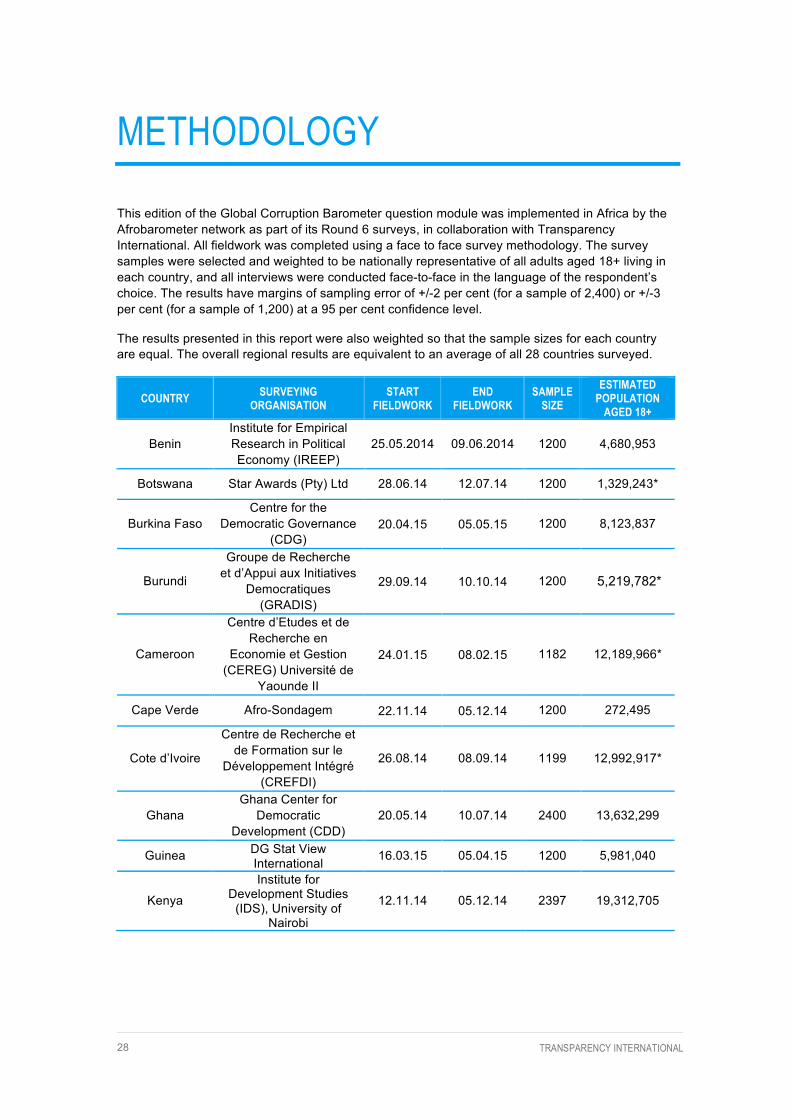
This edition of the Global Corruption Barometer question module was implemented in Africa by the Afrobarometer network as part of its Round 6 surveys, in collaboration with Transparency International. All fieldwork was completed using a face to face survey methodology. The survey samples were selected and weighted to be nationally representative of all adults aged 18+ living in each country, and all interviews were conducted face-to-face in the language of the respondent’s choice. The results have margins of sampling error of +/-2 per cent (for a sample of 2,400) or +/-3 per cent (for a sample of 1,200) at a 95 per cent confidence level.
The results presented in this report were also weighted so that the sample sizes for each country are equal. The overall regional results are equivalent to an average of all 28 countries surveyed.
COUNTRY SURVEYING ORGANISATION
START FIELDWORK
END FIELDWORK
SAMPLE SIZE
ESTIMATED POPULATION
AGED 18+
Benin Institute for Empirical Research in Political Economy (IREEP)
25.05.2014 09.06.2014 1200 4,680,953
Botswana Star Awards (Pty) Ltd 28.06.14 12.07.14 1200 1,329,243*
Burkina Faso Centre for the
Democratic Governance (CDG)
20.04.15 05.05.15 1200 8,123,837
Burundi
Groupe de Recherche et d’Appui aux Initiatives
Democratiques (GRADIS)
29.09.14 10.10.14 1200 5,217,165*
Cameroon
Centre d’Etudes et de Recherche en
Economie et Gestion (CEREG) Université de
Yaounde II
24.01.15 08.02.15 1182 12,189,966*
Cape Verde Afro-Sondagem 22.11.14 05.12.14 1200 272,495
Cote d’Ivoire
Centre de Recherche et de Formation sur le
Développement Intégré (CREFDI)
26.08.14 08.09.14 1199 12,992,917*
Ghana Ghana Center for
Democratic Development (CDD)
20.05.14 10.07.14 2400 13,632,299
Guinea DG Stat View International 16.03.15 05.04.15 1200 5,981,040
Kenya
Institute for Development Studies
(IDS), University of Nairobi
12.11.14 05.12.14 2397 19,312,705
5,219,782*

29 PEOPLE AND CORRUPTION: AFRICA SURVEY 2015
GLOBAL CORRUPTION BAROMETER
Lesotho Advision Lesotho 05.05.14 31.05.14 1200 1,102,787
Liberia Practical Sampling International (PSI) 06.05.15 22.05.15 1199 2,084,804
Madagascar COEF Resources 12.12.14 13.01.15 1200 9,899,442
Malawi Centre for Social Research (CSR),
University of Malawi 01.03.14 27.04.14 2400 7,840,886
Mali Groupe de Recherche
en Économie Appliquée et Théorique (GREAT)
01.12.14 14.12.14 1200 6,837,482
Mauritius StraConsult Ltd with Statistics Mauritius 27.06.14 21.07.14 1200 921,007
Namibia Survey Warehouse, Institute for Public Policy Research
27.08.14 22.09.14 1200 1,202,996
Niger
Laboratoire d’Etudes et de Recherches sur les
Dynamiques Sociales et le Développement Local
(LASDEL)
01.04.15 18.04.15 1200 8,093,721*
Nigeria Practical Sampling International (PSI), CLEEN Foundation
05.12.14 19.01.15 2400 93,911,479
Senegal
Carrefour d’Etudes et de Recherches-Action
pour la Démocratie et le Développement
(CERADD)
22.11.14 08.12.14 1200 7,228,616*
Sierra Leone Campaign for Good Governance, ITASCAP 22.05.15 10.06.15 1191 3,112,280
South Africa Plus 94 13.08.15 21.09.15 2390 30,588,864
Swaziland ActivQuest 21.04.15 11.05.15 1200 823,026*
Tanzania REPOA Policy Research for Development
26.08.14 19.10.14 2386 22,430,900
Togo Center for Research
and Opinion Polls (CROP)
12.10.14 24.10.14 1200 3,562,951
Uganda Hatchile Consult Ltd 07.05.15 26.05.15 2400 16,764,648*
Zambia RuralNet Associates Ltd. 03.10.14 30.10.14 1199 6,222,313
Zimbabwe Mass Public Opinion Institute 16.11.14 29.11.14 2400 6,777,792
An asterisk denotes countries where the available census data does not show the precise number of people aged 18+. In these countries, an estimate was made using other available population data.
To calculate the total number of bribe payers in Sub Saharan Africa, we used the country level bribery rates (the percentage of all adults in the country who had paid a bribe) to calculate the

30 TRANSPARENCY INTERNATIONAL
number of bribe payers in each country. We then added the projected number of bribe payers across all 28 countries, which gave a total number of 74,634,897. For ease of reporting we have rounded this figure to 75 million for the purposes of this report.
CITIZEN’S CORRUPTION SCORECARD RATINGS
1. Change in level of corruption over past 12 months
The scores are based on the percentage of respondents in each country who said that corruption had either increased a little or increased a lot over the 12 months prior to when the survey was conducted.
• Green – Less than 40% said corruption had increased either somewhat or a lot in the past 12 months
• Amber – From 40% up to 60% said corruption had increased either somewhat or a lot in the past 12 months
• Red – 60% or more said corruption had increased either somewhat or a lot in the past 12 months
2. How corrupt public officials are perceived to be
Each country’s score is based on a simple average of the percentage of the population who said that ‘Most of them’ or ‘All of them’ are corrupt for each of the public sector groups - the President’s Office, Members of Parliament, government officials, tax officials, the police, judges and magistrates, and local government councillors. Business executives, religious and traditional leaders were not included as they do not reflect corruption in the public sector.
• Green – Less than 30% on average across the 7 groups • Amber – From 30% up to 50% on average across the 7 groups • Red – 50% or more on average across the 7 groups
3. How is Government handling fighting corruption
The scores are based on the percentage of respondents in each country who rated their government as doing either ‘Very badly’ or ‘Fairly badly’ at fighting corruption in government.
• Green – Less than 40% rated the government very or fairly badly • Amber – From 40% up to 60% rated the government very or fairly badly • Red – 60% or more rated the government very or fairly badly
4. Bribery rate
The scores are based on the percentage of people who said that they paid a bribe to at least one of the six services mentioned in the past 12 months: public medical care, public schools, documents or permits, household services, the police or the courts. The results exclude those who say that they did not come into contact with any of these services in the past 12 months.
31 PEOPLE AND CORRUPTION: AFRICA SURVEY 2015
GLOBAL CORRUPTION BAROMETER
• Green – Less than 10% paid a bribe • Amber – From 10% up to 30% paid a bribe • Red – 30% or more paid a bribe
5. Ordinary people make a difference
The results are based on the percentage of people who either ‘Strongly agree’ or ‘Agree’ with the statement “Ordinary people can make a difference in the fight against corruption”.
• Green – 60% or more ‘strongly agree’ or ‘agree’ • Amber – From 40% up to 60% ‘strongly agree’ or ‘agree’ • Red – Less than 40% ‘strongly agree’ or ‘agree’

32 TRANSPARENCY INTERNATIONAL
QUESTIONNAIRE
Q1. How many of the following people do you think are involved in corruption, or haven’t you heard enough about them to say?
A – The president and officials in his office B – Members of parliament C – Government officials D – Local government councillors E – Police F – Tax officials, like ministry of finance officials or local government tax collectors G – Judges and magistrates H – Traditional leaders I – Religious leaders J – Business executives
• None • Some of them • Most of them • All of them • Don't know/ Haven’t heard [Do not read]
Q2. In your opinion, over the past year, has the level of corruption in this country increased, decreased, or stayed the same?
1 – Increased a lot 2 – Increased somewhat 3 – Stayed the same 4 – Decreased somewhat 5 – Decreased a lot 6 – Don’t know [Do not read] Q3. A. Now I would like to talk to you about experiences that some people have in accessing certain essential government services. In the past 12 months have you…
A – Had contact with a public school? How easy or difficult was it to obtain the services you needed from teachers or school officials? B – Had contact with a public clinic or hospital? How easy or difficult was it to obtain the medical care you needed? C – Tried to get an identity document like a birth certificate, driver’s license, passport or voter’s card, or a permit, from government? How easy or difficult was it to obtain the document you needed? D – Tried to get water, sanitation or electric services from government? How easy or difficult was it to obtain the services you needed? E – Requested assistance from the police? How easy or difficult was it to obtain the assistance you needed? F – Had contact with the courts? How easy or difficult was it to obtain the assistance you needed from the courts?

33 PEOPLE AND CORRUPTION: AFRICA SURVEY 2015
GLOBAL CORRUPTION BAROMETER
• No contact • Very easy • Easy • Difficult • Very Difficult • Don't Know [Do not read]
Q4. If they had contact [Q3 A - F] And how often, if ever, did you have to pay a bribe, give a gift, or do a favour for…
A – A teacher or school official in order to get the services you needed from the schools? B – A health worker or clinic or hospital staff in order to get the medical care you needed? C – A government official in order to get the document you needed? D – A government official in order to get the services you needed? E – A police officer in order to get the assistance you needed, or to avoid a problem like passing a checkpoint or avoiding a fine or arrest? F – A judge or court official in order to get the assistance you needed from the courts?
• No contact • Never • Once or twice • A few times • Often • Don't Know [Do not read]
Q5. If you ever paid a bribe for any of the services discussed above, did you report any of the incidents you mentioned to a government official or someone in authority?
1 – No 2 – Yes 3 – Not Applicable [i.e., Respondent answered No bribes paid, don’t know or no contact to all parts of Q4] [Do not read] 4 – Don’t know [Do not read] Q6. Some people say that incidents of corruption are never reported. Based on your experiences, what do you think is the main reason why many people do not report corruption when it occurs?
1 – Most people do report incidents of corruption 2 – People don’t have enough time to report it 3 – People don’t know where to report it 4 – People don’t know how to report it 5 – Nothing will be done / it wouldn’t make a difference 6 – It’s too expensive to report 7 – Corruption is normal / Everyone does it 8 – People are afraid of the consequences 9 – The officials where they would report to are also corrupt 10 – It’s the government’s money, not the people’s so it’s not our problem 11 – Other 12 – Don’t know

34 TRANSPARENCY INTERNATIONAL
Q7. How well or badly would you say the current government is handling the following matters, or haven’t you heard enough to say? “Fighting corruption in government?”
1 – Very badly 2 – Fairly badly 3 – Fairly well 4 – Very well 5 – Don’t know/ haven’t heard enough [Do not read] Q8. Please tell me whether you agree or disagree with the following statement: ordinary people can make a difference in the fight against corruption?
1 – Strongly disagree 2 – Disagree 3 – Neither agree nor disagree [Do not read] 4 – Agree 5 – Strongly agree 6 – Don’t know [Do not read] Q9. What is the most effective thing that an ordinary person like you can do the help combat corruption in this country?
1 – Nothing/Ordinary people cannot do anything 2 – Refuse to pay bribes 3 – Report corruption when you see or experience it 4 – Vote for clean candidates or parties or for parties that promise to fight corruption 5 – Speak out about the problem, for example, by calling a radio program or writing a letter 6 – Talk to friends and relatives about the problem 7 – Sign a petition asking for a stronger fight against corruption 8 – Join or support an organisation that is fighting corruption 9 – Participate in protest marches or demonstrations against corruption 10 – Other 11 – Don’t know

35 PEOPLE AND CORRUPTION: AFRICA SURVEY 2015
GLOBAL CORRUPTION BAROMETER
FULL DATA TABLES
Table 1 – Perceptions of corruption by institution, proportion that think most or all are corrupt (%)
Q. How many of the following people do you think are involved in corruption, or haven’t you heard enough about them to say? % who say “Most” or “All” are corrupt.
Base. All respondents excluding missing responses.
COUN
TRY
PRES
IDEN
T/PR
IME
MINI
STER
MEMB
ERS
OF
PARL
IAME
NT
GOVE
RNME
NT
OFFI
CIAL
S
LOCA
L
COUN
CILL
ORS
POLI
CE
TAX
OFFI
CIAL
S
JUDG
ES A
ND
MAGI
STRA
TES
TRAD
ITIO
NAL
LEAD
ERS
RELI
GIOU
S LE
ADER
S
BUSI
NESS
EX
ECUT
IVES
PUBL
IC S
ECTO
R AV
ERAG
E
REGIONAL AVERAGE 31 33 38 33 47 37 34 21 15 42 33
Benin 51 46 54 48 54 52 48 26 20 64 50
Botswana 20 25 29 22 34 17 14 13 16 35 23
Burkina Faso 27 30 32 28 28 38 34 11 9 57 31
Burundi 16 14 21 19 41 35 40 22 4 19 27
Cameroon 34 35 45 36 55 55 51 27 18 52 44
Cape Verde 12 13 15 15 19 15 9 not asked 6 19 14
Cote d’Ivoire 24 24 29 31 49 37 35 10 8 53 33
Ghana 47 48 53 43 64 51 49 37 25 44 51
Guinea 32 24 32 24 38 43 38 13 8 34 33
Kenya 27 45 46 36 75 34 33 12 13 38 42
Lesotho 17 19 28 20 38 19 16 16 5 30 22
Liberia 63 68 70 55 77 68 56 41 33 61 65
Madagascar 28 35 35 13 49 35 49 3 4 32 35
Malawi 43 27 35 not asked 39 27 22 30 15 35 32

36 TRANSPARENCY INTERNATIONAL
Mali 35 36 43 44 53 46 56 13 13 70 45
Mauritius 16 19 16 15 22 13 9 not asked 11 22 16
Namibia 17 20 37 26 40 35 28 22 19 45 29
Niger 22 24 23 29 27 27 23 21 13 46 25
Nigeria 54 61 63 58 72 56 45 36 28 45 58
Senegal 22 24 24 24 31 22 24 8 7 38 24
Sierra Leone 48 50 55 49 59 49 47 35 25 53 51
South Africa 46 46 49 48 48 23 23 19 20 38 40
Swaziland 29 36 45 25 42 26 27 22 20 54 33
Tanzania 15 21 25 25 50 37 36 13 10 31 30
Togo 37 35 39 37 44 49 48 35 17 58 41
Uganda 29 36 48 39 63 48 45 12 9 40 44
Zambia 27 34 32 33 51 31 30 21 16 32 34
Zimbabwe 30 38 41 42 58 46 29 22 19 39 41
Table 2 – Change in corruption level over the past year (%)
Q. In your opinion, over the past year, has the level of corruption in this country increased, decreased, or stayed the same?
Base. All respondents excluding those with missing responses.
COUNTRY INCREASED A LOT
INCREASED A LITTLE
STAYED THE
SAME DECREASED
A LITTLE DECREASED
A LOT
DON’T KNOW //
NO ANSWER
TOTAL INCREASE
TOTAL DECREASE
Benin 46 29 7 13 4 2 74 17
Botswana 30 21 14 19 4 11 51 24
Burkina Faso 12 17 18 36 12 5 28 48
Burundi 47 13 8 19 7 5 61 26
Cameroon 30 14 17 25 5 8 44 31

37 PEOPLE AND CORRUPTION: AFRICA SURVEY 2015
GLOBAL CORRUPTION BAROMETER
Cape Verde 27 22 20 11 2 18 49 14
Cote d’Ivoire 20 11 20 28 17 3 32 46
Ghana 64 12 9 6 2 8 76 8
Guinea 29 9 14 23 19 7 38 42
Kenya 41 23 14 15 2 4 64 18
Lesotho 44 14 13 16 9 4 57 26
Liberia 54 19 19 6 1 2 73 6
Madagascar 34 39 14 10 1 1 73 12
Malawi 62 9 9 9 5 5 72 14
Mali 16 14 18 36 14 1 31 50
Mauritius 33 36 21 6 1 3 69 7
Namibia 38 25 18 14 4 1 63 18
Niger 23 21 14 25 7 10 44 32
Nigeria 50 26 16 7 1 1 75 8
Senegal 22 12 14 28 15 9 34 43
Sierra Leone 58 12 10 4 2 15 70 5
South Africa 64 19 10 4 2 1 83 6
Swaziland 39 27 13 13 1 7 66 14
Tanzania 38 28 15 10 3 6 66 13
Togo 26 13 15 29 6 11 39 35
Uganda 52 18 9 14 2 5 69 16
Zambia 43 12 16 18 6 5 55 24
Zimbabwe 48 20 15 9 2 6 68 11

38 TRANSPARENCY INTERNATIONAL
Table 3. Bribery Rates
Q. How often, if ever, did you have to pay a bribe, give a gift, or do a favour for: A. Public schools; B. Public health services; C. Identity documents; D. Utility services; E. The police; F. The courts. % who had paid a bribe at least “once or twice” to any of the services.
Base. Excluding those who have not had contact with any of the six public services in the past 12 months and excluding those who have missing data for all six bribery questions.
COUNTRY BRIBERY RATE (%)
COUNTRY BRIBERY RATE (%)
REGIONAL AVERAGE 22 Namibia 7
Benin 26 Niger 10
Botswana 1 Nigeria 43
Burkina Faso 11 Senegal 8
Burundi 14 Sierra Leone 41
Cameroon 48 South Africa 7
Cape Verde 2 Swaziland 9
Cote d’Ivoire 34 Tanzania 25
Ghana 36 Togo 26
Guinea 35 Uganda 38
Kenya 37 Zambia 17
Lesotho 5 Zimbabwe 22
Liberia 69
Madagascar 16
Malawi 13
Mali 18
Mauritius 1

39 PEOPLE AND CORRUPTION: AFRICA SURVEY 2015
GLOBAL CORRUPTION BAROMETER
Table 4 – Contact rates per service (%)
Q. In the past 12 months have you had contact with A. Public schools; B. Public health services; C. Identity documents; D. Utility services; E. The police; F. The courts. % who had come into contact with each service.
Base. All respondents excluding those with missing responses.
COUNTRY PUBLIC SCHOOL
PUBLIC HOSPITAL
ID, VOTER’S CARD, PERMIT UTILITIES POLICE COURTS
Benin 48 57 44 16 11 7
Botswana 41 81 66 39 46 10
Burkina Faso 41 61 39 13 8 4
Burundi 32 68 33 6 11 13
Cameroon 55 66 54 35 29 21
Cape Verde 32 63 37 27 15 11
Cote d’Ivoire 36 46 39 15 9 7
Ghana 28 41 19 16 12 4
Guinea 36 53 24 11 6 4
Kenya 58 73 52 20 29 7
Lesotho 25 53 40 14 22 9
Liberia 63 73 59 46 60 44
Madagascar 42 37 51 10 8 5
Malawi 29 68 82 19 15 5
Mali 29 59 40 9 7 4
Mauritius 32 73 78 12 12 7
Namibia 51 77 66 26 43 9
Niger 46 66 35 16 10 5
Nigeria 62 69 64 62 43 31
Senegal 44 60 39 22 12 9
Sierra Leone 53 57 31 16 23 11

40 TRANSPARENCY INTERNATIONAL
South Africa 37 58 39 27 34 10
Swaziland 34 66 46 17 24 5
Tanzania 49 71 20 15 18 12
Togo 35 46 33 15 7 7
Uganda 51 74 60 25 32 11
Zambia 41 80 23 17 26 11
Zimbabwe 42 60 44 12 24 7
Table 5 – Bribery rates by service (%)
Q. How often, if ever, did you have to pay a bribe, give a gift, or do a favour for: A. Public schools; B. Public health services; C. Identity documents; D. Utility services; E. The police; F. The courts. % of those who had come into contact with the service and had paid a bribe at least “once or twice” for each service.
Base. Excluding those who have not had contact with the service in the past 12 months and excluding those with missing responses.
COUNTRY PUBLIC SCHOOL
PUBLIC HOSPITAL
ID, VOTER’S CARD, PERMIT UTILITIES POLICE COURTS
Benin 9 13 26 20 18 19
Botswana 1 0 0 0 1 0
Burkina Faso 9 4 9 5 8 *
Burundi 11 2 11 9 28 23
Cameroon 32 31 34 34 34 32
Cape Verde 2 1 1 1 0 2
Cote d’Ivoire 17 18 29 13 26 24
Ghana 24 17 38 35 58 *
Guinea 24 25 34 26 37 *
Kenya 9 11 39 20 49 42
Lesotho 2 2 3 4 2 3
Liberia 45 52 59 56 60 52

41 PEOPLE AND CORRUPTION: AFRICA SURVEY 2015
GLOBAL CORRUPTION BAROMETER
Madagascar 6 9 12 7 24 *
Malawi 12 6 3 11 28 *
Mali 7 8 22 10 35 *
Mauritius 0 0 0 2 5 1
Namibia 3 2 5 3 2 1
Niger 4 5 9 2 16 16
Nigeria 25 24 32 35 45 40
Senegal 3 3 8 4 5 4
Sierra Leone 20 25 37 40 64 65
South Africa 2 2 6 6 3 5
Swaziland 4 1 12 3 3 5
Tanzania 11 20 15 22 35 35
Togo 10 11 27 22 28 22
Uganda 19 25 15 19 41 44
Zambia 12 4 17 8 23 14
Zimbabwe 7 5 25 10 23 20
Table 6 – Handling fighting corruption in government (%)
Q. How well or badly would you say the current government is handling the following matters, or haven’t you heard enough to say? “Fighting corruption in government?”
Base. All respondents excluding missing responses.
COUNTRY VERY BADLY
FAIRLY BADLY
FAIRLY WELL
VERY WELL
DON’T KNOW / NO ANSWER
TOTAL BADLY
TOTAL WELL
Benin 40 39 18 1 2 79 19
Botswana 14 28 46 8 4 42 54
Burkina Faso 20 29 32 13 5 49 45
Burundi 35 32 20 9 3 68 29

42 TRANSPARENCY INTERNATIONAL
Cameroon 24 33 29 8 6 57 37
Cape Verde 19 42 21 1 17 61 23
Cote d’Ivoire 23 30 35 9 3 53 44
Ghana 50 21 20 4 4 71 25
Guinea 36 25 23 9 6 61 33
Kenya 43 27 24 4 3 70 27
Lesotho 32 9 25 22 12 41 47
Liberia 59 22 13 5 2 81 18
Madagascar 42 48 8 1 1 90 9
Malawi 56 13 19 8 3 69 28
Mali 24 32 35 8 1 56 43
Mauritius 29 43 23 2 4 71 25
Namibia 32 33 28 6 0 65 34
Niger 16 30 33 12 8 47 46
Nigeria 45 32 18 3 1 78 22
Senegal 18 28 38 8 7 46 47
Sierra Leone 52 16 14 5 13 69 19
South Africa 56 23 16 5 1 79 20
Swaziland 17 31 41 7 4 48 48
Tanzania 27 31 34 3 5 58 37
Togo 39 22 25 6 8 61 31
Uganda 41 28 22 4 5 69 26
Zambia 40 23 25 7 6 62 32
Zimbabwe 54 26 15 2 3 80 17

43 PEOPLE AND CORRUPTION: AFRICA SURVEY 2015
GLOBAL CORRUPTION BAROMETER
Table 7 – ordinary people can do something against corruption (%)
Q. Please tell me whether you agree or disagree with the following statement: ordinary people can make a difference in the fight against corruption?
Base. All respondents excluding missing responses.
ST
RONG
LY
AGRE
E
AGRE
E
NEIT
HER
AGRE
E NO
R DI
SAGR
EE
DISA
GREE
STRO
NGLY
DI
SAGR
EE
DONT
KN
OW / N
O AN
SWER
TOTA
L AG
REE
TOTA
L DI
SAGR
EE
Benin 12 30 5 25 25 3 42 49
Botswana 34 38 5 10 10 3 72 20
Burkina Faso 18 43 4 16 16 3 61 31
Burundi 32 22 1 13 30 1 54 44
Cameroon 23 33 5 16 19 5 56 35
Cape Verde 20 35 3 23 11 8 55 34
Cote d’Ivoire 15 39 4 22 16 3 55 38
Ghana 27 27 6 13 23 4 53 36
Guinea 18 28 1 12 34 6 46 46
Kenya 31 26 6 11 23 2 58 35
Lesotho 38 21 2 7 29 2 60 36
Liberia 17 26 7 21 25 4 43 45
Madagascar 24 46 8 13 8 0 70 21
Malawi 49 16 2 8 24 2 64 32
Mali 16 34 2 23 25 0 50 48
Mauritius 10 46 7 24 10 3 56 34
Namibia 33 36 6 16 8 1 69 24
Niger 22 21 5 22 28 3 42 50
Nigeria 12 27 14 22 23 2 39 45
Senegal 21 29 3 15 28 5 49 43

44 TRANSPARENCY INTERNATIONAL
Sierra Leone 17 15 7 12 33 16 32 44
South Africa 24 33 13 16 13 3 56 29
Swaziland 19 41 4 15 20 2 59 35
Tanzania 19 36 9 18 15 3 55 33
Togo 17 37 3 21 21 2 53 42
Uganda 21 26 3 12 35 3 47 47
Zambia 24 29 5 15 23 5 53 38
Zimbabwe 19 23 6 14 36 2 42 50

46 TRANSPARENCY INTERNATIONAL
END NOTES
i The survey was conducted before the presidential election in Nigeria. ii Results are compared with previous rounds of Transparency International’s GCB survey. iii Results are based on those who came into contact with at least one of six public services in the past 12 months. iv The Afrobarometer calculates poverty using their Lived Poverty Index (LPI), an experiential measure that consists of a series of survey questions that measure how frequently people actually go without basic necessities during the course of a year. The Afrobarometer asks respondents: over the past year, how often, if ever, have you or your family gone without enough: food to eat; clean water for home use; medicines or medical treatment; enough fuel to cook your food; a cash income? The results presented in this report use the Lived Poverty categories, ranging from no lived poverty to high lived poverty. The results are based only on those who have come into contact with at least one public service in the past 12 months. v For more information, see: http://www.ti-defence.org/publications/dsp-pubs/223-dsp-pubs-arresting-corruption-police.html. vi The survey was conducted before the presidential elections. vii Republic of Senegal (2013) Décret n°2013-1282. http://www.gouv.sn/Decret-no2013-1282-du-23-septembre.html viii Republic of Senegal (2013) Conseil des Ministres. http://www.gouv.sn/Conseil-des-Ministres-du-11,1449.html ix Centif (2014) LOI relative a la declaration de partimoine. http://www.centif.sn/Loi_2014_17.pdf x BBC (2015) Senegal's Karim Wade jailed for corruption. http://www.bbc.com/news/world-africa-32020574 xi Freedom House (2015) Madagascar, https://freedomhouse.org/report/freedom-world/2015/madagascar. xii European Commission (2014) Anti-Corruption Report, http://ec.europa.eu/dgs/home-affairs/what-we-do/policies/organized-crime-and-human-trafficking/corruption/anti-corruption-report/index_en.htm and LAPOP (2012) http://vanderbilt.edu/lapop/raw-data.php xiii BBC (2015) “Ebola: Mapping the outbreak”, http://www.bbc.com/news/world-africa-28755033. xiv Dupuy, K. Divijak, B. (2015) “Ebola and corruption: Overcoming critical governance challenges in a crisis situation”. U4 Brief March 2015:4. xv Jerving, S. (2014) “Why Liberians Thought Ebola Was a Government Scam to Attract Western Aid”, The Nation, http://www.thenation.com/article/why-liberians-thought-ebola-was-government-scam-attract-western-aid/ and Mukpo, A. (2014) “The biggest concern of the Ebola outbreak is political, not medical”, Al Jazeera, http://america.aljazeera.com/opinions/2014/8/ebola-virus-liberiasierraleonepolitics.html. xvi Transparency International (2014) “African Voices Against Corruption – Madagascar”, http://www.voix-contre-la-corruption.org/en/#/quand-la-corruption-rase-la-foret.

Generous support for the People and Corruption: Africa Survey 2015/ Global Corruption Barometer was provided by Ernst & Young and the European Union (under the 7th Framework Research Project ANTICORRP: Anti-corruption Policies Revisited: Global Trends and European Responses to the Challenge of Corruption). We are grateful for these contributions to our activities. The information and views set out in this publication reflect only the author’s views and do not necessarily reflect any official opinion of these donors or the collective opinion of the Anticorrp consortium. For a full list of all contributors and to find out how you can support our work please visit www.transparency.org
CREATE CHANGE WITH USENGAGEMore and more people are joining the fight against corruption, and the discussion is growing. Stay informed and share your views on our website and blog, and social media.
VOLUNTEERWith an active presence in more than 100 countries around the world, we’re always looking for passionate volunteers to help us increase our impact. Check out our website for the contact details for your local organisation.
DONATE Your donation will help us provide support to thousands of victims of corruption, develop new tools and research, and hold governments and businesses to their promises. We want to build a fairer, more just world. With your help, we can. Find out more at:
www.transparency.org/getinvolved
And join the conversation: transparencyinternational anticorruption

Transparency International International Secretariat Alt-Moabit 96, 10559 Berlin, Germany
Phone: +49 30 34 38 200 Fax: +49 30 34 70 39 12
[email protected] www.transparency.org
blog.transparency.org facebook.com/transparencyinternational twitter.com/anticorruption