people to count on. knowledge to build with. market ... · people to count on. knowledge to build...
TRANSCRIPT
VANcouVer l ToroNTo l cAlGAry l edmoNToN l sAskATooN l sT.cAThAriNes l moNTreAl
4Th QuArTer 2011
People to count on. knowledge to build with.
mArkeTiNTelliGeNce
BTy GrouP’s iN-dePTh forecAsT oN coNsTrucTioN TreNds ANd escAlATioN Across cANAdA, iNcludiNG uNiT rATes for 2012
steady workloads, low escalation amidglobal economic uncertainty
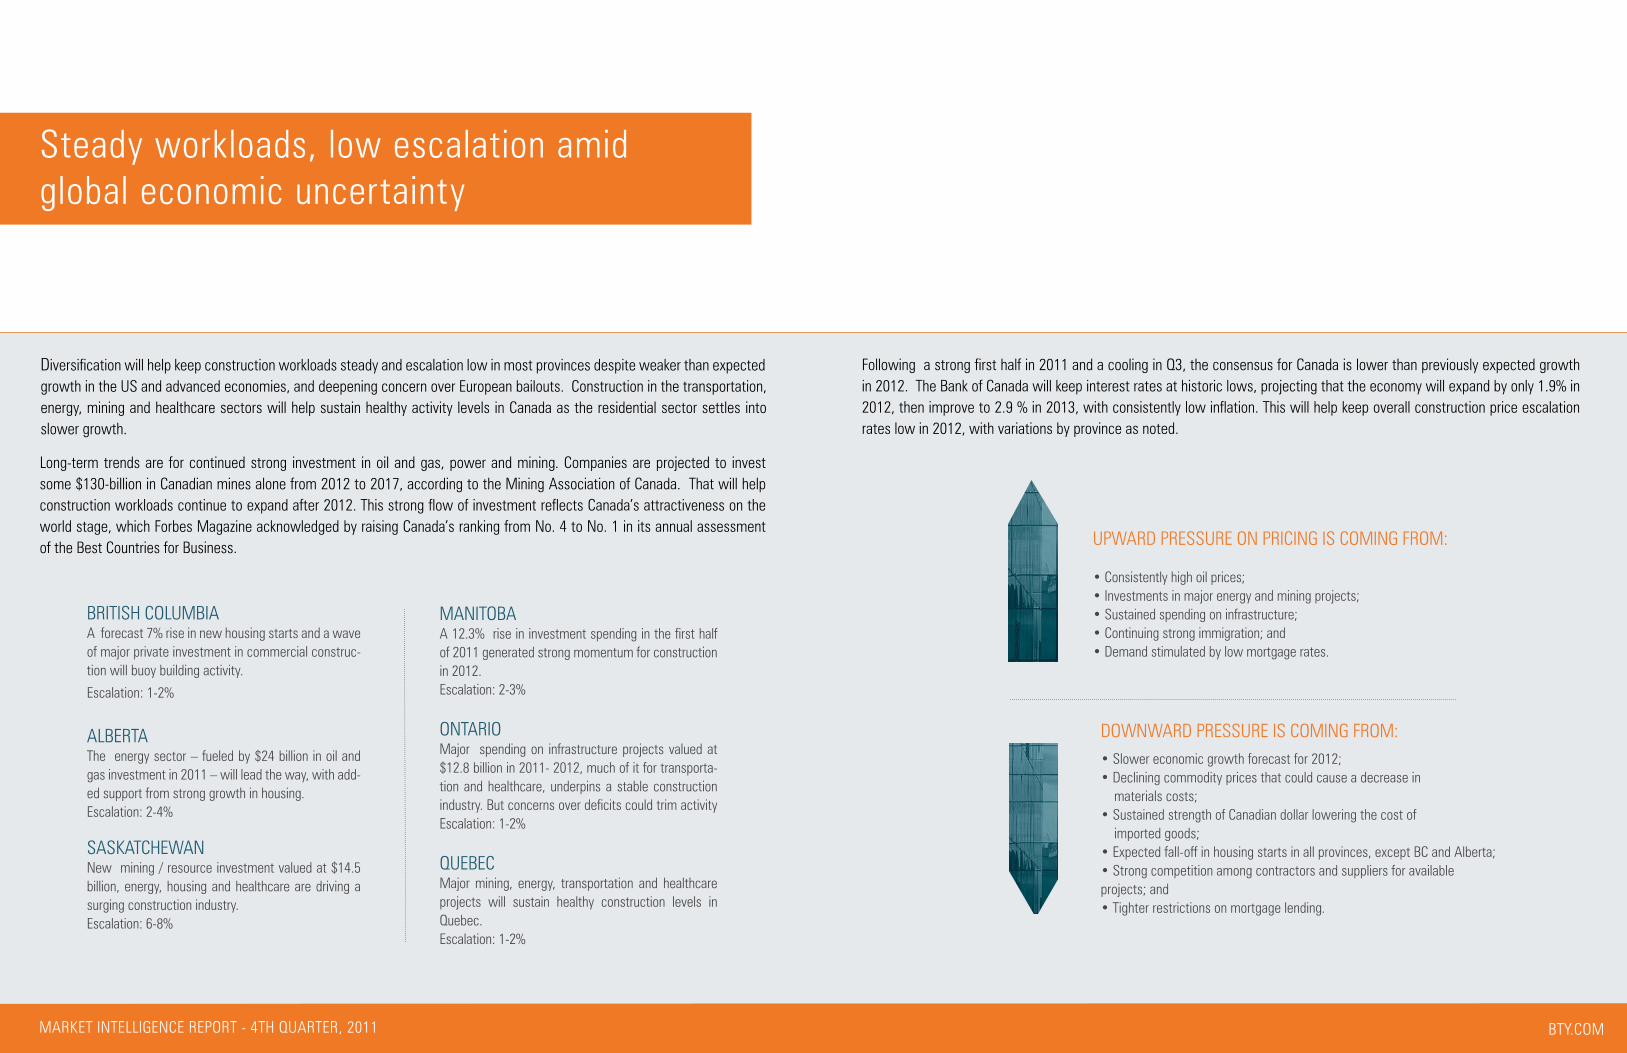
diversification will help keep construction workloads steady and escalation low in most provinces despite weaker than expected growth in the us and advanced economies, and deepening concern over european bailouts. construction in the transportation, energy, mining and healthcare sectors will help sustain healthy activity levels in canada as the residential sector settles into slower growth.
uPwArd Pressure oN PriciNG is comiNG from:
• Consistently high oil prices;• Investments in major energy and mining projects; • Sustained spending on infrastructure; • Continuing strong immigration; and• Demand stimulated by low mortgage rates.
dowNwArd Pressure is comiNG from:• Slower economic growth forecast for 2012;• Declining commodity prices that could cause a decrease in materials costs; • Sustained strength of Canadian dollar lowering the cost of imported goods;• Expected fall-off in housing starts in all provinces, except BC and Alberta;• Strong competition among contractors and suppliers for available projects; and• Tighter restrictions on mortgage lending.
Long-term trends are for continued strong investment in oil and gas, power and mining. Companies are projected to invest some $130-billion in canadian mines alone from 2012 to 2017, according to the mining Association of canada. That will help construction workloads continue to expand after 2012. This strong flow of investment reflects canada’s attractiveness on the world stage, which forbes magazine acknowledged by raising canada’s ranking from No. 4 to No. 1 in its annual assessment of the Best countries for Business.
BriTish columBiAA forecast 7% rise in new housing starts and a wave of major private investment in commercial construc-tion will buoy building activity.
escalation: 1-2%
AlBerTAThe energy sector – fueled by $24 billion in oil and gas investment in 2011 – will lead the way, with add-ed support from strong growth in housing. escalation: 2-4%
sAskATchewANNew mining / resource investment valued at $14.5 billion, energy, housing and healthcare are driving a surging construction industry.escalation: 6-8%
mANiToBAA 12.3% rise in investment spending in the first half of 2011 generated strong momentum for construction in 2012. escalation: 2-3%
oNTArioMajor spending on infrastructure projects valued at $12.8 billion in 2011- 2012, much of it for transporta-tion and healthcare, underpins a stable construction industry. But concerns over deficits could trim activity escalation: 1-2%
QueBecMajor mining, energy, transportation and healthcare projects will sustain healthy construction levels in Quebec.escalation: 1-2%
following a strong first half in 2011 and a cooling in Q3, the consensus for canada is lower than previously expected growth in 2012. The Bank of Canada will keep interest rates at historic lows, projecting that the economy will expand by only 1.9% in 2012, then improve to 2.9 % in 2013, with consistently low inflation. This will help keep overall construction price escalation rates low in 2012, with variations by province as noted.
BTy.commArkeT iNTelliGeNce rePorT - 4Th QuArTer, 2011

Major private sector building projects include:• $750 million TELUS Garden office and residential project•$700 million Oakridge Re-development• $400 million PCL Marine Gateway*• $267 million Aquilini Northeast False Creek Redevelopment*• $150 million Oxford Development’s 36-storey downtown office tower • $280 million Bentall 6, a 22-storey downtown tower (completion 2015) • $250 million Guildford Town Centre Expansion.
Major ongoing transportation and social infrastructure projects include:• $3.1 billion Gateway Program; Hwy 1 and Port Mann Bridge (2014 completion)• $1.2 billion South Fraser Perimeter Road (2013 completion)• $1.4 billion Evergreen Rapid Transit Line (2015 completion)• $700 million redevelopment of Children’s and Women’s Health Centre*• $433 million Kelowna Vernon Hospitals Project*• $297 million Fort St John Hospital*• $239 million Surrey Memorial Hospital Expansion*• $225 million BC Supportive Housing Initiative*• $70 million British Columbia Cancer Agency Centre for the North*
Major mining and energy projects include:• $3 billion Encana/Apache Kitimat Liquid Natural Gas Terminal• $917 million Mt. Milligan Mine• $900 million Mica Dam expansion• $340 million Wildmare and Tumbler Ridge wind energy projects• $310 million Tulsequah Chief mine
*Denotes projects for which BTY Group is providing services
cmhc’s housing market outlook sees Bc’s new home construction rising nearly 7% in 2012, second only to Alberta. sizable increases in private invest-ment spending on major commercial projects are also expected to support increased construction activity. This surge in both residential and non-res-idential building will help offset declines in govern-ment spending on public infrastructure and give the construction industry the highest growth of all do-mestic-oriented industries. while the return to the 12% PsT/GsT tax system in 2013 from the current hsT tax system can be expected to boost personal consumption and residential investment spend-ing, it could also dampen business investment and corporate profits. even so, the mining, oil and gas industries are also projected to step up investment spending in 2012 and 2013.
The provincial government’s plan to focus on the development of new mines and energy facilities for job creation – coupled with sustained demand from high growth Asian economies -- should also stimu-late major new construction projects over the next five years.
ProViNciAl sNAPshoTs
BriTish columBiA
resideNTiAl coNsTrucTioN
To leAd GrowTh
BTy.com
2012 : 1-2%2013 : 2-3%2014 : 2-3%
canada still the Best Place to invest in infrastructure
Taking the long view in these uncertain times is not for the faint of heart. But our experience across canada over the last 33 years through market highs and lows indicates that there is ample evidence that construction here is well positioned to prosper in the near to mid-term. we have a di-versified industry with substantial sustained investments in key sec-JOE REKAB, managing Partner
tors such as transportation and social infrastructure, oil and gas, min-ing, and hydro and wind energy.
in fact, from 2010 to 2015 canadian infrastructure will grow at over two and a half times the growth rate seen over the previous five years, according to a report by Global construction Perspectives and oxford economics. so it is no surprise that canada is attracting the interest of contractors in every sector from around the world – and generating expectations that it will become the fifth largest construction market — a jump from its current position in seventh place.
As canada’s construction profile grows on the global stage, we would do well to remember that building, like politics, is ultimately a local un-dertaking. what might look promising on paper in an overseas board-room needs to be field tested by eyes experienced in what can be unexpectedly challenging – and uniquely local – conditions. It is in this spirit that we offer our opinions on industry trends in this and other market reports, as well as our services to the construction industry.
Joe Rekab, MRICS, PQS(F), is BTY Group’s Managing Partner. Joe draws on more than 30 years of wide-ranging industry experience in providing strategic direction for all major public projects that the firm undertakes. He has special expertise in cost and Project Management for complex Public-Private Partnership (P3) social and transportation infrastructure projects.
BTy Group has more than 65 staff in seven offices across canada pro-viding Project Monitoring and Cost Management services as well as advisory services for Public-Private Partnership (P3) projects. We have worked on over 65 P3 projects – collectively valued at more than CDN $20 billion – from British columbia to New Brunswick and abroad. The projects include facilities and infrastructure for the healthcare, educa-tion, government archive and data management, corrections, police, justice, and transportation sectors.BTy.com
“look for a
combination of strong residential and private sector non-residential investments to
keep Bc’s construction
industry on a positive footing in 2012. longer term,
we see strength in mining and energy investments.”
Toby mallinder Partner
mArkeT iNTelliGeNce rePorT - 4Th QuArTer, 201
$22.4
$7.8
$5.2 $5.3
$0
$5
$10
$15
$20
$25
BUILDINGS RESOURCES ENERGY/ UTILITIES INFRASTRUCTURE
C O N S T R U C T I O N W O R K LO A D BY S E C TO R I N $ B I L L I O N S
Sources: Statistics Canada, Capital expenditures for construction by sector, 2011 intentions; Major Projects Inventory, BC Ministry of Jobs, Tourism and Innovation, June 2011.
iNfrAsTrucTure reNewAl ANd
exPANsioN ANchor coNsTrucTioN
oNTArio
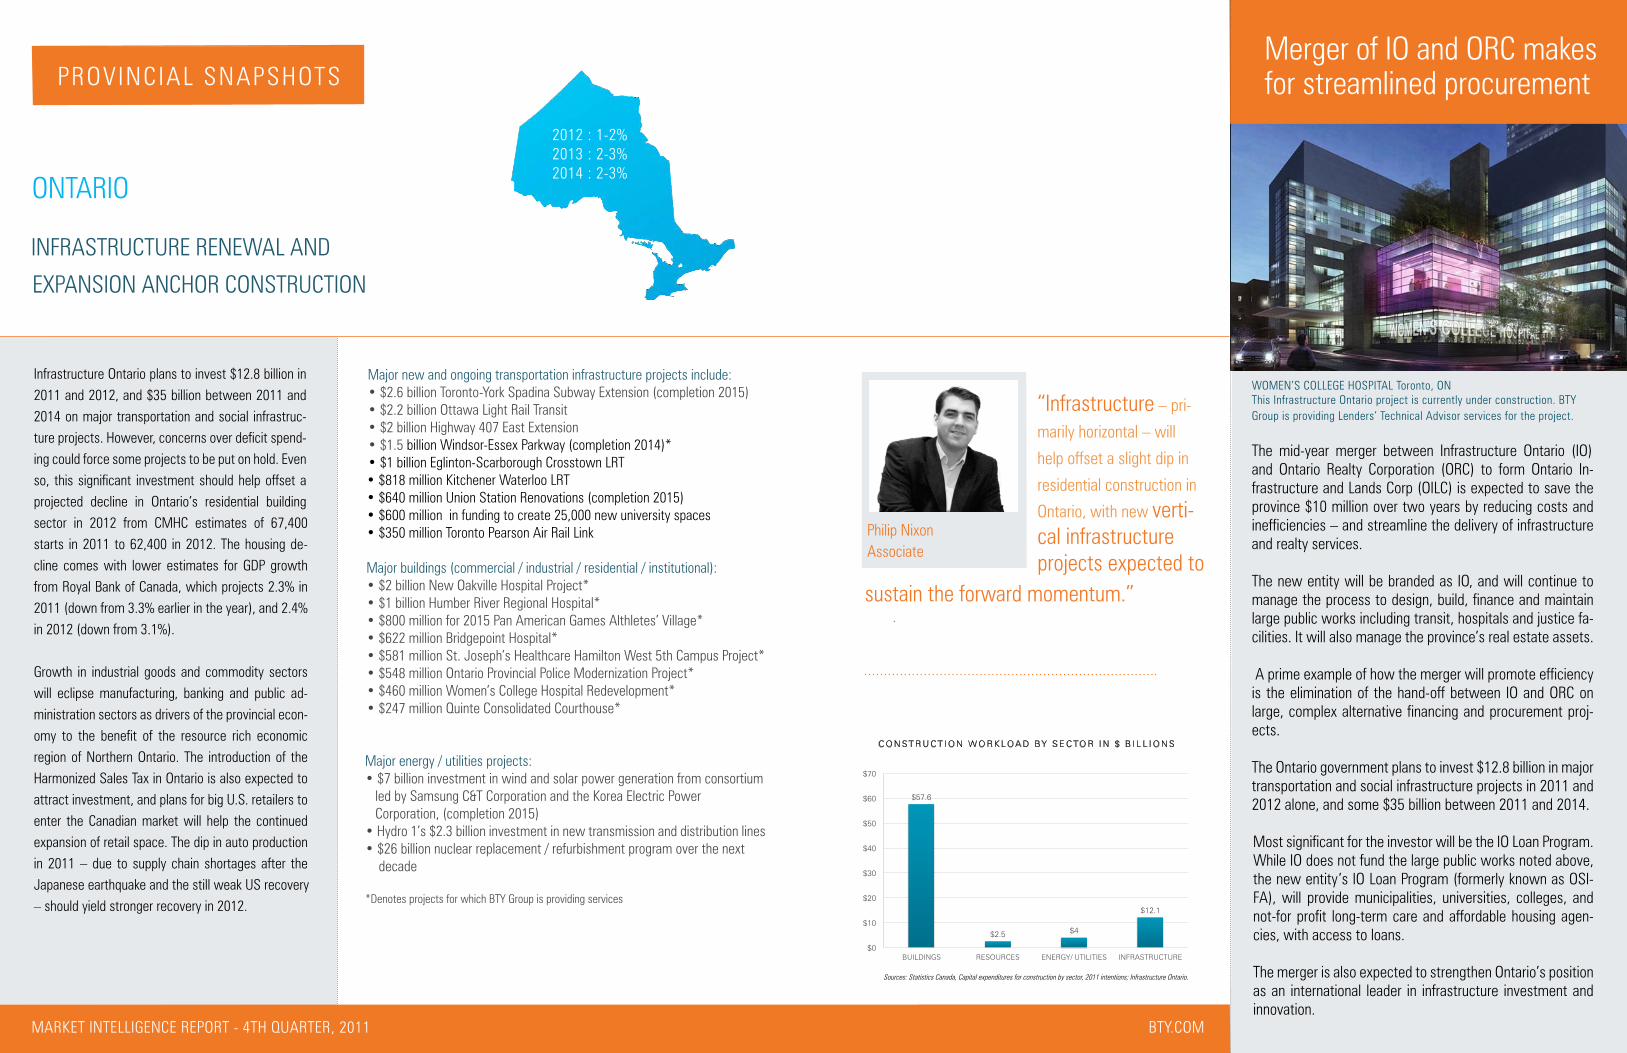
infrastructure ontario plans to invest $12.8 billion in 2011 and 2012, and $35 billion between 2011 and 2014 on major transportation and social infrastruc-ture projects. However, concerns over deficit spend-ing could force some projects to be put on hold. Even so, this significant investment should help offset a projected decline in Ontario’s residential building sector in 2012 from cmhc estimates of 67,400 starts in 2011 to 62,400 in 2012. The housing de-cline comes with lower estimates for GdP growth from Royal Bank of Canada, which projects 2.3% in 2011 (down from 3.3% earlier in the year), and 2.4% in 2012 (down from 3.1%).
Growth in industrial goods and commodity sectors will eclipse manufacturing, banking and public ad-ministration sectors as drivers of the provincial econ-omy to the benefit of the resource rich economic region of Northern ontario. The introduction of the harmonized sales Tax in ontario is also expected to attract investment, and plans for big u.s. retailers to enter the canadian market will help the continued expansion of retail space. The dip in auto production in 2011 – due to supply chain shortages after the Japanese earthquake and the still weak US recovery – should yield stronger recovery in 2012.
Major new and ongoing transportation infrastructure projects include:• $2.6 billion Toronto-York Spadina Subway Extension (completion 2015)• $2.2 billion Ottawa Light Rail Transit• $2 billion Highway 407 East Extension• $1.5 billion Windsor-Essex Parkway (completion 2014)*• $1 billion Eglinton-Scarborough Crosstown LRT• $818 million Kitchener Waterloo LRT • $640 million Union Station Renovations (completion 2015)• $600 million in funding to create 25,000 new university spaces • $350 million Toronto Pearson Air Rail Link
Major buildings (commercial / industrial / residential / institutional):• $2 billion New Oakville Hospital Project*• $1 billion Humber River Regional Hospital*• $800 million for 2015 Pan American Games Althletes’ Village*• $622 million Bridgepoint Hospital*• $581 million St. Joseph’s Healthcare Hamilton West 5th Campus Project*• $548 million Ontario Provincial Police Modernization Project*• $460 million Women’s College Hospital Redevelopment*• $247 million Quinte Consolidated Courthouse*
Major energy / utilities projects: • $7 billion investment in wind and solar power generation from consortium led by samsung c&T corporation and the korea electric Power Corporation, (completion 2015)• Hydro 1’s $2.3 billion investment in new transmission and distribution lines• $26 billion nuclear replacement / refurbishment program over the next decade
*Denotes projects for which BTY Group is providing services
BTy.com
2012 : 1-2%2013 : 2-3%2014 : 2-3%
“infrastructure – pri-
marily horizontal – will
help offset a slight dip in
residential construction in
ontario, with new verti-cal infrastructure projects expected to
Philip NixonAssociate
The mid-year merger between Infrastructure Ontario (IO) and Ontario Realty Corporation (ORC) to form Ontario In-frastructure and Lands Corp (OILC) is expected to save the province $10 million over two years by reducing costs and inefficiencies – and streamline the delivery of infrastructure and realty services.
The new entity will be branded as io, and will continue to manage the process to design, build, finance and maintain large public works including transit, hospitals and justice fa-cilities. it will also manage the province’s real estate assets.
A prime example of how the merger will promote efficiency is the elimination of the hand-off between io and orc on large, complex alternative financing and procurement proj-ects.
The Ontario government plans to invest $12.8 billion in major transportation and social infrastructure projects in 2011 and 2012 alone, and some $35 billion between 2011 and 2014.
most significant for the investor will be the io loan Program. while io does not fund the large public works noted above, the new entity’s IO Loan Program (formerly known as OSI-FA), will provide municipalities, universities, colleges, and not-for profit long-term care and affordable housing agen-cies, with access to loans.
The merger is also expected to strengthen ontario’s position as an international leader in infrastructure investment and innovation.
sustain the forward momentum.”
ProViNciAl sNAPshoTs
womeN’s colleGe hosPiTAl Toronto, oNThis Infrastructure Ontario project is currently under construction. BTY Group is providing Lenders’ Technical Advisor services for the project.
merger of io and orc makes for streamlined procurement
mArkeT iNTelliGeNce rePorT - 4Th QuArTer, 2011
$57.6
$2.5 $4
$12.1
$0
$10
$20
$30
$40
$50
$60
$70
BUILDINGS RESOURCES ENERGY/ UTILITIES INFRASTRUCTURE
C O N S T R U C T I O N W O R K LO A D BY S E C TO R I N $ B I L L I O N S
Sources: Statistics Canada, Capital expenditures for construction by sector, 2011 intentions; Infrastructure Ontario.

QueBec
miNiNG, TrANsPorTATioN ANd
heAlTh To leAd
higher investment in non-residential structures and equipment by both private and public sectors will generate substantial construction activity outside the residential sector, according to rBc economics.
statistics canada’s survey of investment intentions in february indicated that public and private enterprises planned to boost non-residential capital expenditures by 6.6% in 2011 to a record $44 billion. most of this investment will be for public infrastructure, electric-ity generation capacity, the mining and metal refining sectors. For example, Quebec will spend some $3.9 billion on transportation infrastructure in 2011-2012, and global steel giant ArcelorMittal will create 8,900 construction and mining jobs with a $2.1 billion ex-pansion of its mont wright mining complex.
while economic uncertainty has lowered expecta-tions based on year-to-date performance, Quebec’s general construction picture is favourable, with only a slight dip projected in housing starts from 48,000 for 2011 to 44,300 for 2012.
2012 : 1-2%2013 : 2-3%2014 : 2-3%
Major transportation projects include:• $3 billion Turcotte Interchange in Montréal (completion 2016)• $1.5 billion Autoroute 30 (West Side; completion late 2012)• $1.2 billion Champlain Bridge (proposed) • $777 million Autoroute 175 (completion 2013)• $400 million Autoroute 35 • $230 million Autoroute 73 in Beauce• $221 million Autoroute 410 in Sherbrooke
Major healthcare and education projects include:• $3 billion+ for major healthcare projects: Centre hospitalier de l’Université de Montréal* McGill University Health Centre (completion 2014)* Centre de recherche de hospitalier de l’Université de Montréal (completion 2013)*• $995 million modernization of Centre hospitalier de l’Université Sainte-Justine*• $100 million Shriners Hospital for Children• $120 million Outremont Campus of l’Université de Montréal
Major energy projects include: • $30 billion in ongoing commitments to hydro and wind power projects• $6.5 billion Romaine hydro-electric project (first commissioning 2014, completion 2020)• $2 billion refurbishment of Gentilly 2 nuclear power plant
Major mining projects include:• $4 billion New Millenium DSO iron project• $2.1 billion Alcoa modernization of 3 smelters• $2.1 billion ArcelorMittal mine expansion at Mont Wright• $1.4 billion Éléonore project in James Bay• $1 billion Xstrata’s phase 2 of the Raglan mine (nickel and copper)*• $450 million Stornoway Diamond Renard project
*Denotes projects for which BTY Group is providing services
“The outlook is
very favourable as
massive new investments for projects in min-ing, energy and horizontal infra-
stephanie BaxAssociate
whether for hydroelectric, wind, oil and gas or nuclear power, increased investment in canada’s energy sector should ensure that canada will remain an energy powerhouse for decades to come. A short list of ma-jor projects and values from west to east tells the story:
BriTish columBiA: $3 billion for Encana/Apache Kitimat Liquid Natu-ral Gas Terminal and $900 milion for Mica Dam extension. Even larger hydro and wind projects are in the works.
AlBerTA: $24 billion in oilsands investment in 2011 alone.
sAskATchewAN: $1.8 billion in oil and gas drilling and pipeline, and $1.24 billion for a hydro station.
mANiToBA: $7.2 billion for two major hydro projects.
oNTArio: $7 billion investment for wind and solar power generation, $2.3 billion for new transmission and distribution lines, and $26 billion for nuclear refurbishment over the next decade.
QueBec: $30 billion in ongoing commitments to hydro and wind power projects, including $6.5 billion Romaine hydro project and $2 billion re-furbishment of Gentilly 2 nuclear complex.
Provincial government polices are also contributing to a sustained burst of expansion in the sector. BC’s Jobs Program is committed to creating eight new mines by 2015 and expansion at nine operating mines – both of which will require substantial energy project development to deliver power for the energy-intensive mining operations. Quebec’s Plan Nord has targeted $80 billion for integrated resource and aboriginal develop-ment over 25 years. Again, hydroelectric development is a large com-ponent of the plan.
structure are complementing ongoing construc-
tion in vertical infrastructure during a dip in residen-
tial building.”
BTy.com
ProViNciAl sNAPshoTs
$38.2
$3.7
$13.3
$5.6
$0
$5
$10
$15
$20
$25
$30
$35
$40
$45
BUILDINGS RESOURCES ENERGY/ UTILITIES INFRASTRUCTURE
C O N S T R U C T I O N W O R K LO A D BY S E C TO R I N $ B I L L I O N S
Sources: Commission de la Construction de Québec (CCQ), Revue de l’activité, 2e trimestre 2011 Projets importants en cours au deuxième trimestre de 2011 and Statistics Canada, Capital Expenditures for Construction by sector, 2011 intentions .
JOHN HART DAM & GENERATING STATION, Campbell river, BcBTY Group is providing Cost Consulting services for this P3 project.
mArkeT iNTelliGeNce rePorT - 4Th QuArTer, 2011
Growing investment to ensure canada remains long-term energy powerhouse
AlBerTA
reNewed oil sANds iNVesTmeNT
sPArks coNsTrucTioN Boom
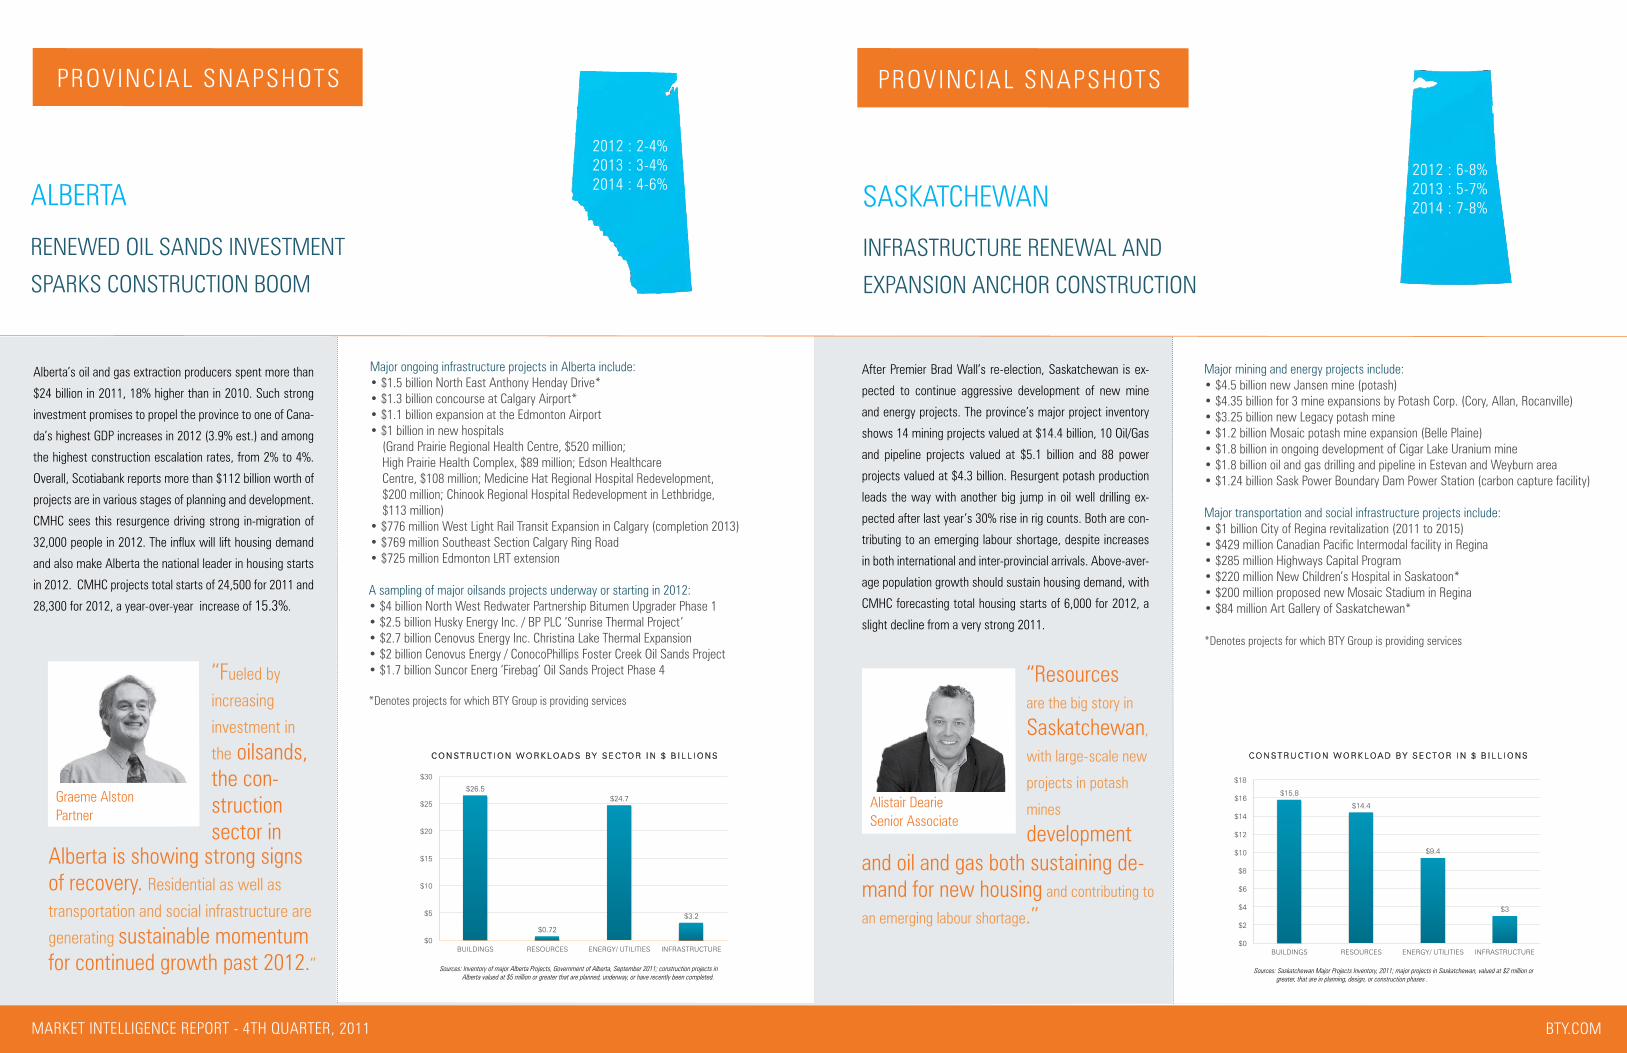
Alberta’s oil and gas extraction producers spent more than
$24 billion in 2011, 18% higher than in 2010. such strong
investment promises to propel the province to one of cana-
da’s highest GDP increases in 2012 (3.9% est.) and among
the highest construction escalation rates, from 2% to 4%.
overall, scotiabank reports more than $112 billion worth of
projects are in various stages of planning and development.
cmhc sees this resurgence driving strong in-migration of
32,000 people in 2012. The influx will lift housing demand
and also make Alberta the national leader in housing starts
in 2012. CMHC projects total starts of 24,500 for 2011 and
28,300 for 2012, a year-over-year increase of 15.3%.
Major ongoing infrastructure projects in Alberta include:• $1.5 billion North East Anthony Henday Drive*• $1.3 billion concourse at Calgary Airport*• $1.1 billion expansion at the Edmonton Airport• $1 billion in new hospitals (Grand Prairie Regional Health Centre, $520 million; High Prairie Health Complex, $89 million; Edson Healthcare Centre, $108 million; Medicine Hat Regional Hospital Redevelopment, $200 million; Chinook Regional Hospital Redevelopment in Lethbridge, $113 million)• $776 million West Light Rail Transit Expansion in Calgary (completion 2013)• $769 million Southeast Section Calgary Ring Road• $725 million Edmonton LRT extension
A sampling of major oilsands projects underway or starting in 2012:• $4 billion North West Redwater Partnership Bitumen Upgrader Phase 1• $2.5 billion Husky Energy Inc. / BP PLC ‘Sunrise Thermal Project’• $2.7 billion Cenovus Energy Inc. Christina Lake Thermal Expansion• $2 billion Cenovus Energy / ConocoPhillips Foster Creek Oil Sands Project• $1.7 billion Suncor Energ ‘Firebag’ Oil Sands Project Phase 4
*Denotes projects for which BTY Group is providing services
sAskATchewAN
After Premier Brad wall’s re-election, saskatchewan is ex-
pected to continue aggressive development of new mine
and energy projects. The province’s major project inventory
shows 14 mining projects valued at $14.4 billion, 10 Oil/Gas
and pipeline projects valued at $5.1 billion and 88 power
projects valued at $4.3 billion. Resurgent potash production
leads the way with another big jump in oil well drilling ex-
pected after last year’s 30% rise in rig counts. Both are con-
tributing to an emerging labour shortage, despite increases
in both international and inter-provincial arrivals. Above-aver-
age population growth should sustain housing demand, with
cmhc forecasting total housing starts of 6,000 for 2012, a
slight decline from a very strong 2011.
Major mining and energy projects include:• $4.5 billion new Jansen mine (potash)• $4.35 billion for 3 mine expansions by Potash Corp. (Cory, Allan, Rocanville)• $3.25 billion new Legacy potash mine• $1.2 billion Mosaic potash mine expansion (Belle Plaine)• $1.8 billion in ongoing development of Cigar Lake Uranium mine• $1.8 billion oil and gas drilling and pipeline in Estevan and Weyburn area• $1.24 billion Sask Power Boundary Dam Power Station (carbon capture facility)
Major transportation and social infrastructure projects include:• $1 billion City of Regina revitalization (2011 to 2015)• $429 million Canadian Pacific Intermodal facility in Regina• $285 million Highways Capital Program• $220 million New Children’s Hospital in Saskatoon*• $200 million proposed new Mosaic Stadium in Regina• $84 million Art Gallery of Saskatchewan*
*Denotes projects for which BTY Group is providing services
BTy.com
2012 : 2-4%2013 : 3-4%2014 : 4-6%
2012 : 6-8%2013 : 5-7%2014 : 7-8%
“fueled by
increasing
investment in
the oilsands, the con-struction sector in
Alberta is showing strong signs of recovery. residential as well as
transportation and social infrastructure are
generating sustainable momentum for continued growth past 2012.”
“resources
are the big story in
saskatchewan,
with large-scale new
projects in potash
mines
development and oil and gas both sustaining de-mand for new housing and contributing to
an emerging labour shortage.”
Alistair deariesenior Associate
Graeme AlstonPartner
iNfrAsTrucTure reNewAl ANd
exPANsioN ANchor coNsTrucTioN
ProViNciAl sNAPshoTs ProViNciAl sNAPshoTs
$26.5
$0.72
$24.7
$3.2
$0
$5
$10
$15
$20
$25
$30
BUILDINGS RESOURCES ENERGY/ UTILITIES INFRASTRUCTURE
C O N S T R U C T I O N W O R K LO A D S BY S E C TO R I N $ B I L L I O N S
Sources: Inventory of major Alberta Projects, Government of Alberta, September 2011; construction projects in Alberta valued at $5 million or greater that are planned, underway, or have recently been completed.
$15.8
$14.4
$9.4
$3
$0
$2
$4
$6
$8
$10
$12
$14
$16
$18
BUILDINGS RESOURCES ENERGY/ UTILITIES INFRASTRUCTURE
C O N S T R U C T I O N W O R K LO A D BY S E C TO R I N $ B I L L I O N S
Sources: Saskatchewan Major Projects Inventory, 2011; major projects in Saskatchewan, valued at $2 million or greater, that are in planning, design, or construction phases .
mArkeT iNTelliGeNce rePorT - 4Th QuArTer, 2011
BTy.com
Major ongoing infrastructure projects include:
• $3.1 billion Gateway Program: widening Hwy 1 and twinning Port Mann Bridge (2014 com-pletion)• South Fraser Perimeter Road (2013 completion)• $1.4 billion Evergreen Rapid Transit Line (2015 completion)
Major social infrastructure projects include:
• $700 million redevelopment of Children’s and Women’s Health Centre• $239 million Surrey Memorial Hospital Expansion• $225 million Supportive Housing Initiative
Major mining and energy projects include:
• $917 million Mt. Milligan mine • $XXX million Encana/Apache Kitimat Liquid Natural Gas Terminal • $310 Million Tusequah Chief mine (proposed)• $1.5 billion New Prosperity Mine (proposed)• $7.9 billion Site C Dam (start 2013)
$38.2
$3.7
$13.3
$5.6
$0
$5
$10
$15
$20
$25
$30
$35
$40
$45
BUILDINGS RESOURCES ENERGY/ UTILITIES INFRASTRUCTURE
C O N S T R U C T I O N W O R K LO A D BY S E C TO R I N $ B I L L I O N S
Sources: Commission de la Construction de Québec (CCQ), Revue de l’activité, 2e trimestre 2011 Projets importants en cours au deuxième trimestre de 2011 and Statistics Canada, Capital Expenditures for Construction by sector, 2011 intentions .
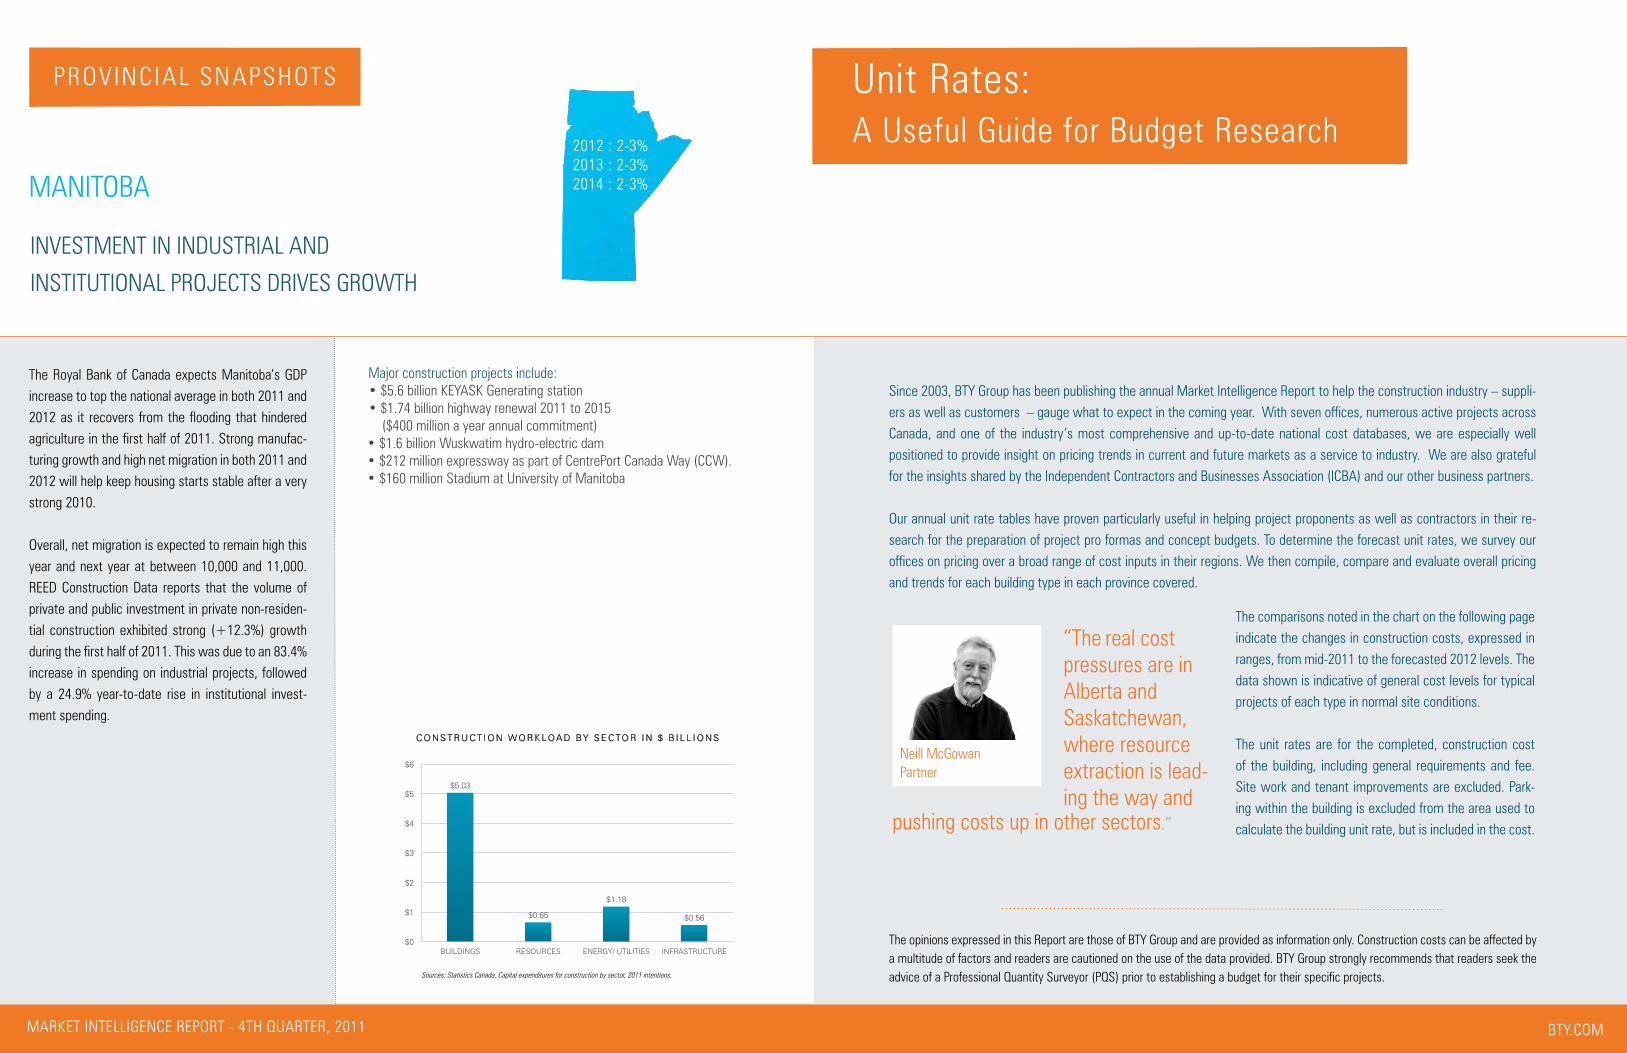
The royal Bank of canada expects manitoba’s GdP increase to top the national average in both 2011 and 2012 as it recovers from the flooding that hindered agriculture in the first half of 2011. strong manufac-turing growth and high net migration in both 2011 and 2012 will help keep housing starts stable after a very strong 2010.
overall, net migration is expected to remain high this year and next year at between 10,000 and 11,000. reed construction data reports that the volume of private and public investment in private non-residen-tial construction exhibited strong (+12.3%) growth during the first half of 2011. This was due to an 83.4% increase in spending on industrial projects, followed by a 24.9% year-to-date rise in institutional invest-ment spending.
mANiToBA
Major construction projects include:• $5.6 billion KEYASK Generating station• $1.74 billion highway renewal 2011 to 2015 ($400 million a year annual commitment)• $1.6 billion Wuskwatim hydro-electric dam• $212 million expressway as part of CentrePort Canada Way (CCW).• $160 million Stadium at University of Manitoba
2012 : 2-3%2013 : 2-3%2014 : 2-3%
BTy.com
iNVesTmeNT iN iNdusTriAl ANd
INSTITUTIONAL PROJECTS DRIVES GROWTH
since 2003, BTy Group has been publishing the annual market intelligence report to help the construction industry – suppli-ers as well as customers – gauge what to expect in the coming year. With seven offices, numerous active projects across canada, and one of the industry’s most comprehensive and up-to-date national cost databases, we are especially well positioned to provide insight on pricing trends in current and future markets as a service to industry. we are also grateful for the insights shared by the Independent Contractors and Businesses Association (ICBA) and our other business partners.
Our annual unit rate tables have proven particularly useful in helping project proponents as well as contractors in their re-search for the preparation of project pro formas and concept budgets. To determine the forecast unit rates, we survey our offices on pricing over a broad range of cost inputs in their regions. we then compile, compare and evaluate overall pricing and trends for each building type in each province covered.
unit rates: A useful Guide for Budget research
The comparisons noted in the chart on the following page indicate the changes in construction costs, expressed in ranges, from mid-2011 to the forecasted 2012 levels. The data shown is indicative of general cost levels for typical projects of each type in normal site conditions.
The unit rates are for the completed, construction cost of the building, including general requirements and fee. site work and tenant improvements are excluded. Park-ing within the building is excluded from the area used to calculate the building unit rate, but is included in the cost.
Neill mcGowanPartner
“The real cost pressures are in Alberta and saskatchewan, where resource extraction is lead-ing the way and
pushing costs up in other sectors.”
The opinions expressed in this report are those of BTy Group and are provided as information only. construction costs can be affected by a multitude of factors and readers are cautioned on the use of the data provided. BTy Group strongly recommends that readers seek the advice of a Professional Quantity Surveyor (PQS) prior to establishing a budget for their specific projects.
$5.03
$0.65
$1.18
$0.56
$0
$1
$2
$3
$4
$5
$6
BUILDINGS RESOURCES ENERGY/ UTILITIES INFRASTRUCTURE
C O N S T R U C T I O N W O R K LO A D BY S E C TO R I N $ B I L L I O N S
Sources: Statistics Canada, Capital expenditures for construction by sector, 2011 intentions.
ProViNciAl sNAPshoTs
mArkeT iNTelliGeNce rePorT - 4Th QuArTer, 2011

BTy.com
cost data Parameters comparison of 2011 vs. 2012 levels
The comparisons below indicate the changes in construction costs, expressed in ranges, from 2011 to the forecasted 2012
levels. The data shown is indicative of general cost levels for typical projects of each type.
BTY Group strongly recommends that readers seek the advice of a Professional Quantity Surveyor (PQS) prior to establishing a budget for their specific projects.
mArkeT iNTelliGeNce rePorT - 4Th QuArTer, 2011
$/m² $/sq.ft $/m² $/sq.ft $/m² $/sq.ft $/m² $/sq.ft $/m² $/sq.ft $/m² $/sq.ft $/m² $/sq.ft $/m² $/sq.ft $/m² $/sq.ft $/m² $/sq.ft
Residential Care 2150 - 2370 200 - 220 2190 - 2420 203 - 225 2700 - 3200 251 - 297 2750 - 3260 256 - 303 1970 - 2060 183 - 192 2120 - 2230 197 - 207 2240 - 2550 208 - 237 2280 - 2600 212 - 242 2030 - 2140 185 - 195 2050 - 2160 191 - 201Ambulatory Care 4200 - 4410 390 - 410 4280 - 4500 398 - 418 4410 - 4640 410 - 431 4500 - 4900 418 - 455 4140 - 4350 385 - 404 4470 - 4700 415 - 436 4080 - 4590 379 - 426 4160 - 4680 387 - 434 4280 - 4500 398 - 418 4370 - 4590 406 - 426Acute Care 5220 - 5700 485 - 530 5320 - 5810 495 - 540 5500 - 6000 511 - 557 5800 - 6500 539 - 604 5150 - 5610 478 - 521 5560 - 6060 517 - 563 5300 - 5710 493 - 530 5410 - 5820 503 - 541 5320 - 5820 495 - 541 5590 - 6110 520 - 567
Research Labroratories 5390 - 5930 500 - 551 5500 - 6050 511 - 562 5300 - 6500 492 - 604 5400 - 6800 502 - 632 5410 - 6170 503 - 573 5850 - 6660 543 - 619 5510 - 6230 512 - 578 5620 - 6350 522 - 590 5420 - 5990 504 - 557 5420 - 5990 504 - 557Teaching Laboratories 4210 - 4640 391 - 431 4290 - 4730 400 - 440 4590 - 5500 427 - 511 4690 - 5650 436 - 525 4360 - 4810 405 - 447 4710 - 5190 437 - 483 4690 - 5400 436 - 502 4790 - 5510 445 - 512 4240 - 4680 394 - 435 4240 - 4680 394 - 435Animal Research 6680 - 7350 620 - 683 6810 - 7500 635 - 700 6970 - 7720 648 - 717 7100 - 7800 660 - 725 6910 - 7410 642 - 689 7460 - 8000 693 - 744 5490 - 7190 510 - 668 5600 - 7330 520 - 681 6460 - 7320 600 - 680 6460 - 7320 600 - 680
Rental Units 1980 - 2530 184 - 235 1980 - 2530 184 - 235 2330 - 2980 216 - 277 2321 - 2984 216 - 277 2250 - 2770 209 - 257 2430 - 2990 225 - 278 2150 - 2770 200 - 257 2200 - 2820 204 - 262 1720 - 2230 160 - 207 1720 - 2230 160 - 207Market Units Mid End Specifications 2260 - 2890 210 - 268 2260 - 2890 210 - 268 2640 - 3390 245 - 315 2638 - 3390 245 - 315 2450 - 3140 227 - 292 2640 - 3390 245 - 315 2450 - 3150 227 - 293 2490 - 3220 231 - 299 1980 - 2530 184 - 235 1980 - 2530 184 - 235Market Units High End Specifications 2700 - 3470 251 - 322 2700 - 3470 251 - 322 3160 - 4070 294 - 378 3164 - 4069 294 - 378 2930 - 3780 272 - 351 3170 - 4080 294 - 379 2930 - 3790 272 - 352 2990 - 3870 277 - 359 2420 - 3230 225 - 300 2420 - 3230 225 - 300
Rental Units 1220 - 1450 113 - 135 1220 - 1450 113 - 135 1270 - 1530 118 - 142 1274 - 1526 118 - 142 1330 - 1590 123 - 148 1390 - 1670 129 - 155 1120 - 1330 104 - 123 1140 - 1350 106 - 125 1070 - 1290 100 - 120 1070 - 1290 100 - 120Market Units Mid End Specifications 1410 - 1680 131 - 156 1410 - 1680 131 - 156 1410 - 1690 131 - 157 1411 - 1690 131 - 157 1470 - 1760 137 - 163 1540 - 1840 143 - 171 1330 - 1530 123 - 142 1350 - 1560 125 - 145 1290 - 1620 120 - 150 1290 - 1620 120 - 150Market Units High End Specifications 1790 - 2120 166 - 197 1790 - 2120 166 - 197 1550 - 1850 144 - 172 1547 - 1853 144 - 172 1610 - 1930 150 - 180 1690 - 2030 157 - 188 1640 - 1940 152 - 181 1670 - 1990 155 - 185 1610 - 2150 150 - 200 1610 - 2150 150 - 200
Rental Units 1040 - 1250 97 - 116 1040 - 1250 97 - 116 1090 - 1310 101 - 122 1090 - 1310 101 - 122 1130 - 1360 105 - 126 1190 - 1430 110 - 133 1120 - 1330 104 - 123 1140 - 1350 106 - 125 910 - 1100 85 - 102 910 - 1100 85 - 102Market Units Mid End Specifications 1130 - 1350 105 - 125 1130 - 1350 105 - 125 1230 - 1470 114 - 137 1230 - 1470 114 - 137 1270 - 1530 118 - 142 1340 - 1600 124 - 149 1230 - 1430 114 - 133 1250 - 1460 116 - 136 1080 - 1290 100 - 120 1080 - 1290 100 - 120Market Units High End Specifications 1220 - 1450 113 - 135 1220 - 1450 113 - 135 1370 - 1640 127 - 152 1370 - 1640 127 - 152 1420 - 1700 132 - 158 1490 - 1790 138 - 166 1430 - 1730 133 - 161 1460 - 1770 136 - 164 1290 - 1610 120 - 150 1290 - 1610 120 - 150
Strip Plaza 1030 - 1430 96 - 133 1030 - 1430 96 - 133 1130 - 1580 105 - 147 1140 - 1620 106 - 151 1130 - 1580 105 - 147 1190 - 1660 110 - 154 1230 - 1530 114 - 142 1250 - 1560 116 - 145 960 - 1290 90 - 120 980 - 1316 91 - 122Enclosed Mall 2360 - 3080 220 - 286 2360 - 3080 220 - 286 2600 - 3390 242 - 315 2650 - 3460 153 - 321 2600 - 3390 242 - 315 2730 - 3560 254 - 331 1530 - 1830 142 - 170 1560 - 1870 145 - 173 2020 - 2640 188 - 245 2040 - 2670 190 - 248Anchor/Department Store 1900 - 2350 177 - 219 1900 - 2350 177 - 219 2090 - 2600 194 - 242 2130 - 2650 198 - 246 2090 - 2600 194 - 242 2190 - 2730 203 - 254 1870 - 2200 173 - 204 1900 - 2240 176 - 208 1620 - 2020 151 - 188 1640 - 2040 152 - 190Supermarket 1450 - 1800 134 - 167 1450 - 1800 134 - 167 1580 - 1980 147 - 184 1610 - 2020 150 - 188 1580 - 1980 147 - 184 1660 - 2070 154 - 193 1370 - 1760 128 - 163 1410 - 1790 131 - 166 1230 - 1540 114 - 143 1240 - 1555 115 - 145Discount Store 1190 - 1640 111 - 152 1190 - 1640 111 - 152 1330 - 1810 124 - 168 1360 - 1850 126 - 172 1300 - 1810 120 - 168 1360 - 1900 126 - 177 1120 - 1330 104 - 123 1140 - 1350 106 - 125 1010 - 1410 94 - 131 1020 - 1424 95 - 132
Under 5 Storeys 1440 - 1700 133 - 158 1440 - 1700 133 - 158 1540 - 1840 143 - 171 1570 - 1900 146 - 177 1450 - 1750 135 - 162 1560 - 1900 145 - 177 1530 - 1830 142 - 170 1560 - 1870 145 - 173 1190 - 1400 110 - 130 1220 - 1441 113 - 1345 - 10 Storeys 1770 - 2230 164 - 207 1770 - 2230 164 - 207 1890 - 2410 176 - 224 1930 - 2500 179 - 232 1790 - 2280 166 - 212 1930 - 2470 180 - 229 1640 - 2040 152 - 190 1670 - 2090 155 - 194 1390 - 1830 130 - 170 1441 - 1885 134 - 17510 - 20 Storeys 1910 - 2410 177 - 224 1910 - 2410 177 - 224 2050 - 2590 190 - 241 2090 - 2700 194 - 251 1940 - 2470 181 - 230 2100 - 2670 195 - 248 1830 - 2240 170 - 208 1870 - 2280 173 - 212 1610 - 2040 150 - 190 1664 - 2217 155 - 20620 - 30 Storeys 2190 - 2780 203 - 258 2190 - 2780 203 - 258 2360 - 2990 219 - 278 2400 - 3100 223 - 288 2230 - 2840 207 - 264 2410 - 3070 224 - 285 2040 - 2550 190 - 237 2090 - 2600 194 - 242 1730 - 2260 160 - 210 1780 - 2330 166 - 216
Metro Highway Lane (Paving 200-280mm)Non-Metro Highway Lane (Paving 200-280mm)
Metro 4 lane road steel girder OverpassNon-Metro 4 lane road steel girder Overpass
PROJECT CATEGORY
$/m$/m
1,671,800 - 1,805,4001,639,040 - 1,770,045
$/m
1,617,960 - 1,715,9301,835,600 - 1,982,3001,799,595 - 1,943,4051,166,357 - 1,270,0801,079,960 - 1,176,000
Saskatchewan
$/km Lane$/km Lane
Ontario
$/km Lane $/km Lane
2012British Columbia
20122011
$/km Lane1,650,300 - 1,750,250
$/km Lane
Quebec2011
Alberta
1,876,000 - 2,026,0001,839,460 - 1,986,460 1,811,600 - 1,921,400
$/km Lane
1,776,070 - 1,883,7401,695,000 - 1,845,300
$/km Lane
2012201120122011 20122011
36,128 - 44,057 36,850 - 45,900
1,062,633 - 1,157,036 983,920 - 1,071,330
$/m $/m$/m $/m$/m
1,662,080 - 1,809,080
39,668 - 48,375 31,100 - 39,500 36,680 - 44,84035,954 - 43,96130,495 - 38,75340,500 - 49,400 36,905 - 44,906 39,857 - 48,498 36,247 - 43,84036,247 - 43,840
$/km Lane$/km Lane1,560,730 - 1,675,1901,560,730 - 1,675,190
1,713,990 - 1,839,120
$/m
1,713,990 - 1,839,120
$/m33,400 - 40,80032,745 - 40,037 33,012 - 39,92733,012 - 39,92728,300 - 36,00027,773 - 35,294 36,299 - 44,16833,611 - 40,897
Office
Roads - Paving
Road Overpass Bridge Structure
Health Care
Laboratories
High-rise Residential
Low-rise Residential
Townhouses (Wood Frame)
Shopping Centres

BTy Group’s market intelligence and market intelligence updates analyze and report on industry trends to provide insights on current and future con-struction markets across canada. To learn more, please visit our web site at www.bty.com or contact:
saira muzaffar, marketing & communications managerT: (416) 596-9339 e: [email protected]
PACIFIC2288 Manitoba StreetVancouver, BCV5Y 4B5T: 604-734-3126 F: 604-734-3136IES740 – 640 8th Avenue SWCalgary, ABT2P 1G7T: 403-269-5155F: 403-269-1046
PRAIRIES
1100 -640 8th Avenue SWCalgary, ABT2P 1G7T: 403-269-5155F: 403-269-1046
100 – 10426 81 AvenueEdmonton, ABT6E 1X5T: 780-439-0056F: 780-433-2458
115B – 115 2nd Avenue N, Saskatoon, SK S7K 2B1T: 306-242-
CENTRAL119 Spadina Ave, Suite 305Toronto, ONM5V 2L1T: 416-596-9339F: 416-596-1093
63 Church Street, Suite 500St. Catharines, ONL2R 3C4 T: 905-680-2344F: 905-680-2432
1000 Rue de La Gauchetiere Ouest24th Floor, Suite 2441Montreal, QCH3B 4W5T: 514-933-4500