pepco falleeil
TRANSCRIPT

41st EEI Financial ConferenceNovember 5 – 8, 2006
Table of ContentsTopic
BeginningPage No.
22Pepco Energy Services
25Mirant and Cross-Border Leases
40Appendix – GAAP Reconciliation
39Appendix – Conectiv Energy
30Appendix – Power Delivery & Regulatory
27Summary
17Conectiv Energy
16Power Delivery – Summary
15Power Delivery – Mid Atlantic Power Pathway Project11Power Delivery – Regulatory
9Sales
5Financial Performance
4Overview 3Safe Harbor Statement
2

Safe Harbor Statement
Some of the statements contained in today’s presentation are forward-looking statements within the meaning of Section 21E of the Securities Exchange Act of 1934 and are subject to the safe harbor created by the Private Securities Litigation Reform Act of 1995. These statements include all financial projections and any declarations regarding management’s intents, beliefs or current expectations. In some cases, you can identify forward-looking statements by terminology such as “may,” “will,” “should,” “expects,” “plans,” “anticipates,” “believes,”“estimates,” “predicts,” “potential” or “continue” or the negative of such terms or other comparable terminology. Any forward-looking statements are not guarantees of future performance, and actual results could differ materially from those indicated by the forward-looking statements. Forward-looking statements involve estimates, assumptions, known and unknown risks, uncertainties and other factors that may cause actual results, levels of activity, performance or achievements to be materially different from any future results, levels of activity, performance or achievements expressed or implied by such forward-looking statements. Each forward-looking statement speaks only as of the date of the particular statement, and we undertake no obligation to publicly update or revise any forward-looking statement, whether as a result of new information, future events or otherwise. A number of factors could cause actual results or outcomes to differ materially from those indicated by the forward-looking statements contained in this presentation. These factors include, but are not limited to, prevailing governmental policies and regulatory actions affecting the energy industry, including with respect to allowed rates of return, industry and rate structure, acquisition and disposal of assets and facilities, operation and construction of plant facilities, recovery of purchased power expenses, and present or prospective wholesale and retail competition; changes in and compliance with environmental and safety laws and policies; weather conditions; population growth rates and demographic patterns; competition for retail and wholesale customers; general economic conditions, including potential negative impacts resulting from an economic downturn; growth in demand, sales and capacity to fulfill demand; changes in tax rates or policies or in rates of inflation; potential changes in accounting standards or practices; changes in project costs; unanticipated changes in operating expenses and capital expenditures; the ability to obtain funding in the capital markets on favorable terms; restrictions imposed by Federal and/or state regulatory commissions; legal and administrative proceedings (whether civil or criminal) and settlements that influence our business and profitability; pace of entry into new markets; volatility in market demand and prices for energy, capacity and fuel; interest rate fluctuations and credit market concerns; and effects of geopolitical events, including the threat of domestic terrorism. Readers are referred to the most recent reports filed with the Securities and Exchange Commission.
3
PHI Overview
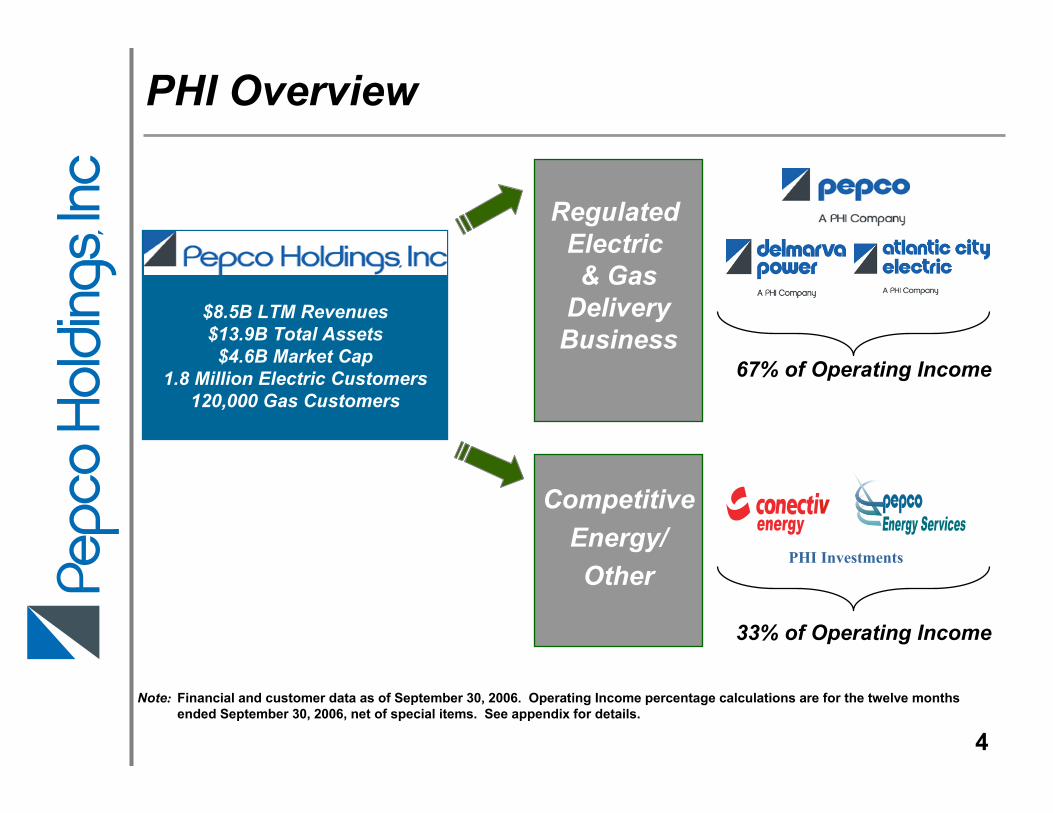
$8.5B LTM Revenues $13.9B Total Assets$4.6B Market Cap
1.8 Million Electric Customers120,000 Gas Customers
Regulated Electric & Gas
DeliveryBusiness
Regulated Electric & GasDeliveryBusiness
CompetitiveEnergy/Other
67% of Operating Income
33% of Operating Income
Financial and customer data as of September 30, 2006. Operating Income percentage calculations are for the twelve months ended September 30, 2006, net of special items. See appendix for details.
PHI Investments
Note:
4
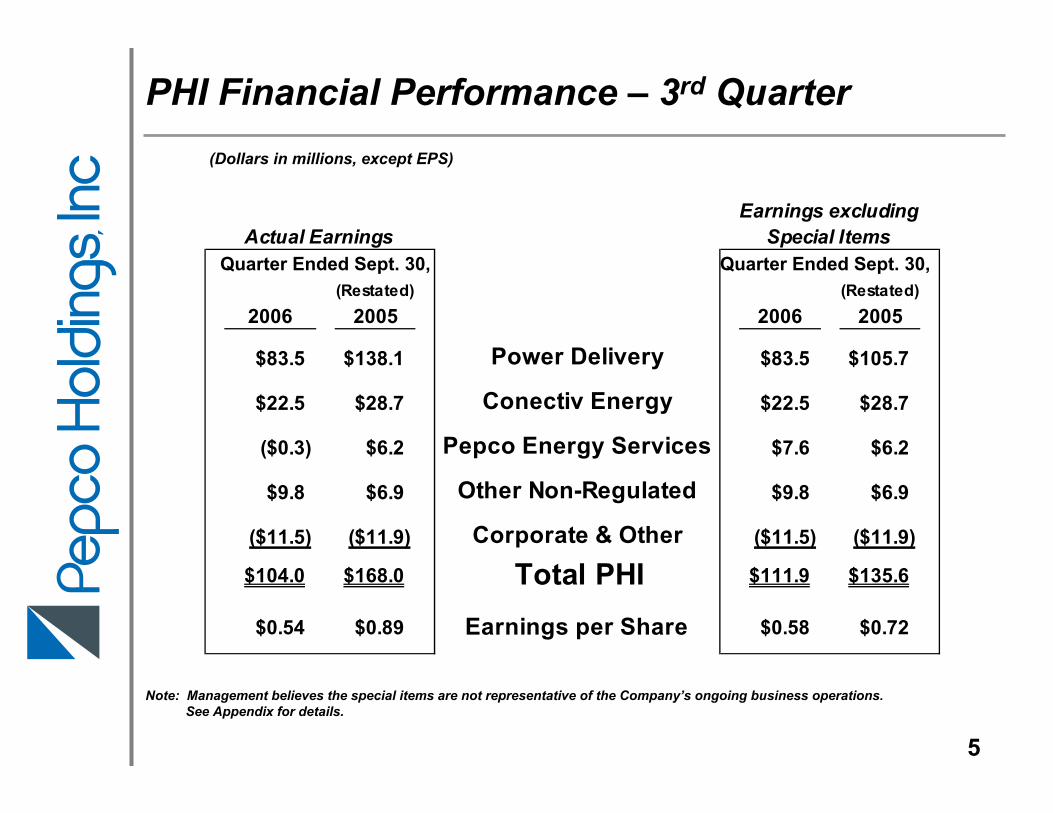
(Restated) (Restated)2006 2005 2006 2005
$83.5 $138.1 Power Delivery $83.5 $105.7
$22.5 $28.7 Conectiv Energy $22.5 $28.7
($0.3) $6.2 Pepco Energy Services $7.6 $6.2
$9.8 $6.9 Other Non-Regulated $9.8 $6.9
($11.5) ($11.9) Corporate & Other ($11.5) ($11.9)
$111.9 $135.6
Earnings excludingActual Earnings Special Items
$104.0 $168.0 Total PHI$0.58 $0.72$0.54 $0.89 Earnings per Share
Note: Management believes the special items are not representative of the Company’s ongoing business operations. See Appendix for details.
(Dollars in millions, except EPS)
PHI Financial Performance – 3rd Quarter
5
Quarter Ended Sept. 30, Quarter Ended Sept. 30,
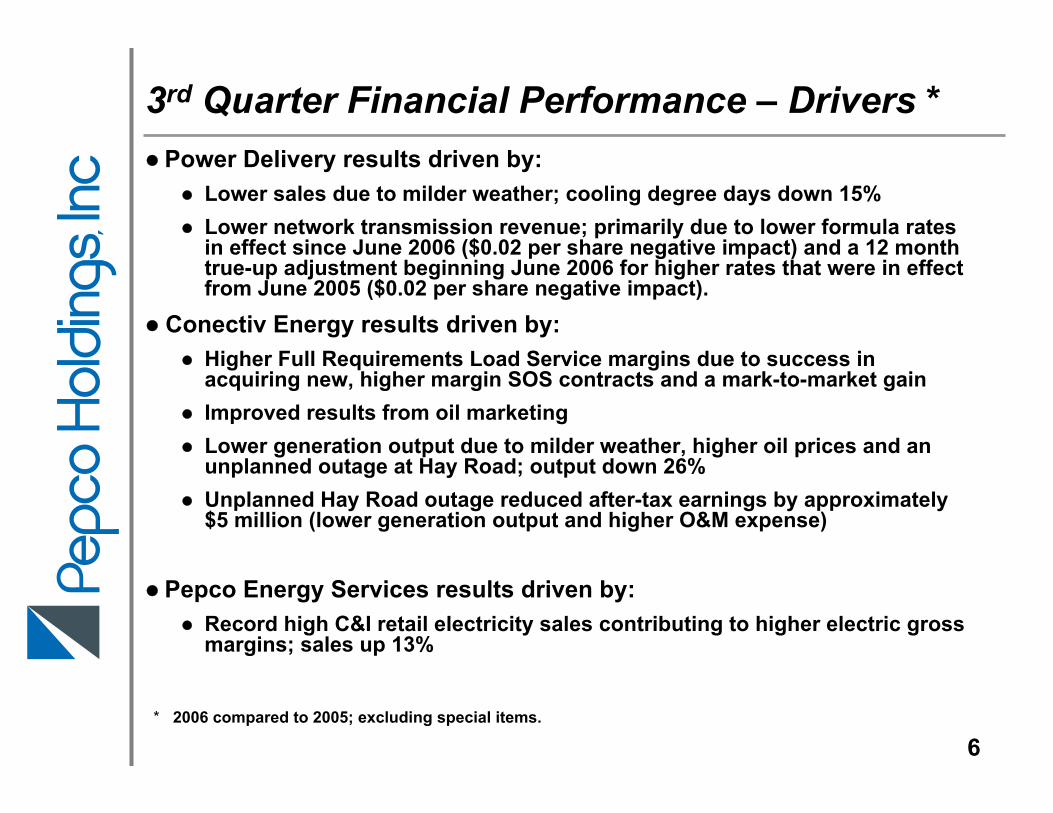
3rd Quarter Financial Performance – Drivers *Power Delivery results driven by:
Lower sales due to milder weather; cooling degree days down 15%Lower network transmission revenue; primarily due to lower formula rates in effect since June 2006 ($0.02 per share negative impact) and a 12 month true-up adjustment beginning June 2006 for higher rates that were in effect from June 2005 ($0.02 per share negative impact).
Conectiv Energy results driven by:Higher Full Requirements Load Service margins due to success in acquiring new, higher margin SOS contracts and a mark-to-market gainImproved results from oil marketingLower generation output due to milder weather, higher oil prices and an unplanned outage at Hay Road; output down 26%Unplanned Hay Road outage reduced after-tax earnings by approximately $5 million (lower generation output and higher O&M expense)
Pepco Energy Services results driven by:Record high C&I retail electricity sales contributing to higher electric gross margins; sales up 13%
* 2006 compared to 2005; excluding special items.
6
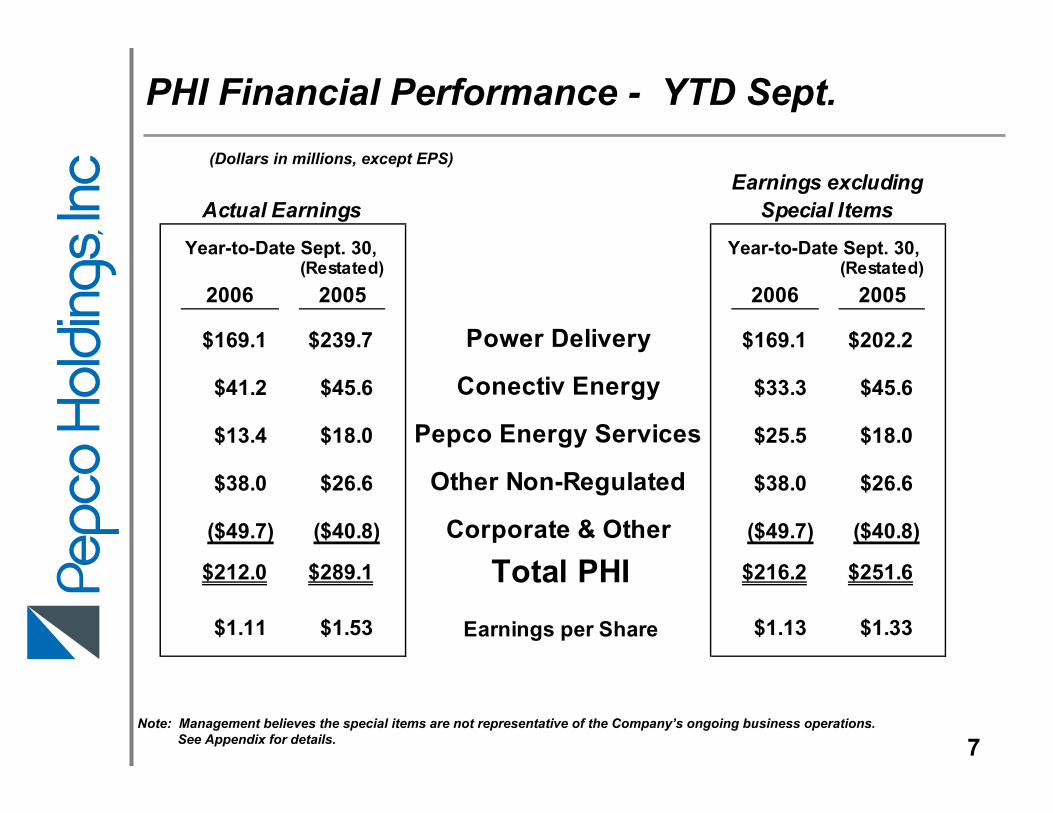
(Restated) (Restated)2006 2005 2006 2005
$169.1 $239.7 Power Delivery $169.1 $202.2
$41.2 $45.6 Conectiv Energy $33.3 $45.6
$13.4 $18.0 Pepco Energy Services $25.5 $18.0
$38.0 $26.6 Other Non-Regulated $38.0 $26.6
($49.7) ($40.8) Corporate & Other ($49.7) ($40.8)
$1.13 $1.33$1.11 $1.53 Earnings per Share
Total PHI
Earnings excludingActual Earnings Special Items
$289.1$212.0 $216.2 $251.6
Note: Management believes the special items are not representative of the Company’s ongoing business operations. See Appendix for details.
(Dollars in millions, except EPS)
PHI Financial Performance - YTD Sept.
7
Year-to-Date Sept. 30, Year-to-Date Sept. 30,
YTD 2006 Financial Performance – Drivers *Power Delivery results driven by:
Lower sales due to milder weather; cooling degree days down 11% and heating degree days down 17%Lower network transmission revenue; primarily due to lower formula rates in effect since June 2006 and a 12 month true-up adjustment beginning June 2006 for higher rates that were in effect from June 2005, partially offset by the effect of the higher rates in place prior to June 2006Higher O&M expense primarily due to increased storm-related activities and higher system maintenance costs
Conectiv Energy results driven by:Higher Full Requirements Load Service margins due to success in acquiring new, higher margin SOS contracts and a mark-to-market gainImproved results from oil, power and natural gas marketing Lower generation output primarily due to milder weather and higher oil prices; output down 27%Unplanned Hay Road outage reduced after-tax earnings by approximately $5 million (lower generation output and higher O&M expense)
Pepco Energy Services results driven by:Higher retail energy supply and energy services gross margins
* 2006 compared to 2005; excluding special items.
8
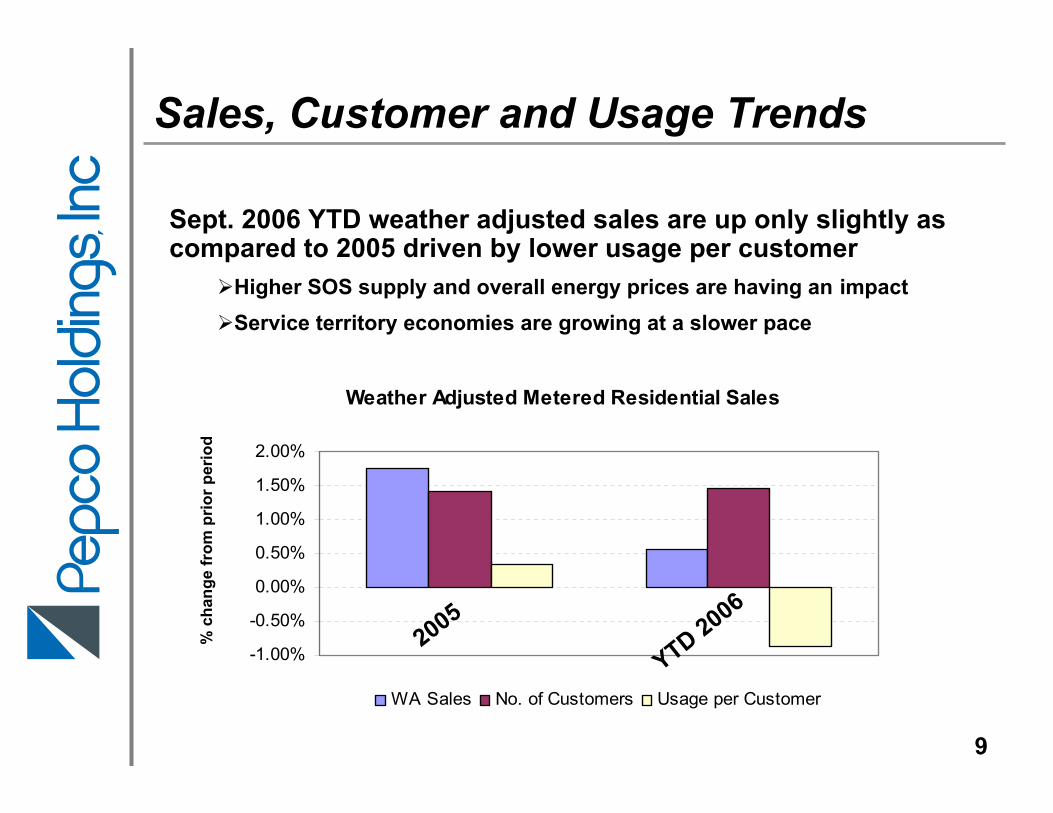
Sept. 2006 YTD weather adjusted sales are up only slightly as compared to 2005 driven by lower usage per customer
Higher SOS supply and overall energy prices are having an impactService territory economies are growing at a slower pace
9
Sales, Customer and Usage Trends
% c
hang
e fr
om p
rior p
erio
d
Weather Adjusted Metered Residential Sales
-1.00%
-0.50%
0.00%
0.50%
1.00%
1.50%
2.00%
WA Sales No. of Customers Usage per Customer
2005
YTD 2006
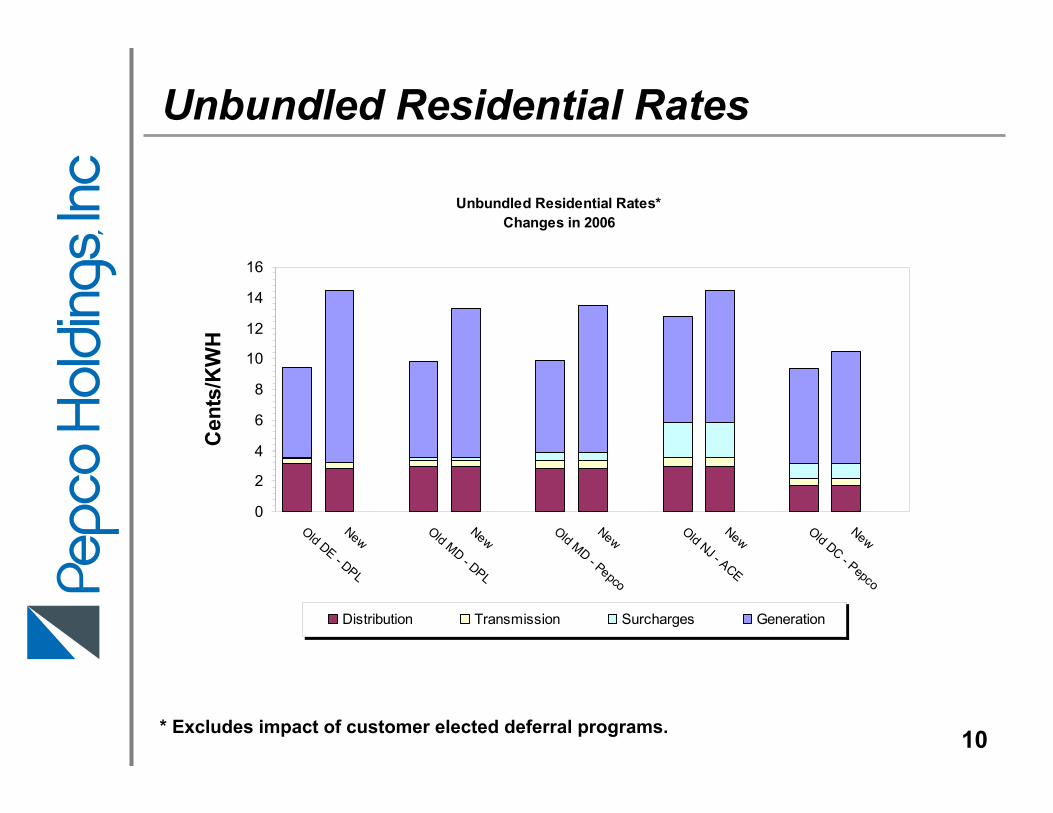
Unbundled Residential Rates
10
Unbundled Residential Rates*Changes in 2006
0
2
4
6
8
10
12
14
16
Old DE - DPL
NewOld MD - DPL
NewOld MD - Pepco
NewOld NJ - ACE
NewOld DC - Pepco
New
Cen
ts/K
WH
Distribution Transmission Surcharges Generation
* Excludes impact of customer elected deferral programs.
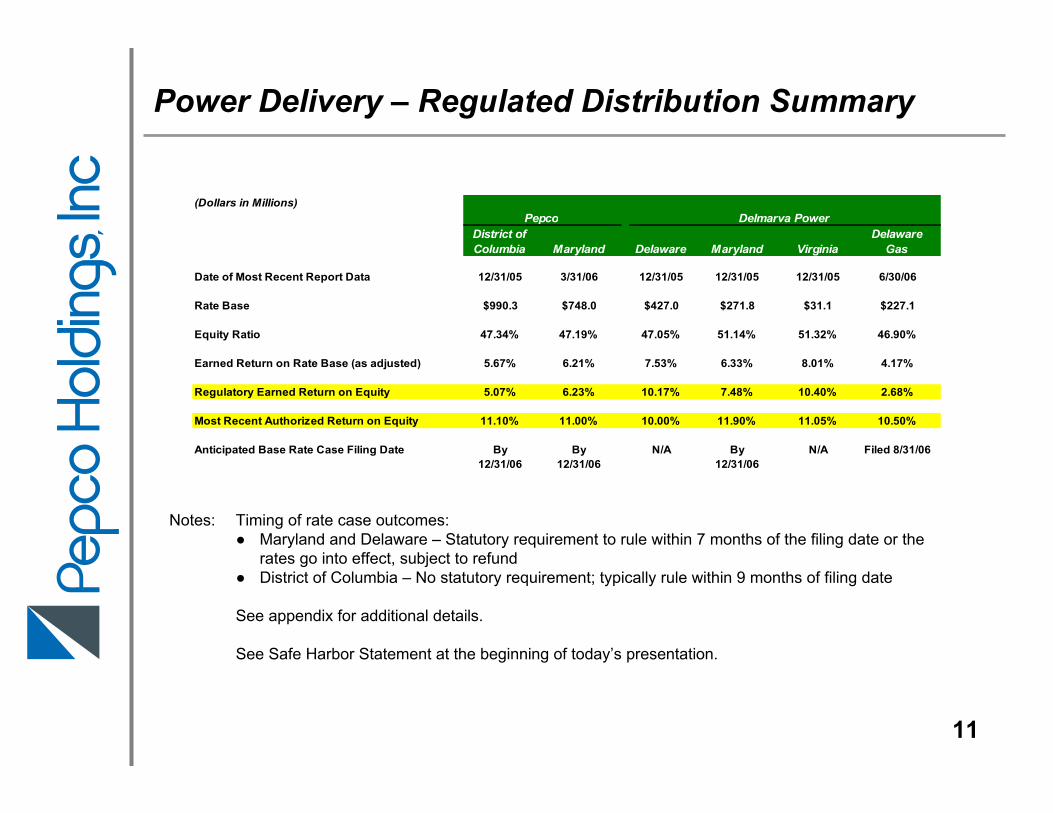
Power Delivery – Regulated Distribution Summary
(Dollars in Millions)
District of DelawareColumbia Maryland Delaware Maryland Virginia Gas
Date of Most Recent Report Data 12/31/05 3/31/06 12/31/05 12/31/05 12/31/05 6/30/06
Rate Base $990.3 $748.0 $427.0 $271.8 $31.1 $227.1 Equity Ratio 47.34% 47.19% 47.05% 51.14% 51.32% 46.90%
Earned Return on Rate Base (as adjusted) 5.67% 6.21% 7.53% 6.33% 8.01% 4.17%
Regulatory Earned Return on Equity 5.07% 6.23% 10.17% 7.48% 10.40% 2.68%
Most Recent Authorized Return on Equity 11.10% 11.00% 10.00% 11.90% 11.05% 10.50%
Anticipated Base Rate Case Filing Date By By N/A By N/A Filed 8/31/0612/31/06 12/31/06 12/31/06
Pepco Delmarva Power
11
Notes: Timing of rate case outcomes:● Maryland and Delaware – Statutory requirement to rule within 7 months of the filing date or the
rates go into effect, subject to refund● District of Columbia – No statutory requirement; typically rule within 9 months of filing date
See appendix for additional details.
See Safe Harbor Statement at the beginning of today’s presentation.
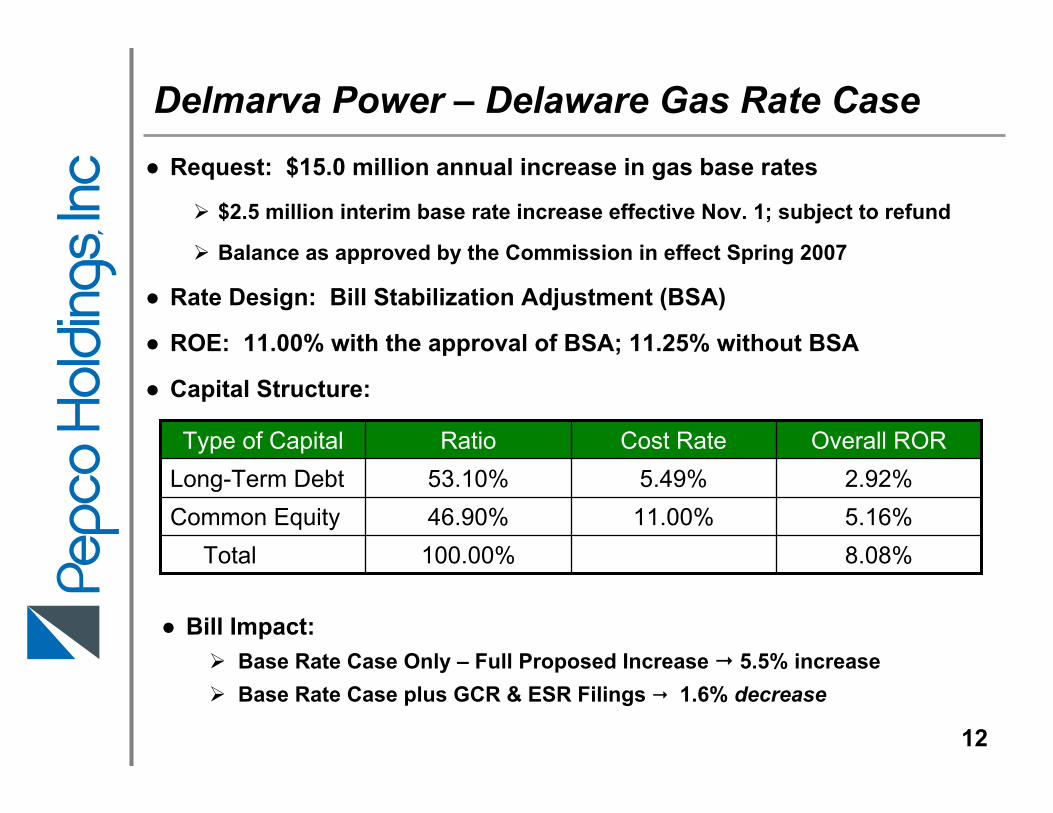
● Request: $15.0 million annual increase in gas base rates
$2.5 million interim base rate increase effective Nov. 1; subject to refund
Balance as approved by the Commission in effect Spring 2007
● Rate Design: Bill Stabilization Adjustment (BSA)
● ROE: 11.00% with the approval of BSA; 11.25% without BSA
● Capital Structure:
Delmarva Power – Delaware Gas Rate Case
12
8.08%100.00%Total5.16%11.00%46.90%Common Equity2.92%5.49%53.10%Long-Term Debt
Overall RORCost RateRatioType of Capital
● Bill Impact:Base Rate Case Only – Full Proposed Increase 5.5% increaseBase Rate Case plus GCR & ESR Filings 1.6% decrease
● Settlement approved by the FERC April 2006
● ROE – 10.8% for existing facilities, 11.3% for new facilities put into service on or after January 1, 2006
● Rates effective June 1, 2006 and include a settlement adjustment and true-up for rates in effect since June 1, 2005, which reflected a 12.9% requested ROE
● 50% / 50% sharing of pole attachment revenue
● Projects projected to be in-service in the current year are reflected in current rates
● Transmission rate base at December 31, 2005 - $880 million
Transmission Formula Rate Filing
13
Upcoming Regulatory Activity
● Pepco and Delmarva Power plan to file electric base rate cases in Maryland and Pepco plans to file in the District of Columbia by year-end 2006
● As in Delmarva Power’s gas case, bill stabilization adjustment mechanisms will be proposed
● Under bill stabilization adjustment mechanisms, revenue is “decoupled” from unit sales consumption and is tied to the growth in number of customers Eliminates revenue fluctuations due to weather and
changes in customer usage patterns
● Benefits of bill stabilization mechanisms:– Utility revenue will be more predictable and better aligned with
costs– Utilities will be better able to recover fixed costs– Customer bills will be more stable– Disincentives towards energy efficiency programs are reduced
14
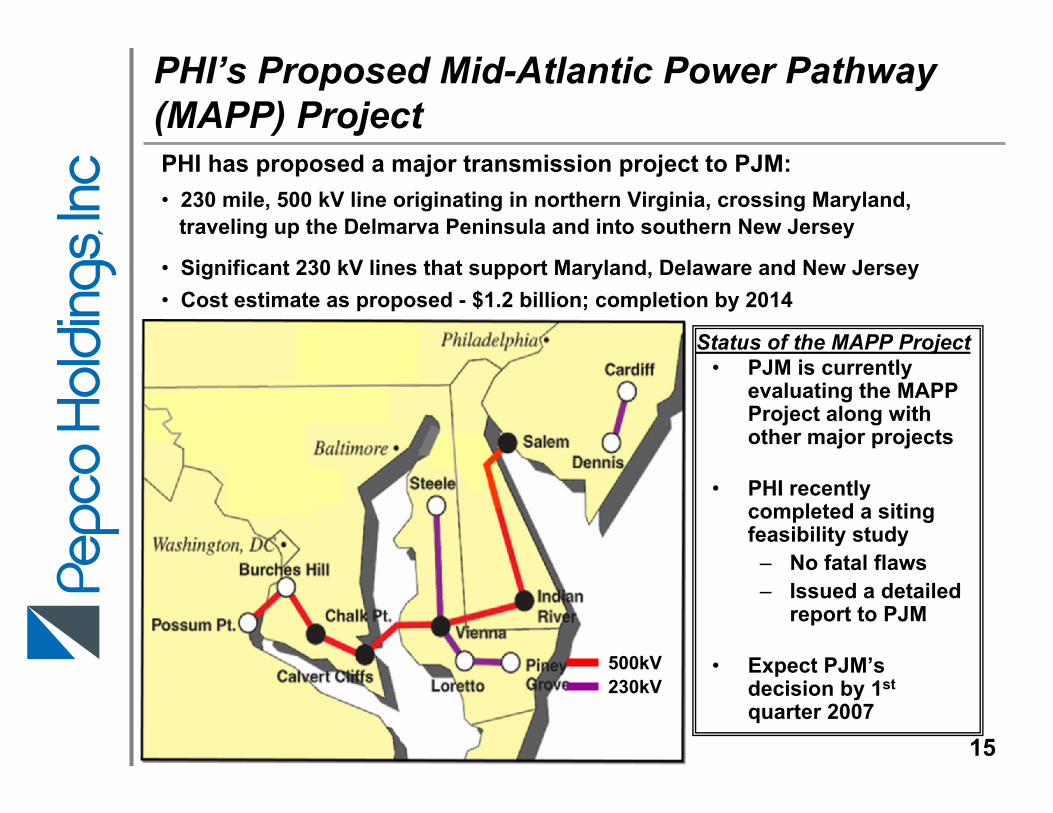
PHI’s Proposed Mid-Atlantic Power Pathway (MAPP) Project
• PJM is currently evaluating the MAPP Project along with other major projects
• PHI recently completed a sitingfeasibility study
– No fatal flaws – Issued a detailed
report to PJM
• Expect PJM’s decision by 1st
quarter 2007
PHI has proposed a major transmission project to PJM:• 230 mile, 500 kV line originating in northern Virginia, crossing Maryland,
traveling up the Delmarva Peninsula and into southern New Jersey
• Significant 230 kV lines that support Maryland, Delaware and New Jersey• Cost estimate as proposed - $1.2 billion; completion by 2014
Status of the MAPP Project
500kV230kV
15
Power Delivery Summary *
16
• Year-to-date 2006 sales increase (weather adjusted) of 0.2% versus an increase of 1.3% for the year 2005
• Transmission revenue true-up to negatively impact the first half of 2007
• Rate case filings on track – expect positive impact in the second half of 2007
• Operation and maintenance expenses expected to be essentially flat in 2007 versus 2006
* See Safe Harbor statement at the beginning of today’s presentation.
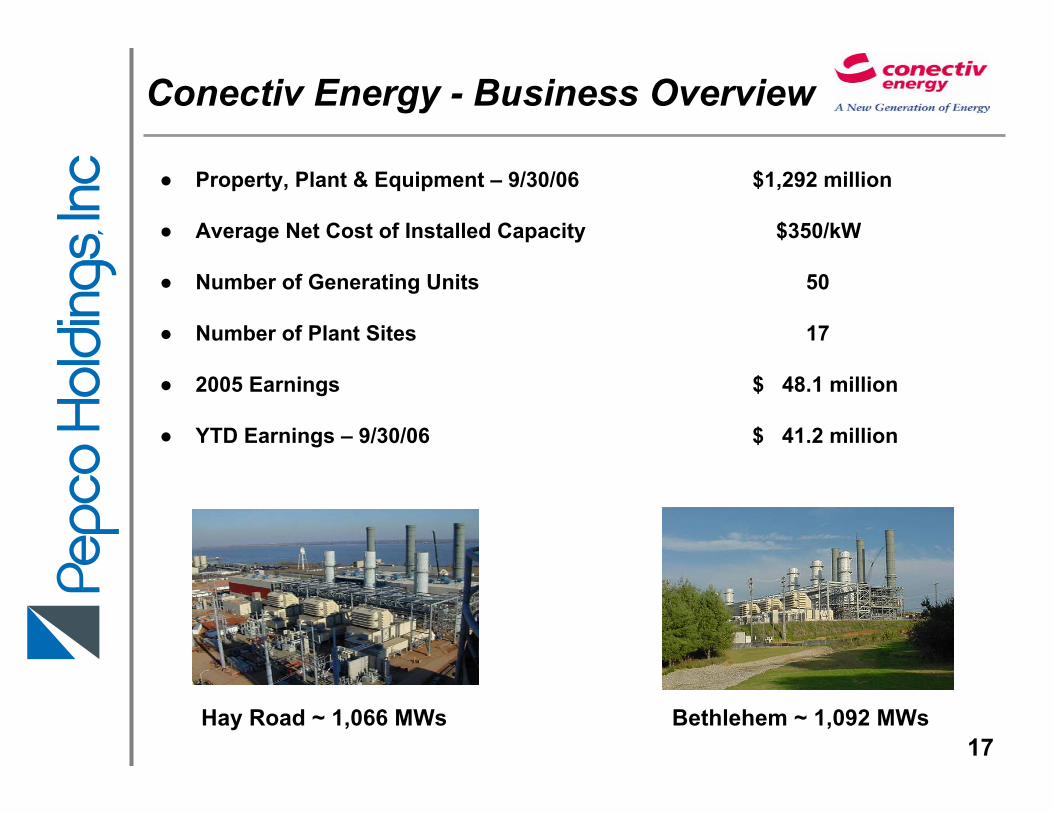
Conectiv Energy - Business Overview
Hay Road – 1,066 MW’s Bethlehem – 1,092 MW’s
● Property, Plant & Equipment – 9/30/06 $1,292 million
● Average Net Cost of Installed Capacity $350/kW
● Number of Generating Units 50
● Number of Plant Sites 17
● 2005 Earnings $ 48.1 million
● YTD Earnings – 9/30/06 $ 41.2 million
Hay Road ~ 1,066 MWs Bethlehem ~ 1,092 MWs17
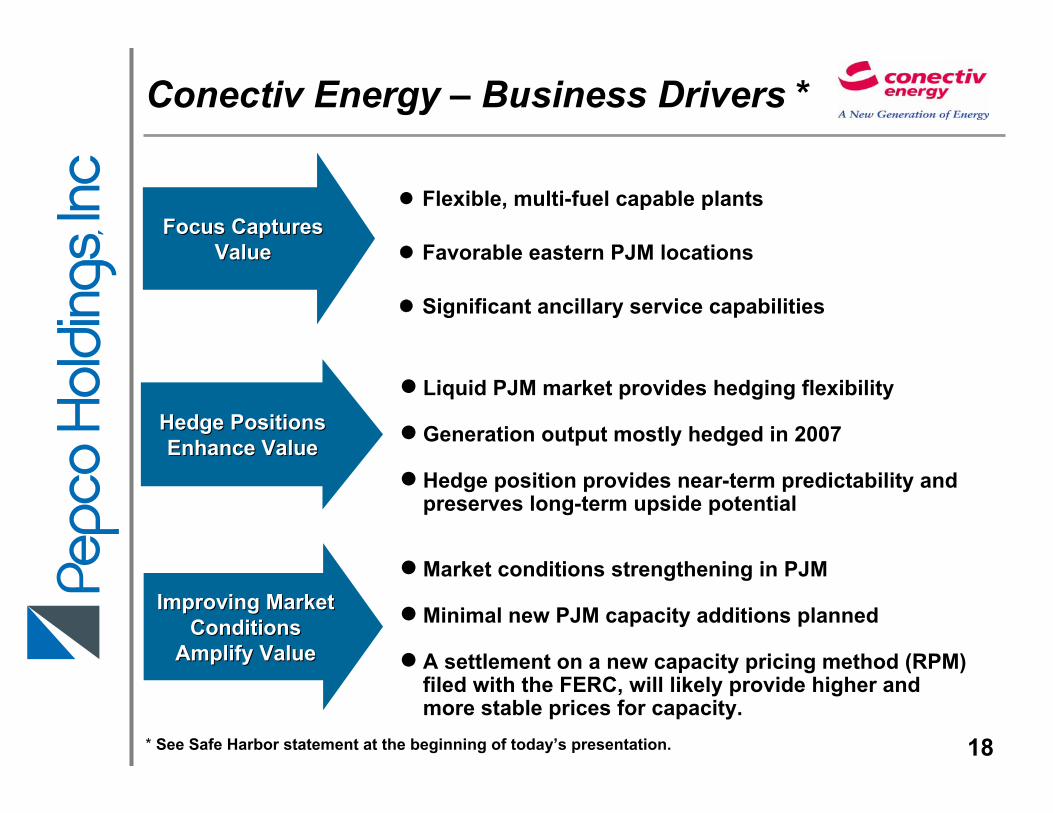
Conectiv Energy – Business Drivers *
● Liquid PJM market provides hedging flexibility
●Generation output mostly hedged in 2007
● Hedge position provides near-term predictability and preserves long-term upside potential
Hedge Positions Hedge Positions Enhance ValueEnhance Value
Improving Market Improving Market Conditions Conditions
Amplify ValueAmplify Value
●Market conditions strengthening in PJM
●Minimal new PJM capacity additions planned
● A settlement on a new capacity pricing method (RPM) filed with the FERC, will likely provide higher and more stable prices for capacity.
Focus Captures Focus Captures ValueValue
Flexible, multi-fuel capable plants
Favorable eastern PJM locations
Significant ancillary service capabilities
18* See Safe Harbor statement at the beginning of today’s presentation.
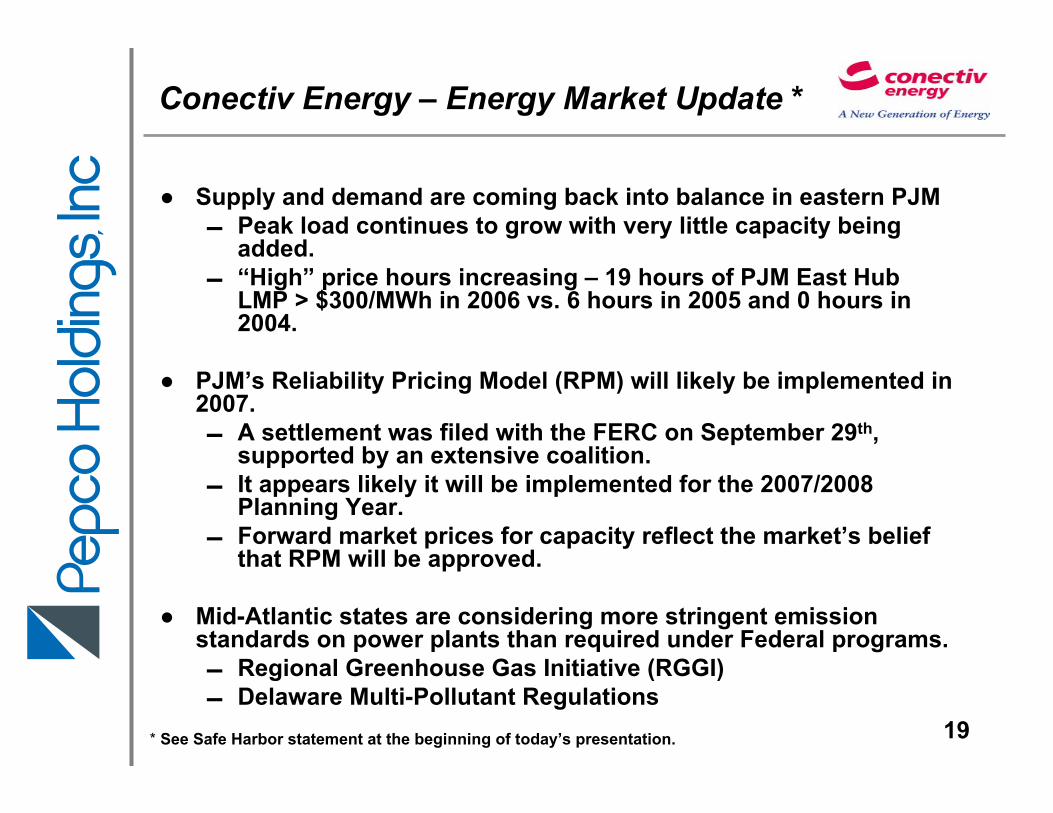
Conectiv Energy – Energy Market Update *
● Supply and demand are coming back into balance in eastern PJM Peak load continues to grow with very little capacity being
added. “High” price hours increasing – 19 hours of PJM East Hub
LMP > $300/MWh in 2006 vs. 6 hours in 2005 and 0 hours in 2004.
● PJM’s Reliability Pricing Model (RPM) will likely be implemented in 2007. A settlement was filed with the FERC on September 29th,
supported by an extensive coalition. It appears likely it will be implemented for the 2007/2008
Planning Year. Forward market prices for capacity reflect the market’s belief
that RPM will be approved.
● Mid-Atlantic states are considering more stringent emission standards on power plants than required under Federal programs. Regional Greenhouse Gas Initiative (RGGI) Delaware Multi-Pollutant Regulations
19* See Safe Harbor statement at the beginning of today’s presentation.
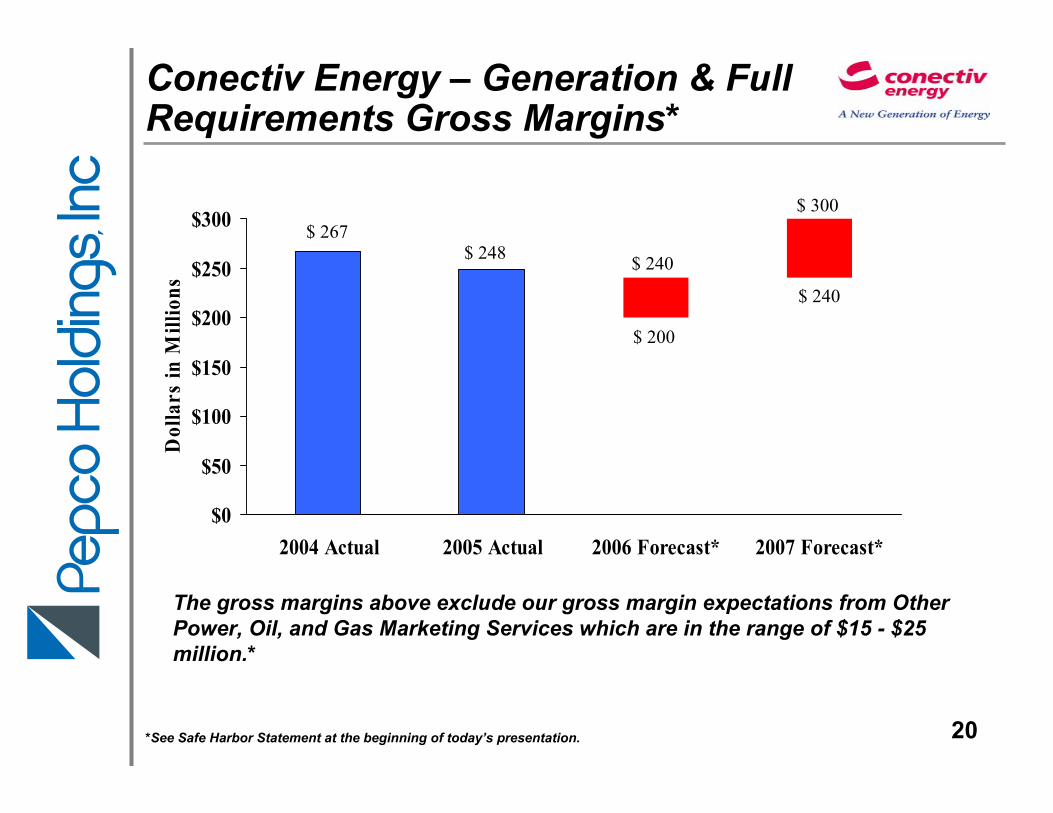
Conectiv Energy – Generation & Full Requirements Gross Margins*
$0
$50
$100
$150
$200
$250
$300
2004 Actual 2005 Actual 2006 Forecast* 2007 Forecast*
Dol
lars
in M
illio
ns
$ 267 $ 248 $ 240
$ 200
$ 300
$ 240
The gross margins above exclude our gross margin expectations from Other Power, Oil, and Gas Marketing Services which are in the range of $15 - $25 million.*
*See Safe Harbor Statement at the beginning of today’s presentation. 20
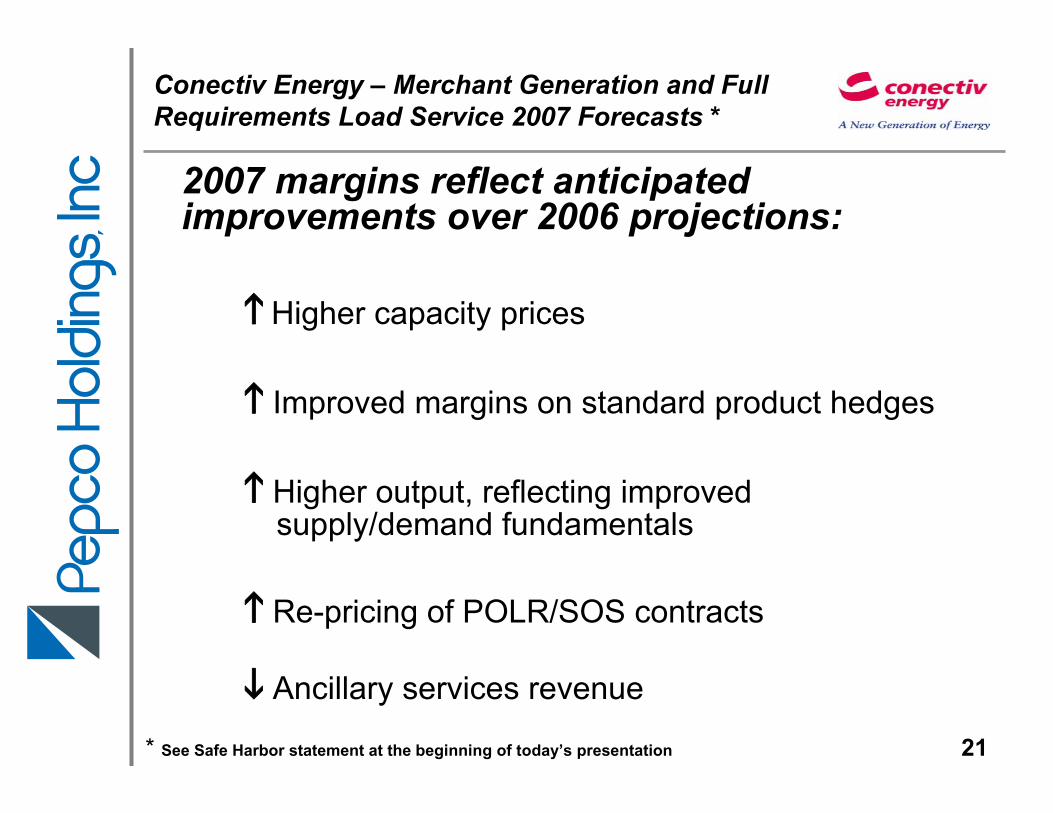
Conectiv Energy – Merchant Generation and FullRequirements Load Service 2007 Forecasts *
2007 margins reflect anticipated improvements over 2006 projections:
Higher capacity prices
Improved margins on standard product hedges
Higher output, reflecting improved supply/demand fundamentals
Re-pricing of POLR/SOS contracts
Ancillary services revenue
* See Safe Harbor statement at the beginning of today’s presentation 21
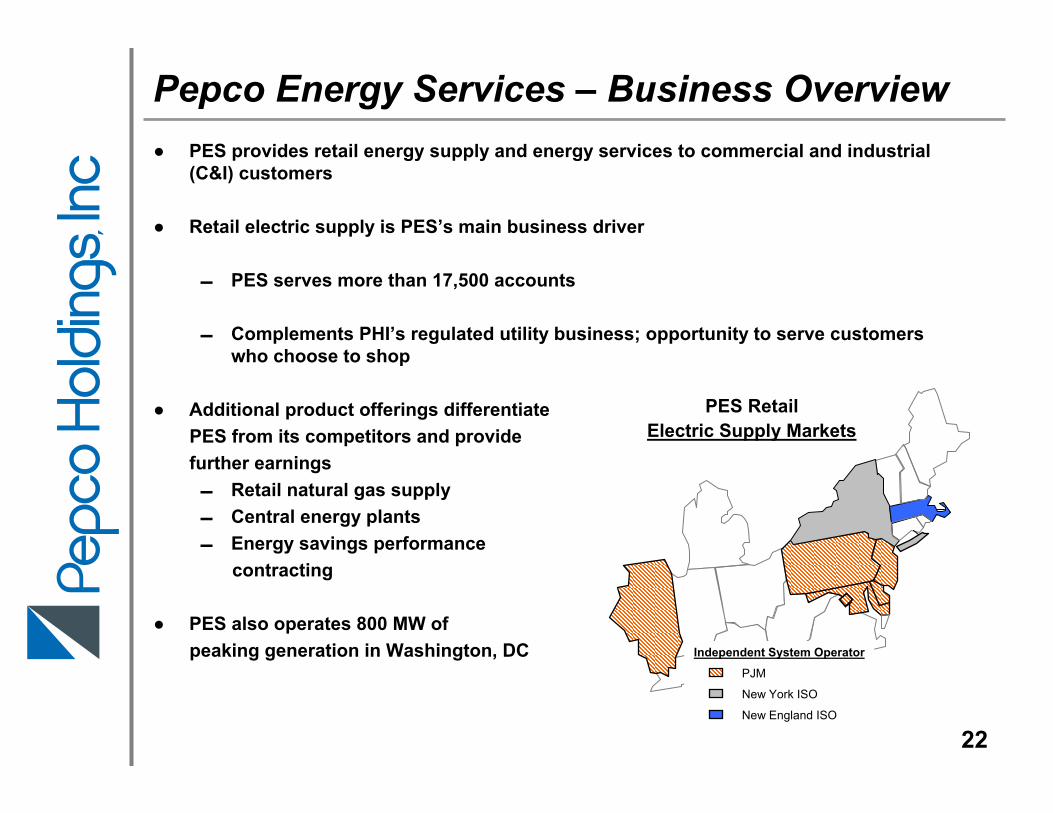
● PES provides retail energy supply and energy services to commercial and industrial (C&I) customers
● Retail electric supply is PES’s main business driver
PES serves more than 17,500 accounts
Complements PHI’s regulated utility business; opportunity to serve customers who choose to shop
● Additional product offerings differentiate PES from its competitors and providefurther earnings Retail natural gas supply Central energy plants Energy savings performance
contracting
● PES also operates 800 MW of peaking generation in Washington, DC
Pepco Energy Services – Business Overview
PES RetailElectric Supply Markets
Independent System Operator
PJM
New York ISO
New England ISO
22
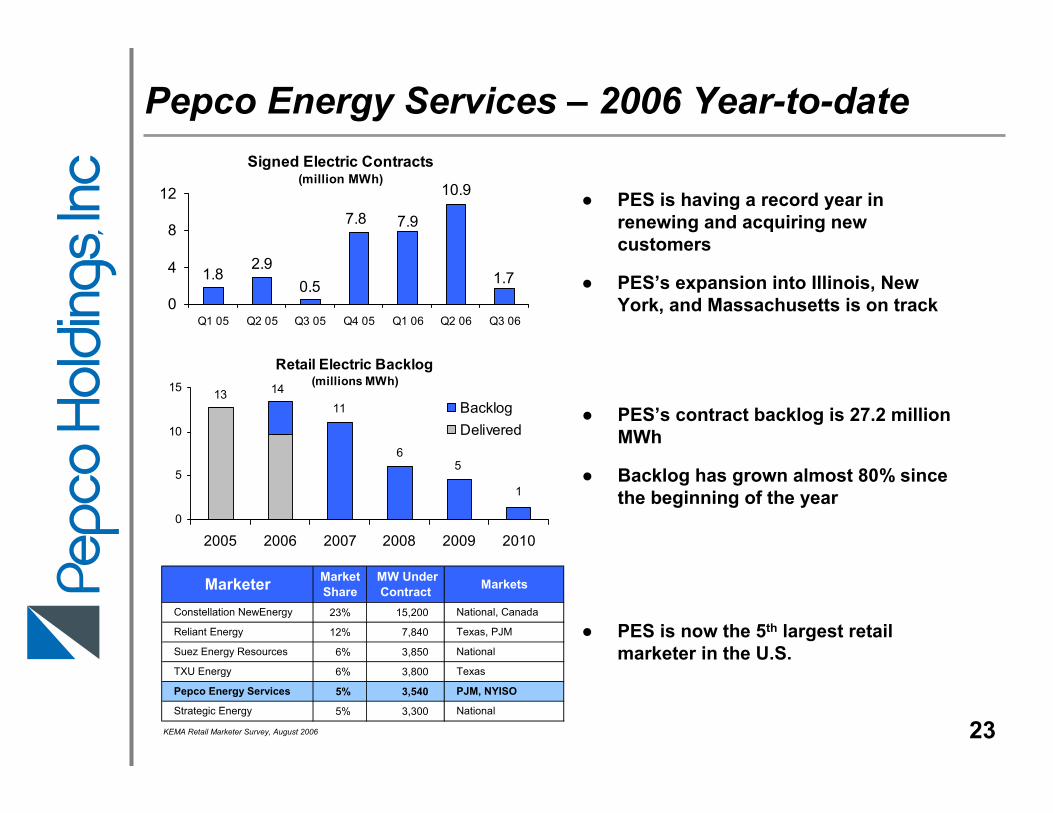
Pepco Energy Services – 2006 Year-to-date
● PES is having a record year in renewing and acquiring new customers
● PES’s expansion into Illinois, New York, and Massachusetts is on track
Signed Electric Contracts(million MWh)
0.5
7.8 7.9
10.9
1.72.9
1.8
0
4
8
12
Q1 05 Q2 05 Q3 05 Q4 05 Q1 06 Q2 06 Q3 06
● PES is now the 5th largest retail marketer in the U.S.
Retail Electric Backlog(millions MWh)
13 14
1
56
11
0
5
10
15
2005 2006 2007 2008 2009 2010
BacklogDelivered
● PES’s contract backlog is 27.2 million MWh
● Backlog has grown almost 80% since the beginning of the year
23% 15,200
12% 7,840
6% 3,850
6% 3,800
5% 3,540
5% 3,300
KEMA Retail Marketer Survey, August 2006
Constellation NewEnergy National, Canada
Reliant Energy Texas, PJM
Marketer
Pepco Energy Services PJM, NYISO
Strategic Energy National
Market Share
MW Under Contract Markets
Suez Energy Resources National
TXU Energy Texas
23
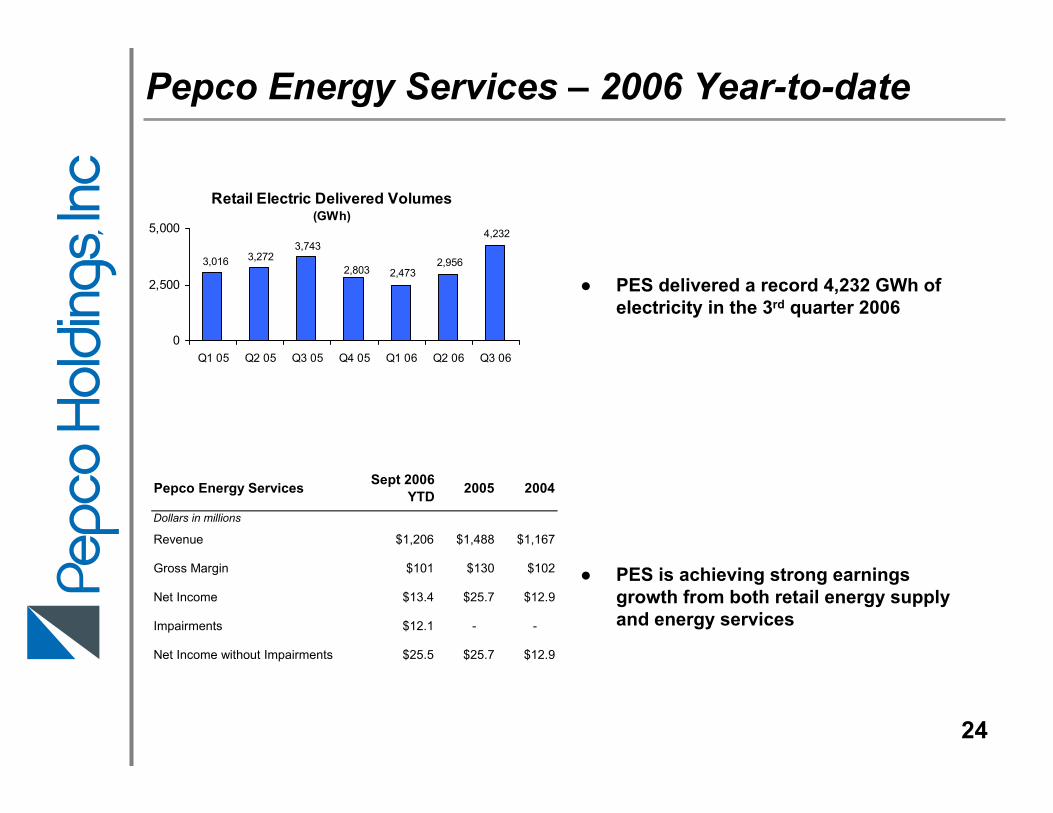
Pepco Energy Services – 2006 Year-to-date
● PES delivered a record 4,232 GWh of electricity in the 3rd quarter 2006
Retail Electric Delivered Volumes(GWh)
3,743
2,803 2,4732,956
4,232
3,2723,016
0
2,500
5,000
Q1 05 Q2 05 Q3 05 Q4 05 Q1 06 Q2 06 Q3 06
● PES is achieving strong earnings growth from both retail energy supply and energy services
Dollars in millions
Revenue $1,206 $1,488 $1,167
Gross Margin $101 $130 $102
Net Income $13.4 $25.7 $12.9
Impairments $12.1 - -
Net Income without Impairments $25.5 $25.7 $12.9
Sept 2006 YTD 2005 2004Pepco Energy Services
24
MirantSettlement Agreement
On August 9, 2006, the Bankruptcy Court approved the settlement agreement between Pepco and Mirant arising out of Mirant’s 2003 bankruptcy; an appeal filed by certain creditors of Mirant is currently pending at the District Court
Under the settlement, Pepco will allow Mirant to reject the back-to-back agreement relating to Pepco’s power purchase agreement with Panda-Brandywine L.P. in exchange for a payment of $450 million*
The $450 million will be used solely for the purpose of funding Pepco’s obligations under the Panda power purchase agreement; Pepco expects the $450 million to be treated as a regulatory liability on its financial statements
Pursuant to the settlement, upon approval of the settlement agreement by the Bankruptcy Court, Pepco received a payment of $70 million in cash from Mirant to settle other disputes and pre-petition and administrative claims, and as reimbursement for Pepco’s legal fees, which is subject to refund if the settlement agreement is not upheld on appeal
Litigation
While the appeal of the Bankruptcy Court approval of the settlement agreement is pending, litigation continues
On July 19, 2006, the Court of Appeals issued an opinion affirming the District Court’s orders which had been appealed by Mirant. The District Court’s orders had:
- Denied Mirant’s attempt to reject the back-to-back agreement- Directed Mirant to resume making payments to Pepco
25* Payment to be made in Mirant shares, which will be liquidated by Pepco. Mirant will pay Pepco, in cash, for any difference between the $450 million payment and the net proceeds of the liquidation of the shares.
Cross-Border LeasesCurrent Status
On February 11, 2005, the Treasury Department issued Notice 2005-13 informing taxpayers that the IRS intends to challenge the tax benefits associated with certain sale-leaseback transactions with tax-indifferent parties (Nationally Coordinated Issue).
On June 9, 2006, the IRS issued its final Revenue Agent’s Report (RAR) for its audit of PHI’s 2001 and 2002 income tax returns.
The RAR disallowed the tax benefits claimed by PHI for these tax years.
PHI filed a protest letter in August 2006 against the proposed adjustments. The unresolved audit issues will move to the appeals process. We anticipate an appeals meeting in late 2007.
PCI believes that its tax position related to these transactions was proper and intends to contest the adjustments proposed by the IRS.
PHI’s leveraged lease portfolio generates approximately $55 million per year in tax benefits and is a major component of PHI Investments’ annual earnings of approximately $35 million.
Future Considerations
On July 13, 2006, the FASB issued FAS 13-2 (Accounting for Leases); any change in the timing of tax cash flows will require a re-pricing of the leases and a current period gain or loss.
PHI believes the IRS issue will most likely take several years to resolve.
26
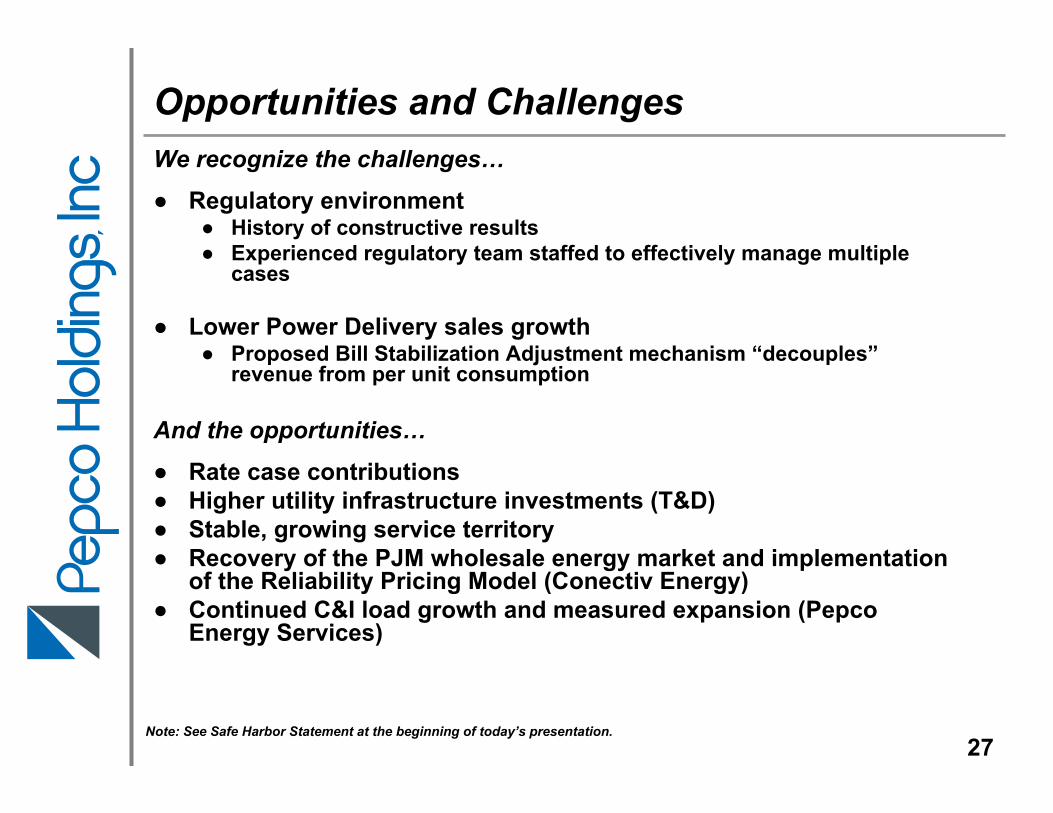
We recognize the challenges…
● Regulatory environment● History of constructive results● Experienced regulatory team staffed to effectively manage multiple
cases
● Lower Power Delivery sales growth● Proposed Bill Stabilization Adjustment mechanism “decouples”
revenue from per unit consumption
And the opportunities…
● Rate case contributions● Higher utility infrastructure investments (T&D)● Stable, growing service territory● Recovery of the PJM wholesale energy market and implementation
of the Reliability Pricing Model (Conectiv Energy)● Continued C&I load growth and measured expansion (Pepco
Energy Services)
Opportunities and Challenges
Note: See Safe Harbor Statement at the beginning of today’s presentation.27
● Stable Earnings Base - Derived primarily from regulated T&D utility businesses
● Earnings Growth Potential - Driven by constructive regulatory outcomes, T&D utility infrastructure investments and competitive energy businesses
● Secure Dividend - Current dividend yield is 26% higher than the average dividend yield for companies in the S&P Electric Utilities index*
Why Invest in PHI?
Note: See Safe Harbor Statement at the beginning of today’s presentation.28
* Pricing data as of October 31, 2006

Appendix
29
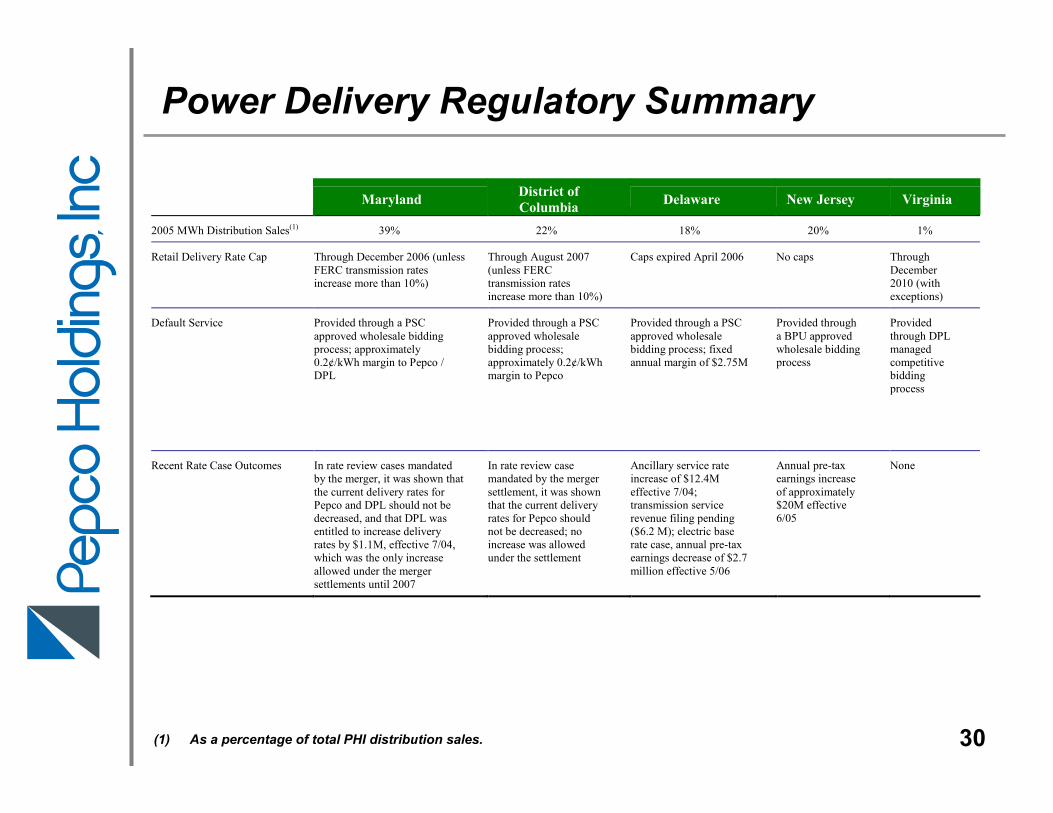
Maryland District of Columbia Delaware New Jersey Virginia
2005 MWh Distribution Sales(1) 39% 22% 18% 20% 1%
Retail Delivery Rate Cap Through December 2006 (unless FERC transmission rates increase more than 10%)
Through August 2007 (unless FERC transmission rates increase more than 10%)
Caps expired April 2006 No caps Through December 2010 (with exceptions)
Default Service
Provided through a PSC approved wholesale bidding process; approximately 0.2¢/kWh margin to Pepco / DPL
Provided through a PSC approved wholesale bidding process; approximately 0.2¢/kWh margin to Pepco
Provided through a PSC approved wholesale bidding process; fixed annual margin of $2.75M
Provided through a BPU approved wholesale bidding process
Provided through DPL managed competitive bidding process
Recent Rate Case Outcomes In rate review cases mandated by the merger, it was shown that the current delivery rates for Pepco and DPL should not be decreased, and that DPL was entitled to increase delivery rates by $1.1M, effective 7/04, which was the only increase allowed under the merger settlements until 2007
In rate review case mandated by the merger settlement, it was shown that the current delivery rates for Pepco should not be decreased; no increase was allowed under the settlement
Ancillary service rate increase of $12.4M effective 7/04; transmission service revenue filing pending ($6.2 M); electric base rate case, annual pre-tax earnings decrease of $2.7 million effective 5/06
Annual pre-tax earnings increase of approximately $20M effective 6/05
None
Power Delivery Regulatory Summary
(1) As a percentage of total PHI distribution sales. 30
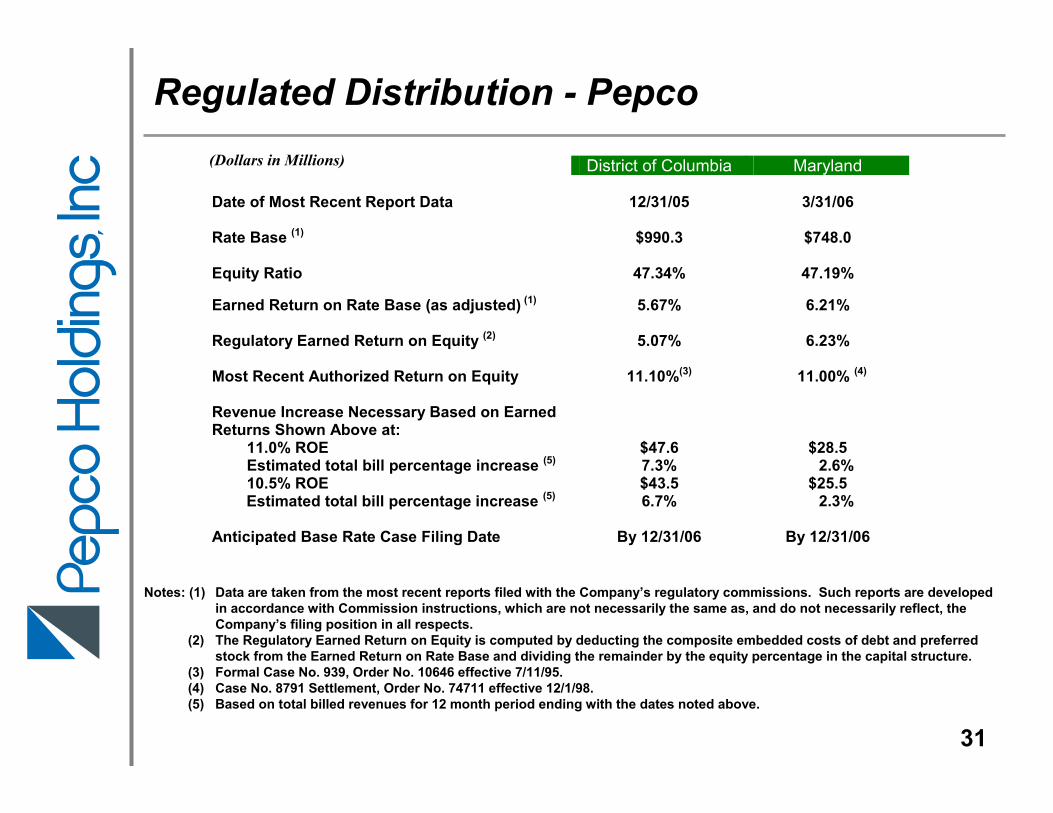
(Dollars in Millions) District of Columbia Maryland Date of Most Recent Report Data
12/31/05
3/31/06
Rate Base (1) $990.3 $748.0
Equity Ratio 47.34% 47.19%
Earned Return on Rate Base (as adjusted) (1) 5.67% 6.21%
Regulatory Earned Return on Equity (2) Most Recent Authorized Return on Equity
5.07%
11.10%(3)
6.23%
11.00% (4)
Revenue Increase Necessary Based on Earned Returns Shown Above at:
11.0% ROE $47.6 $28.5 Estimated total bill percentage increase (5) 10.5% ROE
7.3% $43.5
2.6% $25.5
Estimated total bill percentage increase (5) Anticipated Base Rate Case Filing Date
6.7%
By 12/31/06
2.3%
By 12/31/06
Notes: (1) Data are taken from the most recent reports filed with the Company’s regulatory commissions. Such reports are developed in accordance with Commission instructions, which are not necessarily the same as, and do not necessarily reflect, the Company’s filing position in all respects.
(2) The Regulatory Earned Return on Equity is computed by deducting the composite embedded costs of debt and preferred stock from the Earned Return on Rate Base and dividing the remainder by the equity percentage in the capital structure.
(3) Formal Case No. 939, Order No. 10646 effective 7/11/95.(4) Case No. 8791 Settlement, Order No. 74711 effective 12/1/98.(5) Based on total billed revenues for 12 month period ending with the dates noted above.
Regulated Distribution - Pepco
31
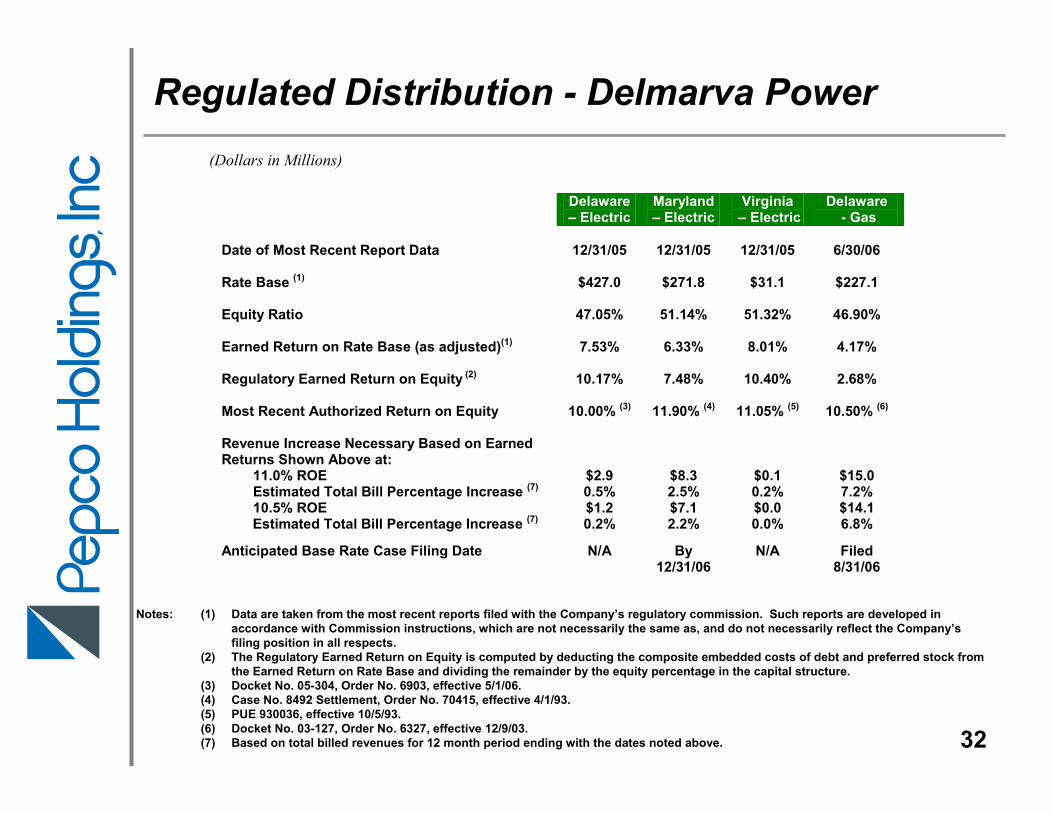
Delaware – Electric
Maryland – Electric
Virginia – Electric
Delaware - Gas
Date of Most Recent Report Data
12/31/05
12/31/05
12/31/05
6/30/06
Rate Base (1) $427.0 $271.8
$31.1 $227.1
Equity Ratio
47.05% 51.14% 51.32% 46.90%
Earned Return on Rate Base (as adjusted)(1) 7.53% 6.33%
8.01% 4.17%
Regulatory Earned Return on Equity (2) 10.17% 7.48%
10.40% 2.68%
Most Recent Authorized Return on Equity Revenue Increase Necessary Based on Earned Returns Shown Above at:
10.00% (3) 11.90% (4) 11.05% (5) 10.50% (6)
11.0% ROE $2.9 $8.3 $0.1 $15.0 Estimated Total Bill Percentage Increase (7) 10.5% ROE
0.5% $1.2
2.5% $7.1
0.2% $0.0
7.2% $14.1
Estimated Total Bill Percentage Increase (7) Anticipated Base Rate Case Filing Date
0.2%
N/A
2.2%
By 12/31/06
0.0%
N/A
6.8%
Filed 8/31/06
Notes: (1) Data are taken from the most recent reports filed with the Company’s regulatory commission. Such reports are developed in accordance with Commission instructions, which are not necessarily the same as, and do not necessarily reflect the Company’s filing position in all respects.
(2) The Regulatory Earned Return on Equity is computed by deducting the composite embedded costs of debt and preferred stock from the Earned Return on Rate Base and dividing the remainder by the equity percentage in the capital structure.
(3) Docket No. 05-304, Order No. 6903, effective 5/1/06.(4) Case No. 8492 Settlement, Order No. 70415, effective 4/1/93.(5) PUE 930036, effective 10/5/93.(6) Docket No. 03-127, Order No. 6327, effective 12/9/03.(7) Based on total billed revenues for 12 month period ending with the dates noted above.
Regulated Distribution - Delmarva Power(Dollars in Millions)
32
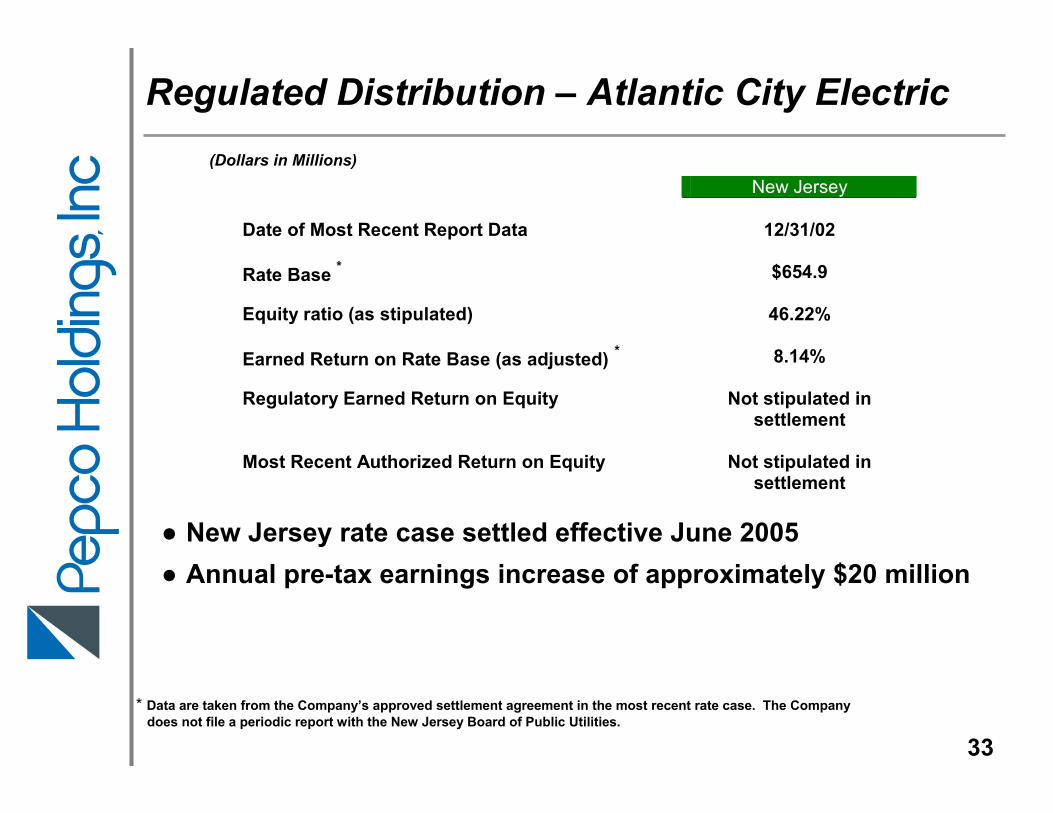
New Jersey Date of Most Recent Report Data
12/31/02
Rate Base * $654.9
Equity ratio (as stipulated)
46.22%
Earned Return on Rate Base (as adjusted) * 8.14%
Regulatory Earned Return on Equity Most Recent Authorized Return on Equity
Not stipulated in settlement
Not stipulated in
settlement
* Data are taken from the Company’s approved settlement agreement in the most recent rate case. The Companydoes not file a periodic report with the New Jersey Board of Public Utilities.
Regulated Distribution – Atlantic City Electric(Dollars in Millions)
● New Jersey rate case settled effective June 2005● Annual pre-tax earnings increase of approximately $20 million
33
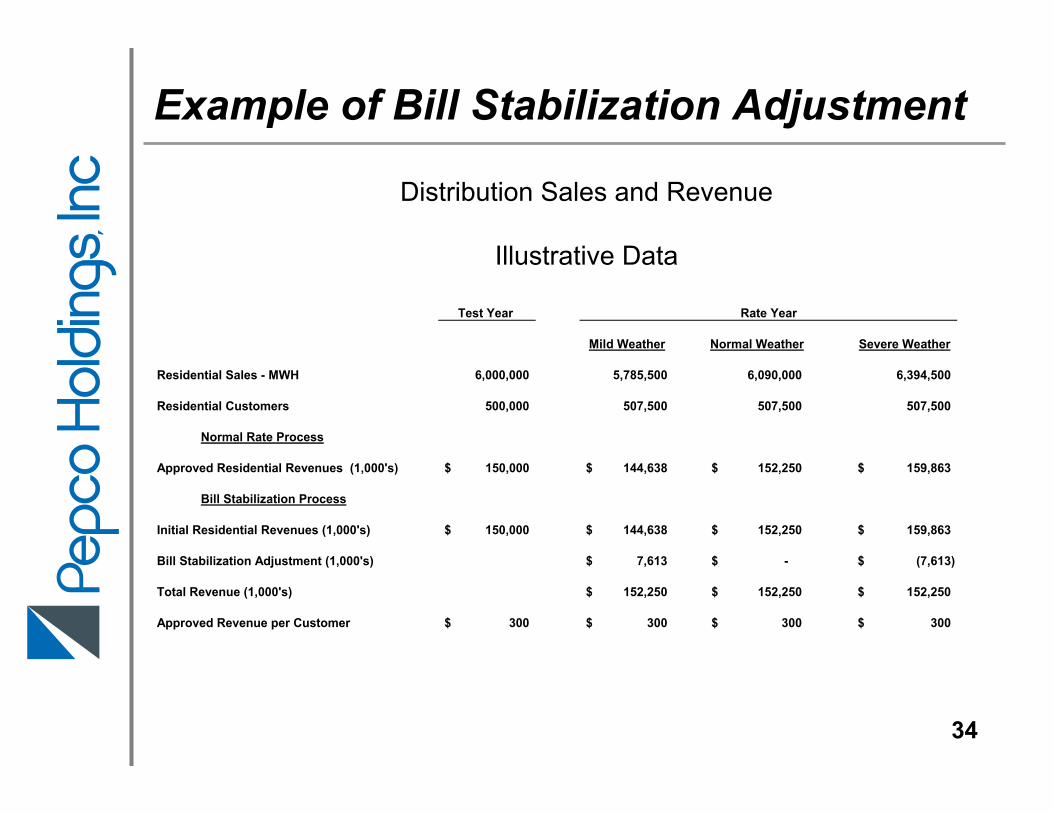
Example of Bill Stabilization Adjustment
34
Test Year
Mild Weather Normal Weather Severe Weather
Residential Sales - MWH 6,000,000 5,785,500 6,090,000 6,394,500
Residential Customers 500,000 507,500 507,500 507,500
Normal Rate Process
Approved Residential Revenues (1,000's) 150,000$ 144,638$ 152,250$ 159,863$
Bill Stabilization Process
Initial Residential Revenues (1,000's) 150,000$ 144,638$ 152,250$ 159,863$
Bill Stabilization Adjustment (1,000's) 7,613$ -$ (7,613)$
Total Revenue (1,000's) 152,250$ 152,250$ 152,250$
Approved Revenue per Customer 300$ 300$ 300$ 300$
Rate Year
Distribution Sales and Revenue
Illustrative Data
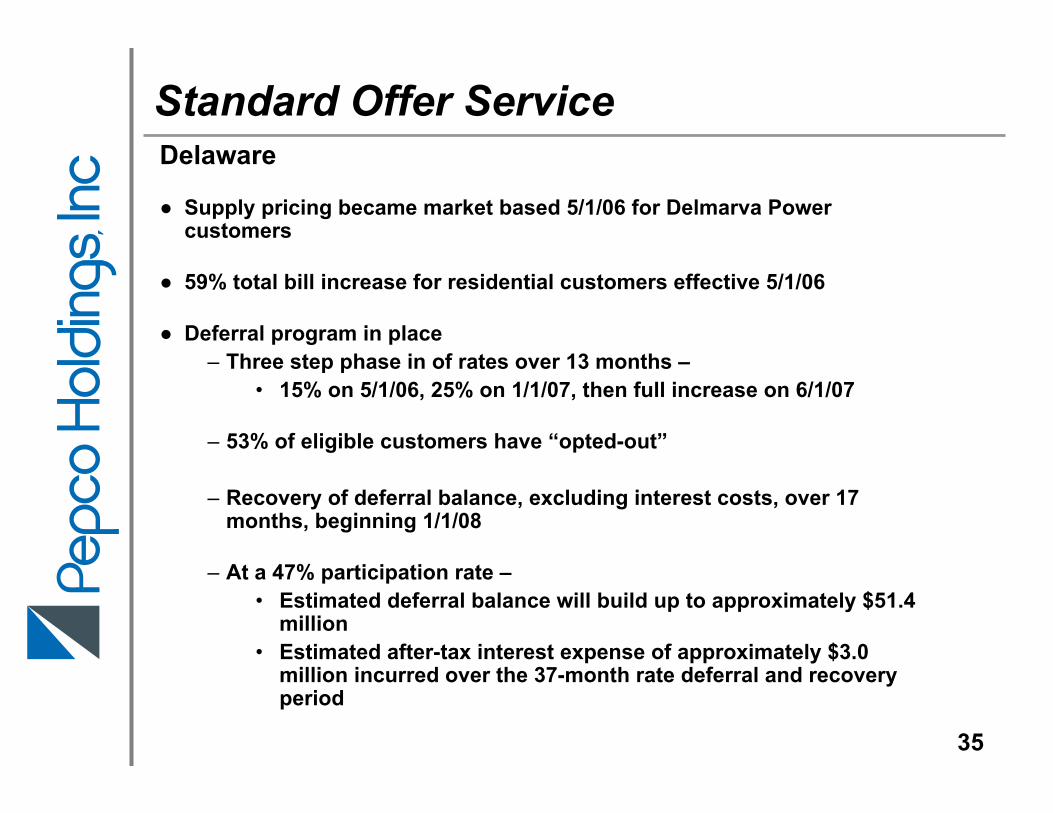
Standard Offer Service
35
Delaware
● Supply pricing became market based 5/1/06 for Delmarva Power customers
● 59% total bill increase for residential customers effective 5/1/06
● Deferral program in place– Three step phase in of rates over 13 months –
• 15% on 5/1/06, 25% on 1/1/07, then full increase on 6/1/07
– 53% of eligible customers have “opted-out”
– Recovery of deferral balance, excluding interest costs, over 17 months, beginning 1/1/08
– At a 47% participation rate –• Estimated deferral balance will build up to approximately $51.4
million• Estimated after-tax interest expense of approximately $3.0
million incurred over the 37-month rate deferral and recovery period
Standard Offer Service
36
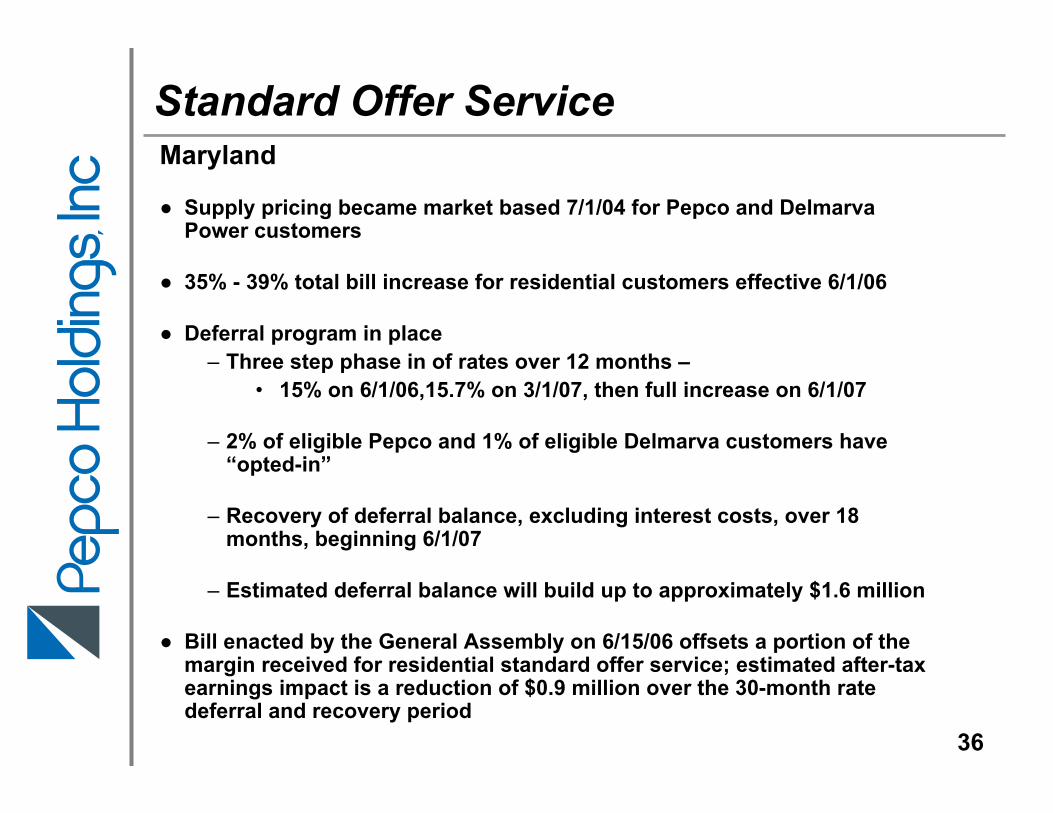
Maryland
● Supply pricing became market based 7/1/04 for Pepco and DelmarvaPower customers
● 35% - 39% total bill increase for residential customers effective 6/1/06
● Deferral program in place– Three step phase in of rates over 12 months –
• 15% on 6/1/06,15.7% on 3/1/07, then full increase on 6/1/07
– 2% of eligible Pepco and 1% of eligible Delmarva customers have “opted-in”
– Recovery of deferral balance, excluding interest costs, over 18 months, beginning 6/1/07
– Estimated deferral balance will build up to approximately $1.6 million
● Bill enacted by the General Assembly on 6/15/06 offsets a portion of the margin received for residential standard offer service; estimated after-tax earnings impact is a reduction of $0.9 million over the 30-month rate deferral and recovery period
Standard Offer Service
37
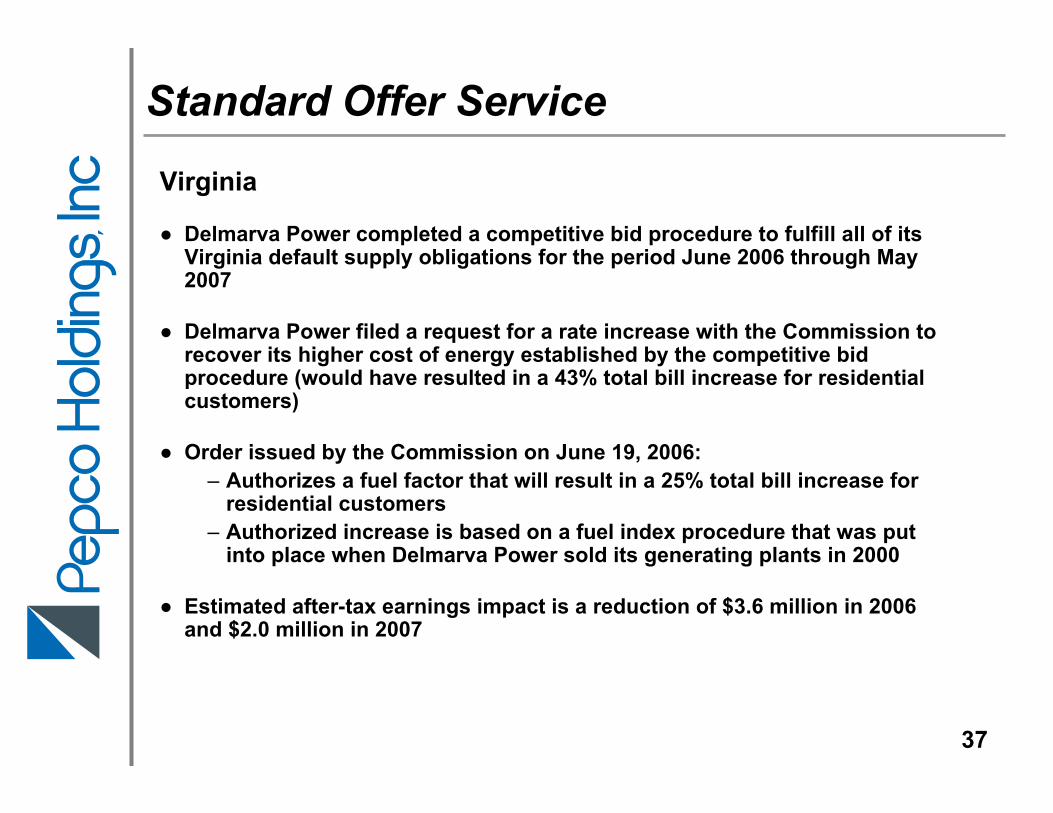
Virginia
● Delmarva Power completed a competitive bid procedure to fulfill all of its Virginia default supply obligations for the period June 2006 through May 2007
● Delmarva Power filed a request for a rate increase with the Commission to recover its higher cost of energy established by the competitive bid procedure (would have resulted in a 43% total bill increase for residential customers)
● Order issued by the Commission on June 19, 2006:– Authorizes a fuel factor that will result in a 25% total bill increase for
residential customers– Authorized increase is based on a fuel index procedure that was put
into place when Delmarva Power sold its generating plants in 2000
● Estimated after-tax earnings impact is a reduction of $3.6 million in 2006 and $2.0 million in 2007
Power Delivery - Infrastructure Investment Strategy
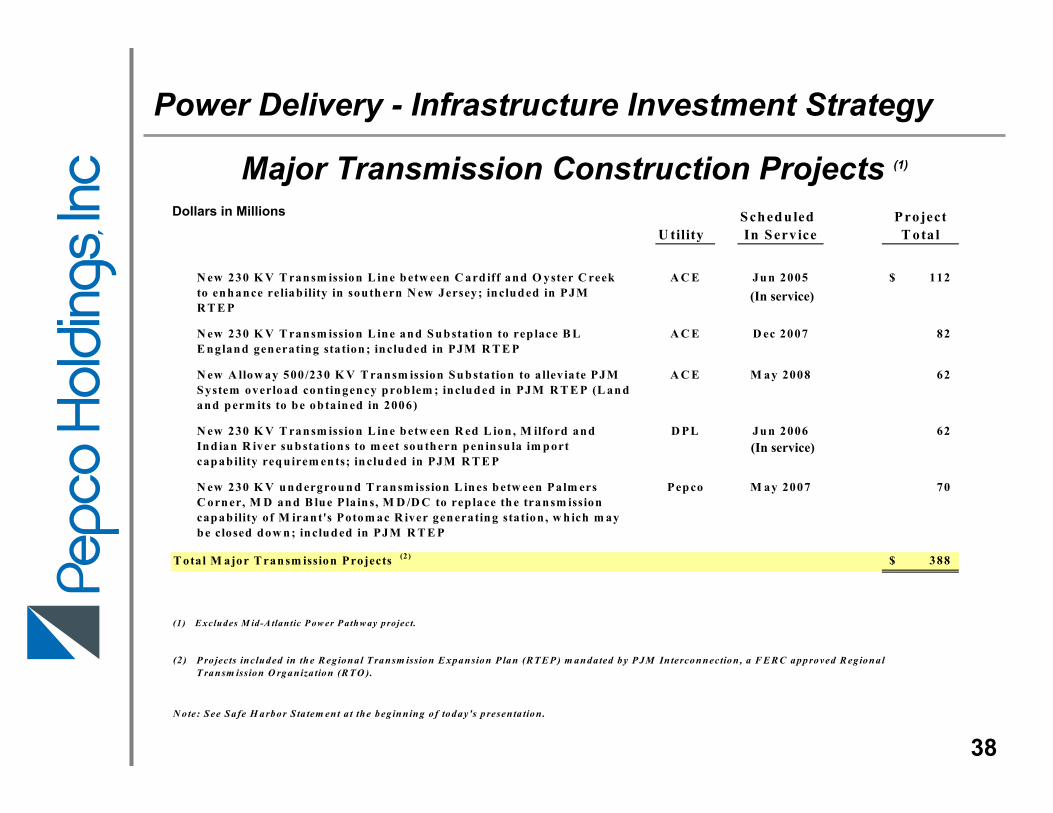
Major Transmission Construction Projects (1)
38
Dollars in Millions Scheduled P rojectU tility In Service T otal
N ew 230 K V T ran sm ission L ine b etw een C ard iff and O yster C reek to enh ance reliab ility in south ern N ew Jersey; in clud ed in PJM R T E P
A C E Ju n 2005 112$
N ew 230 K V T ran sm ission L ine and S ub station to rep lace B L E nglan d gen erating station ; includ ed in PJM R T E P
A C E D ec 2007 82
N ew A llow ay 500/230 K V T ran sm ission Su b station to a llev iate PJM S ystem overload con tin gency prob lem ; inclu d ed in PJM R T E P (L an d and p erm its to be obtain ed in 2006)
A C E M ay 2008 62
N ew 230 K V T ran sm ission L ine b etw een R ed L ion , M ilford and In d ian R iver su b station s to m eet sou th ern pen in su la im p ort cap ability req uirem en ts; in clud ed in PJM R T E P
D PL Ju n 2006 62
N ew 230 K V u n d ergrou n d T ran sm ission L in es b etw een Palm ers C orn er, M D an d B lue P la in s, M D /D C to rep lace th e transm ission cap ability of M irant's Potom ac R iver gen eratin g station , w h ich m ay b e closed dow n ; in clu d ed in PJM R T E P
Pep co M ay 2007 70
T otal M ajor T ran sm ission Projects (2) 388$
(1) E xcludes M id-A tlantic P ow er P athw ay project.
(2 )
N ote: See Safe H arbor S ta tem ent a t the beg inning of today's presenta tion .
P ro jects included in the R egional T ransm ission E xpansion P lan (R T E P ) m andated by P JM In terconnection , a F E R C approved R egional T ransm ission O rganiza tion (R T O ).
(In service)
(In service)
Conectiv Energy - Hedge Update
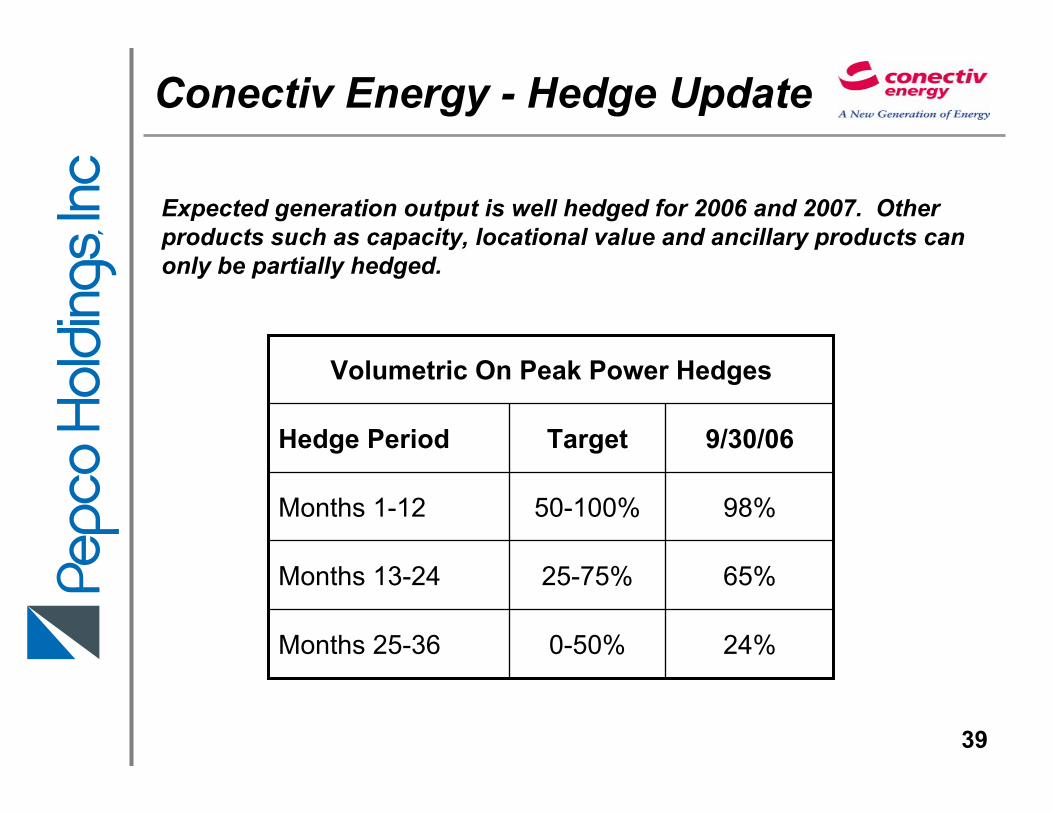
24%0-50%Months 25-36
65%25-75%Months 13-24
98%50-100%Months 1-12
9/30/06TargetHedge Period
Volumetric On Peak Power Hedges
Expected generation output is well hedged for 2006 and 2007. Other products such as capacity, locational value and ancillary products can only be partially hedged.
39
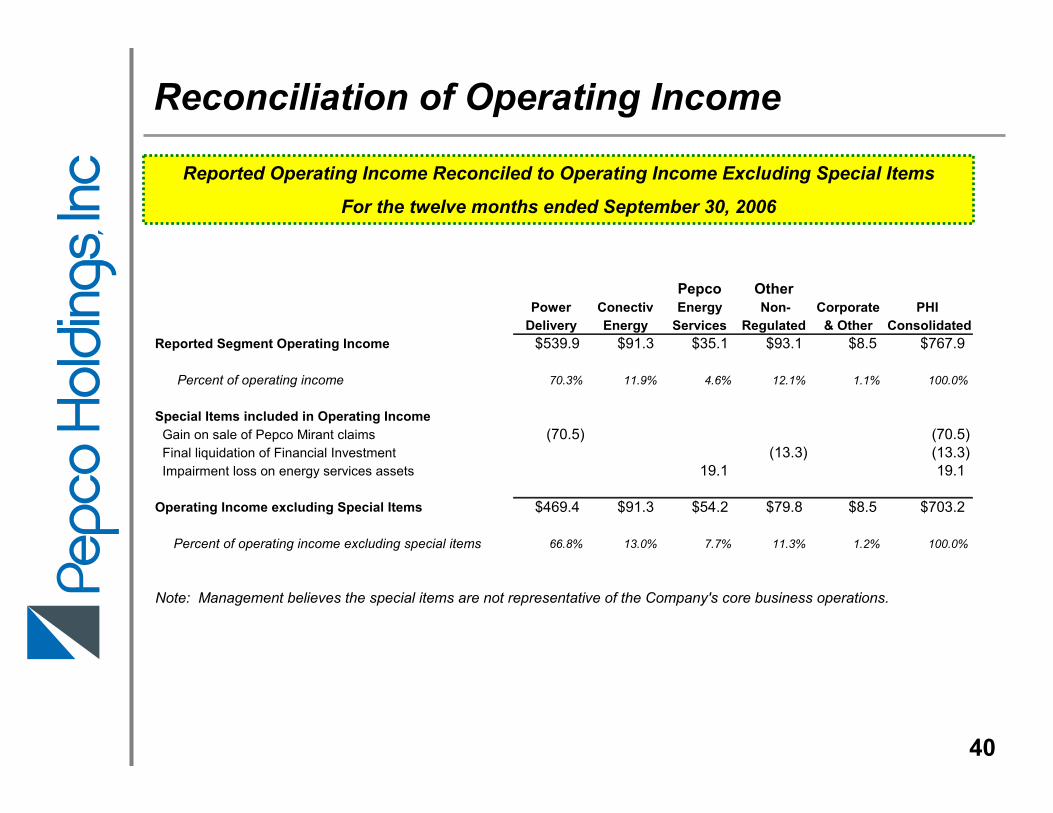
Reconciliation of Operating Income
40
Reported Operating Income Reconciled to Operating Income Excluding Special Items
For the twelve months ended September 30, 2006
Pepco OtherPower Conectiv Energy Non- Corporate PHI
Delivery Energy Services Regulated & Other ConsolidatedReported Segment Operating Income $539.9 $91.3 $35.1 $93.1 $8.5 $767.9
Percent of operating income 70.3% 11.9% 4.6% 12.1% 1.1% 100.0%
Special Items included in Operating Income Gain on sale of Pepco Mirant claims (70.5) (70.5) Final liquidation of Financial Investment (13.3) (13.3) Impairment loss on energy services assets 19.1 19.1
Operating Income excluding Special Items $469.4 $91.3 $54.2 $79.8 $8.5 $703.2
Percent of operating income excluding special items 66.8% 13.0% 7.7% 11.3% 1.2% 100.0%
Note: Management believes the special items are not representative of the Company's core business operations.
Note: Management believes the special items are not representative of the Company’s ongoing business operations.
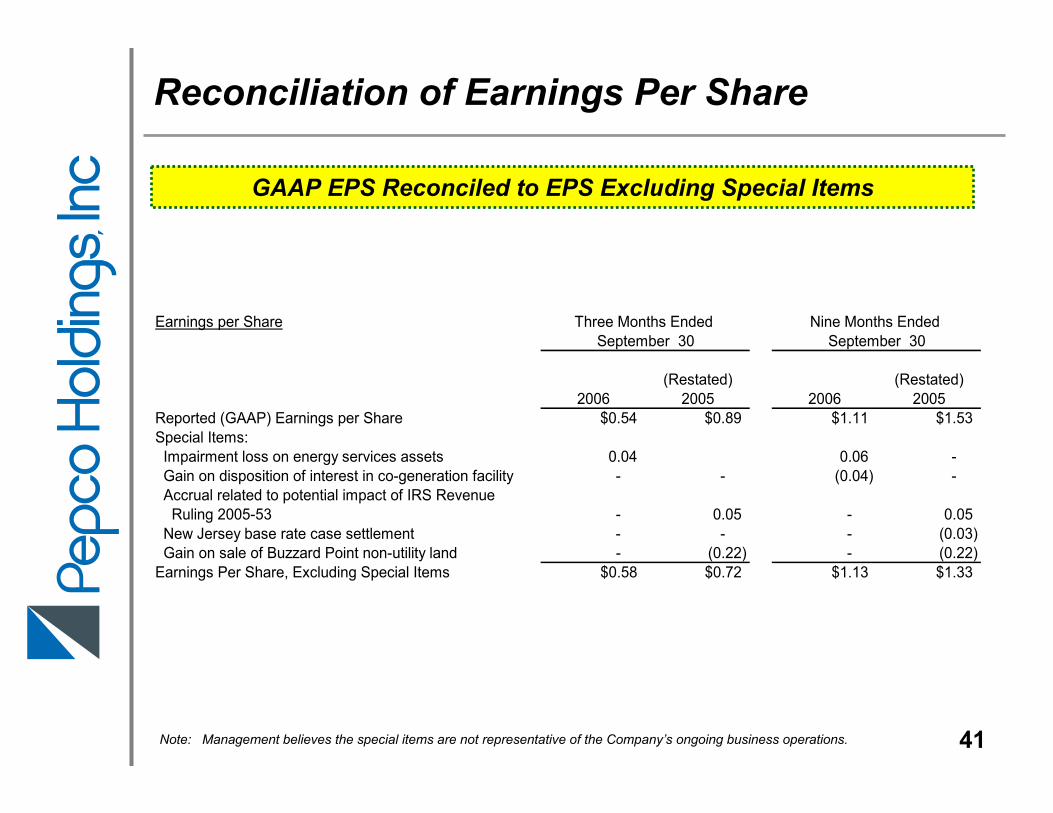
Reconciliation of Earnings Per Share
GAAP EPS Reconciled to EPS Excluding Special Items
41
Earnings per Share
(Restated) (Restated)
2006 2005 2006 2005Reported (GAAP) Earnings per Share $0.54 $0.89 $1.11 $1.53Special Items: Impairment loss on energy services assets 0.04 0.06 - Gain on disposition of interest in co-generation facility - - (0.04) - Accrual related to potential impact of IRS Revenue Ruling 2005-53 - 0.05 - 0.05 New Jersey base rate case settlement - - - (0.03) Gain on sale of Buzzard Point non-utility land - (0.22) - (0.22) Earnings Per Share, Excluding Special Items $0.58 $0.72 $1.13 $1.33
September 30Three Months Ended Nine Months Ended
September 30
Note: Management believes the special items are not representative of the Company’s ongoing business operations.
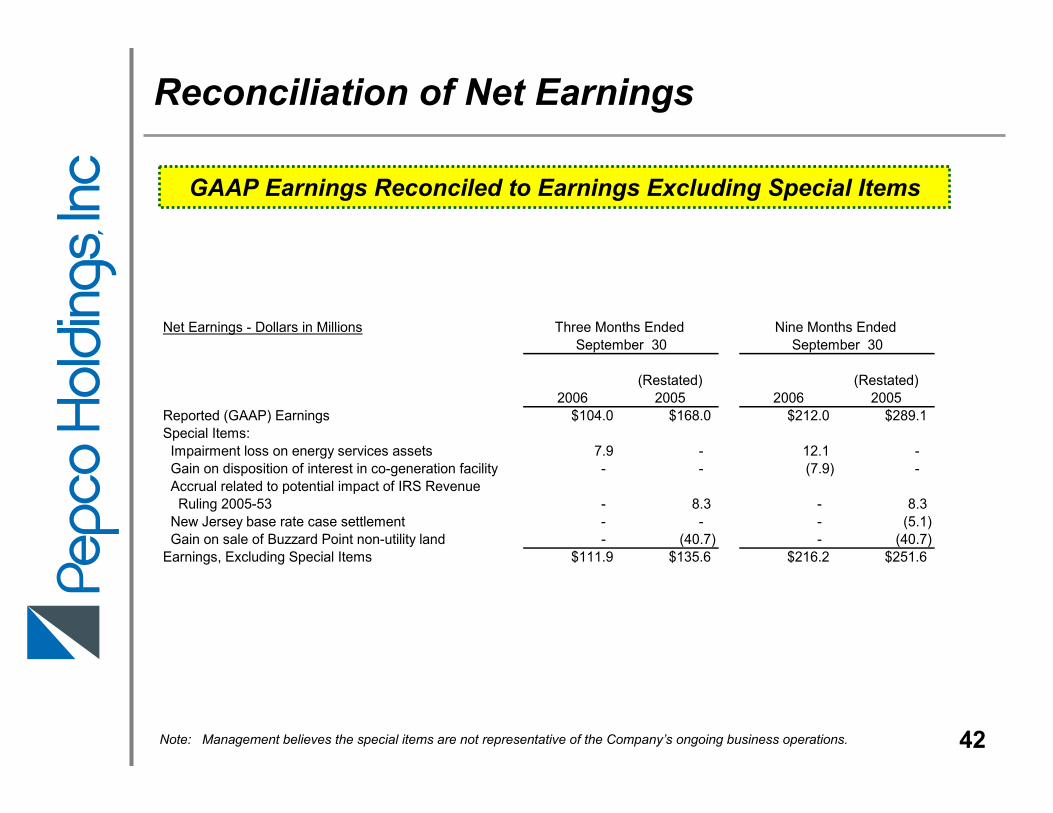
Reconciliation of Net Earnings
GAAP Earnings Reconciled to Earnings Excluding Special Items
42
Net Earnings - Dollars in Millions
(Restated) (Restated)
2006 2005 2006 2005Reported (GAAP) Earnings $104.0 $168.0 $212.0 $289.1Special Items: Impairment loss on energy services assets 7.9 - 12.1 - Gain on disposition of interest in co-generation facility - - (7.9) - Accrual related to potential impact of IRS Revenue Ruling 2005-53 - 8.3 - 8.3 New Jersey base rate case settlement - - - (5.1) Gain on sale of Buzzard Point non-utility land - (40.7) - (40.7) Earnings, Excluding Special Items $111.9 $135.6 $216.2 $251.6
September 30Three Months Ended Nine Months Ended
September 30