pepsi and coca-cola(rh6802b54)
TRANSCRIPT
842019 Pepsi and Coca-cola(RH6802B54)
httpslidepdfcomreaderfullpepsi-and-coca-colarh6802b54 122
Coca-Cola And PepsiRamjee Prasad
10804900
RH6802B54
BTech ECE LEET(3rd Year)
Coca Cola
Pay Exercised
Index Membership
Dow Jones CompositeDow IndustrialsSampP 100SampP 500SampP 1500 Super Comp
$ 0
Sector Consumer Goods $ 0
Industry Beverages - Soft Drinks $ 0
Employees (last reported count) 92400 $ 0
Mr Alexander Benedict Cummings Jr 52Chief Admin Officer Exec VP and Chief Operating Officer of AfricaGroup
$ 159M $ 0
HistoryThe Coca Cola history extends back to 1885 when John Pemberton invented the original recipe for a
new cocawine He named it Pembertons French Wine Coca which was believed to be inspired byVin Mariani a popular cocawine invented by Angelo Mariani Pemberton developed Coca-Cola anon-alcoholic version of his original cocawine when Fulton County passed prohibition legislationCarbonated water was added later by accident when Pemberton was mixing drinks for a friend andincidentally included it His friends loved the new taste so he altered the original formula toincorporate it
This made the first big break in Coca Cola history Candler incorporated The Coca-Cola Company in1982 and began marketing the product The drink achieved the status of national icon for the USA byits 50th anniversary Bottles of Coca-Cola were sold starting in 1894 and cans in 1955 The first
bottle was sold in Vicksburg Mississippi In 1899 Chattanooga Tennessee became the first site of aCoca-Cola bottling company
842019 Pepsi and Coca-cola(RH6802B54)
httpslidepdfcomreaderfullpepsi-and-coca-colarh6802b54 222
In Pembertons original formula he added five ounces of coca leaf (cocaine) per gallon of syrupCandler claimed that he altered the formula and only added a tenth of the amount Coca Cola oncecontained an estimate of nine milligrams of cocaine per glass It wasnt until 1903 that it was removedfrom the drink altogether replacing it with coca flavoring
New Coke came out in 1985 after Coca-Cola attempted to change the original formula Mostconsumers preferred the taste of the original Coca-Cola and many ceased purchasing the productuntil the company switched back to the original formula It was renamed Coca Cola Classic to showconsumers that the drink had reverted back to its original formula
By the 21st century Coca Cola history took another leap in the market In 2005 the companylaunched Diet Coke sweetened with artificial flavors Later in 2005 it announced Coca ColaZero sweetened with aspartame and acesulfame potassium Since then the company has producedother products containing the same Coca-Cola formula with minor differences
Coca Cola is now being sold around the world in more than 200 different countries The Coca-Colacompany now sponsors an assortment of events including the Olympic Games and NASCAR In
England it is the primary sponsor of The Football League It is also featured in several televisionshows including The Gods Must Be Crazy
Coca Cola history has come a long way since Pemberton invented the originalrecipe and continues to grow by leaps and bounds It is no surprise that it is oneof the leading soft drinks of the market
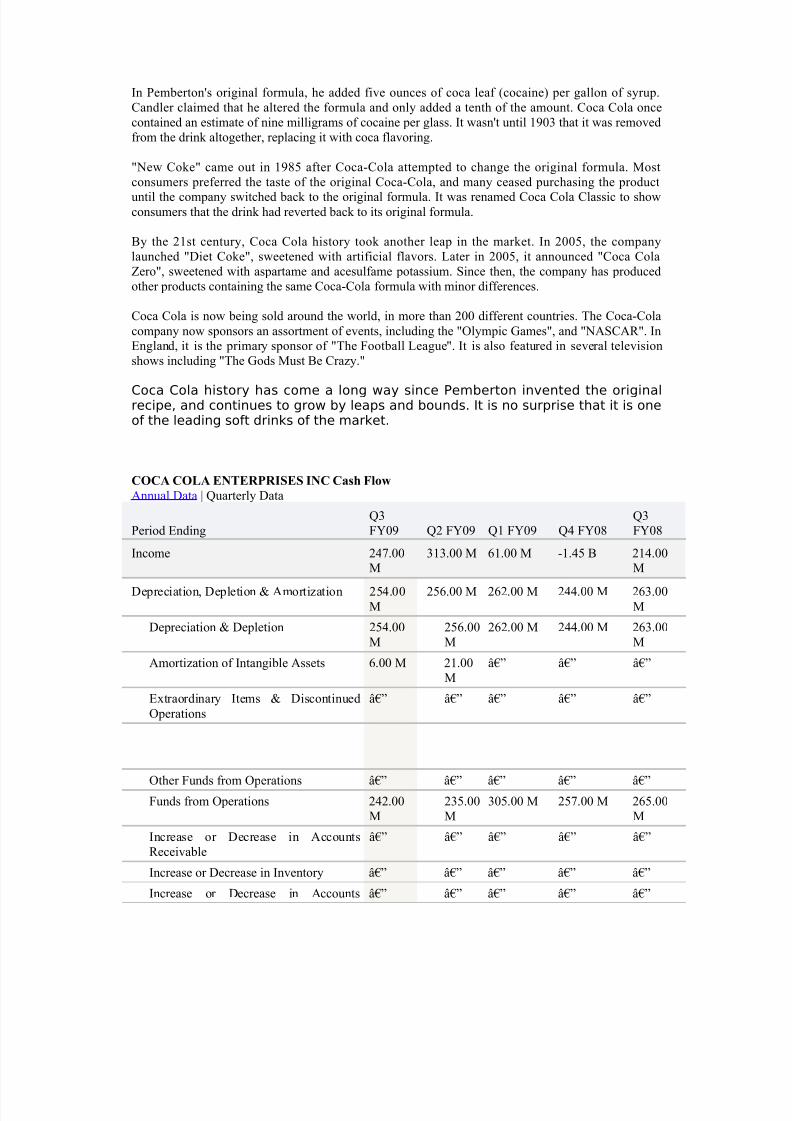
COCA COLA ENTERPRISES INC Cash Flow
Annual Data | Quarterly Data
Period EndingQ3FY09 Q2 FY09 Q1 FY09 Q4 FY08
Q3FY08
Income 24700M
31300 M 6100 M -145 B 21400M
Depreciation Depletion amp Amortization 25400M
25600 M 26200 M 24400 M 26300M
Depreciation amp Depletion 25400M
25600M
26200 M 24400 M 26300M
Amortization of Intangible Assets 600 M 2100M
acirceurordquo acirceurordquo acirceurordquo
Extraordinary Items amp DiscontinuedOperations
acirceurordquo acirceurordquo acirceurordquo acirceurordquo acirceurordquo
Other Funds from Operations acirceurordquo acirceurordquo acirceurordquo acirceurordquo acirceurordquo
Funds from Operations 24200M
23500M
30500 M 25700 M 26500M
Increase or Decrease in AccountsReceivable
acirceurordquo acirceurordquo acirceurordquo acirceurordquo acirceurordquo
Increase or Decrease in Inventory acirceurordquo acirceurordquo acirceurordquo acirceurordquo acirceurordquoIncrease or Decrease in Accounts acirceurordquo acirceurordquo acirceurordquo acirceurordquo acirceurordquo
842019 Pepsi and Coca-cola(RH6802B54)
httpslidepdfcomreaderfullpepsi-and-coca-colarh6802b54 322
842019 Pepsi and Coca-cola(RH6802B54)
httpslidepdfcomreaderfullpepsi-and-coca-colarh6802b54 422
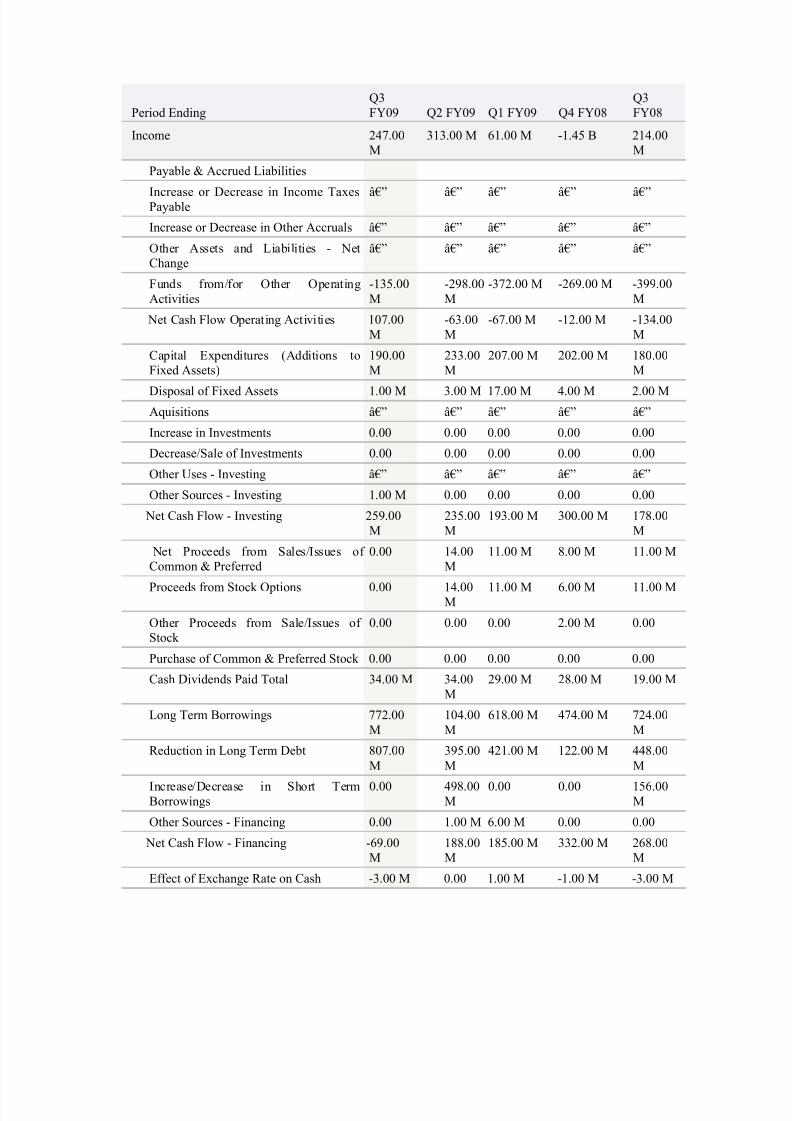
Period EndingQ3FY09 Q2 FY09 Q1 FY09 Q4 FY08
Q3FY08
Income 24700M
31300 M 6100 M -145 B 21400M
IncreaseDecrease in Cash and ShortTerm Investments -22400M -11000M -7400 M 1900 M -4700M
Period Ending FY2008 FY2007 FY2006 FY2005 FY2004
Net IncomeStarting Line -439 B 71100 M -114 B 51400 M 59600M
Operating Activities
Depreciation Depletion amp Amortization 105 B 107 B 101 B 104 B 107 B
Depreciation amp Depletion 105 B 107 B 101 B 104 B 107 B
Amortization of Intangible Assets 7500 M acirceurordquo acirceurordquo acirceurordquo acirceurordquo
Deferred Income Taxes and Investment Taxcredity
7600 M 12400 M 16900 M 25500 M 33100M
Deferred Income Taxes 7600 M 12400M
16900 M 25500 M 33100M
Income Tax Credit acirceurordquo acirceurordquo acirceurordquo acirceurordquo acirceurordquo
Other Cash Flow 762 B -4800 M 290 B -7500 M -12200M
Funds from Operations 168 B 175 B 170 B 156 B 167 B
Extraordinary Items amp DiscontinuedOperations
000 000 000 000 000
Funds fromfor Other Operating Activities -5700M
-9300 M -11100 M 5800 M -5100M
Incline (Decline) in Receivables -11800M
-4200M
-17300 M -3000 M -2100M
Incline (Decline) in Inventories -2400M
-10500M
4600 M -4800 M -200 M
Incline (Decline) in Accounts Payable 13500M
21100M
-1900 M 26400 M 5700 M
Incline (Decline) in Income TaxesPayable
acirceurordquo acirceurordquo acirceurordquo acirceurordquo acirceurordquo
Incline (Decline) in Other Accruals acirceurordquo acirceurordquo acirceurordquo acirceurordquo acirceurordquo
Incline (Decline) in Other Assets or Liabilties
-5000M
-15700M
3500 M -12800 M -8500M
Net Cash FlowOperating Activities 162 B 166 B 159 B 162 B 162 B
Capital Expenditures (Additions to FixedAssets)
Additions to Other Assets 000 000 000 000 000
Net Assets from Acquisitions 000 000 10600 M 000 000
842019 Pepsi and Coca-cola(RH6802B54)
httpslidepdfcomreaderfullpepsi-and-coca-colarh6802b54 522
Period EndingQ3FY09 Q2 FY09 Q1 FY09 Q4 FY08
Q3FY08
Income 24700M
31300 M 6100 M -145 B 21400M
Incline (Decline) in Inventories 000 000 000 000 000
Decrease in Investments 000 000 000 000 000
Disposal of Fixed Assets 1800 M 6800 M 5000 M 4800 M 2400 M
Other Uses - Investing 1200 M 400 M 1400 M 000 000
Other Sources - Investing 000 000 000 000 000
Net Cash Flow - Investing 97500M
87400 M 95200 M 85400 M 92200M
Proceeds from Stock Options 1800 M 12300M
7300 M 4000 M 18100M
Other Proceeds from SaleIssues of Stock
000 000 000 000 000
ComPfd Purchase Retired ConvertedRedeemed
000 000 000 000 000
Financing Activities
Long Term Borrowings 161 B 202 B 108 B 154 B 55800M
Incline or Decline in Short TermBorrowings
000 000 000 000 000
Reduction in Long Term Debt 162 B 283 B 162 B 236 B 130 B
Cash Dividends Paid Total 13800M
11600 M 11400 M 7600 M 7600 M
Common Dividends (Cash) 13800M
11600 M 11400 M 7600 M 7600 M
Preferred Dividends (Cash) 000 000 000 000 000
Other Sources - Financing 300 M 1100 M 400 M 4600 M 000
Other Uses - Financing 300 M 1100 M 400 M 4600 M 000
Net Cash Flow - Financing -12600M
-79900 M -57100 M -80400 M -63200M
Effect of Exchange rate on Cash -1800M
400 M 1000 M -900 M 1400 M
COCA COLA ENTERPRISES INC Average Monthly Returns
842019 Pepsi and Coca-cola(RH6802B54)
httpslidepdfcomreaderfullpepsi-and-coca-colarh6802b54 622
Some investors consider seasonal performance when purchasing or selling stocks This chartillustrates the average monthly return for the past 5 years Users often also consider the number of times a stock increases or decreases for any given month Mouse-over the chart to view 5 years of history for each monthSeasonal Performance Data CCE
Returns Jan Feb Mar Apr May Jun Jul Aug Sep Oct Nov DecAvg
Returns
-185 057 290 512 041 -143 345 251 -269 -1030 -020 623
Times CCEStock PriceIncreased
48 47 57 51 59 45 53 53 48 53 52 48
Times CCEStock PriceUnchanged
1 1 2 1 2 5 3 2 2 3 2 2
Times CCEStock PriceDecreased
52 48 50 51 45 58 49 56 52 55 48 55
2009 -664 223 1490 2934 -233 -005 1285 756 594 -1092 304 mdash
2008 -1136
590 -087 -707 -1048 -1409 -213 083 -175 -4006 -865 3105
2007 049 -213
085 835 643 278 -557 512 168 656 062 023
2006 297 -045
351 -397 067 361 535 391 -658 -383 210 -014
2005 528 -272
-388 -106 778 059 677 -488 -1274 -327 191 -025
2004 mdash mdash mdash mdash mdash mdash mdash mdash mdash mdash mdash 024
PRICES
842019 Pepsi and Coca-cola(RH6802B54)
httpslidepdfcomreaderfullpepsi-and-coca-colarh6802b54 722
Date Open High Low Close Volume Adj Close
4-Dec-09 2018 2018 1974 1991 3430200 1991
3-Dec-09 1995 2010 1984 1986 3473100 1986
2-Dec-09 1978 2002 1972 1997 3016300 1997
1-Dec-09 1978 1995 1973 1975 3605800 1975
30-Nov-09 1991 1998 1959 1965 5927600 1965
27-Nov-09 1998 2000 1972 1993 1291400 1993
25-Nov-09 2032 2044 2018 2037 2238500 2037
24-Nov-09 2040 2060 2012 2030 3577400 2030
24-Nov-09 $ 008 Dividend
23-Nov-09 2057 2074 2050 2060 2314400 2052
20-Nov-09 2017 2049 2012 2042 2779000 2034
19-Nov-09 2051 2060 2015 2023 3153300 2015
18-Nov-09 2067 2075 2046 2062 3366800 2054
17-Nov-09 2054 2079 2050 2073 2504800 2065
16-Nov-09 2027 2067 2023 2064 4489000 2056
13-Nov-09 2018 2037 2000 2023 3474500 2015
12-Nov-09 2029 2047 2011 2014 3220500 2006
11-Nov-09 2009 2029 1997 2027 3458000 2019
10-Nov-09 1979 2009 1962 2003 3429000 1995
9-Nov-09 1984 2012 1977 2010 2973900 2002
6-Nov-09 1960 1973 1949 1972 3231500 1964
5-Nov-09 1911 1987 1911 1972 7675000 19644-Nov-09 1904 1936 1893 1911 5034900 1904
3-Nov-09 1888 1900 1885 1899 5151700 1892
2-Nov-09 1912 1923 1875 1894 6168400 1887
30-Oct-09 1942 1948 1897 1907 7210100 1900
29-Oct-09 1910 1978 1908 1960 10382400 1952
28-Oct-09 2014 2030 1894 1902 8666100 1895
27-Oct-09 1984 2021 1974 2002 5150600 1994
26-Oct-09 1994 2034 1987 1994 4289800 1986
23-Oct-09 2065 2065 1990 1998 3740500 199022-Oct-09 2062 2065 2017 2055 2659200 2047
21-Oct-09 2055 2089 2045 2054 3005800 2046
20-Oct-09 2108 2111 2045 2054 3148900 2046
19-Oct-09 2095 2125 2086 2113 3800700 2105
16-Oct-09 2104 2105 2083 2094 2535100 2086
15-Oct-09 2094 2113 2089 2111 2577300 2103
14-Oct-09 2100 2111 2074 2105 3047400 2097
13-Oct-09 2089 2101 2054 2092 3717700 2084
12-Oct-09 2091 2119 2084 2091 2202700 20839-Oct-09 2079 2098 2074 2094 2096000 2086
842019 Pepsi and Coca-cola(RH6802B54)
httpslidepdfcomreaderfullpepsi-and-coca-colarh6802b54 822
8-Oct-09 2098 2106 2072 2085 2825100 2077
7-Oct-09 2097 2100 2071 2093 2529600 2085
6-Oct-09 2100 2111 2076 2095 3373300 2087
5-Oct-09 2056 2096 2039 2096 3507200 2088
2-Oct-09 2027 2064 2007 2058 3896300 2050
1-Oct-09 2122 2123 2053 2056 5159100 2048
30-Sep-09 2098 2144 2072 2141 4954800 2133
29-Sep-09 2107 2115 2093 2103 2439000 2095
28-Sep-09 2092 2116 2083 2102 2258400 2094
25-Sep-09 2100 2113 2086 2090 1981800 2082
24-Sep-09 2114 2125 2085 2101 2772600 2093
23-Sep-09 2102 2142 2102 2111 4214200 2103
22-Sep-09 2103 2108 2079 2094 2747900 2086
21-Sep-09 2110 2115 2087 2097 4250300 2089
18-Sep-09 2112 2117 2085 2115 4861500 2107
17-Sep-09 2114 2114 2076 2099 4785000 2091
16-Sep-09 2090 2090 2031 2076 3932100 2068
15-Sep-09 2071 2089 2053 2087 3186700 2079
14-Sep-09 2033 2076 2018 2075 3813400 2067
11-Sep-09 2043 2052 2022 2045 2822800 2037
10-Sep-09 2012 2038 2000 2037 5223600 2029
9-Sep-09 2049 2049 1983 2010 5783700 2002
9-Sep-09 $ 008 Dividend8-Sep-09 2038 2051 2029 2050 4232400 2034
4-Sep-09 2026 2047 2015 2032 2756800 2016
3-Sep-09 2015 2032 1992 2030 2937400 2014
2-Sep-09 1987 2014 1975 2004 4132300 1988
Coca-Cola Dividend Stock Analysis
Coca-Cola has paid uninterrupted dividends on its common stock since 1893 and increased paymentsto common shareholders every year for 47 yearsFrom the end of 1998 up until December 2008 this dividend growth stock has delivered a negativeannual average total return of 210 to its shareholders The stock has largely traded between $65 and$40 over the past decade
842019 Pepsi and Coca-cola(RH6802B54)
httpslidepdfcomreaderfullpepsi-and-coca-colarh6802b54 922
The company has managed to deliver a 1090 average annual increase in its EPS between 1999 and2008 Analysts are expecting an increase in EPS to $305-$310 for 2009 and $325-$330 by 2010This would be a nice increase from the 2008 earnings per share of $249 Future drivers for earningscould be the companyrsquos tea coffee and water operations Cost savings initiatives could also add to the
bottom line over time
Some analysts believe that Coca Cola could follow arch rival Pepsi Corsquos (PEP) moves to acquire itsown bottlers in an effort to gain more control over the production and distribution of its beverages inkey markets Coke holds a 35 interest in its largest manufacturer and distributor of Coca Cola
products Coca-Cola Enterprises In (CCE) Coca-Cola Enterprises Inc accounts for about 40 of Cokersquos concentrate sales and 16 of the companyrsquos worldwide volume which makes it a likely targetof acquisition should Coca Cola decide to follow Pepsi Corsquos strategy of buying back its bottlingoperations
The Return on Equity has been in a decline after hitting a high in 2001 Rather than focus on absolute
842019 Pepsi and Coca-cola(RH6802B54)
httpslidepdfcomreaderfullpepsi-and-coca-colarh6802b54 1022
values for this indicator I generally want to see at least a stable return on equity over time
Annual dividends have increased by an average of 1010 annually since 1999 which is slightlylower than the growth in EPS The company last raised its dividend by 8 in February 2009 for the47th year in a row
A 10 growth in dividends translates into the dividend payment doubling every seven years If welook at historical data going as far back as 1969 The Coca Cola Company has indeed managed todouble its dividend payment every seven years on average
The dividend payout ratio remained above 50 for the majority of the past decade A lower payout isalways a plus since it leaves room for consistent dividend growth minimizing the impact of short-
842019 Pepsi and Coca-cola(RH6802B54)
httpslidepdfcomreaderfullpepsi-and-coca-colarh6802b54 1122
term fluctuations in earnings
Currently Coca Cola is trading at 20 times earnings and yields 330 In comparison arch rival in thecola wars Pepsi Co trades at a PE multiple of 165 and yields 340 Check my analysis of Pepsi Co
I believe that The Coca Cola Company is not as attractively valued at the moment as Pepsi Co Iwould consider adding to my position there if it can cover its dividends at least two times by itsearnings by the end of the year and if the PE ratio doesnrsquot increase above 20COCA COLA ENTERPRISES INC Dividends amp Splits
5 Year Dividend History
Payable AmountShare Ex-Date Record Declaration
12102009 $008 11242009 11272009 10282009
09242009 $008 09092009 09112009 07302009
06252009 $007 06102009 06122009 04222009
03262009 $007 03112009 03132009 02112009
12112008 $007 11252008 11282008 10232008
09252008 $007 09102008 09122008 07232008
06262008 $007 06112008 06132008 04232008
03272008 $007 03122008 03142008 02152008
12132007 $006 11282007 11302007 10252007
09272007 $006 09122007 09142007 07242007
06282007 $006 06132007 06152007 04252007
03292007 $006 03142007 03162007 02102007
12142006 $006 11292006 12012006 10262006
09282006 $006 09132006 09152006 07262006
06292006 $006 06142006 06162006 04262006
03302006 $006 03152006 03172006 02182006
12152005 $004 11302005 12022005 10262005
10032005 $004 09152005 09192005 07272005
07012005 $004 06152005 06172005 04272005
842019 Pepsi and Coca-cola(RH6802B54)
httpslidepdfcomreaderfullpepsi-and-coca-colarh6802b54 1222
Payable AmountShare Ex-Date Record Declaration
04012005 $004 03162005 03182005 02162005
Dividend Analysis
Looking at the last 5 years of dividends I have calculated an average highdividend yield of 197 However that seems a tad low considering that each of
the last 2 years is significantly higher than that amount If I average out just the
last 4 years of high dividend yields I come up with 273 Still lower than the
average high yield of the last 2 years
And now the dividend payout ratio Ah ha This explains how they were able to
increase dividends at 10 even when the fundamentals have not been growing
as quickly Look at the increase in the payout ratio It has grown from a low of
3415 in 1997 to a high of 5714 in 2006 It has just been a steady climb up
for the last 10 years
Using the 273 as an average high dividend yield I calculate a price of $4982
to be able to collect this average high dividend yield At close of Friday the
current price was $5280 That means a premium of 599 over the price I am
willing to pay
Conclusion
Well my analysis shows that Coca-Cola fundamentals have not been keeping up
with their very healthy dividend growth This has caused Coca-Cola to have to
payout more and more of its earnings to shareholders This concerns me
because eventually they will not be able to raise their dividend at these high
rates because their dividend payout ratio will be too high
I am sure that Warren Buffett is earning a healthy dividend on his KO stocks but
personally I would pass on this one today There are stocks out there that
continue to grow their fundamentals which will in turn allow them to grow their
dividends
bull COCA COLA ENTERPRISES INC Top Competitors
Symbol Company Name Last
Change
Change
Volume News
Charts
CCE COCA COLA ENTERPRISES INC 1986 -011 -055 347 M
PBG PEPSI BOTTLING GROUP INC 3819 -028 -073 310 M
PEP PEPSICO INC 6276 -089 -140 640 M
Pepsi
842019 Pepsi and Coca-cola(RH6802B54)
httpslidepdfcomreaderfullpepsi-and-coca-colarh6802b54 1322
Pepsi
Type Cola
Manufacturer PepsiCo
Country of origin United States
Introduced1898 (as Brads Drink)June 16 1903 (as Pepsi-Cola)
1961 (as Pepsi)
Related products
Coca-ColaFantaDr Pepper Sprite (soft drink)Irn BruCola TurkaBig Cola
History
Pepsi is a carbonated soft drink produced and manufactured by PepsiCo It is sold in many placessuch as retail stores restaurants schools cinemas and from vending machines The drink was firstmade in the 1890s by pharmacist Caleb Bradham in New Bern North Carolina The brand wastrademarked on June 16 1903 There have been many Pepsi variants produced over the years since1898
In October 2008 Pepsi announced that it would be redesigning its logo and re-branding many of its products by early 2009 In 2009 Pepsi Diet Pepsi and Pepsi Max began using all lower-case fonts for name brands and Diet Pepsi Max was re-branded as Pepsi Max The brands blue and red globetrademark became a series of smiles with the central white band arcing at different angles
depending on the product Pepsi in countries such as the US Canada Brazil Bolivia Guatemala Nicaragua Honduras El Salvador Colombia Argentina Puerto Rico and Australia is carrying thesmile logo while the rest of the countries continue to use the old design on all packagingIn mid-September 2009the new logo has started to appear on 300 and 600ml bottles of Pepsi inAustralia Pepsi Max bottles still carry the current logo as of 27th September
Large Block Holder Type Number
Institutions 1764 Total Number of Shares Held156 B of Shares Owned by all Large Block Holders10000
Mutual Fund 2759
Other Major 25
Total Number of LargeBlock Holders 4548
842019 Pepsi and Coca-cola(RH6802B54)
httpslidepdfcomreaderfullpepsi-and-coca-colarh6802b54 1422
PEPSICO INC Dividends amp Splits
Upcoming Dividends
Payable AmountShare Ex-Date Record Declaration Set Alert
010410 $045 120209 120409 1113095 Year Dividend History
Payable AmountShare Ex-Date Record Declaration
01042010 $045 12022009 12042009 11162009
09302009 $045 09022009 09042009 08132009
06302009 $045 06032009 06052009 05062009
03312009 $0425 03042009 03062009 02072009
01022009 $0425 12032008 12052008 11172008
09302008 $0425 09032008 09052008 07192008
06302008 $0425 06042008 06062008 05082008
03312008 $0375 03052008 03072008 02022008
01022008 $0375 12052007 12072007 11172007
09282007 $0375 09052007 09072007 07202007
06292007 $0375 06062007 06082007 05092007
03302007 $030 03072007 03092007 02032007
01022007 $030 12062006 12082006 11182006
09292006 $030 09062006 09082006 07222006
06302006 $030 06072006 06092006 0504200603312006 $026 03082006 03102006 02042006
01032006 $026 12072005 12092005 11192005
09302005 $026 09072005 09092005 07232005
06302005 $026 06082005 06102005 05052005
03312005 $023 03092005 03112005 01282005
PEPSICO INC Income Statement
ViewAnnual Data | Quarterly Data
Period EndingQ3FY09 Q2 FY09 Q1 FY09 Q4 FY08 Q3 FY08
Net SalesRevenues 1108 B 1059 B 826 B 1273 B 1124 B
Cost of Goods Sold (ExcludingDepreciation)
476 B 452 B 344 B 617 B 490 B
Depreciation Depletion andAmortization
42200M
37100 M 31400 M 2100 M 37700 M
Gross Income 590 B 570 B 451 B 654 B 596 B
Selling General amp Admin Expenses 365 B 350 B 290 B 532 B 398 B
Other Operating Expense 157 B 161 B 144 B 152 B 142 B
842019 Pepsi and Coca-cola(RH6802B54)
httpslidepdfcomreaderfullpepsi-and-coca-colarh6802b54 1522
Period EndingQ3FY09 Q2 FY09 Q1 FY09 Q4 FY08 Q3 FY08
Net SalesRevenues 1108 B 1059 B 826 B 1273 B 1124 B
Operating Income 223 B 220 B 161 B 121 B 198 B
Extraordinary Credit - Pretax 9300 M 000 000 000 000
Extraordinary Charge - Pretax 000 20900 M 9100 M 90800 M 17600 M
Pretax Equity in Earnings 000 000 000 000 000
Other IncomeExpenses - Net 1600 M 42400 M 200 M 90800 M 19200 M
Pretax Income 216 B 212 B 149 B 108 B 192 B
Income Taxes 57500M
56800 M 37400 M 29300 M 55000 M
Minority Interest 1600 M 800 M 600 M 000 000
Equity in Earnings 000 000 000 000 000
Discontinued Operations 000 000 000 000 000
Net Income Before ExtraItemsPreferred Div
172 B 166 B 114 B 71900 M 158 B
Extra Items amp Gain (Loss) Sale of Assets
000 000 000 000 000
Net Income Before PreferredDividends
172 B 166 B 114 B 71900 M 158 B
Preferred Dividend Requirements 000 100 M 300 M 000 200 M
Net Income Used to CalculateDiluted EPS
mdash mdash mdash mdash mdash
Net Income Used to Calculate BasicEPS
mdash mdash mdash mdash mdash
Net Income Available to Common 172 B 166 B 114 B 71900 M 157 B
Period Ending FY2008 FY2007 FY2006 FY2005 FY2004
Net SalesRevenues 4325 B 3947 B 3514 B 3256 B 2926 B
Cost of Goods Sold (ExcludingDepreciation)
1878 B 1667 B 1452 B 1302 B 1229 B
Depreciation Depletion andAmortization
154 B 143 B 141 B 131 B 126 B
Gross Income 2292 B 2138 B 1921 B 1824 B 1571 B
Selling General amp AdminExpenses
1545 B 1411 B 1277 B 1231 B 1030 B
Other Operating Expense 000 000 000 000 000
Operating Expenses - Total 157 B 161 B 144 B 152 B 142 B
Operating Income 748 B 727 B 644 B 592 B 541 B
Extraordinary Credit - Pretax 000 000 000 000 000
842019 Pepsi and Coca-cola(RH6802B54)
httpslidepdfcomreaderfullpepsi-and-coca-colarh6802b54 1622
Period EndingQ3FY09 Q2 FY09 Q1 FY09 Q4 FY08 Q3 FY08
Net SalesRevenues 1108 B 1059 B 826 B 1273 B 1124 B
Extraordinary Charge - Pretax 54300
M
10200 M 15000 M 20600 M mdash
Non-operating Interest Income 4100 M 12500 M 17300 M 15900 M 7400 M
Reserves Inc (Dec) 000 000 000 000 000
Pretax Equity in Earnings 000 000 000 000 000
Other IncomeExpenses - Net 000 000 000 000 000
Earnings Before Interest amp Taxes(EBIT)
698 B 730 B 661 B 608 B 533 B
Interest Expenses On Debt 34300M
24500 M 25500 M 26100 M 16900 M
Interest Capitalized 1400 M 2100 M 1600 M 500 M 200 MPretax Income 665 B 707 B 637 B 582 B 517 B
Income Taxes 188 B 197 B 135 B 230 B 137 B
Current Domestic Income Tax 90200M
153 B 83200 M 176 B 110 B
Current Foreign Income Tax 73200M
48900M
56900 M 42600 M 25600 M
Deferred Domestic Income Tax 31400M
2400 M -3800 M 14800 M 1200 M
Deferred Foreign Income Tax -6900M
-6600M
-1600 M -2600 M 500 M
Income Tax Credits mdash mdash mdash mdash mdash
Minority Interest 000 000 000 000 000
Equity in Earnings 37400M
56000 M 61600 M 55700 M 38000 M
After Tax Income Expense 000 000 000 000 000
Discontinued Operations 000 000 000 000 3800 M
Net Income Before ExtraItemsPreferred Div
514 B 566 B 564 B 408 B 421 B
Extra Items amp Gain (Loss) Sale of Assets
000 000 000 000 000
Net Income Before PreferredDividends
514 B 566 B 564 B 408 B 421 B
Preferred Dividend Requirements 1000 M 1200 M 1100 M 1800 M 2500 M
Net Income Available to Common 514 B 566 B 564 B 408 B 421 B
Seasonal Performance Data PEP
Returns Jan Feb Mar Apr May Jun Jul Aug Sep Oct Nov Dec
AvgReturns -289 -033 154 024 252 -224 316 200 373 -293 095 006
Times PEP Stock Price 49 45 56 51 54 46 57 58 58 52 54 50
842019 Pepsi and Coca-cola(RH6802B54)
httpslidepdfcomreaderfullpepsi-and-coca-colarh6802b54 1722
Returns Jan Feb Mar Apr May Jun Jul Aug Sep Oct Nov Dec
Increased
Times PEP Stock PriceUnchanged
0 0 1 0 2 1 1 0 0 0 1 1
Times PEP Stock Price
Decreased52 51 52 52 50 61 47 53 44 59 47 54
2009 -828 -415 694 -333 460 559 326 -013 351 322 276 acirceurordquo
2008 -1015 201 386 -514 -033 -689 467 288 407 -2000 -053 -339
2007 430 -319 065 398 339 -508 119 367 769 063 469 -165
2006 -321 338 -222 078 381 -068 556 300 -002 -278 -231 094
2005 287 030 -153 492 111 -413 111 059 339 427 012 -019
2004 acirceurordquo acirceurordquo acirceurordquo acirceurordquo acirceurordquo acirceurordquo acirceurordquo acirceurordquo acirceurordquo acirceurordquo acirceurordquo 459
PepsiCo (PEP) Dividend Stock Analysis
PepsiCo Inc manufactures markets and sells various snacks carbonated and non-carbonated
beverages and foods worldwidePepsiCo is a major component of the SampP 500 Dow Industrials and
the Dividend Aristocrats Indexes PepsiCo has been consistently increasing its dividends for 36
consecutive years From the end of 1998 up until December 2008 this dividend growth stock has
delivered a 470 annual average total return to its shareholders
At the same time company has managed to deliver a 990 average annual increase in its EPS since
1999
842019 Pepsi and Coca-cola(RH6802B54)
httpslidepdfcomreaderfullpepsi-and-coca-colarh6802b54 1822
The ROE has remained largely between 31 and 38 with the exception of 2004 when it fell to as
low as 22
Annual dividend payments have increased by an average of 1350 annually since 1999 which is
much higher than the growth in EPS Analysts are expecting slight increase in EPS for 2009
compared to 2008 given the sluggish state of North American economies The strong US dollar could
potentially hurt sales as over 44 of PepsiCorsquos revenues are derived internationally
A 1350 growth in dividends translates into the dividend payment doubling almost every five years
Since 1978 PepsiCo has actually managed to double its dividend payment every six years on average
The dividend payout has remained in a range between 31 and 42 In 2008 the dividend payout
ratio has surged to 51 A lower payout is always a plus since it leaves room for consistent dividend
growth minimizing the impact of short-term fluctuations in earnings The slow growth in earnings
could put future dividend increases at risk
842019 Pepsi and Coca-cola(RH6802B54)
httpslidepdfcomreaderfullpepsi-and-coca-colarh6802b54 1922
842019 Pepsi and Coca-cola(RH6802B54)
httpslidepdfcomreaderfullpepsi-and-coca-colarh6802b54 2022
Though carbonated soft drinks remain the most popular beverage PEP recognizes that non-carbonated soft drinks are a faster growing category The company is focusing on the health andwellness trends It has eliminated trans fats from many of its snack foods and is introducing ldquogoodforyourdquo foods under the Quaker Oats brand Risks include the highly competitive and very maturenature of it products also with more exposure to foreign markets political and currency risks alsoincrease
Conclusion PEP did not earn any Stars in the Fair Value section earned two Stars in the DividendAnalytical Data section and earned one Star in the Dividend Income vs MMA section for a total of three Stars This quantitatively ranks PEP as a 3 Star-Hold
Using my D4L-PreScreenxls model I determined the share price could increase to $6562 beforePEPrsquos NPV MMA Differential fell to the $500 that I like to see for a stock with 37 consecutive yearsof dividend increases At that price the stock would yield 270
Resetting the D4L-PreScreenxls model and solving for the dividend growth rate needed to generatethe target $500 NPV MMA Differential the calculated rate is 63 This dividend growth rate is
lower than the the 76 used in this analysis thus providing a margin of safety PEP has a risk rating of 100 which classifies it as a low risk stock
Like its competition Coca-Cola (KO) PEPrsquos Free Cash Flow Payout currently at 70 tends toremain higher than the 60 level that I prefer However this is mitigated to an extent by relativelylow debt levels and predictable cash flows PEP is a stock I will buy as my allocation allows andwhen it dips below its buy price of $5510 For additional information including the stockrsquos dividendhistory please refer to its data page
Stock price of last five years with monthly price list
842019 Pepsi and Coca-cola(RH6802B54)
httpslidepdfcomreaderfullpepsi-and-coca-colarh6802b54 2122
PRICES
Date Open High Low Close Volume Adj Close
4-Dec-09 6318 6400 6308 6385 8907000 6385
3-Dec-09 6358 6359 6267 6276 6406200 6276
2-Dec-09 6350 6374 6317 6365 6195800 6365
2-Dec-09 $ 045 Dividend
1-Dec-09 6268 6393 6249 6387 6887700 6342
30-Nov-09 6264 6283 6215 6222 7252700 6178
27-Nov-09 6224 6255 6175 6230 3416000 6186
25-Nov-09 6253 6327 6249 6319 4672600 6274
24-Nov-09 6262 6265 6213 6250 4139700 6206
23-Nov-09 6246 6299 6226 6249 5009400 6205
20-Nov-09 6167 6231 6143 6208 5314600 6164
19-Nov-09 6210 6210 6135 6188 4390400 6144
18-Nov-09 6244 6251 6181 6230 3952300 6186
17-Nov-09 6242 6263 6203 6260 4362400 6216
16-Nov-09 6221 6249 6194 6243 4966800 6199
13-Nov-09 6163 6213 6135 6194 6411100 6150
12-Nov-09 6249 6275 6110 6127 8474900 6084
11-Nov-09 6234 6268 6208 6260 4714300 6216
10-Nov-09 6217 6294 6193 6208 7094100 6164
9-Nov-09 6181 6232 6143 6228 6921800 6184
6-Nov-09 6099 6176 6079 6176 4831000 6132
5-Nov-09 6044 6141 6042 6123 5578500 6080
4-Nov-09 6016 6096 5979 6038 5552100 5995
3-Nov-09 6029 6039 5962 6006 5797000 5964
2-Nov-09 6079 6107 6016 6060 6618800 601730-Oct-09 6135 6164 6037 6055 7794100 6012
29-Oct-09 6101 6146 6057 6139 5245300 6096
28-Oct-09 6088 6152 6075 6099 6321900 6056
27-Oct-09 6064 6135 6010 6100 7262900 6057
26-Oct-09 6114 6150 6021 6047 5113000 6004
23-Oct-09 6141 6167 6058 6103 6505200 6060
22-Oct-09 6190 6190 6087 6150 5428100 6107
21-Oct-09 6138 6234 6123 6184 7445000 6140
20-Oct-09 6200 6205 6112 6158 8068000 6115
19-Oct-09 6228 6257 6190 6205 5557300 616116-Oct-09 6247 6268 6211 6229 6588400 6185
15-Oct-09 6157 6275 6139 6268 10518600 6224
14-Oct-09 6094 6168 6070 6162 8462200 6119
13-Oct-09 6088 6100 6052 6060 7502000 6017
12-Oct-09 6043 6136 6025 6092 6178100 6049
9-Oct-09 6038 6070 5981 6059 6360200 6016
8-Oct-09 6124 6124 5980 6039 17263400 5996
7-Oct-09 6085 6138 6045 6117 6441900 6074
6-Oct-09 6105 6127 6042 6087 8128900 6044
5-Oct-09 6083 6124 6014 6085 7892000 60422-Oct-09 5912 6124 5893 6090 17530200 6047
1-Oct-09 5870 5899 5827 5846 9010200 5805
30-Sep-09 5874 5886 5801 5866 8898400 5825
29-Sep-09 5910 5931 5800 5851 7086400 5810
28-Sep-09 5895 5949 5862 5903 4085900 5861
25-Sep-09 5850 5913 5832 5868 6758800 5827
842019 Pepsi and Coca-cola(RH6802B54)
httpslidepdfcomreaderfullpepsi-and-coca-colarh6802b54 2222
References
1 httpwwwcoca-colacomindexjsp2 httpfinanceaolcomquotesthe-coca-cola-companykonys
3 httpfinanceaolcomeventthe-pepsi-bottling-group-incpbgnys
4 httpfinanceyahoocomqs=ko
5 httpwwwdividendgrowthinvestorcom200906coca-cola-ko-dividend-
stock-analysishtml
6 httpfinanceyahoocomqs=ko
7 httpmoneycentralmsncomdetailstock_quoteSymbol=Ko
842019 Pepsi and Coca-cola(RH6802B54)
httpslidepdfcomreaderfullpepsi-and-coca-colarh6802b54 222
In Pembertons original formula he added five ounces of coca leaf (cocaine) per gallon of syrupCandler claimed that he altered the formula and only added a tenth of the amount Coca Cola oncecontained an estimate of nine milligrams of cocaine per glass It wasnt until 1903 that it was removedfrom the drink altogether replacing it with coca flavoring
New Coke came out in 1985 after Coca-Cola attempted to change the original formula Mostconsumers preferred the taste of the original Coca-Cola and many ceased purchasing the productuntil the company switched back to the original formula It was renamed Coca Cola Classic to showconsumers that the drink had reverted back to its original formula
By the 21st century Coca Cola history took another leap in the market In 2005 the companylaunched Diet Coke sweetened with artificial flavors Later in 2005 it announced Coca ColaZero sweetened with aspartame and acesulfame potassium Since then the company has producedother products containing the same Coca-Cola formula with minor differences
Coca Cola is now being sold around the world in more than 200 different countries The Coca-Colacompany now sponsors an assortment of events including the Olympic Games and NASCAR In
England it is the primary sponsor of The Football League It is also featured in several televisionshows including The Gods Must Be Crazy
Coca Cola history has come a long way since Pemberton invented the originalrecipe and continues to grow by leaps and bounds It is no surprise that it is oneof the leading soft drinks of the market
COCA COLA ENTERPRISES INC Cash Flow
Annual Data | Quarterly Data
Period EndingQ3FY09 Q2 FY09 Q1 FY09 Q4 FY08
Q3FY08
Income 24700M
31300 M 6100 M -145 B 21400M
Depreciation Depletion amp Amortization 25400M
25600 M 26200 M 24400 M 26300M
Depreciation amp Depletion 25400M
25600M
26200 M 24400 M 26300M
Amortization of Intangible Assets 600 M 2100M
acirceurordquo acirceurordquo acirceurordquo
Extraordinary Items amp DiscontinuedOperations
acirceurordquo acirceurordquo acirceurordquo acirceurordquo acirceurordquo
Other Funds from Operations acirceurordquo acirceurordquo acirceurordquo acirceurordquo acirceurordquo
Funds from Operations 24200M
23500M
30500 M 25700 M 26500M
Increase or Decrease in AccountsReceivable
acirceurordquo acirceurordquo acirceurordquo acirceurordquo acirceurordquo
Increase or Decrease in Inventory acirceurordquo acirceurordquo acirceurordquo acirceurordquo acirceurordquoIncrease or Decrease in Accounts acirceurordquo acirceurordquo acirceurordquo acirceurordquo acirceurordquo
842019 Pepsi and Coca-cola(RH6802B54)
httpslidepdfcomreaderfullpepsi-and-coca-colarh6802b54 322
842019 Pepsi and Coca-cola(RH6802B54)
httpslidepdfcomreaderfullpepsi-and-coca-colarh6802b54 422
Period EndingQ3FY09 Q2 FY09 Q1 FY09 Q4 FY08
Q3FY08
Income 24700M
31300 M 6100 M -145 B 21400M
IncreaseDecrease in Cash and ShortTerm Investments -22400M -11000M -7400 M 1900 M -4700M
Period Ending FY2008 FY2007 FY2006 FY2005 FY2004
Net IncomeStarting Line -439 B 71100 M -114 B 51400 M 59600M
Operating Activities
Depreciation Depletion amp Amortization 105 B 107 B 101 B 104 B 107 B
Depreciation amp Depletion 105 B 107 B 101 B 104 B 107 B
Amortization of Intangible Assets 7500 M acirceurordquo acirceurordquo acirceurordquo acirceurordquo
Deferred Income Taxes and Investment Taxcredity
7600 M 12400 M 16900 M 25500 M 33100M
Deferred Income Taxes 7600 M 12400M
16900 M 25500 M 33100M
Income Tax Credit acirceurordquo acirceurordquo acirceurordquo acirceurordquo acirceurordquo
Other Cash Flow 762 B -4800 M 290 B -7500 M -12200M
Funds from Operations 168 B 175 B 170 B 156 B 167 B
Extraordinary Items amp DiscontinuedOperations
000 000 000 000 000
Funds fromfor Other Operating Activities -5700M
-9300 M -11100 M 5800 M -5100M
Incline (Decline) in Receivables -11800M
-4200M
-17300 M -3000 M -2100M
Incline (Decline) in Inventories -2400M
-10500M
4600 M -4800 M -200 M
Incline (Decline) in Accounts Payable 13500M
21100M
-1900 M 26400 M 5700 M
Incline (Decline) in Income TaxesPayable
acirceurordquo acirceurordquo acirceurordquo acirceurordquo acirceurordquo
Incline (Decline) in Other Accruals acirceurordquo acirceurordquo acirceurordquo acirceurordquo acirceurordquo
Incline (Decline) in Other Assets or Liabilties
-5000M
-15700M
3500 M -12800 M -8500M
Net Cash FlowOperating Activities 162 B 166 B 159 B 162 B 162 B
Capital Expenditures (Additions to FixedAssets)
Additions to Other Assets 000 000 000 000 000
Net Assets from Acquisitions 000 000 10600 M 000 000
842019 Pepsi and Coca-cola(RH6802B54)
httpslidepdfcomreaderfullpepsi-and-coca-colarh6802b54 522
Period EndingQ3FY09 Q2 FY09 Q1 FY09 Q4 FY08
Q3FY08
Income 24700M
31300 M 6100 M -145 B 21400M
Incline (Decline) in Inventories 000 000 000 000 000
Decrease in Investments 000 000 000 000 000
Disposal of Fixed Assets 1800 M 6800 M 5000 M 4800 M 2400 M
Other Uses - Investing 1200 M 400 M 1400 M 000 000
Other Sources - Investing 000 000 000 000 000
Net Cash Flow - Investing 97500M
87400 M 95200 M 85400 M 92200M
Proceeds from Stock Options 1800 M 12300M
7300 M 4000 M 18100M
Other Proceeds from SaleIssues of Stock
000 000 000 000 000
ComPfd Purchase Retired ConvertedRedeemed
000 000 000 000 000
Financing Activities
Long Term Borrowings 161 B 202 B 108 B 154 B 55800M
Incline or Decline in Short TermBorrowings
000 000 000 000 000
Reduction in Long Term Debt 162 B 283 B 162 B 236 B 130 B
Cash Dividends Paid Total 13800M
11600 M 11400 M 7600 M 7600 M
Common Dividends (Cash) 13800M
11600 M 11400 M 7600 M 7600 M
Preferred Dividends (Cash) 000 000 000 000 000
Other Sources - Financing 300 M 1100 M 400 M 4600 M 000
Other Uses - Financing 300 M 1100 M 400 M 4600 M 000
Net Cash Flow - Financing -12600M
-79900 M -57100 M -80400 M -63200M
Effect of Exchange rate on Cash -1800M
400 M 1000 M -900 M 1400 M
COCA COLA ENTERPRISES INC Average Monthly Returns
842019 Pepsi and Coca-cola(RH6802B54)
httpslidepdfcomreaderfullpepsi-and-coca-colarh6802b54 622
Some investors consider seasonal performance when purchasing or selling stocks This chartillustrates the average monthly return for the past 5 years Users often also consider the number of times a stock increases or decreases for any given month Mouse-over the chart to view 5 years of history for each monthSeasonal Performance Data CCE
Returns Jan Feb Mar Apr May Jun Jul Aug Sep Oct Nov DecAvg
Returns
-185 057 290 512 041 -143 345 251 -269 -1030 -020 623
Times CCEStock PriceIncreased
48 47 57 51 59 45 53 53 48 53 52 48
Times CCEStock PriceUnchanged
1 1 2 1 2 5 3 2 2 3 2 2
Times CCEStock PriceDecreased
52 48 50 51 45 58 49 56 52 55 48 55
2009 -664 223 1490 2934 -233 -005 1285 756 594 -1092 304 mdash
2008 -1136
590 -087 -707 -1048 -1409 -213 083 -175 -4006 -865 3105
2007 049 -213
085 835 643 278 -557 512 168 656 062 023
2006 297 -045
351 -397 067 361 535 391 -658 -383 210 -014
2005 528 -272
-388 -106 778 059 677 -488 -1274 -327 191 -025
2004 mdash mdash mdash mdash mdash mdash mdash mdash mdash mdash mdash 024
PRICES
842019 Pepsi and Coca-cola(RH6802B54)
httpslidepdfcomreaderfullpepsi-and-coca-colarh6802b54 722
Date Open High Low Close Volume Adj Close
4-Dec-09 2018 2018 1974 1991 3430200 1991
3-Dec-09 1995 2010 1984 1986 3473100 1986
2-Dec-09 1978 2002 1972 1997 3016300 1997
1-Dec-09 1978 1995 1973 1975 3605800 1975
30-Nov-09 1991 1998 1959 1965 5927600 1965
27-Nov-09 1998 2000 1972 1993 1291400 1993
25-Nov-09 2032 2044 2018 2037 2238500 2037
24-Nov-09 2040 2060 2012 2030 3577400 2030
24-Nov-09 $ 008 Dividend
23-Nov-09 2057 2074 2050 2060 2314400 2052
20-Nov-09 2017 2049 2012 2042 2779000 2034
19-Nov-09 2051 2060 2015 2023 3153300 2015
18-Nov-09 2067 2075 2046 2062 3366800 2054
17-Nov-09 2054 2079 2050 2073 2504800 2065
16-Nov-09 2027 2067 2023 2064 4489000 2056
13-Nov-09 2018 2037 2000 2023 3474500 2015
12-Nov-09 2029 2047 2011 2014 3220500 2006
11-Nov-09 2009 2029 1997 2027 3458000 2019
10-Nov-09 1979 2009 1962 2003 3429000 1995
9-Nov-09 1984 2012 1977 2010 2973900 2002
6-Nov-09 1960 1973 1949 1972 3231500 1964
5-Nov-09 1911 1987 1911 1972 7675000 19644-Nov-09 1904 1936 1893 1911 5034900 1904
3-Nov-09 1888 1900 1885 1899 5151700 1892
2-Nov-09 1912 1923 1875 1894 6168400 1887
30-Oct-09 1942 1948 1897 1907 7210100 1900
29-Oct-09 1910 1978 1908 1960 10382400 1952
28-Oct-09 2014 2030 1894 1902 8666100 1895
27-Oct-09 1984 2021 1974 2002 5150600 1994
26-Oct-09 1994 2034 1987 1994 4289800 1986
23-Oct-09 2065 2065 1990 1998 3740500 199022-Oct-09 2062 2065 2017 2055 2659200 2047
21-Oct-09 2055 2089 2045 2054 3005800 2046
20-Oct-09 2108 2111 2045 2054 3148900 2046
19-Oct-09 2095 2125 2086 2113 3800700 2105
16-Oct-09 2104 2105 2083 2094 2535100 2086
15-Oct-09 2094 2113 2089 2111 2577300 2103
14-Oct-09 2100 2111 2074 2105 3047400 2097
13-Oct-09 2089 2101 2054 2092 3717700 2084
12-Oct-09 2091 2119 2084 2091 2202700 20839-Oct-09 2079 2098 2074 2094 2096000 2086
842019 Pepsi and Coca-cola(RH6802B54)
httpslidepdfcomreaderfullpepsi-and-coca-colarh6802b54 822
8-Oct-09 2098 2106 2072 2085 2825100 2077
7-Oct-09 2097 2100 2071 2093 2529600 2085
6-Oct-09 2100 2111 2076 2095 3373300 2087
5-Oct-09 2056 2096 2039 2096 3507200 2088
2-Oct-09 2027 2064 2007 2058 3896300 2050
1-Oct-09 2122 2123 2053 2056 5159100 2048
30-Sep-09 2098 2144 2072 2141 4954800 2133
29-Sep-09 2107 2115 2093 2103 2439000 2095
28-Sep-09 2092 2116 2083 2102 2258400 2094
25-Sep-09 2100 2113 2086 2090 1981800 2082
24-Sep-09 2114 2125 2085 2101 2772600 2093
23-Sep-09 2102 2142 2102 2111 4214200 2103
22-Sep-09 2103 2108 2079 2094 2747900 2086
21-Sep-09 2110 2115 2087 2097 4250300 2089
18-Sep-09 2112 2117 2085 2115 4861500 2107
17-Sep-09 2114 2114 2076 2099 4785000 2091
16-Sep-09 2090 2090 2031 2076 3932100 2068
15-Sep-09 2071 2089 2053 2087 3186700 2079
14-Sep-09 2033 2076 2018 2075 3813400 2067
11-Sep-09 2043 2052 2022 2045 2822800 2037
10-Sep-09 2012 2038 2000 2037 5223600 2029
9-Sep-09 2049 2049 1983 2010 5783700 2002
9-Sep-09 $ 008 Dividend8-Sep-09 2038 2051 2029 2050 4232400 2034
4-Sep-09 2026 2047 2015 2032 2756800 2016
3-Sep-09 2015 2032 1992 2030 2937400 2014
2-Sep-09 1987 2014 1975 2004 4132300 1988
Coca-Cola Dividend Stock Analysis
Coca-Cola has paid uninterrupted dividends on its common stock since 1893 and increased paymentsto common shareholders every year for 47 yearsFrom the end of 1998 up until December 2008 this dividend growth stock has delivered a negativeannual average total return of 210 to its shareholders The stock has largely traded between $65 and$40 over the past decade
842019 Pepsi and Coca-cola(RH6802B54)
httpslidepdfcomreaderfullpepsi-and-coca-colarh6802b54 922
The company has managed to deliver a 1090 average annual increase in its EPS between 1999 and2008 Analysts are expecting an increase in EPS to $305-$310 for 2009 and $325-$330 by 2010This would be a nice increase from the 2008 earnings per share of $249 Future drivers for earningscould be the companyrsquos tea coffee and water operations Cost savings initiatives could also add to the
bottom line over time
Some analysts believe that Coca Cola could follow arch rival Pepsi Corsquos (PEP) moves to acquire itsown bottlers in an effort to gain more control over the production and distribution of its beverages inkey markets Coke holds a 35 interest in its largest manufacturer and distributor of Coca Cola
products Coca-Cola Enterprises In (CCE) Coca-Cola Enterprises Inc accounts for about 40 of Cokersquos concentrate sales and 16 of the companyrsquos worldwide volume which makes it a likely targetof acquisition should Coca Cola decide to follow Pepsi Corsquos strategy of buying back its bottlingoperations
The Return on Equity has been in a decline after hitting a high in 2001 Rather than focus on absolute
842019 Pepsi and Coca-cola(RH6802B54)
httpslidepdfcomreaderfullpepsi-and-coca-colarh6802b54 1022
values for this indicator I generally want to see at least a stable return on equity over time
Annual dividends have increased by an average of 1010 annually since 1999 which is slightlylower than the growth in EPS The company last raised its dividend by 8 in February 2009 for the47th year in a row
A 10 growth in dividends translates into the dividend payment doubling every seven years If welook at historical data going as far back as 1969 The Coca Cola Company has indeed managed todouble its dividend payment every seven years on average
The dividend payout ratio remained above 50 for the majority of the past decade A lower payout isalways a plus since it leaves room for consistent dividend growth minimizing the impact of short-
842019 Pepsi and Coca-cola(RH6802B54)
httpslidepdfcomreaderfullpepsi-and-coca-colarh6802b54 1122
term fluctuations in earnings
Currently Coca Cola is trading at 20 times earnings and yields 330 In comparison arch rival in thecola wars Pepsi Co trades at a PE multiple of 165 and yields 340 Check my analysis of Pepsi Co
I believe that The Coca Cola Company is not as attractively valued at the moment as Pepsi Co Iwould consider adding to my position there if it can cover its dividends at least two times by itsearnings by the end of the year and if the PE ratio doesnrsquot increase above 20COCA COLA ENTERPRISES INC Dividends amp Splits
5 Year Dividend History
Payable AmountShare Ex-Date Record Declaration
12102009 $008 11242009 11272009 10282009
09242009 $008 09092009 09112009 07302009
06252009 $007 06102009 06122009 04222009
03262009 $007 03112009 03132009 02112009
12112008 $007 11252008 11282008 10232008
09252008 $007 09102008 09122008 07232008
06262008 $007 06112008 06132008 04232008
03272008 $007 03122008 03142008 02152008
12132007 $006 11282007 11302007 10252007
09272007 $006 09122007 09142007 07242007
06282007 $006 06132007 06152007 04252007
03292007 $006 03142007 03162007 02102007
12142006 $006 11292006 12012006 10262006
09282006 $006 09132006 09152006 07262006
06292006 $006 06142006 06162006 04262006
03302006 $006 03152006 03172006 02182006
12152005 $004 11302005 12022005 10262005
10032005 $004 09152005 09192005 07272005
07012005 $004 06152005 06172005 04272005
842019 Pepsi and Coca-cola(RH6802B54)
httpslidepdfcomreaderfullpepsi-and-coca-colarh6802b54 1222
Payable AmountShare Ex-Date Record Declaration
04012005 $004 03162005 03182005 02162005
Dividend Analysis
Looking at the last 5 years of dividends I have calculated an average highdividend yield of 197 However that seems a tad low considering that each of
the last 2 years is significantly higher than that amount If I average out just the
last 4 years of high dividend yields I come up with 273 Still lower than the
average high yield of the last 2 years
And now the dividend payout ratio Ah ha This explains how they were able to
increase dividends at 10 even when the fundamentals have not been growing
as quickly Look at the increase in the payout ratio It has grown from a low of
3415 in 1997 to a high of 5714 in 2006 It has just been a steady climb up
for the last 10 years
Using the 273 as an average high dividend yield I calculate a price of $4982
to be able to collect this average high dividend yield At close of Friday the
current price was $5280 That means a premium of 599 over the price I am
willing to pay
Conclusion
Well my analysis shows that Coca-Cola fundamentals have not been keeping up
with their very healthy dividend growth This has caused Coca-Cola to have to
payout more and more of its earnings to shareholders This concerns me
because eventually they will not be able to raise their dividend at these high
rates because their dividend payout ratio will be too high
I am sure that Warren Buffett is earning a healthy dividend on his KO stocks but
personally I would pass on this one today There are stocks out there that
continue to grow their fundamentals which will in turn allow them to grow their
dividends
bull COCA COLA ENTERPRISES INC Top Competitors
Symbol Company Name Last
Change
Change
Volume News
Charts
CCE COCA COLA ENTERPRISES INC 1986 -011 -055 347 M
PBG PEPSI BOTTLING GROUP INC 3819 -028 -073 310 M
PEP PEPSICO INC 6276 -089 -140 640 M
Pepsi
842019 Pepsi and Coca-cola(RH6802B54)
httpslidepdfcomreaderfullpepsi-and-coca-colarh6802b54 1322
Pepsi
Type Cola
Manufacturer PepsiCo
Country of origin United States
Introduced1898 (as Brads Drink)June 16 1903 (as Pepsi-Cola)
1961 (as Pepsi)
Related products
Coca-ColaFantaDr Pepper Sprite (soft drink)Irn BruCola TurkaBig Cola
History
Pepsi is a carbonated soft drink produced and manufactured by PepsiCo It is sold in many placessuch as retail stores restaurants schools cinemas and from vending machines The drink was firstmade in the 1890s by pharmacist Caleb Bradham in New Bern North Carolina The brand wastrademarked on June 16 1903 There have been many Pepsi variants produced over the years since1898
In October 2008 Pepsi announced that it would be redesigning its logo and re-branding many of its products by early 2009 In 2009 Pepsi Diet Pepsi and Pepsi Max began using all lower-case fonts for name brands and Diet Pepsi Max was re-branded as Pepsi Max The brands blue and red globetrademark became a series of smiles with the central white band arcing at different angles
depending on the product Pepsi in countries such as the US Canada Brazil Bolivia Guatemala Nicaragua Honduras El Salvador Colombia Argentina Puerto Rico and Australia is carrying thesmile logo while the rest of the countries continue to use the old design on all packagingIn mid-September 2009the new logo has started to appear on 300 and 600ml bottles of Pepsi inAustralia Pepsi Max bottles still carry the current logo as of 27th September
Large Block Holder Type Number
Institutions 1764 Total Number of Shares Held156 B of Shares Owned by all Large Block Holders10000
Mutual Fund 2759
Other Major 25
Total Number of LargeBlock Holders 4548
842019 Pepsi and Coca-cola(RH6802B54)
httpslidepdfcomreaderfullpepsi-and-coca-colarh6802b54 1422
PEPSICO INC Dividends amp Splits
Upcoming Dividends
Payable AmountShare Ex-Date Record Declaration Set Alert
010410 $045 120209 120409 1113095 Year Dividend History
Payable AmountShare Ex-Date Record Declaration
01042010 $045 12022009 12042009 11162009
09302009 $045 09022009 09042009 08132009
06302009 $045 06032009 06052009 05062009
03312009 $0425 03042009 03062009 02072009
01022009 $0425 12032008 12052008 11172008
09302008 $0425 09032008 09052008 07192008
06302008 $0425 06042008 06062008 05082008
03312008 $0375 03052008 03072008 02022008
01022008 $0375 12052007 12072007 11172007
09282007 $0375 09052007 09072007 07202007
06292007 $0375 06062007 06082007 05092007
03302007 $030 03072007 03092007 02032007
01022007 $030 12062006 12082006 11182006
09292006 $030 09062006 09082006 07222006
06302006 $030 06072006 06092006 0504200603312006 $026 03082006 03102006 02042006
01032006 $026 12072005 12092005 11192005
09302005 $026 09072005 09092005 07232005
06302005 $026 06082005 06102005 05052005
03312005 $023 03092005 03112005 01282005
PEPSICO INC Income Statement
ViewAnnual Data | Quarterly Data
Period EndingQ3FY09 Q2 FY09 Q1 FY09 Q4 FY08 Q3 FY08
Net SalesRevenues 1108 B 1059 B 826 B 1273 B 1124 B
Cost of Goods Sold (ExcludingDepreciation)
476 B 452 B 344 B 617 B 490 B
Depreciation Depletion andAmortization
42200M
37100 M 31400 M 2100 M 37700 M
Gross Income 590 B 570 B 451 B 654 B 596 B
Selling General amp Admin Expenses 365 B 350 B 290 B 532 B 398 B
Other Operating Expense 157 B 161 B 144 B 152 B 142 B
842019 Pepsi and Coca-cola(RH6802B54)
httpslidepdfcomreaderfullpepsi-and-coca-colarh6802b54 1522
Period EndingQ3FY09 Q2 FY09 Q1 FY09 Q4 FY08 Q3 FY08
Net SalesRevenues 1108 B 1059 B 826 B 1273 B 1124 B
Operating Income 223 B 220 B 161 B 121 B 198 B
Extraordinary Credit - Pretax 9300 M 000 000 000 000
Extraordinary Charge - Pretax 000 20900 M 9100 M 90800 M 17600 M
Pretax Equity in Earnings 000 000 000 000 000
Other IncomeExpenses - Net 1600 M 42400 M 200 M 90800 M 19200 M
Pretax Income 216 B 212 B 149 B 108 B 192 B
Income Taxes 57500M
56800 M 37400 M 29300 M 55000 M
Minority Interest 1600 M 800 M 600 M 000 000
Equity in Earnings 000 000 000 000 000
Discontinued Operations 000 000 000 000 000
Net Income Before ExtraItemsPreferred Div
172 B 166 B 114 B 71900 M 158 B
Extra Items amp Gain (Loss) Sale of Assets
000 000 000 000 000
Net Income Before PreferredDividends
172 B 166 B 114 B 71900 M 158 B
Preferred Dividend Requirements 000 100 M 300 M 000 200 M
Net Income Used to CalculateDiluted EPS
mdash mdash mdash mdash mdash
Net Income Used to Calculate BasicEPS
mdash mdash mdash mdash mdash
Net Income Available to Common 172 B 166 B 114 B 71900 M 157 B
Period Ending FY2008 FY2007 FY2006 FY2005 FY2004
Net SalesRevenues 4325 B 3947 B 3514 B 3256 B 2926 B
Cost of Goods Sold (ExcludingDepreciation)
1878 B 1667 B 1452 B 1302 B 1229 B
Depreciation Depletion andAmortization
154 B 143 B 141 B 131 B 126 B
Gross Income 2292 B 2138 B 1921 B 1824 B 1571 B
Selling General amp AdminExpenses
1545 B 1411 B 1277 B 1231 B 1030 B
Other Operating Expense 000 000 000 000 000
Operating Expenses - Total 157 B 161 B 144 B 152 B 142 B
Operating Income 748 B 727 B 644 B 592 B 541 B
Extraordinary Credit - Pretax 000 000 000 000 000
842019 Pepsi and Coca-cola(RH6802B54)
httpslidepdfcomreaderfullpepsi-and-coca-colarh6802b54 1622
Period EndingQ3FY09 Q2 FY09 Q1 FY09 Q4 FY08 Q3 FY08
Net SalesRevenues 1108 B 1059 B 826 B 1273 B 1124 B
Extraordinary Charge - Pretax 54300
M
10200 M 15000 M 20600 M mdash
Non-operating Interest Income 4100 M 12500 M 17300 M 15900 M 7400 M
Reserves Inc (Dec) 000 000 000 000 000
Pretax Equity in Earnings 000 000 000 000 000
Other IncomeExpenses - Net 000 000 000 000 000
Earnings Before Interest amp Taxes(EBIT)
698 B 730 B 661 B 608 B 533 B
Interest Expenses On Debt 34300M
24500 M 25500 M 26100 M 16900 M
Interest Capitalized 1400 M 2100 M 1600 M 500 M 200 MPretax Income 665 B 707 B 637 B 582 B 517 B
Income Taxes 188 B 197 B 135 B 230 B 137 B
Current Domestic Income Tax 90200M
153 B 83200 M 176 B 110 B
Current Foreign Income Tax 73200M
48900M
56900 M 42600 M 25600 M
Deferred Domestic Income Tax 31400M
2400 M -3800 M 14800 M 1200 M
Deferred Foreign Income Tax -6900M
-6600M
-1600 M -2600 M 500 M
Income Tax Credits mdash mdash mdash mdash mdash
Minority Interest 000 000 000 000 000
Equity in Earnings 37400M
56000 M 61600 M 55700 M 38000 M
After Tax Income Expense 000 000 000 000 000
Discontinued Operations 000 000 000 000 3800 M
Net Income Before ExtraItemsPreferred Div
514 B 566 B 564 B 408 B 421 B
Extra Items amp Gain (Loss) Sale of Assets
000 000 000 000 000
Net Income Before PreferredDividends
514 B 566 B 564 B 408 B 421 B
Preferred Dividend Requirements 1000 M 1200 M 1100 M 1800 M 2500 M
Net Income Available to Common 514 B 566 B 564 B 408 B 421 B
Seasonal Performance Data PEP
Returns Jan Feb Mar Apr May Jun Jul Aug Sep Oct Nov Dec
AvgReturns -289 -033 154 024 252 -224 316 200 373 -293 095 006
Times PEP Stock Price 49 45 56 51 54 46 57 58 58 52 54 50
842019 Pepsi and Coca-cola(RH6802B54)
httpslidepdfcomreaderfullpepsi-and-coca-colarh6802b54 1722
Returns Jan Feb Mar Apr May Jun Jul Aug Sep Oct Nov Dec
Increased
Times PEP Stock PriceUnchanged
0 0 1 0 2 1 1 0 0 0 1 1
Times PEP Stock Price
Decreased52 51 52 52 50 61 47 53 44 59 47 54
2009 -828 -415 694 -333 460 559 326 -013 351 322 276 acirceurordquo
2008 -1015 201 386 -514 -033 -689 467 288 407 -2000 -053 -339
2007 430 -319 065 398 339 -508 119 367 769 063 469 -165
2006 -321 338 -222 078 381 -068 556 300 -002 -278 -231 094
2005 287 030 -153 492 111 -413 111 059 339 427 012 -019
2004 acirceurordquo acirceurordquo acirceurordquo acirceurordquo acirceurordquo acirceurordquo acirceurordquo acirceurordquo acirceurordquo acirceurordquo acirceurordquo 459
PepsiCo (PEP) Dividend Stock Analysis
PepsiCo Inc manufactures markets and sells various snacks carbonated and non-carbonated
beverages and foods worldwidePepsiCo is a major component of the SampP 500 Dow Industrials and
the Dividend Aristocrats Indexes PepsiCo has been consistently increasing its dividends for 36
consecutive years From the end of 1998 up until December 2008 this dividend growth stock has
delivered a 470 annual average total return to its shareholders
At the same time company has managed to deliver a 990 average annual increase in its EPS since
1999
842019 Pepsi and Coca-cola(RH6802B54)
httpslidepdfcomreaderfullpepsi-and-coca-colarh6802b54 1822
The ROE has remained largely between 31 and 38 with the exception of 2004 when it fell to as
low as 22
Annual dividend payments have increased by an average of 1350 annually since 1999 which is
much higher than the growth in EPS Analysts are expecting slight increase in EPS for 2009
compared to 2008 given the sluggish state of North American economies The strong US dollar could
potentially hurt sales as over 44 of PepsiCorsquos revenues are derived internationally
A 1350 growth in dividends translates into the dividend payment doubling almost every five years
Since 1978 PepsiCo has actually managed to double its dividend payment every six years on average
The dividend payout has remained in a range between 31 and 42 In 2008 the dividend payout
ratio has surged to 51 A lower payout is always a plus since it leaves room for consistent dividend
growth minimizing the impact of short-term fluctuations in earnings The slow growth in earnings
could put future dividend increases at risk
842019 Pepsi and Coca-cola(RH6802B54)
httpslidepdfcomreaderfullpepsi-and-coca-colarh6802b54 1922
842019 Pepsi and Coca-cola(RH6802B54)
httpslidepdfcomreaderfullpepsi-and-coca-colarh6802b54 2022
Though carbonated soft drinks remain the most popular beverage PEP recognizes that non-carbonated soft drinks are a faster growing category The company is focusing on the health andwellness trends It has eliminated trans fats from many of its snack foods and is introducing ldquogoodforyourdquo foods under the Quaker Oats brand Risks include the highly competitive and very maturenature of it products also with more exposure to foreign markets political and currency risks alsoincrease
Conclusion PEP did not earn any Stars in the Fair Value section earned two Stars in the DividendAnalytical Data section and earned one Star in the Dividend Income vs MMA section for a total of three Stars This quantitatively ranks PEP as a 3 Star-Hold
Using my D4L-PreScreenxls model I determined the share price could increase to $6562 beforePEPrsquos NPV MMA Differential fell to the $500 that I like to see for a stock with 37 consecutive yearsof dividend increases At that price the stock would yield 270
Resetting the D4L-PreScreenxls model and solving for the dividend growth rate needed to generatethe target $500 NPV MMA Differential the calculated rate is 63 This dividend growth rate is
lower than the the 76 used in this analysis thus providing a margin of safety PEP has a risk rating of 100 which classifies it as a low risk stock
Like its competition Coca-Cola (KO) PEPrsquos Free Cash Flow Payout currently at 70 tends toremain higher than the 60 level that I prefer However this is mitigated to an extent by relativelylow debt levels and predictable cash flows PEP is a stock I will buy as my allocation allows andwhen it dips below its buy price of $5510 For additional information including the stockrsquos dividendhistory please refer to its data page
Stock price of last five years with monthly price list
842019 Pepsi and Coca-cola(RH6802B54)
httpslidepdfcomreaderfullpepsi-and-coca-colarh6802b54 2122
PRICES
Date Open High Low Close Volume Adj Close
4-Dec-09 6318 6400 6308 6385 8907000 6385
3-Dec-09 6358 6359 6267 6276 6406200 6276
2-Dec-09 6350 6374 6317 6365 6195800 6365
2-Dec-09 $ 045 Dividend
1-Dec-09 6268 6393 6249 6387 6887700 6342
30-Nov-09 6264 6283 6215 6222 7252700 6178
27-Nov-09 6224 6255 6175 6230 3416000 6186
25-Nov-09 6253 6327 6249 6319 4672600 6274
24-Nov-09 6262 6265 6213 6250 4139700 6206
23-Nov-09 6246 6299 6226 6249 5009400 6205
20-Nov-09 6167 6231 6143 6208 5314600 6164
19-Nov-09 6210 6210 6135 6188 4390400 6144
18-Nov-09 6244 6251 6181 6230 3952300 6186
17-Nov-09 6242 6263 6203 6260 4362400 6216
16-Nov-09 6221 6249 6194 6243 4966800 6199
13-Nov-09 6163 6213 6135 6194 6411100 6150
12-Nov-09 6249 6275 6110 6127 8474900 6084
11-Nov-09 6234 6268 6208 6260 4714300 6216
10-Nov-09 6217 6294 6193 6208 7094100 6164
9-Nov-09 6181 6232 6143 6228 6921800 6184
6-Nov-09 6099 6176 6079 6176 4831000 6132
5-Nov-09 6044 6141 6042 6123 5578500 6080
4-Nov-09 6016 6096 5979 6038 5552100 5995
3-Nov-09 6029 6039 5962 6006 5797000 5964
2-Nov-09 6079 6107 6016 6060 6618800 601730-Oct-09 6135 6164 6037 6055 7794100 6012
29-Oct-09 6101 6146 6057 6139 5245300 6096
28-Oct-09 6088 6152 6075 6099 6321900 6056
27-Oct-09 6064 6135 6010 6100 7262900 6057
26-Oct-09 6114 6150 6021 6047 5113000 6004
23-Oct-09 6141 6167 6058 6103 6505200 6060
22-Oct-09 6190 6190 6087 6150 5428100 6107
21-Oct-09 6138 6234 6123 6184 7445000 6140
20-Oct-09 6200 6205 6112 6158 8068000 6115
19-Oct-09 6228 6257 6190 6205 5557300 616116-Oct-09 6247 6268 6211 6229 6588400 6185
15-Oct-09 6157 6275 6139 6268 10518600 6224
14-Oct-09 6094 6168 6070 6162 8462200 6119
13-Oct-09 6088 6100 6052 6060 7502000 6017
12-Oct-09 6043 6136 6025 6092 6178100 6049
9-Oct-09 6038 6070 5981 6059 6360200 6016
8-Oct-09 6124 6124 5980 6039 17263400 5996
7-Oct-09 6085 6138 6045 6117 6441900 6074
6-Oct-09 6105 6127 6042 6087 8128900 6044
5-Oct-09 6083 6124 6014 6085 7892000 60422-Oct-09 5912 6124 5893 6090 17530200 6047
1-Oct-09 5870 5899 5827 5846 9010200 5805
30-Sep-09 5874 5886 5801 5866 8898400 5825
29-Sep-09 5910 5931 5800 5851 7086400 5810
28-Sep-09 5895 5949 5862 5903 4085900 5861
25-Sep-09 5850 5913 5832 5868 6758800 5827
842019 Pepsi and Coca-cola(RH6802B54)
httpslidepdfcomreaderfullpepsi-and-coca-colarh6802b54 2222
References
1 httpwwwcoca-colacomindexjsp2 httpfinanceaolcomquotesthe-coca-cola-companykonys
3 httpfinanceaolcomeventthe-pepsi-bottling-group-incpbgnys
4 httpfinanceyahoocomqs=ko
5 httpwwwdividendgrowthinvestorcom200906coca-cola-ko-dividend-
stock-analysishtml
6 httpfinanceyahoocomqs=ko
7 httpmoneycentralmsncomdetailstock_quoteSymbol=Ko
842019 Pepsi and Coca-cola(RH6802B54)
httpslidepdfcomreaderfullpepsi-and-coca-colarh6802b54 322
842019 Pepsi and Coca-cola(RH6802B54)
httpslidepdfcomreaderfullpepsi-and-coca-colarh6802b54 422
Period EndingQ3FY09 Q2 FY09 Q1 FY09 Q4 FY08
Q3FY08
Income 24700M
31300 M 6100 M -145 B 21400M
IncreaseDecrease in Cash and ShortTerm Investments -22400M -11000M -7400 M 1900 M -4700M
Period Ending FY2008 FY2007 FY2006 FY2005 FY2004
Net IncomeStarting Line -439 B 71100 M -114 B 51400 M 59600M
Operating Activities
Depreciation Depletion amp Amortization 105 B 107 B 101 B 104 B 107 B
Depreciation amp Depletion 105 B 107 B 101 B 104 B 107 B
Amortization of Intangible Assets 7500 M acirceurordquo acirceurordquo acirceurordquo acirceurordquo
Deferred Income Taxes and Investment Taxcredity
7600 M 12400 M 16900 M 25500 M 33100M
Deferred Income Taxes 7600 M 12400M
16900 M 25500 M 33100M
Income Tax Credit acirceurordquo acirceurordquo acirceurordquo acirceurordquo acirceurordquo
Other Cash Flow 762 B -4800 M 290 B -7500 M -12200M
Funds from Operations 168 B 175 B 170 B 156 B 167 B
Extraordinary Items amp DiscontinuedOperations
000 000 000 000 000
Funds fromfor Other Operating Activities -5700M
-9300 M -11100 M 5800 M -5100M
Incline (Decline) in Receivables -11800M
-4200M
-17300 M -3000 M -2100M
Incline (Decline) in Inventories -2400M
-10500M
4600 M -4800 M -200 M
Incline (Decline) in Accounts Payable 13500M
21100M
-1900 M 26400 M 5700 M
Incline (Decline) in Income TaxesPayable
acirceurordquo acirceurordquo acirceurordquo acirceurordquo acirceurordquo
Incline (Decline) in Other Accruals acirceurordquo acirceurordquo acirceurordquo acirceurordquo acirceurordquo
Incline (Decline) in Other Assets or Liabilties
-5000M
-15700M
3500 M -12800 M -8500M
Net Cash FlowOperating Activities 162 B 166 B 159 B 162 B 162 B
Capital Expenditures (Additions to FixedAssets)
Additions to Other Assets 000 000 000 000 000
Net Assets from Acquisitions 000 000 10600 M 000 000
842019 Pepsi and Coca-cola(RH6802B54)
httpslidepdfcomreaderfullpepsi-and-coca-colarh6802b54 522
Period EndingQ3FY09 Q2 FY09 Q1 FY09 Q4 FY08
Q3FY08
Income 24700M
31300 M 6100 M -145 B 21400M
Incline (Decline) in Inventories 000 000 000 000 000
Decrease in Investments 000 000 000 000 000
Disposal of Fixed Assets 1800 M 6800 M 5000 M 4800 M 2400 M
Other Uses - Investing 1200 M 400 M 1400 M 000 000
Other Sources - Investing 000 000 000 000 000
Net Cash Flow - Investing 97500M
87400 M 95200 M 85400 M 92200M
Proceeds from Stock Options 1800 M 12300M
7300 M 4000 M 18100M
Other Proceeds from SaleIssues of Stock
000 000 000 000 000
ComPfd Purchase Retired ConvertedRedeemed
000 000 000 000 000
Financing Activities
Long Term Borrowings 161 B 202 B 108 B 154 B 55800M
Incline or Decline in Short TermBorrowings
000 000 000 000 000
Reduction in Long Term Debt 162 B 283 B 162 B 236 B 130 B
Cash Dividends Paid Total 13800M
11600 M 11400 M 7600 M 7600 M
Common Dividends (Cash) 13800M
11600 M 11400 M 7600 M 7600 M
Preferred Dividends (Cash) 000 000 000 000 000
Other Sources - Financing 300 M 1100 M 400 M 4600 M 000
Other Uses - Financing 300 M 1100 M 400 M 4600 M 000
Net Cash Flow - Financing -12600M
-79900 M -57100 M -80400 M -63200M
Effect of Exchange rate on Cash -1800M
400 M 1000 M -900 M 1400 M
COCA COLA ENTERPRISES INC Average Monthly Returns
842019 Pepsi and Coca-cola(RH6802B54)
httpslidepdfcomreaderfullpepsi-and-coca-colarh6802b54 622
Some investors consider seasonal performance when purchasing or selling stocks This chartillustrates the average monthly return for the past 5 years Users often also consider the number of times a stock increases or decreases for any given month Mouse-over the chart to view 5 years of history for each monthSeasonal Performance Data CCE
Returns Jan Feb Mar Apr May Jun Jul Aug Sep Oct Nov DecAvg
Returns
-185 057 290 512 041 -143 345 251 -269 -1030 -020 623
Times CCEStock PriceIncreased
48 47 57 51 59 45 53 53 48 53 52 48
Times CCEStock PriceUnchanged
1 1 2 1 2 5 3 2 2 3 2 2
Times CCEStock PriceDecreased
52 48 50 51 45 58 49 56 52 55 48 55
2009 -664 223 1490 2934 -233 -005 1285 756 594 -1092 304 mdash
2008 -1136
590 -087 -707 -1048 -1409 -213 083 -175 -4006 -865 3105
2007 049 -213
085 835 643 278 -557 512 168 656 062 023
2006 297 -045
351 -397 067 361 535 391 -658 -383 210 -014
2005 528 -272
-388 -106 778 059 677 -488 -1274 -327 191 -025
2004 mdash mdash mdash mdash mdash mdash mdash mdash mdash mdash mdash 024
PRICES
842019 Pepsi and Coca-cola(RH6802B54)
httpslidepdfcomreaderfullpepsi-and-coca-colarh6802b54 722
Date Open High Low Close Volume Adj Close
4-Dec-09 2018 2018 1974 1991 3430200 1991
3-Dec-09 1995 2010 1984 1986 3473100 1986
2-Dec-09 1978 2002 1972 1997 3016300 1997
1-Dec-09 1978 1995 1973 1975 3605800 1975
30-Nov-09 1991 1998 1959 1965 5927600 1965
27-Nov-09 1998 2000 1972 1993 1291400 1993
25-Nov-09 2032 2044 2018 2037 2238500 2037
24-Nov-09 2040 2060 2012 2030 3577400 2030
24-Nov-09 $ 008 Dividend
23-Nov-09 2057 2074 2050 2060 2314400 2052
20-Nov-09 2017 2049 2012 2042 2779000 2034
19-Nov-09 2051 2060 2015 2023 3153300 2015
18-Nov-09 2067 2075 2046 2062 3366800 2054
17-Nov-09 2054 2079 2050 2073 2504800 2065
16-Nov-09 2027 2067 2023 2064 4489000 2056
13-Nov-09 2018 2037 2000 2023 3474500 2015
12-Nov-09 2029 2047 2011 2014 3220500 2006
11-Nov-09 2009 2029 1997 2027 3458000 2019
10-Nov-09 1979 2009 1962 2003 3429000 1995
9-Nov-09 1984 2012 1977 2010 2973900 2002
6-Nov-09 1960 1973 1949 1972 3231500 1964
5-Nov-09 1911 1987 1911 1972 7675000 19644-Nov-09 1904 1936 1893 1911 5034900 1904
3-Nov-09 1888 1900 1885 1899 5151700 1892
2-Nov-09 1912 1923 1875 1894 6168400 1887
30-Oct-09 1942 1948 1897 1907 7210100 1900
29-Oct-09 1910 1978 1908 1960 10382400 1952
28-Oct-09 2014 2030 1894 1902 8666100 1895
27-Oct-09 1984 2021 1974 2002 5150600 1994
26-Oct-09 1994 2034 1987 1994 4289800 1986
23-Oct-09 2065 2065 1990 1998 3740500 199022-Oct-09 2062 2065 2017 2055 2659200 2047
21-Oct-09 2055 2089 2045 2054 3005800 2046
20-Oct-09 2108 2111 2045 2054 3148900 2046
19-Oct-09 2095 2125 2086 2113 3800700 2105
16-Oct-09 2104 2105 2083 2094 2535100 2086
15-Oct-09 2094 2113 2089 2111 2577300 2103
14-Oct-09 2100 2111 2074 2105 3047400 2097
13-Oct-09 2089 2101 2054 2092 3717700 2084
12-Oct-09 2091 2119 2084 2091 2202700 20839-Oct-09 2079 2098 2074 2094 2096000 2086
842019 Pepsi and Coca-cola(RH6802B54)
httpslidepdfcomreaderfullpepsi-and-coca-colarh6802b54 822
8-Oct-09 2098 2106 2072 2085 2825100 2077
7-Oct-09 2097 2100 2071 2093 2529600 2085
6-Oct-09 2100 2111 2076 2095 3373300 2087
5-Oct-09 2056 2096 2039 2096 3507200 2088
2-Oct-09 2027 2064 2007 2058 3896300 2050
1-Oct-09 2122 2123 2053 2056 5159100 2048
30-Sep-09 2098 2144 2072 2141 4954800 2133
29-Sep-09 2107 2115 2093 2103 2439000 2095
28-Sep-09 2092 2116 2083 2102 2258400 2094
25-Sep-09 2100 2113 2086 2090 1981800 2082
24-Sep-09 2114 2125 2085 2101 2772600 2093
23-Sep-09 2102 2142 2102 2111 4214200 2103
22-Sep-09 2103 2108 2079 2094 2747900 2086
21-Sep-09 2110 2115 2087 2097 4250300 2089
18-Sep-09 2112 2117 2085 2115 4861500 2107
17-Sep-09 2114 2114 2076 2099 4785000 2091
16-Sep-09 2090 2090 2031 2076 3932100 2068
15-Sep-09 2071 2089 2053 2087 3186700 2079
14-Sep-09 2033 2076 2018 2075 3813400 2067
11-Sep-09 2043 2052 2022 2045 2822800 2037
10-Sep-09 2012 2038 2000 2037 5223600 2029
9-Sep-09 2049 2049 1983 2010 5783700 2002
9-Sep-09 $ 008 Dividend8-Sep-09 2038 2051 2029 2050 4232400 2034
4-Sep-09 2026 2047 2015 2032 2756800 2016
3-Sep-09 2015 2032 1992 2030 2937400 2014
2-Sep-09 1987 2014 1975 2004 4132300 1988
Coca-Cola Dividend Stock Analysis
Coca-Cola has paid uninterrupted dividends on its common stock since 1893 and increased paymentsto common shareholders every year for 47 yearsFrom the end of 1998 up until December 2008 this dividend growth stock has delivered a negativeannual average total return of 210 to its shareholders The stock has largely traded between $65 and$40 over the past decade
842019 Pepsi and Coca-cola(RH6802B54)
httpslidepdfcomreaderfullpepsi-and-coca-colarh6802b54 922
The company has managed to deliver a 1090 average annual increase in its EPS between 1999 and2008 Analysts are expecting an increase in EPS to $305-$310 for 2009 and $325-$330 by 2010This would be a nice increase from the 2008 earnings per share of $249 Future drivers for earningscould be the companyrsquos tea coffee and water operations Cost savings initiatives could also add to the
bottom line over time
Some analysts believe that Coca Cola could follow arch rival Pepsi Corsquos (PEP) moves to acquire itsown bottlers in an effort to gain more control over the production and distribution of its beverages inkey markets Coke holds a 35 interest in its largest manufacturer and distributor of Coca Cola
products Coca-Cola Enterprises In (CCE) Coca-Cola Enterprises Inc accounts for about 40 of Cokersquos concentrate sales and 16 of the companyrsquos worldwide volume which makes it a likely targetof acquisition should Coca Cola decide to follow Pepsi Corsquos strategy of buying back its bottlingoperations
The Return on Equity has been in a decline after hitting a high in 2001 Rather than focus on absolute
842019 Pepsi and Coca-cola(RH6802B54)
httpslidepdfcomreaderfullpepsi-and-coca-colarh6802b54 1022
values for this indicator I generally want to see at least a stable return on equity over time
Annual dividends have increased by an average of 1010 annually since 1999 which is slightlylower than the growth in EPS The company last raised its dividend by 8 in February 2009 for the47th year in a row
A 10 growth in dividends translates into the dividend payment doubling every seven years If welook at historical data going as far back as 1969 The Coca Cola Company has indeed managed todouble its dividend payment every seven years on average
The dividend payout ratio remained above 50 for the majority of the past decade A lower payout isalways a plus since it leaves room for consistent dividend growth minimizing the impact of short-
842019 Pepsi and Coca-cola(RH6802B54)
httpslidepdfcomreaderfullpepsi-and-coca-colarh6802b54 1122
term fluctuations in earnings
Currently Coca Cola is trading at 20 times earnings and yields 330 In comparison arch rival in thecola wars Pepsi Co trades at a PE multiple of 165 and yields 340 Check my analysis of Pepsi Co
I believe that The Coca Cola Company is not as attractively valued at the moment as Pepsi Co Iwould consider adding to my position there if it can cover its dividends at least two times by itsearnings by the end of the year and if the PE ratio doesnrsquot increase above 20COCA COLA ENTERPRISES INC Dividends amp Splits
5 Year Dividend History
Payable AmountShare Ex-Date Record Declaration
12102009 $008 11242009 11272009 10282009
09242009 $008 09092009 09112009 07302009
06252009 $007 06102009 06122009 04222009
03262009 $007 03112009 03132009 02112009
12112008 $007 11252008 11282008 10232008
09252008 $007 09102008 09122008 07232008
06262008 $007 06112008 06132008 04232008
03272008 $007 03122008 03142008 02152008
12132007 $006 11282007 11302007 10252007
09272007 $006 09122007 09142007 07242007
06282007 $006 06132007 06152007 04252007
03292007 $006 03142007 03162007 02102007
12142006 $006 11292006 12012006 10262006
09282006 $006 09132006 09152006 07262006
06292006 $006 06142006 06162006 04262006
03302006 $006 03152006 03172006 02182006
12152005 $004 11302005 12022005 10262005
10032005 $004 09152005 09192005 07272005
07012005 $004 06152005 06172005 04272005
842019 Pepsi and Coca-cola(RH6802B54)
httpslidepdfcomreaderfullpepsi-and-coca-colarh6802b54 1222
Payable AmountShare Ex-Date Record Declaration
04012005 $004 03162005 03182005 02162005
Dividend Analysis
Looking at the last 5 years of dividends I have calculated an average highdividend yield of 197 However that seems a tad low considering that each of
the last 2 years is significantly higher than that amount If I average out just the
last 4 years of high dividend yields I come up with 273 Still lower than the
average high yield of the last 2 years
And now the dividend payout ratio Ah ha This explains how they were able to
increase dividends at 10 even when the fundamentals have not been growing
as quickly Look at the increase in the payout ratio It has grown from a low of
3415 in 1997 to a high of 5714 in 2006 It has just been a steady climb up
for the last 10 years
Using the 273 as an average high dividend yield I calculate a price of $4982
to be able to collect this average high dividend yield At close of Friday the
current price was $5280 That means a premium of 599 over the price I am
willing to pay
Conclusion
Well my analysis shows that Coca-Cola fundamentals have not been keeping up
with their very healthy dividend growth This has caused Coca-Cola to have to
payout more and more of its earnings to shareholders This concerns me
because eventually they will not be able to raise their dividend at these high
rates because their dividend payout ratio will be too high
I am sure that Warren Buffett is earning a healthy dividend on his KO stocks but
personally I would pass on this one today There are stocks out there that
continue to grow their fundamentals which will in turn allow them to grow their
dividends
bull COCA COLA ENTERPRISES INC Top Competitors
Symbol Company Name Last
Change
Change
Volume News
Charts
CCE COCA COLA ENTERPRISES INC 1986 -011 -055 347 M
PBG PEPSI BOTTLING GROUP INC 3819 -028 -073 310 M
PEP PEPSICO INC 6276 -089 -140 640 M
Pepsi
842019 Pepsi and Coca-cola(RH6802B54)
httpslidepdfcomreaderfullpepsi-and-coca-colarh6802b54 1322
Pepsi
Type Cola
Manufacturer PepsiCo
Country of origin United States
Introduced1898 (as Brads Drink)June 16 1903 (as Pepsi-Cola)
1961 (as Pepsi)
Related products
Coca-ColaFantaDr Pepper Sprite (soft drink)Irn BruCola TurkaBig Cola
History
Pepsi is a carbonated soft drink produced and manufactured by PepsiCo It is sold in many placessuch as retail stores restaurants schools cinemas and from vending machines The drink was firstmade in the 1890s by pharmacist Caleb Bradham in New Bern North Carolina The brand wastrademarked on June 16 1903 There have been many Pepsi variants produced over the years since1898
In October 2008 Pepsi announced that it would be redesigning its logo and re-branding many of its products by early 2009 In 2009 Pepsi Diet Pepsi and Pepsi Max began using all lower-case fonts for name brands and Diet Pepsi Max was re-branded as Pepsi Max The brands blue and red globetrademark became a series of smiles with the central white band arcing at different angles
depending on the product Pepsi in countries such as the US Canada Brazil Bolivia Guatemala Nicaragua Honduras El Salvador Colombia Argentina Puerto Rico and Australia is carrying thesmile logo while the rest of the countries continue to use the old design on all packagingIn mid-September 2009the new logo has started to appear on 300 and 600ml bottles of Pepsi inAustralia Pepsi Max bottles still carry the current logo as of 27th September
Large Block Holder Type Number
Institutions 1764 Total Number of Shares Held156 B of Shares Owned by all Large Block Holders10000
Mutual Fund 2759
Other Major 25
Total Number of LargeBlock Holders 4548
842019 Pepsi and Coca-cola(RH6802B54)
httpslidepdfcomreaderfullpepsi-and-coca-colarh6802b54 1422
PEPSICO INC Dividends amp Splits
Upcoming Dividends
Payable AmountShare Ex-Date Record Declaration Set Alert
010410 $045 120209 120409 1113095 Year Dividend History
Payable AmountShare Ex-Date Record Declaration
01042010 $045 12022009 12042009 11162009
09302009 $045 09022009 09042009 08132009
06302009 $045 06032009 06052009 05062009
03312009 $0425 03042009 03062009 02072009
01022009 $0425 12032008 12052008 11172008
09302008 $0425 09032008 09052008 07192008
06302008 $0425 06042008 06062008 05082008
03312008 $0375 03052008 03072008 02022008
01022008 $0375 12052007 12072007 11172007
09282007 $0375 09052007 09072007 07202007
06292007 $0375 06062007 06082007 05092007
03302007 $030 03072007 03092007 02032007
01022007 $030 12062006 12082006 11182006
09292006 $030 09062006 09082006 07222006
06302006 $030 06072006 06092006 0504200603312006 $026 03082006 03102006 02042006
01032006 $026 12072005 12092005 11192005
09302005 $026 09072005 09092005 07232005
06302005 $026 06082005 06102005 05052005
03312005 $023 03092005 03112005 01282005
PEPSICO INC Income Statement
ViewAnnual Data | Quarterly Data
Period EndingQ3FY09 Q2 FY09 Q1 FY09 Q4 FY08 Q3 FY08
Net SalesRevenues 1108 B 1059 B 826 B 1273 B 1124 B
Cost of Goods Sold (ExcludingDepreciation)
476 B 452 B 344 B 617 B 490 B
Depreciation Depletion andAmortization
42200M
37100 M 31400 M 2100 M 37700 M
Gross Income 590 B 570 B 451 B 654 B 596 B
Selling General amp Admin Expenses 365 B 350 B 290 B 532 B 398 B
Other Operating Expense 157 B 161 B 144 B 152 B 142 B
842019 Pepsi and Coca-cola(RH6802B54)
httpslidepdfcomreaderfullpepsi-and-coca-colarh6802b54 1522
Period EndingQ3FY09 Q2 FY09 Q1 FY09 Q4 FY08 Q3 FY08
Net SalesRevenues 1108 B 1059 B 826 B 1273 B 1124 B
Operating Income 223 B 220 B 161 B 121 B 198 B
Extraordinary Credit - Pretax 9300 M 000 000 000 000
Extraordinary Charge - Pretax 000 20900 M 9100 M 90800 M 17600 M
Pretax Equity in Earnings 000 000 000 000 000
Other IncomeExpenses - Net 1600 M 42400 M 200 M 90800 M 19200 M
Pretax Income 216 B 212 B 149 B 108 B 192 B
Income Taxes 57500M
56800 M 37400 M 29300 M 55000 M
Minority Interest 1600 M 800 M 600 M 000 000
Equity in Earnings 000 000 000 000 000
Discontinued Operations 000 000 000 000 000
Net Income Before ExtraItemsPreferred Div
172 B 166 B 114 B 71900 M 158 B
Extra Items amp Gain (Loss) Sale of Assets
000 000 000 000 000
Net Income Before PreferredDividends
172 B 166 B 114 B 71900 M 158 B
Preferred Dividend Requirements 000 100 M 300 M 000 200 M
Net Income Used to CalculateDiluted EPS
mdash mdash mdash mdash mdash
Net Income Used to Calculate BasicEPS
mdash mdash mdash mdash mdash
Net Income Available to Common 172 B 166 B 114 B 71900 M 157 B
Period Ending FY2008 FY2007 FY2006 FY2005 FY2004
Net SalesRevenues 4325 B 3947 B 3514 B 3256 B 2926 B
Cost of Goods Sold (ExcludingDepreciation)
1878 B 1667 B 1452 B 1302 B 1229 B
Depreciation Depletion andAmortization
154 B 143 B 141 B 131 B 126 B
Gross Income 2292 B 2138 B 1921 B 1824 B 1571 B
Selling General amp AdminExpenses
1545 B 1411 B 1277 B 1231 B 1030 B
Other Operating Expense 000 000 000 000 000
Operating Expenses - Total 157 B 161 B 144 B 152 B 142 B
Operating Income 748 B 727 B 644 B 592 B 541 B
Extraordinary Credit - Pretax 000 000 000 000 000
842019 Pepsi and Coca-cola(RH6802B54)
httpslidepdfcomreaderfullpepsi-and-coca-colarh6802b54 1622
Period EndingQ3FY09 Q2 FY09 Q1 FY09 Q4 FY08 Q3 FY08
Net SalesRevenues 1108 B 1059 B 826 B 1273 B 1124 B
Extraordinary Charge - Pretax 54300
M
10200 M 15000 M 20600 M mdash
Non-operating Interest Income 4100 M 12500 M 17300 M 15900 M 7400 M
Reserves Inc (Dec) 000 000 000 000 000
Pretax Equity in Earnings 000 000 000 000 000
Other IncomeExpenses - Net 000 000 000 000 000
Earnings Before Interest amp Taxes(EBIT)
698 B 730 B 661 B 608 B 533 B
Interest Expenses On Debt 34300M
24500 M 25500 M 26100 M 16900 M
Interest Capitalized 1400 M 2100 M 1600 M 500 M 200 MPretax Income 665 B 707 B 637 B 582 B 517 B
Income Taxes 188 B 197 B 135 B 230 B 137 B
Current Domestic Income Tax 90200M
153 B 83200 M 176 B 110 B
Current Foreign Income Tax 73200M
48900M
56900 M 42600 M 25600 M
Deferred Domestic Income Tax 31400M
2400 M -3800 M 14800 M 1200 M
Deferred Foreign Income Tax -6900M
-6600M
-1600 M -2600 M 500 M
Income Tax Credits mdash mdash mdash mdash mdash
Minority Interest 000 000 000 000 000
Equity in Earnings 37400M
56000 M 61600 M 55700 M 38000 M
After Tax Income Expense 000 000 000 000 000
Discontinued Operations 000 000 000 000 3800 M
Net Income Before ExtraItemsPreferred Div
514 B 566 B 564 B 408 B 421 B
Extra Items amp Gain (Loss) Sale of Assets
000 000 000 000 000
Net Income Before PreferredDividends
514 B 566 B 564 B 408 B 421 B
Preferred Dividend Requirements 1000 M 1200 M 1100 M 1800 M 2500 M
Net Income Available to Common 514 B 566 B 564 B 408 B 421 B
Seasonal Performance Data PEP
Returns Jan Feb Mar Apr May Jun Jul Aug Sep Oct Nov Dec
AvgReturns -289 -033 154 024 252 -224 316 200 373 -293 095 006
Times PEP Stock Price 49 45 56 51 54 46 57 58 58 52 54 50
842019 Pepsi and Coca-cola(RH6802B54)
httpslidepdfcomreaderfullpepsi-and-coca-colarh6802b54 1722
Returns Jan Feb Mar Apr May Jun Jul Aug Sep Oct Nov Dec
Increased
Times PEP Stock PriceUnchanged
0 0 1 0 2 1 1 0 0 0 1 1
Times PEP Stock Price
Decreased52 51 52 52 50 61 47 53 44 59 47 54
2009 -828 -415 694 -333 460 559 326 -013 351 322 276 acirceurordquo
2008 -1015 201 386 -514 -033 -689 467 288 407 -2000 -053 -339
2007 430 -319 065 398 339 -508 119 367 769 063 469 -165
2006 -321 338 -222 078 381 -068 556 300 -002 -278 -231 094
2005 287 030 -153 492 111 -413 111 059 339 427 012 -019
2004 acirceurordquo acirceurordquo acirceurordquo acirceurordquo acirceurordquo acirceurordquo acirceurordquo acirceurordquo acirceurordquo acirceurordquo acirceurordquo 459
PepsiCo (PEP) Dividend Stock Analysis
PepsiCo Inc manufactures markets and sells various snacks carbonated and non-carbonated
beverages and foods worldwidePepsiCo is a major component of the SampP 500 Dow Industrials and
the Dividend Aristocrats Indexes PepsiCo has been consistently increasing its dividends for 36
consecutive years From the end of 1998 up until December 2008 this dividend growth stock has
delivered a 470 annual average total return to its shareholders
At the same time company has managed to deliver a 990 average annual increase in its EPS since
1999
842019 Pepsi and Coca-cola(RH6802B54)
httpslidepdfcomreaderfullpepsi-and-coca-colarh6802b54 1822
The ROE has remained largely between 31 and 38 with the exception of 2004 when it fell to as
low as 22
Annual dividend payments have increased by an average of 1350 annually since 1999 which is
much higher than the growth in EPS Analysts are expecting slight increase in EPS for 2009
compared to 2008 given the sluggish state of North American economies The strong US dollar could
potentially hurt sales as over 44 of PepsiCorsquos revenues are derived internationally
A 1350 growth in dividends translates into the dividend payment doubling almost every five years
Since 1978 PepsiCo has actually managed to double its dividend payment every six years on average
The dividend payout has remained in a range between 31 and 42 In 2008 the dividend payout
ratio has surged to 51 A lower payout is always a plus since it leaves room for consistent dividend
growth minimizing the impact of short-term fluctuations in earnings The slow growth in earnings
could put future dividend increases at risk
842019 Pepsi and Coca-cola(RH6802B54)
httpslidepdfcomreaderfullpepsi-and-coca-colarh6802b54 1922
842019 Pepsi and Coca-cola(RH6802B54)
httpslidepdfcomreaderfullpepsi-and-coca-colarh6802b54 2022
Though carbonated soft drinks remain the most popular beverage PEP recognizes that non-carbonated soft drinks are a faster growing category The company is focusing on the health andwellness trends It has eliminated trans fats from many of its snack foods and is introducing ldquogoodforyourdquo foods under the Quaker Oats brand Risks include the highly competitive and very maturenature of it products also with more exposure to foreign markets political and currency risks alsoincrease
Conclusion PEP did not earn any Stars in the Fair Value section earned two Stars in the DividendAnalytical Data section and earned one Star in the Dividend Income vs MMA section for a total of three Stars This quantitatively ranks PEP as a 3 Star-Hold
Using my D4L-PreScreenxls model I determined the share price could increase to $6562 beforePEPrsquos NPV MMA Differential fell to the $500 that I like to see for a stock with 37 consecutive yearsof dividend increases At that price the stock would yield 270
Resetting the D4L-PreScreenxls model and solving for the dividend growth rate needed to generatethe target $500 NPV MMA Differential the calculated rate is 63 This dividend growth rate is
lower than the the 76 used in this analysis thus providing a margin of safety PEP has a risk rating of 100 which classifies it as a low risk stock
Like its competition Coca-Cola (KO) PEPrsquos Free Cash Flow Payout currently at 70 tends toremain higher than the 60 level that I prefer However this is mitigated to an extent by relativelylow debt levels and predictable cash flows PEP is a stock I will buy as my allocation allows andwhen it dips below its buy price of $5510 For additional information including the stockrsquos dividendhistory please refer to its data page
Stock price of last five years with monthly price list
842019 Pepsi and Coca-cola(RH6802B54)
httpslidepdfcomreaderfullpepsi-and-coca-colarh6802b54 2122
PRICES
Date Open High Low Close Volume Adj Close
4-Dec-09 6318 6400 6308 6385 8907000 6385
3-Dec-09 6358 6359 6267 6276 6406200 6276
2-Dec-09 6350 6374 6317 6365 6195800 6365
2-Dec-09 $ 045 Dividend
1-Dec-09 6268 6393 6249 6387 6887700 6342
30-Nov-09 6264 6283 6215 6222 7252700 6178
27-Nov-09 6224 6255 6175 6230 3416000 6186
25-Nov-09 6253 6327 6249 6319 4672600 6274
24-Nov-09 6262 6265 6213 6250 4139700 6206
23-Nov-09 6246 6299 6226 6249 5009400 6205
20-Nov-09 6167 6231 6143 6208 5314600 6164
19-Nov-09 6210 6210 6135 6188 4390400 6144
18-Nov-09 6244 6251 6181 6230 3952300 6186
17-Nov-09 6242 6263 6203 6260 4362400 6216
16-Nov-09 6221 6249 6194 6243 4966800 6199
13-Nov-09 6163 6213 6135 6194 6411100 6150
12-Nov-09 6249 6275 6110 6127 8474900 6084
11-Nov-09 6234 6268 6208 6260 4714300 6216
10-Nov-09 6217 6294 6193 6208 7094100 6164
9-Nov-09 6181 6232 6143 6228 6921800 6184
6-Nov-09 6099 6176 6079 6176 4831000 6132
5-Nov-09 6044 6141 6042 6123 5578500 6080
4-Nov-09 6016 6096 5979 6038 5552100 5995
3-Nov-09 6029 6039 5962 6006 5797000 5964
2-Nov-09 6079 6107 6016 6060 6618800 601730-Oct-09 6135 6164 6037 6055 7794100 6012
29-Oct-09 6101 6146 6057 6139 5245300 6096
28-Oct-09 6088 6152 6075 6099 6321900 6056
27-Oct-09 6064 6135 6010 6100 7262900 6057
26-Oct-09 6114 6150 6021 6047 5113000 6004
23-Oct-09 6141 6167 6058 6103 6505200 6060
22-Oct-09 6190 6190 6087 6150 5428100 6107
21-Oct-09 6138 6234 6123 6184 7445000 6140
20-Oct-09 6200 6205 6112 6158 8068000 6115
19-Oct-09 6228 6257 6190 6205 5557300 616116-Oct-09 6247 6268 6211 6229 6588400 6185
15-Oct-09 6157 6275 6139 6268 10518600 6224
14-Oct-09 6094 6168 6070 6162 8462200 6119
13-Oct-09 6088 6100 6052 6060 7502000 6017
12-Oct-09 6043 6136 6025 6092 6178100 6049
9-Oct-09 6038 6070 5981 6059 6360200 6016
8-Oct-09 6124 6124 5980 6039 17263400 5996
7-Oct-09 6085 6138 6045 6117 6441900 6074
6-Oct-09 6105 6127 6042 6087 8128900 6044
5-Oct-09 6083 6124 6014 6085 7892000 60422-Oct-09 5912 6124 5893 6090 17530200 6047
1-Oct-09 5870 5899 5827 5846 9010200 5805
30-Sep-09 5874 5886 5801 5866 8898400 5825
29-Sep-09 5910 5931 5800 5851 7086400 5810
28-Sep-09 5895 5949 5862 5903 4085900 5861
25-Sep-09 5850 5913 5832 5868 6758800 5827
842019 Pepsi and Coca-cola(RH6802B54)
httpslidepdfcomreaderfullpepsi-and-coca-colarh6802b54 2222
References
1 httpwwwcoca-colacomindexjsp2 httpfinanceaolcomquotesthe-coca-cola-companykonys
3 httpfinanceaolcomeventthe-pepsi-bottling-group-incpbgnys
4 httpfinanceyahoocomqs=ko
5 httpwwwdividendgrowthinvestorcom200906coca-cola-ko-dividend-
stock-analysishtml
6 httpfinanceyahoocomqs=ko
7 httpmoneycentralmsncomdetailstock_quoteSymbol=Ko
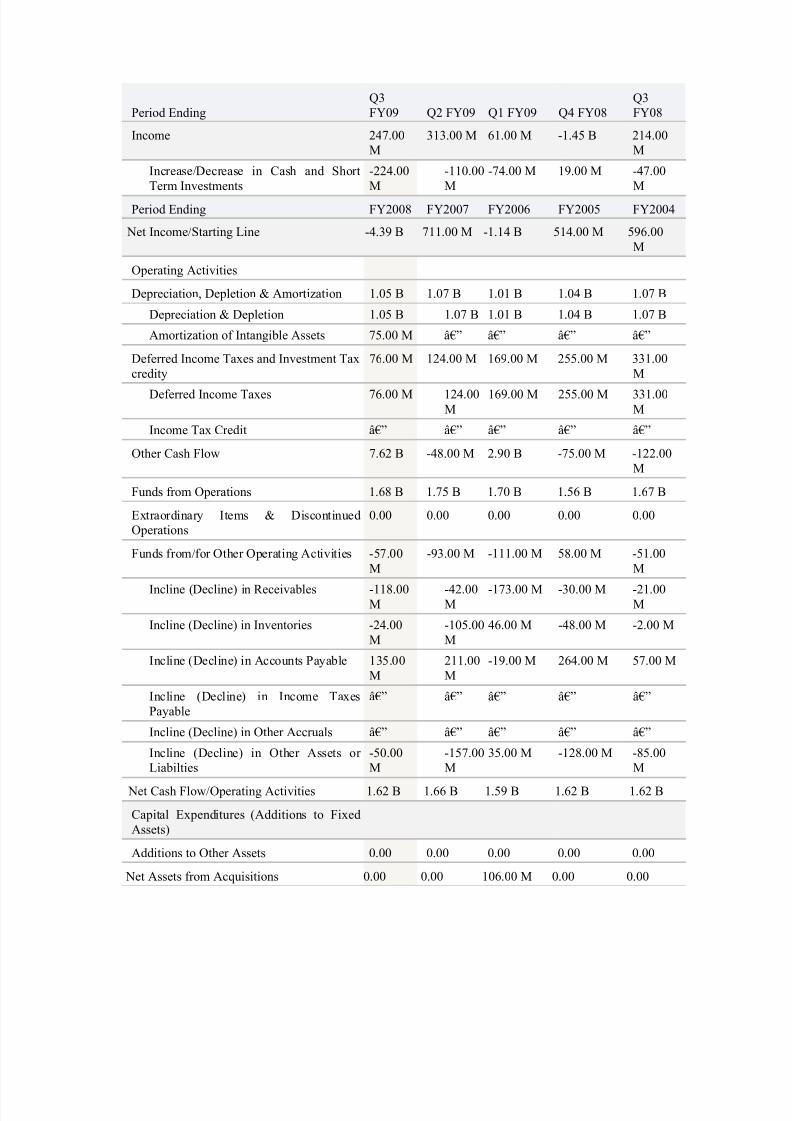
842019 Pepsi and Coca-cola(RH6802B54)
httpslidepdfcomreaderfullpepsi-and-coca-colarh6802b54 422
Period EndingQ3FY09 Q2 FY09 Q1 FY09 Q4 FY08
Q3FY08
Income 24700M
31300 M 6100 M -145 B 21400M
IncreaseDecrease in Cash and ShortTerm Investments -22400M -11000M -7400 M 1900 M -4700M
Period Ending FY2008 FY2007 FY2006 FY2005 FY2004
Net IncomeStarting Line -439 B 71100 M -114 B 51400 M 59600M
Operating Activities
Depreciation Depletion amp Amortization 105 B 107 B 101 B 104 B 107 B
Depreciation amp Depletion 105 B 107 B 101 B 104 B 107 B
Amortization of Intangible Assets 7500 M acirceurordquo acirceurordquo acirceurordquo acirceurordquo
Deferred Income Taxes and Investment Taxcredity
7600 M 12400 M 16900 M 25500 M 33100M
Deferred Income Taxes 7600 M 12400M
16900 M 25500 M 33100M
Income Tax Credit acirceurordquo acirceurordquo acirceurordquo acirceurordquo acirceurordquo
Other Cash Flow 762 B -4800 M 290 B -7500 M -12200M
Funds from Operations 168 B 175 B 170 B 156 B 167 B
Extraordinary Items amp DiscontinuedOperations
000 000 000 000 000
Funds fromfor Other Operating Activities -5700M
-9300 M -11100 M 5800 M -5100M
Incline (Decline) in Receivables -11800M
-4200M
-17300 M -3000 M -2100M
Incline (Decline) in Inventories -2400M
-10500M
4600 M -4800 M -200 M
Incline (Decline) in Accounts Payable 13500M
21100M
-1900 M 26400 M 5700 M
Incline (Decline) in Income TaxesPayable
acirceurordquo acirceurordquo acirceurordquo acirceurordquo acirceurordquo
Incline (Decline) in Other Accruals acirceurordquo acirceurordquo acirceurordquo acirceurordquo acirceurordquo
Incline (Decline) in Other Assets or Liabilties
-5000M
-15700M
3500 M -12800 M -8500M
Net Cash FlowOperating Activities 162 B 166 B 159 B 162 B 162 B
Capital Expenditures (Additions to FixedAssets)
Additions to Other Assets 000 000 000 000 000
Net Assets from Acquisitions 000 000 10600 M 000 000
842019 Pepsi and Coca-cola(RH6802B54)
httpslidepdfcomreaderfullpepsi-and-coca-colarh6802b54 522
Period EndingQ3FY09 Q2 FY09 Q1 FY09 Q4 FY08
Q3FY08
Income 24700M
31300 M 6100 M -145 B 21400M
Incline (Decline) in Inventories 000 000 000 000 000
Decrease in Investments 000 000 000 000 000
Disposal of Fixed Assets 1800 M 6800 M 5000 M 4800 M 2400 M
Other Uses - Investing 1200 M 400 M 1400 M 000 000
Other Sources - Investing 000 000 000 000 000
Net Cash Flow - Investing 97500M
87400 M 95200 M 85400 M 92200M
Proceeds from Stock Options 1800 M 12300M
7300 M 4000 M 18100M
Other Proceeds from SaleIssues of Stock
000 000 000 000 000
ComPfd Purchase Retired ConvertedRedeemed
000 000 000 000 000
Financing Activities
Long Term Borrowings 161 B 202 B 108 B 154 B 55800M
Incline or Decline in Short TermBorrowings
000 000 000 000 000
Reduction in Long Term Debt 162 B 283 B 162 B 236 B 130 B
Cash Dividends Paid Total 13800M
11600 M 11400 M 7600 M 7600 M
Common Dividends (Cash) 13800M
11600 M 11400 M 7600 M 7600 M
Preferred Dividends (Cash) 000 000 000 000 000
Other Sources - Financing 300 M 1100 M 400 M 4600 M 000
Other Uses - Financing 300 M 1100 M 400 M 4600 M 000
Net Cash Flow - Financing -12600M
-79900 M -57100 M -80400 M -63200M
Effect of Exchange rate on Cash -1800M
400 M 1000 M -900 M 1400 M
COCA COLA ENTERPRISES INC Average Monthly Returns
842019 Pepsi and Coca-cola(RH6802B54)
httpslidepdfcomreaderfullpepsi-and-coca-colarh6802b54 622
Some investors consider seasonal performance when purchasing or selling stocks This chartillustrates the average monthly return for the past 5 years Users often also consider the number of times a stock increases or decreases for any given month Mouse-over the chart to view 5 years of history for each monthSeasonal Performance Data CCE
Returns Jan Feb Mar Apr May Jun Jul Aug Sep Oct Nov DecAvg
Returns
-185 057 290 512 041 -143 345 251 -269 -1030 -020 623
Times CCEStock PriceIncreased
48 47 57 51 59 45 53 53 48 53 52 48
Times CCEStock PriceUnchanged
1 1 2 1 2 5 3 2 2 3 2 2
Times CCEStock PriceDecreased
52 48 50 51 45 58 49 56 52 55 48 55
2009 -664 223 1490 2934 -233 -005 1285 756 594 -1092 304 mdash
2008 -1136
590 -087 -707 -1048 -1409 -213 083 -175 -4006 -865 3105
2007 049 -213
085 835 643 278 -557 512 168 656 062 023
2006 297 -045
351 -397 067 361 535 391 -658 -383 210 -014
2005 528 -272
-388 -106 778 059 677 -488 -1274 -327 191 -025
2004 mdash mdash mdash mdash mdash mdash mdash mdash mdash mdash mdash 024
PRICES
842019 Pepsi and Coca-cola(RH6802B54)
httpslidepdfcomreaderfullpepsi-and-coca-colarh6802b54 722
Date Open High Low Close Volume Adj Close
4-Dec-09 2018 2018 1974 1991 3430200 1991
3-Dec-09 1995 2010 1984 1986 3473100 1986
2-Dec-09 1978 2002 1972 1997 3016300 1997
1-Dec-09 1978 1995 1973 1975 3605800 1975
30-Nov-09 1991 1998 1959 1965 5927600 1965
27-Nov-09 1998 2000 1972 1993 1291400 1993
25-Nov-09 2032 2044 2018 2037 2238500 2037
24-Nov-09 2040 2060 2012 2030 3577400 2030
24-Nov-09 $ 008 Dividend
23-Nov-09 2057 2074 2050 2060 2314400 2052
20-Nov-09 2017 2049 2012 2042 2779000 2034
19-Nov-09 2051 2060 2015 2023 3153300 2015
18-Nov-09 2067 2075 2046 2062 3366800 2054
17-Nov-09 2054 2079 2050 2073 2504800 2065
16-Nov-09 2027 2067 2023 2064 4489000 2056
13-Nov-09 2018 2037 2000 2023 3474500 2015
12-Nov-09 2029 2047 2011 2014 3220500 2006
11-Nov-09 2009 2029 1997 2027 3458000 2019
10-Nov-09 1979 2009 1962 2003 3429000 1995
9-Nov-09 1984 2012 1977 2010 2973900 2002
6-Nov-09 1960 1973 1949 1972 3231500 1964
5-Nov-09 1911 1987 1911 1972 7675000 19644-Nov-09 1904 1936 1893 1911 5034900 1904
3-Nov-09 1888 1900 1885 1899 5151700 1892
2-Nov-09 1912 1923 1875 1894 6168400 1887
30-Oct-09 1942 1948 1897 1907 7210100 1900
29-Oct-09 1910 1978 1908 1960 10382400 1952
28-Oct-09 2014 2030 1894 1902 8666100 1895
27-Oct-09 1984 2021 1974 2002 5150600 1994
26-Oct-09 1994 2034 1987 1994 4289800 1986
23-Oct-09 2065 2065 1990 1998 3740500 199022-Oct-09 2062 2065 2017 2055 2659200 2047
21-Oct-09 2055 2089 2045 2054 3005800 2046
20-Oct-09 2108 2111 2045 2054 3148900 2046
19-Oct-09 2095 2125 2086 2113 3800700 2105
16-Oct-09 2104 2105 2083 2094 2535100 2086
15-Oct-09 2094 2113 2089 2111 2577300 2103
14-Oct-09 2100 2111 2074 2105 3047400 2097
13-Oct-09 2089 2101 2054 2092 3717700 2084
12-Oct-09 2091 2119 2084 2091 2202700 20839-Oct-09 2079 2098 2074 2094 2096000 2086
842019 Pepsi and Coca-cola(RH6802B54)
httpslidepdfcomreaderfullpepsi-and-coca-colarh6802b54 822
8-Oct-09 2098 2106 2072 2085 2825100 2077
7-Oct-09 2097 2100 2071 2093 2529600 2085
6-Oct-09 2100 2111 2076 2095 3373300 2087
5-Oct-09 2056 2096 2039 2096 3507200 2088
2-Oct-09 2027 2064 2007 2058 3896300 2050
1-Oct-09 2122 2123 2053 2056 5159100 2048
30-Sep-09 2098 2144 2072 2141 4954800 2133
29-Sep-09 2107 2115 2093 2103 2439000 2095
28-Sep-09 2092 2116 2083 2102 2258400 2094
25-Sep-09 2100 2113 2086 2090 1981800 2082
24-Sep-09 2114 2125 2085 2101 2772600 2093
23-Sep-09 2102 2142 2102 2111 4214200 2103
22-Sep-09 2103 2108 2079 2094 2747900 2086
21-Sep-09 2110 2115 2087 2097 4250300 2089
18-Sep-09 2112 2117 2085 2115 4861500 2107
17-Sep-09 2114 2114 2076 2099 4785000 2091
16-Sep-09 2090 2090 2031 2076 3932100 2068
15-Sep-09 2071 2089 2053 2087 3186700 2079
14-Sep-09 2033 2076 2018 2075 3813400 2067
11-Sep-09 2043 2052 2022 2045 2822800 2037
10-Sep-09 2012 2038 2000 2037 5223600 2029
9-Sep-09 2049 2049 1983 2010 5783700 2002
9-Sep-09 $ 008 Dividend8-Sep-09 2038 2051 2029 2050 4232400 2034
4-Sep-09 2026 2047 2015 2032 2756800 2016
3-Sep-09 2015 2032 1992 2030 2937400 2014
2-Sep-09 1987 2014 1975 2004 4132300 1988
Coca-Cola Dividend Stock Analysis
Coca-Cola has paid uninterrupted dividends on its common stock since 1893 and increased paymentsto common shareholders every year for 47 yearsFrom the end of 1998 up until December 2008 this dividend growth stock has delivered a negativeannual average total return of 210 to its shareholders The stock has largely traded between $65 and$40 over the past decade
842019 Pepsi and Coca-cola(RH6802B54)
httpslidepdfcomreaderfullpepsi-and-coca-colarh6802b54 922
The company has managed to deliver a 1090 average annual increase in its EPS between 1999 and2008 Analysts are expecting an increase in EPS to $305-$310 for 2009 and $325-$330 by 2010This would be a nice increase from the 2008 earnings per share of $249 Future drivers for earningscould be the companyrsquos tea coffee and water operations Cost savings initiatives could also add to the
bottom line over time
Some analysts believe that Coca Cola could follow arch rival Pepsi Corsquos (PEP) moves to acquire itsown bottlers in an effort to gain more control over the production and distribution of its beverages inkey markets Coke holds a 35 interest in its largest manufacturer and distributor of Coca Cola
products Coca-Cola Enterprises In (CCE) Coca-Cola Enterprises Inc accounts for about 40 of Cokersquos concentrate sales and 16 of the companyrsquos worldwide volume which makes it a likely targetof acquisition should Coca Cola decide to follow Pepsi Corsquos strategy of buying back its bottlingoperations
The Return on Equity has been in a decline after hitting a high in 2001 Rather than focus on absolute
842019 Pepsi and Coca-cola(RH6802B54)
httpslidepdfcomreaderfullpepsi-and-coca-colarh6802b54 1022
values for this indicator I generally want to see at least a stable return on equity over time
Annual dividends have increased by an average of 1010 annually since 1999 which is slightlylower than the growth in EPS The company last raised its dividend by 8 in February 2009 for the47th year in a row
A 10 growth in dividends translates into the dividend payment doubling every seven years If welook at historical data going as far back as 1969 The Coca Cola Company has indeed managed todouble its dividend payment every seven years on average
The dividend payout ratio remained above 50 for the majority of the past decade A lower payout isalways a plus since it leaves room for consistent dividend growth minimizing the impact of short-
842019 Pepsi and Coca-cola(RH6802B54)
httpslidepdfcomreaderfullpepsi-and-coca-colarh6802b54 1122
term fluctuations in earnings
Currently Coca Cola is trading at 20 times earnings and yields 330 In comparison arch rival in thecola wars Pepsi Co trades at a PE multiple of 165 and yields 340 Check my analysis of Pepsi Co
I believe that The Coca Cola Company is not as attractively valued at the moment as Pepsi Co Iwould consider adding to my position there if it can cover its dividends at least two times by itsearnings by the end of the year and if the PE ratio doesnrsquot increase above 20COCA COLA ENTERPRISES INC Dividends amp Splits
5 Year Dividend History
Payable AmountShare Ex-Date Record Declaration
12102009 $008 11242009 11272009 10282009
09242009 $008 09092009 09112009 07302009
06252009 $007 06102009 06122009 04222009
03262009 $007 03112009 03132009 02112009
12112008 $007 11252008 11282008 10232008
09252008 $007 09102008 09122008 07232008
06262008 $007 06112008 06132008 04232008
03272008 $007 03122008 03142008 02152008
12132007 $006 11282007 11302007 10252007
09272007 $006 09122007 09142007 07242007
06282007 $006 06132007 06152007 04252007
03292007 $006 03142007 03162007 02102007
12142006 $006 11292006 12012006 10262006
09282006 $006 09132006 09152006 07262006
06292006 $006 06142006 06162006 04262006
03302006 $006 03152006 03172006 02182006
12152005 $004 11302005 12022005 10262005
10032005 $004 09152005 09192005 07272005
07012005 $004 06152005 06172005 04272005
842019 Pepsi and Coca-cola(RH6802B54)
httpslidepdfcomreaderfullpepsi-and-coca-colarh6802b54 1222
Payable AmountShare Ex-Date Record Declaration
04012005 $004 03162005 03182005 02162005
Dividend Analysis
Looking at the last 5 years of dividends I have calculated an average highdividend yield of 197 However that seems a tad low considering that each of
the last 2 years is significantly higher than that amount If I average out just the
last 4 years of high dividend yields I come up with 273 Still lower than the
average high yield of the last 2 years
And now the dividend payout ratio Ah ha This explains how they were able to
increase dividends at 10 even when the fundamentals have not been growing
as quickly Look at the increase in the payout ratio It has grown from a low of
3415 in 1997 to a high of 5714 in 2006 It has just been a steady climb up
for the last 10 years
Using the 273 as an average high dividend yield I calculate a price of $4982
to be able to collect this average high dividend yield At close of Friday the
current price was $5280 That means a premium of 599 over the price I am
willing to pay
Conclusion
Well my analysis shows that Coca-Cola fundamentals have not been keeping up
with their very healthy dividend growth This has caused Coca-Cola to have to
payout more and more of its earnings to shareholders This concerns me
because eventually they will not be able to raise their dividend at these high
rates because their dividend payout ratio will be too high
I am sure that Warren Buffett is earning a healthy dividend on his KO stocks but
personally I would pass on this one today There are stocks out there that
continue to grow their fundamentals which will in turn allow them to grow their
dividends
bull COCA COLA ENTERPRISES INC Top Competitors
Symbol Company Name Last
Change
Change
Volume News
Charts
CCE COCA COLA ENTERPRISES INC 1986 -011 -055 347 M
PBG PEPSI BOTTLING GROUP INC 3819 -028 -073 310 M
PEP PEPSICO INC 6276 -089 -140 640 M
Pepsi
842019 Pepsi and Coca-cola(RH6802B54)
httpslidepdfcomreaderfullpepsi-and-coca-colarh6802b54 1322
Pepsi
Type Cola
Manufacturer PepsiCo
Country of origin United States
Introduced1898 (as Brads Drink)June 16 1903 (as Pepsi-Cola)
1961 (as Pepsi)
Related products
Coca-ColaFantaDr Pepper Sprite (soft drink)Irn BruCola TurkaBig Cola
History
Pepsi is a carbonated soft drink produced and manufactured by PepsiCo It is sold in many placessuch as retail stores restaurants schools cinemas and from vending machines The drink was firstmade in the 1890s by pharmacist Caleb Bradham in New Bern North Carolina The brand wastrademarked on June 16 1903 There have been many Pepsi variants produced over the years since1898
In October 2008 Pepsi announced that it would be redesigning its logo and re-branding many of its products by early 2009 In 2009 Pepsi Diet Pepsi and Pepsi Max began using all lower-case fonts for name brands and Diet Pepsi Max was re-branded as Pepsi Max The brands blue and red globetrademark became a series of smiles with the central white band arcing at different angles
depending on the product Pepsi in countries such as the US Canada Brazil Bolivia Guatemala Nicaragua Honduras El Salvador Colombia Argentina Puerto Rico and Australia is carrying thesmile logo while the rest of the countries continue to use the old design on all packagingIn mid-September 2009the new logo has started to appear on 300 and 600ml bottles of Pepsi inAustralia Pepsi Max bottles still carry the current logo as of 27th September
Large Block Holder Type Number
Institutions 1764 Total Number of Shares Held156 B of Shares Owned by all Large Block Holders10000
Mutual Fund 2759
Other Major 25
Total Number of LargeBlock Holders 4548
842019 Pepsi and Coca-cola(RH6802B54)
httpslidepdfcomreaderfullpepsi-and-coca-colarh6802b54 1422
PEPSICO INC Dividends amp Splits
Upcoming Dividends
Payable AmountShare Ex-Date Record Declaration Set Alert
010410 $045 120209 120409 1113095 Year Dividend History
Payable AmountShare Ex-Date Record Declaration
01042010 $045 12022009 12042009 11162009
09302009 $045 09022009 09042009 08132009
06302009 $045 06032009 06052009 05062009
03312009 $0425 03042009 03062009 02072009
01022009 $0425 12032008 12052008 11172008
09302008 $0425 09032008 09052008 07192008
06302008 $0425 06042008 06062008 05082008
03312008 $0375 03052008 03072008 02022008
01022008 $0375 12052007 12072007 11172007
09282007 $0375 09052007 09072007 07202007
06292007 $0375 06062007 06082007 05092007
03302007 $030 03072007 03092007 02032007
01022007 $030 12062006 12082006 11182006
09292006 $030 09062006 09082006 07222006
06302006 $030 06072006 06092006 0504200603312006 $026 03082006 03102006 02042006
01032006 $026 12072005 12092005 11192005
09302005 $026 09072005 09092005 07232005
06302005 $026 06082005 06102005 05052005
03312005 $023 03092005 03112005 01282005
PEPSICO INC Income Statement
ViewAnnual Data | Quarterly Data
Period EndingQ3FY09 Q2 FY09 Q1 FY09 Q4 FY08 Q3 FY08
Net SalesRevenues 1108 B 1059 B 826 B 1273 B 1124 B
Cost of Goods Sold (ExcludingDepreciation)
476 B 452 B 344 B 617 B 490 B
Depreciation Depletion andAmortization
42200M
37100 M 31400 M 2100 M 37700 M
Gross Income 590 B 570 B 451 B 654 B 596 B
Selling General amp Admin Expenses 365 B 350 B 290 B 532 B 398 B
Other Operating Expense 157 B 161 B 144 B 152 B 142 B
842019 Pepsi and Coca-cola(RH6802B54)
httpslidepdfcomreaderfullpepsi-and-coca-colarh6802b54 1522
Period EndingQ3FY09 Q2 FY09 Q1 FY09 Q4 FY08 Q3 FY08
Net SalesRevenues 1108 B 1059 B 826 B 1273 B 1124 B
Operating Income 223 B 220 B 161 B 121 B 198 B
Extraordinary Credit - Pretax 9300 M 000 000 000 000
Extraordinary Charge - Pretax 000 20900 M 9100 M 90800 M 17600 M
Pretax Equity in Earnings 000 000 000 000 000
Other IncomeExpenses - Net 1600 M 42400 M 200 M 90800 M 19200 M
Pretax Income 216 B 212 B 149 B 108 B 192 B
Income Taxes 57500M
56800 M 37400 M 29300 M 55000 M
Minority Interest 1600 M 800 M 600 M 000 000
Equity in Earnings 000 000 000 000 000
Discontinued Operations 000 000 000 000 000
Net Income Before ExtraItemsPreferred Div
172 B 166 B 114 B 71900 M 158 B
Extra Items amp Gain (Loss) Sale of Assets
000 000 000 000 000
Net Income Before PreferredDividends
172 B 166 B 114 B 71900 M 158 B
Preferred Dividend Requirements 000 100 M 300 M 000 200 M
Net Income Used to CalculateDiluted EPS
mdash mdash mdash mdash mdash
Net Income Used to Calculate BasicEPS
mdash mdash mdash mdash mdash
Net Income Available to Common 172 B 166 B 114 B 71900 M 157 B
Period Ending FY2008 FY2007 FY2006 FY2005 FY2004
Net SalesRevenues 4325 B 3947 B 3514 B 3256 B 2926 B
Cost of Goods Sold (ExcludingDepreciation)
1878 B 1667 B 1452 B 1302 B 1229 B
Depreciation Depletion andAmortization
154 B 143 B 141 B 131 B 126 B
Gross Income 2292 B 2138 B 1921 B 1824 B 1571 B
Selling General amp AdminExpenses
1545 B 1411 B 1277 B 1231 B 1030 B
Other Operating Expense 000 000 000 000 000
Operating Expenses - Total 157 B 161 B 144 B 152 B 142 B
Operating Income 748 B 727 B 644 B 592 B 541 B
Extraordinary Credit - Pretax 000 000 000 000 000
842019 Pepsi and Coca-cola(RH6802B54)
httpslidepdfcomreaderfullpepsi-and-coca-colarh6802b54 1622
Period EndingQ3FY09 Q2 FY09 Q1 FY09 Q4 FY08 Q3 FY08
Net SalesRevenues 1108 B 1059 B 826 B 1273 B 1124 B
Extraordinary Charge - Pretax 54300
M
10200 M 15000 M 20600 M mdash
Non-operating Interest Income 4100 M 12500 M 17300 M 15900 M 7400 M
Reserves Inc (Dec) 000 000 000 000 000
Pretax Equity in Earnings 000 000 000 000 000
Other IncomeExpenses - Net 000 000 000 000 000
Earnings Before Interest amp Taxes(EBIT)
698 B 730 B 661 B 608 B 533 B
Interest Expenses On Debt 34300M
24500 M 25500 M 26100 M 16900 M
Interest Capitalized 1400 M 2100 M 1600 M 500 M 200 MPretax Income 665 B 707 B 637 B 582 B 517 B
Income Taxes 188 B 197 B 135 B 230 B 137 B
Current Domestic Income Tax 90200M
153 B 83200 M 176 B 110 B
Current Foreign Income Tax 73200M
48900M
56900 M 42600 M 25600 M
Deferred Domestic Income Tax 31400M
2400 M -3800 M 14800 M 1200 M
Deferred Foreign Income Tax -6900M
-6600M
-1600 M -2600 M 500 M
Income Tax Credits mdash mdash mdash mdash mdash
Minority Interest 000 000 000 000 000
Equity in Earnings 37400M
56000 M 61600 M 55700 M 38000 M
After Tax Income Expense 000 000 000 000 000
Discontinued Operations 000 000 000 000 3800 M
Net Income Before ExtraItemsPreferred Div
514 B 566 B 564 B 408 B 421 B
Extra Items amp Gain (Loss) Sale of Assets
000 000 000 000 000
Net Income Before PreferredDividends
514 B 566 B 564 B 408 B 421 B
Preferred Dividend Requirements 1000 M 1200 M 1100 M 1800 M 2500 M
Net Income Available to Common 514 B 566 B 564 B 408 B 421 B
Seasonal Performance Data PEP
Returns Jan Feb Mar Apr May Jun Jul Aug Sep Oct Nov Dec
AvgReturns -289 -033 154 024 252 -224 316 200 373 -293 095 006
Times PEP Stock Price 49 45 56 51 54 46 57 58 58 52 54 50
842019 Pepsi and Coca-cola(RH6802B54)
httpslidepdfcomreaderfullpepsi-and-coca-colarh6802b54 1722
Returns Jan Feb Mar Apr May Jun Jul Aug Sep Oct Nov Dec
Increased
Times PEP Stock PriceUnchanged
0 0 1 0 2 1 1 0 0 0 1 1
Times PEP Stock Price
Decreased52 51 52 52 50 61 47 53 44 59 47 54
2009 -828 -415 694 -333 460 559 326 -013 351 322 276 acirceurordquo
2008 -1015 201 386 -514 -033 -689 467 288 407 -2000 -053 -339
2007 430 -319 065 398 339 -508 119 367 769 063 469 -165
2006 -321 338 -222 078 381 -068 556 300 -002 -278 -231 094
2005 287 030 -153 492 111 -413 111 059 339 427 012 -019
2004 acirceurordquo acirceurordquo acirceurordquo acirceurordquo acirceurordquo acirceurordquo acirceurordquo acirceurordquo acirceurordquo acirceurordquo acirceurordquo 459
PepsiCo (PEP) Dividend Stock Analysis
PepsiCo Inc manufactures markets and sells various snacks carbonated and non-carbonated
beverages and foods worldwidePepsiCo is a major component of the SampP 500 Dow Industrials and
the Dividend Aristocrats Indexes PepsiCo has been consistently increasing its dividends for 36
consecutive years From the end of 1998 up until December 2008 this dividend growth stock has
delivered a 470 annual average total return to its shareholders
At the same time company has managed to deliver a 990 average annual increase in its EPS since
1999
842019 Pepsi and Coca-cola(RH6802B54)
httpslidepdfcomreaderfullpepsi-and-coca-colarh6802b54 1822
The ROE has remained largely between 31 and 38 with the exception of 2004 when it fell to as
low as 22
Annual dividend payments have increased by an average of 1350 annually since 1999 which is
much higher than the growth in EPS Analysts are expecting slight increase in EPS for 2009
compared to 2008 given the sluggish state of North American economies The strong US dollar could
potentially hurt sales as over 44 of PepsiCorsquos revenues are derived internationally
A 1350 growth in dividends translates into the dividend payment doubling almost every five years
Since 1978 PepsiCo has actually managed to double its dividend payment every six years on average
The dividend payout has remained in a range between 31 and 42 In 2008 the dividend payout
ratio has surged to 51 A lower payout is always a plus since it leaves room for consistent dividend
growth minimizing the impact of short-term fluctuations in earnings The slow growth in earnings
could put future dividend increases at risk
842019 Pepsi and Coca-cola(RH6802B54)
httpslidepdfcomreaderfullpepsi-and-coca-colarh6802b54 1922
842019 Pepsi and Coca-cola(RH6802B54)
httpslidepdfcomreaderfullpepsi-and-coca-colarh6802b54 2022
Though carbonated soft drinks remain the most popular beverage PEP recognizes that non-carbonated soft drinks are a faster growing category The company is focusing on the health andwellness trends It has eliminated trans fats from many of its snack foods and is introducing ldquogoodforyourdquo foods under the Quaker Oats brand Risks include the highly competitive and very maturenature of it products also with more exposure to foreign markets political and currency risks alsoincrease
Conclusion PEP did not earn any Stars in the Fair Value section earned two Stars in the DividendAnalytical Data section and earned one Star in the Dividend Income vs MMA section for a total of three Stars This quantitatively ranks PEP as a 3 Star-Hold
Using my D4L-PreScreenxls model I determined the share price could increase to $6562 beforePEPrsquos NPV MMA Differential fell to the $500 that I like to see for a stock with 37 consecutive yearsof dividend increases At that price the stock would yield 270
Resetting the D4L-PreScreenxls model and solving for the dividend growth rate needed to generatethe target $500 NPV MMA Differential the calculated rate is 63 This dividend growth rate is
lower than the the 76 used in this analysis thus providing a margin of safety PEP has a risk rating of 100 which classifies it as a low risk stock
Like its competition Coca-Cola (KO) PEPrsquos Free Cash Flow Payout currently at 70 tends toremain higher than the 60 level that I prefer However this is mitigated to an extent by relativelylow debt levels and predictable cash flows PEP is a stock I will buy as my allocation allows andwhen it dips below its buy price of $5510 For additional information including the stockrsquos dividendhistory please refer to its data page
Stock price of last five years with monthly price list
842019 Pepsi and Coca-cola(RH6802B54)
httpslidepdfcomreaderfullpepsi-and-coca-colarh6802b54 2122
PRICES
Date Open High Low Close Volume Adj Close
4-Dec-09 6318 6400 6308 6385 8907000 6385
3-Dec-09 6358 6359 6267 6276 6406200 6276
2-Dec-09 6350 6374 6317 6365 6195800 6365
2-Dec-09 $ 045 Dividend
1-Dec-09 6268 6393 6249 6387 6887700 6342
30-Nov-09 6264 6283 6215 6222 7252700 6178
27-Nov-09 6224 6255 6175 6230 3416000 6186
25-Nov-09 6253 6327 6249 6319 4672600 6274
24-Nov-09 6262 6265 6213 6250 4139700 6206
23-Nov-09 6246 6299 6226 6249 5009400 6205
20-Nov-09 6167 6231 6143 6208 5314600 6164
19-Nov-09 6210 6210 6135 6188 4390400 6144
18-Nov-09 6244 6251 6181 6230 3952300 6186
17-Nov-09 6242 6263 6203 6260 4362400 6216
16-Nov-09 6221 6249 6194 6243 4966800 6199
13-Nov-09 6163 6213 6135 6194 6411100 6150
12-Nov-09 6249 6275 6110 6127 8474900 6084
11-Nov-09 6234 6268 6208 6260 4714300 6216
10-Nov-09 6217 6294 6193 6208 7094100 6164
9-Nov-09 6181 6232 6143 6228 6921800 6184
6-Nov-09 6099 6176 6079 6176 4831000 6132
5-Nov-09 6044 6141 6042 6123 5578500 6080
4-Nov-09 6016 6096 5979 6038 5552100 5995
3-Nov-09 6029 6039 5962 6006 5797000 5964
2-Nov-09 6079 6107 6016 6060 6618800 601730-Oct-09 6135 6164 6037 6055 7794100 6012
29-Oct-09 6101 6146 6057 6139 5245300 6096
28-Oct-09 6088 6152 6075 6099 6321900 6056
27-Oct-09 6064 6135 6010 6100 7262900 6057
26-Oct-09 6114 6150 6021 6047 5113000 6004
23-Oct-09 6141 6167 6058 6103 6505200 6060
22-Oct-09 6190 6190 6087 6150 5428100 6107
21-Oct-09 6138 6234 6123 6184 7445000 6140
20-Oct-09 6200 6205 6112 6158 8068000 6115
19-Oct-09 6228 6257 6190 6205 5557300 616116-Oct-09 6247 6268 6211 6229 6588400 6185
15-Oct-09 6157 6275 6139 6268 10518600 6224
14-Oct-09 6094 6168 6070 6162 8462200 6119
13-Oct-09 6088 6100 6052 6060 7502000 6017
12-Oct-09 6043 6136 6025 6092 6178100 6049
9-Oct-09 6038 6070 5981 6059 6360200 6016
8-Oct-09 6124 6124 5980 6039 17263400 5996
7-Oct-09 6085 6138 6045 6117 6441900 6074
6-Oct-09 6105 6127 6042 6087 8128900 6044
5-Oct-09 6083 6124 6014 6085 7892000 60422-Oct-09 5912 6124 5893 6090 17530200 6047
1-Oct-09 5870 5899 5827 5846 9010200 5805
30-Sep-09 5874 5886 5801 5866 8898400 5825
29-Sep-09 5910 5931 5800 5851 7086400 5810
28-Sep-09 5895 5949 5862 5903 4085900 5861
25-Sep-09 5850 5913 5832 5868 6758800 5827
842019 Pepsi and Coca-cola(RH6802B54)
httpslidepdfcomreaderfullpepsi-and-coca-colarh6802b54 2222
References
1 httpwwwcoca-colacomindexjsp2 httpfinanceaolcomquotesthe-coca-cola-companykonys
3 httpfinanceaolcomeventthe-pepsi-bottling-group-incpbgnys
4 httpfinanceyahoocomqs=ko
5 httpwwwdividendgrowthinvestorcom200906coca-cola-ko-dividend-
stock-analysishtml
6 httpfinanceyahoocomqs=ko
7 httpmoneycentralmsncomdetailstock_quoteSymbol=Ko
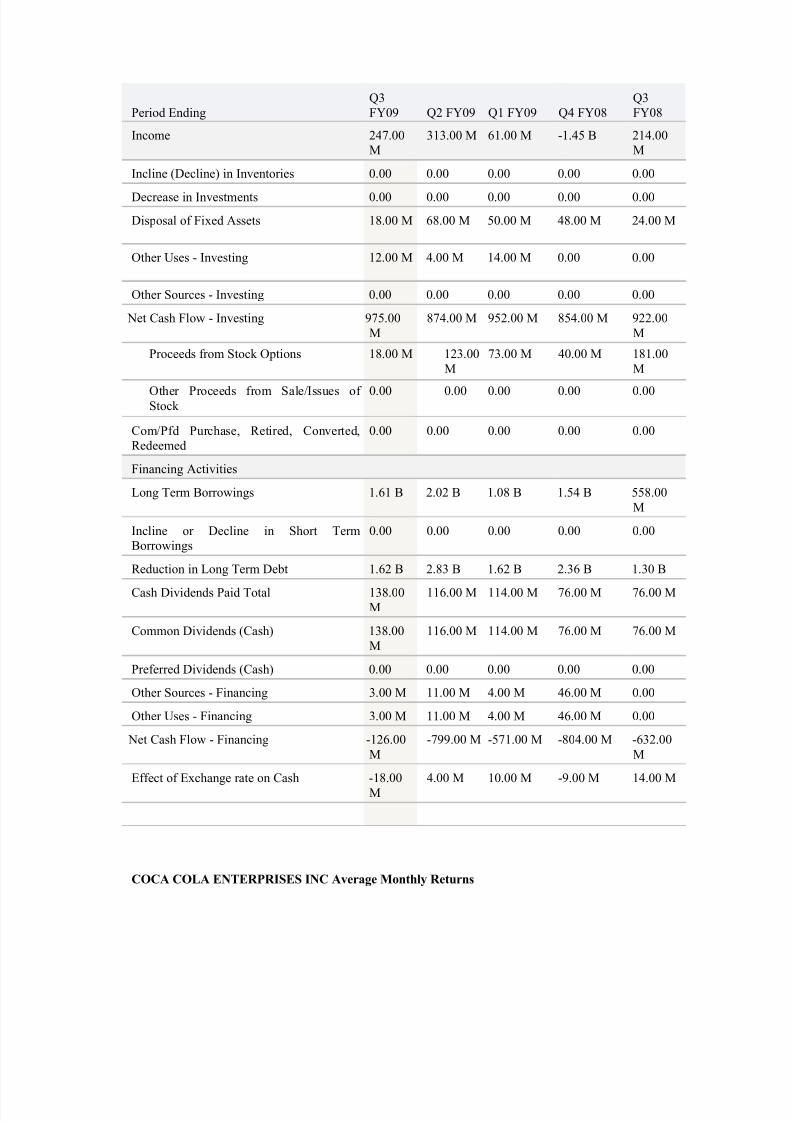
842019 Pepsi and Coca-cola(RH6802B54)
httpslidepdfcomreaderfullpepsi-and-coca-colarh6802b54 522
Period EndingQ3FY09 Q2 FY09 Q1 FY09 Q4 FY08
Q3FY08
Income 24700M
31300 M 6100 M -145 B 21400M
Incline (Decline) in Inventories 000 000 000 000 000
Decrease in Investments 000 000 000 000 000
Disposal of Fixed Assets 1800 M 6800 M 5000 M 4800 M 2400 M
Other Uses - Investing 1200 M 400 M 1400 M 000 000
Other Sources - Investing 000 000 000 000 000
Net Cash Flow - Investing 97500M
87400 M 95200 M 85400 M 92200M
Proceeds from Stock Options 1800 M 12300M
7300 M 4000 M 18100M
Other Proceeds from SaleIssues of Stock
000 000 000 000 000
ComPfd Purchase Retired ConvertedRedeemed
000 000 000 000 000
Financing Activities
Long Term Borrowings 161 B 202 B 108 B 154 B 55800M
Incline or Decline in Short TermBorrowings
000 000 000 000 000
Reduction in Long Term Debt 162 B 283 B 162 B 236 B 130 B
Cash Dividends Paid Total 13800M
11600 M 11400 M 7600 M 7600 M
Common Dividends (Cash) 13800M
11600 M 11400 M 7600 M 7600 M
Preferred Dividends (Cash) 000 000 000 000 000
Other Sources - Financing 300 M 1100 M 400 M 4600 M 000
Other Uses - Financing 300 M 1100 M 400 M 4600 M 000
Net Cash Flow - Financing -12600M
-79900 M -57100 M -80400 M -63200M
Effect of Exchange rate on Cash -1800M
400 M 1000 M -900 M 1400 M
COCA COLA ENTERPRISES INC Average Monthly Returns
842019 Pepsi and Coca-cola(RH6802B54)
httpslidepdfcomreaderfullpepsi-and-coca-colarh6802b54 622
Some investors consider seasonal performance when purchasing or selling stocks This chartillustrates the average monthly return for the past 5 years Users often also consider the number of times a stock increases or decreases for any given month Mouse-over the chart to view 5 years of history for each monthSeasonal Performance Data CCE
Returns Jan Feb Mar Apr May Jun Jul Aug Sep Oct Nov DecAvg
Returns
-185 057 290 512 041 -143 345 251 -269 -1030 -020 623
Times CCEStock PriceIncreased
48 47 57 51 59 45 53 53 48 53 52 48
Times CCEStock PriceUnchanged
1 1 2 1 2 5 3 2 2 3 2 2
Times CCEStock PriceDecreased
52 48 50 51 45 58 49 56 52 55 48 55
2009 -664 223 1490 2934 -233 -005 1285 756 594 -1092 304 mdash
2008 -1136
590 -087 -707 -1048 -1409 -213 083 -175 -4006 -865 3105
2007 049 -213
085 835 643 278 -557 512 168 656 062 023
2006 297 -045
351 -397 067 361 535 391 -658 -383 210 -014
2005 528 -272
-388 -106 778 059 677 -488 -1274 -327 191 -025
2004 mdash mdash mdash mdash mdash mdash mdash mdash mdash mdash mdash 024
PRICES
842019 Pepsi and Coca-cola(RH6802B54)
httpslidepdfcomreaderfullpepsi-and-coca-colarh6802b54 722
Date Open High Low Close Volume Adj Close
4-Dec-09 2018 2018 1974 1991 3430200 1991
3-Dec-09 1995 2010 1984 1986 3473100 1986
2-Dec-09 1978 2002 1972 1997 3016300 1997
1-Dec-09 1978 1995 1973 1975 3605800 1975
30-Nov-09 1991 1998 1959 1965 5927600 1965
27-Nov-09 1998 2000 1972 1993 1291400 1993
25-Nov-09 2032 2044 2018 2037 2238500 2037
24-Nov-09 2040 2060 2012 2030 3577400 2030
24-Nov-09 $ 008 Dividend
23-Nov-09 2057 2074 2050 2060 2314400 2052
20-Nov-09 2017 2049 2012 2042 2779000 2034
19-Nov-09 2051 2060 2015 2023 3153300 2015
18-Nov-09 2067 2075 2046 2062 3366800 2054
17-Nov-09 2054 2079 2050 2073 2504800 2065
16-Nov-09 2027 2067 2023 2064 4489000 2056
13-Nov-09 2018 2037 2000 2023 3474500 2015
12-Nov-09 2029 2047 2011 2014 3220500 2006
11-Nov-09 2009 2029 1997 2027 3458000 2019
10-Nov-09 1979 2009 1962 2003 3429000 1995
9-Nov-09 1984 2012 1977 2010 2973900 2002
6-Nov-09 1960 1973 1949 1972 3231500 1964
5-Nov-09 1911 1987 1911 1972 7675000 19644-Nov-09 1904 1936 1893 1911 5034900 1904
3-Nov-09 1888 1900 1885 1899 5151700 1892
2-Nov-09 1912 1923 1875 1894 6168400 1887
30-Oct-09 1942 1948 1897 1907 7210100 1900
29-Oct-09 1910 1978 1908 1960 10382400 1952
28-Oct-09 2014 2030 1894 1902 8666100 1895
27-Oct-09 1984 2021 1974 2002 5150600 1994
26-Oct-09 1994 2034 1987 1994 4289800 1986
23-Oct-09 2065 2065 1990 1998 3740500 199022-Oct-09 2062 2065 2017 2055 2659200 2047
21-Oct-09 2055 2089 2045 2054 3005800 2046
20-Oct-09 2108 2111 2045 2054 3148900 2046
19-Oct-09 2095 2125 2086 2113 3800700 2105
16-Oct-09 2104 2105 2083 2094 2535100 2086
15-Oct-09 2094 2113 2089 2111 2577300 2103
14-Oct-09 2100 2111 2074 2105 3047400 2097
13-Oct-09 2089 2101 2054 2092 3717700 2084
12-Oct-09 2091 2119 2084 2091 2202700 20839-Oct-09 2079 2098 2074 2094 2096000 2086
842019 Pepsi and Coca-cola(RH6802B54)
httpslidepdfcomreaderfullpepsi-and-coca-colarh6802b54 822
8-Oct-09 2098 2106 2072 2085 2825100 2077
7-Oct-09 2097 2100 2071 2093 2529600 2085
6-Oct-09 2100 2111 2076 2095 3373300 2087
5-Oct-09 2056 2096 2039 2096 3507200 2088
2-Oct-09 2027 2064 2007 2058 3896300 2050
1-Oct-09 2122 2123 2053 2056 5159100 2048
30-Sep-09 2098 2144 2072 2141 4954800 2133
29-Sep-09 2107 2115 2093 2103 2439000 2095
28-Sep-09 2092 2116 2083 2102 2258400 2094
25-Sep-09 2100 2113 2086 2090 1981800 2082
24-Sep-09 2114 2125 2085 2101 2772600 2093
23-Sep-09 2102 2142 2102 2111 4214200 2103
22-Sep-09 2103 2108 2079 2094 2747900 2086
21-Sep-09 2110 2115 2087 2097 4250300 2089
18-Sep-09 2112 2117 2085 2115 4861500 2107
17-Sep-09 2114 2114 2076 2099 4785000 2091
16-Sep-09 2090 2090 2031 2076 3932100 2068
15-Sep-09 2071 2089 2053 2087 3186700 2079
14-Sep-09 2033 2076 2018 2075 3813400 2067
11-Sep-09 2043 2052 2022 2045 2822800 2037
10-Sep-09 2012 2038 2000 2037 5223600 2029
9-Sep-09 2049 2049 1983 2010 5783700 2002
9-Sep-09 $ 008 Dividend8-Sep-09 2038 2051 2029 2050 4232400 2034
4-Sep-09 2026 2047 2015 2032 2756800 2016
3-Sep-09 2015 2032 1992 2030 2937400 2014
2-Sep-09 1987 2014 1975 2004 4132300 1988
Coca-Cola Dividend Stock Analysis
Coca-Cola has paid uninterrupted dividends on its common stock since 1893 and increased paymentsto common shareholders every year for 47 yearsFrom the end of 1998 up until December 2008 this dividend growth stock has delivered a negativeannual average total return of 210 to its shareholders The stock has largely traded between $65 and$40 over the past decade
842019 Pepsi and Coca-cola(RH6802B54)
httpslidepdfcomreaderfullpepsi-and-coca-colarh6802b54 922
The company has managed to deliver a 1090 average annual increase in its EPS between 1999 and2008 Analysts are expecting an increase in EPS to $305-$310 for 2009 and $325-$330 by 2010This would be a nice increase from the 2008 earnings per share of $249 Future drivers for earningscould be the companyrsquos tea coffee and water operations Cost savings initiatives could also add to the
bottom line over time
Some analysts believe that Coca Cola could follow arch rival Pepsi Corsquos (PEP) moves to acquire itsown bottlers in an effort to gain more control over the production and distribution of its beverages inkey markets Coke holds a 35 interest in its largest manufacturer and distributor of Coca Cola
products Coca-Cola Enterprises In (CCE) Coca-Cola Enterprises Inc accounts for about 40 of Cokersquos concentrate sales and 16 of the companyrsquos worldwide volume which makes it a likely targetof acquisition should Coca Cola decide to follow Pepsi Corsquos strategy of buying back its bottlingoperations
The Return on Equity has been in a decline after hitting a high in 2001 Rather than focus on absolute
842019 Pepsi and Coca-cola(RH6802B54)
httpslidepdfcomreaderfullpepsi-and-coca-colarh6802b54 1022
values for this indicator I generally want to see at least a stable return on equity over time
Annual dividends have increased by an average of 1010 annually since 1999 which is slightlylower than the growth in EPS The company last raised its dividend by 8 in February 2009 for the47th year in a row
A 10 growth in dividends translates into the dividend payment doubling every seven years If welook at historical data going as far back as 1969 The Coca Cola Company has indeed managed todouble its dividend payment every seven years on average
The dividend payout ratio remained above 50 for the majority of the past decade A lower payout isalways a plus since it leaves room for consistent dividend growth minimizing the impact of short-
842019 Pepsi and Coca-cola(RH6802B54)
httpslidepdfcomreaderfullpepsi-and-coca-colarh6802b54 1122
term fluctuations in earnings
Currently Coca Cola is trading at 20 times earnings and yields 330 In comparison arch rival in thecola wars Pepsi Co trades at a PE multiple of 165 and yields 340 Check my analysis of Pepsi Co
I believe that The Coca Cola Company is not as attractively valued at the moment as Pepsi Co Iwould consider adding to my position there if it can cover its dividends at least two times by itsearnings by the end of the year and if the PE ratio doesnrsquot increase above 20COCA COLA ENTERPRISES INC Dividends amp Splits
5 Year Dividend History
Payable AmountShare Ex-Date Record Declaration
12102009 $008 11242009 11272009 10282009
09242009 $008 09092009 09112009 07302009
06252009 $007 06102009 06122009 04222009
03262009 $007 03112009 03132009 02112009
12112008 $007 11252008 11282008 10232008
09252008 $007 09102008 09122008 07232008
06262008 $007 06112008 06132008 04232008
03272008 $007 03122008 03142008 02152008
12132007 $006 11282007 11302007 10252007
09272007 $006 09122007 09142007 07242007
06282007 $006 06132007 06152007 04252007
03292007 $006 03142007 03162007 02102007
12142006 $006 11292006 12012006 10262006
09282006 $006 09132006 09152006 07262006
06292006 $006 06142006 06162006 04262006
03302006 $006 03152006 03172006 02182006
12152005 $004 11302005 12022005 10262005
10032005 $004 09152005 09192005 07272005
07012005 $004 06152005 06172005 04272005
842019 Pepsi and Coca-cola(RH6802B54)
httpslidepdfcomreaderfullpepsi-and-coca-colarh6802b54 1222
Payable AmountShare Ex-Date Record Declaration
04012005 $004 03162005 03182005 02162005
Dividend Analysis
Looking at the last 5 years of dividends I have calculated an average highdividend yield of 197 However that seems a tad low considering that each of
the last 2 years is significantly higher than that amount If I average out just the
last 4 years of high dividend yields I come up with 273 Still lower than the
average high yield of the last 2 years
And now the dividend payout ratio Ah ha This explains how they were able to
increase dividends at 10 even when the fundamentals have not been growing
as quickly Look at the increase in the payout ratio It has grown from a low of
3415 in 1997 to a high of 5714 in 2006 It has just been a steady climb up
for the last 10 years
Using the 273 as an average high dividend yield I calculate a price of $4982
to be able to collect this average high dividend yield At close of Friday the
current price was $5280 That means a premium of 599 over the price I am
willing to pay
Conclusion
Well my analysis shows that Coca-Cola fundamentals have not been keeping up
with their very healthy dividend growth This has caused Coca-Cola to have to
payout more and more of its earnings to shareholders This concerns me
because eventually they will not be able to raise their dividend at these high
rates because their dividend payout ratio will be too high
I am sure that Warren Buffett is earning a healthy dividend on his KO stocks but
personally I would pass on this one today There are stocks out there that
continue to grow their fundamentals which will in turn allow them to grow their
dividends
bull COCA COLA ENTERPRISES INC Top Competitors
Symbol Company Name Last
Change
Change
Volume News
Charts
CCE COCA COLA ENTERPRISES INC 1986 -011 -055 347 M
PBG PEPSI BOTTLING GROUP INC 3819 -028 -073 310 M
PEP PEPSICO INC 6276 -089 -140 640 M
Pepsi
842019 Pepsi and Coca-cola(RH6802B54)
httpslidepdfcomreaderfullpepsi-and-coca-colarh6802b54 1322
Pepsi
Type Cola
Manufacturer PepsiCo
Country of origin United States
Introduced1898 (as Brads Drink)June 16 1903 (as Pepsi-Cola)
1961 (as Pepsi)
Related products
Coca-ColaFantaDr Pepper Sprite (soft drink)Irn BruCola TurkaBig Cola
History
Pepsi is a carbonated soft drink produced and manufactured by PepsiCo It is sold in many placessuch as retail stores restaurants schools cinemas and from vending machines The drink was firstmade in the 1890s by pharmacist Caleb Bradham in New Bern North Carolina The brand wastrademarked on June 16 1903 There have been many Pepsi variants produced over the years since1898
In October 2008 Pepsi announced that it would be redesigning its logo and re-branding many of its products by early 2009 In 2009 Pepsi Diet Pepsi and Pepsi Max began using all lower-case fonts for name brands and Diet Pepsi Max was re-branded as Pepsi Max The brands blue and red globetrademark became a series of smiles with the central white band arcing at different angles
depending on the product Pepsi in countries such as the US Canada Brazil Bolivia Guatemala Nicaragua Honduras El Salvador Colombia Argentina Puerto Rico and Australia is carrying thesmile logo while the rest of the countries continue to use the old design on all packagingIn mid-September 2009the new logo has started to appear on 300 and 600ml bottles of Pepsi inAustralia Pepsi Max bottles still carry the current logo as of 27th September
Large Block Holder Type Number
Institutions 1764 Total Number of Shares Held156 B of Shares Owned by all Large Block Holders10000
Mutual Fund 2759
Other Major 25
Total Number of LargeBlock Holders 4548
842019 Pepsi and Coca-cola(RH6802B54)
httpslidepdfcomreaderfullpepsi-and-coca-colarh6802b54 1422
PEPSICO INC Dividends amp Splits
Upcoming Dividends
Payable AmountShare Ex-Date Record Declaration Set Alert
010410 $045 120209 120409 1113095 Year Dividend History
Payable AmountShare Ex-Date Record Declaration
01042010 $045 12022009 12042009 11162009
09302009 $045 09022009 09042009 08132009
06302009 $045 06032009 06052009 05062009
03312009 $0425 03042009 03062009 02072009
01022009 $0425 12032008 12052008 11172008
09302008 $0425 09032008 09052008 07192008
06302008 $0425 06042008 06062008 05082008
03312008 $0375 03052008 03072008 02022008
01022008 $0375 12052007 12072007 11172007
09282007 $0375 09052007 09072007 07202007
06292007 $0375 06062007 06082007 05092007
03302007 $030 03072007 03092007 02032007
01022007 $030 12062006 12082006 11182006
09292006 $030 09062006 09082006 07222006
06302006 $030 06072006 06092006 0504200603312006 $026 03082006 03102006 02042006
01032006 $026 12072005 12092005 11192005
09302005 $026 09072005 09092005 07232005
06302005 $026 06082005 06102005 05052005
03312005 $023 03092005 03112005 01282005
PEPSICO INC Income Statement
ViewAnnual Data | Quarterly Data
Period EndingQ3FY09 Q2 FY09 Q1 FY09 Q4 FY08 Q3 FY08
Net SalesRevenues 1108 B 1059 B 826 B 1273 B 1124 B
Cost of Goods Sold (ExcludingDepreciation)
476 B 452 B 344 B 617 B 490 B
Depreciation Depletion andAmortization
42200M
37100 M 31400 M 2100 M 37700 M
Gross Income 590 B 570 B 451 B 654 B 596 B
Selling General amp Admin Expenses 365 B 350 B 290 B 532 B 398 B
Other Operating Expense 157 B 161 B 144 B 152 B 142 B
842019 Pepsi and Coca-cola(RH6802B54)
httpslidepdfcomreaderfullpepsi-and-coca-colarh6802b54 1522
Period EndingQ3FY09 Q2 FY09 Q1 FY09 Q4 FY08 Q3 FY08
Net SalesRevenues 1108 B 1059 B 826 B 1273 B 1124 B
Operating Income 223 B 220 B 161 B 121 B 198 B
Extraordinary Credit - Pretax 9300 M 000 000 000 000
Extraordinary Charge - Pretax 000 20900 M 9100 M 90800 M 17600 M
Pretax Equity in Earnings 000 000 000 000 000
Other IncomeExpenses - Net 1600 M 42400 M 200 M 90800 M 19200 M
Pretax Income 216 B 212 B 149 B 108 B 192 B
Income Taxes 57500M
56800 M 37400 M 29300 M 55000 M
Minority Interest 1600 M 800 M 600 M 000 000
Equity in Earnings 000 000 000 000 000
Discontinued Operations 000 000 000 000 000
Net Income Before ExtraItemsPreferred Div
172 B 166 B 114 B 71900 M 158 B
Extra Items amp Gain (Loss) Sale of Assets
000 000 000 000 000
Net Income Before PreferredDividends
172 B 166 B 114 B 71900 M 158 B
Preferred Dividend Requirements 000 100 M 300 M 000 200 M
Net Income Used to CalculateDiluted EPS
mdash mdash mdash mdash mdash
Net Income Used to Calculate BasicEPS
mdash mdash mdash mdash mdash
Net Income Available to Common 172 B 166 B 114 B 71900 M 157 B
Period Ending FY2008 FY2007 FY2006 FY2005 FY2004
Net SalesRevenues 4325 B 3947 B 3514 B 3256 B 2926 B
Cost of Goods Sold (ExcludingDepreciation)
1878 B 1667 B 1452 B 1302 B 1229 B
Depreciation Depletion andAmortization
154 B 143 B 141 B 131 B 126 B
Gross Income 2292 B 2138 B 1921 B 1824 B 1571 B
Selling General amp AdminExpenses
1545 B 1411 B 1277 B 1231 B 1030 B
Other Operating Expense 000 000 000 000 000
Operating Expenses - Total 157 B 161 B 144 B 152 B 142 B
Operating Income 748 B 727 B 644 B 592 B 541 B
Extraordinary Credit - Pretax 000 000 000 000 000
842019 Pepsi and Coca-cola(RH6802B54)
httpslidepdfcomreaderfullpepsi-and-coca-colarh6802b54 1622
Period EndingQ3FY09 Q2 FY09 Q1 FY09 Q4 FY08 Q3 FY08
Net SalesRevenues 1108 B 1059 B 826 B 1273 B 1124 B
Extraordinary Charge - Pretax 54300
M
10200 M 15000 M 20600 M mdash
Non-operating Interest Income 4100 M 12500 M 17300 M 15900 M 7400 M
Reserves Inc (Dec) 000 000 000 000 000
Pretax Equity in Earnings 000 000 000 000 000
Other IncomeExpenses - Net 000 000 000 000 000
Earnings Before Interest amp Taxes(EBIT)
698 B 730 B 661 B 608 B 533 B
Interest Expenses On Debt 34300M
24500 M 25500 M 26100 M 16900 M
Interest Capitalized 1400 M 2100 M 1600 M 500 M 200 MPretax Income 665 B 707 B 637 B 582 B 517 B
Income Taxes 188 B 197 B 135 B 230 B 137 B
Current Domestic Income Tax 90200M
153 B 83200 M 176 B 110 B
Current Foreign Income Tax 73200M
48900M
56900 M 42600 M 25600 M
Deferred Domestic Income Tax 31400M
2400 M -3800 M 14800 M 1200 M
Deferred Foreign Income Tax -6900M
-6600M
-1600 M -2600 M 500 M
Income Tax Credits mdash mdash mdash mdash mdash
Minority Interest 000 000 000 000 000
Equity in Earnings 37400M
56000 M 61600 M 55700 M 38000 M
After Tax Income Expense 000 000 000 000 000
Discontinued Operations 000 000 000 000 3800 M
Net Income Before ExtraItemsPreferred Div
514 B 566 B 564 B 408 B 421 B
Extra Items amp Gain (Loss) Sale of Assets
000 000 000 000 000
Net Income Before PreferredDividends
514 B 566 B 564 B 408 B 421 B
Preferred Dividend Requirements 1000 M 1200 M 1100 M 1800 M 2500 M
Net Income Available to Common 514 B 566 B 564 B 408 B 421 B
Seasonal Performance Data PEP
Returns Jan Feb Mar Apr May Jun Jul Aug Sep Oct Nov Dec
AvgReturns -289 -033 154 024 252 -224 316 200 373 -293 095 006
Times PEP Stock Price 49 45 56 51 54 46 57 58 58 52 54 50
842019 Pepsi and Coca-cola(RH6802B54)
httpslidepdfcomreaderfullpepsi-and-coca-colarh6802b54 1722
Returns Jan Feb Mar Apr May Jun Jul Aug Sep Oct Nov Dec
Increased
Times PEP Stock PriceUnchanged
0 0 1 0 2 1 1 0 0 0 1 1
Times PEP Stock Price
Decreased52 51 52 52 50 61 47 53 44 59 47 54
2009 -828 -415 694 -333 460 559 326 -013 351 322 276 acirceurordquo
2008 -1015 201 386 -514 -033 -689 467 288 407 -2000 -053 -339
2007 430 -319 065 398 339 -508 119 367 769 063 469 -165
2006 -321 338 -222 078 381 -068 556 300 -002 -278 -231 094
2005 287 030 -153 492 111 -413 111 059 339 427 012 -019
2004 acirceurordquo acirceurordquo acirceurordquo acirceurordquo acirceurordquo acirceurordquo acirceurordquo acirceurordquo acirceurordquo acirceurordquo acirceurordquo 459
PepsiCo (PEP) Dividend Stock Analysis
PepsiCo Inc manufactures markets and sells various snacks carbonated and non-carbonated
beverages and foods worldwidePepsiCo is a major component of the SampP 500 Dow Industrials and
the Dividend Aristocrats Indexes PepsiCo has been consistently increasing its dividends for 36
consecutive years From the end of 1998 up until December 2008 this dividend growth stock has
delivered a 470 annual average total return to its shareholders
At the same time company has managed to deliver a 990 average annual increase in its EPS since
1999
842019 Pepsi and Coca-cola(RH6802B54)
httpslidepdfcomreaderfullpepsi-and-coca-colarh6802b54 1822
The ROE has remained largely between 31 and 38 with the exception of 2004 when it fell to as
low as 22
Annual dividend payments have increased by an average of 1350 annually since 1999 which is
much higher than the growth in EPS Analysts are expecting slight increase in EPS for 2009
compared to 2008 given the sluggish state of North American economies The strong US dollar could
potentially hurt sales as over 44 of PepsiCorsquos revenues are derived internationally
A 1350 growth in dividends translates into the dividend payment doubling almost every five years
Since 1978 PepsiCo has actually managed to double its dividend payment every six years on average
The dividend payout has remained in a range between 31 and 42 In 2008 the dividend payout
ratio has surged to 51 A lower payout is always a plus since it leaves room for consistent dividend
growth minimizing the impact of short-term fluctuations in earnings The slow growth in earnings
could put future dividend increases at risk
842019 Pepsi and Coca-cola(RH6802B54)
httpslidepdfcomreaderfullpepsi-and-coca-colarh6802b54 1922
842019 Pepsi and Coca-cola(RH6802B54)
httpslidepdfcomreaderfullpepsi-and-coca-colarh6802b54 2022
Though carbonated soft drinks remain the most popular beverage PEP recognizes that non-carbonated soft drinks are a faster growing category The company is focusing on the health andwellness trends It has eliminated trans fats from many of its snack foods and is introducing ldquogoodforyourdquo foods under the Quaker Oats brand Risks include the highly competitive and very maturenature of it products also with more exposure to foreign markets political and currency risks alsoincrease
Conclusion PEP did not earn any Stars in the Fair Value section earned two Stars in the DividendAnalytical Data section and earned one Star in the Dividend Income vs MMA section for a total of three Stars This quantitatively ranks PEP as a 3 Star-Hold
Using my D4L-PreScreenxls model I determined the share price could increase to $6562 beforePEPrsquos NPV MMA Differential fell to the $500 that I like to see for a stock with 37 consecutive yearsof dividend increases At that price the stock would yield 270
Resetting the D4L-PreScreenxls model and solving for the dividend growth rate needed to generatethe target $500 NPV MMA Differential the calculated rate is 63 This dividend growth rate is
lower than the the 76 used in this analysis thus providing a margin of safety PEP has a risk rating of 100 which classifies it as a low risk stock
Like its competition Coca-Cola (KO) PEPrsquos Free Cash Flow Payout currently at 70 tends toremain higher than the 60 level that I prefer However this is mitigated to an extent by relativelylow debt levels and predictable cash flows PEP is a stock I will buy as my allocation allows andwhen it dips below its buy price of $5510 For additional information including the stockrsquos dividendhistory please refer to its data page
Stock price of last five years with monthly price list
842019 Pepsi and Coca-cola(RH6802B54)
httpslidepdfcomreaderfullpepsi-and-coca-colarh6802b54 2122
PRICES
Date Open High Low Close Volume Adj Close
4-Dec-09 6318 6400 6308 6385 8907000 6385
3-Dec-09 6358 6359 6267 6276 6406200 6276
2-Dec-09 6350 6374 6317 6365 6195800 6365
2-Dec-09 $ 045 Dividend
1-Dec-09 6268 6393 6249 6387 6887700 6342
30-Nov-09 6264 6283 6215 6222 7252700 6178
27-Nov-09 6224 6255 6175 6230 3416000 6186
25-Nov-09 6253 6327 6249 6319 4672600 6274
24-Nov-09 6262 6265 6213 6250 4139700 6206
23-Nov-09 6246 6299 6226 6249 5009400 6205
20-Nov-09 6167 6231 6143 6208 5314600 6164
19-Nov-09 6210 6210 6135 6188 4390400 6144
18-Nov-09 6244 6251 6181 6230 3952300 6186
17-Nov-09 6242 6263 6203 6260 4362400 6216
16-Nov-09 6221 6249 6194 6243 4966800 6199
13-Nov-09 6163 6213 6135 6194 6411100 6150
12-Nov-09 6249 6275 6110 6127 8474900 6084
11-Nov-09 6234 6268 6208 6260 4714300 6216
10-Nov-09 6217 6294 6193 6208 7094100 6164
9-Nov-09 6181 6232 6143 6228 6921800 6184
6-Nov-09 6099 6176 6079 6176 4831000 6132
5-Nov-09 6044 6141 6042 6123 5578500 6080
4-Nov-09 6016 6096 5979 6038 5552100 5995
3-Nov-09 6029 6039 5962 6006 5797000 5964
2-Nov-09 6079 6107 6016 6060 6618800 601730-Oct-09 6135 6164 6037 6055 7794100 6012
29-Oct-09 6101 6146 6057 6139 5245300 6096
28-Oct-09 6088 6152 6075 6099 6321900 6056
27-Oct-09 6064 6135 6010 6100 7262900 6057
26-Oct-09 6114 6150 6021 6047 5113000 6004
23-Oct-09 6141 6167 6058 6103 6505200 6060
22-Oct-09 6190 6190 6087 6150 5428100 6107
21-Oct-09 6138 6234 6123 6184 7445000 6140
20-Oct-09 6200 6205 6112 6158 8068000 6115
19-Oct-09 6228 6257 6190 6205 5557300 616116-Oct-09 6247 6268 6211 6229 6588400 6185
15-Oct-09 6157 6275 6139 6268 10518600 6224
14-Oct-09 6094 6168 6070 6162 8462200 6119
13-Oct-09 6088 6100 6052 6060 7502000 6017
12-Oct-09 6043 6136 6025 6092 6178100 6049
9-Oct-09 6038 6070 5981 6059 6360200 6016
8-Oct-09 6124 6124 5980 6039 17263400 5996
7-Oct-09 6085 6138 6045 6117 6441900 6074
6-Oct-09 6105 6127 6042 6087 8128900 6044
5-Oct-09 6083 6124 6014 6085 7892000 60422-Oct-09 5912 6124 5893 6090 17530200 6047
1-Oct-09 5870 5899 5827 5846 9010200 5805
30-Sep-09 5874 5886 5801 5866 8898400 5825
29-Sep-09 5910 5931 5800 5851 7086400 5810
28-Sep-09 5895 5949 5862 5903 4085900 5861
25-Sep-09 5850 5913 5832 5868 6758800 5827
842019 Pepsi and Coca-cola(RH6802B54)
httpslidepdfcomreaderfullpepsi-and-coca-colarh6802b54 2222
References
1 httpwwwcoca-colacomindexjsp2 httpfinanceaolcomquotesthe-coca-cola-companykonys
3 httpfinanceaolcomeventthe-pepsi-bottling-group-incpbgnys
4 httpfinanceyahoocomqs=ko
5 httpwwwdividendgrowthinvestorcom200906coca-cola-ko-dividend-
stock-analysishtml
6 httpfinanceyahoocomqs=ko
7 httpmoneycentralmsncomdetailstock_quoteSymbol=Ko
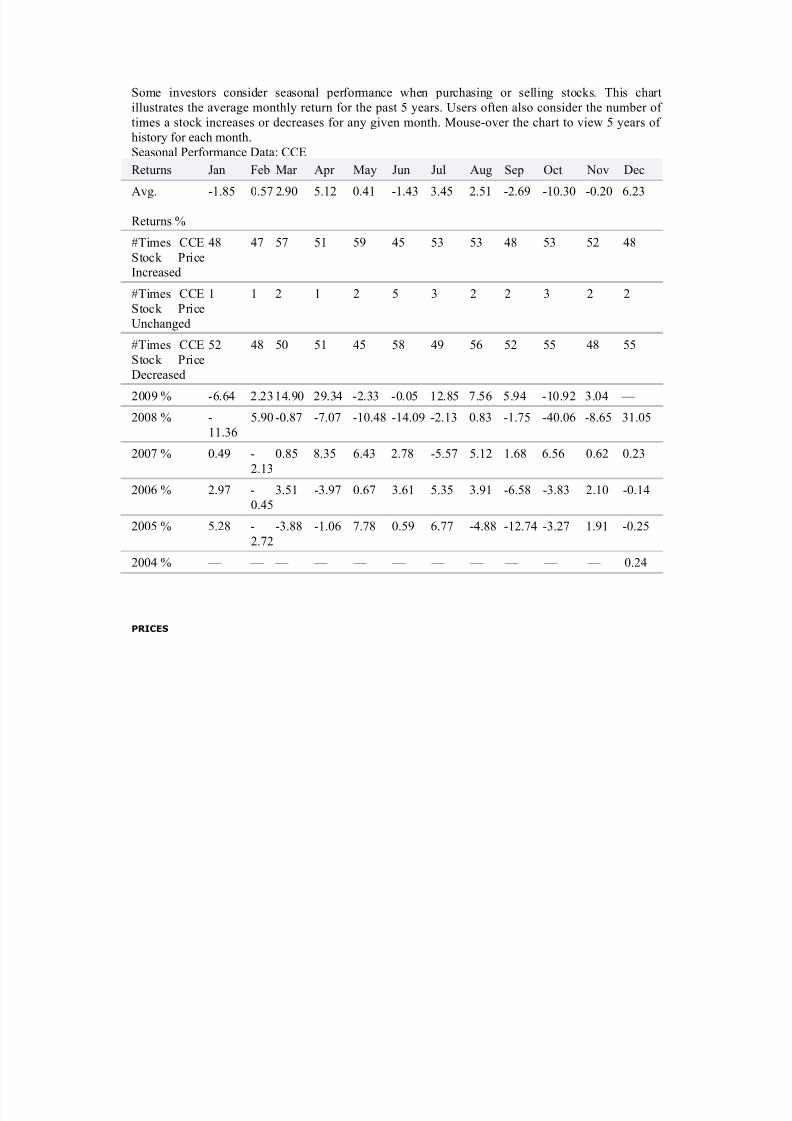
842019 Pepsi and Coca-cola(RH6802B54)
httpslidepdfcomreaderfullpepsi-and-coca-colarh6802b54 622
Some investors consider seasonal performance when purchasing or selling stocks This chartillustrates the average monthly return for the past 5 years Users often also consider the number of times a stock increases or decreases for any given month Mouse-over the chart to view 5 years of history for each monthSeasonal Performance Data CCE
Returns Jan Feb Mar Apr May Jun Jul Aug Sep Oct Nov DecAvg
Returns
-185 057 290 512 041 -143 345 251 -269 -1030 -020 623
Times CCEStock PriceIncreased
48 47 57 51 59 45 53 53 48 53 52 48
Times CCEStock PriceUnchanged
1 1 2 1 2 5 3 2 2 3 2 2
Times CCEStock PriceDecreased
52 48 50 51 45 58 49 56 52 55 48 55
2009 -664 223 1490 2934 -233 -005 1285 756 594 -1092 304 mdash
2008 -1136
590 -087 -707 -1048 -1409 -213 083 -175 -4006 -865 3105
2007 049 -213
085 835 643 278 -557 512 168 656 062 023
2006 297 -045
351 -397 067 361 535 391 -658 -383 210 -014
2005 528 -272
-388 -106 778 059 677 -488 -1274 -327 191 -025
2004 mdash mdash mdash mdash mdash mdash mdash mdash mdash mdash mdash 024
PRICES
842019 Pepsi and Coca-cola(RH6802B54)
httpslidepdfcomreaderfullpepsi-and-coca-colarh6802b54 722
Date Open High Low Close Volume Adj Close
4-Dec-09 2018 2018 1974 1991 3430200 1991
3-Dec-09 1995 2010 1984 1986 3473100 1986
2-Dec-09 1978 2002 1972 1997 3016300 1997
1-Dec-09 1978 1995 1973 1975 3605800 1975
30-Nov-09 1991 1998 1959 1965 5927600 1965
27-Nov-09 1998 2000 1972 1993 1291400 1993
25-Nov-09 2032 2044 2018 2037 2238500 2037
24-Nov-09 2040 2060 2012 2030 3577400 2030
24-Nov-09 $ 008 Dividend
23-Nov-09 2057 2074 2050 2060 2314400 2052
20-Nov-09 2017 2049 2012 2042 2779000 2034
19-Nov-09 2051 2060 2015 2023 3153300 2015
18-Nov-09 2067 2075 2046 2062 3366800 2054
17-Nov-09 2054 2079 2050 2073 2504800 2065
16-Nov-09 2027 2067 2023 2064 4489000 2056
13-Nov-09 2018 2037 2000 2023 3474500 2015
12-Nov-09 2029 2047 2011 2014 3220500 2006
11-Nov-09 2009 2029 1997 2027 3458000 2019
10-Nov-09 1979 2009 1962 2003 3429000 1995
9-Nov-09 1984 2012 1977 2010 2973900 2002
6-Nov-09 1960 1973 1949 1972 3231500 1964
5-Nov-09 1911 1987 1911 1972 7675000 19644-Nov-09 1904 1936 1893 1911 5034900 1904
3-Nov-09 1888 1900 1885 1899 5151700 1892
2-Nov-09 1912 1923 1875 1894 6168400 1887
30-Oct-09 1942 1948 1897 1907 7210100 1900
29-Oct-09 1910 1978 1908 1960 10382400 1952
28-Oct-09 2014 2030 1894 1902 8666100 1895
27-Oct-09 1984 2021 1974 2002 5150600 1994
26-Oct-09 1994 2034 1987 1994 4289800 1986
23-Oct-09 2065 2065 1990 1998 3740500 199022-Oct-09 2062 2065 2017 2055 2659200 2047
21-Oct-09 2055 2089 2045 2054 3005800 2046
20-Oct-09 2108 2111 2045 2054 3148900 2046
19-Oct-09 2095 2125 2086 2113 3800700 2105
16-Oct-09 2104 2105 2083 2094 2535100 2086
15-Oct-09 2094 2113 2089 2111 2577300 2103
14-Oct-09 2100 2111 2074 2105 3047400 2097
13-Oct-09 2089 2101 2054 2092 3717700 2084
12-Oct-09 2091 2119 2084 2091 2202700 20839-Oct-09 2079 2098 2074 2094 2096000 2086
842019 Pepsi and Coca-cola(RH6802B54)
httpslidepdfcomreaderfullpepsi-and-coca-colarh6802b54 822
8-Oct-09 2098 2106 2072 2085 2825100 2077
7-Oct-09 2097 2100 2071 2093 2529600 2085
6-Oct-09 2100 2111 2076 2095 3373300 2087
5-Oct-09 2056 2096 2039 2096 3507200 2088
2-Oct-09 2027 2064 2007 2058 3896300 2050
1-Oct-09 2122 2123 2053 2056 5159100 2048
30-Sep-09 2098 2144 2072 2141 4954800 2133
29-Sep-09 2107 2115 2093 2103 2439000 2095
28-Sep-09 2092 2116 2083 2102 2258400 2094
25-Sep-09 2100 2113 2086 2090 1981800 2082
24-Sep-09 2114 2125 2085 2101 2772600 2093
23-Sep-09 2102 2142 2102 2111 4214200 2103
22-Sep-09 2103 2108 2079 2094 2747900 2086
21-Sep-09 2110 2115 2087 2097 4250300 2089
18-Sep-09 2112 2117 2085 2115 4861500 2107
17-Sep-09 2114 2114 2076 2099 4785000 2091
16-Sep-09 2090 2090 2031 2076 3932100 2068
15-Sep-09 2071 2089 2053 2087 3186700 2079
14-Sep-09 2033 2076 2018 2075 3813400 2067
11-Sep-09 2043 2052 2022 2045 2822800 2037
10-Sep-09 2012 2038 2000 2037 5223600 2029
9-Sep-09 2049 2049 1983 2010 5783700 2002
9-Sep-09 $ 008 Dividend8-Sep-09 2038 2051 2029 2050 4232400 2034
4-Sep-09 2026 2047 2015 2032 2756800 2016
3-Sep-09 2015 2032 1992 2030 2937400 2014
2-Sep-09 1987 2014 1975 2004 4132300 1988
Coca-Cola Dividend Stock Analysis
Coca-Cola has paid uninterrupted dividends on its common stock since 1893 and increased paymentsto common shareholders every year for 47 yearsFrom the end of 1998 up until December 2008 this dividend growth stock has delivered a negativeannual average total return of 210 to its shareholders The stock has largely traded between $65 and$40 over the past decade
842019 Pepsi and Coca-cola(RH6802B54)
httpslidepdfcomreaderfullpepsi-and-coca-colarh6802b54 922
The company has managed to deliver a 1090 average annual increase in its EPS between 1999 and2008 Analysts are expecting an increase in EPS to $305-$310 for 2009 and $325-$330 by 2010This would be a nice increase from the 2008 earnings per share of $249 Future drivers for earningscould be the companyrsquos tea coffee and water operations Cost savings initiatives could also add to the
bottom line over time
Some analysts believe that Coca Cola could follow arch rival Pepsi Corsquos (PEP) moves to acquire itsown bottlers in an effort to gain more control over the production and distribution of its beverages inkey markets Coke holds a 35 interest in its largest manufacturer and distributor of Coca Cola
products Coca-Cola Enterprises In (CCE) Coca-Cola Enterprises Inc accounts for about 40 of Cokersquos concentrate sales and 16 of the companyrsquos worldwide volume which makes it a likely targetof acquisition should Coca Cola decide to follow Pepsi Corsquos strategy of buying back its bottlingoperations
The Return on Equity has been in a decline after hitting a high in 2001 Rather than focus on absolute
842019 Pepsi and Coca-cola(RH6802B54)
httpslidepdfcomreaderfullpepsi-and-coca-colarh6802b54 1022
values for this indicator I generally want to see at least a stable return on equity over time
Annual dividends have increased by an average of 1010 annually since 1999 which is slightlylower than the growth in EPS The company last raised its dividend by 8 in February 2009 for the47th year in a row
A 10 growth in dividends translates into the dividend payment doubling every seven years If welook at historical data going as far back as 1969 The Coca Cola Company has indeed managed todouble its dividend payment every seven years on average
The dividend payout ratio remained above 50 for the majority of the past decade A lower payout isalways a plus since it leaves room for consistent dividend growth minimizing the impact of short-
842019 Pepsi and Coca-cola(RH6802B54)
httpslidepdfcomreaderfullpepsi-and-coca-colarh6802b54 1122
term fluctuations in earnings
Currently Coca Cola is trading at 20 times earnings and yields 330 In comparison arch rival in thecola wars Pepsi Co trades at a PE multiple of 165 and yields 340 Check my analysis of Pepsi Co
I believe that The Coca Cola Company is not as attractively valued at the moment as Pepsi Co Iwould consider adding to my position there if it can cover its dividends at least two times by itsearnings by the end of the year and if the PE ratio doesnrsquot increase above 20COCA COLA ENTERPRISES INC Dividends amp Splits
5 Year Dividend History
Payable AmountShare Ex-Date Record Declaration
12102009 $008 11242009 11272009 10282009
09242009 $008 09092009 09112009 07302009
06252009 $007 06102009 06122009 04222009
03262009 $007 03112009 03132009 02112009
12112008 $007 11252008 11282008 10232008
09252008 $007 09102008 09122008 07232008
06262008 $007 06112008 06132008 04232008
03272008 $007 03122008 03142008 02152008
12132007 $006 11282007 11302007 10252007
09272007 $006 09122007 09142007 07242007
06282007 $006 06132007 06152007 04252007
03292007 $006 03142007 03162007 02102007
12142006 $006 11292006 12012006 10262006
09282006 $006 09132006 09152006 07262006
06292006 $006 06142006 06162006 04262006
03302006 $006 03152006 03172006 02182006
12152005 $004 11302005 12022005 10262005
10032005 $004 09152005 09192005 07272005
07012005 $004 06152005 06172005 04272005
842019 Pepsi and Coca-cola(RH6802B54)
httpslidepdfcomreaderfullpepsi-and-coca-colarh6802b54 1222
Payable AmountShare Ex-Date Record Declaration
04012005 $004 03162005 03182005 02162005
Dividend Analysis
Looking at the last 5 years of dividends I have calculated an average highdividend yield of 197 However that seems a tad low considering that each of
the last 2 years is significantly higher than that amount If I average out just the
last 4 years of high dividend yields I come up with 273 Still lower than the
average high yield of the last 2 years
And now the dividend payout ratio Ah ha This explains how they were able to
increase dividends at 10 even when the fundamentals have not been growing
as quickly Look at the increase in the payout ratio It has grown from a low of
3415 in 1997 to a high of 5714 in 2006 It has just been a steady climb up
for the last 10 years
Using the 273 as an average high dividend yield I calculate a price of $4982
to be able to collect this average high dividend yield At close of Friday the
current price was $5280 That means a premium of 599 over the price I am
willing to pay
Conclusion
Well my analysis shows that Coca-Cola fundamentals have not been keeping up
with their very healthy dividend growth This has caused Coca-Cola to have to
payout more and more of its earnings to shareholders This concerns me
because eventually they will not be able to raise their dividend at these high
rates because their dividend payout ratio will be too high
I am sure that Warren Buffett is earning a healthy dividend on his KO stocks but
personally I would pass on this one today There are stocks out there that
continue to grow their fundamentals which will in turn allow them to grow their
dividends
bull COCA COLA ENTERPRISES INC Top Competitors
Symbol Company Name Last
Change
Change
Volume News
Charts
CCE COCA COLA ENTERPRISES INC 1986 -011 -055 347 M
PBG PEPSI BOTTLING GROUP INC 3819 -028 -073 310 M
PEP PEPSICO INC 6276 -089 -140 640 M
Pepsi
842019 Pepsi and Coca-cola(RH6802B54)
httpslidepdfcomreaderfullpepsi-and-coca-colarh6802b54 1322
Pepsi
Type Cola
Manufacturer PepsiCo
Country of origin United States
Introduced1898 (as Brads Drink)June 16 1903 (as Pepsi-Cola)
1961 (as Pepsi)
Related products
Coca-ColaFantaDr Pepper Sprite (soft drink)Irn BruCola TurkaBig Cola
History
Pepsi is a carbonated soft drink produced and manufactured by PepsiCo It is sold in many placessuch as retail stores restaurants schools cinemas and from vending machines The drink was firstmade in the 1890s by pharmacist Caleb Bradham in New Bern North Carolina The brand wastrademarked on June 16 1903 There have been many Pepsi variants produced over the years since1898
In October 2008 Pepsi announced that it would be redesigning its logo and re-branding many of its products by early 2009 In 2009 Pepsi Diet Pepsi and Pepsi Max began using all lower-case fonts for name brands and Diet Pepsi Max was re-branded as Pepsi Max The brands blue and red globetrademark became a series of smiles with the central white band arcing at different angles
depending on the product Pepsi in countries such as the US Canada Brazil Bolivia Guatemala Nicaragua Honduras El Salvador Colombia Argentina Puerto Rico and Australia is carrying thesmile logo while the rest of the countries continue to use the old design on all packagingIn mid-September 2009the new logo has started to appear on 300 and 600ml bottles of Pepsi inAustralia Pepsi Max bottles still carry the current logo as of 27th September
Large Block Holder Type Number
Institutions 1764 Total Number of Shares Held156 B of Shares Owned by all Large Block Holders10000
Mutual Fund 2759
Other Major 25
Total Number of LargeBlock Holders 4548
842019 Pepsi and Coca-cola(RH6802B54)
httpslidepdfcomreaderfullpepsi-and-coca-colarh6802b54 1422
PEPSICO INC Dividends amp Splits
Upcoming Dividends
Payable AmountShare Ex-Date Record Declaration Set Alert
010410 $045 120209 120409 1113095 Year Dividend History
Payable AmountShare Ex-Date Record Declaration
01042010 $045 12022009 12042009 11162009
09302009 $045 09022009 09042009 08132009
06302009 $045 06032009 06052009 05062009
03312009 $0425 03042009 03062009 02072009
01022009 $0425 12032008 12052008 11172008
09302008 $0425 09032008 09052008 07192008
06302008 $0425 06042008 06062008 05082008
03312008 $0375 03052008 03072008 02022008
01022008 $0375 12052007 12072007 11172007
09282007 $0375 09052007 09072007 07202007
06292007 $0375 06062007 06082007 05092007
03302007 $030 03072007 03092007 02032007
01022007 $030 12062006 12082006 11182006
09292006 $030 09062006 09082006 07222006
06302006 $030 06072006 06092006 0504200603312006 $026 03082006 03102006 02042006
01032006 $026 12072005 12092005 11192005
09302005 $026 09072005 09092005 07232005
06302005 $026 06082005 06102005 05052005
03312005 $023 03092005 03112005 01282005
PEPSICO INC Income Statement
ViewAnnual Data | Quarterly Data
Period EndingQ3FY09 Q2 FY09 Q1 FY09 Q4 FY08 Q3 FY08
Net SalesRevenues 1108 B 1059 B 826 B 1273 B 1124 B
Cost of Goods Sold (ExcludingDepreciation)
476 B 452 B 344 B 617 B 490 B
Depreciation Depletion andAmortization
42200M
37100 M 31400 M 2100 M 37700 M
Gross Income 590 B 570 B 451 B 654 B 596 B
Selling General amp Admin Expenses 365 B 350 B 290 B 532 B 398 B
Other Operating Expense 157 B 161 B 144 B 152 B 142 B
842019 Pepsi and Coca-cola(RH6802B54)
httpslidepdfcomreaderfullpepsi-and-coca-colarh6802b54 1522
Period EndingQ3FY09 Q2 FY09 Q1 FY09 Q4 FY08 Q3 FY08
Net SalesRevenues 1108 B 1059 B 826 B 1273 B 1124 B
Operating Income 223 B 220 B 161 B 121 B 198 B
Extraordinary Credit - Pretax 9300 M 000 000 000 000
Extraordinary Charge - Pretax 000 20900 M 9100 M 90800 M 17600 M
Pretax Equity in Earnings 000 000 000 000 000
Other IncomeExpenses - Net 1600 M 42400 M 200 M 90800 M 19200 M
Pretax Income 216 B 212 B 149 B 108 B 192 B
Income Taxes 57500M
56800 M 37400 M 29300 M 55000 M
Minority Interest 1600 M 800 M 600 M 000 000
Equity in Earnings 000 000 000 000 000
Discontinued Operations 000 000 000 000 000
Net Income Before ExtraItemsPreferred Div
172 B 166 B 114 B 71900 M 158 B
Extra Items amp Gain (Loss) Sale of Assets
000 000 000 000 000
Net Income Before PreferredDividends
172 B 166 B 114 B 71900 M 158 B
Preferred Dividend Requirements 000 100 M 300 M 000 200 M
Net Income Used to CalculateDiluted EPS
mdash mdash mdash mdash mdash
Net Income Used to Calculate BasicEPS
mdash mdash mdash mdash mdash
Net Income Available to Common 172 B 166 B 114 B 71900 M 157 B
Period Ending FY2008 FY2007 FY2006 FY2005 FY2004
Net SalesRevenues 4325 B 3947 B 3514 B 3256 B 2926 B
Cost of Goods Sold (ExcludingDepreciation)
1878 B 1667 B 1452 B 1302 B 1229 B
Depreciation Depletion andAmortization
154 B 143 B 141 B 131 B 126 B
Gross Income 2292 B 2138 B 1921 B 1824 B 1571 B
Selling General amp AdminExpenses
1545 B 1411 B 1277 B 1231 B 1030 B
Other Operating Expense 000 000 000 000 000
Operating Expenses - Total 157 B 161 B 144 B 152 B 142 B
Operating Income 748 B 727 B 644 B 592 B 541 B
Extraordinary Credit - Pretax 000 000 000 000 000
842019 Pepsi and Coca-cola(RH6802B54)
httpslidepdfcomreaderfullpepsi-and-coca-colarh6802b54 1622
Period EndingQ3FY09 Q2 FY09 Q1 FY09 Q4 FY08 Q3 FY08
Net SalesRevenues 1108 B 1059 B 826 B 1273 B 1124 B
Extraordinary Charge - Pretax 54300
M
10200 M 15000 M 20600 M mdash
Non-operating Interest Income 4100 M 12500 M 17300 M 15900 M 7400 M
Reserves Inc (Dec) 000 000 000 000 000
Pretax Equity in Earnings 000 000 000 000 000
Other IncomeExpenses - Net 000 000 000 000 000
Earnings Before Interest amp Taxes(EBIT)
698 B 730 B 661 B 608 B 533 B
Interest Expenses On Debt 34300M
24500 M 25500 M 26100 M 16900 M
Interest Capitalized 1400 M 2100 M 1600 M 500 M 200 MPretax Income 665 B 707 B 637 B 582 B 517 B
Income Taxes 188 B 197 B 135 B 230 B 137 B
Current Domestic Income Tax 90200M
153 B 83200 M 176 B 110 B
Current Foreign Income Tax 73200M
48900M
56900 M 42600 M 25600 M
Deferred Domestic Income Tax 31400M
2400 M -3800 M 14800 M 1200 M
Deferred Foreign Income Tax -6900M
-6600M
-1600 M -2600 M 500 M
Income Tax Credits mdash mdash mdash mdash mdash
Minority Interest 000 000 000 000 000
Equity in Earnings 37400M
56000 M 61600 M 55700 M 38000 M
After Tax Income Expense 000 000 000 000 000
Discontinued Operations 000 000 000 000 3800 M
Net Income Before ExtraItemsPreferred Div
514 B 566 B 564 B 408 B 421 B
Extra Items amp Gain (Loss) Sale of Assets
000 000 000 000 000
Net Income Before PreferredDividends
514 B 566 B 564 B 408 B 421 B
Preferred Dividend Requirements 1000 M 1200 M 1100 M 1800 M 2500 M
Net Income Available to Common 514 B 566 B 564 B 408 B 421 B
Seasonal Performance Data PEP
Returns Jan Feb Mar Apr May Jun Jul Aug Sep Oct Nov Dec
AvgReturns -289 -033 154 024 252 -224 316 200 373 -293 095 006
Times PEP Stock Price 49 45 56 51 54 46 57 58 58 52 54 50
842019 Pepsi and Coca-cola(RH6802B54)
httpslidepdfcomreaderfullpepsi-and-coca-colarh6802b54 1722
Returns Jan Feb Mar Apr May Jun Jul Aug Sep Oct Nov Dec
Increased
Times PEP Stock PriceUnchanged
0 0 1 0 2 1 1 0 0 0 1 1
Times PEP Stock Price
Decreased52 51 52 52 50 61 47 53 44 59 47 54
2009 -828 -415 694 -333 460 559 326 -013 351 322 276 acirceurordquo
2008 -1015 201 386 -514 -033 -689 467 288 407 -2000 -053 -339
2007 430 -319 065 398 339 -508 119 367 769 063 469 -165
2006 -321 338 -222 078 381 -068 556 300 -002 -278 -231 094
2005 287 030 -153 492 111 -413 111 059 339 427 012 -019
2004 acirceurordquo acirceurordquo acirceurordquo acirceurordquo acirceurordquo acirceurordquo acirceurordquo acirceurordquo acirceurordquo acirceurordquo acirceurordquo 459
PepsiCo (PEP) Dividend Stock Analysis
PepsiCo Inc manufactures markets and sells various snacks carbonated and non-carbonated
beverages and foods worldwidePepsiCo is a major component of the SampP 500 Dow Industrials and
the Dividend Aristocrats Indexes PepsiCo has been consistently increasing its dividends for 36
consecutive years From the end of 1998 up until December 2008 this dividend growth stock has
delivered a 470 annual average total return to its shareholders
At the same time company has managed to deliver a 990 average annual increase in its EPS since
1999
842019 Pepsi and Coca-cola(RH6802B54)
httpslidepdfcomreaderfullpepsi-and-coca-colarh6802b54 1822
The ROE has remained largely between 31 and 38 with the exception of 2004 when it fell to as
low as 22
Annual dividend payments have increased by an average of 1350 annually since 1999 which is
much higher than the growth in EPS Analysts are expecting slight increase in EPS for 2009
compared to 2008 given the sluggish state of North American economies The strong US dollar could
potentially hurt sales as over 44 of PepsiCorsquos revenues are derived internationally
A 1350 growth in dividends translates into the dividend payment doubling almost every five years
Since 1978 PepsiCo has actually managed to double its dividend payment every six years on average
The dividend payout has remained in a range between 31 and 42 In 2008 the dividend payout
ratio has surged to 51 A lower payout is always a plus since it leaves room for consistent dividend
growth minimizing the impact of short-term fluctuations in earnings The slow growth in earnings
could put future dividend increases at risk
842019 Pepsi and Coca-cola(RH6802B54)
httpslidepdfcomreaderfullpepsi-and-coca-colarh6802b54 1922
842019 Pepsi and Coca-cola(RH6802B54)
httpslidepdfcomreaderfullpepsi-and-coca-colarh6802b54 2022
Though carbonated soft drinks remain the most popular beverage PEP recognizes that non-carbonated soft drinks are a faster growing category The company is focusing on the health andwellness trends It has eliminated trans fats from many of its snack foods and is introducing ldquogoodforyourdquo foods under the Quaker Oats brand Risks include the highly competitive and very maturenature of it products also with more exposure to foreign markets political and currency risks alsoincrease
Conclusion PEP did not earn any Stars in the Fair Value section earned two Stars in the DividendAnalytical Data section and earned one Star in the Dividend Income vs MMA section for a total of three Stars This quantitatively ranks PEP as a 3 Star-Hold
Using my D4L-PreScreenxls model I determined the share price could increase to $6562 beforePEPrsquos NPV MMA Differential fell to the $500 that I like to see for a stock with 37 consecutive yearsof dividend increases At that price the stock would yield 270
Resetting the D4L-PreScreenxls model and solving for the dividend growth rate needed to generatethe target $500 NPV MMA Differential the calculated rate is 63 This dividend growth rate is
lower than the the 76 used in this analysis thus providing a margin of safety PEP has a risk rating of 100 which classifies it as a low risk stock
Like its competition Coca-Cola (KO) PEPrsquos Free Cash Flow Payout currently at 70 tends toremain higher than the 60 level that I prefer However this is mitigated to an extent by relativelylow debt levels and predictable cash flows PEP is a stock I will buy as my allocation allows andwhen it dips below its buy price of $5510 For additional information including the stockrsquos dividendhistory please refer to its data page
Stock price of last five years with monthly price list
842019 Pepsi and Coca-cola(RH6802B54)
httpslidepdfcomreaderfullpepsi-and-coca-colarh6802b54 2122
PRICES
Date Open High Low Close Volume Adj Close
4-Dec-09 6318 6400 6308 6385 8907000 6385
3-Dec-09 6358 6359 6267 6276 6406200 6276
2-Dec-09 6350 6374 6317 6365 6195800 6365
2-Dec-09 $ 045 Dividend
1-Dec-09 6268 6393 6249 6387 6887700 6342
30-Nov-09 6264 6283 6215 6222 7252700 6178
27-Nov-09 6224 6255 6175 6230 3416000 6186
25-Nov-09 6253 6327 6249 6319 4672600 6274
24-Nov-09 6262 6265 6213 6250 4139700 6206
23-Nov-09 6246 6299 6226 6249 5009400 6205
20-Nov-09 6167 6231 6143 6208 5314600 6164
19-Nov-09 6210 6210 6135 6188 4390400 6144
18-Nov-09 6244 6251 6181 6230 3952300 6186
17-Nov-09 6242 6263 6203 6260 4362400 6216
16-Nov-09 6221 6249 6194 6243 4966800 6199
13-Nov-09 6163 6213 6135 6194 6411100 6150
12-Nov-09 6249 6275 6110 6127 8474900 6084
11-Nov-09 6234 6268 6208 6260 4714300 6216
10-Nov-09 6217 6294 6193 6208 7094100 6164
9-Nov-09 6181 6232 6143 6228 6921800 6184
6-Nov-09 6099 6176 6079 6176 4831000 6132
5-Nov-09 6044 6141 6042 6123 5578500 6080
4-Nov-09 6016 6096 5979 6038 5552100 5995
3-Nov-09 6029 6039 5962 6006 5797000 5964
2-Nov-09 6079 6107 6016 6060 6618800 601730-Oct-09 6135 6164 6037 6055 7794100 6012
29-Oct-09 6101 6146 6057 6139 5245300 6096
28-Oct-09 6088 6152 6075 6099 6321900 6056
27-Oct-09 6064 6135 6010 6100 7262900 6057
26-Oct-09 6114 6150 6021 6047 5113000 6004
23-Oct-09 6141 6167 6058 6103 6505200 6060
22-Oct-09 6190 6190 6087 6150 5428100 6107
21-Oct-09 6138 6234 6123 6184 7445000 6140
20-Oct-09 6200 6205 6112 6158 8068000 6115
19-Oct-09 6228 6257 6190 6205 5557300 616116-Oct-09 6247 6268 6211 6229 6588400 6185
15-Oct-09 6157 6275 6139 6268 10518600 6224
14-Oct-09 6094 6168 6070 6162 8462200 6119
13-Oct-09 6088 6100 6052 6060 7502000 6017
12-Oct-09 6043 6136 6025 6092 6178100 6049
9-Oct-09 6038 6070 5981 6059 6360200 6016
8-Oct-09 6124 6124 5980 6039 17263400 5996
7-Oct-09 6085 6138 6045 6117 6441900 6074
6-Oct-09 6105 6127 6042 6087 8128900 6044
5-Oct-09 6083 6124 6014 6085 7892000 60422-Oct-09 5912 6124 5893 6090 17530200 6047
1-Oct-09 5870 5899 5827 5846 9010200 5805
30-Sep-09 5874 5886 5801 5866 8898400 5825
29-Sep-09 5910 5931 5800 5851 7086400 5810
28-Sep-09 5895 5949 5862 5903 4085900 5861
25-Sep-09 5850 5913 5832 5868 6758800 5827
842019 Pepsi and Coca-cola(RH6802B54)
httpslidepdfcomreaderfullpepsi-and-coca-colarh6802b54 2222
References
1 httpwwwcoca-colacomindexjsp2 httpfinanceaolcomquotesthe-coca-cola-companykonys
3 httpfinanceaolcomeventthe-pepsi-bottling-group-incpbgnys
4 httpfinanceyahoocomqs=ko
5 httpwwwdividendgrowthinvestorcom200906coca-cola-ko-dividend-
stock-analysishtml
6 httpfinanceyahoocomqs=ko
7 httpmoneycentralmsncomdetailstock_quoteSymbol=Ko
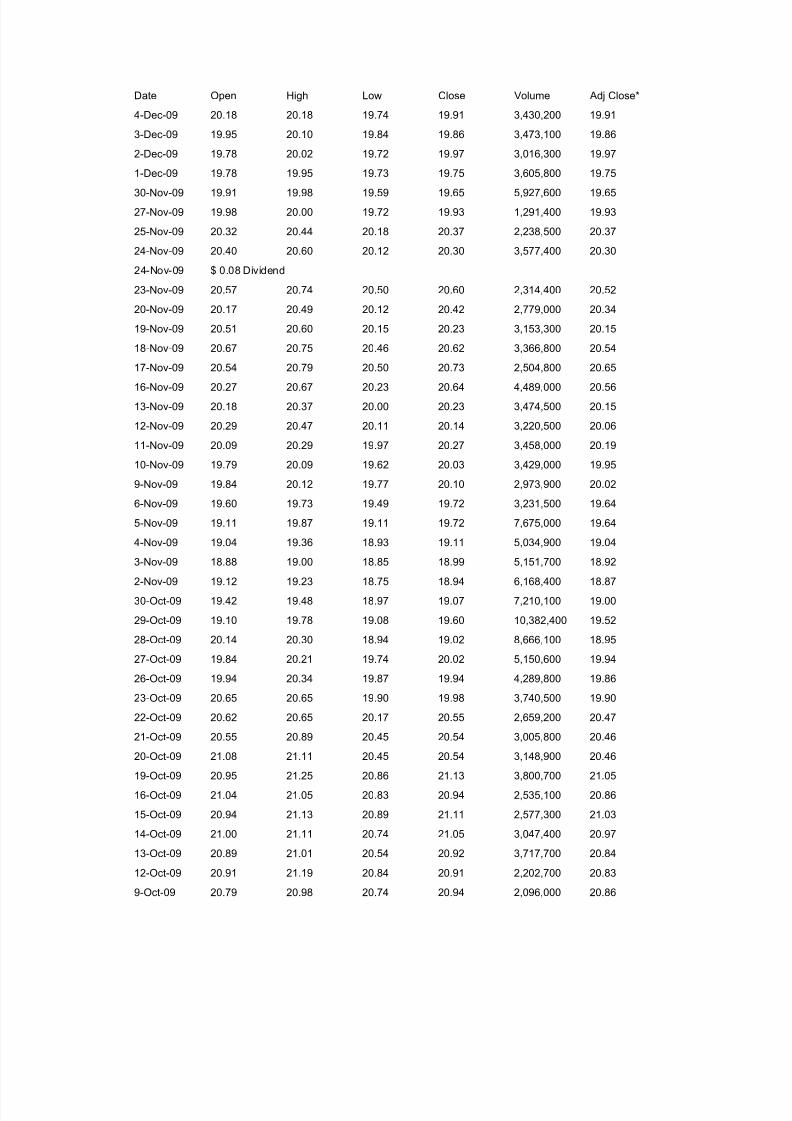
842019 Pepsi and Coca-cola(RH6802B54)
httpslidepdfcomreaderfullpepsi-and-coca-colarh6802b54 722
Date Open High Low Close Volume Adj Close
4-Dec-09 2018 2018 1974 1991 3430200 1991
3-Dec-09 1995 2010 1984 1986 3473100 1986
2-Dec-09 1978 2002 1972 1997 3016300 1997
1-Dec-09 1978 1995 1973 1975 3605800 1975
30-Nov-09 1991 1998 1959 1965 5927600 1965
27-Nov-09 1998 2000 1972 1993 1291400 1993
25-Nov-09 2032 2044 2018 2037 2238500 2037
24-Nov-09 2040 2060 2012 2030 3577400 2030
24-Nov-09 $ 008 Dividend
23-Nov-09 2057 2074 2050 2060 2314400 2052
20-Nov-09 2017 2049 2012 2042 2779000 2034
19-Nov-09 2051 2060 2015 2023 3153300 2015
18-Nov-09 2067 2075 2046 2062 3366800 2054
17-Nov-09 2054 2079 2050 2073 2504800 2065
16-Nov-09 2027 2067 2023 2064 4489000 2056
13-Nov-09 2018 2037 2000 2023 3474500 2015
12-Nov-09 2029 2047 2011 2014 3220500 2006
11-Nov-09 2009 2029 1997 2027 3458000 2019
10-Nov-09 1979 2009 1962 2003 3429000 1995
9-Nov-09 1984 2012 1977 2010 2973900 2002
6-Nov-09 1960 1973 1949 1972 3231500 1964
5-Nov-09 1911 1987 1911 1972 7675000 19644-Nov-09 1904 1936 1893 1911 5034900 1904
3-Nov-09 1888 1900 1885 1899 5151700 1892
2-Nov-09 1912 1923 1875 1894 6168400 1887
30-Oct-09 1942 1948 1897 1907 7210100 1900
29-Oct-09 1910 1978 1908 1960 10382400 1952
28-Oct-09 2014 2030 1894 1902 8666100 1895
27-Oct-09 1984 2021 1974 2002 5150600 1994
26-Oct-09 1994 2034 1987 1994 4289800 1986
23-Oct-09 2065 2065 1990 1998 3740500 199022-Oct-09 2062 2065 2017 2055 2659200 2047
21-Oct-09 2055 2089 2045 2054 3005800 2046
20-Oct-09 2108 2111 2045 2054 3148900 2046
19-Oct-09 2095 2125 2086 2113 3800700 2105
16-Oct-09 2104 2105 2083 2094 2535100 2086
15-Oct-09 2094 2113 2089 2111 2577300 2103
14-Oct-09 2100 2111 2074 2105 3047400 2097
13-Oct-09 2089 2101 2054 2092 3717700 2084
12-Oct-09 2091 2119 2084 2091 2202700 20839-Oct-09 2079 2098 2074 2094 2096000 2086
842019 Pepsi and Coca-cola(RH6802B54)
httpslidepdfcomreaderfullpepsi-and-coca-colarh6802b54 822
8-Oct-09 2098 2106 2072 2085 2825100 2077
7-Oct-09 2097 2100 2071 2093 2529600 2085
6-Oct-09 2100 2111 2076 2095 3373300 2087
5-Oct-09 2056 2096 2039 2096 3507200 2088
2-Oct-09 2027 2064 2007 2058 3896300 2050
1-Oct-09 2122 2123 2053 2056 5159100 2048
30-Sep-09 2098 2144 2072 2141 4954800 2133
29-Sep-09 2107 2115 2093 2103 2439000 2095
28-Sep-09 2092 2116 2083 2102 2258400 2094
25-Sep-09 2100 2113 2086 2090 1981800 2082
24-Sep-09 2114 2125 2085 2101 2772600 2093
23-Sep-09 2102 2142 2102 2111 4214200 2103
22-Sep-09 2103 2108 2079 2094 2747900 2086
21-Sep-09 2110 2115 2087 2097 4250300 2089
18-Sep-09 2112 2117 2085 2115 4861500 2107
17-Sep-09 2114 2114 2076 2099 4785000 2091
16-Sep-09 2090 2090 2031 2076 3932100 2068
15-Sep-09 2071 2089 2053 2087 3186700 2079
14-Sep-09 2033 2076 2018 2075 3813400 2067
11-Sep-09 2043 2052 2022 2045 2822800 2037
10-Sep-09 2012 2038 2000 2037 5223600 2029
9-Sep-09 2049 2049 1983 2010 5783700 2002
9-Sep-09 $ 008 Dividend8-Sep-09 2038 2051 2029 2050 4232400 2034
4-Sep-09 2026 2047 2015 2032 2756800 2016
3-Sep-09 2015 2032 1992 2030 2937400 2014
2-Sep-09 1987 2014 1975 2004 4132300 1988
Coca-Cola Dividend Stock Analysis
Coca-Cola has paid uninterrupted dividends on its common stock since 1893 and increased paymentsto common shareholders every year for 47 yearsFrom the end of 1998 up until December 2008 this dividend growth stock has delivered a negativeannual average total return of 210 to its shareholders The stock has largely traded between $65 and$40 over the past decade
842019 Pepsi and Coca-cola(RH6802B54)
httpslidepdfcomreaderfullpepsi-and-coca-colarh6802b54 922
The company has managed to deliver a 1090 average annual increase in its EPS between 1999 and2008 Analysts are expecting an increase in EPS to $305-$310 for 2009 and $325-$330 by 2010This would be a nice increase from the 2008 earnings per share of $249 Future drivers for earningscould be the companyrsquos tea coffee and water operations Cost savings initiatives could also add to the
bottom line over time
Some analysts believe that Coca Cola could follow arch rival Pepsi Corsquos (PEP) moves to acquire itsown bottlers in an effort to gain more control over the production and distribution of its beverages inkey markets Coke holds a 35 interest in its largest manufacturer and distributor of Coca Cola
products Coca-Cola Enterprises In (CCE) Coca-Cola Enterprises Inc accounts for about 40 of Cokersquos concentrate sales and 16 of the companyrsquos worldwide volume which makes it a likely targetof acquisition should Coca Cola decide to follow Pepsi Corsquos strategy of buying back its bottlingoperations
The Return on Equity has been in a decline after hitting a high in 2001 Rather than focus on absolute
842019 Pepsi and Coca-cola(RH6802B54)
httpslidepdfcomreaderfullpepsi-and-coca-colarh6802b54 1022
values for this indicator I generally want to see at least a stable return on equity over time
Annual dividends have increased by an average of 1010 annually since 1999 which is slightlylower than the growth in EPS The company last raised its dividend by 8 in February 2009 for the47th year in a row
A 10 growth in dividends translates into the dividend payment doubling every seven years If welook at historical data going as far back as 1969 The Coca Cola Company has indeed managed todouble its dividend payment every seven years on average
The dividend payout ratio remained above 50 for the majority of the past decade A lower payout isalways a plus since it leaves room for consistent dividend growth minimizing the impact of short-
842019 Pepsi and Coca-cola(RH6802B54)
httpslidepdfcomreaderfullpepsi-and-coca-colarh6802b54 1122
term fluctuations in earnings
Currently Coca Cola is trading at 20 times earnings and yields 330 In comparison arch rival in thecola wars Pepsi Co trades at a PE multiple of 165 and yields 340 Check my analysis of Pepsi Co
I believe that The Coca Cola Company is not as attractively valued at the moment as Pepsi Co Iwould consider adding to my position there if it can cover its dividends at least two times by itsearnings by the end of the year and if the PE ratio doesnrsquot increase above 20COCA COLA ENTERPRISES INC Dividends amp Splits
5 Year Dividend History
Payable AmountShare Ex-Date Record Declaration
12102009 $008 11242009 11272009 10282009
09242009 $008 09092009 09112009 07302009
06252009 $007 06102009 06122009 04222009
03262009 $007 03112009 03132009 02112009
12112008 $007 11252008 11282008 10232008
09252008 $007 09102008 09122008 07232008
06262008 $007 06112008 06132008 04232008
03272008 $007 03122008 03142008 02152008
12132007 $006 11282007 11302007 10252007
09272007 $006 09122007 09142007 07242007
06282007 $006 06132007 06152007 04252007
03292007 $006 03142007 03162007 02102007
12142006 $006 11292006 12012006 10262006
09282006 $006 09132006 09152006 07262006
06292006 $006 06142006 06162006 04262006
03302006 $006 03152006 03172006 02182006
12152005 $004 11302005 12022005 10262005
10032005 $004 09152005 09192005 07272005
07012005 $004 06152005 06172005 04272005
842019 Pepsi and Coca-cola(RH6802B54)
httpslidepdfcomreaderfullpepsi-and-coca-colarh6802b54 1222
Payable AmountShare Ex-Date Record Declaration
04012005 $004 03162005 03182005 02162005
Dividend Analysis
Looking at the last 5 years of dividends I have calculated an average highdividend yield of 197 However that seems a tad low considering that each of
the last 2 years is significantly higher than that amount If I average out just the
last 4 years of high dividend yields I come up with 273 Still lower than the
average high yield of the last 2 years
And now the dividend payout ratio Ah ha This explains how they were able to
increase dividends at 10 even when the fundamentals have not been growing
as quickly Look at the increase in the payout ratio It has grown from a low of
3415 in 1997 to a high of 5714 in 2006 It has just been a steady climb up
for the last 10 years
Using the 273 as an average high dividend yield I calculate a price of $4982
to be able to collect this average high dividend yield At close of Friday the
current price was $5280 That means a premium of 599 over the price I am
willing to pay
Conclusion
Well my analysis shows that Coca-Cola fundamentals have not been keeping up
with their very healthy dividend growth This has caused Coca-Cola to have to
payout more and more of its earnings to shareholders This concerns me
because eventually they will not be able to raise their dividend at these high
rates because their dividend payout ratio will be too high
I am sure that Warren Buffett is earning a healthy dividend on his KO stocks but
personally I would pass on this one today There are stocks out there that
continue to grow their fundamentals which will in turn allow them to grow their
dividends
bull COCA COLA ENTERPRISES INC Top Competitors
Symbol Company Name Last
Change
Change
Volume News
Charts
CCE COCA COLA ENTERPRISES INC 1986 -011 -055 347 M
PBG PEPSI BOTTLING GROUP INC 3819 -028 -073 310 M
PEP PEPSICO INC 6276 -089 -140 640 M
Pepsi
842019 Pepsi and Coca-cola(RH6802B54)
httpslidepdfcomreaderfullpepsi-and-coca-colarh6802b54 1322
Pepsi
Type Cola
Manufacturer PepsiCo
Country of origin United States
Introduced1898 (as Brads Drink)June 16 1903 (as Pepsi-Cola)
1961 (as Pepsi)
Related products
Coca-ColaFantaDr Pepper Sprite (soft drink)Irn BruCola TurkaBig Cola
History
Pepsi is a carbonated soft drink produced and manufactured by PepsiCo It is sold in many placessuch as retail stores restaurants schools cinemas and from vending machines The drink was firstmade in the 1890s by pharmacist Caleb Bradham in New Bern North Carolina The brand wastrademarked on June 16 1903 There have been many Pepsi variants produced over the years since1898
In October 2008 Pepsi announced that it would be redesigning its logo and re-branding many of its products by early 2009 In 2009 Pepsi Diet Pepsi and Pepsi Max began using all lower-case fonts for name brands and Diet Pepsi Max was re-branded as Pepsi Max The brands blue and red globetrademark became a series of smiles with the central white band arcing at different angles
depending on the product Pepsi in countries such as the US Canada Brazil Bolivia Guatemala Nicaragua Honduras El Salvador Colombia Argentina Puerto Rico and Australia is carrying thesmile logo while the rest of the countries continue to use the old design on all packagingIn mid-September 2009the new logo has started to appear on 300 and 600ml bottles of Pepsi inAustralia Pepsi Max bottles still carry the current logo as of 27th September
Large Block Holder Type Number
Institutions 1764 Total Number of Shares Held156 B of Shares Owned by all Large Block Holders10000
Mutual Fund 2759
Other Major 25
Total Number of LargeBlock Holders 4548
842019 Pepsi and Coca-cola(RH6802B54)
httpslidepdfcomreaderfullpepsi-and-coca-colarh6802b54 1422
PEPSICO INC Dividends amp Splits
Upcoming Dividends
Payable AmountShare Ex-Date Record Declaration Set Alert
010410 $045 120209 120409 1113095 Year Dividend History
Payable AmountShare Ex-Date Record Declaration
01042010 $045 12022009 12042009 11162009
09302009 $045 09022009 09042009 08132009
06302009 $045 06032009 06052009 05062009
03312009 $0425 03042009 03062009 02072009
01022009 $0425 12032008 12052008 11172008
09302008 $0425 09032008 09052008 07192008
06302008 $0425 06042008 06062008 05082008
03312008 $0375 03052008 03072008 02022008
01022008 $0375 12052007 12072007 11172007
09282007 $0375 09052007 09072007 07202007
06292007 $0375 06062007 06082007 05092007
03302007 $030 03072007 03092007 02032007
01022007 $030 12062006 12082006 11182006
09292006 $030 09062006 09082006 07222006
06302006 $030 06072006 06092006 0504200603312006 $026 03082006 03102006 02042006
01032006 $026 12072005 12092005 11192005
09302005 $026 09072005 09092005 07232005
06302005 $026 06082005 06102005 05052005
03312005 $023 03092005 03112005 01282005
PEPSICO INC Income Statement
ViewAnnual Data | Quarterly Data
Period EndingQ3FY09 Q2 FY09 Q1 FY09 Q4 FY08 Q3 FY08
Net SalesRevenues 1108 B 1059 B 826 B 1273 B 1124 B
Cost of Goods Sold (ExcludingDepreciation)
476 B 452 B 344 B 617 B 490 B
Depreciation Depletion andAmortization
42200M
37100 M 31400 M 2100 M 37700 M
Gross Income 590 B 570 B 451 B 654 B 596 B
Selling General amp Admin Expenses 365 B 350 B 290 B 532 B 398 B
Other Operating Expense 157 B 161 B 144 B 152 B 142 B
842019 Pepsi and Coca-cola(RH6802B54)
httpslidepdfcomreaderfullpepsi-and-coca-colarh6802b54 1522
Period EndingQ3FY09 Q2 FY09 Q1 FY09 Q4 FY08 Q3 FY08
Net SalesRevenues 1108 B 1059 B 826 B 1273 B 1124 B
Operating Income 223 B 220 B 161 B 121 B 198 B
Extraordinary Credit - Pretax 9300 M 000 000 000 000
Extraordinary Charge - Pretax 000 20900 M 9100 M 90800 M 17600 M
Pretax Equity in Earnings 000 000 000 000 000
Other IncomeExpenses - Net 1600 M 42400 M 200 M 90800 M 19200 M
Pretax Income 216 B 212 B 149 B 108 B 192 B
Income Taxes 57500M
56800 M 37400 M 29300 M 55000 M
Minority Interest 1600 M 800 M 600 M 000 000
Equity in Earnings 000 000 000 000 000
Discontinued Operations 000 000 000 000 000
Net Income Before ExtraItemsPreferred Div
172 B 166 B 114 B 71900 M 158 B
Extra Items amp Gain (Loss) Sale of Assets
000 000 000 000 000
Net Income Before PreferredDividends
172 B 166 B 114 B 71900 M 158 B
Preferred Dividend Requirements 000 100 M 300 M 000 200 M
Net Income Used to CalculateDiluted EPS
mdash mdash mdash mdash mdash
Net Income Used to Calculate BasicEPS
mdash mdash mdash mdash mdash
Net Income Available to Common 172 B 166 B 114 B 71900 M 157 B
Period Ending FY2008 FY2007 FY2006 FY2005 FY2004
Net SalesRevenues 4325 B 3947 B 3514 B 3256 B 2926 B
Cost of Goods Sold (ExcludingDepreciation)
1878 B 1667 B 1452 B 1302 B 1229 B
Depreciation Depletion andAmortization
154 B 143 B 141 B 131 B 126 B
Gross Income 2292 B 2138 B 1921 B 1824 B 1571 B
Selling General amp AdminExpenses
1545 B 1411 B 1277 B 1231 B 1030 B
Other Operating Expense 000 000 000 000 000
Operating Expenses - Total 157 B 161 B 144 B 152 B 142 B
Operating Income 748 B 727 B 644 B 592 B 541 B
Extraordinary Credit - Pretax 000 000 000 000 000
842019 Pepsi and Coca-cola(RH6802B54)
httpslidepdfcomreaderfullpepsi-and-coca-colarh6802b54 1622
Period EndingQ3FY09 Q2 FY09 Q1 FY09 Q4 FY08 Q3 FY08
Net SalesRevenues 1108 B 1059 B 826 B 1273 B 1124 B
Extraordinary Charge - Pretax 54300
M
10200 M 15000 M 20600 M mdash
Non-operating Interest Income 4100 M 12500 M 17300 M 15900 M 7400 M
Reserves Inc (Dec) 000 000 000 000 000
Pretax Equity in Earnings 000 000 000 000 000
Other IncomeExpenses - Net 000 000 000 000 000
Earnings Before Interest amp Taxes(EBIT)
698 B 730 B 661 B 608 B 533 B
Interest Expenses On Debt 34300M
24500 M 25500 M 26100 M 16900 M
Interest Capitalized 1400 M 2100 M 1600 M 500 M 200 MPretax Income 665 B 707 B 637 B 582 B 517 B
Income Taxes 188 B 197 B 135 B 230 B 137 B
Current Domestic Income Tax 90200M
153 B 83200 M 176 B 110 B
Current Foreign Income Tax 73200M
48900M
56900 M 42600 M 25600 M
Deferred Domestic Income Tax 31400M
2400 M -3800 M 14800 M 1200 M
Deferred Foreign Income Tax -6900M
-6600M
-1600 M -2600 M 500 M
Income Tax Credits mdash mdash mdash mdash mdash
Minority Interest 000 000 000 000 000
Equity in Earnings 37400M
56000 M 61600 M 55700 M 38000 M
After Tax Income Expense 000 000 000 000 000
Discontinued Operations 000 000 000 000 3800 M
Net Income Before ExtraItemsPreferred Div
514 B 566 B 564 B 408 B 421 B
Extra Items amp Gain (Loss) Sale of Assets
000 000 000 000 000
Net Income Before PreferredDividends
514 B 566 B 564 B 408 B 421 B
Preferred Dividend Requirements 1000 M 1200 M 1100 M 1800 M 2500 M
Net Income Available to Common 514 B 566 B 564 B 408 B 421 B
Seasonal Performance Data PEP
Returns Jan Feb Mar Apr May Jun Jul Aug Sep Oct Nov Dec
AvgReturns -289 -033 154 024 252 -224 316 200 373 -293 095 006
Times PEP Stock Price 49 45 56 51 54 46 57 58 58 52 54 50
842019 Pepsi and Coca-cola(RH6802B54)
httpslidepdfcomreaderfullpepsi-and-coca-colarh6802b54 1722
Returns Jan Feb Mar Apr May Jun Jul Aug Sep Oct Nov Dec
Increased
Times PEP Stock PriceUnchanged
0 0 1 0 2 1 1 0 0 0 1 1
Times PEP Stock Price
Decreased52 51 52 52 50 61 47 53 44 59 47 54
2009 -828 -415 694 -333 460 559 326 -013 351 322 276 acirceurordquo
2008 -1015 201 386 -514 -033 -689 467 288 407 -2000 -053 -339
2007 430 -319 065 398 339 -508 119 367 769 063 469 -165
2006 -321 338 -222 078 381 -068 556 300 -002 -278 -231 094
2005 287 030 -153 492 111 -413 111 059 339 427 012 -019
2004 acirceurordquo acirceurordquo acirceurordquo acirceurordquo acirceurordquo acirceurordquo acirceurordquo acirceurordquo acirceurordquo acirceurordquo acirceurordquo 459
PepsiCo (PEP) Dividend Stock Analysis
PepsiCo Inc manufactures markets and sells various snacks carbonated and non-carbonated
beverages and foods worldwidePepsiCo is a major component of the SampP 500 Dow Industrials and
the Dividend Aristocrats Indexes PepsiCo has been consistently increasing its dividends for 36
consecutive years From the end of 1998 up until December 2008 this dividend growth stock has
delivered a 470 annual average total return to its shareholders
At the same time company has managed to deliver a 990 average annual increase in its EPS since
1999
842019 Pepsi and Coca-cola(RH6802B54)
httpslidepdfcomreaderfullpepsi-and-coca-colarh6802b54 1822
The ROE has remained largely between 31 and 38 with the exception of 2004 when it fell to as
low as 22
Annual dividend payments have increased by an average of 1350 annually since 1999 which is
much higher than the growth in EPS Analysts are expecting slight increase in EPS for 2009
compared to 2008 given the sluggish state of North American economies The strong US dollar could
potentially hurt sales as over 44 of PepsiCorsquos revenues are derived internationally
A 1350 growth in dividends translates into the dividend payment doubling almost every five years
Since 1978 PepsiCo has actually managed to double its dividend payment every six years on average
The dividend payout has remained in a range between 31 and 42 In 2008 the dividend payout
ratio has surged to 51 A lower payout is always a plus since it leaves room for consistent dividend
growth minimizing the impact of short-term fluctuations in earnings The slow growth in earnings
could put future dividend increases at risk
842019 Pepsi and Coca-cola(RH6802B54)
httpslidepdfcomreaderfullpepsi-and-coca-colarh6802b54 1922
842019 Pepsi and Coca-cola(RH6802B54)
httpslidepdfcomreaderfullpepsi-and-coca-colarh6802b54 2022
Though carbonated soft drinks remain the most popular beverage PEP recognizes that non-carbonated soft drinks are a faster growing category The company is focusing on the health andwellness trends It has eliminated trans fats from many of its snack foods and is introducing ldquogoodforyourdquo foods under the Quaker Oats brand Risks include the highly competitive and very maturenature of it products also with more exposure to foreign markets political and currency risks alsoincrease
Conclusion PEP did not earn any Stars in the Fair Value section earned two Stars in the DividendAnalytical Data section and earned one Star in the Dividend Income vs MMA section for a total of three Stars This quantitatively ranks PEP as a 3 Star-Hold
Using my D4L-PreScreenxls model I determined the share price could increase to $6562 beforePEPrsquos NPV MMA Differential fell to the $500 that I like to see for a stock with 37 consecutive yearsof dividend increases At that price the stock would yield 270
Resetting the D4L-PreScreenxls model and solving for the dividend growth rate needed to generatethe target $500 NPV MMA Differential the calculated rate is 63 This dividend growth rate is
lower than the the 76 used in this analysis thus providing a margin of safety PEP has a risk rating of 100 which classifies it as a low risk stock
Like its competition Coca-Cola (KO) PEPrsquos Free Cash Flow Payout currently at 70 tends toremain higher than the 60 level that I prefer However this is mitigated to an extent by relativelylow debt levels and predictable cash flows PEP is a stock I will buy as my allocation allows andwhen it dips below its buy price of $5510 For additional information including the stockrsquos dividendhistory please refer to its data page
Stock price of last five years with monthly price list
842019 Pepsi and Coca-cola(RH6802B54)
httpslidepdfcomreaderfullpepsi-and-coca-colarh6802b54 2122
PRICES
Date Open High Low Close Volume Adj Close
4-Dec-09 6318 6400 6308 6385 8907000 6385
3-Dec-09 6358 6359 6267 6276 6406200 6276
2-Dec-09 6350 6374 6317 6365 6195800 6365
2-Dec-09 $ 045 Dividend
1-Dec-09 6268 6393 6249 6387 6887700 6342
30-Nov-09 6264 6283 6215 6222 7252700 6178
27-Nov-09 6224 6255 6175 6230 3416000 6186
25-Nov-09 6253 6327 6249 6319 4672600 6274
24-Nov-09 6262 6265 6213 6250 4139700 6206
23-Nov-09 6246 6299 6226 6249 5009400 6205
20-Nov-09 6167 6231 6143 6208 5314600 6164
19-Nov-09 6210 6210 6135 6188 4390400 6144
18-Nov-09 6244 6251 6181 6230 3952300 6186
17-Nov-09 6242 6263 6203 6260 4362400 6216
16-Nov-09 6221 6249 6194 6243 4966800 6199
13-Nov-09 6163 6213 6135 6194 6411100 6150
12-Nov-09 6249 6275 6110 6127 8474900 6084
11-Nov-09 6234 6268 6208 6260 4714300 6216
10-Nov-09 6217 6294 6193 6208 7094100 6164
9-Nov-09 6181 6232 6143 6228 6921800 6184
6-Nov-09 6099 6176 6079 6176 4831000 6132
5-Nov-09 6044 6141 6042 6123 5578500 6080
4-Nov-09 6016 6096 5979 6038 5552100 5995
3-Nov-09 6029 6039 5962 6006 5797000 5964
2-Nov-09 6079 6107 6016 6060 6618800 601730-Oct-09 6135 6164 6037 6055 7794100 6012
29-Oct-09 6101 6146 6057 6139 5245300 6096
28-Oct-09 6088 6152 6075 6099 6321900 6056
27-Oct-09 6064 6135 6010 6100 7262900 6057
26-Oct-09 6114 6150 6021 6047 5113000 6004
23-Oct-09 6141 6167 6058 6103 6505200 6060
22-Oct-09 6190 6190 6087 6150 5428100 6107
21-Oct-09 6138 6234 6123 6184 7445000 6140
20-Oct-09 6200 6205 6112 6158 8068000 6115
19-Oct-09 6228 6257 6190 6205 5557300 616116-Oct-09 6247 6268 6211 6229 6588400 6185
15-Oct-09 6157 6275 6139 6268 10518600 6224
14-Oct-09 6094 6168 6070 6162 8462200 6119
13-Oct-09 6088 6100 6052 6060 7502000 6017
12-Oct-09 6043 6136 6025 6092 6178100 6049
9-Oct-09 6038 6070 5981 6059 6360200 6016
8-Oct-09 6124 6124 5980 6039 17263400 5996
7-Oct-09 6085 6138 6045 6117 6441900 6074
6-Oct-09 6105 6127 6042 6087 8128900 6044
5-Oct-09 6083 6124 6014 6085 7892000 60422-Oct-09 5912 6124 5893 6090 17530200 6047
1-Oct-09 5870 5899 5827 5846 9010200 5805
30-Sep-09 5874 5886 5801 5866 8898400 5825
29-Sep-09 5910 5931 5800 5851 7086400 5810
28-Sep-09 5895 5949 5862 5903 4085900 5861
25-Sep-09 5850 5913 5832 5868 6758800 5827
842019 Pepsi and Coca-cola(RH6802B54)
httpslidepdfcomreaderfullpepsi-and-coca-colarh6802b54 2222
References
1 httpwwwcoca-colacomindexjsp2 httpfinanceaolcomquotesthe-coca-cola-companykonys
3 httpfinanceaolcomeventthe-pepsi-bottling-group-incpbgnys
4 httpfinanceyahoocomqs=ko
5 httpwwwdividendgrowthinvestorcom200906coca-cola-ko-dividend-
stock-analysishtml
6 httpfinanceyahoocomqs=ko
7 httpmoneycentralmsncomdetailstock_quoteSymbol=Ko
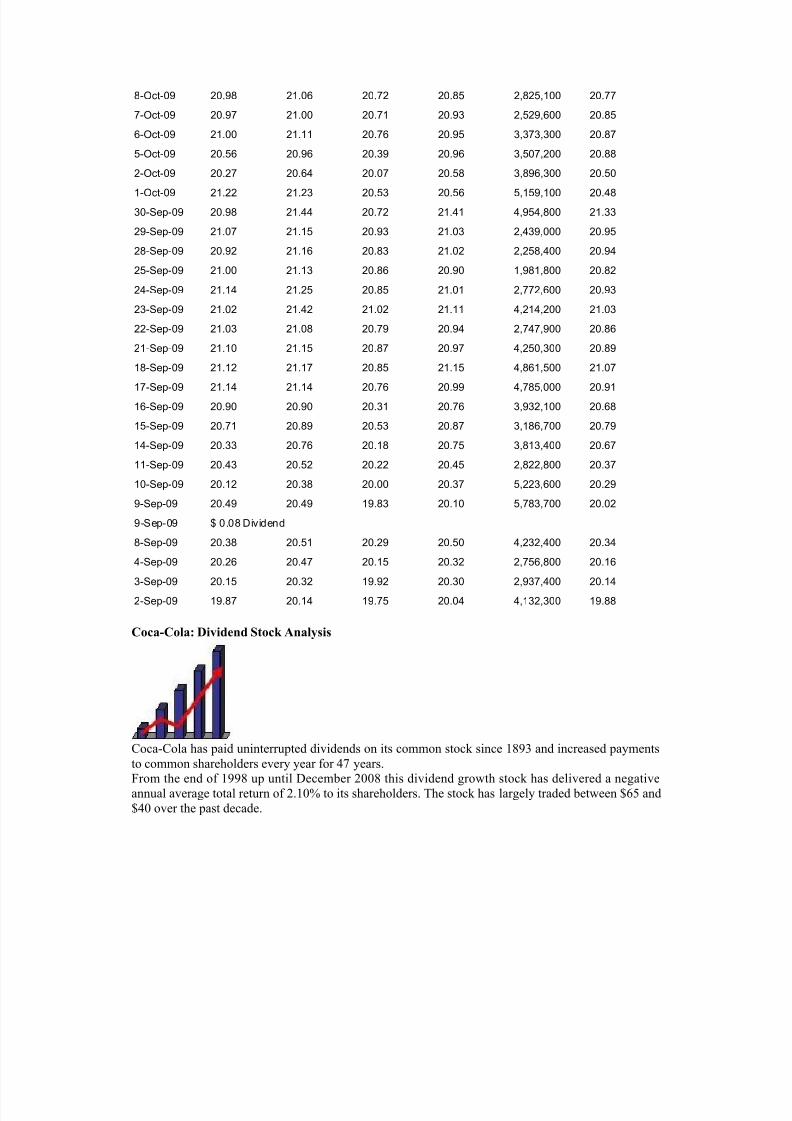
842019 Pepsi and Coca-cola(RH6802B54)
httpslidepdfcomreaderfullpepsi-and-coca-colarh6802b54 822
8-Oct-09 2098 2106 2072 2085 2825100 2077
7-Oct-09 2097 2100 2071 2093 2529600 2085
6-Oct-09 2100 2111 2076 2095 3373300 2087
5-Oct-09 2056 2096 2039 2096 3507200 2088
2-Oct-09 2027 2064 2007 2058 3896300 2050
1-Oct-09 2122 2123 2053 2056 5159100 2048
30-Sep-09 2098 2144 2072 2141 4954800 2133
29-Sep-09 2107 2115 2093 2103 2439000 2095
28-Sep-09 2092 2116 2083 2102 2258400 2094
25-Sep-09 2100 2113 2086 2090 1981800 2082
24-Sep-09 2114 2125 2085 2101 2772600 2093
23-Sep-09 2102 2142 2102 2111 4214200 2103
22-Sep-09 2103 2108 2079 2094 2747900 2086
21-Sep-09 2110 2115 2087 2097 4250300 2089
18-Sep-09 2112 2117 2085 2115 4861500 2107
17-Sep-09 2114 2114 2076 2099 4785000 2091
16-Sep-09 2090 2090 2031 2076 3932100 2068
15-Sep-09 2071 2089 2053 2087 3186700 2079
14-Sep-09 2033 2076 2018 2075 3813400 2067
11-Sep-09 2043 2052 2022 2045 2822800 2037
10-Sep-09 2012 2038 2000 2037 5223600 2029
9-Sep-09 2049 2049 1983 2010 5783700 2002
9-Sep-09 $ 008 Dividend8-Sep-09 2038 2051 2029 2050 4232400 2034
4-Sep-09 2026 2047 2015 2032 2756800 2016
3-Sep-09 2015 2032 1992 2030 2937400 2014
2-Sep-09 1987 2014 1975 2004 4132300 1988
Coca-Cola Dividend Stock Analysis
Coca-Cola has paid uninterrupted dividends on its common stock since 1893 and increased paymentsto common shareholders every year for 47 yearsFrom the end of 1998 up until December 2008 this dividend growth stock has delivered a negativeannual average total return of 210 to its shareholders The stock has largely traded between $65 and$40 over the past decade
842019 Pepsi and Coca-cola(RH6802B54)
httpslidepdfcomreaderfullpepsi-and-coca-colarh6802b54 922
The company has managed to deliver a 1090 average annual increase in its EPS between 1999 and2008 Analysts are expecting an increase in EPS to $305-$310 for 2009 and $325-$330 by 2010This would be a nice increase from the 2008 earnings per share of $249 Future drivers for earningscould be the companyrsquos tea coffee and water operations Cost savings initiatives could also add to the
bottom line over time
Some analysts believe that Coca Cola could follow arch rival Pepsi Corsquos (PEP) moves to acquire itsown bottlers in an effort to gain more control over the production and distribution of its beverages inkey markets Coke holds a 35 interest in its largest manufacturer and distributor of Coca Cola
products Coca-Cola Enterprises In (CCE) Coca-Cola Enterprises Inc accounts for about 40 of Cokersquos concentrate sales and 16 of the companyrsquos worldwide volume which makes it a likely targetof acquisition should Coca Cola decide to follow Pepsi Corsquos strategy of buying back its bottlingoperations
The Return on Equity has been in a decline after hitting a high in 2001 Rather than focus on absolute
842019 Pepsi and Coca-cola(RH6802B54)
httpslidepdfcomreaderfullpepsi-and-coca-colarh6802b54 1022
values for this indicator I generally want to see at least a stable return on equity over time
Annual dividends have increased by an average of 1010 annually since 1999 which is slightlylower than the growth in EPS The company last raised its dividend by 8 in February 2009 for the47th year in a row
A 10 growth in dividends translates into the dividend payment doubling every seven years If welook at historical data going as far back as 1969 The Coca Cola Company has indeed managed todouble its dividend payment every seven years on average
The dividend payout ratio remained above 50 for the majority of the past decade A lower payout isalways a plus since it leaves room for consistent dividend growth minimizing the impact of short-
842019 Pepsi and Coca-cola(RH6802B54)
httpslidepdfcomreaderfullpepsi-and-coca-colarh6802b54 1122
term fluctuations in earnings
Currently Coca Cola is trading at 20 times earnings and yields 330 In comparison arch rival in thecola wars Pepsi Co trades at a PE multiple of 165 and yields 340 Check my analysis of Pepsi Co
I believe that The Coca Cola Company is not as attractively valued at the moment as Pepsi Co Iwould consider adding to my position there if it can cover its dividends at least two times by itsearnings by the end of the year and if the PE ratio doesnrsquot increase above 20COCA COLA ENTERPRISES INC Dividends amp Splits
5 Year Dividend History
Payable AmountShare Ex-Date Record Declaration
12102009 $008 11242009 11272009 10282009
09242009 $008 09092009 09112009 07302009
06252009 $007 06102009 06122009 04222009
03262009 $007 03112009 03132009 02112009
12112008 $007 11252008 11282008 10232008
09252008 $007 09102008 09122008 07232008
06262008 $007 06112008 06132008 04232008
03272008 $007 03122008 03142008 02152008
12132007 $006 11282007 11302007 10252007
09272007 $006 09122007 09142007 07242007
06282007 $006 06132007 06152007 04252007
03292007 $006 03142007 03162007 02102007
12142006 $006 11292006 12012006 10262006
09282006 $006 09132006 09152006 07262006
06292006 $006 06142006 06162006 04262006
03302006 $006 03152006 03172006 02182006
12152005 $004 11302005 12022005 10262005
10032005 $004 09152005 09192005 07272005
07012005 $004 06152005 06172005 04272005
842019 Pepsi and Coca-cola(RH6802B54)
httpslidepdfcomreaderfullpepsi-and-coca-colarh6802b54 1222
Payable AmountShare Ex-Date Record Declaration
04012005 $004 03162005 03182005 02162005
Dividend Analysis
Looking at the last 5 years of dividends I have calculated an average highdividend yield of 197 However that seems a tad low considering that each of
the last 2 years is significantly higher than that amount If I average out just the
last 4 years of high dividend yields I come up with 273 Still lower than the
average high yield of the last 2 years
And now the dividend payout ratio Ah ha This explains how they were able to
increase dividends at 10 even when the fundamentals have not been growing
as quickly Look at the increase in the payout ratio It has grown from a low of
3415 in 1997 to a high of 5714 in 2006 It has just been a steady climb up
for the last 10 years
Using the 273 as an average high dividend yield I calculate a price of $4982
to be able to collect this average high dividend yield At close of Friday the
current price was $5280 That means a premium of 599 over the price I am
willing to pay
Conclusion
Well my analysis shows that Coca-Cola fundamentals have not been keeping up
with their very healthy dividend growth This has caused Coca-Cola to have to
payout more and more of its earnings to shareholders This concerns me
because eventually they will not be able to raise their dividend at these high
rates because their dividend payout ratio will be too high
I am sure that Warren Buffett is earning a healthy dividend on his KO stocks but
personally I would pass on this one today There are stocks out there that
continue to grow their fundamentals which will in turn allow them to grow their
dividends
bull COCA COLA ENTERPRISES INC Top Competitors
Symbol Company Name Last
Change
Change
Volume News
Charts
CCE COCA COLA ENTERPRISES INC 1986 -011 -055 347 M
PBG PEPSI BOTTLING GROUP INC 3819 -028 -073 310 M
PEP PEPSICO INC 6276 -089 -140 640 M
Pepsi
842019 Pepsi and Coca-cola(RH6802B54)
httpslidepdfcomreaderfullpepsi-and-coca-colarh6802b54 1322
Pepsi
Type Cola
Manufacturer PepsiCo
Country of origin United States
Introduced1898 (as Brads Drink)June 16 1903 (as Pepsi-Cola)
1961 (as Pepsi)
Related products
Coca-ColaFantaDr Pepper Sprite (soft drink)Irn BruCola TurkaBig Cola
History
Pepsi is a carbonated soft drink produced and manufactured by PepsiCo It is sold in many placessuch as retail stores restaurants schools cinemas and from vending machines The drink was firstmade in the 1890s by pharmacist Caleb Bradham in New Bern North Carolina The brand wastrademarked on June 16 1903 There have been many Pepsi variants produced over the years since1898
In October 2008 Pepsi announced that it would be redesigning its logo and re-branding many of its products by early 2009 In 2009 Pepsi Diet Pepsi and Pepsi Max began using all lower-case fonts for name brands and Diet Pepsi Max was re-branded as Pepsi Max The brands blue and red globetrademark became a series of smiles with the central white band arcing at different angles
depending on the product Pepsi in countries such as the US Canada Brazil Bolivia Guatemala Nicaragua Honduras El Salvador Colombia Argentina Puerto Rico and Australia is carrying thesmile logo while the rest of the countries continue to use the old design on all packagingIn mid-September 2009the new logo has started to appear on 300 and 600ml bottles of Pepsi inAustralia Pepsi Max bottles still carry the current logo as of 27th September
Large Block Holder Type Number
Institutions 1764 Total Number of Shares Held156 B of Shares Owned by all Large Block Holders10000
Mutual Fund 2759
Other Major 25
Total Number of LargeBlock Holders 4548
842019 Pepsi and Coca-cola(RH6802B54)
httpslidepdfcomreaderfullpepsi-and-coca-colarh6802b54 1422
PEPSICO INC Dividends amp Splits
Upcoming Dividends
Payable AmountShare Ex-Date Record Declaration Set Alert
010410 $045 120209 120409 1113095 Year Dividend History
Payable AmountShare Ex-Date Record Declaration
01042010 $045 12022009 12042009 11162009
09302009 $045 09022009 09042009 08132009
06302009 $045 06032009 06052009 05062009
03312009 $0425 03042009 03062009 02072009
01022009 $0425 12032008 12052008 11172008
09302008 $0425 09032008 09052008 07192008
06302008 $0425 06042008 06062008 05082008
03312008 $0375 03052008 03072008 02022008
01022008 $0375 12052007 12072007 11172007
09282007 $0375 09052007 09072007 07202007
06292007 $0375 06062007 06082007 05092007
03302007 $030 03072007 03092007 02032007
01022007 $030 12062006 12082006 11182006
09292006 $030 09062006 09082006 07222006
06302006 $030 06072006 06092006 0504200603312006 $026 03082006 03102006 02042006
01032006 $026 12072005 12092005 11192005
09302005 $026 09072005 09092005 07232005
06302005 $026 06082005 06102005 05052005
03312005 $023 03092005 03112005 01282005
PEPSICO INC Income Statement
ViewAnnual Data | Quarterly Data
Period EndingQ3FY09 Q2 FY09 Q1 FY09 Q4 FY08 Q3 FY08
Net SalesRevenues 1108 B 1059 B 826 B 1273 B 1124 B
Cost of Goods Sold (ExcludingDepreciation)
476 B 452 B 344 B 617 B 490 B
Depreciation Depletion andAmortization
42200M
37100 M 31400 M 2100 M 37700 M
Gross Income 590 B 570 B 451 B 654 B 596 B
Selling General amp Admin Expenses 365 B 350 B 290 B 532 B 398 B
Other Operating Expense 157 B 161 B 144 B 152 B 142 B
842019 Pepsi and Coca-cola(RH6802B54)
httpslidepdfcomreaderfullpepsi-and-coca-colarh6802b54 1522
Period EndingQ3FY09 Q2 FY09 Q1 FY09 Q4 FY08 Q3 FY08
Net SalesRevenues 1108 B 1059 B 826 B 1273 B 1124 B
Operating Income 223 B 220 B 161 B 121 B 198 B
Extraordinary Credit - Pretax 9300 M 000 000 000 000
Extraordinary Charge - Pretax 000 20900 M 9100 M 90800 M 17600 M
Pretax Equity in Earnings 000 000 000 000 000
Other IncomeExpenses - Net 1600 M 42400 M 200 M 90800 M 19200 M
Pretax Income 216 B 212 B 149 B 108 B 192 B
Income Taxes 57500M
56800 M 37400 M 29300 M 55000 M
Minority Interest 1600 M 800 M 600 M 000 000
Equity in Earnings 000 000 000 000 000
Discontinued Operations 000 000 000 000 000
Net Income Before ExtraItemsPreferred Div
172 B 166 B 114 B 71900 M 158 B
Extra Items amp Gain (Loss) Sale of Assets
000 000 000 000 000
Net Income Before PreferredDividends
172 B 166 B 114 B 71900 M 158 B
Preferred Dividend Requirements 000 100 M 300 M 000 200 M
Net Income Used to CalculateDiluted EPS
mdash mdash mdash mdash mdash
Net Income Used to Calculate BasicEPS
mdash mdash mdash mdash mdash
Net Income Available to Common 172 B 166 B 114 B 71900 M 157 B
Period Ending FY2008 FY2007 FY2006 FY2005 FY2004
Net SalesRevenues 4325 B 3947 B 3514 B 3256 B 2926 B
Cost of Goods Sold (ExcludingDepreciation)
1878 B 1667 B 1452 B 1302 B 1229 B
Depreciation Depletion andAmortization
154 B 143 B 141 B 131 B 126 B
Gross Income 2292 B 2138 B 1921 B 1824 B 1571 B
Selling General amp AdminExpenses
1545 B 1411 B 1277 B 1231 B 1030 B
Other Operating Expense 000 000 000 000 000
Operating Expenses - Total 157 B 161 B 144 B 152 B 142 B
Operating Income 748 B 727 B 644 B 592 B 541 B
Extraordinary Credit - Pretax 000 000 000 000 000
842019 Pepsi and Coca-cola(RH6802B54)
httpslidepdfcomreaderfullpepsi-and-coca-colarh6802b54 1622
Period EndingQ3FY09 Q2 FY09 Q1 FY09 Q4 FY08 Q3 FY08
Net SalesRevenues 1108 B 1059 B 826 B 1273 B 1124 B
Extraordinary Charge - Pretax 54300
M
10200 M 15000 M 20600 M mdash
Non-operating Interest Income 4100 M 12500 M 17300 M 15900 M 7400 M
Reserves Inc (Dec) 000 000 000 000 000
Pretax Equity in Earnings 000 000 000 000 000
Other IncomeExpenses - Net 000 000 000 000 000
Earnings Before Interest amp Taxes(EBIT)
698 B 730 B 661 B 608 B 533 B
Interest Expenses On Debt 34300M
24500 M 25500 M 26100 M 16900 M
Interest Capitalized 1400 M 2100 M 1600 M 500 M 200 MPretax Income 665 B 707 B 637 B 582 B 517 B
Income Taxes 188 B 197 B 135 B 230 B 137 B
Current Domestic Income Tax 90200M
153 B 83200 M 176 B 110 B
Current Foreign Income Tax 73200M
48900M
56900 M 42600 M 25600 M
Deferred Domestic Income Tax 31400M
2400 M -3800 M 14800 M 1200 M
Deferred Foreign Income Tax -6900M
-6600M
-1600 M -2600 M 500 M
Income Tax Credits mdash mdash mdash mdash mdash
Minority Interest 000 000 000 000 000
Equity in Earnings 37400M
56000 M 61600 M 55700 M 38000 M
After Tax Income Expense 000 000 000 000 000
Discontinued Operations 000 000 000 000 3800 M
Net Income Before ExtraItemsPreferred Div
514 B 566 B 564 B 408 B 421 B
Extra Items amp Gain (Loss) Sale of Assets
000 000 000 000 000
Net Income Before PreferredDividends
514 B 566 B 564 B 408 B 421 B
Preferred Dividend Requirements 1000 M 1200 M 1100 M 1800 M 2500 M
Net Income Available to Common 514 B 566 B 564 B 408 B 421 B
Seasonal Performance Data PEP
Returns Jan Feb Mar Apr May Jun Jul Aug Sep Oct Nov Dec
AvgReturns -289 -033 154 024 252 -224 316 200 373 -293 095 006
Times PEP Stock Price 49 45 56 51 54 46 57 58 58 52 54 50
842019 Pepsi and Coca-cola(RH6802B54)
httpslidepdfcomreaderfullpepsi-and-coca-colarh6802b54 1722
Returns Jan Feb Mar Apr May Jun Jul Aug Sep Oct Nov Dec
Increased
Times PEP Stock PriceUnchanged
0 0 1 0 2 1 1 0 0 0 1 1
Times PEP Stock Price
Decreased52 51 52 52 50 61 47 53 44 59 47 54
2009 -828 -415 694 -333 460 559 326 -013 351 322 276 acirceurordquo
2008 -1015 201 386 -514 -033 -689 467 288 407 -2000 -053 -339
2007 430 -319 065 398 339 -508 119 367 769 063 469 -165
2006 -321 338 -222 078 381 -068 556 300 -002 -278 -231 094
2005 287 030 -153 492 111 -413 111 059 339 427 012 -019
2004 acirceurordquo acirceurordquo acirceurordquo acirceurordquo acirceurordquo acirceurordquo acirceurordquo acirceurordquo acirceurordquo acirceurordquo acirceurordquo 459
PepsiCo (PEP) Dividend Stock Analysis
PepsiCo Inc manufactures markets and sells various snacks carbonated and non-carbonated
beverages and foods worldwidePepsiCo is a major component of the SampP 500 Dow Industrials and
the Dividend Aristocrats Indexes PepsiCo has been consistently increasing its dividends for 36
consecutive years From the end of 1998 up until December 2008 this dividend growth stock has
delivered a 470 annual average total return to its shareholders
At the same time company has managed to deliver a 990 average annual increase in its EPS since
1999
842019 Pepsi and Coca-cola(RH6802B54)
httpslidepdfcomreaderfullpepsi-and-coca-colarh6802b54 1822
The ROE has remained largely between 31 and 38 with the exception of 2004 when it fell to as
low as 22
Annual dividend payments have increased by an average of 1350 annually since 1999 which is
much higher than the growth in EPS Analysts are expecting slight increase in EPS for 2009
compared to 2008 given the sluggish state of North American economies The strong US dollar could
potentially hurt sales as over 44 of PepsiCorsquos revenues are derived internationally
A 1350 growth in dividends translates into the dividend payment doubling almost every five years
Since 1978 PepsiCo has actually managed to double its dividend payment every six years on average
The dividend payout has remained in a range between 31 and 42 In 2008 the dividend payout
ratio has surged to 51 A lower payout is always a plus since it leaves room for consistent dividend
growth minimizing the impact of short-term fluctuations in earnings The slow growth in earnings
could put future dividend increases at risk
842019 Pepsi and Coca-cola(RH6802B54)
httpslidepdfcomreaderfullpepsi-and-coca-colarh6802b54 1922
842019 Pepsi and Coca-cola(RH6802B54)
httpslidepdfcomreaderfullpepsi-and-coca-colarh6802b54 2022
Though carbonated soft drinks remain the most popular beverage PEP recognizes that non-carbonated soft drinks are a faster growing category The company is focusing on the health andwellness trends It has eliminated trans fats from many of its snack foods and is introducing ldquogoodforyourdquo foods under the Quaker Oats brand Risks include the highly competitive and very maturenature of it products also with more exposure to foreign markets political and currency risks alsoincrease
Conclusion PEP did not earn any Stars in the Fair Value section earned two Stars in the DividendAnalytical Data section and earned one Star in the Dividend Income vs MMA section for a total of three Stars This quantitatively ranks PEP as a 3 Star-Hold
Using my D4L-PreScreenxls model I determined the share price could increase to $6562 beforePEPrsquos NPV MMA Differential fell to the $500 that I like to see for a stock with 37 consecutive yearsof dividend increases At that price the stock would yield 270
Resetting the D4L-PreScreenxls model and solving for the dividend growth rate needed to generatethe target $500 NPV MMA Differential the calculated rate is 63 This dividend growth rate is
lower than the the 76 used in this analysis thus providing a margin of safety PEP has a risk rating of 100 which classifies it as a low risk stock
Like its competition Coca-Cola (KO) PEPrsquos Free Cash Flow Payout currently at 70 tends toremain higher than the 60 level that I prefer However this is mitigated to an extent by relativelylow debt levels and predictable cash flows PEP is a stock I will buy as my allocation allows andwhen it dips below its buy price of $5510 For additional information including the stockrsquos dividendhistory please refer to its data page
Stock price of last five years with monthly price list
842019 Pepsi and Coca-cola(RH6802B54)
httpslidepdfcomreaderfullpepsi-and-coca-colarh6802b54 2122
PRICES
Date Open High Low Close Volume Adj Close
4-Dec-09 6318 6400 6308 6385 8907000 6385
3-Dec-09 6358 6359 6267 6276 6406200 6276
2-Dec-09 6350 6374 6317 6365 6195800 6365
2-Dec-09 $ 045 Dividend
1-Dec-09 6268 6393 6249 6387 6887700 6342
30-Nov-09 6264 6283 6215 6222 7252700 6178
27-Nov-09 6224 6255 6175 6230 3416000 6186
25-Nov-09 6253 6327 6249 6319 4672600 6274
24-Nov-09 6262 6265 6213 6250 4139700 6206
23-Nov-09 6246 6299 6226 6249 5009400 6205
20-Nov-09 6167 6231 6143 6208 5314600 6164
19-Nov-09 6210 6210 6135 6188 4390400 6144
18-Nov-09 6244 6251 6181 6230 3952300 6186
17-Nov-09 6242 6263 6203 6260 4362400 6216
16-Nov-09 6221 6249 6194 6243 4966800 6199
13-Nov-09 6163 6213 6135 6194 6411100 6150
12-Nov-09 6249 6275 6110 6127 8474900 6084
11-Nov-09 6234 6268 6208 6260 4714300 6216
10-Nov-09 6217 6294 6193 6208 7094100 6164
9-Nov-09 6181 6232 6143 6228 6921800 6184
6-Nov-09 6099 6176 6079 6176 4831000 6132
5-Nov-09 6044 6141 6042 6123 5578500 6080
4-Nov-09 6016 6096 5979 6038 5552100 5995
3-Nov-09 6029 6039 5962 6006 5797000 5964
2-Nov-09 6079 6107 6016 6060 6618800 601730-Oct-09 6135 6164 6037 6055 7794100 6012
29-Oct-09 6101 6146 6057 6139 5245300 6096
28-Oct-09 6088 6152 6075 6099 6321900 6056
27-Oct-09 6064 6135 6010 6100 7262900 6057
26-Oct-09 6114 6150 6021 6047 5113000 6004
23-Oct-09 6141 6167 6058 6103 6505200 6060
22-Oct-09 6190 6190 6087 6150 5428100 6107
21-Oct-09 6138 6234 6123 6184 7445000 6140
20-Oct-09 6200 6205 6112 6158 8068000 6115
19-Oct-09 6228 6257 6190 6205 5557300 616116-Oct-09 6247 6268 6211 6229 6588400 6185
15-Oct-09 6157 6275 6139 6268 10518600 6224
14-Oct-09 6094 6168 6070 6162 8462200 6119
13-Oct-09 6088 6100 6052 6060 7502000 6017
12-Oct-09 6043 6136 6025 6092 6178100 6049
9-Oct-09 6038 6070 5981 6059 6360200 6016
8-Oct-09 6124 6124 5980 6039 17263400 5996
7-Oct-09 6085 6138 6045 6117 6441900 6074
6-Oct-09 6105 6127 6042 6087 8128900 6044
5-Oct-09 6083 6124 6014 6085 7892000 60422-Oct-09 5912 6124 5893 6090 17530200 6047
1-Oct-09 5870 5899 5827 5846 9010200 5805
30-Sep-09 5874 5886 5801 5866 8898400 5825
29-Sep-09 5910 5931 5800 5851 7086400 5810
28-Sep-09 5895 5949 5862 5903 4085900 5861
25-Sep-09 5850 5913 5832 5868 6758800 5827
842019 Pepsi and Coca-cola(RH6802B54)
httpslidepdfcomreaderfullpepsi-and-coca-colarh6802b54 2222
References
1 httpwwwcoca-colacomindexjsp2 httpfinanceaolcomquotesthe-coca-cola-companykonys
3 httpfinanceaolcomeventthe-pepsi-bottling-group-incpbgnys
4 httpfinanceyahoocomqs=ko
5 httpwwwdividendgrowthinvestorcom200906coca-cola-ko-dividend-
stock-analysishtml
6 httpfinanceyahoocomqs=ko
7 httpmoneycentralmsncomdetailstock_quoteSymbol=Ko
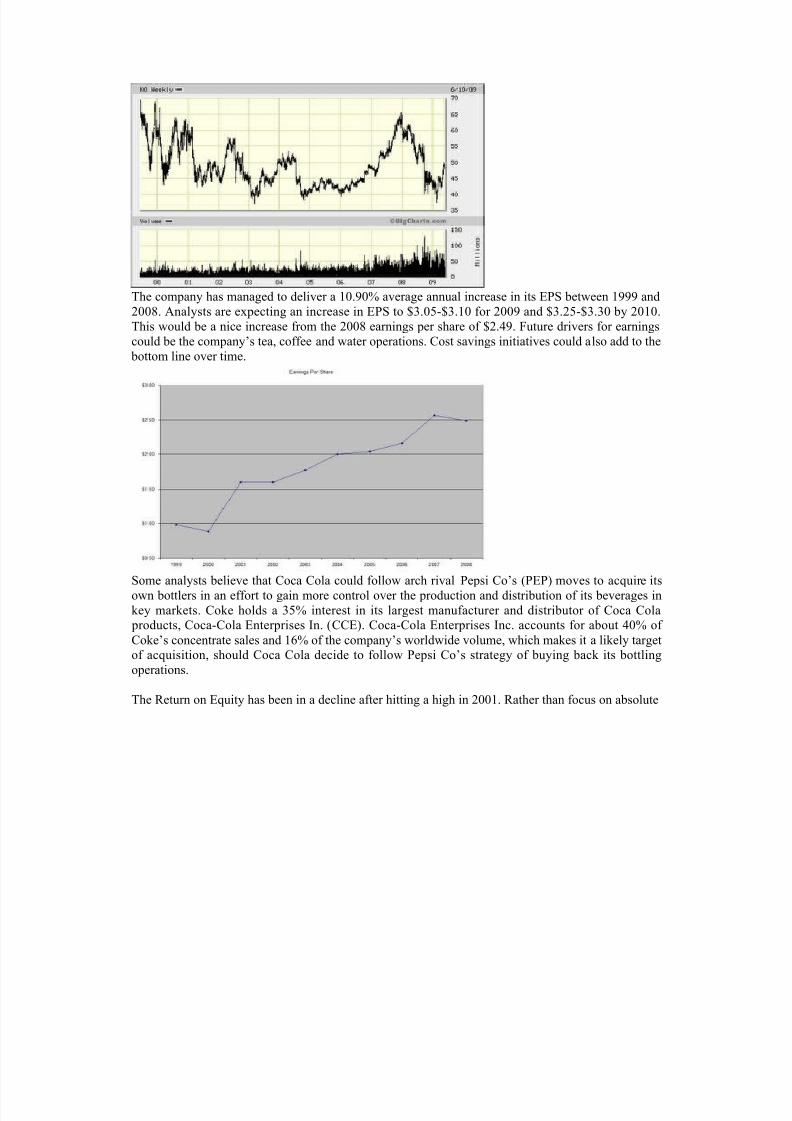
842019 Pepsi and Coca-cola(RH6802B54)
httpslidepdfcomreaderfullpepsi-and-coca-colarh6802b54 922
The company has managed to deliver a 1090 average annual increase in its EPS between 1999 and2008 Analysts are expecting an increase in EPS to $305-$310 for 2009 and $325-$330 by 2010This would be a nice increase from the 2008 earnings per share of $249 Future drivers for earningscould be the companyrsquos tea coffee and water operations Cost savings initiatives could also add to the
bottom line over time
Some analysts believe that Coca Cola could follow arch rival Pepsi Corsquos (PEP) moves to acquire itsown bottlers in an effort to gain more control over the production and distribution of its beverages inkey markets Coke holds a 35 interest in its largest manufacturer and distributor of Coca Cola
products Coca-Cola Enterprises In (CCE) Coca-Cola Enterprises Inc accounts for about 40 of Cokersquos concentrate sales and 16 of the companyrsquos worldwide volume which makes it a likely targetof acquisition should Coca Cola decide to follow Pepsi Corsquos strategy of buying back its bottlingoperations
The Return on Equity has been in a decline after hitting a high in 2001 Rather than focus on absolute
842019 Pepsi and Coca-cola(RH6802B54)
httpslidepdfcomreaderfullpepsi-and-coca-colarh6802b54 1022
values for this indicator I generally want to see at least a stable return on equity over time
Annual dividends have increased by an average of 1010 annually since 1999 which is slightlylower than the growth in EPS The company last raised its dividend by 8 in February 2009 for the47th year in a row
A 10 growth in dividends translates into the dividend payment doubling every seven years If welook at historical data going as far back as 1969 The Coca Cola Company has indeed managed todouble its dividend payment every seven years on average
The dividend payout ratio remained above 50 for the majority of the past decade A lower payout isalways a plus since it leaves room for consistent dividend growth minimizing the impact of short-
842019 Pepsi and Coca-cola(RH6802B54)
httpslidepdfcomreaderfullpepsi-and-coca-colarh6802b54 1122
term fluctuations in earnings
Currently Coca Cola is trading at 20 times earnings and yields 330 In comparison arch rival in thecola wars Pepsi Co trades at a PE multiple of 165 and yields 340 Check my analysis of Pepsi Co
I believe that The Coca Cola Company is not as attractively valued at the moment as Pepsi Co Iwould consider adding to my position there if it can cover its dividends at least two times by itsearnings by the end of the year and if the PE ratio doesnrsquot increase above 20COCA COLA ENTERPRISES INC Dividends amp Splits
5 Year Dividend History
Payable AmountShare Ex-Date Record Declaration
12102009 $008 11242009 11272009 10282009
09242009 $008 09092009 09112009 07302009
06252009 $007 06102009 06122009 04222009
03262009 $007 03112009 03132009 02112009
12112008 $007 11252008 11282008 10232008
09252008 $007 09102008 09122008 07232008
06262008 $007 06112008 06132008 04232008
03272008 $007 03122008 03142008 02152008
12132007 $006 11282007 11302007 10252007
09272007 $006 09122007 09142007 07242007
06282007 $006 06132007 06152007 04252007
03292007 $006 03142007 03162007 02102007
12142006 $006 11292006 12012006 10262006
09282006 $006 09132006 09152006 07262006
06292006 $006 06142006 06162006 04262006
03302006 $006 03152006 03172006 02182006
12152005 $004 11302005 12022005 10262005
10032005 $004 09152005 09192005 07272005
07012005 $004 06152005 06172005 04272005
842019 Pepsi and Coca-cola(RH6802B54)
httpslidepdfcomreaderfullpepsi-and-coca-colarh6802b54 1222
Payable AmountShare Ex-Date Record Declaration
04012005 $004 03162005 03182005 02162005
Dividend Analysis
Looking at the last 5 years of dividends I have calculated an average highdividend yield of 197 However that seems a tad low considering that each of
the last 2 years is significantly higher than that amount If I average out just the
last 4 years of high dividend yields I come up with 273 Still lower than the
average high yield of the last 2 years
And now the dividend payout ratio Ah ha This explains how they were able to
increase dividends at 10 even when the fundamentals have not been growing
as quickly Look at the increase in the payout ratio It has grown from a low of
3415 in 1997 to a high of 5714 in 2006 It has just been a steady climb up
for the last 10 years
Using the 273 as an average high dividend yield I calculate a price of $4982
to be able to collect this average high dividend yield At close of Friday the
current price was $5280 That means a premium of 599 over the price I am
willing to pay
Conclusion
Well my analysis shows that Coca-Cola fundamentals have not been keeping up
with their very healthy dividend growth This has caused Coca-Cola to have to
payout more and more of its earnings to shareholders This concerns me
because eventually they will not be able to raise their dividend at these high
rates because their dividend payout ratio will be too high
I am sure that Warren Buffett is earning a healthy dividend on his KO stocks but
personally I would pass on this one today There are stocks out there that
continue to grow their fundamentals which will in turn allow them to grow their
dividends
bull COCA COLA ENTERPRISES INC Top Competitors
Symbol Company Name Last
Change
Change
Volume News
Charts
CCE COCA COLA ENTERPRISES INC 1986 -011 -055 347 M
PBG PEPSI BOTTLING GROUP INC 3819 -028 -073 310 M
PEP PEPSICO INC 6276 -089 -140 640 M
Pepsi
842019 Pepsi and Coca-cola(RH6802B54)
httpslidepdfcomreaderfullpepsi-and-coca-colarh6802b54 1322
Pepsi
Type Cola
Manufacturer PepsiCo
Country of origin United States
Introduced1898 (as Brads Drink)June 16 1903 (as Pepsi-Cola)
1961 (as Pepsi)
Related products
Coca-ColaFantaDr Pepper Sprite (soft drink)Irn BruCola TurkaBig Cola
History
Pepsi is a carbonated soft drink produced and manufactured by PepsiCo It is sold in many placessuch as retail stores restaurants schools cinemas and from vending machines The drink was firstmade in the 1890s by pharmacist Caleb Bradham in New Bern North Carolina The brand wastrademarked on June 16 1903 There have been many Pepsi variants produced over the years since1898
In October 2008 Pepsi announced that it would be redesigning its logo and re-branding many of its products by early 2009 In 2009 Pepsi Diet Pepsi and Pepsi Max began using all lower-case fonts for name brands and Diet Pepsi Max was re-branded as Pepsi Max The brands blue and red globetrademark became a series of smiles with the central white band arcing at different angles
depending on the product Pepsi in countries such as the US Canada Brazil Bolivia Guatemala Nicaragua Honduras El Salvador Colombia Argentina Puerto Rico and Australia is carrying thesmile logo while the rest of the countries continue to use the old design on all packagingIn mid-September 2009the new logo has started to appear on 300 and 600ml bottles of Pepsi inAustralia Pepsi Max bottles still carry the current logo as of 27th September
Large Block Holder Type Number
Institutions 1764 Total Number of Shares Held156 B of Shares Owned by all Large Block Holders10000
Mutual Fund 2759
Other Major 25
Total Number of LargeBlock Holders 4548
842019 Pepsi and Coca-cola(RH6802B54)
httpslidepdfcomreaderfullpepsi-and-coca-colarh6802b54 1422
PEPSICO INC Dividends amp Splits
Upcoming Dividends
Payable AmountShare Ex-Date Record Declaration Set Alert
010410 $045 120209 120409 1113095 Year Dividend History
Payable AmountShare Ex-Date Record Declaration
01042010 $045 12022009 12042009 11162009
09302009 $045 09022009 09042009 08132009
06302009 $045 06032009 06052009 05062009
03312009 $0425 03042009 03062009 02072009
01022009 $0425 12032008 12052008 11172008
09302008 $0425 09032008 09052008 07192008
06302008 $0425 06042008 06062008 05082008
03312008 $0375 03052008 03072008 02022008
01022008 $0375 12052007 12072007 11172007
09282007 $0375 09052007 09072007 07202007
06292007 $0375 06062007 06082007 05092007
03302007 $030 03072007 03092007 02032007
01022007 $030 12062006 12082006 11182006
09292006 $030 09062006 09082006 07222006
06302006 $030 06072006 06092006 0504200603312006 $026 03082006 03102006 02042006
01032006 $026 12072005 12092005 11192005
09302005 $026 09072005 09092005 07232005
06302005 $026 06082005 06102005 05052005
03312005 $023 03092005 03112005 01282005
PEPSICO INC Income Statement
ViewAnnual Data | Quarterly Data
Period EndingQ3FY09 Q2 FY09 Q1 FY09 Q4 FY08 Q3 FY08
Net SalesRevenues 1108 B 1059 B 826 B 1273 B 1124 B
Cost of Goods Sold (ExcludingDepreciation)
476 B 452 B 344 B 617 B 490 B
Depreciation Depletion andAmortization
42200M
37100 M 31400 M 2100 M 37700 M
Gross Income 590 B 570 B 451 B 654 B 596 B
Selling General amp Admin Expenses 365 B 350 B 290 B 532 B 398 B
Other Operating Expense 157 B 161 B 144 B 152 B 142 B
842019 Pepsi and Coca-cola(RH6802B54)
httpslidepdfcomreaderfullpepsi-and-coca-colarh6802b54 1522
Period EndingQ3FY09 Q2 FY09 Q1 FY09 Q4 FY08 Q3 FY08
Net SalesRevenues 1108 B 1059 B 826 B 1273 B 1124 B
Operating Income 223 B 220 B 161 B 121 B 198 B
Extraordinary Credit - Pretax 9300 M 000 000 000 000
Extraordinary Charge - Pretax 000 20900 M 9100 M 90800 M 17600 M
Pretax Equity in Earnings 000 000 000 000 000
Other IncomeExpenses - Net 1600 M 42400 M 200 M 90800 M 19200 M
Pretax Income 216 B 212 B 149 B 108 B 192 B
Income Taxes 57500M
56800 M 37400 M 29300 M 55000 M
Minority Interest 1600 M 800 M 600 M 000 000
Equity in Earnings 000 000 000 000 000
Discontinued Operations 000 000 000 000 000
Net Income Before ExtraItemsPreferred Div
172 B 166 B 114 B 71900 M 158 B
Extra Items amp Gain (Loss) Sale of Assets
000 000 000 000 000
Net Income Before PreferredDividends
172 B 166 B 114 B 71900 M 158 B
Preferred Dividend Requirements 000 100 M 300 M 000 200 M
Net Income Used to CalculateDiluted EPS
mdash mdash mdash mdash mdash
Net Income Used to Calculate BasicEPS
mdash mdash mdash mdash mdash
Net Income Available to Common 172 B 166 B 114 B 71900 M 157 B
Period Ending FY2008 FY2007 FY2006 FY2005 FY2004
Net SalesRevenues 4325 B 3947 B 3514 B 3256 B 2926 B
Cost of Goods Sold (ExcludingDepreciation)
1878 B 1667 B 1452 B 1302 B 1229 B
Depreciation Depletion andAmortization
154 B 143 B 141 B 131 B 126 B
Gross Income 2292 B 2138 B 1921 B 1824 B 1571 B
Selling General amp AdminExpenses
1545 B 1411 B 1277 B 1231 B 1030 B
Other Operating Expense 000 000 000 000 000
Operating Expenses - Total 157 B 161 B 144 B 152 B 142 B
Operating Income 748 B 727 B 644 B 592 B 541 B
Extraordinary Credit - Pretax 000 000 000 000 000
842019 Pepsi and Coca-cola(RH6802B54)
httpslidepdfcomreaderfullpepsi-and-coca-colarh6802b54 1622
Period EndingQ3FY09 Q2 FY09 Q1 FY09 Q4 FY08 Q3 FY08
Net SalesRevenues 1108 B 1059 B 826 B 1273 B 1124 B
Extraordinary Charge - Pretax 54300
M
10200 M 15000 M 20600 M mdash
Non-operating Interest Income 4100 M 12500 M 17300 M 15900 M 7400 M
Reserves Inc (Dec) 000 000 000 000 000
Pretax Equity in Earnings 000 000 000 000 000
Other IncomeExpenses - Net 000 000 000 000 000
Earnings Before Interest amp Taxes(EBIT)
698 B 730 B 661 B 608 B 533 B
Interest Expenses On Debt 34300M
24500 M 25500 M 26100 M 16900 M
Interest Capitalized 1400 M 2100 M 1600 M 500 M 200 MPretax Income 665 B 707 B 637 B 582 B 517 B
Income Taxes 188 B 197 B 135 B 230 B 137 B
Current Domestic Income Tax 90200M
153 B 83200 M 176 B 110 B
Current Foreign Income Tax 73200M
48900M
56900 M 42600 M 25600 M
Deferred Domestic Income Tax 31400M
2400 M -3800 M 14800 M 1200 M
Deferred Foreign Income Tax -6900M
-6600M
-1600 M -2600 M 500 M
Income Tax Credits mdash mdash mdash mdash mdash
Minority Interest 000 000 000 000 000
Equity in Earnings 37400M
56000 M 61600 M 55700 M 38000 M
After Tax Income Expense 000 000 000 000 000
Discontinued Operations 000 000 000 000 3800 M
Net Income Before ExtraItemsPreferred Div
514 B 566 B 564 B 408 B 421 B
Extra Items amp Gain (Loss) Sale of Assets
000 000 000 000 000
Net Income Before PreferredDividends
514 B 566 B 564 B 408 B 421 B
Preferred Dividend Requirements 1000 M 1200 M 1100 M 1800 M 2500 M
Net Income Available to Common 514 B 566 B 564 B 408 B 421 B
Seasonal Performance Data PEP
Returns Jan Feb Mar Apr May Jun Jul Aug Sep Oct Nov Dec
AvgReturns -289 -033 154 024 252 -224 316 200 373 -293 095 006
Times PEP Stock Price 49 45 56 51 54 46 57 58 58 52 54 50
842019 Pepsi and Coca-cola(RH6802B54)
httpslidepdfcomreaderfullpepsi-and-coca-colarh6802b54 1722
Returns Jan Feb Mar Apr May Jun Jul Aug Sep Oct Nov Dec
Increased
Times PEP Stock PriceUnchanged
0 0 1 0 2 1 1 0 0 0 1 1
Times PEP Stock Price
Decreased52 51 52 52 50 61 47 53 44 59 47 54
2009 -828 -415 694 -333 460 559 326 -013 351 322 276 acirceurordquo
2008 -1015 201 386 -514 -033 -689 467 288 407 -2000 -053 -339
2007 430 -319 065 398 339 -508 119 367 769 063 469 -165
2006 -321 338 -222 078 381 -068 556 300 -002 -278 -231 094
2005 287 030 -153 492 111 -413 111 059 339 427 012 -019
2004 acirceurordquo acirceurordquo acirceurordquo acirceurordquo acirceurordquo acirceurordquo acirceurordquo acirceurordquo acirceurordquo acirceurordquo acirceurordquo 459
PepsiCo (PEP) Dividend Stock Analysis
PepsiCo Inc manufactures markets and sells various snacks carbonated and non-carbonated
beverages and foods worldwidePepsiCo is a major component of the SampP 500 Dow Industrials and
the Dividend Aristocrats Indexes PepsiCo has been consistently increasing its dividends for 36
consecutive years From the end of 1998 up until December 2008 this dividend growth stock has
delivered a 470 annual average total return to its shareholders
At the same time company has managed to deliver a 990 average annual increase in its EPS since
1999
842019 Pepsi and Coca-cola(RH6802B54)
httpslidepdfcomreaderfullpepsi-and-coca-colarh6802b54 1822
The ROE has remained largely between 31 and 38 with the exception of 2004 when it fell to as
low as 22
Annual dividend payments have increased by an average of 1350 annually since 1999 which is
much higher than the growth in EPS Analysts are expecting slight increase in EPS for 2009
compared to 2008 given the sluggish state of North American economies The strong US dollar could
potentially hurt sales as over 44 of PepsiCorsquos revenues are derived internationally
A 1350 growth in dividends translates into the dividend payment doubling almost every five years
Since 1978 PepsiCo has actually managed to double its dividend payment every six years on average
The dividend payout has remained in a range between 31 and 42 In 2008 the dividend payout
ratio has surged to 51 A lower payout is always a plus since it leaves room for consistent dividend
growth minimizing the impact of short-term fluctuations in earnings The slow growth in earnings
could put future dividend increases at risk
842019 Pepsi and Coca-cola(RH6802B54)
httpslidepdfcomreaderfullpepsi-and-coca-colarh6802b54 1922
842019 Pepsi and Coca-cola(RH6802B54)
httpslidepdfcomreaderfullpepsi-and-coca-colarh6802b54 2022
Though carbonated soft drinks remain the most popular beverage PEP recognizes that non-carbonated soft drinks are a faster growing category The company is focusing on the health andwellness trends It has eliminated trans fats from many of its snack foods and is introducing ldquogoodforyourdquo foods under the Quaker Oats brand Risks include the highly competitive and very maturenature of it products also with more exposure to foreign markets political and currency risks alsoincrease
Conclusion PEP did not earn any Stars in the Fair Value section earned two Stars in the DividendAnalytical Data section and earned one Star in the Dividend Income vs MMA section for a total of three Stars This quantitatively ranks PEP as a 3 Star-Hold
Using my D4L-PreScreenxls model I determined the share price could increase to $6562 beforePEPrsquos NPV MMA Differential fell to the $500 that I like to see for a stock with 37 consecutive yearsof dividend increases At that price the stock would yield 270
Resetting the D4L-PreScreenxls model and solving for the dividend growth rate needed to generatethe target $500 NPV MMA Differential the calculated rate is 63 This dividend growth rate is
lower than the the 76 used in this analysis thus providing a margin of safety PEP has a risk rating of 100 which classifies it as a low risk stock
Like its competition Coca-Cola (KO) PEPrsquos Free Cash Flow Payout currently at 70 tends toremain higher than the 60 level that I prefer However this is mitigated to an extent by relativelylow debt levels and predictable cash flows PEP is a stock I will buy as my allocation allows andwhen it dips below its buy price of $5510 For additional information including the stockrsquos dividendhistory please refer to its data page
Stock price of last five years with monthly price list
842019 Pepsi and Coca-cola(RH6802B54)
httpslidepdfcomreaderfullpepsi-and-coca-colarh6802b54 2122
PRICES
Date Open High Low Close Volume Adj Close
4-Dec-09 6318 6400 6308 6385 8907000 6385
3-Dec-09 6358 6359 6267 6276 6406200 6276
2-Dec-09 6350 6374 6317 6365 6195800 6365
2-Dec-09 $ 045 Dividend
1-Dec-09 6268 6393 6249 6387 6887700 6342
30-Nov-09 6264 6283 6215 6222 7252700 6178
27-Nov-09 6224 6255 6175 6230 3416000 6186
25-Nov-09 6253 6327 6249 6319 4672600 6274
24-Nov-09 6262 6265 6213 6250 4139700 6206
23-Nov-09 6246 6299 6226 6249 5009400 6205
20-Nov-09 6167 6231 6143 6208 5314600 6164
19-Nov-09 6210 6210 6135 6188 4390400 6144
18-Nov-09 6244 6251 6181 6230 3952300 6186
17-Nov-09 6242 6263 6203 6260 4362400 6216
16-Nov-09 6221 6249 6194 6243 4966800 6199
13-Nov-09 6163 6213 6135 6194 6411100 6150
12-Nov-09 6249 6275 6110 6127 8474900 6084
11-Nov-09 6234 6268 6208 6260 4714300 6216
10-Nov-09 6217 6294 6193 6208 7094100 6164
9-Nov-09 6181 6232 6143 6228 6921800 6184
6-Nov-09 6099 6176 6079 6176 4831000 6132
5-Nov-09 6044 6141 6042 6123 5578500 6080
4-Nov-09 6016 6096 5979 6038 5552100 5995
3-Nov-09 6029 6039 5962 6006 5797000 5964
2-Nov-09 6079 6107 6016 6060 6618800 601730-Oct-09 6135 6164 6037 6055 7794100 6012
29-Oct-09 6101 6146 6057 6139 5245300 6096
28-Oct-09 6088 6152 6075 6099 6321900 6056
27-Oct-09 6064 6135 6010 6100 7262900 6057
26-Oct-09 6114 6150 6021 6047 5113000 6004
23-Oct-09 6141 6167 6058 6103 6505200 6060
22-Oct-09 6190 6190 6087 6150 5428100 6107
21-Oct-09 6138 6234 6123 6184 7445000 6140
20-Oct-09 6200 6205 6112 6158 8068000 6115
19-Oct-09 6228 6257 6190 6205 5557300 616116-Oct-09 6247 6268 6211 6229 6588400 6185
15-Oct-09 6157 6275 6139 6268 10518600 6224
14-Oct-09 6094 6168 6070 6162 8462200 6119
13-Oct-09 6088 6100 6052 6060 7502000 6017
12-Oct-09 6043 6136 6025 6092 6178100 6049
9-Oct-09 6038 6070 5981 6059 6360200 6016
8-Oct-09 6124 6124 5980 6039 17263400 5996
7-Oct-09 6085 6138 6045 6117 6441900 6074
6-Oct-09 6105 6127 6042 6087 8128900 6044
5-Oct-09 6083 6124 6014 6085 7892000 60422-Oct-09 5912 6124 5893 6090 17530200 6047
1-Oct-09 5870 5899 5827 5846 9010200 5805
30-Sep-09 5874 5886 5801 5866 8898400 5825
29-Sep-09 5910 5931 5800 5851 7086400 5810
28-Sep-09 5895 5949 5862 5903 4085900 5861
25-Sep-09 5850 5913 5832 5868 6758800 5827
842019 Pepsi and Coca-cola(RH6802B54)
httpslidepdfcomreaderfullpepsi-and-coca-colarh6802b54 2222
References
1 httpwwwcoca-colacomindexjsp2 httpfinanceaolcomquotesthe-coca-cola-companykonys
3 httpfinanceaolcomeventthe-pepsi-bottling-group-incpbgnys
4 httpfinanceyahoocomqs=ko
5 httpwwwdividendgrowthinvestorcom200906coca-cola-ko-dividend-
stock-analysishtml
6 httpfinanceyahoocomqs=ko
7 httpmoneycentralmsncomdetailstock_quoteSymbol=Ko
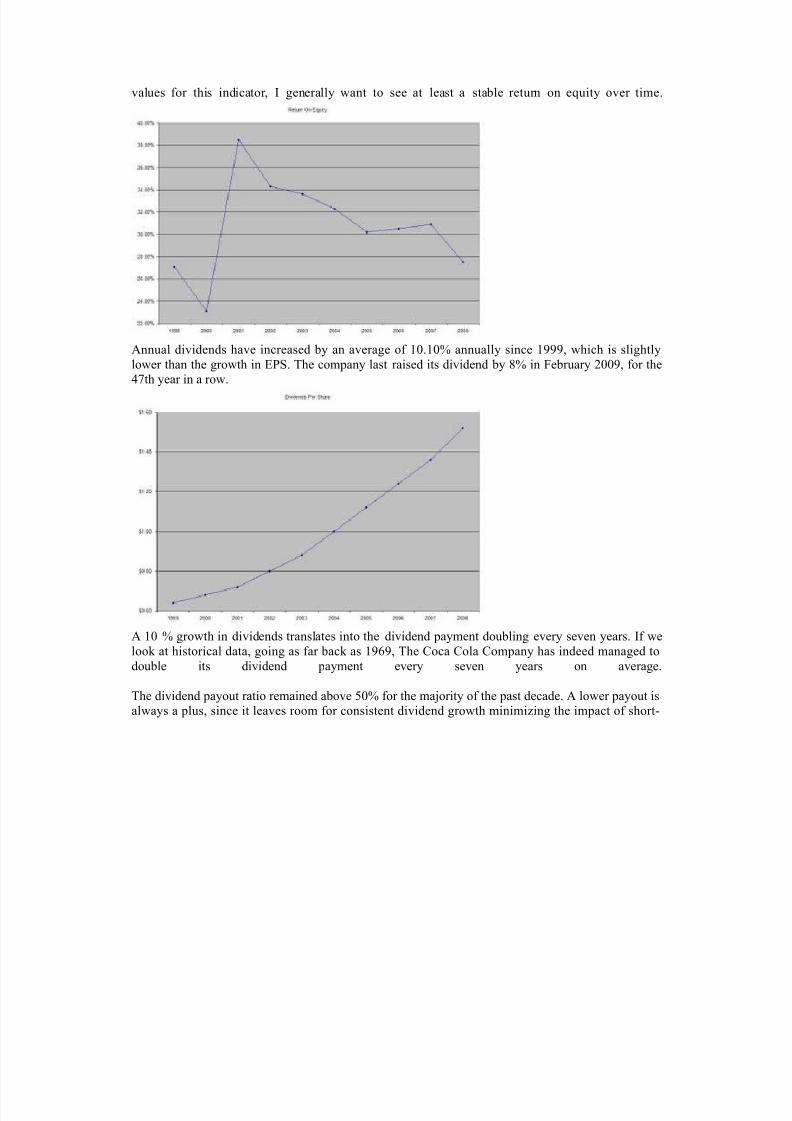
842019 Pepsi and Coca-cola(RH6802B54)
httpslidepdfcomreaderfullpepsi-and-coca-colarh6802b54 1022
values for this indicator I generally want to see at least a stable return on equity over time
Annual dividends have increased by an average of 1010 annually since 1999 which is slightlylower than the growth in EPS The company last raised its dividend by 8 in February 2009 for the47th year in a row
A 10 growth in dividends translates into the dividend payment doubling every seven years If welook at historical data going as far back as 1969 The Coca Cola Company has indeed managed todouble its dividend payment every seven years on average
The dividend payout ratio remained above 50 for the majority of the past decade A lower payout isalways a plus since it leaves room for consistent dividend growth minimizing the impact of short-
842019 Pepsi and Coca-cola(RH6802B54)
httpslidepdfcomreaderfullpepsi-and-coca-colarh6802b54 1122
term fluctuations in earnings
Currently Coca Cola is trading at 20 times earnings and yields 330 In comparison arch rival in thecola wars Pepsi Co trades at a PE multiple of 165 and yields 340 Check my analysis of Pepsi Co
I believe that The Coca Cola Company is not as attractively valued at the moment as Pepsi Co Iwould consider adding to my position there if it can cover its dividends at least two times by itsearnings by the end of the year and if the PE ratio doesnrsquot increase above 20COCA COLA ENTERPRISES INC Dividends amp Splits
5 Year Dividend History
Payable AmountShare Ex-Date Record Declaration
12102009 $008 11242009 11272009 10282009
09242009 $008 09092009 09112009 07302009
06252009 $007 06102009 06122009 04222009
03262009 $007 03112009 03132009 02112009
12112008 $007 11252008 11282008 10232008
09252008 $007 09102008 09122008 07232008
06262008 $007 06112008 06132008 04232008
03272008 $007 03122008 03142008 02152008
12132007 $006 11282007 11302007 10252007
09272007 $006 09122007 09142007 07242007
06282007 $006 06132007 06152007 04252007
03292007 $006 03142007 03162007 02102007
12142006 $006 11292006 12012006 10262006
09282006 $006 09132006 09152006 07262006
06292006 $006 06142006 06162006 04262006
03302006 $006 03152006 03172006 02182006
12152005 $004 11302005 12022005 10262005
10032005 $004 09152005 09192005 07272005
07012005 $004 06152005 06172005 04272005
842019 Pepsi and Coca-cola(RH6802B54)
httpslidepdfcomreaderfullpepsi-and-coca-colarh6802b54 1222
Payable AmountShare Ex-Date Record Declaration
04012005 $004 03162005 03182005 02162005
Dividend Analysis
Looking at the last 5 years of dividends I have calculated an average highdividend yield of 197 However that seems a tad low considering that each of
the last 2 years is significantly higher than that amount If I average out just the
last 4 years of high dividend yields I come up with 273 Still lower than the
average high yield of the last 2 years
And now the dividend payout ratio Ah ha This explains how they were able to
increase dividends at 10 even when the fundamentals have not been growing
as quickly Look at the increase in the payout ratio It has grown from a low of
3415 in 1997 to a high of 5714 in 2006 It has just been a steady climb up
for the last 10 years
Using the 273 as an average high dividend yield I calculate a price of $4982
to be able to collect this average high dividend yield At close of Friday the
current price was $5280 That means a premium of 599 over the price I am
willing to pay
Conclusion
Well my analysis shows that Coca-Cola fundamentals have not been keeping up
with their very healthy dividend growth This has caused Coca-Cola to have to
payout more and more of its earnings to shareholders This concerns me
because eventually they will not be able to raise their dividend at these high
rates because their dividend payout ratio will be too high
I am sure that Warren Buffett is earning a healthy dividend on his KO stocks but
personally I would pass on this one today There are stocks out there that
continue to grow their fundamentals which will in turn allow them to grow their
dividends
bull COCA COLA ENTERPRISES INC Top Competitors
Symbol Company Name Last
Change
Change
Volume News
Charts
CCE COCA COLA ENTERPRISES INC 1986 -011 -055 347 M
PBG PEPSI BOTTLING GROUP INC 3819 -028 -073 310 M
PEP PEPSICO INC 6276 -089 -140 640 M
Pepsi
842019 Pepsi and Coca-cola(RH6802B54)
httpslidepdfcomreaderfullpepsi-and-coca-colarh6802b54 1322
Pepsi
Type Cola
Manufacturer PepsiCo
Country of origin United States
Introduced1898 (as Brads Drink)June 16 1903 (as Pepsi-Cola)
1961 (as Pepsi)
Related products
Coca-ColaFantaDr Pepper Sprite (soft drink)Irn BruCola TurkaBig Cola
History
Pepsi is a carbonated soft drink produced and manufactured by PepsiCo It is sold in many placessuch as retail stores restaurants schools cinemas and from vending machines The drink was firstmade in the 1890s by pharmacist Caleb Bradham in New Bern North Carolina The brand wastrademarked on June 16 1903 There have been many Pepsi variants produced over the years since1898
In October 2008 Pepsi announced that it would be redesigning its logo and re-branding many of its products by early 2009 In 2009 Pepsi Diet Pepsi and Pepsi Max began using all lower-case fonts for name brands and Diet Pepsi Max was re-branded as Pepsi Max The brands blue and red globetrademark became a series of smiles with the central white band arcing at different angles
depending on the product Pepsi in countries such as the US Canada Brazil Bolivia Guatemala Nicaragua Honduras El Salvador Colombia Argentina Puerto Rico and Australia is carrying thesmile logo while the rest of the countries continue to use the old design on all packagingIn mid-September 2009the new logo has started to appear on 300 and 600ml bottles of Pepsi inAustralia Pepsi Max bottles still carry the current logo as of 27th September
Large Block Holder Type Number
Institutions 1764 Total Number of Shares Held156 B of Shares Owned by all Large Block Holders10000
Mutual Fund 2759
Other Major 25
Total Number of LargeBlock Holders 4548
842019 Pepsi and Coca-cola(RH6802B54)
httpslidepdfcomreaderfullpepsi-and-coca-colarh6802b54 1422
PEPSICO INC Dividends amp Splits
Upcoming Dividends
Payable AmountShare Ex-Date Record Declaration Set Alert
010410 $045 120209 120409 1113095 Year Dividend History
Payable AmountShare Ex-Date Record Declaration
01042010 $045 12022009 12042009 11162009
09302009 $045 09022009 09042009 08132009
06302009 $045 06032009 06052009 05062009
03312009 $0425 03042009 03062009 02072009
01022009 $0425 12032008 12052008 11172008
09302008 $0425 09032008 09052008 07192008
06302008 $0425 06042008 06062008 05082008
03312008 $0375 03052008 03072008 02022008
01022008 $0375 12052007 12072007 11172007
09282007 $0375 09052007 09072007 07202007
06292007 $0375 06062007 06082007 05092007
03302007 $030 03072007 03092007 02032007
01022007 $030 12062006 12082006 11182006
09292006 $030 09062006 09082006 07222006
06302006 $030 06072006 06092006 0504200603312006 $026 03082006 03102006 02042006
01032006 $026 12072005 12092005 11192005
09302005 $026 09072005 09092005 07232005
06302005 $026 06082005 06102005 05052005
03312005 $023 03092005 03112005 01282005
PEPSICO INC Income Statement
ViewAnnual Data | Quarterly Data
Period EndingQ3FY09 Q2 FY09 Q1 FY09 Q4 FY08 Q3 FY08
Net SalesRevenues 1108 B 1059 B 826 B 1273 B 1124 B
Cost of Goods Sold (ExcludingDepreciation)
476 B 452 B 344 B 617 B 490 B
Depreciation Depletion andAmortization
42200M
37100 M 31400 M 2100 M 37700 M
Gross Income 590 B 570 B 451 B 654 B 596 B
Selling General amp Admin Expenses 365 B 350 B 290 B 532 B 398 B
Other Operating Expense 157 B 161 B 144 B 152 B 142 B
842019 Pepsi and Coca-cola(RH6802B54)
httpslidepdfcomreaderfullpepsi-and-coca-colarh6802b54 1522
Period EndingQ3FY09 Q2 FY09 Q1 FY09 Q4 FY08 Q3 FY08
Net SalesRevenues 1108 B 1059 B 826 B 1273 B 1124 B
Operating Income 223 B 220 B 161 B 121 B 198 B
Extraordinary Credit - Pretax 9300 M 000 000 000 000
Extraordinary Charge - Pretax 000 20900 M 9100 M 90800 M 17600 M
Pretax Equity in Earnings 000 000 000 000 000
Other IncomeExpenses - Net 1600 M 42400 M 200 M 90800 M 19200 M
Pretax Income 216 B 212 B 149 B 108 B 192 B
Income Taxes 57500M
56800 M 37400 M 29300 M 55000 M
Minority Interest 1600 M 800 M 600 M 000 000
Equity in Earnings 000 000 000 000 000
Discontinued Operations 000 000 000 000 000
Net Income Before ExtraItemsPreferred Div
172 B 166 B 114 B 71900 M 158 B
Extra Items amp Gain (Loss) Sale of Assets
000 000 000 000 000
Net Income Before PreferredDividends
172 B 166 B 114 B 71900 M 158 B
Preferred Dividend Requirements 000 100 M 300 M 000 200 M
Net Income Used to CalculateDiluted EPS
mdash mdash mdash mdash mdash
Net Income Used to Calculate BasicEPS
mdash mdash mdash mdash mdash
Net Income Available to Common 172 B 166 B 114 B 71900 M 157 B
Period Ending FY2008 FY2007 FY2006 FY2005 FY2004
Net SalesRevenues 4325 B 3947 B 3514 B 3256 B 2926 B
Cost of Goods Sold (ExcludingDepreciation)
1878 B 1667 B 1452 B 1302 B 1229 B
Depreciation Depletion andAmortization
154 B 143 B 141 B 131 B 126 B
Gross Income 2292 B 2138 B 1921 B 1824 B 1571 B
Selling General amp AdminExpenses
1545 B 1411 B 1277 B 1231 B 1030 B
Other Operating Expense 000 000 000 000 000
Operating Expenses - Total 157 B 161 B 144 B 152 B 142 B
Operating Income 748 B 727 B 644 B 592 B 541 B
Extraordinary Credit - Pretax 000 000 000 000 000
842019 Pepsi and Coca-cola(RH6802B54)
httpslidepdfcomreaderfullpepsi-and-coca-colarh6802b54 1622
Period EndingQ3FY09 Q2 FY09 Q1 FY09 Q4 FY08 Q3 FY08
Net SalesRevenues 1108 B 1059 B 826 B 1273 B 1124 B
Extraordinary Charge - Pretax 54300
M
10200 M 15000 M 20600 M mdash
Non-operating Interest Income 4100 M 12500 M 17300 M 15900 M 7400 M
Reserves Inc (Dec) 000 000 000 000 000
Pretax Equity in Earnings 000 000 000 000 000
Other IncomeExpenses - Net 000 000 000 000 000
Earnings Before Interest amp Taxes(EBIT)
698 B 730 B 661 B 608 B 533 B
Interest Expenses On Debt 34300M
24500 M 25500 M 26100 M 16900 M
Interest Capitalized 1400 M 2100 M 1600 M 500 M 200 MPretax Income 665 B 707 B 637 B 582 B 517 B
Income Taxes 188 B 197 B 135 B 230 B 137 B
Current Domestic Income Tax 90200M
153 B 83200 M 176 B 110 B
Current Foreign Income Tax 73200M
48900M
56900 M 42600 M 25600 M
Deferred Domestic Income Tax 31400M
2400 M -3800 M 14800 M 1200 M
Deferred Foreign Income Tax -6900M
-6600M
-1600 M -2600 M 500 M
Income Tax Credits mdash mdash mdash mdash mdash
Minority Interest 000 000 000 000 000
Equity in Earnings 37400M
56000 M 61600 M 55700 M 38000 M
After Tax Income Expense 000 000 000 000 000
Discontinued Operations 000 000 000 000 3800 M
Net Income Before ExtraItemsPreferred Div
514 B 566 B 564 B 408 B 421 B
Extra Items amp Gain (Loss) Sale of Assets
000 000 000 000 000
Net Income Before PreferredDividends
514 B 566 B 564 B 408 B 421 B
Preferred Dividend Requirements 1000 M 1200 M 1100 M 1800 M 2500 M
Net Income Available to Common 514 B 566 B 564 B 408 B 421 B
Seasonal Performance Data PEP
Returns Jan Feb Mar Apr May Jun Jul Aug Sep Oct Nov Dec
AvgReturns -289 -033 154 024 252 -224 316 200 373 -293 095 006
Times PEP Stock Price 49 45 56 51 54 46 57 58 58 52 54 50
842019 Pepsi and Coca-cola(RH6802B54)
httpslidepdfcomreaderfullpepsi-and-coca-colarh6802b54 1722
Returns Jan Feb Mar Apr May Jun Jul Aug Sep Oct Nov Dec
Increased
Times PEP Stock PriceUnchanged
0 0 1 0 2 1 1 0 0 0 1 1
Times PEP Stock Price
Decreased52 51 52 52 50 61 47 53 44 59 47 54
2009 -828 -415 694 -333 460 559 326 -013 351 322 276 acirceurordquo
2008 -1015 201 386 -514 -033 -689 467 288 407 -2000 -053 -339
2007 430 -319 065 398 339 -508 119 367 769 063 469 -165
2006 -321 338 -222 078 381 -068 556 300 -002 -278 -231 094
2005 287 030 -153 492 111 -413 111 059 339 427 012 -019
2004 acirceurordquo acirceurordquo acirceurordquo acirceurordquo acirceurordquo acirceurordquo acirceurordquo acirceurordquo acirceurordquo acirceurordquo acirceurordquo 459
PepsiCo (PEP) Dividend Stock Analysis
PepsiCo Inc manufactures markets and sells various snacks carbonated and non-carbonated
beverages and foods worldwidePepsiCo is a major component of the SampP 500 Dow Industrials and
the Dividend Aristocrats Indexes PepsiCo has been consistently increasing its dividends for 36
consecutive years From the end of 1998 up until December 2008 this dividend growth stock has
delivered a 470 annual average total return to its shareholders
At the same time company has managed to deliver a 990 average annual increase in its EPS since
1999
842019 Pepsi and Coca-cola(RH6802B54)
httpslidepdfcomreaderfullpepsi-and-coca-colarh6802b54 1822
The ROE has remained largely between 31 and 38 with the exception of 2004 when it fell to as
low as 22
Annual dividend payments have increased by an average of 1350 annually since 1999 which is
much higher than the growth in EPS Analysts are expecting slight increase in EPS for 2009
compared to 2008 given the sluggish state of North American economies The strong US dollar could
potentially hurt sales as over 44 of PepsiCorsquos revenues are derived internationally
A 1350 growth in dividends translates into the dividend payment doubling almost every five years
Since 1978 PepsiCo has actually managed to double its dividend payment every six years on average
The dividend payout has remained in a range between 31 and 42 In 2008 the dividend payout
ratio has surged to 51 A lower payout is always a plus since it leaves room for consistent dividend
growth minimizing the impact of short-term fluctuations in earnings The slow growth in earnings
could put future dividend increases at risk
842019 Pepsi and Coca-cola(RH6802B54)
httpslidepdfcomreaderfullpepsi-and-coca-colarh6802b54 1922
842019 Pepsi and Coca-cola(RH6802B54)
httpslidepdfcomreaderfullpepsi-and-coca-colarh6802b54 2022
Though carbonated soft drinks remain the most popular beverage PEP recognizes that non-carbonated soft drinks are a faster growing category The company is focusing on the health andwellness trends It has eliminated trans fats from many of its snack foods and is introducing ldquogoodforyourdquo foods under the Quaker Oats brand Risks include the highly competitive and very maturenature of it products also with more exposure to foreign markets political and currency risks alsoincrease
Conclusion PEP did not earn any Stars in the Fair Value section earned two Stars in the DividendAnalytical Data section and earned one Star in the Dividend Income vs MMA section for a total of three Stars This quantitatively ranks PEP as a 3 Star-Hold
Using my D4L-PreScreenxls model I determined the share price could increase to $6562 beforePEPrsquos NPV MMA Differential fell to the $500 that I like to see for a stock with 37 consecutive yearsof dividend increases At that price the stock would yield 270
Resetting the D4L-PreScreenxls model and solving for the dividend growth rate needed to generatethe target $500 NPV MMA Differential the calculated rate is 63 This dividend growth rate is
lower than the the 76 used in this analysis thus providing a margin of safety PEP has a risk rating of 100 which classifies it as a low risk stock
Like its competition Coca-Cola (KO) PEPrsquos Free Cash Flow Payout currently at 70 tends toremain higher than the 60 level that I prefer However this is mitigated to an extent by relativelylow debt levels and predictable cash flows PEP is a stock I will buy as my allocation allows andwhen it dips below its buy price of $5510 For additional information including the stockrsquos dividendhistory please refer to its data page
Stock price of last five years with monthly price list
842019 Pepsi and Coca-cola(RH6802B54)
httpslidepdfcomreaderfullpepsi-and-coca-colarh6802b54 2122
PRICES
Date Open High Low Close Volume Adj Close
4-Dec-09 6318 6400 6308 6385 8907000 6385
3-Dec-09 6358 6359 6267 6276 6406200 6276
2-Dec-09 6350 6374 6317 6365 6195800 6365
2-Dec-09 $ 045 Dividend
1-Dec-09 6268 6393 6249 6387 6887700 6342
30-Nov-09 6264 6283 6215 6222 7252700 6178
27-Nov-09 6224 6255 6175 6230 3416000 6186
25-Nov-09 6253 6327 6249 6319 4672600 6274
24-Nov-09 6262 6265 6213 6250 4139700 6206
23-Nov-09 6246 6299 6226 6249 5009400 6205
20-Nov-09 6167 6231 6143 6208 5314600 6164
19-Nov-09 6210 6210 6135 6188 4390400 6144
18-Nov-09 6244 6251 6181 6230 3952300 6186
17-Nov-09 6242 6263 6203 6260 4362400 6216
16-Nov-09 6221 6249 6194 6243 4966800 6199
13-Nov-09 6163 6213 6135 6194 6411100 6150
12-Nov-09 6249 6275 6110 6127 8474900 6084
11-Nov-09 6234 6268 6208 6260 4714300 6216
10-Nov-09 6217 6294 6193 6208 7094100 6164
9-Nov-09 6181 6232 6143 6228 6921800 6184
6-Nov-09 6099 6176 6079 6176 4831000 6132
5-Nov-09 6044 6141 6042 6123 5578500 6080
4-Nov-09 6016 6096 5979 6038 5552100 5995
3-Nov-09 6029 6039 5962 6006 5797000 5964
2-Nov-09 6079 6107 6016 6060 6618800 601730-Oct-09 6135 6164 6037 6055 7794100 6012
29-Oct-09 6101 6146 6057 6139 5245300 6096
28-Oct-09 6088 6152 6075 6099 6321900 6056
27-Oct-09 6064 6135 6010 6100 7262900 6057
26-Oct-09 6114 6150 6021 6047 5113000 6004
23-Oct-09 6141 6167 6058 6103 6505200 6060
22-Oct-09 6190 6190 6087 6150 5428100 6107
21-Oct-09 6138 6234 6123 6184 7445000 6140
20-Oct-09 6200 6205 6112 6158 8068000 6115
19-Oct-09 6228 6257 6190 6205 5557300 616116-Oct-09 6247 6268 6211 6229 6588400 6185
15-Oct-09 6157 6275 6139 6268 10518600 6224
14-Oct-09 6094 6168 6070 6162 8462200 6119
13-Oct-09 6088 6100 6052 6060 7502000 6017
12-Oct-09 6043 6136 6025 6092 6178100 6049
9-Oct-09 6038 6070 5981 6059 6360200 6016
8-Oct-09 6124 6124 5980 6039 17263400 5996
7-Oct-09 6085 6138 6045 6117 6441900 6074
6-Oct-09 6105 6127 6042 6087 8128900 6044
5-Oct-09 6083 6124 6014 6085 7892000 60422-Oct-09 5912 6124 5893 6090 17530200 6047
1-Oct-09 5870 5899 5827 5846 9010200 5805
30-Sep-09 5874 5886 5801 5866 8898400 5825
29-Sep-09 5910 5931 5800 5851 7086400 5810
28-Sep-09 5895 5949 5862 5903 4085900 5861
25-Sep-09 5850 5913 5832 5868 6758800 5827
842019 Pepsi and Coca-cola(RH6802B54)
httpslidepdfcomreaderfullpepsi-and-coca-colarh6802b54 2222
References
1 httpwwwcoca-colacomindexjsp2 httpfinanceaolcomquotesthe-coca-cola-companykonys
3 httpfinanceaolcomeventthe-pepsi-bottling-group-incpbgnys
4 httpfinanceyahoocomqs=ko
5 httpwwwdividendgrowthinvestorcom200906coca-cola-ko-dividend-
stock-analysishtml
6 httpfinanceyahoocomqs=ko
7 httpmoneycentralmsncomdetailstock_quoteSymbol=Ko
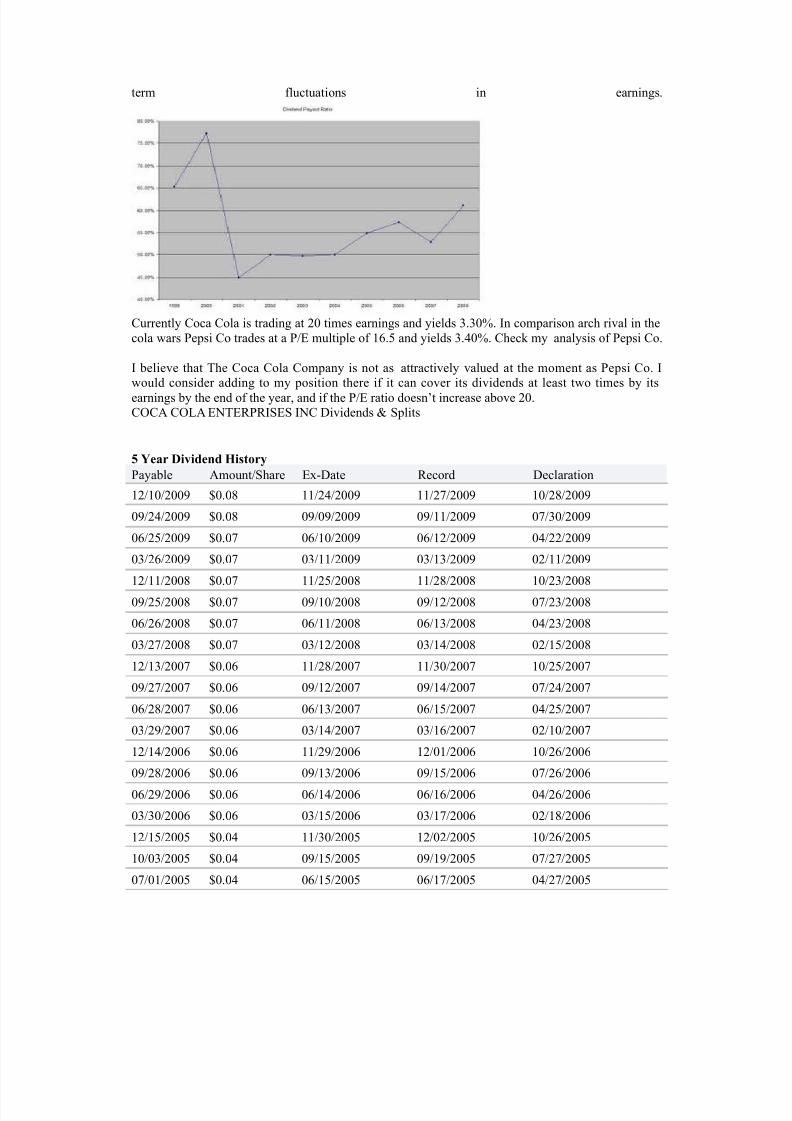
842019 Pepsi and Coca-cola(RH6802B54)
httpslidepdfcomreaderfullpepsi-and-coca-colarh6802b54 1222
Payable AmountShare Ex-Date Record Declaration
04012005 $004 03162005 03182005 02162005
Dividend Analysis
Looking at the last 5 years of dividends I have calculated an average highdividend yield of 197 However that seems a tad low considering that each of
the last 2 years is significantly higher than that amount If I average out just the
last 4 years of high dividend yields I come up with 273 Still lower than the
average high yield of the last 2 years
And now the dividend payout ratio Ah ha This explains how they were able to
increase dividends at 10 even when the fundamentals have not been growing
as quickly Look at the increase in the payout ratio It has grown from a low of
3415 in 1997 to a high of 5714 in 2006 It has just been a steady climb up
for the last 10 years
Using the 273 as an average high dividend yield I calculate a price of $4982
to be able to collect this average high dividend yield At close of Friday the
current price was $5280 That means a premium of 599 over the price I am
willing to pay
Conclusion
Well my analysis shows that Coca-Cola fundamentals have not been keeping up
with their very healthy dividend growth This has caused Coca-Cola to have to
payout more and more of its earnings to shareholders This concerns me
because eventually they will not be able to raise their dividend at these high
rates because their dividend payout ratio will be too high
I am sure that Warren Buffett is earning a healthy dividend on his KO stocks but
personally I would pass on this one today There are stocks out there that
continue to grow their fundamentals which will in turn allow them to grow their
dividends
bull COCA COLA ENTERPRISES INC Top Competitors
Symbol Company Name Last
Change
Change
Volume News
Charts
CCE COCA COLA ENTERPRISES INC 1986 -011 -055 347 M
PBG PEPSI BOTTLING GROUP INC 3819 -028 -073 310 M
PEP PEPSICO INC 6276 -089 -140 640 M
Pepsi
842019 Pepsi and Coca-cola(RH6802B54)
httpslidepdfcomreaderfullpepsi-and-coca-colarh6802b54 1322
Pepsi
Type Cola
Manufacturer PepsiCo
Country of origin United States
Introduced1898 (as Brads Drink)June 16 1903 (as Pepsi-Cola)
1961 (as Pepsi)
Related products
Coca-ColaFantaDr Pepper Sprite (soft drink)Irn BruCola TurkaBig Cola
History
Pepsi is a carbonated soft drink produced and manufactured by PepsiCo It is sold in many placessuch as retail stores restaurants schools cinemas and from vending machines The drink was firstmade in the 1890s by pharmacist Caleb Bradham in New Bern North Carolina The brand wastrademarked on June 16 1903 There have been many Pepsi variants produced over the years since1898
In October 2008 Pepsi announced that it would be redesigning its logo and re-branding many of its products by early 2009 In 2009 Pepsi Diet Pepsi and Pepsi Max began using all lower-case fonts for name brands and Diet Pepsi Max was re-branded as Pepsi Max The brands blue and red globetrademark became a series of smiles with the central white band arcing at different angles
depending on the product Pepsi in countries such as the US Canada Brazil Bolivia Guatemala Nicaragua Honduras El Salvador Colombia Argentina Puerto Rico and Australia is carrying thesmile logo while the rest of the countries continue to use the old design on all packagingIn mid-September 2009the new logo has started to appear on 300 and 600ml bottles of Pepsi inAustralia Pepsi Max bottles still carry the current logo as of 27th September
Large Block Holder Type Number
Institutions 1764 Total Number of Shares Held156 B of Shares Owned by all Large Block Holders10000
Mutual Fund 2759
Other Major 25
Total Number of LargeBlock Holders 4548
842019 Pepsi and Coca-cola(RH6802B54)
httpslidepdfcomreaderfullpepsi-and-coca-colarh6802b54 1422
PEPSICO INC Dividends amp Splits
Upcoming Dividends
Payable AmountShare Ex-Date Record Declaration Set Alert
010410 $045 120209 120409 1113095 Year Dividend History
Payable AmountShare Ex-Date Record Declaration
01042010 $045 12022009 12042009 11162009
09302009 $045 09022009 09042009 08132009
06302009 $045 06032009 06052009 05062009
03312009 $0425 03042009 03062009 02072009
01022009 $0425 12032008 12052008 11172008
09302008 $0425 09032008 09052008 07192008
06302008 $0425 06042008 06062008 05082008
03312008 $0375 03052008 03072008 02022008
01022008 $0375 12052007 12072007 11172007
09282007 $0375 09052007 09072007 07202007
06292007 $0375 06062007 06082007 05092007
03302007 $030 03072007 03092007 02032007
01022007 $030 12062006 12082006 11182006
09292006 $030 09062006 09082006 07222006
06302006 $030 06072006 06092006 0504200603312006 $026 03082006 03102006 02042006
01032006 $026 12072005 12092005 11192005
09302005 $026 09072005 09092005 07232005
06302005 $026 06082005 06102005 05052005
03312005 $023 03092005 03112005 01282005
PEPSICO INC Income Statement
ViewAnnual Data | Quarterly Data
Period EndingQ3FY09 Q2 FY09 Q1 FY09 Q4 FY08 Q3 FY08
Net SalesRevenues 1108 B 1059 B 826 B 1273 B 1124 B
Cost of Goods Sold (ExcludingDepreciation)
476 B 452 B 344 B 617 B 490 B
Depreciation Depletion andAmortization
42200M
37100 M 31400 M 2100 M 37700 M
Gross Income 590 B 570 B 451 B 654 B 596 B
Selling General amp Admin Expenses 365 B 350 B 290 B 532 B 398 B
Other Operating Expense 157 B 161 B 144 B 152 B 142 B
842019 Pepsi and Coca-cola(RH6802B54)
httpslidepdfcomreaderfullpepsi-and-coca-colarh6802b54 1522
Period EndingQ3FY09 Q2 FY09 Q1 FY09 Q4 FY08 Q3 FY08
Net SalesRevenues 1108 B 1059 B 826 B 1273 B 1124 B
Operating Income 223 B 220 B 161 B 121 B 198 B
Extraordinary Credit - Pretax 9300 M 000 000 000 000
Extraordinary Charge - Pretax 000 20900 M 9100 M 90800 M 17600 M
Pretax Equity in Earnings 000 000 000 000 000
Other IncomeExpenses - Net 1600 M 42400 M 200 M 90800 M 19200 M
Pretax Income 216 B 212 B 149 B 108 B 192 B
Income Taxes 57500M
56800 M 37400 M 29300 M 55000 M
Minority Interest 1600 M 800 M 600 M 000 000
Equity in Earnings 000 000 000 000 000
Discontinued Operations 000 000 000 000 000
Net Income Before ExtraItemsPreferred Div
172 B 166 B 114 B 71900 M 158 B
Extra Items amp Gain (Loss) Sale of Assets
000 000 000 000 000
Net Income Before PreferredDividends
172 B 166 B 114 B 71900 M 158 B
Preferred Dividend Requirements 000 100 M 300 M 000 200 M
Net Income Used to CalculateDiluted EPS
mdash mdash mdash mdash mdash
Net Income Used to Calculate BasicEPS
mdash mdash mdash mdash mdash
Net Income Available to Common 172 B 166 B 114 B 71900 M 157 B
Period Ending FY2008 FY2007 FY2006 FY2005 FY2004
Net SalesRevenues 4325 B 3947 B 3514 B 3256 B 2926 B
Cost of Goods Sold (ExcludingDepreciation)
1878 B 1667 B 1452 B 1302 B 1229 B
Depreciation Depletion andAmortization
154 B 143 B 141 B 131 B 126 B
Gross Income 2292 B 2138 B 1921 B 1824 B 1571 B
Selling General amp AdminExpenses
1545 B 1411 B 1277 B 1231 B 1030 B
Other Operating Expense 000 000 000 000 000
Operating Expenses - Total 157 B 161 B 144 B 152 B 142 B
Operating Income 748 B 727 B 644 B 592 B 541 B
Extraordinary Credit - Pretax 000 000 000 000 000
842019 Pepsi and Coca-cola(RH6802B54)
httpslidepdfcomreaderfullpepsi-and-coca-colarh6802b54 1622
Period EndingQ3FY09 Q2 FY09 Q1 FY09 Q4 FY08 Q3 FY08
Net SalesRevenues 1108 B 1059 B 826 B 1273 B 1124 B
Extraordinary Charge - Pretax 54300
M
10200 M 15000 M 20600 M mdash
Non-operating Interest Income 4100 M 12500 M 17300 M 15900 M 7400 M
Reserves Inc (Dec) 000 000 000 000 000
Pretax Equity in Earnings 000 000 000 000 000
Other IncomeExpenses - Net 000 000 000 000 000
Earnings Before Interest amp Taxes(EBIT)
698 B 730 B 661 B 608 B 533 B
Interest Expenses On Debt 34300M
24500 M 25500 M 26100 M 16900 M
Interest Capitalized 1400 M 2100 M 1600 M 500 M 200 MPretax Income 665 B 707 B 637 B 582 B 517 B
Income Taxes 188 B 197 B 135 B 230 B 137 B
Current Domestic Income Tax 90200M
153 B 83200 M 176 B 110 B
Current Foreign Income Tax 73200M
48900M
56900 M 42600 M 25600 M
Deferred Domestic Income Tax 31400M
2400 M -3800 M 14800 M 1200 M
Deferred Foreign Income Tax -6900M
-6600M
-1600 M -2600 M 500 M
Income Tax Credits mdash mdash mdash mdash mdash
Minority Interest 000 000 000 000 000
Equity in Earnings 37400M
56000 M 61600 M 55700 M 38000 M
After Tax Income Expense 000 000 000 000 000
Discontinued Operations 000 000 000 000 3800 M
Net Income Before ExtraItemsPreferred Div
514 B 566 B 564 B 408 B 421 B
Extra Items amp Gain (Loss) Sale of Assets
000 000 000 000 000
Net Income Before PreferredDividends
514 B 566 B 564 B 408 B 421 B
Preferred Dividend Requirements 1000 M 1200 M 1100 M 1800 M 2500 M
Net Income Available to Common 514 B 566 B 564 B 408 B 421 B
Seasonal Performance Data PEP
Returns Jan Feb Mar Apr May Jun Jul Aug Sep Oct Nov Dec
AvgReturns -289 -033 154 024 252 -224 316 200 373 -293 095 006
Times PEP Stock Price 49 45 56 51 54 46 57 58 58 52 54 50
842019 Pepsi and Coca-cola(RH6802B54)
httpslidepdfcomreaderfullpepsi-and-coca-colarh6802b54 1722
Returns Jan Feb Mar Apr May Jun Jul Aug Sep Oct Nov Dec
Increased
Times PEP Stock PriceUnchanged
0 0 1 0 2 1 1 0 0 0 1 1
Times PEP Stock Price
Decreased52 51 52 52 50 61 47 53 44 59 47 54
2009 -828 -415 694 -333 460 559 326 -013 351 322 276 acirceurordquo
2008 -1015 201 386 -514 -033 -689 467 288 407 -2000 -053 -339
2007 430 -319 065 398 339 -508 119 367 769 063 469 -165
2006 -321 338 -222 078 381 -068 556 300 -002 -278 -231 094
2005 287 030 -153 492 111 -413 111 059 339 427 012 -019
2004 acirceurordquo acirceurordquo acirceurordquo acirceurordquo acirceurordquo acirceurordquo acirceurordquo acirceurordquo acirceurordquo acirceurordquo acirceurordquo 459
PepsiCo (PEP) Dividend Stock Analysis
PepsiCo Inc manufactures markets and sells various snacks carbonated and non-carbonated
beverages and foods worldwidePepsiCo is a major component of the SampP 500 Dow Industrials and
the Dividend Aristocrats Indexes PepsiCo has been consistently increasing its dividends for 36
consecutive years From the end of 1998 up until December 2008 this dividend growth stock has
delivered a 470 annual average total return to its shareholders
At the same time company has managed to deliver a 990 average annual increase in its EPS since
1999
842019 Pepsi and Coca-cola(RH6802B54)
httpslidepdfcomreaderfullpepsi-and-coca-colarh6802b54 1822
The ROE has remained largely between 31 and 38 with the exception of 2004 when it fell to as
low as 22
Annual dividend payments have increased by an average of 1350 annually since 1999 which is
much higher than the growth in EPS Analysts are expecting slight increase in EPS for 2009
compared to 2008 given the sluggish state of North American economies The strong US dollar could
potentially hurt sales as over 44 of PepsiCorsquos revenues are derived internationally
A 1350 growth in dividends translates into the dividend payment doubling almost every five years
Since 1978 PepsiCo has actually managed to double its dividend payment every six years on average
The dividend payout has remained in a range between 31 and 42 In 2008 the dividend payout
ratio has surged to 51 A lower payout is always a plus since it leaves room for consistent dividend
growth minimizing the impact of short-term fluctuations in earnings The slow growth in earnings
could put future dividend increases at risk
842019 Pepsi and Coca-cola(RH6802B54)
httpslidepdfcomreaderfullpepsi-and-coca-colarh6802b54 1922
842019 Pepsi and Coca-cola(RH6802B54)
httpslidepdfcomreaderfullpepsi-and-coca-colarh6802b54 2022
Though carbonated soft drinks remain the most popular beverage PEP recognizes that non-carbonated soft drinks are a faster growing category The company is focusing on the health andwellness trends It has eliminated trans fats from many of its snack foods and is introducing ldquogoodforyourdquo foods under the Quaker Oats brand Risks include the highly competitive and very maturenature of it products also with more exposure to foreign markets political and currency risks alsoincrease
Conclusion PEP did not earn any Stars in the Fair Value section earned two Stars in the DividendAnalytical Data section and earned one Star in the Dividend Income vs MMA section for a total of three Stars This quantitatively ranks PEP as a 3 Star-Hold
Using my D4L-PreScreenxls model I determined the share price could increase to $6562 beforePEPrsquos NPV MMA Differential fell to the $500 that I like to see for a stock with 37 consecutive yearsof dividend increases At that price the stock would yield 270
Resetting the D4L-PreScreenxls model and solving for the dividend growth rate needed to generatethe target $500 NPV MMA Differential the calculated rate is 63 This dividend growth rate is
lower than the the 76 used in this analysis thus providing a margin of safety PEP has a risk rating of 100 which classifies it as a low risk stock
Like its competition Coca-Cola (KO) PEPrsquos Free Cash Flow Payout currently at 70 tends toremain higher than the 60 level that I prefer However this is mitigated to an extent by relativelylow debt levels and predictable cash flows PEP is a stock I will buy as my allocation allows andwhen it dips below its buy price of $5510 For additional information including the stockrsquos dividendhistory please refer to its data page
Stock price of last five years with monthly price list
842019 Pepsi and Coca-cola(RH6802B54)
httpslidepdfcomreaderfullpepsi-and-coca-colarh6802b54 2122
PRICES
Date Open High Low Close Volume Adj Close
4-Dec-09 6318 6400 6308 6385 8907000 6385
3-Dec-09 6358 6359 6267 6276 6406200 6276
2-Dec-09 6350 6374 6317 6365 6195800 6365
2-Dec-09 $ 045 Dividend
1-Dec-09 6268 6393 6249 6387 6887700 6342
30-Nov-09 6264 6283 6215 6222 7252700 6178
27-Nov-09 6224 6255 6175 6230 3416000 6186
25-Nov-09 6253 6327 6249 6319 4672600 6274
24-Nov-09 6262 6265 6213 6250 4139700 6206
23-Nov-09 6246 6299 6226 6249 5009400 6205
20-Nov-09 6167 6231 6143 6208 5314600 6164
19-Nov-09 6210 6210 6135 6188 4390400 6144
18-Nov-09 6244 6251 6181 6230 3952300 6186
17-Nov-09 6242 6263 6203 6260 4362400 6216
16-Nov-09 6221 6249 6194 6243 4966800 6199
13-Nov-09 6163 6213 6135 6194 6411100 6150
12-Nov-09 6249 6275 6110 6127 8474900 6084
11-Nov-09 6234 6268 6208 6260 4714300 6216
10-Nov-09 6217 6294 6193 6208 7094100 6164
9-Nov-09 6181 6232 6143 6228 6921800 6184
6-Nov-09 6099 6176 6079 6176 4831000 6132
5-Nov-09 6044 6141 6042 6123 5578500 6080
4-Nov-09 6016 6096 5979 6038 5552100 5995
3-Nov-09 6029 6039 5962 6006 5797000 5964
2-Nov-09 6079 6107 6016 6060 6618800 601730-Oct-09 6135 6164 6037 6055 7794100 6012
29-Oct-09 6101 6146 6057 6139 5245300 6096
28-Oct-09 6088 6152 6075 6099 6321900 6056
27-Oct-09 6064 6135 6010 6100 7262900 6057
26-Oct-09 6114 6150 6021 6047 5113000 6004
23-Oct-09 6141 6167 6058 6103 6505200 6060
22-Oct-09 6190 6190 6087 6150 5428100 6107
21-Oct-09 6138 6234 6123 6184 7445000 6140
20-Oct-09 6200 6205 6112 6158 8068000 6115
19-Oct-09 6228 6257 6190 6205 5557300 616116-Oct-09 6247 6268 6211 6229 6588400 6185
15-Oct-09 6157 6275 6139 6268 10518600 6224
14-Oct-09 6094 6168 6070 6162 8462200 6119
13-Oct-09 6088 6100 6052 6060 7502000 6017
12-Oct-09 6043 6136 6025 6092 6178100 6049
9-Oct-09 6038 6070 5981 6059 6360200 6016
8-Oct-09 6124 6124 5980 6039 17263400 5996
7-Oct-09 6085 6138 6045 6117 6441900 6074
6-Oct-09 6105 6127 6042 6087 8128900 6044
5-Oct-09 6083 6124 6014 6085 7892000 60422-Oct-09 5912 6124 5893 6090 17530200 6047
1-Oct-09 5870 5899 5827 5846 9010200 5805
30-Sep-09 5874 5886 5801 5866 8898400 5825
29-Sep-09 5910 5931 5800 5851 7086400 5810
28-Sep-09 5895 5949 5862 5903 4085900 5861
25-Sep-09 5850 5913 5832 5868 6758800 5827
842019 Pepsi and Coca-cola(RH6802B54)
httpslidepdfcomreaderfullpepsi-and-coca-colarh6802b54 2222
References
1 httpwwwcoca-colacomindexjsp2 httpfinanceaolcomquotesthe-coca-cola-companykonys
3 httpfinanceaolcomeventthe-pepsi-bottling-group-incpbgnys
4 httpfinanceyahoocomqs=ko
5 httpwwwdividendgrowthinvestorcom200906coca-cola-ko-dividend-
stock-analysishtml
6 httpfinanceyahoocomqs=ko
7 httpmoneycentralmsncomdetailstock_quoteSymbol=Ko
842019 Pepsi and Coca-cola(RH6802B54)
httpslidepdfcomreaderfullpepsi-and-coca-colarh6802b54 1322
Pepsi
Type Cola
Manufacturer PepsiCo
Country of origin United States
Introduced1898 (as Brads Drink)June 16 1903 (as Pepsi-Cola)
1961 (as Pepsi)
Related products
Coca-ColaFantaDr Pepper Sprite (soft drink)Irn BruCola TurkaBig Cola
History
Pepsi is a carbonated soft drink produced and manufactured by PepsiCo It is sold in many placessuch as retail stores restaurants schools cinemas and from vending machines The drink was firstmade in the 1890s by pharmacist Caleb Bradham in New Bern North Carolina The brand wastrademarked on June 16 1903 There have been many Pepsi variants produced over the years since1898
In October 2008 Pepsi announced that it would be redesigning its logo and re-branding many of its products by early 2009 In 2009 Pepsi Diet Pepsi and Pepsi Max began using all lower-case fonts for name brands and Diet Pepsi Max was re-branded as Pepsi Max The brands blue and red globetrademark became a series of smiles with the central white band arcing at different angles
depending on the product Pepsi in countries such as the US Canada Brazil Bolivia Guatemala Nicaragua Honduras El Salvador Colombia Argentina Puerto Rico and Australia is carrying thesmile logo while the rest of the countries continue to use the old design on all packagingIn mid-September 2009the new logo has started to appear on 300 and 600ml bottles of Pepsi inAustralia Pepsi Max bottles still carry the current logo as of 27th September
Large Block Holder Type Number
Institutions 1764 Total Number of Shares Held156 B of Shares Owned by all Large Block Holders10000
Mutual Fund 2759
Other Major 25
Total Number of LargeBlock Holders 4548
842019 Pepsi and Coca-cola(RH6802B54)
httpslidepdfcomreaderfullpepsi-and-coca-colarh6802b54 1422
PEPSICO INC Dividends amp Splits
Upcoming Dividends
Payable AmountShare Ex-Date Record Declaration Set Alert
010410 $045 120209 120409 1113095 Year Dividend History
Payable AmountShare Ex-Date Record Declaration
01042010 $045 12022009 12042009 11162009
09302009 $045 09022009 09042009 08132009
06302009 $045 06032009 06052009 05062009
03312009 $0425 03042009 03062009 02072009
01022009 $0425 12032008 12052008 11172008
09302008 $0425 09032008 09052008 07192008
06302008 $0425 06042008 06062008 05082008
03312008 $0375 03052008 03072008 02022008
01022008 $0375 12052007 12072007 11172007
09282007 $0375 09052007 09072007 07202007
06292007 $0375 06062007 06082007 05092007
03302007 $030 03072007 03092007 02032007
01022007 $030 12062006 12082006 11182006
09292006 $030 09062006 09082006 07222006
06302006 $030 06072006 06092006 0504200603312006 $026 03082006 03102006 02042006
01032006 $026 12072005 12092005 11192005
09302005 $026 09072005 09092005 07232005
06302005 $026 06082005 06102005 05052005
03312005 $023 03092005 03112005 01282005
PEPSICO INC Income Statement
ViewAnnual Data | Quarterly Data
Period EndingQ3FY09 Q2 FY09 Q1 FY09 Q4 FY08 Q3 FY08
Net SalesRevenues 1108 B 1059 B 826 B 1273 B 1124 B
Cost of Goods Sold (ExcludingDepreciation)
476 B 452 B 344 B 617 B 490 B
Depreciation Depletion andAmortization
42200M
37100 M 31400 M 2100 M 37700 M
Gross Income 590 B 570 B 451 B 654 B 596 B
Selling General amp Admin Expenses 365 B 350 B 290 B 532 B 398 B
Other Operating Expense 157 B 161 B 144 B 152 B 142 B
842019 Pepsi and Coca-cola(RH6802B54)
httpslidepdfcomreaderfullpepsi-and-coca-colarh6802b54 1522
Period EndingQ3FY09 Q2 FY09 Q1 FY09 Q4 FY08 Q3 FY08
Net SalesRevenues 1108 B 1059 B 826 B 1273 B 1124 B
Operating Income 223 B 220 B 161 B 121 B 198 B
Extraordinary Credit - Pretax 9300 M 000 000 000 000
Extraordinary Charge - Pretax 000 20900 M 9100 M 90800 M 17600 M
Pretax Equity in Earnings 000 000 000 000 000
Other IncomeExpenses - Net 1600 M 42400 M 200 M 90800 M 19200 M
Pretax Income 216 B 212 B 149 B 108 B 192 B
Income Taxes 57500M
56800 M 37400 M 29300 M 55000 M
Minority Interest 1600 M 800 M 600 M 000 000
Equity in Earnings 000 000 000 000 000
Discontinued Operations 000 000 000 000 000
Net Income Before ExtraItemsPreferred Div
172 B 166 B 114 B 71900 M 158 B
Extra Items amp Gain (Loss) Sale of Assets
000 000 000 000 000
Net Income Before PreferredDividends
172 B 166 B 114 B 71900 M 158 B
Preferred Dividend Requirements 000 100 M 300 M 000 200 M
Net Income Used to CalculateDiluted EPS
mdash mdash mdash mdash mdash
Net Income Used to Calculate BasicEPS
mdash mdash mdash mdash mdash
Net Income Available to Common 172 B 166 B 114 B 71900 M 157 B
Period Ending FY2008 FY2007 FY2006 FY2005 FY2004
Net SalesRevenues 4325 B 3947 B 3514 B 3256 B 2926 B
Cost of Goods Sold (ExcludingDepreciation)
1878 B 1667 B 1452 B 1302 B 1229 B
Depreciation Depletion andAmortization
154 B 143 B 141 B 131 B 126 B
Gross Income 2292 B 2138 B 1921 B 1824 B 1571 B
Selling General amp AdminExpenses
1545 B 1411 B 1277 B 1231 B 1030 B
Other Operating Expense 000 000 000 000 000
Operating Expenses - Total 157 B 161 B 144 B 152 B 142 B
Operating Income 748 B 727 B 644 B 592 B 541 B
Extraordinary Credit - Pretax 000 000 000 000 000
842019 Pepsi and Coca-cola(RH6802B54)
httpslidepdfcomreaderfullpepsi-and-coca-colarh6802b54 1622
Period EndingQ3FY09 Q2 FY09 Q1 FY09 Q4 FY08 Q3 FY08
Net SalesRevenues 1108 B 1059 B 826 B 1273 B 1124 B
Extraordinary Charge - Pretax 54300
M
10200 M 15000 M 20600 M mdash
Non-operating Interest Income 4100 M 12500 M 17300 M 15900 M 7400 M
Reserves Inc (Dec) 000 000 000 000 000
Pretax Equity in Earnings 000 000 000 000 000
Other IncomeExpenses - Net 000 000 000 000 000
Earnings Before Interest amp Taxes(EBIT)
698 B 730 B 661 B 608 B 533 B
Interest Expenses On Debt 34300M
24500 M 25500 M 26100 M 16900 M
Interest Capitalized 1400 M 2100 M 1600 M 500 M 200 MPretax Income 665 B 707 B 637 B 582 B 517 B
Income Taxes 188 B 197 B 135 B 230 B 137 B
Current Domestic Income Tax 90200M
153 B 83200 M 176 B 110 B
Current Foreign Income Tax 73200M
48900M
56900 M 42600 M 25600 M
Deferred Domestic Income Tax 31400M
2400 M -3800 M 14800 M 1200 M
Deferred Foreign Income Tax -6900M
-6600M
-1600 M -2600 M 500 M
Income Tax Credits mdash mdash mdash mdash mdash
Minority Interest 000 000 000 000 000
Equity in Earnings 37400M
56000 M 61600 M 55700 M 38000 M
After Tax Income Expense 000 000 000 000 000
Discontinued Operations 000 000 000 000 3800 M
Net Income Before ExtraItemsPreferred Div
514 B 566 B 564 B 408 B 421 B
Extra Items amp Gain (Loss) Sale of Assets
000 000 000 000 000
Net Income Before PreferredDividends
514 B 566 B 564 B 408 B 421 B
Preferred Dividend Requirements 1000 M 1200 M 1100 M 1800 M 2500 M
Net Income Available to Common 514 B 566 B 564 B 408 B 421 B
Seasonal Performance Data PEP
Returns Jan Feb Mar Apr May Jun Jul Aug Sep Oct Nov Dec
AvgReturns -289 -033 154 024 252 -224 316 200 373 -293 095 006
Times PEP Stock Price 49 45 56 51 54 46 57 58 58 52 54 50
842019 Pepsi and Coca-cola(RH6802B54)
httpslidepdfcomreaderfullpepsi-and-coca-colarh6802b54 1722
Returns Jan Feb Mar Apr May Jun Jul Aug Sep Oct Nov Dec
Increased
Times PEP Stock PriceUnchanged
0 0 1 0 2 1 1 0 0 0 1 1
Times PEP Stock Price
Decreased52 51 52 52 50 61 47 53 44 59 47 54
2009 -828 -415 694 -333 460 559 326 -013 351 322 276 acirceurordquo
2008 -1015 201 386 -514 -033 -689 467 288 407 -2000 -053 -339
2007 430 -319 065 398 339 -508 119 367 769 063 469 -165
2006 -321 338 -222 078 381 -068 556 300 -002 -278 -231 094
2005 287 030 -153 492 111 -413 111 059 339 427 012 -019
2004 acirceurordquo acirceurordquo acirceurordquo acirceurordquo acirceurordquo acirceurordquo acirceurordquo acirceurordquo acirceurordquo acirceurordquo acirceurordquo 459
PepsiCo (PEP) Dividend Stock Analysis
PepsiCo Inc manufactures markets and sells various snacks carbonated and non-carbonated
beverages and foods worldwidePepsiCo is a major component of the SampP 500 Dow Industrials and
the Dividend Aristocrats Indexes PepsiCo has been consistently increasing its dividends for 36
consecutive years From the end of 1998 up until December 2008 this dividend growth stock has
delivered a 470 annual average total return to its shareholders
At the same time company has managed to deliver a 990 average annual increase in its EPS since
1999
842019 Pepsi and Coca-cola(RH6802B54)
httpslidepdfcomreaderfullpepsi-and-coca-colarh6802b54 1822
The ROE has remained largely between 31 and 38 with the exception of 2004 when it fell to as
low as 22
Annual dividend payments have increased by an average of 1350 annually since 1999 which is
much higher than the growth in EPS Analysts are expecting slight increase in EPS for 2009
compared to 2008 given the sluggish state of North American economies The strong US dollar could
potentially hurt sales as over 44 of PepsiCorsquos revenues are derived internationally
A 1350 growth in dividends translates into the dividend payment doubling almost every five years
Since 1978 PepsiCo has actually managed to double its dividend payment every six years on average
The dividend payout has remained in a range between 31 and 42 In 2008 the dividend payout
ratio has surged to 51 A lower payout is always a plus since it leaves room for consistent dividend
growth minimizing the impact of short-term fluctuations in earnings The slow growth in earnings
could put future dividend increases at risk
842019 Pepsi and Coca-cola(RH6802B54)
httpslidepdfcomreaderfullpepsi-and-coca-colarh6802b54 1922
842019 Pepsi and Coca-cola(RH6802B54)
httpslidepdfcomreaderfullpepsi-and-coca-colarh6802b54 2022
Though carbonated soft drinks remain the most popular beverage PEP recognizes that non-carbonated soft drinks are a faster growing category The company is focusing on the health andwellness trends It has eliminated trans fats from many of its snack foods and is introducing ldquogoodforyourdquo foods under the Quaker Oats brand Risks include the highly competitive and very maturenature of it products also with more exposure to foreign markets political and currency risks alsoincrease
Conclusion PEP did not earn any Stars in the Fair Value section earned two Stars in the DividendAnalytical Data section and earned one Star in the Dividend Income vs MMA section for a total of three Stars This quantitatively ranks PEP as a 3 Star-Hold
Using my D4L-PreScreenxls model I determined the share price could increase to $6562 beforePEPrsquos NPV MMA Differential fell to the $500 that I like to see for a stock with 37 consecutive yearsof dividend increases At that price the stock would yield 270
Resetting the D4L-PreScreenxls model and solving for the dividend growth rate needed to generatethe target $500 NPV MMA Differential the calculated rate is 63 This dividend growth rate is
lower than the the 76 used in this analysis thus providing a margin of safety PEP has a risk rating of 100 which classifies it as a low risk stock
Like its competition Coca-Cola (KO) PEPrsquos Free Cash Flow Payout currently at 70 tends toremain higher than the 60 level that I prefer However this is mitigated to an extent by relativelylow debt levels and predictable cash flows PEP is a stock I will buy as my allocation allows andwhen it dips below its buy price of $5510 For additional information including the stockrsquos dividendhistory please refer to its data page
Stock price of last five years with monthly price list
842019 Pepsi and Coca-cola(RH6802B54)
httpslidepdfcomreaderfullpepsi-and-coca-colarh6802b54 2122
PRICES
Date Open High Low Close Volume Adj Close
4-Dec-09 6318 6400 6308 6385 8907000 6385
3-Dec-09 6358 6359 6267 6276 6406200 6276
2-Dec-09 6350 6374 6317 6365 6195800 6365
2-Dec-09 $ 045 Dividend
1-Dec-09 6268 6393 6249 6387 6887700 6342
30-Nov-09 6264 6283 6215 6222 7252700 6178
27-Nov-09 6224 6255 6175 6230 3416000 6186
25-Nov-09 6253 6327 6249 6319 4672600 6274
24-Nov-09 6262 6265 6213 6250 4139700 6206
23-Nov-09 6246 6299 6226 6249 5009400 6205
20-Nov-09 6167 6231 6143 6208 5314600 6164
19-Nov-09 6210 6210 6135 6188 4390400 6144
18-Nov-09 6244 6251 6181 6230 3952300 6186
17-Nov-09 6242 6263 6203 6260 4362400 6216
16-Nov-09 6221 6249 6194 6243 4966800 6199
13-Nov-09 6163 6213 6135 6194 6411100 6150
12-Nov-09 6249 6275 6110 6127 8474900 6084
11-Nov-09 6234 6268 6208 6260 4714300 6216
10-Nov-09 6217 6294 6193 6208 7094100 6164
9-Nov-09 6181 6232 6143 6228 6921800 6184
6-Nov-09 6099 6176 6079 6176 4831000 6132
5-Nov-09 6044 6141 6042 6123 5578500 6080
4-Nov-09 6016 6096 5979 6038 5552100 5995
3-Nov-09 6029 6039 5962 6006 5797000 5964
2-Nov-09 6079 6107 6016 6060 6618800 601730-Oct-09 6135 6164 6037 6055 7794100 6012
29-Oct-09 6101 6146 6057 6139 5245300 6096
28-Oct-09 6088 6152 6075 6099 6321900 6056
27-Oct-09 6064 6135 6010 6100 7262900 6057
26-Oct-09 6114 6150 6021 6047 5113000 6004
23-Oct-09 6141 6167 6058 6103 6505200 6060
22-Oct-09 6190 6190 6087 6150 5428100 6107
21-Oct-09 6138 6234 6123 6184 7445000 6140
20-Oct-09 6200 6205 6112 6158 8068000 6115
19-Oct-09 6228 6257 6190 6205 5557300 616116-Oct-09 6247 6268 6211 6229 6588400 6185
15-Oct-09 6157 6275 6139 6268 10518600 6224
14-Oct-09 6094 6168 6070 6162 8462200 6119
13-Oct-09 6088 6100 6052 6060 7502000 6017
12-Oct-09 6043 6136 6025 6092 6178100 6049
9-Oct-09 6038 6070 5981 6059 6360200 6016
8-Oct-09 6124 6124 5980 6039 17263400 5996
7-Oct-09 6085 6138 6045 6117 6441900 6074
6-Oct-09 6105 6127 6042 6087 8128900 6044
5-Oct-09 6083 6124 6014 6085 7892000 60422-Oct-09 5912 6124 5893 6090 17530200 6047
1-Oct-09 5870 5899 5827 5846 9010200 5805
30-Sep-09 5874 5886 5801 5866 8898400 5825
29-Sep-09 5910 5931 5800 5851 7086400 5810
28-Sep-09 5895 5949 5862 5903 4085900 5861
25-Sep-09 5850 5913 5832 5868 6758800 5827
842019 Pepsi and Coca-cola(RH6802B54)
httpslidepdfcomreaderfullpepsi-and-coca-colarh6802b54 2222
References
1 httpwwwcoca-colacomindexjsp2 httpfinanceaolcomquotesthe-coca-cola-companykonys
3 httpfinanceaolcomeventthe-pepsi-bottling-group-incpbgnys
4 httpfinanceyahoocomqs=ko
5 httpwwwdividendgrowthinvestorcom200906coca-cola-ko-dividend-
stock-analysishtml
6 httpfinanceyahoocomqs=ko
7 httpmoneycentralmsncomdetailstock_quoteSymbol=Ko
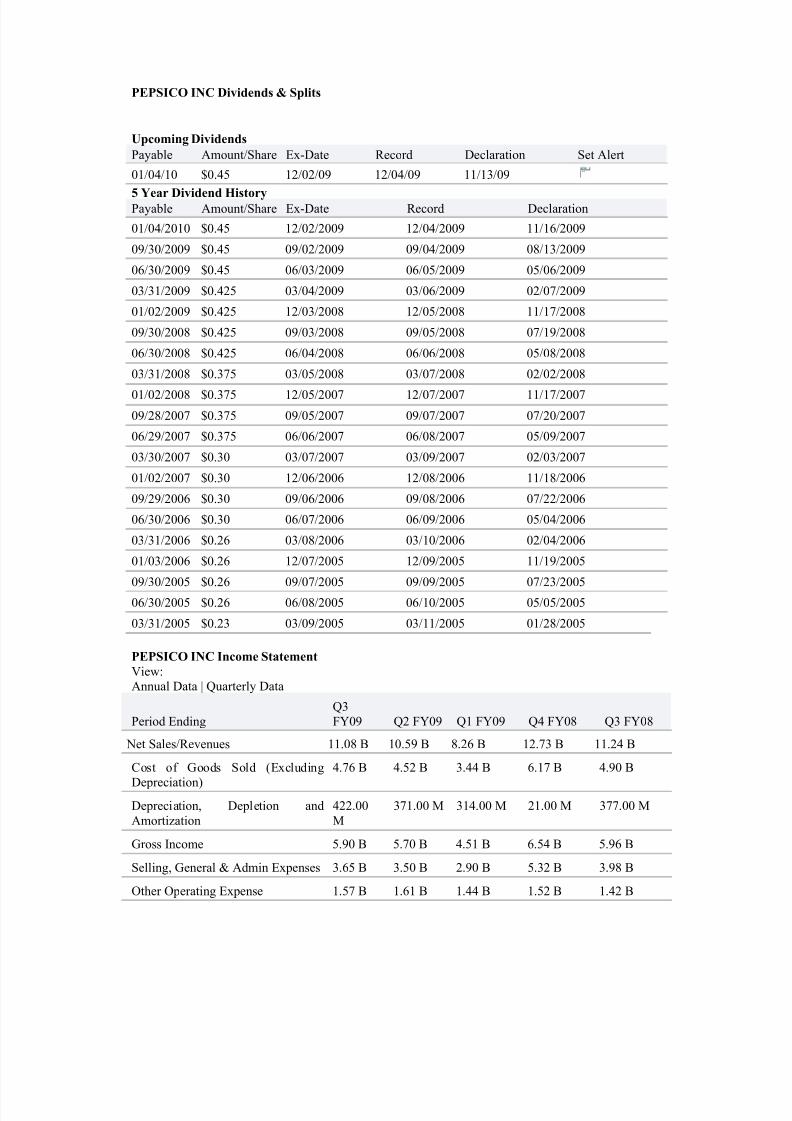
842019 Pepsi and Coca-cola(RH6802B54)
httpslidepdfcomreaderfullpepsi-and-coca-colarh6802b54 1422
PEPSICO INC Dividends amp Splits
Upcoming Dividends
Payable AmountShare Ex-Date Record Declaration Set Alert
010410 $045 120209 120409 1113095 Year Dividend History
Payable AmountShare Ex-Date Record Declaration
01042010 $045 12022009 12042009 11162009
09302009 $045 09022009 09042009 08132009
06302009 $045 06032009 06052009 05062009
03312009 $0425 03042009 03062009 02072009
01022009 $0425 12032008 12052008 11172008
09302008 $0425 09032008 09052008 07192008
06302008 $0425 06042008 06062008 05082008
03312008 $0375 03052008 03072008 02022008
01022008 $0375 12052007 12072007 11172007
09282007 $0375 09052007 09072007 07202007
06292007 $0375 06062007 06082007 05092007
03302007 $030 03072007 03092007 02032007
01022007 $030 12062006 12082006 11182006
09292006 $030 09062006 09082006 07222006
06302006 $030 06072006 06092006 0504200603312006 $026 03082006 03102006 02042006
01032006 $026 12072005 12092005 11192005
09302005 $026 09072005 09092005 07232005
06302005 $026 06082005 06102005 05052005
03312005 $023 03092005 03112005 01282005
PEPSICO INC Income Statement
ViewAnnual Data | Quarterly Data
Period EndingQ3FY09 Q2 FY09 Q1 FY09 Q4 FY08 Q3 FY08
Net SalesRevenues 1108 B 1059 B 826 B 1273 B 1124 B
Cost of Goods Sold (ExcludingDepreciation)
476 B 452 B 344 B 617 B 490 B
Depreciation Depletion andAmortization
42200M
37100 M 31400 M 2100 M 37700 M
Gross Income 590 B 570 B 451 B 654 B 596 B
Selling General amp Admin Expenses 365 B 350 B 290 B 532 B 398 B
Other Operating Expense 157 B 161 B 144 B 152 B 142 B
842019 Pepsi and Coca-cola(RH6802B54)
httpslidepdfcomreaderfullpepsi-and-coca-colarh6802b54 1522
Period EndingQ3FY09 Q2 FY09 Q1 FY09 Q4 FY08 Q3 FY08
Net SalesRevenues 1108 B 1059 B 826 B 1273 B 1124 B
Operating Income 223 B 220 B 161 B 121 B 198 B
Extraordinary Credit - Pretax 9300 M 000 000 000 000
Extraordinary Charge - Pretax 000 20900 M 9100 M 90800 M 17600 M
Pretax Equity in Earnings 000 000 000 000 000
Other IncomeExpenses - Net 1600 M 42400 M 200 M 90800 M 19200 M
Pretax Income 216 B 212 B 149 B 108 B 192 B
Income Taxes 57500M
56800 M 37400 M 29300 M 55000 M
Minority Interest 1600 M 800 M 600 M 000 000
Equity in Earnings 000 000 000 000 000
Discontinued Operations 000 000 000 000 000
Net Income Before ExtraItemsPreferred Div
172 B 166 B 114 B 71900 M 158 B
Extra Items amp Gain (Loss) Sale of Assets
000 000 000 000 000
Net Income Before PreferredDividends
172 B 166 B 114 B 71900 M 158 B
Preferred Dividend Requirements 000 100 M 300 M 000 200 M
Net Income Used to CalculateDiluted EPS
mdash mdash mdash mdash mdash
Net Income Used to Calculate BasicEPS
mdash mdash mdash mdash mdash
Net Income Available to Common 172 B 166 B 114 B 71900 M 157 B
Period Ending FY2008 FY2007 FY2006 FY2005 FY2004
Net SalesRevenues 4325 B 3947 B 3514 B 3256 B 2926 B
Cost of Goods Sold (ExcludingDepreciation)
1878 B 1667 B 1452 B 1302 B 1229 B
Depreciation Depletion andAmortization
154 B 143 B 141 B 131 B 126 B
Gross Income 2292 B 2138 B 1921 B 1824 B 1571 B
Selling General amp AdminExpenses
1545 B 1411 B 1277 B 1231 B 1030 B
Other Operating Expense 000 000 000 000 000
Operating Expenses - Total 157 B 161 B 144 B 152 B 142 B
Operating Income 748 B 727 B 644 B 592 B 541 B
Extraordinary Credit - Pretax 000 000 000 000 000
842019 Pepsi and Coca-cola(RH6802B54)
httpslidepdfcomreaderfullpepsi-and-coca-colarh6802b54 1622
Period EndingQ3FY09 Q2 FY09 Q1 FY09 Q4 FY08 Q3 FY08
Net SalesRevenues 1108 B 1059 B 826 B 1273 B 1124 B
Extraordinary Charge - Pretax 54300
M
10200 M 15000 M 20600 M mdash
Non-operating Interest Income 4100 M 12500 M 17300 M 15900 M 7400 M
Reserves Inc (Dec) 000 000 000 000 000
Pretax Equity in Earnings 000 000 000 000 000
Other IncomeExpenses - Net 000 000 000 000 000
Earnings Before Interest amp Taxes(EBIT)
698 B 730 B 661 B 608 B 533 B
Interest Expenses On Debt 34300M
24500 M 25500 M 26100 M 16900 M
Interest Capitalized 1400 M 2100 M 1600 M 500 M 200 MPretax Income 665 B 707 B 637 B 582 B 517 B
Income Taxes 188 B 197 B 135 B 230 B 137 B
Current Domestic Income Tax 90200M
153 B 83200 M 176 B 110 B
Current Foreign Income Tax 73200M
48900M
56900 M 42600 M 25600 M
Deferred Domestic Income Tax 31400M
2400 M -3800 M 14800 M 1200 M
Deferred Foreign Income Tax -6900M
-6600M
-1600 M -2600 M 500 M
Income Tax Credits mdash mdash mdash mdash mdash
Minority Interest 000 000 000 000 000
Equity in Earnings 37400M
56000 M 61600 M 55700 M 38000 M
After Tax Income Expense 000 000 000 000 000
Discontinued Operations 000 000 000 000 3800 M
Net Income Before ExtraItemsPreferred Div
514 B 566 B 564 B 408 B 421 B
Extra Items amp Gain (Loss) Sale of Assets
000 000 000 000 000
Net Income Before PreferredDividends
514 B 566 B 564 B 408 B 421 B
Preferred Dividend Requirements 1000 M 1200 M 1100 M 1800 M 2500 M
Net Income Available to Common 514 B 566 B 564 B 408 B 421 B
Seasonal Performance Data PEP
Returns Jan Feb Mar Apr May Jun Jul Aug Sep Oct Nov Dec
AvgReturns -289 -033 154 024 252 -224 316 200 373 -293 095 006
Times PEP Stock Price 49 45 56 51 54 46 57 58 58 52 54 50
842019 Pepsi and Coca-cola(RH6802B54)
httpslidepdfcomreaderfullpepsi-and-coca-colarh6802b54 1722
Returns Jan Feb Mar Apr May Jun Jul Aug Sep Oct Nov Dec
Increased
Times PEP Stock PriceUnchanged
0 0 1 0 2 1 1 0 0 0 1 1
Times PEP Stock Price
Decreased52 51 52 52 50 61 47 53 44 59 47 54
2009 -828 -415 694 -333 460 559 326 -013 351 322 276 acirceurordquo
2008 -1015 201 386 -514 -033 -689 467 288 407 -2000 -053 -339
2007 430 -319 065 398 339 -508 119 367 769 063 469 -165
2006 -321 338 -222 078 381 -068 556 300 -002 -278 -231 094
2005 287 030 -153 492 111 -413 111 059 339 427 012 -019
2004 acirceurordquo acirceurordquo acirceurordquo acirceurordquo acirceurordquo acirceurordquo acirceurordquo acirceurordquo acirceurordquo acirceurordquo acirceurordquo 459
PepsiCo (PEP) Dividend Stock Analysis
PepsiCo Inc manufactures markets and sells various snacks carbonated and non-carbonated
beverages and foods worldwidePepsiCo is a major component of the SampP 500 Dow Industrials and
the Dividend Aristocrats Indexes PepsiCo has been consistently increasing its dividends for 36
consecutive years From the end of 1998 up until December 2008 this dividend growth stock has
delivered a 470 annual average total return to its shareholders
At the same time company has managed to deliver a 990 average annual increase in its EPS since
1999
842019 Pepsi and Coca-cola(RH6802B54)
httpslidepdfcomreaderfullpepsi-and-coca-colarh6802b54 1822
The ROE has remained largely between 31 and 38 with the exception of 2004 when it fell to as
low as 22
Annual dividend payments have increased by an average of 1350 annually since 1999 which is
much higher than the growth in EPS Analysts are expecting slight increase in EPS for 2009
compared to 2008 given the sluggish state of North American economies The strong US dollar could
potentially hurt sales as over 44 of PepsiCorsquos revenues are derived internationally
A 1350 growth in dividends translates into the dividend payment doubling almost every five years
Since 1978 PepsiCo has actually managed to double its dividend payment every six years on average
The dividend payout has remained in a range between 31 and 42 In 2008 the dividend payout
ratio has surged to 51 A lower payout is always a plus since it leaves room for consistent dividend
growth minimizing the impact of short-term fluctuations in earnings The slow growth in earnings
could put future dividend increases at risk
842019 Pepsi and Coca-cola(RH6802B54)
httpslidepdfcomreaderfullpepsi-and-coca-colarh6802b54 1922
842019 Pepsi and Coca-cola(RH6802B54)
httpslidepdfcomreaderfullpepsi-and-coca-colarh6802b54 2022
Though carbonated soft drinks remain the most popular beverage PEP recognizes that non-carbonated soft drinks are a faster growing category The company is focusing on the health andwellness trends It has eliminated trans fats from many of its snack foods and is introducing ldquogoodforyourdquo foods under the Quaker Oats brand Risks include the highly competitive and very maturenature of it products also with more exposure to foreign markets political and currency risks alsoincrease
Conclusion PEP did not earn any Stars in the Fair Value section earned two Stars in the DividendAnalytical Data section and earned one Star in the Dividend Income vs MMA section for a total of three Stars This quantitatively ranks PEP as a 3 Star-Hold
Using my D4L-PreScreenxls model I determined the share price could increase to $6562 beforePEPrsquos NPV MMA Differential fell to the $500 that I like to see for a stock with 37 consecutive yearsof dividend increases At that price the stock would yield 270
Resetting the D4L-PreScreenxls model and solving for the dividend growth rate needed to generatethe target $500 NPV MMA Differential the calculated rate is 63 This dividend growth rate is
lower than the the 76 used in this analysis thus providing a margin of safety PEP has a risk rating of 100 which classifies it as a low risk stock
Like its competition Coca-Cola (KO) PEPrsquos Free Cash Flow Payout currently at 70 tends toremain higher than the 60 level that I prefer However this is mitigated to an extent by relativelylow debt levels and predictable cash flows PEP is a stock I will buy as my allocation allows andwhen it dips below its buy price of $5510 For additional information including the stockrsquos dividendhistory please refer to its data page
Stock price of last five years with monthly price list
842019 Pepsi and Coca-cola(RH6802B54)
httpslidepdfcomreaderfullpepsi-and-coca-colarh6802b54 2122
PRICES
Date Open High Low Close Volume Adj Close
4-Dec-09 6318 6400 6308 6385 8907000 6385
3-Dec-09 6358 6359 6267 6276 6406200 6276
2-Dec-09 6350 6374 6317 6365 6195800 6365
2-Dec-09 $ 045 Dividend
1-Dec-09 6268 6393 6249 6387 6887700 6342
30-Nov-09 6264 6283 6215 6222 7252700 6178
27-Nov-09 6224 6255 6175 6230 3416000 6186
25-Nov-09 6253 6327 6249 6319 4672600 6274
24-Nov-09 6262 6265 6213 6250 4139700 6206
23-Nov-09 6246 6299 6226 6249 5009400 6205
20-Nov-09 6167 6231 6143 6208 5314600 6164
19-Nov-09 6210 6210 6135 6188 4390400 6144
18-Nov-09 6244 6251 6181 6230 3952300 6186
17-Nov-09 6242 6263 6203 6260 4362400 6216
16-Nov-09 6221 6249 6194 6243 4966800 6199
13-Nov-09 6163 6213 6135 6194 6411100 6150
12-Nov-09 6249 6275 6110 6127 8474900 6084
11-Nov-09 6234 6268 6208 6260 4714300 6216
10-Nov-09 6217 6294 6193 6208 7094100 6164
9-Nov-09 6181 6232 6143 6228 6921800 6184
6-Nov-09 6099 6176 6079 6176 4831000 6132
5-Nov-09 6044 6141 6042 6123 5578500 6080
4-Nov-09 6016 6096 5979 6038 5552100 5995
3-Nov-09 6029 6039 5962 6006 5797000 5964
2-Nov-09 6079 6107 6016 6060 6618800 601730-Oct-09 6135 6164 6037 6055 7794100 6012
29-Oct-09 6101 6146 6057 6139 5245300 6096
28-Oct-09 6088 6152 6075 6099 6321900 6056
27-Oct-09 6064 6135 6010 6100 7262900 6057
26-Oct-09 6114 6150 6021 6047 5113000 6004
23-Oct-09 6141 6167 6058 6103 6505200 6060
22-Oct-09 6190 6190 6087 6150 5428100 6107
21-Oct-09 6138 6234 6123 6184 7445000 6140
20-Oct-09 6200 6205 6112 6158 8068000 6115
19-Oct-09 6228 6257 6190 6205 5557300 616116-Oct-09 6247 6268 6211 6229 6588400 6185
15-Oct-09 6157 6275 6139 6268 10518600 6224
14-Oct-09 6094 6168 6070 6162 8462200 6119
13-Oct-09 6088 6100 6052 6060 7502000 6017
12-Oct-09 6043 6136 6025 6092 6178100 6049
9-Oct-09 6038 6070 5981 6059 6360200 6016
8-Oct-09 6124 6124 5980 6039 17263400 5996
7-Oct-09 6085 6138 6045 6117 6441900 6074
6-Oct-09 6105 6127 6042 6087 8128900 6044
5-Oct-09 6083 6124 6014 6085 7892000 60422-Oct-09 5912 6124 5893 6090 17530200 6047
1-Oct-09 5870 5899 5827 5846 9010200 5805
30-Sep-09 5874 5886 5801 5866 8898400 5825
29-Sep-09 5910 5931 5800 5851 7086400 5810
28-Sep-09 5895 5949 5862 5903 4085900 5861
25-Sep-09 5850 5913 5832 5868 6758800 5827
842019 Pepsi and Coca-cola(RH6802B54)
httpslidepdfcomreaderfullpepsi-and-coca-colarh6802b54 2222
References
1 httpwwwcoca-colacomindexjsp2 httpfinanceaolcomquotesthe-coca-cola-companykonys
3 httpfinanceaolcomeventthe-pepsi-bottling-group-incpbgnys
4 httpfinanceyahoocomqs=ko
5 httpwwwdividendgrowthinvestorcom200906coca-cola-ko-dividend-
stock-analysishtml
6 httpfinanceyahoocomqs=ko
7 httpmoneycentralmsncomdetailstock_quoteSymbol=Ko
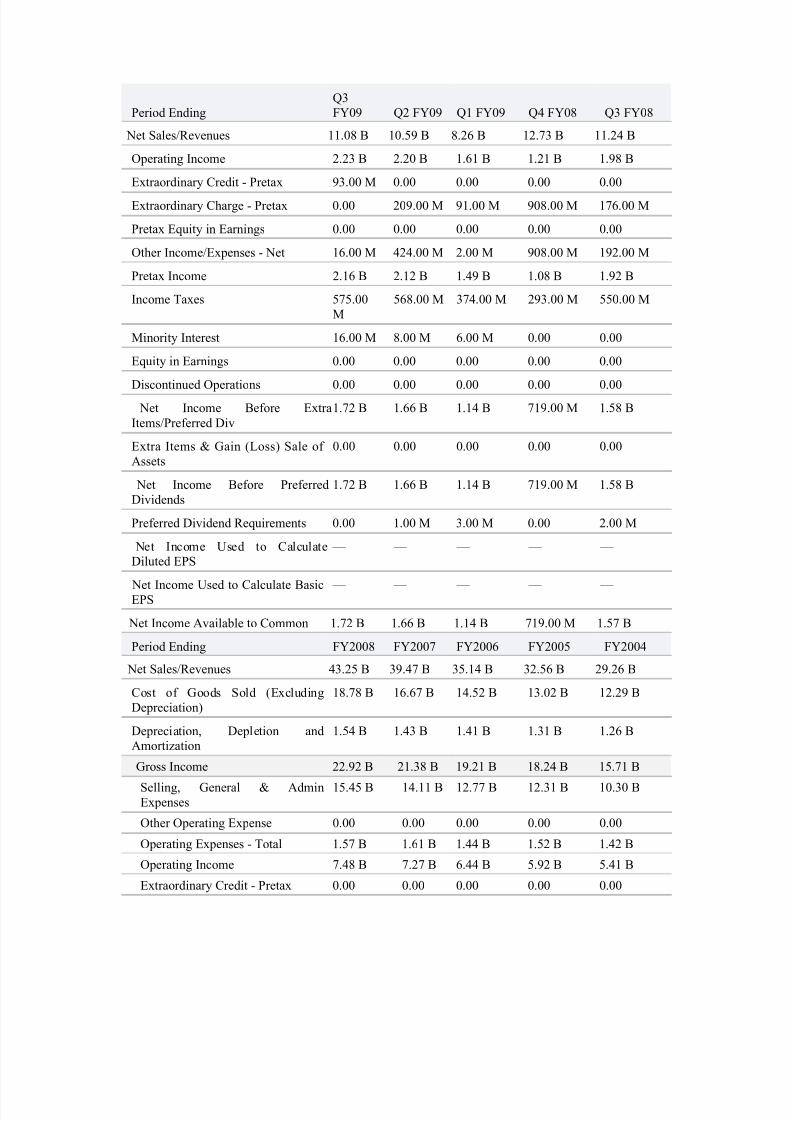
842019 Pepsi and Coca-cola(RH6802B54)
httpslidepdfcomreaderfullpepsi-and-coca-colarh6802b54 1522
Period EndingQ3FY09 Q2 FY09 Q1 FY09 Q4 FY08 Q3 FY08
Net SalesRevenues 1108 B 1059 B 826 B 1273 B 1124 B
Operating Income 223 B 220 B 161 B 121 B 198 B
Extraordinary Credit - Pretax 9300 M 000 000 000 000
Extraordinary Charge - Pretax 000 20900 M 9100 M 90800 M 17600 M
Pretax Equity in Earnings 000 000 000 000 000
Other IncomeExpenses - Net 1600 M 42400 M 200 M 90800 M 19200 M
Pretax Income 216 B 212 B 149 B 108 B 192 B
Income Taxes 57500M
56800 M 37400 M 29300 M 55000 M
Minority Interest 1600 M 800 M 600 M 000 000
Equity in Earnings 000 000 000 000 000
Discontinued Operations 000 000 000 000 000
Net Income Before ExtraItemsPreferred Div
172 B 166 B 114 B 71900 M 158 B
Extra Items amp Gain (Loss) Sale of Assets
000 000 000 000 000
Net Income Before PreferredDividends
172 B 166 B 114 B 71900 M 158 B
Preferred Dividend Requirements 000 100 M 300 M 000 200 M
Net Income Used to CalculateDiluted EPS
mdash mdash mdash mdash mdash
Net Income Used to Calculate BasicEPS
mdash mdash mdash mdash mdash
Net Income Available to Common 172 B 166 B 114 B 71900 M 157 B
Period Ending FY2008 FY2007 FY2006 FY2005 FY2004
Net SalesRevenues 4325 B 3947 B 3514 B 3256 B 2926 B
Cost of Goods Sold (ExcludingDepreciation)
1878 B 1667 B 1452 B 1302 B 1229 B
Depreciation Depletion andAmortization
154 B 143 B 141 B 131 B 126 B
Gross Income 2292 B 2138 B 1921 B 1824 B 1571 B
Selling General amp AdminExpenses
1545 B 1411 B 1277 B 1231 B 1030 B
Other Operating Expense 000 000 000 000 000
Operating Expenses - Total 157 B 161 B 144 B 152 B 142 B
Operating Income 748 B 727 B 644 B 592 B 541 B
Extraordinary Credit - Pretax 000 000 000 000 000
842019 Pepsi and Coca-cola(RH6802B54)
httpslidepdfcomreaderfullpepsi-and-coca-colarh6802b54 1622
Period EndingQ3FY09 Q2 FY09 Q1 FY09 Q4 FY08 Q3 FY08
Net SalesRevenues 1108 B 1059 B 826 B 1273 B 1124 B
Extraordinary Charge - Pretax 54300
M
10200 M 15000 M 20600 M mdash
Non-operating Interest Income 4100 M 12500 M 17300 M 15900 M 7400 M
Reserves Inc (Dec) 000 000 000 000 000
Pretax Equity in Earnings 000 000 000 000 000
Other IncomeExpenses - Net 000 000 000 000 000
Earnings Before Interest amp Taxes(EBIT)
698 B 730 B 661 B 608 B 533 B
Interest Expenses On Debt 34300M
24500 M 25500 M 26100 M 16900 M
Interest Capitalized 1400 M 2100 M 1600 M 500 M 200 MPretax Income 665 B 707 B 637 B 582 B 517 B
Income Taxes 188 B 197 B 135 B 230 B 137 B
Current Domestic Income Tax 90200M
153 B 83200 M 176 B 110 B
Current Foreign Income Tax 73200M
48900M
56900 M 42600 M 25600 M
Deferred Domestic Income Tax 31400M
2400 M -3800 M 14800 M 1200 M
Deferred Foreign Income Tax -6900M
-6600M
-1600 M -2600 M 500 M
Income Tax Credits mdash mdash mdash mdash mdash
Minority Interest 000 000 000 000 000
Equity in Earnings 37400M
56000 M 61600 M 55700 M 38000 M
After Tax Income Expense 000 000 000 000 000
Discontinued Operations 000 000 000 000 3800 M
Net Income Before ExtraItemsPreferred Div
514 B 566 B 564 B 408 B 421 B
Extra Items amp Gain (Loss) Sale of Assets
000 000 000 000 000
Net Income Before PreferredDividends
514 B 566 B 564 B 408 B 421 B
Preferred Dividend Requirements 1000 M 1200 M 1100 M 1800 M 2500 M
Net Income Available to Common 514 B 566 B 564 B 408 B 421 B
Seasonal Performance Data PEP
Returns Jan Feb Mar Apr May Jun Jul Aug Sep Oct Nov Dec
AvgReturns -289 -033 154 024 252 -224 316 200 373 -293 095 006
Times PEP Stock Price 49 45 56 51 54 46 57 58 58 52 54 50
842019 Pepsi and Coca-cola(RH6802B54)
httpslidepdfcomreaderfullpepsi-and-coca-colarh6802b54 1722
Returns Jan Feb Mar Apr May Jun Jul Aug Sep Oct Nov Dec
Increased
Times PEP Stock PriceUnchanged
0 0 1 0 2 1 1 0 0 0 1 1
Times PEP Stock Price
Decreased52 51 52 52 50 61 47 53 44 59 47 54
2009 -828 -415 694 -333 460 559 326 -013 351 322 276 acirceurordquo
2008 -1015 201 386 -514 -033 -689 467 288 407 -2000 -053 -339
2007 430 -319 065 398 339 -508 119 367 769 063 469 -165
2006 -321 338 -222 078 381 -068 556 300 -002 -278 -231 094
2005 287 030 -153 492 111 -413 111 059 339 427 012 -019
2004 acirceurordquo acirceurordquo acirceurordquo acirceurordquo acirceurordquo acirceurordquo acirceurordquo acirceurordquo acirceurordquo acirceurordquo acirceurordquo 459
PepsiCo (PEP) Dividend Stock Analysis
PepsiCo Inc manufactures markets and sells various snacks carbonated and non-carbonated
beverages and foods worldwidePepsiCo is a major component of the SampP 500 Dow Industrials and
the Dividend Aristocrats Indexes PepsiCo has been consistently increasing its dividends for 36
consecutive years From the end of 1998 up until December 2008 this dividend growth stock has
delivered a 470 annual average total return to its shareholders
At the same time company has managed to deliver a 990 average annual increase in its EPS since
1999
842019 Pepsi and Coca-cola(RH6802B54)
httpslidepdfcomreaderfullpepsi-and-coca-colarh6802b54 1822
The ROE has remained largely between 31 and 38 with the exception of 2004 when it fell to as
low as 22
Annual dividend payments have increased by an average of 1350 annually since 1999 which is
much higher than the growth in EPS Analysts are expecting slight increase in EPS for 2009
compared to 2008 given the sluggish state of North American economies The strong US dollar could
potentially hurt sales as over 44 of PepsiCorsquos revenues are derived internationally
A 1350 growth in dividends translates into the dividend payment doubling almost every five years
Since 1978 PepsiCo has actually managed to double its dividend payment every six years on average
The dividend payout has remained in a range between 31 and 42 In 2008 the dividend payout
ratio has surged to 51 A lower payout is always a plus since it leaves room for consistent dividend
growth minimizing the impact of short-term fluctuations in earnings The slow growth in earnings
could put future dividend increases at risk
842019 Pepsi and Coca-cola(RH6802B54)
httpslidepdfcomreaderfullpepsi-and-coca-colarh6802b54 1922
842019 Pepsi and Coca-cola(RH6802B54)
httpslidepdfcomreaderfullpepsi-and-coca-colarh6802b54 2022
Though carbonated soft drinks remain the most popular beverage PEP recognizes that non-carbonated soft drinks are a faster growing category The company is focusing on the health andwellness trends It has eliminated trans fats from many of its snack foods and is introducing ldquogoodforyourdquo foods under the Quaker Oats brand Risks include the highly competitive and very maturenature of it products also with more exposure to foreign markets political and currency risks alsoincrease
Conclusion PEP did not earn any Stars in the Fair Value section earned two Stars in the DividendAnalytical Data section and earned one Star in the Dividend Income vs MMA section for a total of three Stars This quantitatively ranks PEP as a 3 Star-Hold
Using my D4L-PreScreenxls model I determined the share price could increase to $6562 beforePEPrsquos NPV MMA Differential fell to the $500 that I like to see for a stock with 37 consecutive yearsof dividend increases At that price the stock would yield 270
Resetting the D4L-PreScreenxls model and solving for the dividend growth rate needed to generatethe target $500 NPV MMA Differential the calculated rate is 63 This dividend growth rate is
lower than the the 76 used in this analysis thus providing a margin of safety PEP has a risk rating of 100 which classifies it as a low risk stock
Like its competition Coca-Cola (KO) PEPrsquos Free Cash Flow Payout currently at 70 tends toremain higher than the 60 level that I prefer However this is mitigated to an extent by relativelylow debt levels and predictable cash flows PEP is a stock I will buy as my allocation allows andwhen it dips below its buy price of $5510 For additional information including the stockrsquos dividendhistory please refer to its data page
Stock price of last five years with monthly price list
842019 Pepsi and Coca-cola(RH6802B54)
httpslidepdfcomreaderfullpepsi-and-coca-colarh6802b54 2122
PRICES
Date Open High Low Close Volume Adj Close
4-Dec-09 6318 6400 6308 6385 8907000 6385
3-Dec-09 6358 6359 6267 6276 6406200 6276
2-Dec-09 6350 6374 6317 6365 6195800 6365
2-Dec-09 $ 045 Dividend
1-Dec-09 6268 6393 6249 6387 6887700 6342
30-Nov-09 6264 6283 6215 6222 7252700 6178
27-Nov-09 6224 6255 6175 6230 3416000 6186
25-Nov-09 6253 6327 6249 6319 4672600 6274
24-Nov-09 6262 6265 6213 6250 4139700 6206
23-Nov-09 6246 6299 6226 6249 5009400 6205
20-Nov-09 6167 6231 6143 6208 5314600 6164
19-Nov-09 6210 6210 6135 6188 4390400 6144
18-Nov-09 6244 6251 6181 6230 3952300 6186
17-Nov-09 6242 6263 6203 6260 4362400 6216
16-Nov-09 6221 6249 6194 6243 4966800 6199
13-Nov-09 6163 6213 6135 6194 6411100 6150
12-Nov-09 6249 6275 6110 6127 8474900 6084
11-Nov-09 6234 6268 6208 6260 4714300 6216
10-Nov-09 6217 6294 6193 6208 7094100 6164
9-Nov-09 6181 6232 6143 6228 6921800 6184
6-Nov-09 6099 6176 6079 6176 4831000 6132
5-Nov-09 6044 6141 6042 6123 5578500 6080
4-Nov-09 6016 6096 5979 6038 5552100 5995
3-Nov-09 6029 6039 5962 6006 5797000 5964
2-Nov-09 6079 6107 6016 6060 6618800 601730-Oct-09 6135 6164 6037 6055 7794100 6012
29-Oct-09 6101 6146 6057 6139 5245300 6096
28-Oct-09 6088 6152 6075 6099 6321900 6056
27-Oct-09 6064 6135 6010 6100 7262900 6057
26-Oct-09 6114 6150 6021 6047 5113000 6004
23-Oct-09 6141 6167 6058 6103 6505200 6060
22-Oct-09 6190 6190 6087 6150 5428100 6107
21-Oct-09 6138 6234 6123 6184 7445000 6140
20-Oct-09 6200 6205 6112 6158 8068000 6115
19-Oct-09 6228 6257 6190 6205 5557300 616116-Oct-09 6247 6268 6211 6229 6588400 6185
15-Oct-09 6157 6275 6139 6268 10518600 6224
14-Oct-09 6094 6168 6070 6162 8462200 6119
13-Oct-09 6088 6100 6052 6060 7502000 6017
12-Oct-09 6043 6136 6025 6092 6178100 6049
9-Oct-09 6038 6070 5981 6059 6360200 6016
8-Oct-09 6124 6124 5980 6039 17263400 5996
7-Oct-09 6085 6138 6045 6117 6441900 6074
6-Oct-09 6105 6127 6042 6087 8128900 6044
5-Oct-09 6083 6124 6014 6085 7892000 60422-Oct-09 5912 6124 5893 6090 17530200 6047
1-Oct-09 5870 5899 5827 5846 9010200 5805
30-Sep-09 5874 5886 5801 5866 8898400 5825
29-Sep-09 5910 5931 5800 5851 7086400 5810
28-Sep-09 5895 5949 5862 5903 4085900 5861
25-Sep-09 5850 5913 5832 5868 6758800 5827
842019 Pepsi and Coca-cola(RH6802B54)
httpslidepdfcomreaderfullpepsi-and-coca-colarh6802b54 2222
References
1 httpwwwcoca-colacomindexjsp2 httpfinanceaolcomquotesthe-coca-cola-companykonys
3 httpfinanceaolcomeventthe-pepsi-bottling-group-incpbgnys
4 httpfinanceyahoocomqs=ko
5 httpwwwdividendgrowthinvestorcom200906coca-cola-ko-dividend-
stock-analysishtml
6 httpfinanceyahoocomqs=ko
7 httpmoneycentralmsncomdetailstock_quoteSymbol=Ko
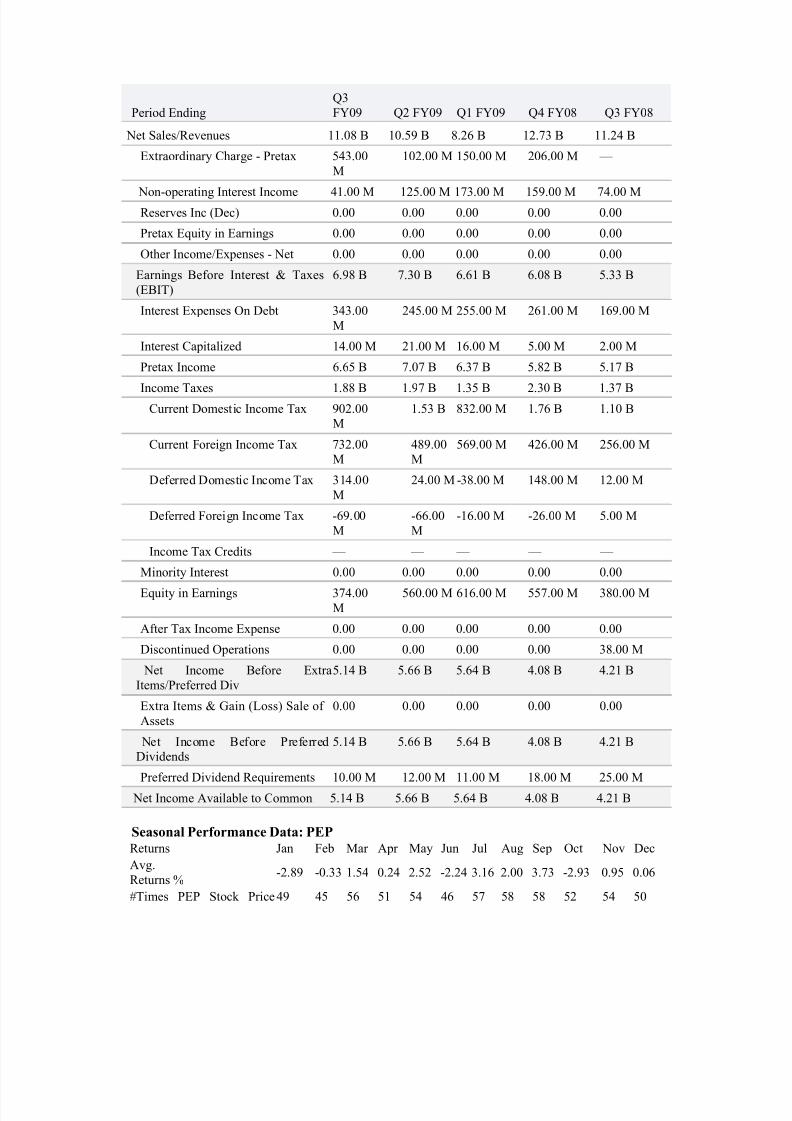
842019 Pepsi and Coca-cola(RH6802B54)
httpslidepdfcomreaderfullpepsi-and-coca-colarh6802b54 1622
Period EndingQ3FY09 Q2 FY09 Q1 FY09 Q4 FY08 Q3 FY08
Net SalesRevenues 1108 B 1059 B 826 B 1273 B 1124 B
Extraordinary Charge - Pretax 54300
M
10200 M 15000 M 20600 M mdash
Non-operating Interest Income 4100 M 12500 M 17300 M 15900 M 7400 M
Reserves Inc (Dec) 000 000 000 000 000
Pretax Equity in Earnings 000 000 000 000 000
Other IncomeExpenses - Net 000 000 000 000 000
Earnings Before Interest amp Taxes(EBIT)
698 B 730 B 661 B 608 B 533 B
Interest Expenses On Debt 34300M
24500 M 25500 M 26100 M 16900 M
Interest Capitalized 1400 M 2100 M 1600 M 500 M 200 MPretax Income 665 B 707 B 637 B 582 B 517 B
Income Taxes 188 B 197 B 135 B 230 B 137 B
Current Domestic Income Tax 90200M
153 B 83200 M 176 B 110 B
Current Foreign Income Tax 73200M
48900M
56900 M 42600 M 25600 M
Deferred Domestic Income Tax 31400M
2400 M -3800 M 14800 M 1200 M
Deferred Foreign Income Tax -6900M
-6600M
-1600 M -2600 M 500 M
Income Tax Credits mdash mdash mdash mdash mdash
Minority Interest 000 000 000 000 000
Equity in Earnings 37400M
56000 M 61600 M 55700 M 38000 M
After Tax Income Expense 000 000 000 000 000
Discontinued Operations 000 000 000 000 3800 M
Net Income Before ExtraItemsPreferred Div
514 B 566 B 564 B 408 B 421 B
Extra Items amp Gain (Loss) Sale of Assets
000 000 000 000 000
Net Income Before PreferredDividends
514 B 566 B 564 B 408 B 421 B
Preferred Dividend Requirements 1000 M 1200 M 1100 M 1800 M 2500 M
Net Income Available to Common 514 B 566 B 564 B 408 B 421 B
Seasonal Performance Data PEP
Returns Jan Feb Mar Apr May Jun Jul Aug Sep Oct Nov Dec
AvgReturns -289 -033 154 024 252 -224 316 200 373 -293 095 006
Times PEP Stock Price 49 45 56 51 54 46 57 58 58 52 54 50
842019 Pepsi and Coca-cola(RH6802B54)
httpslidepdfcomreaderfullpepsi-and-coca-colarh6802b54 1722
Returns Jan Feb Mar Apr May Jun Jul Aug Sep Oct Nov Dec
Increased
Times PEP Stock PriceUnchanged
0 0 1 0 2 1 1 0 0 0 1 1
Times PEP Stock Price
Decreased52 51 52 52 50 61 47 53 44 59 47 54
2009 -828 -415 694 -333 460 559 326 -013 351 322 276 acirceurordquo
2008 -1015 201 386 -514 -033 -689 467 288 407 -2000 -053 -339
2007 430 -319 065 398 339 -508 119 367 769 063 469 -165
2006 -321 338 -222 078 381 -068 556 300 -002 -278 -231 094
2005 287 030 -153 492 111 -413 111 059 339 427 012 -019
2004 acirceurordquo acirceurordquo acirceurordquo acirceurordquo acirceurordquo acirceurordquo acirceurordquo acirceurordquo acirceurordquo acirceurordquo acirceurordquo 459
PepsiCo (PEP) Dividend Stock Analysis
PepsiCo Inc manufactures markets and sells various snacks carbonated and non-carbonated
beverages and foods worldwidePepsiCo is a major component of the SampP 500 Dow Industrials and
the Dividend Aristocrats Indexes PepsiCo has been consistently increasing its dividends for 36
consecutive years From the end of 1998 up until December 2008 this dividend growth stock has
delivered a 470 annual average total return to its shareholders
At the same time company has managed to deliver a 990 average annual increase in its EPS since
1999
842019 Pepsi and Coca-cola(RH6802B54)
httpslidepdfcomreaderfullpepsi-and-coca-colarh6802b54 1822
The ROE has remained largely between 31 and 38 with the exception of 2004 when it fell to as
low as 22
Annual dividend payments have increased by an average of 1350 annually since 1999 which is
much higher than the growth in EPS Analysts are expecting slight increase in EPS for 2009
compared to 2008 given the sluggish state of North American economies The strong US dollar could
potentially hurt sales as over 44 of PepsiCorsquos revenues are derived internationally
A 1350 growth in dividends translates into the dividend payment doubling almost every five years
Since 1978 PepsiCo has actually managed to double its dividend payment every six years on average
The dividend payout has remained in a range between 31 and 42 In 2008 the dividend payout
ratio has surged to 51 A lower payout is always a plus since it leaves room for consistent dividend
growth minimizing the impact of short-term fluctuations in earnings The slow growth in earnings
could put future dividend increases at risk
842019 Pepsi and Coca-cola(RH6802B54)
httpslidepdfcomreaderfullpepsi-and-coca-colarh6802b54 1922
842019 Pepsi and Coca-cola(RH6802B54)
httpslidepdfcomreaderfullpepsi-and-coca-colarh6802b54 2022
Though carbonated soft drinks remain the most popular beverage PEP recognizes that non-carbonated soft drinks are a faster growing category The company is focusing on the health andwellness trends It has eliminated trans fats from many of its snack foods and is introducing ldquogoodforyourdquo foods under the Quaker Oats brand Risks include the highly competitive and very maturenature of it products also with more exposure to foreign markets political and currency risks alsoincrease
Conclusion PEP did not earn any Stars in the Fair Value section earned two Stars in the DividendAnalytical Data section and earned one Star in the Dividend Income vs MMA section for a total of three Stars This quantitatively ranks PEP as a 3 Star-Hold
Using my D4L-PreScreenxls model I determined the share price could increase to $6562 beforePEPrsquos NPV MMA Differential fell to the $500 that I like to see for a stock with 37 consecutive yearsof dividend increases At that price the stock would yield 270
Resetting the D4L-PreScreenxls model and solving for the dividend growth rate needed to generatethe target $500 NPV MMA Differential the calculated rate is 63 This dividend growth rate is
lower than the the 76 used in this analysis thus providing a margin of safety PEP has a risk rating of 100 which classifies it as a low risk stock
Like its competition Coca-Cola (KO) PEPrsquos Free Cash Flow Payout currently at 70 tends toremain higher than the 60 level that I prefer However this is mitigated to an extent by relativelylow debt levels and predictable cash flows PEP is a stock I will buy as my allocation allows andwhen it dips below its buy price of $5510 For additional information including the stockrsquos dividendhistory please refer to its data page
Stock price of last five years with monthly price list
842019 Pepsi and Coca-cola(RH6802B54)
httpslidepdfcomreaderfullpepsi-and-coca-colarh6802b54 2122
PRICES
Date Open High Low Close Volume Adj Close
4-Dec-09 6318 6400 6308 6385 8907000 6385
3-Dec-09 6358 6359 6267 6276 6406200 6276
2-Dec-09 6350 6374 6317 6365 6195800 6365
2-Dec-09 $ 045 Dividend
1-Dec-09 6268 6393 6249 6387 6887700 6342
30-Nov-09 6264 6283 6215 6222 7252700 6178
27-Nov-09 6224 6255 6175 6230 3416000 6186
25-Nov-09 6253 6327 6249 6319 4672600 6274
24-Nov-09 6262 6265 6213 6250 4139700 6206
23-Nov-09 6246 6299 6226 6249 5009400 6205
20-Nov-09 6167 6231 6143 6208 5314600 6164
19-Nov-09 6210 6210 6135 6188 4390400 6144
18-Nov-09 6244 6251 6181 6230 3952300 6186
17-Nov-09 6242 6263 6203 6260 4362400 6216
16-Nov-09 6221 6249 6194 6243 4966800 6199
13-Nov-09 6163 6213 6135 6194 6411100 6150
12-Nov-09 6249 6275 6110 6127 8474900 6084
11-Nov-09 6234 6268 6208 6260 4714300 6216
10-Nov-09 6217 6294 6193 6208 7094100 6164
9-Nov-09 6181 6232 6143 6228 6921800 6184
6-Nov-09 6099 6176 6079 6176 4831000 6132
5-Nov-09 6044 6141 6042 6123 5578500 6080
4-Nov-09 6016 6096 5979 6038 5552100 5995
3-Nov-09 6029 6039 5962 6006 5797000 5964
2-Nov-09 6079 6107 6016 6060 6618800 601730-Oct-09 6135 6164 6037 6055 7794100 6012
29-Oct-09 6101 6146 6057 6139 5245300 6096
28-Oct-09 6088 6152 6075 6099 6321900 6056
27-Oct-09 6064 6135 6010 6100 7262900 6057
26-Oct-09 6114 6150 6021 6047 5113000 6004
23-Oct-09 6141 6167 6058 6103 6505200 6060
22-Oct-09 6190 6190 6087 6150 5428100 6107
21-Oct-09 6138 6234 6123 6184 7445000 6140
20-Oct-09 6200 6205 6112 6158 8068000 6115
19-Oct-09 6228 6257 6190 6205 5557300 616116-Oct-09 6247 6268 6211 6229 6588400 6185
15-Oct-09 6157 6275 6139 6268 10518600 6224
14-Oct-09 6094 6168 6070 6162 8462200 6119
13-Oct-09 6088 6100 6052 6060 7502000 6017
12-Oct-09 6043 6136 6025 6092 6178100 6049
9-Oct-09 6038 6070 5981 6059 6360200 6016
8-Oct-09 6124 6124 5980 6039 17263400 5996
7-Oct-09 6085 6138 6045 6117 6441900 6074
6-Oct-09 6105 6127 6042 6087 8128900 6044
5-Oct-09 6083 6124 6014 6085 7892000 60422-Oct-09 5912 6124 5893 6090 17530200 6047
1-Oct-09 5870 5899 5827 5846 9010200 5805
30-Sep-09 5874 5886 5801 5866 8898400 5825
29-Sep-09 5910 5931 5800 5851 7086400 5810
28-Sep-09 5895 5949 5862 5903 4085900 5861
25-Sep-09 5850 5913 5832 5868 6758800 5827
842019 Pepsi and Coca-cola(RH6802B54)
httpslidepdfcomreaderfullpepsi-and-coca-colarh6802b54 2222
References
1 httpwwwcoca-colacomindexjsp2 httpfinanceaolcomquotesthe-coca-cola-companykonys
3 httpfinanceaolcomeventthe-pepsi-bottling-group-incpbgnys
4 httpfinanceyahoocomqs=ko
5 httpwwwdividendgrowthinvestorcom200906coca-cola-ko-dividend-
stock-analysishtml
6 httpfinanceyahoocomqs=ko
7 httpmoneycentralmsncomdetailstock_quoteSymbol=Ko
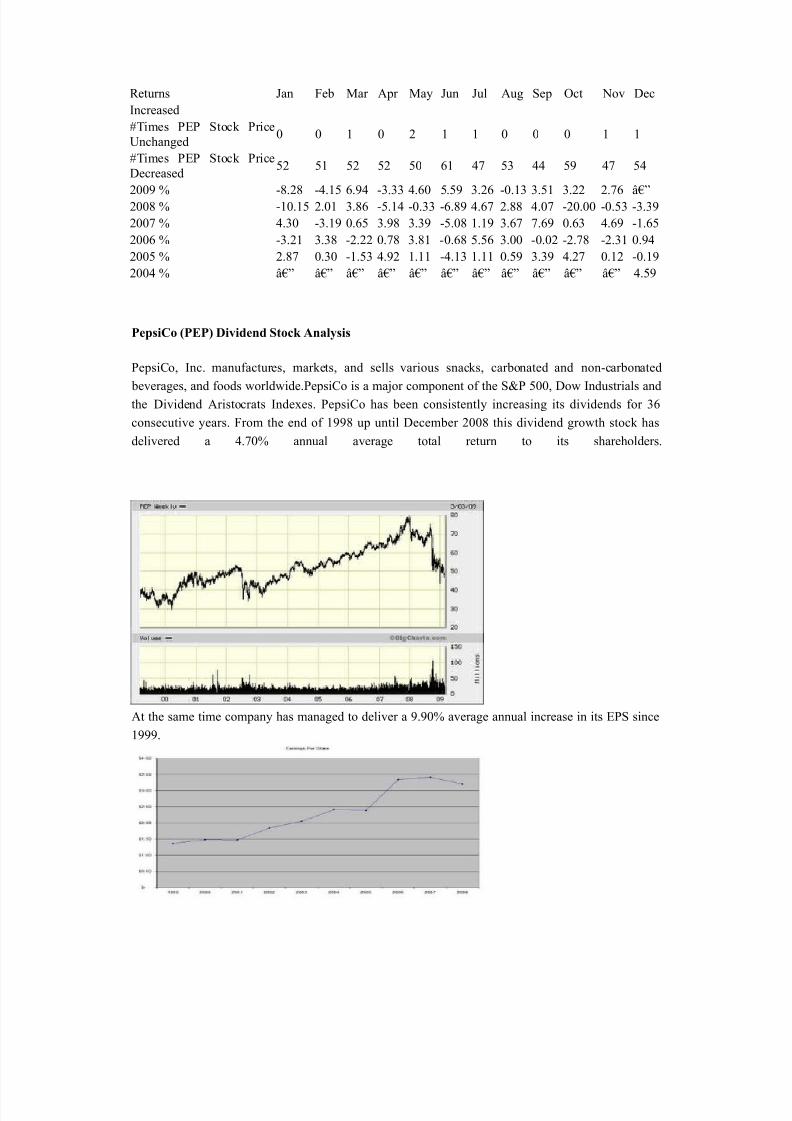
842019 Pepsi and Coca-cola(RH6802B54)
httpslidepdfcomreaderfullpepsi-and-coca-colarh6802b54 1722
Returns Jan Feb Mar Apr May Jun Jul Aug Sep Oct Nov Dec
Increased
Times PEP Stock PriceUnchanged
0 0 1 0 2 1 1 0 0 0 1 1
Times PEP Stock Price
Decreased52 51 52 52 50 61 47 53 44 59 47 54
2009 -828 -415 694 -333 460 559 326 -013 351 322 276 acirceurordquo
2008 -1015 201 386 -514 -033 -689 467 288 407 -2000 -053 -339
2007 430 -319 065 398 339 -508 119 367 769 063 469 -165
2006 -321 338 -222 078 381 -068 556 300 -002 -278 -231 094
2005 287 030 -153 492 111 -413 111 059 339 427 012 -019
2004 acirceurordquo acirceurordquo acirceurordquo acirceurordquo acirceurordquo acirceurordquo acirceurordquo acirceurordquo acirceurordquo acirceurordquo acirceurordquo 459
PepsiCo (PEP) Dividend Stock Analysis
PepsiCo Inc manufactures markets and sells various snacks carbonated and non-carbonated
beverages and foods worldwidePepsiCo is a major component of the SampP 500 Dow Industrials and
the Dividend Aristocrats Indexes PepsiCo has been consistently increasing its dividends for 36
consecutive years From the end of 1998 up until December 2008 this dividend growth stock has
delivered a 470 annual average total return to its shareholders
At the same time company has managed to deliver a 990 average annual increase in its EPS since
1999
842019 Pepsi and Coca-cola(RH6802B54)
httpslidepdfcomreaderfullpepsi-and-coca-colarh6802b54 1822
The ROE has remained largely between 31 and 38 with the exception of 2004 when it fell to as
low as 22
Annual dividend payments have increased by an average of 1350 annually since 1999 which is
much higher than the growth in EPS Analysts are expecting slight increase in EPS for 2009
compared to 2008 given the sluggish state of North American economies The strong US dollar could
potentially hurt sales as over 44 of PepsiCorsquos revenues are derived internationally
A 1350 growth in dividends translates into the dividend payment doubling almost every five years
Since 1978 PepsiCo has actually managed to double its dividend payment every six years on average
The dividend payout has remained in a range between 31 and 42 In 2008 the dividend payout
ratio has surged to 51 A lower payout is always a plus since it leaves room for consistent dividend
growth minimizing the impact of short-term fluctuations in earnings The slow growth in earnings
could put future dividend increases at risk
842019 Pepsi and Coca-cola(RH6802B54)
httpslidepdfcomreaderfullpepsi-and-coca-colarh6802b54 1922
842019 Pepsi and Coca-cola(RH6802B54)
httpslidepdfcomreaderfullpepsi-and-coca-colarh6802b54 2022
Though carbonated soft drinks remain the most popular beverage PEP recognizes that non-carbonated soft drinks are a faster growing category The company is focusing on the health andwellness trends It has eliminated trans fats from many of its snack foods and is introducing ldquogoodforyourdquo foods under the Quaker Oats brand Risks include the highly competitive and very maturenature of it products also with more exposure to foreign markets political and currency risks alsoincrease
Conclusion PEP did not earn any Stars in the Fair Value section earned two Stars in the DividendAnalytical Data section and earned one Star in the Dividend Income vs MMA section for a total of three Stars This quantitatively ranks PEP as a 3 Star-Hold
Using my D4L-PreScreenxls model I determined the share price could increase to $6562 beforePEPrsquos NPV MMA Differential fell to the $500 that I like to see for a stock with 37 consecutive yearsof dividend increases At that price the stock would yield 270
Resetting the D4L-PreScreenxls model and solving for the dividend growth rate needed to generatethe target $500 NPV MMA Differential the calculated rate is 63 This dividend growth rate is
lower than the the 76 used in this analysis thus providing a margin of safety PEP has a risk rating of 100 which classifies it as a low risk stock
Like its competition Coca-Cola (KO) PEPrsquos Free Cash Flow Payout currently at 70 tends toremain higher than the 60 level that I prefer However this is mitigated to an extent by relativelylow debt levels and predictable cash flows PEP is a stock I will buy as my allocation allows andwhen it dips below its buy price of $5510 For additional information including the stockrsquos dividendhistory please refer to its data page
Stock price of last five years with monthly price list
842019 Pepsi and Coca-cola(RH6802B54)
httpslidepdfcomreaderfullpepsi-and-coca-colarh6802b54 2122
PRICES
Date Open High Low Close Volume Adj Close
4-Dec-09 6318 6400 6308 6385 8907000 6385
3-Dec-09 6358 6359 6267 6276 6406200 6276
2-Dec-09 6350 6374 6317 6365 6195800 6365
2-Dec-09 $ 045 Dividend
1-Dec-09 6268 6393 6249 6387 6887700 6342
30-Nov-09 6264 6283 6215 6222 7252700 6178
27-Nov-09 6224 6255 6175 6230 3416000 6186
25-Nov-09 6253 6327 6249 6319 4672600 6274
24-Nov-09 6262 6265 6213 6250 4139700 6206
23-Nov-09 6246 6299 6226 6249 5009400 6205
20-Nov-09 6167 6231 6143 6208 5314600 6164
19-Nov-09 6210 6210 6135 6188 4390400 6144
18-Nov-09 6244 6251 6181 6230 3952300 6186
17-Nov-09 6242 6263 6203 6260 4362400 6216
16-Nov-09 6221 6249 6194 6243 4966800 6199
13-Nov-09 6163 6213 6135 6194 6411100 6150
12-Nov-09 6249 6275 6110 6127 8474900 6084
11-Nov-09 6234 6268 6208 6260 4714300 6216
10-Nov-09 6217 6294 6193 6208 7094100 6164
9-Nov-09 6181 6232 6143 6228 6921800 6184
6-Nov-09 6099 6176 6079 6176 4831000 6132
5-Nov-09 6044 6141 6042 6123 5578500 6080
4-Nov-09 6016 6096 5979 6038 5552100 5995
3-Nov-09 6029 6039 5962 6006 5797000 5964
2-Nov-09 6079 6107 6016 6060 6618800 601730-Oct-09 6135 6164 6037 6055 7794100 6012
29-Oct-09 6101 6146 6057 6139 5245300 6096
28-Oct-09 6088 6152 6075 6099 6321900 6056
27-Oct-09 6064 6135 6010 6100 7262900 6057
26-Oct-09 6114 6150 6021 6047 5113000 6004
23-Oct-09 6141 6167 6058 6103 6505200 6060
22-Oct-09 6190 6190 6087 6150 5428100 6107
21-Oct-09 6138 6234 6123 6184 7445000 6140
20-Oct-09 6200 6205 6112 6158 8068000 6115
19-Oct-09 6228 6257 6190 6205 5557300 616116-Oct-09 6247 6268 6211 6229 6588400 6185
15-Oct-09 6157 6275 6139 6268 10518600 6224
14-Oct-09 6094 6168 6070 6162 8462200 6119
13-Oct-09 6088 6100 6052 6060 7502000 6017
12-Oct-09 6043 6136 6025 6092 6178100 6049
9-Oct-09 6038 6070 5981 6059 6360200 6016
8-Oct-09 6124 6124 5980 6039 17263400 5996
7-Oct-09 6085 6138 6045 6117 6441900 6074
6-Oct-09 6105 6127 6042 6087 8128900 6044
5-Oct-09 6083 6124 6014 6085 7892000 60422-Oct-09 5912 6124 5893 6090 17530200 6047
1-Oct-09 5870 5899 5827 5846 9010200 5805
30-Sep-09 5874 5886 5801 5866 8898400 5825
29-Sep-09 5910 5931 5800 5851 7086400 5810
28-Sep-09 5895 5949 5862 5903 4085900 5861
25-Sep-09 5850 5913 5832 5868 6758800 5827
842019 Pepsi and Coca-cola(RH6802B54)
httpslidepdfcomreaderfullpepsi-and-coca-colarh6802b54 2222
References
1 httpwwwcoca-colacomindexjsp2 httpfinanceaolcomquotesthe-coca-cola-companykonys
3 httpfinanceaolcomeventthe-pepsi-bottling-group-incpbgnys
4 httpfinanceyahoocomqs=ko
5 httpwwwdividendgrowthinvestorcom200906coca-cola-ko-dividend-
stock-analysishtml
6 httpfinanceyahoocomqs=ko
7 httpmoneycentralmsncomdetailstock_quoteSymbol=Ko
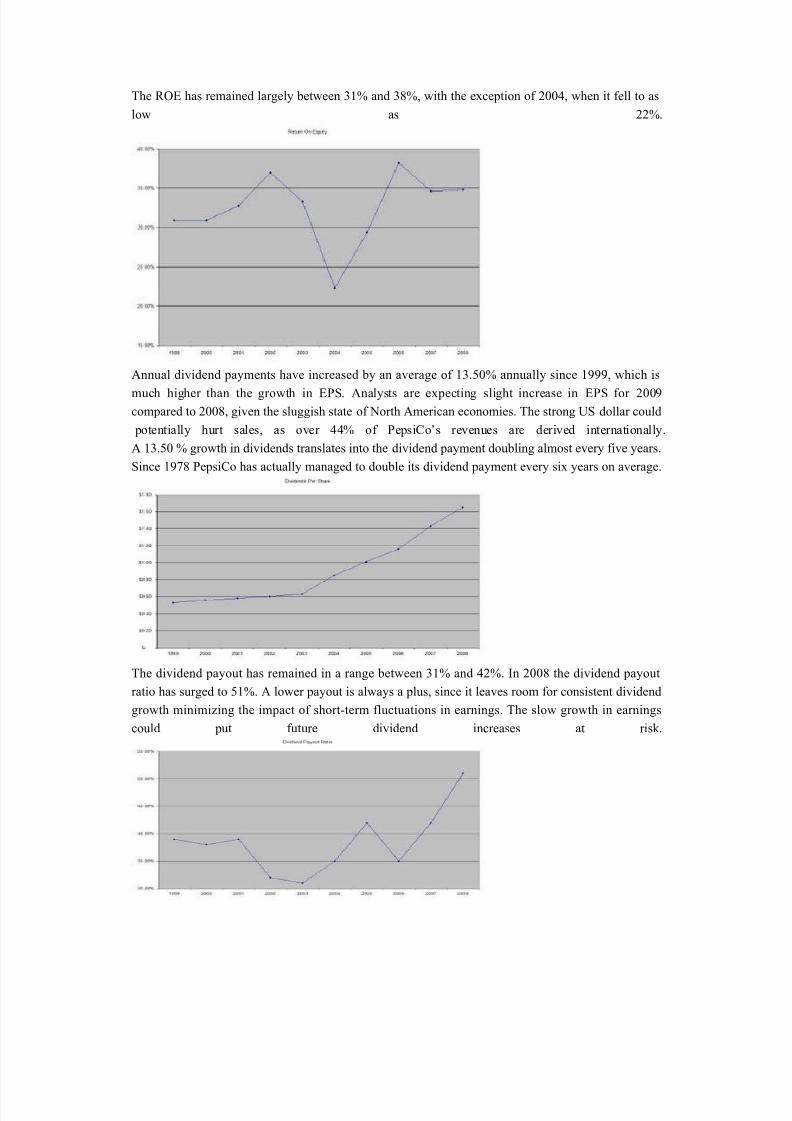
842019 Pepsi and Coca-cola(RH6802B54)
httpslidepdfcomreaderfullpepsi-and-coca-colarh6802b54 1822
The ROE has remained largely between 31 and 38 with the exception of 2004 when it fell to as
low as 22
Annual dividend payments have increased by an average of 1350 annually since 1999 which is
much higher than the growth in EPS Analysts are expecting slight increase in EPS for 2009
compared to 2008 given the sluggish state of North American economies The strong US dollar could
potentially hurt sales as over 44 of PepsiCorsquos revenues are derived internationally
A 1350 growth in dividends translates into the dividend payment doubling almost every five years
Since 1978 PepsiCo has actually managed to double its dividend payment every six years on average
The dividend payout has remained in a range between 31 and 42 In 2008 the dividend payout
ratio has surged to 51 A lower payout is always a plus since it leaves room for consistent dividend
growth minimizing the impact of short-term fluctuations in earnings The slow growth in earnings
could put future dividend increases at risk
842019 Pepsi and Coca-cola(RH6802B54)
httpslidepdfcomreaderfullpepsi-and-coca-colarh6802b54 1922
842019 Pepsi and Coca-cola(RH6802B54)
httpslidepdfcomreaderfullpepsi-and-coca-colarh6802b54 2022
Though carbonated soft drinks remain the most popular beverage PEP recognizes that non-carbonated soft drinks are a faster growing category The company is focusing on the health andwellness trends It has eliminated trans fats from many of its snack foods and is introducing ldquogoodforyourdquo foods under the Quaker Oats brand Risks include the highly competitive and very maturenature of it products also with more exposure to foreign markets political and currency risks alsoincrease
Conclusion PEP did not earn any Stars in the Fair Value section earned two Stars in the DividendAnalytical Data section and earned one Star in the Dividend Income vs MMA section for a total of three Stars This quantitatively ranks PEP as a 3 Star-Hold
Using my D4L-PreScreenxls model I determined the share price could increase to $6562 beforePEPrsquos NPV MMA Differential fell to the $500 that I like to see for a stock with 37 consecutive yearsof dividend increases At that price the stock would yield 270
Resetting the D4L-PreScreenxls model and solving for the dividend growth rate needed to generatethe target $500 NPV MMA Differential the calculated rate is 63 This dividend growth rate is
lower than the the 76 used in this analysis thus providing a margin of safety PEP has a risk rating of 100 which classifies it as a low risk stock
Like its competition Coca-Cola (KO) PEPrsquos Free Cash Flow Payout currently at 70 tends toremain higher than the 60 level that I prefer However this is mitigated to an extent by relativelylow debt levels and predictable cash flows PEP is a stock I will buy as my allocation allows andwhen it dips below its buy price of $5510 For additional information including the stockrsquos dividendhistory please refer to its data page
Stock price of last five years with monthly price list
842019 Pepsi and Coca-cola(RH6802B54)
httpslidepdfcomreaderfullpepsi-and-coca-colarh6802b54 2122
PRICES
Date Open High Low Close Volume Adj Close
4-Dec-09 6318 6400 6308 6385 8907000 6385
3-Dec-09 6358 6359 6267 6276 6406200 6276
2-Dec-09 6350 6374 6317 6365 6195800 6365
2-Dec-09 $ 045 Dividend
1-Dec-09 6268 6393 6249 6387 6887700 6342
30-Nov-09 6264 6283 6215 6222 7252700 6178
27-Nov-09 6224 6255 6175 6230 3416000 6186
25-Nov-09 6253 6327 6249 6319 4672600 6274
24-Nov-09 6262 6265 6213 6250 4139700 6206
23-Nov-09 6246 6299 6226 6249 5009400 6205
20-Nov-09 6167 6231 6143 6208 5314600 6164
19-Nov-09 6210 6210 6135 6188 4390400 6144
18-Nov-09 6244 6251 6181 6230 3952300 6186
17-Nov-09 6242 6263 6203 6260 4362400 6216
16-Nov-09 6221 6249 6194 6243 4966800 6199
13-Nov-09 6163 6213 6135 6194 6411100 6150
12-Nov-09 6249 6275 6110 6127 8474900 6084
11-Nov-09 6234 6268 6208 6260 4714300 6216
10-Nov-09 6217 6294 6193 6208 7094100 6164
9-Nov-09 6181 6232 6143 6228 6921800 6184
6-Nov-09 6099 6176 6079 6176 4831000 6132
5-Nov-09 6044 6141 6042 6123 5578500 6080
4-Nov-09 6016 6096 5979 6038 5552100 5995
3-Nov-09 6029 6039 5962 6006 5797000 5964
2-Nov-09 6079 6107 6016 6060 6618800 601730-Oct-09 6135 6164 6037 6055 7794100 6012
29-Oct-09 6101 6146 6057 6139 5245300 6096
28-Oct-09 6088 6152 6075 6099 6321900 6056
27-Oct-09 6064 6135 6010 6100 7262900 6057
26-Oct-09 6114 6150 6021 6047 5113000 6004
23-Oct-09 6141 6167 6058 6103 6505200 6060
22-Oct-09 6190 6190 6087 6150 5428100 6107
21-Oct-09 6138 6234 6123 6184 7445000 6140
20-Oct-09 6200 6205 6112 6158 8068000 6115
19-Oct-09 6228 6257 6190 6205 5557300 616116-Oct-09 6247 6268 6211 6229 6588400 6185
15-Oct-09 6157 6275 6139 6268 10518600 6224
14-Oct-09 6094 6168 6070 6162 8462200 6119
13-Oct-09 6088 6100 6052 6060 7502000 6017
12-Oct-09 6043 6136 6025 6092 6178100 6049
9-Oct-09 6038 6070 5981 6059 6360200 6016
8-Oct-09 6124 6124 5980 6039 17263400 5996
7-Oct-09 6085 6138 6045 6117 6441900 6074
6-Oct-09 6105 6127 6042 6087 8128900 6044
5-Oct-09 6083 6124 6014 6085 7892000 60422-Oct-09 5912 6124 5893 6090 17530200 6047
1-Oct-09 5870 5899 5827 5846 9010200 5805
30-Sep-09 5874 5886 5801 5866 8898400 5825
29-Sep-09 5910 5931 5800 5851 7086400 5810
28-Sep-09 5895 5949 5862 5903 4085900 5861
25-Sep-09 5850 5913 5832 5868 6758800 5827
842019 Pepsi and Coca-cola(RH6802B54)
httpslidepdfcomreaderfullpepsi-and-coca-colarh6802b54 2222
References
1 httpwwwcoca-colacomindexjsp2 httpfinanceaolcomquotesthe-coca-cola-companykonys
3 httpfinanceaolcomeventthe-pepsi-bottling-group-incpbgnys
4 httpfinanceyahoocomqs=ko
5 httpwwwdividendgrowthinvestorcom200906coca-cola-ko-dividend-
stock-analysishtml
6 httpfinanceyahoocomqs=ko
7 httpmoneycentralmsncomdetailstock_quoteSymbol=Ko
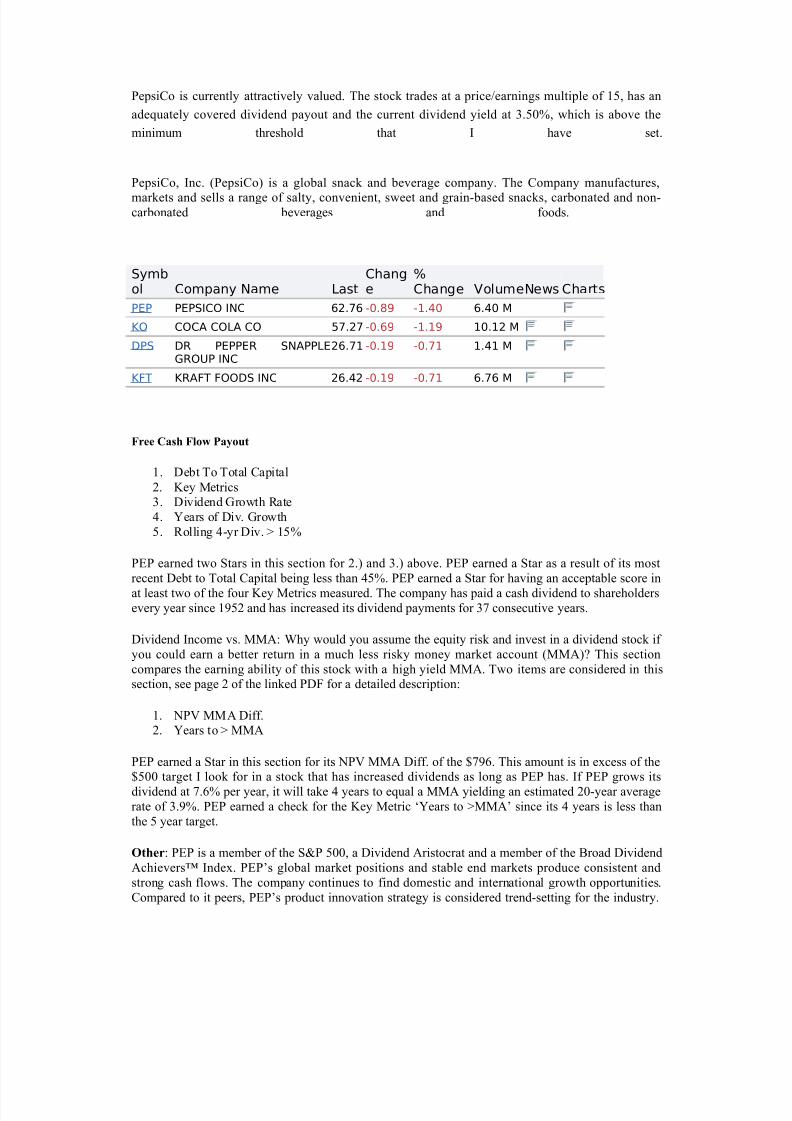
842019 Pepsi and Coca-cola(RH6802B54)
httpslidepdfcomreaderfullpepsi-and-coca-colarh6802b54 1922
842019 Pepsi and Coca-cola(RH6802B54)
httpslidepdfcomreaderfullpepsi-and-coca-colarh6802b54 2022
Though carbonated soft drinks remain the most popular beverage PEP recognizes that non-carbonated soft drinks are a faster growing category The company is focusing on the health andwellness trends It has eliminated trans fats from many of its snack foods and is introducing ldquogoodforyourdquo foods under the Quaker Oats brand Risks include the highly competitive and very maturenature of it products also with more exposure to foreign markets political and currency risks alsoincrease
Conclusion PEP did not earn any Stars in the Fair Value section earned two Stars in the DividendAnalytical Data section and earned one Star in the Dividend Income vs MMA section for a total of three Stars This quantitatively ranks PEP as a 3 Star-Hold
Using my D4L-PreScreenxls model I determined the share price could increase to $6562 beforePEPrsquos NPV MMA Differential fell to the $500 that I like to see for a stock with 37 consecutive yearsof dividend increases At that price the stock would yield 270
Resetting the D4L-PreScreenxls model and solving for the dividend growth rate needed to generatethe target $500 NPV MMA Differential the calculated rate is 63 This dividend growth rate is
lower than the the 76 used in this analysis thus providing a margin of safety PEP has a risk rating of 100 which classifies it as a low risk stock
Like its competition Coca-Cola (KO) PEPrsquos Free Cash Flow Payout currently at 70 tends toremain higher than the 60 level that I prefer However this is mitigated to an extent by relativelylow debt levels and predictable cash flows PEP is a stock I will buy as my allocation allows andwhen it dips below its buy price of $5510 For additional information including the stockrsquos dividendhistory please refer to its data page
Stock price of last five years with monthly price list
842019 Pepsi and Coca-cola(RH6802B54)
httpslidepdfcomreaderfullpepsi-and-coca-colarh6802b54 2122
PRICES
Date Open High Low Close Volume Adj Close
4-Dec-09 6318 6400 6308 6385 8907000 6385
3-Dec-09 6358 6359 6267 6276 6406200 6276
2-Dec-09 6350 6374 6317 6365 6195800 6365
2-Dec-09 $ 045 Dividend
1-Dec-09 6268 6393 6249 6387 6887700 6342
30-Nov-09 6264 6283 6215 6222 7252700 6178
27-Nov-09 6224 6255 6175 6230 3416000 6186
25-Nov-09 6253 6327 6249 6319 4672600 6274
24-Nov-09 6262 6265 6213 6250 4139700 6206
23-Nov-09 6246 6299 6226 6249 5009400 6205
20-Nov-09 6167 6231 6143 6208 5314600 6164
19-Nov-09 6210 6210 6135 6188 4390400 6144
18-Nov-09 6244 6251 6181 6230 3952300 6186
17-Nov-09 6242 6263 6203 6260 4362400 6216
16-Nov-09 6221 6249 6194 6243 4966800 6199
13-Nov-09 6163 6213 6135 6194 6411100 6150
12-Nov-09 6249 6275 6110 6127 8474900 6084
11-Nov-09 6234 6268 6208 6260 4714300 6216
10-Nov-09 6217 6294 6193 6208 7094100 6164
9-Nov-09 6181 6232 6143 6228 6921800 6184
6-Nov-09 6099 6176 6079 6176 4831000 6132
5-Nov-09 6044 6141 6042 6123 5578500 6080
4-Nov-09 6016 6096 5979 6038 5552100 5995
3-Nov-09 6029 6039 5962 6006 5797000 5964
2-Nov-09 6079 6107 6016 6060 6618800 601730-Oct-09 6135 6164 6037 6055 7794100 6012
29-Oct-09 6101 6146 6057 6139 5245300 6096
28-Oct-09 6088 6152 6075 6099 6321900 6056
27-Oct-09 6064 6135 6010 6100 7262900 6057
26-Oct-09 6114 6150 6021 6047 5113000 6004
23-Oct-09 6141 6167 6058 6103 6505200 6060
22-Oct-09 6190 6190 6087 6150 5428100 6107
21-Oct-09 6138 6234 6123 6184 7445000 6140
20-Oct-09 6200 6205 6112 6158 8068000 6115
19-Oct-09 6228 6257 6190 6205 5557300 616116-Oct-09 6247 6268 6211 6229 6588400 6185
15-Oct-09 6157 6275 6139 6268 10518600 6224
14-Oct-09 6094 6168 6070 6162 8462200 6119
13-Oct-09 6088 6100 6052 6060 7502000 6017
12-Oct-09 6043 6136 6025 6092 6178100 6049
9-Oct-09 6038 6070 5981 6059 6360200 6016
8-Oct-09 6124 6124 5980 6039 17263400 5996
7-Oct-09 6085 6138 6045 6117 6441900 6074
6-Oct-09 6105 6127 6042 6087 8128900 6044
5-Oct-09 6083 6124 6014 6085 7892000 60422-Oct-09 5912 6124 5893 6090 17530200 6047
1-Oct-09 5870 5899 5827 5846 9010200 5805
30-Sep-09 5874 5886 5801 5866 8898400 5825
29-Sep-09 5910 5931 5800 5851 7086400 5810
28-Sep-09 5895 5949 5862 5903 4085900 5861
25-Sep-09 5850 5913 5832 5868 6758800 5827
842019 Pepsi and Coca-cola(RH6802B54)
httpslidepdfcomreaderfullpepsi-and-coca-colarh6802b54 2222
References
1 httpwwwcoca-colacomindexjsp2 httpfinanceaolcomquotesthe-coca-cola-companykonys
3 httpfinanceaolcomeventthe-pepsi-bottling-group-incpbgnys
4 httpfinanceyahoocomqs=ko
5 httpwwwdividendgrowthinvestorcom200906coca-cola-ko-dividend-
stock-analysishtml
6 httpfinanceyahoocomqs=ko
7 httpmoneycentralmsncomdetailstock_quoteSymbol=Ko
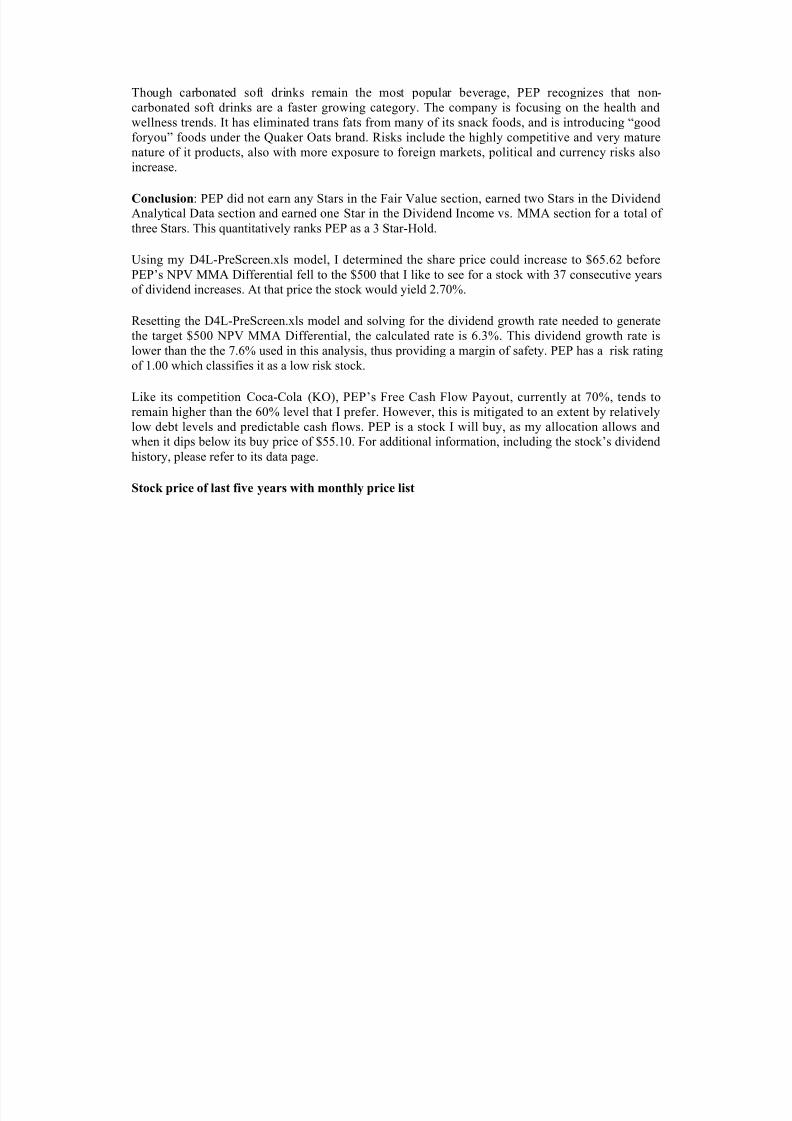
842019 Pepsi and Coca-cola(RH6802B54)
httpslidepdfcomreaderfullpepsi-and-coca-colarh6802b54 2022
Though carbonated soft drinks remain the most popular beverage PEP recognizes that non-carbonated soft drinks are a faster growing category The company is focusing on the health andwellness trends It has eliminated trans fats from many of its snack foods and is introducing ldquogoodforyourdquo foods under the Quaker Oats brand Risks include the highly competitive and very maturenature of it products also with more exposure to foreign markets political and currency risks alsoincrease
Conclusion PEP did not earn any Stars in the Fair Value section earned two Stars in the DividendAnalytical Data section and earned one Star in the Dividend Income vs MMA section for a total of three Stars This quantitatively ranks PEP as a 3 Star-Hold
Using my D4L-PreScreenxls model I determined the share price could increase to $6562 beforePEPrsquos NPV MMA Differential fell to the $500 that I like to see for a stock with 37 consecutive yearsof dividend increases At that price the stock would yield 270
Resetting the D4L-PreScreenxls model and solving for the dividend growth rate needed to generatethe target $500 NPV MMA Differential the calculated rate is 63 This dividend growth rate is
lower than the the 76 used in this analysis thus providing a margin of safety PEP has a risk rating of 100 which classifies it as a low risk stock
Like its competition Coca-Cola (KO) PEPrsquos Free Cash Flow Payout currently at 70 tends toremain higher than the 60 level that I prefer However this is mitigated to an extent by relativelylow debt levels and predictable cash flows PEP is a stock I will buy as my allocation allows andwhen it dips below its buy price of $5510 For additional information including the stockrsquos dividendhistory please refer to its data page
Stock price of last five years with monthly price list
842019 Pepsi and Coca-cola(RH6802B54)
httpslidepdfcomreaderfullpepsi-and-coca-colarh6802b54 2122
PRICES
Date Open High Low Close Volume Adj Close
4-Dec-09 6318 6400 6308 6385 8907000 6385
3-Dec-09 6358 6359 6267 6276 6406200 6276
2-Dec-09 6350 6374 6317 6365 6195800 6365
2-Dec-09 $ 045 Dividend
1-Dec-09 6268 6393 6249 6387 6887700 6342
30-Nov-09 6264 6283 6215 6222 7252700 6178
27-Nov-09 6224 6255 6175 6230 3416000 6186
25-Nov-09 6253 6327 6249 6319 4672600 6274
24-Nov-09 6262 6265 6213 6250 4139700 6206
23-Nov-09 6246 6299 6226 6249 5009400 6205
20-Nov-09 6167 6231 6143 6208 5314600 6164
19-Nov-09 6210 6210 6135 6188 4390400 6144
18-Nov-09 6244 6251 6181 6230 3952300 6186
17-Nov-09 6242 6263 6203 6260 4362400 6216
16-Nov-09 6221 6249 6194 6243 4966800 6199
13-Nov-09 6163 6213 6135 6194 6411100 6150
12-Nov-09 6249 6275 6110 6127 8474900 6084
11-Nov-09 6234 6268 6208 6260 4714300 6216
10-Nov-09 6217 6294 6193 6208 7094100 6164
9-Nov-09 6181 6232 6143 6228 6921800 6184
6-Nov-09 6099 6176 6079 6176 4831000 6132
5-Nov-09 6044 6141 6042 6123 5578500 6080
4-Nov-09 6016 6096 5979 6038 5552100 5995
3-Nov-09 6029 6039 5962 6006 5797000 5964
2-Nov-09 6079 6107 6016 6060 6618800 601730-Oct-09 6135 6164 6037 6055 7794100 6012
29-Oct-09 6101 6146 6057 6139 5245300 6096
28-Oct-09 6088 6152 6075 6099 6321900 6056
27-Oct-09 6064 6135 6010 6100 7262900 6057
26-Oct-09 6114 6150 6021 6047 5113000 6004
23-Oct-09 6141 6167 6058 6103 6505200 6060
22-Oct-09 6190 6190 6087 6150 5428100 6107
21-Oct-09 6138 6234 6123 6184 7445000 6140
20-Oct-09 6200 6205 6112 6158 8068000 6115
19-Oct-09 6228 6257 6190 6205 5557300 616116-Oct-09 6247 6268 6211 6229 6588400 6185
15-Oct-09 6157 6275 6139 6268 10518600 6224
14-Oct-09 6094 6168 6070 6162 8462200 6119
13-Oct-09 6088 6100 6052 6060 7502000 6017
12-Oct-09 6043 6136 6025 6092 6178100 6049
9-Oct-09 6038 6070 5981 6059 6360200 6016
8-Oct-09 6124 6124 5980 6039 17263400 5996
7-Oct-09 6085 6138 6045 6117 6441900 6074
6-Oct-09 6105 6127 6042 6087 8128900 6044
5-Oct-09 6083 6124 6014 6085 7892000 60422-Oct-09 5912 6124 5893 6090 17530200 6047
1-Oct-09 5870 5899 5827 5846 9010200 5805
30-Sep-09 5874 5886 5801 5866 8898400 5825
29-Sep-09 5910 5931 5800 5851 7086400 5810
28-Sep-09 5895 5949 5862 5903 4085900 5861
25-Sep-09 5850 5913 5832 5868 6758800 5827
842019 Pepsi and Coca-cola(RH6802B54)
httpslidepdfcomreaderfullpepsi-and-coca-colarh6802b54 2222
References
1 httpwwwcoca-colacomindexjsp2 httpfinanceaolcomquotesthe-coca-cola-companykonys
3 httpfinanceaolcomeventthe-pepsi-bottling-group-incpbgnys
4 httpfinanceyahoocomqs=ko
5 httpwwwdividendgrowthinvestorcom200906coca-cola-ko-dividend-
stock-analysishtml
6 httpfinanceyahoocomqs=ko
7 httpmoneycentralmsncomdetailstock_quoteSymbol=Ko
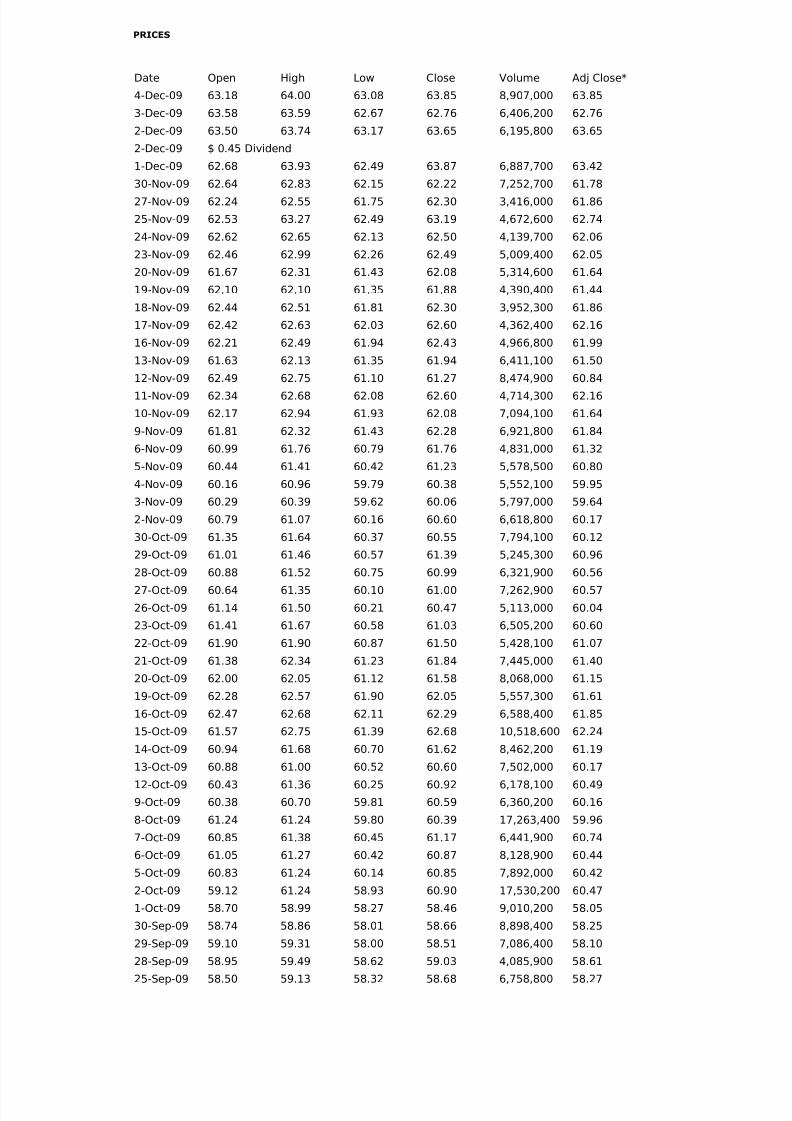
842019 Pepsi and Coca-cola(RH6802B54)
httpslidepdfcomreaderfullpepsi-and-coca-colarh6802b54 2222
References
1 httpwwwcoca-colacomindexjsp2 httpfinanceaolcomquotesthe-coca-cola-companykonys
3 httpfinanceaolcomeventthe-pepsi-bottling-group-incpbgnys
4 httpfinanceyahoocomqs=ko
5 httpwwwdividendgrowthinvestorcom200906coca-cola-ko-dividend-
stock-analysishtml
6 httpfinanceyahoocomqs=ko
7 httpmoneycentralmsncomdetailstock_quoteSymbol=Ko