pepsico second quarter 2012 earnings call - official … · pepsico second quarter 2012 earnings...
TRANSCRIPT

Indra NooyiChairman and Chief Executive Officer
Hugh JohnstonChief Financial Officer
Indra NooyiChairman and Chief Executive Officer
Hugh JohnstonChief Financial Officer
PepsiCo Second Quarter 2012 Earnings CallJuly 25, 2012PepsiCo Second Quarter 2012 Earnings CallJuly 25, 2012

2
Safe Harbor Statement of Terms & Non-GAAP Information
Note: This presentation should be viewed in conjunction with PepsiCo’s Q2 2012 earnings call
Safe Harbor Statement• Statements in this communication that are "forward-looking statements,” including PepsiCo’s 2012 guidance, are based on currently available information, operating plans and
projections about future events and trends. Terminology such as “believe,” “expect,” “intend,” “estimate,” “project,” “anticipate,” “will” or similar statements or variations of such termsare intended to identify forward-looking statements, although not all forward-looking statements contain such terms. Forward-looking statements inherently involve risks anduncertainties that could cause actual results to differ materially from those predicted in such forward-looking statements. Such risks and uncertainties include, but are not limited to:changes in demand for PepsiCo’s products, as a result of changes in consumer preferences and tastes or otherwise; PepsiCo’s ability to compete effectively; unfavorable economicconditions in the countries in which PepsiCo operates; damage to PepsiCo’s reputation; PepsiCo’s ability to grow its business in developing and emerging markets or unstablepolitical conditions, civil unrest or other developments and risks in the countries where PepsiCo operates; trade consolidation or the loss of any key customer; changes in the legaland regulatory environment; PepsiCo’s ability to build and sustain proper information technology infrastructure, successfully implement its ongoing business transformation initiativeor outsource certain functions effectively; fluctuations in foreign exchange rates; increased costs, disruption of supply or shortages of raw materials and other supplies; disruption ofPepsiCo’s supply chain; climate change, or legal, regulatory or market measures to address climate change; PepsiCo’s ability to hire or retain key employees or a highly skilled anddiverse workforce; failure to successfully renew collective bargaining agreements or strikes or work stoppages; failure to successfully complete or integrate acquisitions and jointventures into PepsiCo’s existing operations; failure to successfully implement PepsiCo’s global operating model; failure to realize anticipated benefits from our productivity plan; anydowngrade of our credit ratings; and any infringement of or challenge to PepsiCo’s intellectual property rights.
• For additional information on these and other factors that could cause PepsiCo’s actual results to materially differ from those set forth herein, please see PepsiCo’s filings with theSEC, including its most recent annual report on Form 10-K and subsequent reports on Forms 10-Q and 8-K. Investors are cautioned not to place undue reliance on any suchforward-looking statements, which speak only as of the date they are made. PepsiCo undertakes no obligation to update any forward-looking statements, whether as a result of newinformation, future events or otherwise.
Non-GAAP Information• Please refer to the “Investors” section of PepsiCo’s web site at www.pepsico.com under the heading “Investor Presentations” to find disclosure and a reconciliation of any non-GAAP
financial measures contained herein.
Glossary• Please refer to the Glossary and attachments to our July 25, 2012 earnings release for the definitions of core, constant currency, organic and certain other terms used
herein. Beginning with the second quarter of 2012, organic results exclude the impact of foreign exchange translation.
Indra NooyiChairman and Chief Executive OfficerIndra NooyiChairman and Chief Executive Officer
PepsiCo Second Quarter 2012 Earnings CallPepsiCo Second Quarter 2012 Earnings Call

4
• Consumer Behavior, Competitive Landscape, and Commodities In-line With Expectations
• Balanced Revenue Management Led to 5 Percent Organic Net Revenue Growth1
Q2 Results In-Line with Expectations
1. Represents a Non-GAAP financial measure that excludes certain items. For a description of these items, please refer to “Reconciliation of GAAP and Non-GAAP Information” in the “Investors” section of PepsiCo’s website at www.pepsico.com

5
• Reported Net Revenue Impacted by Structural Changes and Foreign Exchange
• Strategic Benefits of Refranchising Transactions
‐ Strengthen Operations
‐ Improve Operating Margins and Key Efficiency Metrics
‐ Improve Returns on Capital
Reported Results Impacted by Transactions

6
• Core EPS of $1.121
• 5 Percent Organic Net Revenue Growth1
• 4 Percent Global Effective Net Pricing
• Grew Organic Net Revenue1 in Global Snacks & Global Beverages
• 9 Percent Organic Net Revenue Growth1 in Emerging and Developing Markets
Financial Highlights for Q2
1. Represents Non-GAAP financial measures that exclude certain items. For a description of these items, please refer to “Reconciliation of GAAP and Non-GAAP Information” in the “Investors” section of PepsiCo’s website at www.pepsico.com

7
We Remain Focused on 5 Key Initiatives
Innovation
21Brand
Building
3Execution
4Productivity
5Driving Cash
Returns
8
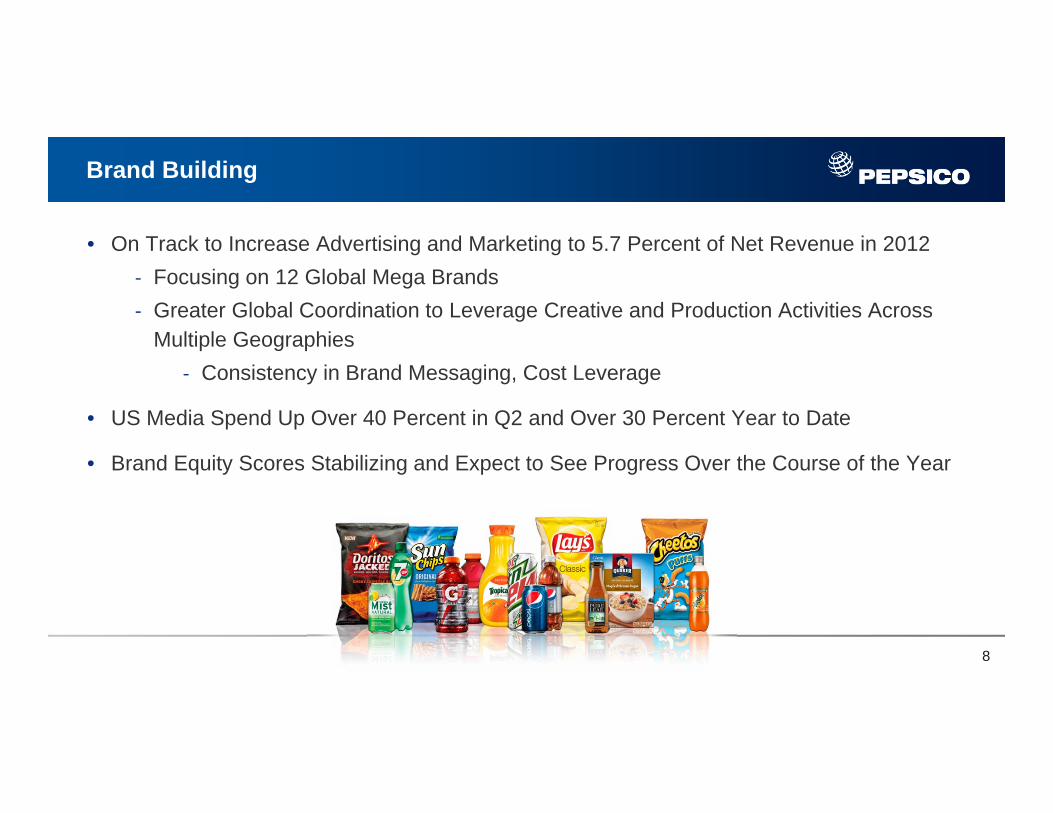
• On Track to Increase Advertising and Marketing to 5.7 Percent of Net Revenue in 2012‐ Focusing on 12 Global Mega Brands‐ Greater Global Coordination to Leverage Creative and Production Activities Across
Multiple Geographies‐ Consistency in Brand Messaging, Cost Leverage
• US Media Spend Up Over 40 Percent in Q2 and Over 30 Percent Year to Date
• Brand Equity Scores Stabilizing and Expect to See Progress Over the Course of the Year
Brand Building

9
Targeted Innovation with Particular Focus on Mega Brands

10
FLNA Innovation Drove Incremental Sales All Across the Portfolio
Doritos JackedUltimate Extreme
Snacks
Doritos Locos TacosPartnerships in Other Channels
Ruffles UltimateContinues to gain distribution,
helped drive mid-single-digit sales growth for trademark Ruffles
11
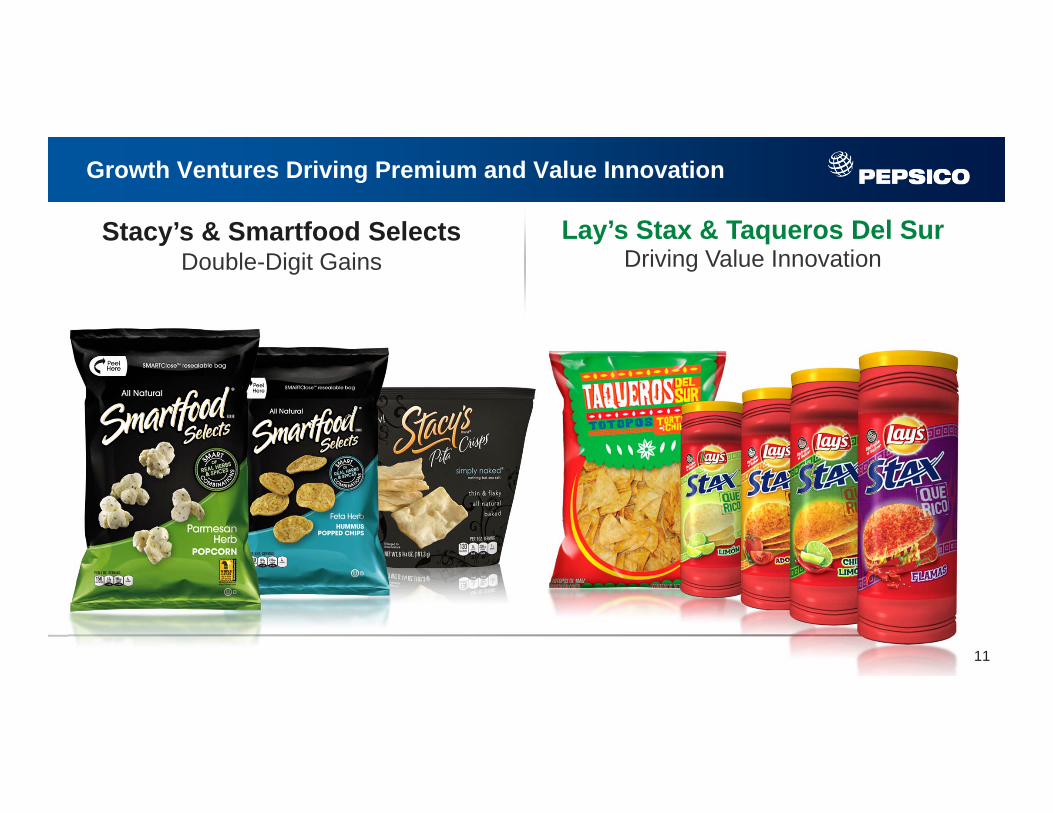
Growth Ventures Driving Premium and Value Innovation
Stacy’s & Smartfood SelectsDouble-Digit Gains
Lay’s Stax & Taqueros Del SurDriving Value Innovation

12
Pepsi Next Launching New Flavors
Pepsi Next
Pepsi Next Off To A Strong Start
Launching Two New Flavors –Pepsi Next Cherry Vanilla and Pepsi Next Paradise Mango

13
Gatorade Product Innovation and Differentiated Packaging
Gatorade
Recent Introduction of Gatorade Prime Chews (in 3 Flavors)
Introduction of Differentiated Packaging
14
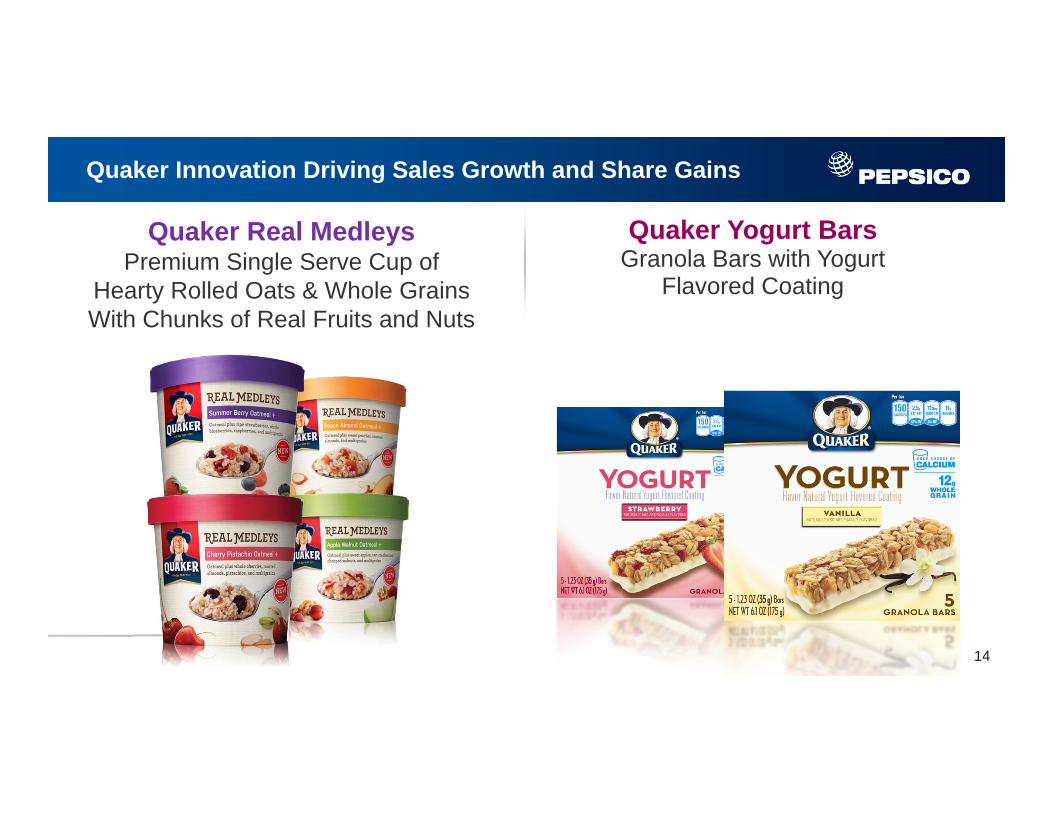
Quaker Innovation Driving Sales Growth and Share Gains
Quaker Real MedleysPremium Single Serve Cup of
Hearty Rolled Oats & Whole Grains With Chunks of Real Fruits and Nuts
Quaker Yogurt Bars Granola Bars with Yogurt
Flavored Coating

15
Driving Execution Across Our Businesses
Power of One“Rock Your Summer”
Campaign
Strong Growth in Emerging Markets
#1 Contributor to C-Store Revenue Growth in the U.S.
Source: IRI

16
On-Track To Deliver 2012 Productivity
Expect ~$1.1 Billion in Productivity in 2012 and $3 Billion in Total Over the Next 3 Years
Executing Restructuring
Program
Reducing Capital Intensity & Improving Working
Capital Efficiency
Leveraging Global Capability
& Know-How

17
Returning Cash to Shareholders
• Returned $2.8 Billion to Shareholders in First Half of 2012 and Expect to Return More Than $6 Billion for the Full Year 2012
• 40th Consecutive Year of Dividend Increases
17

18
Innovation
21Brand
Building
3Execution
4Productivity
5Driving Cash
Returns
Making Good Progress And Confident in Achieving Our 2012 Goals in These 5 Initiatives
Hugh JohnstonChief Financial OfficerHugh JohnstonChief Financial Officer
PepsiCo Second Quarter 2012 Earnings CallPepsiCo Second Quarter 2012 Earnings Call

20
Brand Strength and Innovation
81%
85%
Q1 Q2
2012
Brand Equity Holding or Gaining1
Brand Strength
~7%
2012 Q2 YTD
% of Net Revenue2
Innovation
1. Source: Millward Brown. Data is for Key Brands in Strategic Markets
2. Measured on a Constant Currency Basis Based on Internal Company Estimates
21
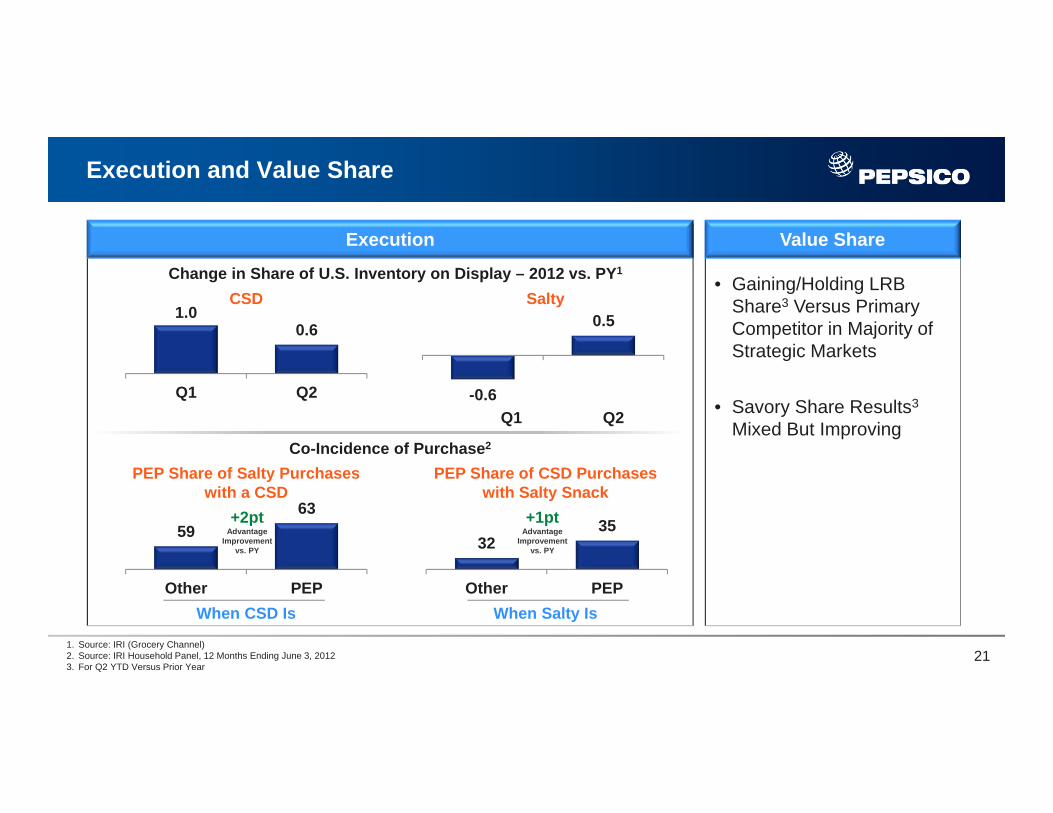
Execution and Value Share
• Gaining/Holding LRB Share3 Versus Primary Competitor in Majority of Strategic Markets
• Savory Share Results3
Mixed But Improving
1.00.6
Q1 Q2 -0.6
0.5
5963
Other PEP
3235
Other PEP
Q1 Q2
When Salty IsWhen CSD Is
PEP Share of CSD Purchases with Salty Snack
PEP Share of Salty Purchases with a CSD
SaltyCSDChange in Share of U.S. Inventory on Display – 2012 vs. PY1
Execution Value Share
Co-Incidence of Purchase2
1. Source: IRI (Grocery Channel)2. Source: IRI Household Panel, 12 Months Ending June 3, 20123. For Q2 YTD Versus Prior Year
+2ptAdvantage
Improvementvs. PY
+1ptAdvantage
Improvementvs. PY

22
Financial Metrics
Cost and capex• Capex as percent of net revenue 4.4% on rolling 4-quarter basis, improvement
of more than 100 bps over prior rolling 4 quarters
• YTD operating cost reduction as % of net revenue on target
EPS • On target to deliver expected (5)% core constant currency EPS for full year ’121
Net ROIC• NOPAT and capital investment performance on target for 2012
• Expect Net ROIC to improve by 50+ bps/year beginning in 2013
Operating cash flow • On target to deliver $6 billion+ in core management operating cash flow for ‘12
Focus Area 2012 Update
1. From PepsiCo’s fiscal 2011 core EPS of $4.40. Based on current forex market consensus, FX translation would have an unfavorable impact of ~(3)pts on 2012 core EPSNote: Certain of the above represent Non-GAAP financial measures that exclude certain items. For a description of these items, please refer to “Reconciliation of GAAP and Non-GAAP Information” in the “Investors” section of PepsiCo’s website at www.pepsico.com

23
As Expected, Below the Line Deleverage in Q2
Core Corporate Unallocated1 Increased in the Quarter
Higher Net Interest Expense of ~$30 Million Year Over Year Driven by Lower Interest Income and Higher Average Net Debt
Core Effective Tax Rate Of 27.8%1, 180 Basis Points Increase Year Over Year
23
Drove ~3 Points of Deleverage Below the Line
1. Represents a Non-GAAP financial measure that excludes certain items. For a description of these items, please refer to “Reconciliation of GAAP and Non-GAAP Information” in the “Investors” section of PepsiCo’s website at www.pepsico.com

24
2012 Guidance
24
Core Constant Currency EPS Growth
Commodity Inflation
2012 Productivity
A&M % of Sales YoY Increase
Corporate Unallocated Expenses
Net Interest Expense
Core Tax Rate
Foreign Exchange Impact on Core EPS
~(5)%1
~$1.5B
~$1.1B
50 Basis Points
Increase
Increase
~27%
~(3)%2
1. From PepsiCo’s fiscal 2011 core EPS of $4.402. Based on current forex market consensusNote: Certain of the above represent Non-GAAP financial measures that exclude certain items. For a description of these items, please refer to “Reconciliation of GAAP and Non-GAAP Information” in the “Investors” section of PepsiCo’s website at www.pepsico.com
25
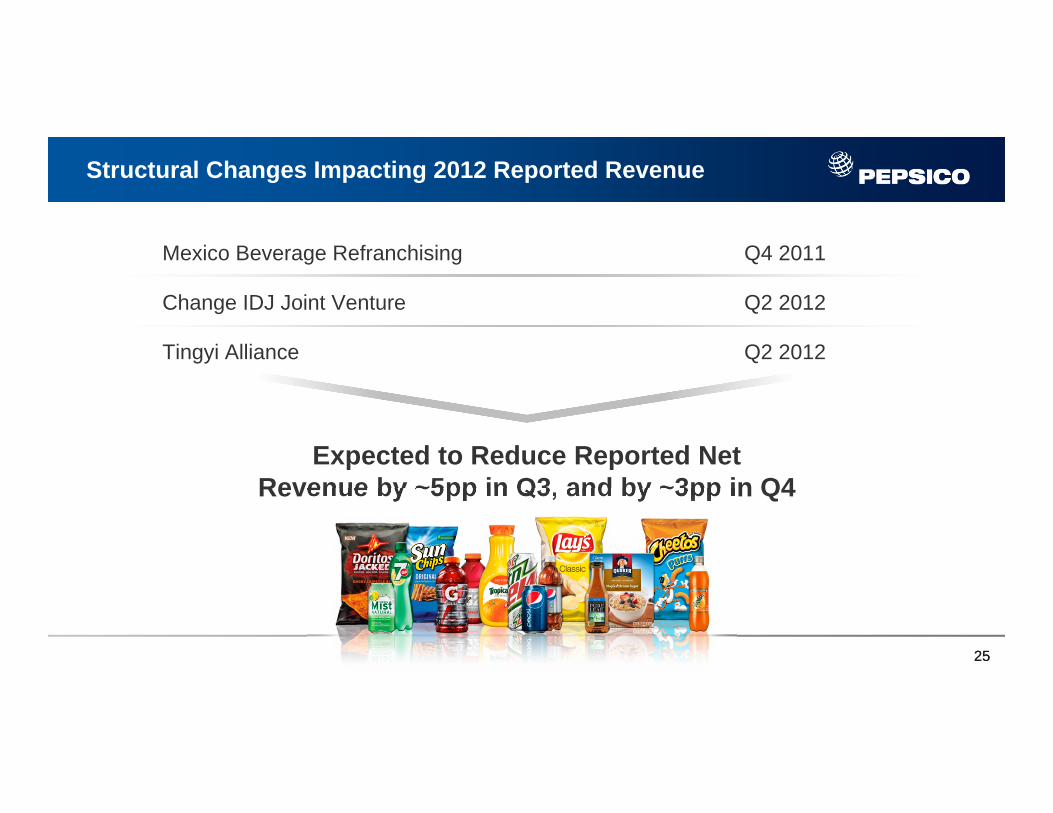
Structural Changes Impacting 2012 Reported Revenue
25
Expected to Reduce Reported Net Revenue by ~5pp in Q3, and by ~3pp in Q4
Mexico Beverage Refranchising
Change IDJ Joint Venture
Tingyi Alliance
Q4 2011
Q2 2012
Q2 2012
26
Returning Cash to Shareholders
• Net Capital Spending Down 100 Basis Points as % of Net Revenue on Rolling Four Quarter Basis
• Improving Working Capital Efficiency
• Returned $2.8 billion to Shareholders Year to Date
• Continue to Expect More than $6 billion in Cash Returns to Shareholders in 2012
26

27
Earnings Expectations Consistent with Previous Outlook
• Continue to Expect Core Constant Currency EPS to Decline by 5% in 20121
• Brand Building, Innovation, and Productivity Remain Our Investment Priorities
271. From PepsiCo’s fiscal 2011 core EPS of $4.40. Based on current forex market consensus, FX translation would have an unfavorable impact of ~(3)pts on 2012 core EPSNote: Certain of the above represent Non-GAAP financial measures that exclude certain items. For a description of these items, please refer to “Reconciliation of GAAP and Non-GAAP Information” in the “Investors” section of PepsiCo’s website at www.pepsico.com

28