peptide mass mapping of acetylated isoforms of histone h4 from mouse lymphosarcoma cells treated...
TRANSCRIPT
Peptide Mass Mapping of Acetylated Isoformsof Histone H4 from Mouse LymphosarcomaCells Treated with Histone Deacetylase(HDACs) Inhibitors
Chen Ren, Liwen Zhang,* and Michael A. FreitasDepartment of Chemistry, The Ohio State University, Columbus, Ohio, USA
Kalpana Ghoshal, Mark R. Parthun, and Samson T. JacobDepartment of Molecular and Cellular Biochemistry, The Ohio State University, Columbus, Ohio, USA
The acetylated isoforms of histone H4 from mouse lymphosarcoma cells treated with HDACinhibitors trichostatin A (TSA) and depsipeptide (DDP) were separated by acetic acidurea-polyacrylamide gel electrophoresis (AU-PAGE), in-gel digested, and analyzed by matrixassisted laser desorption/ionization time-of-flight mass spectrometry (MALDI-TOF MS) andliquid chromatography tandem mass spectrometry (LC-MS/MS). The acetylation pattern ofhistone H4 in mouse lymphosarcoma cells induced by TSA was established in whichacetylation initially occurred at K16 followed by K12 and then K8 and/or K5. An identicalorder of acetylation was found for cells treated with DDP. (J Am Soc Mass Spectrom 2005, 16,1641–1653) © 2005 American Society for Mass Spectrometry
The core histones form an octamer that consists ofa tetramer of H4-H3 and two dimers of H2A-H2Bwhich organize with double stranded DNA to
form nucleosomes [1, 2]. Histones are highly positively-charged and highly conserved throughout eukaryoticevolution. Their posttranslational modifications (acetyla-tion, methylation, phosphorylation, ADP ribosylation,and ubiquitination, etc.) are proposed to affect the inter-actions between DNA and other chromatin associatedproteins, thus regulating the higher order structure ofchromatin and in turn gene transcription [3]. Histoneacetylation and deacetylation are controlled by histoneacetyltransferases (HATs) and histone deacetylases(HDACs). HDAC inhibitors increase acetylation levelsand induce open chromatin structure and increased genetranscription. HDAC inhibitors have been found to func-tion as potential chemotherapeutic reagents as they arrestcell growth, differentiation, and/or apoptosis in manytumor cell types [4].
Although nucleosome formation is essential to com-pact the genome within the nuclei, it also impedesaccess of most transcription factors to their cognate siteson DNA. Most of the extrinsic and intrinsic signaltransduction pathways manifest their biological re-sponse by modulating gene expression that requires
Published online August 11, 2005Address reprint requests to Dr. M. A. Freitas, Department of Chemistry, TheOhio State University, 100 West 18th Avenue, Columbus, OH 43210, USA.E-mail: [email protected]
* Also at the Campus Chemical Instrument Center, The Ohio State Univer-sity, Columbus, OH 43210.© 2005 American Society for Mass Spectrometry. Published by Elsevie1044-0305/05/$30.00doi:10.1016/j.jasms.2005.06.001
access of transcription factors to the DNA. Mobilizationof nucleosomes is mediated through altering posttrans-lational modifications of NH2-terminal tails of histonesas well as by ATP-dependent chromatin remodelingmachinery (for review, see references [5–7]. Dependingupon the modification states of core histones, the asso-ciated genes can be activated or repressed as theyinteract with coactivators or corepressors. In eukaryoticcells, acetylation of core histones at the NH2-terminallysines and phosphorylation at serine-10 of H3 usuallyare markers of active genes, whereas methylated his-tones are associated with both active and repressedpromoters depending upon the site of methylation. Forexample, K9 methylation (K9-Me) in H3 is exclusivelyassociated with transcriptionally repressed geneswhereas K4-Me in H3 is a marker of active promoters.In contrast, methylation of R17 in H3 and R3 in H4 is asignature of genes activated by steroid hormone recep-tors [8, 9]. Lysines can be mono-, di- or trimethylatedwhereas arginines can be mono- or di- (asymmetrical orsymmetrical) methylated [3, 6, 8 –10]. Gene activationalso depends on the degree of histone methylation [9].Gene expression can be turned on or off very rapidly byreversible acetylation/deacetylation or phosphoryla-tion/dephosphorylation by cellular HATs/HDACs andkinases/phosphatases. In contrast, methylation wasthought to be irreversible as no specific histone demeth-ylase had been identified [11]. However, LSD1(KIAA0601), a nuclear homolog of amine oxidases, hasrecently been reported to function as a histone demeth-
ylase and transcriptional corepressor, which is specificr Inc. Received March 15, 2005Revised June 1, 2005
Accepted June 1, 2005

1642 REN ET AL. J Am Soc Mass Spectrom 2005, 16, 1641–1653
to demethylate lysine 4 of histone H3 [12]. Anotherstudy has shown that methylated arginines of H3 andH4 can be converted to citrulline by peptidylargininedeiminase 4, releasing methylamine [13, 14]. Thesefindings suggest that methylation marks on histonescan be also dynamically regulated by histone methyl-ases and demethylases or by cellular enzymatic machin-ery.
Posttranslational modifications on core histones alsoact in a combinatorial, sequential or antagonistic man-ner to activate or repress gene expression. For example,K9- and K14-acetylation (Ac), and S10-phosphorylation(S10-P) are signature markers on early growth responsegenes stimulated with growth factors [15]. Similarly,K4-Me and K14-Ac on the same H3 and R3-Me andK5-Ac on H4 are symbols of active genes indicating thatmodifications at one site sequentially or synergisticallymodulate those at other sites [6]. In contrast, somemodifications are mutually exclusive, e.g., S10-P pre-vents methylation at K9 of H3 and S18-P of H4 excludesmethylation at K20 but facilitates K16 acetylation.Therefore, analysis of different posttranslational modi-fications occurring upon a single molecule is critical toexplore their potential role in gene regulation. To iden-tify these modification patterns, we explored systematicmass spectrometric analysis of histone H4 from mouselymphosarcoma cells treated with HDAC inhibitors.
Traditional methods, such as micro-sequencing andimmunoassay, are limited by the dependence on largeamounts of purified samples and the availability of sitespecific antibodies [16, 17]. The successful developmentof soft ionization techniques, such as electrospray ion-ization (ESI) [18 –20] and matrix assisted laser desorp-tion/ionization (MALDI) [21–23], have spurred theadoption of mass spectrometry as a powerful techniquefor protein characterization. Mass spectrometry hasbeen demonstrated to be a very powerful technique toidentify the posttranslational modifications of core his-tones [24 –33]. Purification and separation of histoneisoforms also play a critical role in the accurate and fastidentification of histone posttranslational modifica-tions. Core histones can be separated by reverse phasehigh-pressure liquid chromatography but without res-olution of the different isoforms [26, 27]. Hydrophilic-interaction liquid chromatography (HILIC) uses a weakcation exchange column and an increasing salt concen-tration gradient to elute different acetylation, phosphor-ylation and methylation isoforms [34, 35]. However, inHILIC the high organic and salt concentrations are notdirectly amenable to online MS analysis without exten-sive workup.
Acetic acid urea-polyacrylamide gel electrophoresis(AU-PAGE) separates proteins based on their size andeffective charge. Acetylation of the positively charged�-amino lysine side-chain residues causes a decrease ofthe effective charge and the mobility of histones in gels.It has been shown that different acetylation isoforms ofhistone H4 and H3 can be separated by AU-PAGE and
only micrograms of the whole histone mixture arerequired for further MS analysis [36]. The enzymaticin-gel digests can be used to identify the sites ofposttranslational modifications by mass spectrometry.Person used MALDI-TOF MS and LC-MS/MS to iden-tify histone H4 modifications from in-gel chymotrypsindigestion with H4 separated on Triton AU gels [37]. Wemodified their approach for the use of trypsin toexamine the acetylation profiles of histone H4 frommouse lymphosarcoma cells treated with TSA anddepsipetide. Trypsin digests are much easier to obtainreproducible digestion profiles than chymotrypsin.Since lysine acetylation inhibits cleavage by trypsin, thisenzyme also provides additional diagnostic informa-tion useful in sequencing the sites of modification. Herewe present this approach as a rapid, robust and highlyreproducible method to profile acetylation on the NH2-terminal tails of histone H4 for cancer cells treated withHDAC inhibitor chemotherapies.
Experimental
Materials
HDAC inhibitor trichostatin A (TSA) was purchasedfrom Sigma Chemical Company (St. Louis, MO) anddepsipeptide (DDP) was obtained from the Develop-mental Therapeutics Program, Division of CancerTreatment, National Cancer Institute (Bethesda, MD).Modified sequencing grade trypsin (V511) was pur-chased from Promega (St. Louis, MO). The MALDImatrix, �-cyano-4-hydroxy-cinnamic acid (HCCA),was purchased from Bruker Daltonics (Billerica, MA).All other chemicals were analytical or HPLC grade.
Cell Culture and Treatment of Cells with HDACInhibitors TSA, and DDP
Lymphosarcoma cells were grown in RPMI 1640 me-dium (Invitrogen, Carlsbad, CA) containing 20 mMHepes, 2% sodium bicarbonate, 1 mM glutamine, 10 nM2-mercaptoethanol, and 5% FBS at 37 °C in the presenceof 5% CO2 [38]. Cells were treated for 12 h with TSA(300 nM) or DDP (10 nM) from a 1000X stock dissolvedin methanol before isolation of histones. Control cellswere treated with the same volume of methanol.
Histone Purification
Histones were isolated from lymphosarcoma cells asdescribed previously [39]. Briefly, cells (5 � 107) wereharvested by centrifugation at 4 °C at 2000 � g for5 min, washed with PBS, and resuspended in 5 ml ofnuclear isolation buffer consisting of 0.25 M sucrose,10 mM Tris HCl (pH 7.5), 1.5 mM MgCl2, 0.5% TritonX-100, 0.5 mM PMSF, protease inhibitor cocktail(Sigma). Cells were either homogenized in a douncehomogenizer on ice with tight pestle or vortexed until90 to 95% of plasma membrane of the cells were broken.
Nuclei were isolated by spinning at 3000 � g for 5 min
1643J Am Soc Mass Spectrom 2005, 16, 1641–1653 PEPTIDE MAPPING OF ACETYLATED ISOFORMS OF HISTONE H4
at 4 °C and washed twice with the same buffer withoutTriton X-100. Histones were extracted from the nucleiwith 0.4 N ice-cold H2SO4 for 30 min and insolubleparticles were removed by centrifugation at 15,000 � gfor 10 min. Histones were precipitated from the super-natant with 10� volumes of acetone and collected bycentrifugation at 22,000 � g for 30 min. The pellet waswashed twice with ice-cold acetone, dissolved in water,and stored at �80 °C in small aliquots.
Acetic Acid-Urea Polyacrylamide GelElectrophoresis (AU-PAGE) Separationof Acetylated Histone Isoforms
Acetic acid urea-polyacrylamide gel electrophoresis(AU-PAGE) was performed as described earlier [39]with some modifications. 50 �g of histones from con-trol, TSA, and DDP treated cells were separated byAU-PAGE (15% acrylamide, acrylamide:bisacrylamide:38.7:1.3) at 300 V (constant voltage) overnight (20 h) at4 °C using 5% acetic acid as the running buffer. The gelswere fixed in 50% ethanol/10% acetic acid at roomtemperature for 4 h, then washed twice (30 min each)with 50% methanol/5% acetic acid, stained withCoomassie Brilliant Blue for 30 min and then destainedin 30% methanol/10% acetic acid until the backgroundwas clear.
Trypsin In-Gel Digestion
Each of the gel bands was excised into small pieces andtwo bands of the same isoforms combined. The gelpieces were washed twice (one h each) with freshlymade 50% methanol/5% acetic acid solution. Gel pieceswere dehydrated in 200 �l ACN for 5 min followed bya 5 min rehydration in 200 �l 100 mM NH4HCO3 twice.Gels were dehydrated in ACN again for 5 min anddried in speed vacuum for 2 to 3 min. Thirty �l offreshly prepared trypsin (20 ng/�l in 50 mMNH4HCO3) were added to each sample and rehydratedon ice for 10 min, then digested at 37 °C for 1 or 2 h.Tryptic digested peptides were extracted with 50%ACN/5% formic acid three times and were dried toabout 10 �l in the speed vacuum.
Matrix Assisted Laser Desorption/IonizationTime-of-Flight (MALDI-TOF) MS
MALDI-TOF MS was performed on a Bruker Reflex III(Bruker, Breman, Germany). The mass spectrometerwas operated in linear, positive ion mode. The N2 laserpower was adjusted to the minimum intensity neces-sary to obtain signal. The accelerating voltage wasmaintained at 28 kV. The instrument was calibratedwith protein standards bracketing the molecularweights of the protein samples (typically mixtures ofbradykinin fragment 1-5 and ACTH fragment 18-39 as
appropriate). Saturated �-cyano-4-hydroxy-cinnamicacid (HCCA) matrix solution in 0.1% TFA/50% ACNwas mixed with the sample in 5:1 ratio and 1 �l of themixture was spotted on a ground steel MTP384 target(Bruker) and allowed to air dry. Samples were furtherdesalted by washing the dried spots with 1 �l 0.1% TFA.
Nano-Liquid Chromatography Tandem MassSpectrometry (Nano-LC-MS/MS)
Nano-LC-MS/MS were performed on a hybrid quadru-pole time-of-flight Q-TOF II (Micromass, Wythenshawe,UK) mass spectrometer equipped with an orthogonalnanospray source from New Objective, Inc. (Woburn,MA) operated in positive ion mode. The LC system was aWaters Capillary LC (Waters, Milford, MA). The mobilephase A was water containing 50 mM acetic acid and themobile phase B was acetonitrile. Samples dried in thespeed vacuum were dissolved in 15 �l acetic acid (50mM). 2.5 �l of the samples were injected onto the trappingcolumn (LC Packings, Sunnyvale, CA) and washed with50 mM acetic acid. The injector port was switched toinject and the peptides were eluted off the trap onto thecolumn. A 5 cm 75 �m i.d. ProteoPep C18 column (NewObjective) packed directly in the nanospray tip wasused for chromatographic separations. Peptides wereeluted directly off the column into the Q-TOF systemusing a gradient of 2 to 80% B over 30 min, with a flowrate of 500 nl/min (precolumn split from 40 �l/min).The total run time was 55 min. The nanospray capillaryvoltage was set at 3.0 kV and the cone voltage at 55 V.The source temperature was maintained at 100 °C. Massspectra were recorded using MassLynx 4.0 with auto-matic switching functions and were acquired from mass400 to 2000 Da every second with a resolution of 8000(FWHM). When a desired peak was detected at aminimum of 15 ion counts, the mass spectrometerautomatically acquired CID MS/MS spectrum of theindividual peptide. Collision energy was set dependenton charge state recognition properties. Sequence infor-mation from the MS/MS data were processed usingMascot Distiller. Database searches were performedusing Mascot MS/MS ion search (Matrix Science,Boston MA) [40].
Micro-Liquid Chromatography TandemMass Spectrometry (Micro-LC-MS/MS)
In-gel trypsin digests were also run on micro-LC cou-pled with a Thermo Finnigan LCQ DECA XP� ion trap(San Jose, CA). MS/MS data were obtained from m/z200 to 2000 to compensate for low m/z ions that mayhave been missed in the nano-LC-MS/MS experiments.Ten �l of the in-gel digests were injected into a supelco(Bellefonte, PA) biowide pore C18 column (15 cm �1 mm, 5 �m) connected to a Shimadzu capillary LC(Columbia, MD). The mobile phase A was water with0.1% formic acid and mobile phase B was acetonitrile
with 0.1% formic acid. Peptides were separated using a
1644 REN ET AL. J Am Soc Mass Spectrom 2005, 16, 1641–1653
gradient of 5 to 75% B over 60 min. The total run timewas 80 min. Peptides eluted off the column flowed intothe ESI interface of the mass spectrometer. The capillaryvoltage was maintained at 4.5 KV and the sheath gas
Figure 1. AU-PAGE separation of control, TSA, and DDP treatedhistones.
Table 1. MALDI-TOF Data for TSA treated histone H4 acetylati
Isoform/coverage Measured (MH�) Rel. abund. Cal
0 Ac 515.30 1.00543.36 0.60989.54 0.12
1180.56 0.0401325.68 0.11
1 Ac 515.34 1.0530.32 0.50543.41 0.73989.62 0.17
1180.65 0.091325.79 0.20
2 Ac 515.44 1.0530.43 0.24543.50 0.53927.72 0.68989.77 0.38
1180.83 0.341325.96 0.34
3 Ac 515.50 1.00543.54 0.35927.69 0.75989.70 0.20
1180.70 0.111211.79 0.0371325.82 0.331396.85 0.87
4 Ac 515.39 1.0543.46 0.30989.73 0.11
1180.76 0.0461325.96 0.121439.04 0.54
Note: The bolded peaks are confirmed by nano-LCMS/MS run on quadrupoThe others were verified by micro-LC-MS/MS run on LCQ DECA XP� ion tra
flow was set to 40. A full mass scan was obtained from200 to 2000 Da and data-dependent MS/MS spectrawere obtained for the three most intense precursor ions.Database searches on the product ions were performedthe same as for the nano-LC-MS/MS data.
Results and Discussion
AU-PAGE Separation and Peptide Mass Mapping
Histone variants were separated by AU-PAGE based ontheir acetylation state. The acetylated isoforms of his-tones H4 and H3 were well separated by AU-PAGEunlike the acetylated isoforms of histones H2A andH2B, which overlapped with other bands (Figure 1).Acetylation of H4 increased upon treatment with bothTSA and DDP. The NH2-terminal serine is assumed tobe acetylated in all isoforms. Three gel bands wereclearly observed for the untreated control correspond-ing to the non-, mono-, and diacetylated isoforms (note:to avoid confusion, this discussion keeps with thetradition of labeling the first gel band as 0-Ac. Further-more, this band is referred to as nonacetylated since ithas no acetylated lysines). The number of visible bands
oforms
ed (MH�) Possible sequence Error (ppm)
5.34 36RLAR39 �77.623.40 20KMe2VLR23 �73.619.58 60VFLENVIR67 �40.420.62 46ISGLIYEETR55 �50.825.75 24DNIQGITKPAIR35 �52.805.34 36RLAR39 0.000.30 13GGAKAcR
17 37.713.40 20KMe2VLR23 18.409.58 60VFLENVIR67 40.420.62 46ISGLIYEETR55 25.415.75 24DNIQGITKPAIR35 30.175.34 36RLAR39 194.050.30 13GGAKAcR
17 245.143.40 20KMe2VLR23 184.037.54 9GLGKAcGGAKAcR
17 194.069.58 60VFLENVIR67 192.000.62 46ISGLIYEETR55 177.875.75 24DNIQGITKPAIR35 158.405.34 36RLAR39 306.983.40 20KMe2VLR23 260.957.54 9GLGKAcGGAKAcR
17 164.319.58 60VFLENVIR67 122.880.62 46ISGLIYEETR55 66.581.69 6GGKAcGLGKAcGGAKAcR
17 85.835.75 24DNIQGITKPAIR35 49.716.80 4GKAcGGKGLGKAcGGAKAcR
17 34.014GKGGKAcGLGKAcGGAKAcR
17
5.34 36RLAR39 97.023.40 20KMe2VLR23 110.429.58 60VFLENVIR67 151.580.62 46ISGLIYEETR55 118.585.75 24DNIQGITKPAIR35 158.408.81 4GKAcGGKAcGLGKAcGGAKAcR
17 159.85
on is
culat
515498
11813251535498
1181325153549298
11813251549298
118121132139
515498
118132143
Me2: Dimethylation; Me: Monomethylation; Ac: Acetylation; Rel. Aund.: Relative Abundance.
le Time-of-flight Q-Tof II.p.
re in
1645J Am Soc Mass Spectrom 2005, 16, 1641–1653 PEPTIDE MAPPING OF ACETYLATED ISOFORMS OF HISTONE H4
increased to five after treatment with TSA and DDP(non-, mono-, di-, tri-, and tetraacetylated isoform ofhistone H4). The gel bands were excised separately andin-gel digested with trypsin to determine the posttrans-lational modifications for each of the isoforms. Themasses for the peptides were determined from theMALDI-TOF MS and were compared with theoreticalmasses obtained by use of MS-Digest on the ProteinProspector website (prospector.ucsf.edu) [41]. Modifi-cations that were allowed in the theoretical digestincluded: S/T/Y phosphorylation; NH2-terminus acet-ylation; lysine mono-, di-, and trimethylation, lysineacetylation, and oxidation of methionine (methylationat arginine was not considered at this time). On aver-age, the dynamic range between the highest and lowestabundance peptides was 140.
Acetylation Patterns for TSA Treated Cells
To identify the modifications of H4 in the control cellsand in cells treated with HDAC inhibitors, a systematicstrategy was developed for the analysis of H4 isoformsseparated by AU-PAGE using mass spectrometry afterin-gel trypsin digestion. Arg-C digestion was also per-formed but the results exhibited poorer reproducibilitythan trypsin due to nonspecific cleavage at lysine resi-dues (data not shown). In-gel digestion procedures forArg-C are still being developed as selective cleavage atarginine is highly desirable. The peptides shown in
Figure 2. MALDI-TOF MS spectra of trypsin inby AU-PAGE from TSA treated histones. Signalare italicized. Trypsin autolysis products (842.attributable to the coomassie stain (825.1� Th) a
Table 1 were observed in the MALDI-TOF MS data from
the TSA treated histones and confirmed by LC-MS/MS. Afull list of the MALDI-TOF MS masses is provided in theSupplementary Material with the online version of thisarticle, along with their potential assignments as gener-ated by protein prospector [41]. However, only theassignments confirmed by MS/MS are discussed in thefollowing sections. The MALDI-TOF MS peptide map-ping data in Figures 2 and 3 are discussed separatelyfrom the supporting MS/MS data in Figures 4, 5, 6, 7, 8,and 9.
Several peptides were observed in all gel bands inMALDI-TOF MS. These included: the dimethylation ofK20 in fragment 20-23 (543.40� Th) and the unmodifiedfragments 36-39 (515.30� Th), 60-67 (989.58� Th), 46-55(1180.62� Th), 24-35 (1325.75� Th). In the first gel band(Figure 2a), no lysine acetylation was observed. This is notunexpected since the NH2-terminal serine is believed to bepredominantly acetylated. The only modification ob-served was dimethylation of K20 as was shown by thestrong peak at 543.36� Th. However, fewer peaks wereobserved compared with the other isoforms. This is be-cause the tails of histone H4 are arginine- and lysine rich,resulting in small fragments (�500 Th) that were likelyobscured by strong signals from the matrix.
In the second gel band, K16 was found to be acetylatedas indicated by the presence of the peptide at 530.32� Thcorresponding to one acetylation in fragment 13-17, inaddition to the previously discussed dimethylation of K20(Figure 2b). For the third gel band, a peptide at 927.72 � Th
digests of different acetylation isoforms isolatedibutable to the acetylation of the NH2-terminush) are indicated by two asterisks and signalsdicated by one asterisk.
-gels attr7� T
was observed (Figure 2c). This peptide corresponded to

� Th
1646 REN ET AL. J Am Soc Mass Spectrom 2005, 16, 1641–1653
the addition of two acetyl groups to K12 and K16 infragment 9-17. The peak at 530.43� Th (K16 acetylation infragment 13-17) was still present although in lower abun-
Figure 3. MALDI-TOF MS spectra of trypsinisolated by AU-PAGE from DDP treated histNH2-terminus are italicized. Trypsin autolysis prsignals attributable to the coomassie stain (825.1
Figure 4. Nano-LC-MS/MS spectrum of the prfrom TSA treated diacetylation band. The same
observed in both the TSA and DDP treated triacetyladance as compared with the previous gel band. Sincetrypsin is inhibited by lysine acetylation, the presence offragment 13-17 indicated acetylation somewhere else on
l digests (1 h) of different acetylation isoformsSignals attributable to the acetylation of the
ts (842.7� Th) are indicated by two asterisks and) are indicated by one asterisk.
or ion at 464.382� Th. These data were obtainedentation pattern of this precursor ion was also
in-geones.oduc
ecursfragm
tion band.
1647J Am Soc Mass Spectrom 2005, 16, 1641–1653 PEPTIDE MAPPING OF ACETYLATED ISOFORMS OF HISTONE H4
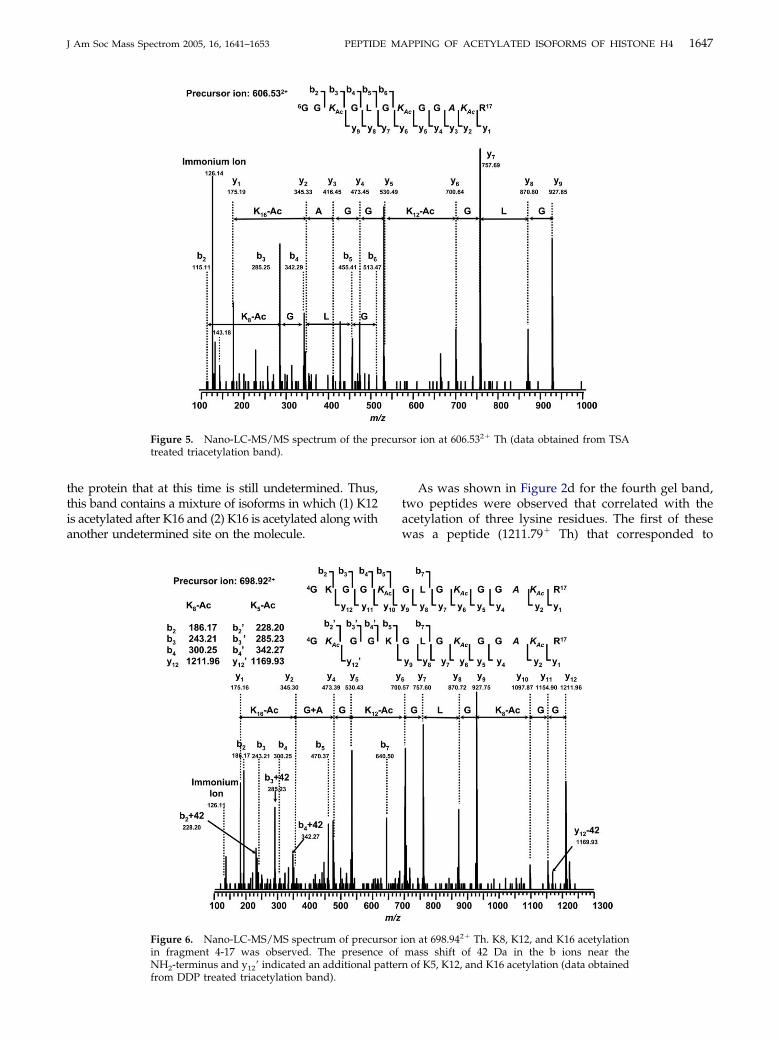
the protein that at this time is still undetermined. Thus,this band contains a mixture of isoforms in which (1) K12is acetylated after K16 and (2) K16 is acetylated along withanother undetermined site on the molecule.
Figure 6. Nano-LC-MS/MS spectrum of precuin fragment 4-17 was observed. The presencNH -terminus and y = indicated an additional p
Figure 5. Nano-LC-MS/MS spectrum of the prtreated triacetylation band).
2 12
from DDP treated triacetylation band).
As was shown in Figure 2d for the fourth gel band,two peptides were observed that correlated with theacetylation of three lysine residues. The first of thesewas a peptide (1211.79� Th) that corresponded to
on at 698.942� Th. K8, K12, and K16 acetylationmass shift of 42 Da in the b ions near the
n of K5, K12, and K16 acetylation (data obtained
sor ion at 606.532� Th (data obtained from TSA
rsor ie ofatter
ecur
1648 REN ET AL. J Am Soc Mass Spectrom 2005, 16, 1641–1653
acetylated K8, K12, and K16 in fragment 6-17. Thesecond peptide (1396.85� Th) also corresponded tothree acetylated lysines in fragment 4-17. This fragmentcontains 4 lysine residues, K5, K8, K12, and K16. It wasassumed that K12 and K16 remained acetylated leavingeither K5 or K8 as the next likely location for modifica-tion. Nano-LC-MS/MS of the peptides in this digestedgel band showed the presence of two peptide sequencesin which K16, K12, and either K8 or K5 were acetylatedbased on the observance of two y12 ions (1211.96� and1169.93�, respectively). The y ions corresponded toacetylation of K16, K12, and K8 were present at higherabundance. The result is partially corroborated by thepresence of the diacetylated fragment 9-17. It wasinferred that K8 must be at least partially unmodified toallow trypsin cleavage after K8, leading to the conclu-sion that an additional acetylation was located on K5.The abundance for the peptide at 1211.79� Th was verylow in the one h trypsin digestion (data not shown). Itsabundance increased as the digestion time increased totwo h, whereas that of the peptide at 1396.85� Thdecreased. This observation supports the presence of amissed cleavage at K5, which would result in a lowerabundance of the peptide at 1211.79� Th. However,little additional benefit was noted between the diges-tion time of one h and two h.
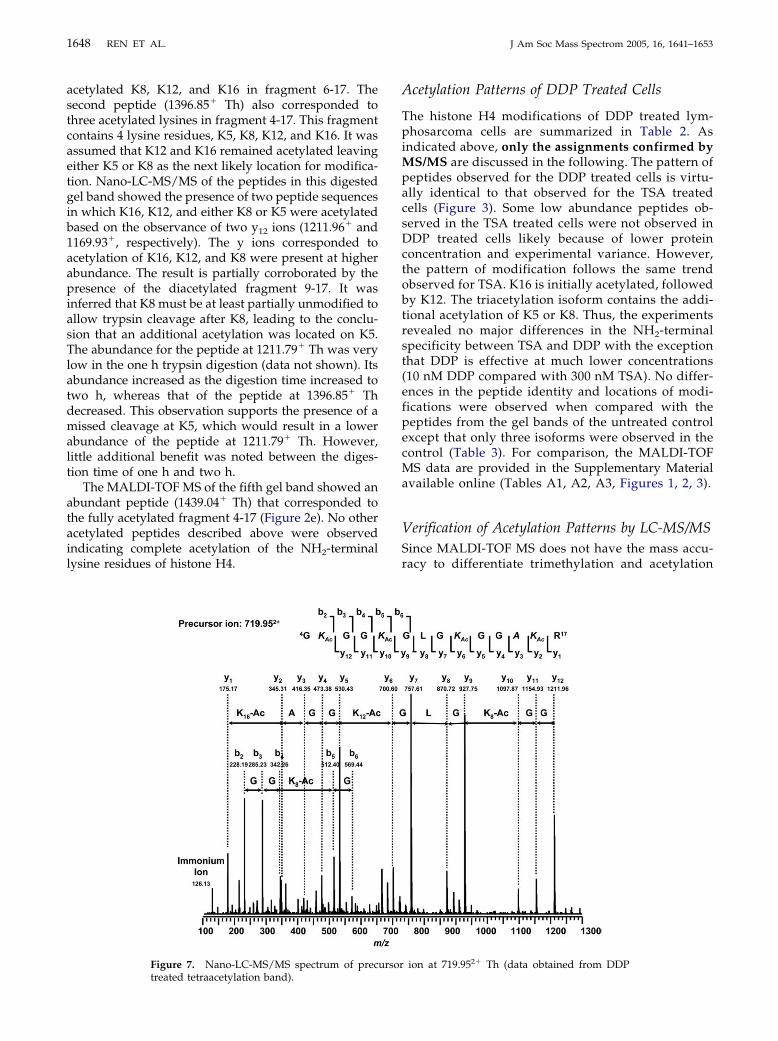
The MALDI-TOF MS of the fifth gel band showed anabundant peptide (1439.04� Th) that corresponded tothe fully acetylated fragment 4-17 (Figure 2e). No otheracetylated peptides described above were observedindicating complete acetylation of the NH2-terminallysine residues of histone H4.
Figure 7. Nano-LC-MS/MS spectrum of prec
treated tetraacetylation band).Acetylation Patterns of DDP Treated Cells
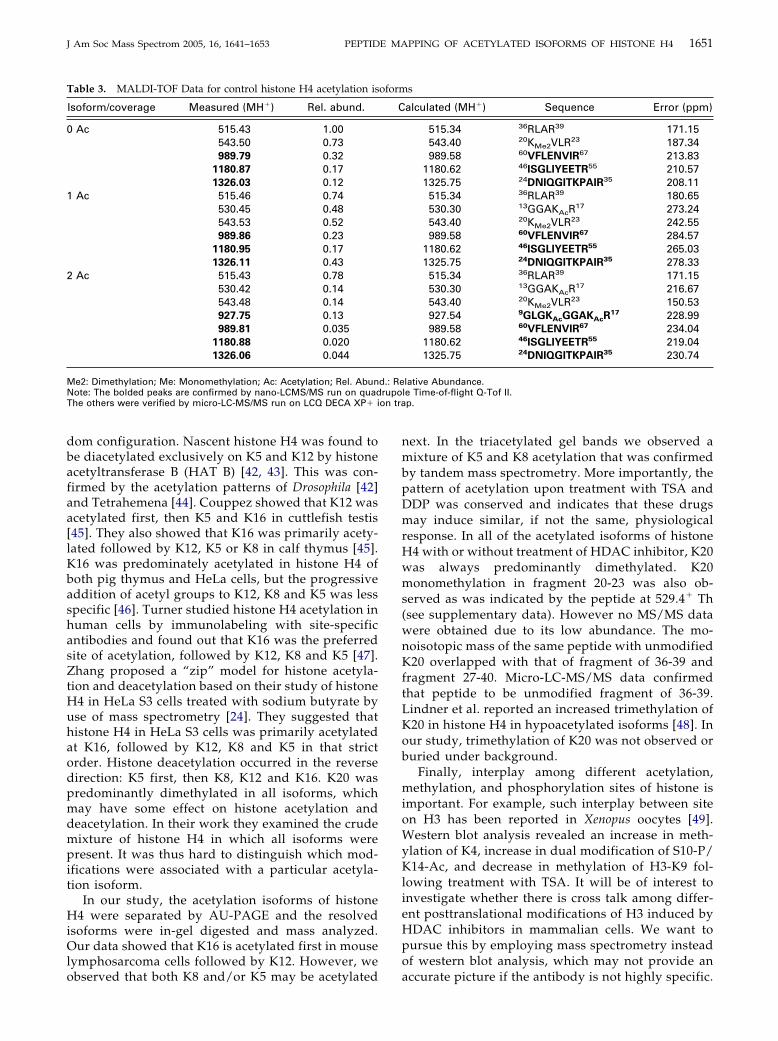
The histone H4 modifications of DDP treated lym-phosarcoma cells are summarized in Table 2. Asindicated above, only the assignments confirmed byMS/MS are discussed in the following. The pattern ofpeptides observed for the DDP treated cells is virtu-ally identical to that observed for the TSA treatedcells (Figure 3). Some low abundance peptides ob-served in the TSA treated cells were not observed inDDP treated cells likely because of lower proteinconcentration and experimental variance. However,the pattern of modification follows the same trendobserved for TSA. K16 is initially acetylated, followedby K12. The triacetylation isoform contains the addi-tional acetylation of K5 or K8. Thus, the experimentsrevealed no major differences in the NH2-terminalspecificity between TSA and DDP with the exceptionthat DDP is effective at much lower concentrations(10 nM DDP compared with 300 nM TSA). No differ-ences in the peptide identity and locations of modi-fications were observed when compared with thepeptides from the gel bands of the untreated controlexcept that only three isoforms were observed in thecontrol (Table 3). For comparison, the MALDI-TOFMS data are provided in the Supplementary Materialavailable online (Tables A1, A2, A3, Figures 1, 2, 3).
Verification of Acetylation Patterns by LC-MS/MSSince MALDI-TOF MS does not have the mass accu-racy to differentiate trimethylation and acetylation
ion at 719.952� Th (data obtained from DDP
ursor
from
1649J Am Soc Mass Spectrom 2005, 16, 1641–1653 PEPTIDE MAPPING OF ACETYLATED ISOFORMS OF HISTONE H4
(42.0470 versus 42.0106 Da), LC-MS/MS experimentswere also performed to verify the sequences andmodification patterns for each of the in-gel digests. Inaddition to direct sequence information, MS/MS gen-erates diagnostic fragments that aid in the assign-ment. For example, trimethylated peptides yield y-59
Figure 8. Micro-LC-MS/MS spectrum of preacetylated in fragment 13 to 17 (data obtained
Figure 9. Micro-LC-MS/MS spectrum of pre
dimethylated in fragment 20 to 23 (data obtained froions and/or b-59 ions [29]. If the peptide is acety-lated, y and b ions will be observed in addition to animmonium ion 126� Th [29].
The precursor ion at 464.382� Th was assigned unam-biguously by nano-LC-MS/MS to be acetylation at K12and K16 in fragment 9-17. The immonium ion at 126.14�
r ion at 265.912� Th. K16 was verified to beDDP treated diacetylation band).
r ion at 272.642� Th. K20 was verified to be
curso
curso
m DDP treated diacetylation band).
rupoon tra
1650 REN ET AL. J Am Soc Mass Spectrom 2005, 16, 1641–1653
Th and the abundant y and b ions confirm the MALDI-TOF MS peak at 927.76� Th as 9GLGKAcGGAKAcR
17
(Figure 4). Using the same strategy, the monoisotopicpeak at 1211.79� Th from MALDI-TOF MS was identifiedas 6GGKAcGLGKAcGGAKAcR
17 from the nano-LC-MS/MSdata of precursor ion 606.53 2� Th (Figure 5). This assign -ment confirms the absence of the isobaric unmodifiedfragment 92-102 that could also occur at 1211.63� Th. Themonoisotopic peak at 1396.85� Th has three lysines acety-lated among four lysines in fragment 4-17 giving rise tofour possible isoforms. Nano-LC-MS/MS showed thatK12 and K16 were acetylated. However, closer inspectionof the data revealed two sets of NH2-terminal b and y ionsdiffering in mass by 42 Da. Although the product ion forK5 acetylation b2=(228.20�), b3=(285.23�), b4= (342.27�)might also be assigned as internal fragment ions, theunique y12= (1169.93�) supports K5 as another site ofacetylation. Thus, this peak is from a mixture of peptideswhere either K5 or K8 were acetylated. The sequences forthese monoisotopic peaks were 4GKGGKAcGLGKAcG-GAKAcR
17 and 4GKAcGGKGLGKAcGGAKAcR17 (Figure 6).
The peptide with monoisotopic mass 1439.04� Th was
Table 2. MALDI-TOF Data for depsipeptide treated histone H4
Isoform/coverage Measured (MH�) Rel. abund. Cal
0 Ac 515.40 1.00543.47 0.65989.74 0.13
1180.79 0.0331325.98 0.088
1 Ac 515.36 0.35530.33 0.18543.42 0.27989.65 0.18
1180.74 0.0041325.82 0.010
2 Ac 515.40 0.46530.39 0.078543.47 0.29927.65 0.16989.67 0.031
1180.71 0.0151325.87 0.039
3 Ac 515.45 1.00543.52 0.38927.73 0.58989.80 0.23
1180.87 0.141211.92 0.0371326.01 0.181397.06 0.048
4 Ac 515.44 0.37543.51 0.30989.74 0.040
1180.86 0.0171325.99 0.0271439.06 0.54
Me2: Dimethylation; Me: Monomethylation; Ac: Acetylation; Rel. AbunNote: The bolded peaks are confirmed by nano-LCMS/MS run on quadThe others were verified by micro-LC-MS/MS run on LCQ DECA XP� i
established by nano-LC-MS/MS to be the acetylation of
K5, K8, K12, and K16 in fragment 4-17 from the precursorion at 719.952� Th (Figure 7) excluding assignment to theunmodified isobaric fragment 79-91 (1438.80� Th).
For the low mass precursor ions, micro-LC-MS/MSdata were obtained to verify their sequence. For thepeptide at 515.30� Th, there are three possible se-quences based on the monoisotopic mass: 37LARR40,36RLAR39, or 20KVLR23. MS/MS of the precursor ion at258.372� Th revealed its sequence as 36RLAR39 (seesupplementary data). Using the same method, the pre-cursor ion at 265.912� corresponded to acetylation ofK16 in fragment 13-17 (Figure 8) and the precursor ionat 272.642� confirmed the dimetylation of K20 in20KMe2VLR23 (Figure 9). A singly charged precursor ionat 543.30� was also fragmented and further verified thedimethylation of K20 in fragment 20-23 (see Supple-mentary Material).
Acetylation Patterns of Histone H4
Histone acetylation has been widely studied due toits significant role in nucleosome assembly. More
lation isoforms
ed (MH�) Sequence Error (ppm)
5.34 36RLAR39 112.933.40 20KMe2VLR23 132.139.58 60VFLENVIR67 163.300.62 46ISGLIYEETR55 142.815.75 24DNIQGITKPAIR35 170.395.34 36RLAR39 38.810.30 13GGAKAcR
17 56.573.40 20KMe2VLR23 40.129.58 60VFLENVIR67 70.740.62 46ISGLIYEETR55 101.645.75 24DNIQGITKPAIR35 52.805.34 36RLAR39 112.930.30 13GGAKAcR
17 169.723.40 20KMe2VLR23 132.137.54 9GLGKAcGGAKAcR
17 121.189.58 60VFLENVIR67 92.560.62 46ISGLIYEETR55 92.565.75 24DNIQGITKPAIR35 87.425.34 36RLAR39 161.243.40 20KMe2VLR23 224.157.54 9GLGKAcGGAKAcR
17 207.439.58 60VFLENVIR67 223.930.62 46ISGLIYEETR55 210.571.69 6GGKAcGLGKAcGGAKAcR
17 189.825.75 24DNIQGITKPAIR35 193.026.80 4GKAcGGKGLGKAcGGAKAcR
17 184.354GKGGKAcGLGKAcGGAKAcR
17
5.34 36RLAR39 190.553.40 20KMe2VLR23 205.749.58 60VFLENVIR67 163.300.62 46ISGLIYEETR55 202.105.75 24DNIQGITKPAIR35 177.948.81 4GKAcGGKAcGLGKAcGGAKAcR
17 182.10
lative Abundance.le Time-of-flight Q-Tof II.p.
acety
culat
515498
11813251535498
1181325153549298
11813251549298
118121132139
515498
118132143
d.: Re
importantly acetylation does not appear to be ran-
rupoon tra
1651J Am Soc Mass Spectrom 2005, 16, 1641–1653 PEPTIDE MAPPING OF ACETYLATED ISOFORMS OF HISTONE H4
dom configuration. Nascent histone H4 was found tobe diacetylated exclusively on K5 and K12 by histoneacetyltransferase B (HAT B) [42, 43]. This was con-firmed by the acetylation patterns of Drosophila [42]and Tetrahemena [44]. Couppez showed that K12 wasacetylated first, then K5 and K16 in cuttlefish testis[45]. They also showed that K16 was primarily acety-lated followed by K12, K5 or K8 in calf thymus [45].K16 was predominately acetylated in histone H4 ofboth pig thymus and HeLa cells, but the progressiveaddition of acetyl groups to K12, K8 and K5 was lessspecific [46]. Turner studied histone H4 acetylation inhuman cells by immunolabeling with site-specificantibodies and found out that K16 was the preferredsite of acetylation, followed by K12, K8 and K5 [47].Zhang proposed a “zip” model for histone acetyla-tion and deacetylation based on their study of histoneH4 in HeLa S3 cells treated with sodium butyrate byuse of mass spectrometry [24]. They suggested thathistone H4 in HeLa S3 cells was primarily acetylatedat K16, followed by K12, K8 and K5 in that strictorder. Histone deacetylation occurred in the reversedirection: K5 first, then K8, K12 and K16. K20 waspredominantly dimethylated in all isoforms, whichmay have some effect on histone acetylation anddeacetylation. In their work they examined the crudemixture of histone H4 in which all isoforms werepresent. It was thus hard to distinguish which mod-ifications were associated with a particular acetyla-tion isoform.
In our study, the acetylation isoforms of histoneH4 were separated by AU-PAGE and the resolvedisoforms were in-gel digested and mass analyzed.Our data showed that K16 is acetylated first in mouselymphosarcoma cells followed by K12. However, we
Table 3. MALDI-TOF Data for control histone H4 acetylation is
Isoform/coverage Measured (MH�) Rel. abund.
0 Ac 515.43 1.00543.50 0.73989.79 0.32
1180.87 0.171326.03 0.12
1 Ac 515.46 0.74530.45 0.48543.53 0.52989.86 0.23
1180.95 0.171326.11 0.43
2 Ac 515.43 0.78530.42 0.14543.48 0.14927.75 0.13989.81 0.035
1180.88 0.0201326.06 0.044
Me2: Dimethylation; Me: Monomethylation; Ac: Acetylation; Rel. AbunNote: The bolded peaks are confirmed by nano-LCMS/MS run on quadThe others were verified by micro-LC-MS/MS run on LCQ DECA XP� i
observed that both K8 and/or K5 may be acetylated
next. In the triacetylated gel bands we observed amixture of K5 and K8 acetylation that was confirmedby tandem mass spectrometry. More importantly, thepattern of acetylation upon treatment with TSA andDDP was conserved and indicates that these drugsmay induce similar, if not the same, physiologicalresponse. In all of the acetylated isoforms of histoneH4 with or without treatment of HDAC inhibitor, K20was always predominantly dimethylated. K20monomethylation in fragment 20-23 was also ob-served as was indicated by the peptide at 529.4� Th(see supplementary data). However no MS/MS datawere obtained due to its low abundance. The mo-noisotopic mass of the same peptide with unmodifiedK20 overlapped with that of fragment of 36-39 andfragment 27-40. Micro-LC-MS/MS data confirmedthat peptide to be unmodified fragment of 36-39.Lindner et al. reported an increased trimethylation ofK20 in histone H4 in hypoacetylated isoforms [48]. Inour study, trimethylation of K20 was not observed orburied under background.
Finally, interplay among different acetylation,methylation, and phosphorylation sites of histone isimportant. For example, such interplay between siteon H3 has been reported in Xenopus oocytes [49].Western blot analysis revealed an increase in meth-ylation of K4, increase in dual modification of S10-P/K14-Ac, and decrease in methylation of H3-K9 fol-lowing treatment with TSA. It will be of interest toinvestigate whether there is cross talk among differ-ent posttranslational modifications of H3 induced byHDAC inhibitors in mammalian cells. We want topursue this by employing mass spectrometry insteadof western blot analysis, which may not provide an
s
alculated (MH�) Sequence Error (ppm)
515.34 36RLAR39 171.15543.40 20KMe2VLR23 187.34989.58 60VFLENVIR67 213.83
1180.62 46ISGLIYEETR55 210.571325.75 24DNIQGITKPAIR35 208.11515.34 36RLAR39 180.65530.30 13GGAKAcR
17 273.24543.40 20KMe2VLR23 242.55989.58 60VFLENVIR67 284.57
1180.62 46ISGLIYEETR55 265.031325.75 24DNIQGITKPAIR35 278.33515.34 36RLAR39 171.15530.30 13GGAKAcR
17 216.67543.40 20KMe2VLR23 150.53927.54 9GLGKAcGGAKAcR
17 228.99989.58 60VFLENVIR67 234.04
1180.62 46ISGLIYEETR55 219.041325.75 24DNIQGITKPAIR35 230.74
lative Abundance.le Time-of-flight Q-Tof II.p.
oform
C
d.: Re
accurate picture if the antibody is not highly specific.

1652 REN ET AL. J Am Soc Mass Spectrom 2005, 16, 1641–1653
Conclusions
The present study was undertaken to explore the acet-ylation patterns of histone H4 after treatment withHDAC inhibitors. To address this question, differentacetylation isoforms of histone H4 were separated firstby AU-PAGE; then MALDI-TOF MS and nano- ormicro-LC-MS/MS was performed to give a systematicanalysis. Our study demonstrates the successful appli-cation of peptide mass fingerprinting on tryptic in-geldigests after the separation of acetylation isoforms byAU-PAGE. MALDI-TOF MS data identified the trend ofacetylation for the HDAC inhibitor TSA and DDPtreated histones on the NH2-terminal residues. In his-tone H4 of mouse lymphosarcoma cells, K16 is prefer-entially acetylated, followed by K12, K8, and/or K5.Nano- or micro-LC-MS/MS of the in-gel digests veri-fied the modification patterns.
HDAC inhibitors also play an important role in thereversible acetylation of nonhistone DNA binding pro-teins such as p53 [50] and NF-kB [51]. Likely, many keycellular proteins are hyperacetylated in cells treatedwith TSA or DDP. It will be important to identify theseproteins specifically in cancer cells that are sensitive orresistant to HDAC inhibitors by employing whole cellproteomics. Studies along these lines are our goals inthe future.
AcknowledgmentsThe authors thank Xiaodan Su and Huban Kutay for help with theAU-PAGE. They also thank Dr. Kari Green-Church and NanetteKleinholz at Campus Chemical Instrumentation Center for assis-tance with MALDI-TOF MS and nano-LC-MS/MS experiments.The study was funded by the Ohio State University, the Camilleand Henry Dreyfus Foundation, the American Society for MassSpectrometry; CA107106 from the National Institutes of Health (toMAF), CA61204 and ES61204 from the National Institutes ofHealth (to STJ), and GM62970 from the National Institutes ofHealth (to MRP).
References1. Luger, K.; Mader, A. W.; Richmond, R. K.; Sargent, D. F.;
Richmond, T. J. Crystal structure of the nucleosome coreparticle at 2.8 Å resolution. Nature 1997, 389, 251–260.
2. Luger, K.; Richmond, T. J. The histone tails of the nucleosome.Curr. Opin. Genet. Dev. 1998, 8, 140–146.
3. Strahl, B. D.; Allis, C. D. The language of covalent histonemodifications. Nature 2000, 403, 41–45.
4. Marks, P.; Rifkind, R. A.; Richon, V. M.; Breslow, R.; Miller, T.;Kelly, W. K. Histone deacetylases and cancer: Causes andtherapies. Nat. Rev. Cancer 2001, 1, 194–202.
5. Strahl, B. D.; Ohba, R.; Cook, R. G.; Allis, C. D. Methylation ofhistone H3 at lysine 4 is highly conserved and correlates withtranscriptionally active nuclei in tetrahymena. Proc. Natl. Acad.Sci. U.S.A. 1999, 96, 14967–14972.
6. Jenuwein, T.; Allis, C. D. Translating the histone code. Science2001, 293, 1074–1080.
7. Sif, S. ATP-dependent nucleosome remodeling complexes:Enzymes tailored to deal with chromatin. J. Cell. Biochem. 2004,
91, 1087–1098.8. Zhang, Y.; Reinberg, D. Transcription regulation by histonemethylation: Interplay between different covalent modifica-tions of the core histone tails. Genes Dev. 2001, 15, 2343–2360.
9. Xu, W.; Cho, H.; Evans, R. M. Acetylation and methylation innuclear receptor gene activation. Methods Enzymol. 2003, 364,205–223.
10. Santos-Rosa, H.; Schneider, R.; Bannister, A. J.; Sherriff, J.;Bernstein, B. E.; Emre, N. C.; Schreiber, S. L.; Mellor, J.;Kouzarides, T. Active genes are trimethylated at K4 of histoneH3. Nature 2002, 419, 407–411.
11. Bannister, A. J.; Schneider, R.; Kouzarides, T. Histone methyl-ation: Dynamic or static? Cell 2002, 109, 801–806.
12. Shi, Y.; Lan, F.; Matson, C.; Mulligan, P.; Whetstine, J. R.; Cole,P. A.; Casero, R. A. Histone demethylation mediated by thenuclear amine oxidase homolog LSD1. Cell 2004, 119, 941–953.
13. Wang, Y.; Wysocka, J.; Sayegh, J.; Lee, Y. H.; Perlin, J. R.;Leonelli, L.; Sonbuchner, L. S.; McDonald, C. H.; Cook, R. G.;Dou, Y.; Roeder, R. G.; Clarke, S.; Stallcup, M. R.; Allis, C. D.;Coonrod, S. A. Human PAD4 regulates histone argininemethylation levels via demethylimination. Science 2004, 2, 2.
14. Cuthbert, G. L.; Daujat, S.; Snowden, A. W.; Erdjument-Bromage,H.; Hagiwara, T.; Yamada, M.; Schneider, R.; Gregory, P. D.;Tempst, P.; Bannister, A. J.; Kouzarides, T. Histone deiminationantagonizes arginine methylation. Cell 2004, 118, 545–553.
15. Mahadevan, L. C., Clayton, A. L., Hazzalin, C. A., Thomson, S.Phosphorylation and acetylation of histone H3 at induciblegenes: Two controversies revisited. Novartis Foundation Symp.2004, 259, 102/11; 111/4; Discussion; 163–169.
16. Crane-Robinson, C.; Hebbes, T. R.; Clayton, A. L.; Thorne,A. W. Chromosomal mapping of core histone acetylation byimmunoselection. Methods 1997, 12, 48–56.
17. Suka, N.; Suka, Y.; Carmen, A. A.; Wu, J.; Grunstein, M.Highly specific antibodies determine histone acetylation siteusage in yeast heterochromatin and euchromatin. Mol. Cell2001, 8, 473–479.
18. Fenn, J. B.; Mann, M.; Meng, C. K.; Wong, S. F.; Whitehouse,C. M. Electrospray ionization for mass spectrometry of largebiomolecules. Science 1989, 246, 64–71.
19. Fenn, J. B.; Mann, M.; Meng, C. K.; Wong, S. F. Electrospray.Mass Spectrom. Rev. 1990, 9, 37–70.
20. Whitehouse, C. M.; Dreyer, R. N.; Yamashita, M.; Fenn, J. B.Electrospray. Anal. Chem. 1985, 57, 675–679.
21. Karas, M.; Bahr, U.; Hillenkamp, F. UV laser matrix desorp-tion/ionization mass spectrometry of proteins in the 100,000Da range. Int. J. Mass Spectrom. Ion Processes 1989, 92, 231–242.
22. Tanaka, K.; Waki, H.; Ido, Y.; Akita, S.; Yoshida, Y.; Yoshida,T. Protein and polymer analyses up to m/z 100,000 by laserionization time-of-flight mass spectrometry. Rapid Commun.Mass Spectrom. 1988, 2, 151–153.
23. Hillenkamp, F.; Karas, M.; Beavis, R. C.; Chait, B. T. Matrix-assisted laser desorption/ionization mass spectrometry ofbiopolymers. Anal. Chem. 1991, 63, 1193A–1203A.
24. Zhang, K.; Williams, K. E.; Huang, L.; Yau, P.; Siino, J. S.;Bradbury, E. M.; Jones, P. R.; Minch, M. J.; Burlingame, A. L.Histone acetylation and deacetylation: Identification of acety-lation and methylation sites of HeLa histone H4 by massspectrometry. Mol. Cell. Proteomics 2002, 1, 500–508.
25. Zhang, K.; Tang, H.; Huang, L.; Blankenship, J. W.; Jones,P. R.; Xiang, F.; Yau, P. M.; Burlingame, A. L. Identification ofacetylation and methylation sites of histone H3 from chickenerythrocytes by high-accuracy matrix-assisted laser desorp-tion ionization-time-of-flight, matrix-assisted laser desorptionionization-postsource decay, and nanoelectrospray ionizationtandem mass spectrometry. Anal. Biochem. 2002, 306, 259–269.
26. Zhang, K.; Tang, H. Analysis of core histones by liquidchromatography-mass spectrometry and peptide mapping.
J. Chromatogr. B 2003, 783, 173–179.
1653J Am Soc Mass Spectrom 2005, 16, 1641–1653 PEPTIDE MAPPING OF ACETYLATED ISOFORMS OF HISTONE H4
27. Zhang, L.; Freitas, M. A.; Wickman, J.; Parthun, M. R.; Kliso-vic, M. I.; Marcucci, G.; Byrd, J. C. Differential expression ofhistone posttranslational modifications in acute myeloid andchronic lymphocytic leukemia determined by high-pressureliquid chromatography and mass spectrometry. J. Am. Soc.Mass Spectrom. 2004, 15, 77–86.
28. Zhang, L.; Eugeni, E. E.; Parthun, M. R.; Freitas, M. A.Identification of novel histone posttranslational modificationsby peptide mass fingerprinting. Chromosoma 2003, 112, 77–86.
29. Zhang, K.; Yau, P. M.; Chandrasekhar, B.; New, R.; Kondrat,R.; Imai, B. S.; Bradbury, M. E. Differentiation between pep-tides containing acetylated or trimethylated lysines by massspectrometry: An application for determining lysine 9 acety-lation and methylation of histone H3. Proteomics 2004, 4, 1–10.
30. Galasinski, S. C.; Resing, K. A.; Ahn, N. G. Protein massanalysis of histones. Methods 2003, 31, 3–11.
31. Freitas, M. A.; Sklenar, A. R.; Parthun, M. R. Application ofmass spectrometry to the identification and quantification ofhistone posttranslational modifications. J. Cell. Biochem. 2004,92, 691–700.
32. Medzihradszky, K. F.; Zhang, X.; Chalkley, R. J.; Guan, S.;McFarland, M. A.; Chalmers, M. J.; Marshall, A. G.; Diaz, R. L.;Allis, C. D.; Burlingame, A. L. Characterization of tetrahymenahistone H2B variants and posttranslational populations byelectron capture dissociation (ECD) Fourier transform ioncyclotron mass spectrometry (FT-ICR MS). Mol. Cell. Proteom-ics 2004, 3, 872–886.
33. Galasinski, S. C.; Louie, D. F.; Gloor, K. K.; Resing, K. A.; Ahn,N. G. Global regulation of posttranslational modifications oncore histones. J. Biol. Chem. 2002, 277, 2579–2588.
34. Lindner, H.; Sarg, B.; Meraner, C.; Helliger, W. Separation ofacetylated core histones by hydrophilic-interaction liquidchromatography. J. Chromatogr. A 1996, 743, 137–144.
35. Lindner, H.; Sarg, B.; Helliger, W. Application of hydrophilic-interaction liquid chromatography to the separation of phos-phorylated H1 histones. J. Chromatogr. A 1997, 782, 55–62.
36. Reinhold, B. B.; Chan, S.-Y.; Reuber, L.; Walker, G. C.;Reinhold, V. N. Detailed structural characterization of theexopolysaccharide from Rhizobium meliloti. J. Bacteriol. 1994,176, 1997–2002.
37. Person, M. D.; Monks, T. J.; Lau, S. S. An integrated approachto identifying chemically induced posttranslational modifica-tions using comparative MALDI-MS and targeted HPLC-ESI-MS/MS. Chem. Res. Toxicol. 2003, 16, 598–608.
38. Majumder, S.; Ghoshal, K.; Li, Z.; Bo, Y.; Jacob, S. T. Silencingof metallothionein-I gene in mouse lymphosarcoma cells bymethylation. Oncogene 1999, 18, 6287–6295.
39. Ghoshal, K.; Datta, J.; Majumder, S.; Bai, S.; Dong, X.; Parthun,
M.; Jacob, S. T. Inhibitors of histone deacetylase and DNAmethyltransferase synergistically activate the methylatedmetallothionein I promoter by activating the transcriptionfactor MTF-1 and forming an open chromatin structure. Mol.Cell. Biol. 2002, 22, 8302–8319.
40. Perkins, D. N.; Pappin, D. J.; Creasy, D. M.; Cottrell, J. S.Probability-based protein identification by searching sequencedatabases using mass spectrometry data. Electrophoresis 1999,20, 3551–3567.
41. Clauser, K. R.; Baker, P.; Burlingame, A. L. Role of accuratemass measurement (�10 ppm) in protein identification strat-egies employing MS or MS/MS and database searching. Anal.Chem. 1999, 71, 2871–2882.
42. Sobel, R. E.; Cook, R. G.; Perry, C. A.; Annunziato, A. T.; Allis,C. D. Conservation of deposition-related acetylation sites innewly synthesized histones H3 and H4. Proc. Natl. Acad. Sci.U.S.A. 1995, 92, 1237–1241.
43. Chang, L.; Loranger, S. S.; Mizzen, C.; Ernst, S. G.; Allis, C. D.;Annunziato, A. T. Histones in transit: Cytosolic histone com-plexes and diacetylation of H4 during nucleosome assembly inhuman cells. Biochemistry 1997, 36, 469–480.
44. Chicoine, L. G.; Schulman, I. G.; Richman, R.; Cook, R. G.;Allis, C. D. Nonrandom utilization of acetylation sites inhistones isolated from tetrahymena. Evidence for functionallydistinct H4 acetylation sites. J. Biol. Chem. 1986, 261, 1071–1076.
45. Couppez, M.; Martin-Ponthieu, A.; Sautiere, P. Histone H4from cuttlefish testis is sequentially acetylated. Comparisonwith acetylation of calf thymus histone H4. J. Biol. Chem. 1987,262, 2854–2860.
46. Thorne, A. W.; Kmiciek, D.; Mitchelson, K.; Sautiere, P.;Crane-Robinson, C.Patterns of histone acetylation. Eur. J. Bio-chem. 1990, 193, 701–713.
47. Turner, B. M.; O’Neill, L. P.; Allan, I. M. Histone H4 acetyla-tion in human cells. Frequency of acetylation at different sitesdefined by immunolabeling with site-specific antibodies.FEBS Lett. 1989, 253, 141–145.
48. Sarg, B.; Helliger, W.; Talasz, H.; Koutzamani, E.; Lindner,H. H. Histone H4 hyperacetylation precludes histone H4lysine 20 trimethylation. J. Biol. Chem. 2004, 279, 53458–53464.
49. Li, J.; Lin, Q.; Yoon, H. G.; Huang, Z. Q.; Strahl, B. D.; Allis,C. D.; Wong, J. Involvement of histone methylation andphosphorylation in regulation of transcription by thyroidhormone receptor. Mol. Cell. Biol. 2002, 22, 5688–5697.
50. Luo, J.; Li, M.; Tang, Y.; Laszkowska, M.; Roeder, R. G.; Gu, W.Acetylation of p53 augments its site-specific DNA bindingboth in vitro and in vivo. Proc. Natl. Acad. Sci. U.S.A. 2004, 101,2259–2264.
51. Greene, W. C., Chen, L. F. Regulation of NF-�B action byreversible acetylation. Novartis Foundation Symp. 2004, 259,
208/17; Discussion; 218–225.