perceived discrimination among older adults living in
TRANSCRIPT

RESEARCH ARTICLE Open Access
Perceived discrimination among olderadults living in urban and rural areas inBrazil: a national study (ELSI-Brazil)Luciana de Souza Braga1*, Waleska Teixeira Caiaffa1, Ana Paula Romanelli Ceolin1, Fabíola Bof de Andrade2 andMaria Fernanda Lima-Costa2
Abstract
Background: Research on discrimination and health focused on older adults has been scarce, comparatively withyounger and middle-aged adults. Considering where people live matters, accurate measures of perceiveddiscrimination might consider how the place of residence interferes on discriminatory experiences. This studyaimed to assess the association between perceived discrimination and urban/rural place of residence among arepresentative sample of older adults in Brazil.
Methods: Data came from the baseline of the Brazilian Longitudinal Study of Aging (ELSI-Brazil), conducted in2015/2016, with individuals aged 50 years and older. Perceived Discrimination was measured by means of thefollowing question: “In the past 12 months have you felt a victim of any type of discrimination” with five possibleanswers: (1)“when you sought medical services or health care?”, (2)“in social gatherings?”, (3)“in the work place?”, (4)“within the family?”, (5)“due to where you live?”. Participants who answered yes for any of the five domains werecoded as having reported an experience of discrimination. The main exposure variable was the urban-ruralclassification of the households, carried out according to the methods employed by the Brazilian Institute ofGeography and Statistics during the 2010 Population Census. Other covariates included: age, sex, skin color,household wealth and education. Multiple Poisson regression was used to estimate prevalence ratios and theirrespective 95% confidence interval for the association between discrimination and independent variables.
Results: Prevalence of any perceived discrimination among Brazilian older adults was 16.8%. Regardless the place ofresidence (either urban or rural), participants reported health care settings as the most common domain wherediscriminatory experiences occurred and the work place as the least common. According to the adjusted model,perceived discrimination was significantly higher among urban dwellers when compared to their rural counterparts,independent of sociodemographic characteristics, health status and neighborhood social environment. Theoutcome was significant associated with skin color, education and health status.
Conclusions: Urban environment plays a core role in perceived discrimination and health care settings constitutethe most common domain where discriminatory experiences occurred. Our findings may contribute to fulfill theknowledge gap on discrimination among older adults living in developing countries.
Keywords: Discrimination, Urban population, Rural population, Socioeconomic factors
* Correspondence: [email protected]ório de Saúde Urbana de Belo Horizonte, Faculdade de Medicina,Universidade Federal de Minas Gerais, Avenida Professor Alfredo Balena, n°190, Belo Horizonte, Minas Gerais 30130-100, BrazilFull list of author information is available at the end of the article
© The Author(s). 2019 Open Access This article is distributed under the terms of the Creative Commons Attribution 4.0International License (http://creativecommons.org/licenses/by/4.0/), which permits unrestricted use, distribution, andreproduction in any medium, provided you give appropriate credit to the original author(s) and the source, provide a link tothe Creative Commons license, and indicate if changes were made. The Creative Commons Public Domain Dedication waiver(http://creativecommons.org/publicdomain/zero/1.0/) applies to the data made available in this article, unless otherwise stated.
Braga et al. BMC Geriatrics (2019) 19:67 https://doi.org/10.1186/s12877-019-1076-4

BackgroundPerceived discrimination has been defined as an individ-ual’s perception of being treatedunfairly by other peopledue to some personal attribute, such as race, ethnicity,age, gender, socioeconomic status, weight, sexual orien-tation, or other characteristics [1, 2]. Unfair treatmentusually involves discriminatory practices of dominantgroups to maintain privileges they accrue through subor-dinating groups they oppress, which typically revolvearound notions of innate superiority and inferiority, dif-ference, or deviance [3, 4].A large and growing body of research suggests that
self-reported experiences of discrimination are a form ofpsychological stress that has an adverse impact on bothmental and physical health outcomes, across multiplepopulation groups in a wider range of cultural and na-tional contexts [4–6]. Researchers have found associationsbetween reports of discrimination and distress, clinicallydiagnosed mental disorders (e.g., generalized anxiety, post-traumatic stress disorder, depression), all-cause mortalityand a variety of objective clinical disease outcomes suchas preclinical endpoints - nighttime blood pressure and vis-ceral fat - and silent indicators of premature aging - higherallostatic load and increased oxidative stress [5, 6]. Regard-less of effects on health, unjustly denying people fair treat-ment constrain possibilities for living fully expressed andcreate patterns of health inequities [3, 4]. Thus, perceiveddiscrimination’ studies may contribute to identify whatdrives population patterns of health and health inequitiesand to generate knowledge useful for guiding policies andactions to tackle inequities.Research on discrimination and health focused on
older adults has been scarce, comparatively with youngerand middle-aged adults. In general, researchers suggestthat older adults who internalize negative attitudes to-wards themselves are at increased risk for functional [7]and cognitive decline [8], life dissatisfaction [1, 9], de-pression [1], besides social withdrawal [9, 10], reductionin cultural engagement and reluctance to visit healthprofessionals [10]. Among older adults who live in devel-oping countries, literature is even scarcer. The studiesusually represent major urban centers, focus primarily onracial discrimination and older adults just integrate largersamples composed by younger participants rather thanconstitute the target population under analysis [11–13].In Brazil, evidences from a large metropolitan region
showed that around 9% of the respondents reported sometype of discrimination, higher among black, women andlower among those aged 60 years and over [11]. Additionalassociated factors included poorer health status and lowsocial trust [11]. Data from a larger survey of civil servantsshowed that among individuals aged 40 and older, blackwere more likely to report lifetime discrimination, particu-larly black men and for most race-by-gender groups,
perceived discrimination increased with educational at-tainment [13].Brazil has rapidly transitioned from a low-income
country, primarily rural in the mid-1950s, to one of thetop ten economies in the world, with 84% of the popula-tion living in urban areas [14]. The latest Brazilian cen-sus indicated that nearly 33 million people aged 50 andolder lived in cities, and about 6 million were ruraldwellers [15]. The magnitude of rural Brazil is not negli-gible and these areas still play a fundamental role inkeeping economics, social cohesion and environmentalsustainability [16, 17]. In its turn, urban dwellers mayexperience advantages and disadvantages [18, 19], suchas many adverse health outcomes and large health in-equalities [20]. It already became apparent that urbandisadvantaged areas may have similar if not worse healthoutcomes than rural areas [18, 21]. Some authors arguethat discrimination would manifest strongly in areaswith higher levels of social inequalities [3]. If wherepeople live matters, accurate measures of perceived dis-crimination might consider how the place of residenceaffects discriminatory experiences.Using data from the Brazilian Longitudinal Study of
Aging (ELSI-Brazil) baseline survey, we examined thecross-sectional association between perceived discrimin-ation and urban/rural place of residence, among olderadults. Our objective is also to identify the main individ-ual characteristics related to higher reports of discrimin-atory experiences, fostering better understanding of thedistribution, magnitude, and interrelationships amongrisk factors for exposure to discrimination. Consideringdiscrimination may manifest strongly in areas withhigher levels of social inequalities, we hypothesized thaturban residence would be positively associated with per-ceived discrimination, independent of sociodemographiccharacteristics. Given the marginalized racial status ofblacks in Brazil and the evidences from abovementionedstudies, we also expected higher reports of discrimin-atory experiences within this group.
MethodsStudy populationELSI-Brazil is a nationally representative population-basedcohort study of non-institutionalized people aged 50 yearsand older residing in 70 municipalities across the 5 greatBrazilian regions [22]. The baseline survey was conductedbetween 2015 and 2016. To ensure that the sample repre-sents the urban and rural areas of the small, medium andlarge municipalities, the ELSI-Brazil sampling used a designwith selection stages, combining stratification of primarysampling units (municipalities), census tracts and house-holds. The analytic sample for this study included allELSI-Brazil participants (n = 9412). Individuals were ex-cluded if they had missing data on perceived discrimination
Braga et al. BMC Geriatrics (2019) 19:67 Page 2 of 11

and place of residence. The resulting analytic sample wascomprised of 9383 participants. Detailed information ondesign, methods of recruitment and covered topics is avail-able elsewhere [22]. ELSI-Brazil was approved by the EthicsBoard of Oswaldo Cruz Foundation (FIOCRUZ), MinasGerais (CAAE: 34649814.3.0000.5091). All participantssigned separate informed consent forms in advance of theirparticipation in the study.
MeasuresPerceived discriminationTo our dependent variable, collected information wasbased on the question: “In the past 12 months have youfelt a victim of any type of discrimination”, that wasfollowed up with five possible domains: (1)“when yousought medical services or health care?”, (2)“in social gath-erings?”, (3)“in the work place?”, (4)“within the family?”,(5)“due to where you live?”. For each domain, participantswho answered “yes” were coded as having reported an ex-perience of discrimination. An indicator variable, termed“any discrimination”, was developed to capture whetherthe respondents reported at least one episode of discrim-ination in any above-mentioned domain.
Place of residenceThe main exposure variable was the urban-rural classifica-tion of the households, carried out according to the methodsemployed by the Brazilian Institute of Geography and Statis-tics (IBGE) during the 2010 Population Census [23]. Firstly,IBGE defines the urban-rural classification of each censustract from administrative limits set out by local laws [23].Within each municipality boundaries, these local laws deter-mine an imaginary line called “urban perimeter”. The censustracts located within the “urban perimeter” are termedurban while the residual areas are designated rural. Second,IBGE assigns to the households the same urban-rural classi-fication of the census tract to which these residences belong.Because the sampling design of ELSI-Brasil took into ac-count the urban-rural classification of each census tract, thehouseholds’ classification was already known previously tothe interview.
CovariatesIndividual sociodemographic characteristics included age(50–59 years, 60–69 years, 70–79 years, > 80 years), sex(male or female), ethno racial self-classification, householdwealth and educational attainment (less than 4, 4–7, and 8or more years). ELSI-Brazil participants self-declared raceaccording to one of the following IBGE categories: black,brown, white, yellow (Asian) and indigenous. The lattertwo categories constitute nearly 1% of the Brazilian popu-lation over 50 years old [15]. Thus, considering the smallsample size of both yellow and indigenous participants,these categories were grouped for analytic purposes,
regardless of the acknowledged cultural differences be-tween them. Analyses showed similar trends in terms ofdirection and magnitude when groups were treated separ-ately (data not shown). The household wealth wasassessed through data on ownership of household durableassets, such as home appliances and vehicles, and domes-tic employees. Based on principal components analysis(PCA), a score of socioeconomic position was generatedand participants were divided into quartiles, from the‘most poor’ to the ‘most wealthy’ [24]. A binary variablewhereas the 3 lowest quartiles versus the top quartile wascreated and employed during the analyses.Finally, we also included health status and neighbor-
hood social environment indicators whereas both couldconfound or partially mediate the association betweenperceived discrimination and place of residence. Due tocollinearity among health indicators, a composite meas-ure of the health status based on PCA was obtained (seeAdditional file 1). The selected variables includedself-rated health, number of the last 30 days spent inpoor mental and/or physical health, and history of medicaldiagnosis from a list of 12 prevalent chronic diseases/con-ditions, such as hypertension, diabetes, depression andarthritis. The resulting health status score was divided intotertiles and the lowest one, termed “few health problems”,represents the reference group. The neighborhood socialenvironment was assessed by the question: “Do you believeyou can trust most people in your neighborhood?” Re-sponses were coded as low, medium or high social trust.All covariates rely on self-report.
Statistical analysisWe calculated age-and gender-adjusted prevalence ratesfor each study variable according to the place of resi-dence and estimated perceived discrimination prevalenceby sex, age, ethno racial self-classification and educa-tional attainment using Poisson regression. To verifydifferences among categories, we used the proportiontest, considering a level of significance of 0.05. Use ofPoisson models was justified because our outcomeswere relatively common (prevalence > 10%), especiallythe main one (any discrimination) [25]. To verify theunivariate and multivariate associations between “anydiscrimination” and the independent variables, we fitPoisson regression to estimate the prevalence ratios(PR) and their respective 95% confidence interval(95% CI). The multivariate model was tested includ-ing all independent variables. To examine whetherthe place of residence had a different effect on race,we include an interaction term. Those variables witha p-value > 0.05 were removed. From the multivariatemodel, we plotted the predicted probabilities ofreporting any discrimination.
Braga et al. BMC Geriatrics (2019) 19:67 Page 3 of 11

Data analysis was performed using Stata 12.0 statisticalprogram [26]. Through the svy command, we took into ac-count the sample design, individual weights and aggregation.
ResultsAmong older adults, nearly 85% live in urban areas and15% are rural dwellers, a proportion quite similar to thepatterns of the 2010 Brazilian Population Census. Table 1shows that rural dwellers present a significant higherproportion of blacks (11.9% versus 9.3% in urban areas),and browns (49.7% versus 43.8% in urban areas), worseeducational attainment (89.0% have less than 8 years ofschooling versus 59.8% in urban areas) and a higher pro-portion of individuals belonging to the lowest householdwealth quartiles (94.2% versus 71.5% in urban areas).Otherwise, low social trust was predominant amongolder adults who lived in urban areas (19.1% versus15.0% in rural areas). The age and sex-adjusted preva-lence of perceived discrimination (any) among Brazilianolder adults was 16.8%, higher among urban dwellers forall domains. Regardless the place of residence, partici-pants reported health care settings as the most commondomain where discriminatory experiences occurred.Table 2 identifies the relationship between reports of
discriminatory experiences and sociodemographic char-acteristics. Except for perceived discrimination withinthe family, no male/female trend was found regarding per-ceived discrimination. Age showed an inverse gradientwith reports of discriminatory experiences, for all analyzeddomains. Whereas ethno racial self-classification, yellowand indigenous reported higher discrimination (any, whensought health services and due to where live) than anyother race category. Regarding educational attainment, themost educated individuals were more likely to report anydiscrimination, but only significant for social gatheringsand work place domains.Table 3 presents the results of our fitted model, which
presented a good fit (Deviance Goodness of Fit =4757.694). It shows that perceived discrimination is 34%higher among urban dwellers when compared to theirrural counterparts, independent of sociodemographiccharacteristics, health status and neighborhood social en-vironment. Among older adults, perceived discriminationwas positively associated to ethno racial self-classification,higher educational attainment (PR = 1.17 to individualswith 4–7 years of schooling; PR = 1.24 to those with > 8years of schooling) and worse health status (PR = 1.65 toindividuals with some health problems; PR = 2.40 to thosewith many health problems). Age and social trust showedan inverse association with perceived discrimination. Sexand household wealth showed no association with per-ceived discrimination. Once the interaction term betweenplace of residence and ethno racial self-classification wasinsignificant, it was not included in the final model.
Finally, the figures show how the predicted probabilitiesof reporting any discrimination varied by place of resi-dence, skin color, and age group (Fig. 1) or health status(Fig. 2). Discrimination reports were highest among urbandwellers, regardless ethno racial self-classification, agegroup or health status. Despite these important magnitudedifferences between urban and rural dwellers, trends werequite similar for both areas: (1) participants who identifyas yellow or indigenous were the worse-off group,followed by blacks and browns, at all ages and for every
Table 1 Age and sex-adjusted prevalence of descriptivestatistics, by place of residence (ELSI-Brazil/2015–2016)
Urban Rural Total
N (unweighted) 7912 1471 9383
% (weighted) 84.7 15.3 100.0
Aged 50–59 years1 48.0 46.0 47.7
60–69 years1 29.4 30.9 29.6
70–79 years1 15.4 16.9 15.6
80+ years1 7.2 6.2 7.1
Female1 53.9 54.3 53.9
Male1 46.2 45.7 46.1
White* 44.1 35.2 42.7
Black* 9.3 11.9 9.7
Brown* 43.8 49.7 44.7
Yellow 1.1 1.0 1.1
Indigenous 1.8 2.3 1.9
Educational attainment (< 4 years)* 28.5 56.8 32.8
4–7 years 31.3 32.2 31.4
8+ years* 40.2 10.8 35.7
Lowest household wealth (3 lowest quartiles)* 71.5 94.2 75.0
Highest household wealth (top quartile)* 28.5 5.8 25.0
Few health problems2 35.6 36.1 35.7
Some health problems2 32.3 31.9 32.2
Many health problems2 32.0 32.1 32.0
Low social trust* 19.1 15.0 18.5
Medium social trust* 26.3 30.0 26.9
High social trust 54.6 54.9 54.6
Perceived discrimination (any)* 17.6 12.2 16.8
In seeking health care* 11.4 8.7 11.0
In social gatherings 3.3 2.5 3.1
In the work place* 2.7 1.1 2.5
Within the family* 3.8 2.6 3.6
Due to where live * 3.7 2.3 3.51=Non-adjusted. * = significant difference between urban and rural (p < 0.05).2Composite measure obtained through principal components analysis, fromthe following variables: self-rated health, number of the last 30 days spent inpoor mental and/or physical health, and history of medical diagnosis from alist of 12 prevalent chronic diseases/conditions. Results took into accountcomplex sample design and sample weights
Braga et al. BMC Geriatrics (2019) 19:67 Page 4 of 11

Table 2 Perceived discrimination by sociodemographic characteristics (ELSI-Brazil/2015–2016)
Sex (n) Age (years) (n) Ethno racial self-classification (n) Educationalattainment (years) (n)
Female(5314)
Male(4098)
50–59(3980)
60–69(2875)
70–79(1781)
80+(776)
White(3590)
Black(887)
Brown(4283)
Yellow/Indigenous(310)
< 4(3463)
4–7(2845)
8+(3042)
% % % %
Perceiveddiscrimination(any)
17.6 15.8 18.5 17.5 13.6 8.8* 14.3 21.9 17.7 26.2* 14.4 17.9 18.0*
In seekinghealth care
11.4 10.5 11.5 11.8 9.9 6.4* 9.2 13.9 11.8 17.3* 10.5 11.7 10.9
In socialgatherings
3.2 3.1 3.6 3.2 2.7 0.8* 2.1 6.2 3.3 5.0* 2.7 2.7 3.9*
In the workplace
2.3 2.7 3.6 2.1 0.7 0.2* 2.0 3.0 2.6 4.8 1.3 2.4 3.6*
Within thefamily
4.6 2.5* 3.8 3.9 3.5 2.0 3.4 3.3 3.8 5.1 3.5 4.1 3.3
Due to wherelive
3.8 3.2 3.8 4.0 3.0 0.8* 2.6 4.8 4.0 7.0* 3.2 3.5 4.0
* = Significant difference (p < 0.05)
Table 3 Factors associated to perceived discrimination among older adults (ELSI-Brazil/2015–2016)
Unadjusted2 Adjusted3
N1 PR 95% CI PR 95%CI
Place of residence (reference: rural) 192
Urban 1425 1.44 (1.13–1.84) 1.34 (1.06–1.69)
Aged (reference: 50–59 years) 787
60–69 years 491 0.95 (0.84–1.07) 1.00 (0.88–1.14)
70–79 years 257 0.74 (0.62–0.88) 0.82 (0.68–1.00)
80+ years 82 0.48 (0.35–0.65) 0.52 (0.38–0.72)
Sex (reference: female) 950
Male 667 0.89 (0.79–1.01) 1.08 (0.94–1.24)
Ethno racial self-classification (reference: white) 526
Black 189 1.54 (1.25–1.89) 1.49 (1.25–1.78)
Brown 772 1.24 (1.04–1.48) 1.20 (1.03–1.41)
Yellow / Indigenous 77 1.84 (1.41–2.40) 1.57 (1.16–2.14)
Educational attainment (reference: < 4 years) 523
4–7 years 504 1.24 (1.10–1.40) 1.17 (1.03–1.32)
8+ years 579 1.25 (1.06–1.47) 1.24 (1.05–1.46)
Household wealth (reference: 3 lowest quartile) 1302
Highest household wealth (top quartile) 304 0.86 (0.73–1.02) 0.87 (0.74–1.03)
Health status (reference: few health problems)4 338
Some health problems 540 1.66 (1.40–1.97) 1.65 (1.39–1.96)
Many health problems 739 2.46 (2.09–2.89) 2.40 (2.02–2.85)
Neighborhood social environment (reference: low social trust) 495
Medium social trust 479 0.75 (0.65–0.86) 0.77 (0.66–0.89)
High social trust 629 0.49 (0.42–0.56) 0.54 (0.47–0.62)
PR: prevalence ratio; 95% CI: 95% confidence interval. 1Number of participants who reported perceived discrimination. 2Univariate analyses; 3Multivariate analyses.4Composite measure obtained through principal components analysis, from the following variables: self-rated health, number of the last 30 days spent in poormental and/or physical health, and history of medical diagnosis from a list of 12 prevalent chronic diseases/conditions. Results took into account complex sampledesign and sample weights
Braga et al. BMC Geriatrics (2019) 19:67 Page 5 of 11
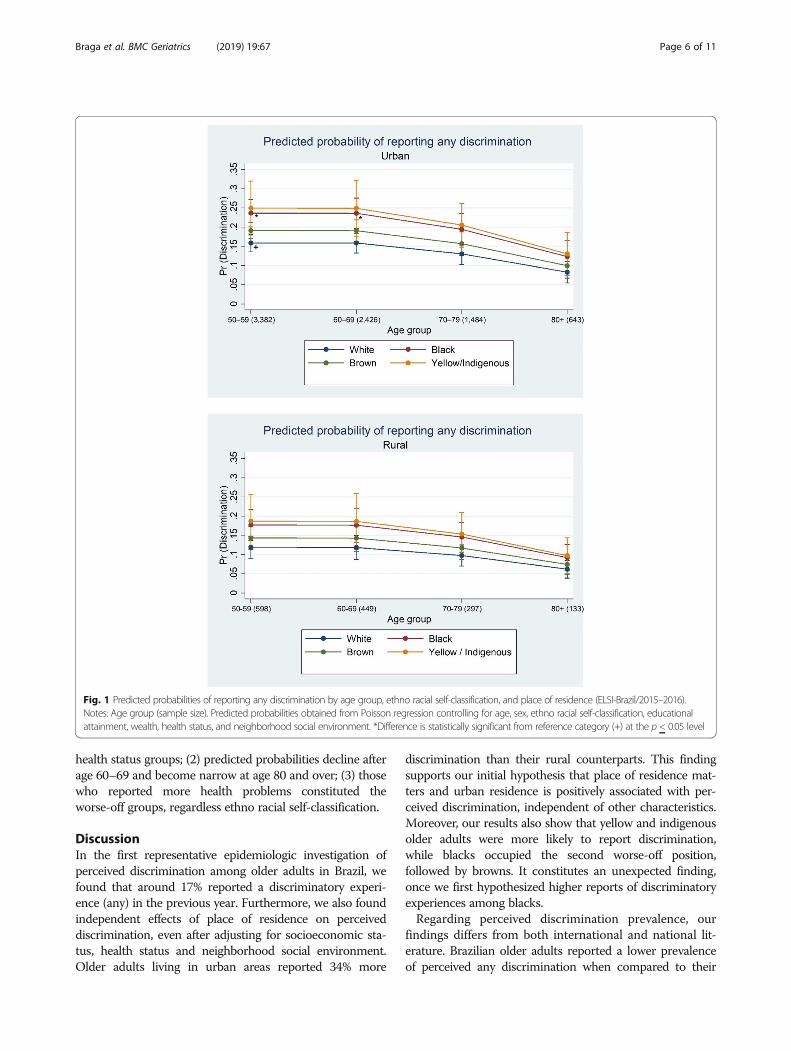
health status groups; (2) predicted probabilities decline afterage 60–69 and become narrow at age 80 and over; (3) thosewho reported more health problems constituted theworse-off groups, regardless ethno racial self-classification.
DiscussionIn the first representative epidemiologic investigation ofperceived discrimination among older adults in Brazil, wefound that around 17% reported a discriminatory experi-ence (any) in the previous year. Furthermore, we also foundindependent effects of place of residence on perceiveddiscrimination, even after adjusting for socioeconomic sta-tus, health status and neighborhood social environment.Older adults living in urban areas reported 34% more
discrimination than their rural counterparts. This findingsupports our initial hypothesis that place of residence mat-ters and urban residence is positively associated with per-ceived discrimination, independent of other characteristics.Moreover, our results also show that yellow and indigenousolder adults were more likely to report discrimination,while blacks occupied the second worse-off position,followed by browns. It constitutes an unexpected finding,once we first hypothesized higher reports of discriminatoryexperiences among blacks.Regarding perceived discrimination prevalence, our
findings differs from both international and national lit-erature. Brazilian older adults reported a lower prevalenceof perceived any discrimination when compared to their
Fig. 1 Predicted probabilities of reporting any discrimination by age group, ethno racial self-classification, and place of residence (ELSI-Brazil/2015–2016).Notes: Age group (sample size). Predicted probabilities obtained from Poisson regression controlling for age, sex, ethno racial self-classification, educationalattainment, wealth, health status, and neighborhood social environment. *Difference is statistically significant from reference category (+) at the p < 0.05 level
Braga et al. BMC Geriatrics (2019) 19:67 Page 6 of 11

English (39.3%) and Americans counterparts (over 60%)[2, 27]. These differences might be partially attributed tovariability in the way discrimination was measured, alongwith possible cultural differences. Both above-mentionedstudies assessed discrimination more broadly, based onthe frequency with which five everyday discriminatoryevents had happened. Even though these scales are quitecomparable to ELSI’s scale, once they measure if individ-uals were treated disrespectfully or received poorer qualityservices in day-to-day life situations, they keep slight dif-ferences. In addition, some authors argue that the persist-ent inequality in Brazil (Gini coefficient = 0.51 in 2015)
might contribute to some individuals interpret discrimin-atory experiences as normal situations and do not reportthem [3, 28]. Social inequalities in Brazil are still remark-able and higher than United States (Gini coefficient = 0.41in 2016) and England (Gini coefficient = 0,33 in 2015)[28]. Considering national data, our results showed an 8%higher prevalence of perceived discrimination [11]. How-ever, this previous study also included young and middleadults, all from a specific metropolitan region in Brazil,which might contribute to justify the differences found.Regarding the place of residence, rural dwellers were
less likely to acknowledge discrimination. It is possible
Fig. 2 Predicted probabilities of reporting any discrimination by health status, ethno racial self-classification, and place of residence (ELSI-Brazil/2015–2016). Notes: Yellow/Ind.: yellow/indigenous. Skin color (sample size). Predicted probabilities obtained from Poisson regression controllingfor age, sex, ethno racial self-classification, educational attainment, wealth, health status, and neighborhood social environment. *Difference isstatistically significant from reference category (+) at the p < 0.05 level
Braga et al. BMC Geriatrics (2019) 19:67 Page 7 of 11

that older adults living in rural areas encounter less dis-criminatory experiences than their counterparts who livein cities. In this case, rural dwellers would report lowerlevels of perceived discrimination and urban living mightbe understood as an exposure factor to discriminatoryexperiences. The core aspects and cultural values thatdefine the rural ways of life in Brazil might contribute tothese findings. Characteristics such as smaller populationsand low demographic density, marked by less degree ofsocial differentiation, stratification and complexity, wherecloser and solidarity relationships among neighbors pre-vail [16], might favor low levels of discrimination occur-rence. An alternative explanation for the higher levels ofdiscrimination found in urban areas is that urban olderadults are more aware of discrimination and thereforemore readily to report it, or are more likely to label an ex-perience as due to discrimination. Thus, the place of resi-dence affects the tendency to perceive and/or reportdiscriminatory treatment. An additional aspect of interest-ing regarding urban-rural differences is that no differenceson health status were found. Even though urban-living indisadvantaged areas have similar if not worse health out-comes than rural areas, [18, 21] rural living in Brazil isoften related to important restrictions on access to goods,services and opportunities [16, 29]. Further studies are ne-cessary to better investigate this finding among older Bra-zilian. Additionally, considering the nested nature of ourdata, multilevel analysis might help us to improve our un-derstanding on how the place of residence contributes toperceived discrimination.Adjustment for socioeconomic status, health status
and neighborhood social environment in the currentstudy slightly reduced the relation of place of residenceto perceived discrimination, suggesting that a part of thisrelation may be mediated by these factors. On age, as itincreased, participants reported lower levels of discrim-ination and a significant negative association was ob-served for older old. Our findings are consistent withother studies [6, 11] and might be explained by selectivesurvival. Also, it is important to consider an effect ofaging, such that experiences and/or perceptions of dis-crimination may change across life course, suggesting theimportance of considering the specific cohort and periodcontext in which discrimination was measured [6, 13].Regarding racial disparities, our study demonstrated
that reports of discriminatory experiences were respect-ively 57, 49 and 20% higher among yellow/indigenous,blacks and browns, in comparison to whites. As yellowsand indigenous constitute a minority group, also in nu-meric terms, researchers usually exclude these individ-uals from analysis due to the small sample size. To ourknowledge, it was the first time a representative studyinvestigated discrimination among yellow and indigen-ous older adults in Brazil. The higher levels of perceived
discrimination we found among indigenous and blacks areconsistent with the marks that slavery left in Brazil, re-garding the social position of these individuals throughoutsuccessive generations. Aspects such as greater exposureto early mortality along with social disorganization andmigration to cities, living in poor conditions, certainlyhave contributed to perpetuate the socioeconomic mar-ginality of these groups [30]. Lifetime socioeconomic dif-ferences across successive generations have beenidentified as the main cause of racial inequality in health[4, 30]. It has been suggested that perceived discriminationand its impact on health play a central role in the origin ofthese inequalities [4, 30]. Some authors also argue that ra-cial discrimination in Brazil is mostly notable in “hard do-mains”, such as job market, affective-sexual relationships,and the interactions with the police [3]. Under this per-spective, discrimination in “hard domains” would occur asan expression of dominance and oppression, viewed as astruggle for power and privilege [4]. In other contexts,termed “soft domains”, race would tend to seem irrelevantfor social relations and interpersonal contact. These do-mains include both leisure places and activities, such aspubs, having a talk with the neighbor, samba, carnival, andlocals of spiritual or religious manifestations [3]. It mightexplain our findings of racial disparities on perceived dis-crimination in seeking health care, whereas health caresettings as “hard domains”. However, we found significantracial disparities on perceived discrimination in socialgatherings – understood as a “soft domain”, and no dis-parities in the work place - a “hard domain”. It seemsplausible that the prevalence of perceived discriminationin the work place may decrease and no disparities amongracial groups be observed, as individuals get older andleave the job market. From now, it is necessary to investi-gate the relationship between racial disparities and specificdomains of perceived discrimination among older adultsalong with how disparities affect health outcomes. A dee-per understanding on these topics did not constitute ourobjectives in this study.According to our results, the more educated partici-
pants perceived more discrimination. Those with highereducational attainment may be more aware of discrimin-atory treatment or more likely to identify it as such, ormay engage in activities and move through social envi-ronments with a more diverse set of individuals, placingthem at greater exposure (out of place) [13]. Unexpect-edly, no association was observed with household wealth,which might potentially protect individuals from exposureto situations that give rise to discrimination and provide agreater sense of control or security [31]. Some authorsidentified level of education and wealth as the most sig-nificant correlates of perceived discrimination, regardlessof the discriminatory situation itself [10]. Considering re-ports of everyday discrimination among older adults,
Braga et al. BMC Geriatrics (2019) 19:67 Page 8 of 11

findings are quite heterogeneous concerning educationallevel. Some studies showed that the participants who re-ported having experienced discrimination were morelikely to be more educated [10, 31] and less wealthy [10,27, 31]. However, there are no significant differences re-garding educational attainment for other samples [27, 31].Additionally, a Brazilian regional study including young,middle and older adults, showed no association betweenperceived any discrimination and both educational attain-ment and household wealth [11]. In agreement with thisprevious study, we also observed that participants in poorhealth status and low social trust have consistently higherprevalence of reporting discrimination. Although we can-not establish causal relationships linking discriminationand poorer health status, there is considerable evidenceon this association [4, 5]. There is also consistent evidencethat social support may moderate the effects of discrimin-ation on health. However, our study design does not allowus to investigate if people have low trust due to experi-ences of discrimination or, whether people who have lesstrust are more likely to interpret some actions as discrimin-atory or to report experiences of discrimination more often.Regarding the longitudinal perspective of ELSI-Brazil, wewill be able to explore the complex relationships betweendiscrimination, poor health and low social trust amongolder adults in a near future.It is also noteworthy that about one in ten participants
reported perceived discrimination in seeking health care.This finding is quite consistent with both internationaland national literature [10, 12, 31]. Discrimination maybe evident in how clinical staff communicate with olderpatients and in the quality of care they provide. It canaffect physicians’ behaviors and their decision-making,contributing to disparities in health care. For patientswith major chronic conditions, such as older adults, dis-criminatory experiences may reduce engagement withthe medical care system, affecting health promotion anddisease management [32]. Whereas that most Brazilianolder adults depends exclusively of the national healthsystem, the Sistema Único de Saúde or SUS, our findingshows a very concerning trending of the healthcare inthe country. The SUS provides comprehensive and uni-versal care through decentralized management andprovision of health services that are free of charge atthe point of delivery [14]. Universality, comprehensive-ness and equity constitute the cornerstones of the sys-tem, which includes that all citizens must be treatedrespectfully and appropriately by health care profes-sionals, regardless any personal attribute. Future re-search may provide better understanding on perceiveddiscrimination in healthcare settings among Brazilianolder adults.Our study is not without limitations. First, the true
magnitude of rural Brazil has been discussed [16, 17].
The current methodology employed by IBGE establishesby means of municipal laws the limits of urban areasand classifies as rural those areas located outside theseboundaries. If characteristics such as size, density, diversityand complexity define urban areas [18], it is noteworthy thatmany Brazilian municipalities currently classified as urbando not present these core aspects [16, 17]. A newurban-rural classification, aligned to international commu-nity, has been proposed by IBGE and will be incorporatedto the 2020 Population Census. Based on three criteria -population size, demographic density, and localization in re-lation to the main urban centers - this new typology found76% of the Brazilian population as predominantly urban,which corresponds to 26% of the total municipalities [17].Regardless this potential limitation, our study took into ac-count the official classification employed in the country. Sec-ond, our research used a generic measure of discrimination.Unfortunately, our data did not allow participants to attri-bute discrimination to one or more possible causes, such asgender, race, age, weight, physical disability, or other. Despiteattribute’s relevance, many studies indicate that the experi-ence of unfairness or mistreatment may be more importantfor health than what the mistreatment is attribute to [6].Moreover, some authors argue that focuses on a single attri-bution for discriminatory experiences may ignore that indi-viduals often occupy more than one socially disadvantagedstatus and these status may interact to shape their experi-ences, which is termed intersectionality. We do believe thatour multivariate analysis partially offset this limitation, as wecontrolled for characteristics typically related to discrimin-ation, such as age, gender, and SES. Third, this study may besubjected to bias, once place of residence might play a roleon either minimization or vigilance bias. Minimization biasoccurs when individuals perceive less discrimination thanactually exists. Subtle ways of discrimination related to am-biguous situations could lead to minimization bias. It alsomight occur when individuals who belong to disadvantagedgroups internalize unfair treatment as a natural or normalphenomenon [3, 6]. In our analysis, rural older adults mightbe subjects to this type of bias. On the other hand, theirurban counterparts might perceive more discriminationthan actually exists, which is known as vigilance bias.Fourth, our study captured the perspective of individualswho reported discrimination. Another way to investigate itcould consider the perspective of the stigmatizing individ-uals, which is termed actual discrimination (e.g. attitudesfrom health professionals towards groups with specific per-sonal attributes). Together, both perspectives would showwhether and to what extent perceived and actual discrimin-ation effectively corresponds. Since we measured perceiveddiscrimination, we cannot draw conclusions about levels ofactual discrimination.Our study also has important strengths. Using a national
source of high quality information on individual aged 50
Braga et al. BMC Geriatrics (2019) 19:67 Page 9 of 11

years or more, to our knowledge we carried out the first na-tional study on perceived discrimination among older adults.Besides, it included participants commonly excluded fromanalyses: yellows, indigenous and rural dwellers. Due to thedesign of ELSI-Brazil, we will be able to provide longitudinalinformation on reports of discrimination in a near future.
ConclusionsIn brief, our study explored the prevalence and correlatesof perceived discrimination among a representative sampleof Brazilian older adults. Our main findings show that: (1)the urban environment plays a core role in perceived dis-crimination; (2) yellows and indigenous are more likely toreport discriminatory experiences, followed by blacks; (3)health care settings constitute the most common domainwhere discriminatory experiences occurred. Our findingsmay contribute to fulfill the knowledge gap on discrimin-ation among older adults living in developing countries.
Additional file
Additional file 1: Principal component analysis (PCA) on health status. Acomposite measure of the health status was obtained, based on PCA.The selected variables included self-rated health, number of the last 30days spent in poor mental and/or physical health, and history of medicaldiagnosis from a list of 12 prevalent chronic diseases/conditions, such ashypertension, diabetes, depression and arthritis. The resulting health statusscore was divided into tertiles, representing individual with few health prob-lems, some health problems and many health problems. (PDF 163 kb)
AbbreviationsCI: Confidence Interval; ELSA: English Longitudinal Study of Ageing;ELSI: Brazilian Longitudinal Study of Aging (Estudo Longitudinal da Saúde dosIdosos Brasileiros); FIOCRUZ: Oswaldo Cruz Foundation (Fundação Oswaldo Cruz);HRS: Health and Retirement Study; IBGE: Brazilian Institute of Geography andStatistics (Instituto Brasileiro de Geografia e Estatística); PCA: PrincipalComponents Analysis; PR: Prevalence Ratios; SES: Socioeconomic status;SUS: Unified Health System (Sistema Único de Saúde)
AcknowledgementsThe authors thank the study participants.
FundingELSI-Brazil baseline study was supported by the Brazilian Ministry ofHealth(DECIT/SCTIE - Department of Science and Technology from theSecretariat ofScience, Technology and Strategic Inputs and COSAPI/DAPES/SAS – HealthcareCoordination of Elderly, Department of Strategic andProgrammatic Actions from theSecretariat of Health Care) and the BrazilianMinistry of Science, Technology,Innovation and Communication. Grants no.404965/2012–1, 20836, 22566 and 23700. Professors W. T. Caiaffa and M. F.Lima-Costa are fellows of the National Research Council (CNPq).
Availability of data and materialsThe dataset generated and analyzed during the current study is publiclyavailable in the ELSI-Brazil repository, elsi.cpqrr.fiocruz.br
Authors’ contributionsLSB conceived the study, carried out the analyses and led the writing. WTCconceived and supervised the study, reviewed the manuscript. APRC carriedout the analyses. FBA conceived and supervised the study, reviewed themanuscript. MFLC conceived and supervised the study, reviewed themanuscript. All authors read and approved the final manuscript.
Ethics approval and consent to participateELSI-Brazil was approved by the Ethics Board of Oswaldo Cruz Foundation(FIOCRUZ), Minas Gerais (CAAE: 34649814.3.0000.5091). All participants signedinformed consent forms in advance of their participation in the study.
Consent for publicationNot applicable.
Competing interestsThe authors declare that they have no competing interests.
Publisher’s NoteSpringer Nature remains neutral with regard to jurisdictional claims inpublished maps and institutional affiliations.
Author details1Observatório de Saúde Urbana de Belo Horizonte, Faculdade de Medicina,Universidade Federal de Minas Gerais, Avenida Professor Alfredo Balena, n°190, Belo Horizonte, Minas Gerais 30130-100, Brazil. 2Instituto René Rachou,Fundação Oswaldo Cruz, Avenida Augusto de Lima, n°1715, Belo Horizonte30190-002, Brazil.
Received: 20 August 2018 Accepted: 18 February 2019
References1. Kessler RC, Mickelson KD, Williams DR. The prevalence, distribution, and
mental health correlates of perceived discrimination in the United States. JHealth Soc Behav. 1999;40:208–30. https://doi.org/10.2307/2676349.
2. Ayalon L, Gum AM. The relationships between major lifetime discrimination,everyday discrimination, and mental health in three racial and ethnicgroups of older adults. Aging Ment Health. 2011; 15: 587–594. doi: https://doi.org/10.1080/13607863.2010.543664.
3. Bastos JL, Faerstein E. Discriminação e saúde: perspectivas e métodos. Riode Janeiro, RJ: Editora FIOCRUZ; 2012.
4. Krieger N. Discrimination and health inequities. In: Berkman F, Kawachi I,Glymour MM. Social epidemiology. 2nd ed. New York, NY: Oxford UniversityPress; 2014.
5. Pascoe EA, Richman LS. Perceived discrimination and health: a meta-analyticreview. Psychol Bull. 2009;135:531–54. https://doi.org/10.1037/a0016059.
6. Lewis TT, Cogburn CD, Williams DR. Self-reported experiences ofdiscrimination and health: scientific advances, ongoing controversies, andemerging issues. Annu Rev Clin Psycho. 2015;11:407–40. https://doi.org/10.1146/annurev-clinpsy-032814-112728.
7. Levy BR, Slade MD, Murphy TE, Gill TM. Association between positive agestereotypes and recovery from disability in older persons. JAMA. 2012;308:1972–6. https://doi.org/10.1001/jama.2012.14541.
8. Levy BR, Zonderman AB, Slade MD, Ferrucci L. Memory shaped by agestereotypes over time. J Gerontol B Psychol Sci Soc Sci. 2012;67:432–6.https://doi.org/10.1093/geronb/gbr120.
9. Sutin AR, Stephan Y, Carretta H, Terracciano A. Perceived discrimination andphysical, cognitive, and emotional health in older adulthood. Am J GeriatrPsychiatry. 2015;23:171–9. https://doi.org/10.1016/j.jagp.2014.03.007.
10. Rippon I, Kneale D, de Oliveira C, Demakakos P, Steptoe A. Perceived agediscrimination in older adults. Age Ageing. 2014;43:379–86. https://doi.org/10.1093/ageing/aft146.
11. Macinko J, Mullachery P, Proietti FA, Lima-Costa MF. Who experiencesdiscrimination in Brazil? Evidence from a large metropolitan region. Int JEquity Health. 2012;11:80. https://doi.org/10.1186/1475-9276-11-80.
12. Boccolini CS, Boccolini PMM, Damacena GN, Ferreira APS, Szwarcwald CL.Factors associated with perceived discrimination in health services of Brazil:Results of the Brazilian National Health Survey, 2013 Cien Saude Colet 2016;21(2): 371–378. doi: https://doi.org/10.1590/1413-81232015212.19412015.
13. Burgard S, Castiglione DP, Lin KY, et al. Differential reporting ofdiscriminatory experiences in Brazil and the United States. Cad. SaúdePública. 2017;33(Sup 1):e00110516. https://doi.org/10.1590/0102-311X00110516.
14. Paim J, Travassos C, Almeida C, Bahia L, Macinko J. The Brazilian healthsystem: history, advances and challenges. Lancet. 2011;377(9779):1778–97.https://doi.org/10.1016/S0140-6736(11)60054-8.
Braga et al. BMC Geriatrics (2019) 19:67 Page 10 of 11

15. Instituto Brasileiro de Geografia e Estatística (IBGE). Sistema IBGE deRecuperação Automática (SIDRA) / Censo Demográfico 2010. https://sidra.ibge.gov.br/tabela/2093. Acessed 8 Jan. 2018.
16. Wanderley MNB, Favareto A. A singularidade do rural brasileiro: implicacoespara as tipologias territoriais e a elaboracao de politicas publicas. In:Miranda C, Silva H (org). Concepcoes da ruralidade contemporanea: assingularidades brasileiras. Brasilia: Instituto Interamericano de Cooperacaopara a Agricultura (IICA); 2013.
17. Instituto Brasileiro de Geografia e Estatística (IBGE). Classificação ecaracterização dos espaços rurais e urbanos no Brasil: uma primeiraaproximação. Rio de Janeiro. In: RJ: IBGE; 2017.
18. Vlahov D. A pivotal moment for urban health. Cad.Saúde Pública. 2015; 31Sup: S7-S8. doi: https://doi.org/10.1590/0102-311XPE01S115
19. Caiaffa WT, Ferreira FR, Ferreira AD, Oliveira CL, Camargos VP, Proietti FA.Urban health: "the city is a strange lady, smiling today, devouring youtomorrow". Ciênc Saúde Coletiva. 2008;13(6):1785–96. https://doi.org/10.1590/S1413-81232008000600013.
20. Diez Roux AV. Health in cities: is a systems approach needed? CadSaúdePública 2015; 31 Sup: S9-S23. doi: https://doi.org/10.1590/0102-311XDE01S115
21. Ezeh A, Oyebode O, Satterthwaite D, et al. The history, geography, andsociology of slums and the health problems of people who live in slums.Lancet. 2017;389(10068):547–58. https://doi.org/10.1016/S0140-6736(16)31650-6.
22. Lima-Costa MF, Andrade FB, Souza PRB Jr, et al. The Brazilian longitudinalstudy of aging (ELSI-Brasil): objectives and design. Am J Epidemiol. 2018;Jan 31. https://doi.org/10.1093/aje/kwx387.
23. Instituto Brasileiro de Geografia e Estatística (IBGE). Desenho conceitual. In: __Metodologia do Censo Demográfico 2010. 2ª ed. Rio de Janeiro, RJ: IBGE; 2016:277–351.
24. Ismail K. Unravelling factor analysis. Evid Based Ment Health. 2008;11(4):99–102. https://doi.org/10.1136/ebmh.11.4.99.
25. Robbins AS, Chao SY, Fonseca VP. What’s the relative risk? A method todirectly estimate risk ratios in cohort studies of common outcomes. AnnEpidemiol. 2002;12(7):452–4. https://doi.org/10.1016/S1047-2797(01)00278-2.
26. StataCorp: Stata user’s guide. Release 12. College Station, TX: Statacorporation; 2011.
27. Shankar A, Hinds P. Perceived discrimination: associations with physical andcognitive function in older adults. Health Psychol. 2017;36(12):1126–34.https://doi.org/10.1037/hea000052.
28. World Bank. Data Bank: Poverty and Equity database. Gini index (World BankEstimate). Available at: https://data.worldbank.org/country/brazil. Accessed 8Jan 2018.
29. Travassos C, Viacava F. Access to and use of health services by rural elderly,Brazil, 1998 and 2003. Cad.Saúde Pública. 2007;23(10):2490–502. https://doi.org/10.1590/S0102-311X2007001000023.
30. Chor D, Lima CRA. Epidemiologic aspects of racial inequalities in health inBrazil. Cad Saúde Pública. 2005;21(5):1586–94. https://doi.org/10.1590/S0102-311X2005000500033.
31. Rippon I, Zaninotto P, Steptoe A. Greater perceived age discrimination inEngland than the United States: results from HRS and ELSA. J Gerontol BPsychol Sci Soc Sci. 2015;70(6):925–93. https://doi.org/10.1093/geronb/gbv040.
32. Nguyen TT, Vable AM, Glymour MM, Nuru-Jeter A. Trends for reporteddiscrimination in health care in a national sample of older adults withchronic conditions. J Gen Intern Med. 2017;15. https://doi.org/10.1007/s11606-017-4209-5.
Braga et al. BMC Geriatrics (2019) 19:67 Page 11 of 11