perceived effectiveness of e-learning for technology
TRANSCRIPT

Kennesaw State UniversityDigitalCommons@Kennesaw State UniversityMaster of Science in Information TechnologyTheses Department of Information Technology
Summer 7-28-2016
Perceived Effectiveness of E-Learning forTechnology Instruction in Public Library StaffDevelopment Programs: A Survey Based on theTechnology Acceptance ModelJulia HuprichKennesaw State University
Follow this and additional works at: http://digitalcommons.kennesaw.edu/msit_etd
Part of the Computer Sciences Commons
This Thesis is brought to you for free and open access by the Department of Information Technology at DigitalCommons@Kennesaw State University.It has been accepted for inclusion in Master of Science in Information Technology Theses by an authorized administrator ofDigitalCommons@Kennesaw State University. For more information, please contact [email protected].
Recommended CitationHuprich, Julia, "Perceived Effectiveness of E-Learning for Technology Instruction in Public Library Staff Development Programs: ASurvey Based on the Technology Acceptance Model" (2016). Master of Science in Information Technology Theses. Paper 1.

PERCEIVED EFFECTIVENESS OF ELEARNING FOR TECHNOLOGY
INSTRUCTION IN PUBLIC LIBRARY STAFF DEVELOPMENT PROGRAMS:
A SURVEY BASED ON THE TECHNOLOGY ACCEPTANCE MODEL
Submitted by
Julia Huprich
in partial fulfillment of the requirements for the degree of
Master of Science in Information Technology
Department of Information Technology
School of Computing and Software Engineering
Kennesaw State University
Kennesaw, Georgia
COMMITTEE MEMBERS
Rich HalsteadNussloch, Ph.D. (Chair)
Rebecca Rutherfoord, Ed.D.
Guangzhi Zheng, Ph.D.
July 17, 2016
ABSTRACT
The purpose of this research study was to determine the perceived effectiveness of elearning for
staff members in public libraries. In addition, the effects of user demographics including a
user’s age and gender were analyzed to determine if these factors impacted the perceived
effectiveness of elearning as a training delivery model.
Davis’s Technology Acceptance Model (1989) was used to develop a questionnaire related to the
perceived effectiveness and value of elearning, and a survey of public library staff members
across the United States was conducted. Results of the survey showed the impact that previous
elearning experience and the user's age had on the perception of this method of instruction;
younger staff members and those who had previously completed elearning modules were more
likely to consider it to be an effective way to learn new information. The survey results provide
valuable implications for organizations using elearning as a component of a technology
acceptance program and can help inform decisions related to the implementation of elearning
programs. Best practices in the development of technology training programs and opportunities
for additional studies are also discussed.
KEYWORDS
technology adoption, technology acceptance model, training, public libraries, elearning
Page 2 of 99

ACKNOWLEDGEMENTS
The completion of this thesis could not have occurred without the expertise of Dr. Rich
HalsteadNussloch, my thesis advisor. Many thanks to him for his guidance and advice during
this process, and for introducing me to the Technology Acceptance Model early in the MSIT
program. I would also like to thank Drs. Rutherfoord and Zheng for their review and
consideration of my thesis and for dedicating their time to be a part of my thesis committee.
I must also express a huge debt of gratitude to my family, especially to Cheryl and Karen for
their endless support. Many thanks and much love go to Bobby and Jack, who patiently endured
many meals of questionable culinary quality and virtually no nutritional value as I finished this
thesis. I wouldn’t be anywhere without you, and you deserve at least one nice dinner after all of
this is over.
Finally, I have to thank my mentors, Rachel, Helen, and Wendy, for all of their support and
guidance over the years.
Page 3 of 99

TABLE OF CONTENTS
1. INTRODUCTION
1.1 PUBLIC LIBRARIES & TECHNOLOGY
1.2 ELEARNING OVERVIEW, BENEFITS, & CHALLENGES
2. LITERATURE REVIEW
2.1 TECHNOLOGY ACCEPTANCE MODEL
2.2 IMPACT OF TRAINING ON TAM
2.3 BARRIERS TO ELEARNING EFFECTIVENESS
2.4 EXTENSION OF PREVIOUSLY CONDUCTED STUDIES
3. METHODS OF RESEARCH DESIGN AND DEVELOPMENT
3.1 OVERVIEW & HYPOTHESES
3.1.1 Perceived effectiveness of elearning (PE) & completion of an elearning
module (EL)
3.1.2 Perceived usefulness of technology (PU), perceived ease of use of
technology (PEU), and usage behavior (UB)
3.1.3 Demographics of study participants and impact on PE
3.2 RESEARCH MEASURES
3.3 DATA COLLECTION
4. RESULTS AND DISCUSSION
4.1 SURVEY RESULTS
4.1.1 H1: Impact of elearning experience on perceived effectiveness
Page 4 of 99
4.1.2 H2: Impact of elearning experience on perceived usefulness of
technology
4.1.3 H3: Impact of elearning experience on perceived ease of use
4.1.4 H4: Impact of gender on perceived effectiveness of elearning
4.1.5 H5: Impact of age on perceived effectiveness of elearning
4.1.6 Results Summary
4.2 PRACTICAL IMPLICATIONS AND RECOMMENDED BEST PRACTICES
4.3 OPPORTUNITIES FOR FUTURE STUDIES
5. CONCLUSION
APPENDIX A. ONLINE SURVEY INVITATION EMAILS
APPENDIX B. SURVEY INVITATION EMAIL AND DESTINATIONS
APPENDIX C. INFORMED CONSENT AGREEMENT
APPENDIX D. PARTICIPANT ONLINE SURVEY QUESTIONS
APPENDIX E. CORRELATION COEFFICIENTS FOR FUTURE STUDIES
REFERENCES
Page 5 of 99

FIGURES
Figure 1. Technology acceptance model (TAM) Figure 2. New research model Figure 3. Public library experience Figure 4. Completion of elearning and impact on theory constructs Figure 5. Relative Frequency Histogram: EL and Q5 Figure 6. Relative Frequency Histogram: EL and Q6 Figure 7. Relative Frequency Histogram: EL and Q7 Figure 8. Relative Frequency Histogram: EL and Q8 Figure 9. Relative Frequency Histogram: EL and Q9 Figure 10. Relative Frequency Histogram: EL and Q10 Figure 11. Relative Frequency Histogram: EL and Q11 Figure 12. Relative Frequency Histogram: EL and Q12 Figure 13. Relative Frequency Histogram: gender and Q5 Figure 14. Relative Frequency Histogram: gender and Q6 Figure 15. Relative Frequency Histogram: gender and Q7 Figure 16. Relative Frequency Histogram: gender and Q8 Figure 17. Relative Frequency Histogram: age and Q5 Figure 18. Relative Frequency Histogram: age and Q6 Figure 19. Relative Frequency Histogram: age and Q7 Figure 20. Relative Frequency Histogram: age and Q8 Figure 21. Age and average PE
Page 6 of 99
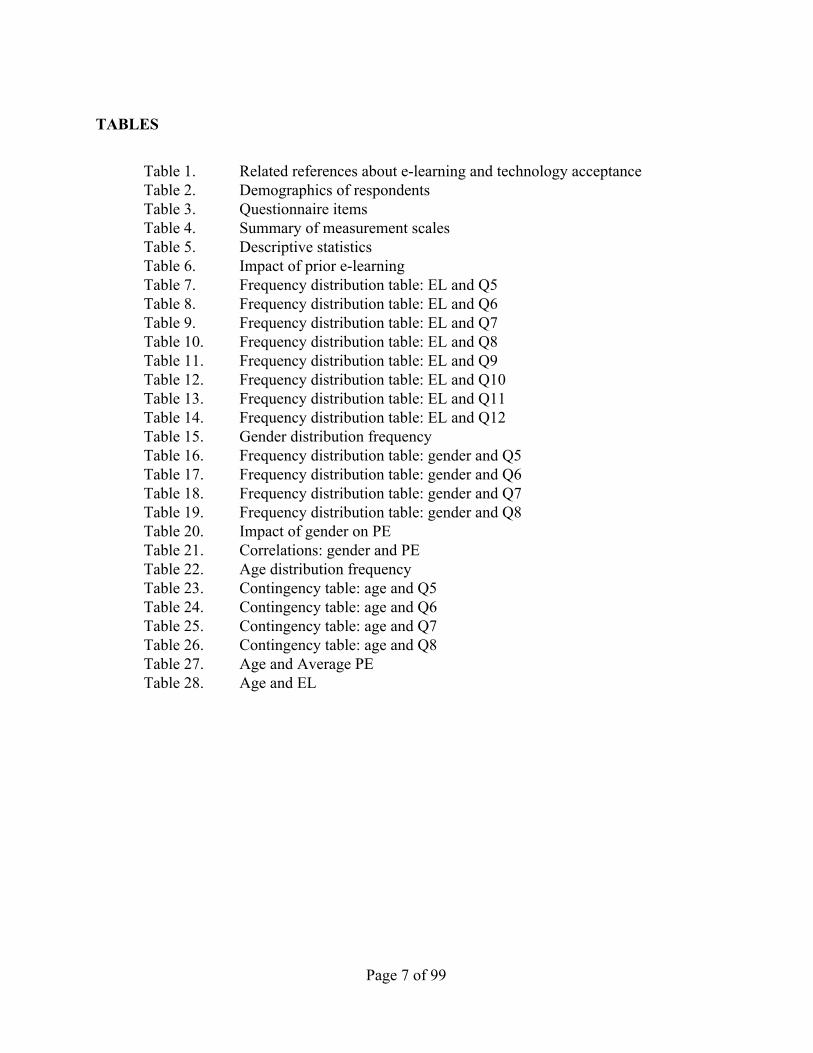
TABLES
Table 1. Related references about elearning and technology acceptance Table 2. Demographics of respondents Table 3. Questionnaire items Table 4. Summary of measurement scales Table 5. Descriptive statistics Table 6. Impact of prior elearning Table 7. Frequency distribution table: EL and Q5 Table 8. Frequency distribution table: EL and Q6 Table 9. Frequency distribution table: EL and Q7 Table 10. Frequency distribution table: EL and Q8 Table 11. Frequency distribution table: EL and Q9 Table 12. Frequency distribution table: EL and Q10 Table 13. Frequency distribution table: EL and Q11 Table 14. Frequency distribution table: EL and Q12 Table 15. Gender distribution frequency Table 16. Frequency distribution table: gender and Q5 Table 17. Frequency distribution table: gender and Q6 Table 18. Frequency distribution table: gender and Q7 Table 19. Frequency distribution table: gender and Q8 Table 20. Impact of gender on PE Table 21. Correlations: gender and PE Table 22. Age distribution frequency Table 23. Contingency table: age and Q5 Table 24. Contingency table: age and Q6 Table 25. Contingency table: age and Q7 Table 26. Contingency table: age and Q8 Table 27. Age and Average PE Table 28. Age and EL
Page 7 of 99
1. INTRODUCTION
Technology adoption presents a problem for any organization; resistance to change is a
permanent fixture in many organizations and is a threat to any company’s productivity and staff
morale (Dent, 1999; Weick & Quinn, 1999; Jones, 2010; Keen, 1981). Public libraries, generally
accepted as knowledge repositories and supporters of lifelong learning, are not immune to this
resistance to change (Palmour, 1980; Spacey, Goulding, & Murray, 2013; Fernandez & Rainey,
2006). However, librarians, information technology professionals, training managers, and other
leaders can positively change the way that all library staff members approach technology
adoption and acceptance with careful consideration of the impact of training; studies demonstrate
that training has a directly beneficial effect on the rate of both organizational change (Hayes,
2014; Stanleigh, 2008; Watkins & Marsick, 2003; Bellou & Chatzinikou, 2015) and technology
adoption (Boothby, Dufour, & Tang, 2010; Hickman & Rogers, 2007; Straub, 2009).
The purpose of this study is to determine if elearning is perceived to be an effective instructional
delivery method that positively impacts technology acceptance in public library staff. Elearning
has many advantages for both the organization and the learner: trainings are considerably
cheaper to deliver online, rather than facetoface; learners are able to control their learning
experience and pace, leading to higher satisfaction in the experience; and elearning can help
organizations generate a more positive learning culture and increase overall employee
performance (Caudill, 2015). With the constant influx of technological change for librarians and
library staff, it is important for library administrators to understand the most effective ways to
implement this change in their organization. Using the Technology Acceptance Model developed
Page 8 of 99

in 1989 by researcher Fred Davis, this study will examine several factors that may lead to an
increased rate of adoption in library staff and provide recommendations for training programs
and methods for public libraries.
1.1 PUBLIC LIBRARIES & TECHNOLOGY
Public libraries in the United States have undergone a tremendous shift in service models as a
result of the digital revolution (Casey & Savastinuk, 2006; Varnum, 2014; Knox, 2011; Koerber,
2015; Bertot, Jaeger, & McClure, 2011). Gone are the days of the “traditional” public library
with card catalogs and dusty shelves; now, public libraries are community hubs offering a
multitude of services for the public, including computer training, 3D printing, and internet
access (Hoffman, Bertot, & Davis, 2012). Studies conducted by the American Library
Association and the Pew Research Center, among others, demonstrate not only the shift in
services provided in public libraries, but also the changing values of the American population in
regards to public libraries (“Libraries Connect Communities,” 2007 & 2012; Zickuhr, Rainie, &
Purcell, 2013). Communities expect their libraries to be places of knowledge and learning, and in
order to meet that expectation, library staff must continually update their understanding of
technology.
However, this change has not been without conflict among public library professionals. Conley
(2010) identifies that librarians are not as accepting of technology as other professionals may be
due to a factor called “subject culture.” Because traditional librarians have relied on books for
Page 9 of 99

knowledge for hundreds of years, the concept of transitioning knowledge and discovery of
knowledge to computers can be a barrier to technology acceptance.
With the expansion of the public library’s role comes additional duties, responsibilities, and job
requirements for public library staff. Meeting these needs requires a continued dedication to
professional development for all staff in these organizations. However, training costs, staffing
shortages, and an increasing number of “technologies librarians need to know” place a number of
restrictions on staff who are already being asked to do more with less (Blowers, H. & Reed, L.,
2006; Putnam, L., 2016; Harhai, M. & Kreuger, J., 2016; Koh, K. & Abbas, J., 2015; Knox, K.
C., 2011; Koerber, J., 2015). These conflicting needs lead libraries to consider alternative
training methods namely, elearning, due to its benefits.
1.2 ELEARNING OVERVIEW, BENEFITS, & CHALLENGES
Research has shown that technology and learning are becoming more and more intertwined.
Recent studies conducted by the Pew Research Center show an increase in the amount of
workplace elearning that is being conducted and an increasing reliance on elearning for
professional development and employee training (Horrigan, 2016). Elearning, which is also
referred to as computerbased training (CBT) and webbased training (WBT), is a general term
referring to any kind of training delivered through some kind of modern, webenabled device,
such as a computer or mobile phone; for the purpose of this study, we are using the following
definition:
Page 10 of 99

Elearning is generally defined as a learning opportunity delivered via technology;
examples include selfpaced online training, training videos on YouTube, and webinars.
Facetoface training would not be considered elearning.
Elearning has long been touted as being the “next big thing” in training, and early research
estimated that this type of instructional method would account for as much as 50% of all
workplace learning by 2003 (Carliner & Shank, 2008). Elearning, on the surface, was an easy
fix for many training woes: online instructional modules would be accessible anytime, anywhere,
and would be relatively inexpensive to implement, as it required no travel time or facetoface
instructors.
However, elearning has not had a 100% adoption rate across all sectors. A multitude of studies
have researched the impact that demographics such as age and gender have had on the adoption
of elearning (Park, Son & Kim, 2011; Ahmad & Tarmudi, 2011; Lee, Hsieh, & Chen, 2011);
studies have also indicated that organizational support, computer selfefficacy, and prior
experiences affect attitudes towards elearning (Lee, Hsieh, & Chen, 2011).
CONFLICT: PERSONAL VS. PROFESSIONAL LEARNING
Recent studies show that in regards to personal learning, adults mainly rely on reading
information rather than taking an online course; 85% of adults learn through reading, versus 15%
through an online course (Horrigan, 2016). 63% of employed Americans took a course for
professional learning; 75% of this training was conducted at the workplace, and 55% of the
Page 11 of 99

training was conducted online. This conflict of training delivery methods between chosen
educational opportunities and mandatory ones is telling; if adults prefer learning by reading, then
perhaps elearning is not an effective way to conduct training in the workplace. In addition,
professional learners with higher levels of education or income are more likely to take advantage
of online learning, and technology, and adults’ access to technology, income, and education level
influences their likelihood to engage in elearning for personal reasons (Horrigan, 2016).
Students’ lack of familiarity with technology and their personal learning preferences can be
important factors in the usage of technology to create valuable learning opportunities.
ELEARNING IN PUBLIC LIBRARIES
In recent studies conducted by the Chief Officers of State Library Agencies (COSLA), the
majority of public library staff have access to elearning, either through their state library
administrative agency, through a federallyfunded program like WebJunction, or through
organizations like the American Library Association (COSLA, 2014, 2015). Those numbers have
risen in recent years; in 2014, 10 state library agencies offered no exclusivelyonline training:
Connecticut, Hawaii, Louisiana, Mississippi, New Hampshire, New Jersey, New Mexico,
Oklahoma, Rhode Island, and West Virginia (COSLA, 2014). In the 2015 survey, only
Kentucky, Louisiana, Oklahoma, Rhode Island, South Dakota, Virginia, and Wisconsin did not
offer online training, down 30% from the previous year (COSLA, 2015).
Even with access to online training (theoretically available anytime, anywhere), staff in public
libraries still face an insurmountable barrier: lack of time for training. In a 2016 survey, 90% of
Page 12 of 99

public library staff members reported that they were either interested or very interested in
regularly participating in training opportunities; 63% reported that they were unable to, due to an
inability to complete training during the workday (Huprich, in press). Time presents the biggest
barrier for most learners; a secondary barrier is the cost associated with training. Elearning
could, in theory, address both of these concerns.
In addition, because of the demonstrated barriers to training for public library staff and the
increased emphasis on technology in public libraries across the country, the opportunity exists
for elearning to provide an ideal educational solution for staff. Prior to doing this, however, we
will attempt to understand two things with this study: the role that elearning plays on technology
acceptance, and which factors positively affect the perception that elearning is an effective
instructional method.
2. LITERATURE REVIEW
Literature from several fields was analyzed to further understand the impact of elearning on
technology acceptance. The technology acceptance model, first developed in 1989 by Fred
Davis, is an important tool in understanding the impact of multiple factors on the rate of
acceptance of technologybased tools and resources. Additional studies conducted on the impact
of training on technology adoption, and specifically, those focusing on elearning as a tool to
increase technology acceptance, adoption, and integration are useful in determining how public
libraries can positively impact technology adoption rates using elearning. More recently, studies
Page 13 of 99

have been conducted to determine what impact demographic factors have on the acceptance of
elearning as a valuable professional training tool.
This thesis makes two unique contributions to the literature related to elearning, public libraries,
and technology. First, this study adds to the evergrowing empirical literature on the role of
elearning in staff training programs in libraries by providing an analysis of the impact of
employees’ perception of elearning on its effectiveness. In addition, the research conducted here
allows us to make valuable contributions to the understanding of how elearning can be an
effective method to increasing technology acceptance rates in public library staff. Best practices
and opportunities for future research are also presented.
2.1 TECHNOLOGY ACCEPTANCE MODEL
The purpose of studying the technology acceptance model is to gain insight into how and why
users will often adopt some systems readily while ignoring other valuable systems, when given
the opportunity to use systems voluntarily. One pivotal study, conducted by Fred D. Davis in the
late 1980s, shed light on the way that usefulness – specifically, perceived usefulness – will affect
a user’s acceptance of a specific technology system.
The Technology Acceptance Model, introduced by Davis in 1989, posited that there are two
factors that determine whether people accept or reject new systems: perceived usefulness and
perceived ease of use. He details these findings thusly:
Page 14 of 99
“[P]eople tend to use or not use an application to the extent they believe it will help them
perform better. We refer to this first variable as perceived usefulness. Second, even if
potential users believe that a given application is useful, they may, at the same time,
believe that the systems is too hard to use and that the performance benefits of usage are
outweighed by the effort of using the application. That is, in addition to usefulness, usage
is thought to be influenced by perceived ease of use” (320).
By asking users a series of questions through facetoface interviews and surveys, Davis
determined that there were several factors that affected the two variables: perceived usefulness
was affected by job effectiveness, productivity and time savings, and importance to the position;
perceived ease of use levels were affected by perceived physical effort and mental effort, and
perceived ease of learning the new system.
Davis’s research included an analysis of the subjects’ actual usage of a system; in his 1989 study,
he focused on the usage of an email system. His research discovered a direct correlation
between the perceived usefulness (PU) of the email system and its actual usage, as well as
between the perceived ease of use (PEU) and its usage. However, the correlation was higher with
perceived usefulness of the system and its usage. In effect, users who believed that the email
system was useful were actually using the system more than those who thought it was easier to
use.
Page 15 of 99

Figure 1. Technology acceptance model (TAM). Source: Davis (1989).
Davis has the following to say about his discovery:
“In hindsight, the prominence of perceived usefulness makes sense conceptually: users
are often driven to adopt an application primarily because of the functions it performs for
them, and secondarily for how easy or hard it is to get the system to perform those
functions. […] Although difficulty of use can discourage adoption of an otherwise useful
system, no amount of ease of use can compensate for a system that does not perform a
useful function” (333334).
Jiao and Zhao (2014) posit that the method of implementation of innovation can dramatically
affect employees’ perception of change; according to their study, if employees are not able to
contribute to the change process, they may perceive it as a negative instead of a positive change
and thus reject the new technology.
Page 16 of 99

While the method of implementation of innovation can affect technology acceptance, this is not
the only factor that can present a barrier to adoption. Studies have shown that demographic,
socioeconomic, experiential, and psychological characteristics can impact technology adoption.
Biological gender has been shown to affect rates of technology adoption; different factors
influence the genders differently. Studies determined that women were more likely to be affected
by the subjective norms and culture of the organization in the context of technology adoption,
whereas men are more affected by perceived usefulness (Venkatesh, Morris & Ackerman, 2001;
Venkatesh & Morris, 2000). Researchers have suggested that the implementation process,
including training and marketing, be customized to appeal more specifically to each gender,
although the implications for having singlegender “tracks” for implementation has yet to be
seen (Venkatesh & Morris, 2000).
Age has also shown to affect the rate of technology adoption and innovation diffusion. Research
conducted in 2000 demonstrated that workers at varying ages had a range of values and
motivations that affected their technology adoption decisions (Morris & Venkatesh); subsequent
studies have had consistent findings: younger employees adopt technology faster and more
efficiently than their older counterparts (Meyer, 2011; Morris, Venkatesh, & Ackerman, 2005).
2.2 IMPACT OF TRAINING ON TAM
Leaders in the field of the study of the Technology Acceptance Model have long maintained that
training is the primary method for organizational leaders to ensure adoption across the
Page 17 of 99

workforce; specifically, Venkatesh and Morris (2000) recommend that training is of the utmost
importance in regards to technology acceptance:
“Training represents the key method for successful knowledge transfer to users,
implementation, and diffusion of new technologies, and is the most popular mechanism
used to smooth the transition to new technology in the workplace” (131).
Davis’s research on the Technology Acceptance Model demonstrates that training has a directly
beneficial effect on the rate of technology acceptance when usefulness has already been
demonstrated. When considering the introduction of a new system, other researchers have also
found a few items to note; Chuttur’s 2009 study, “Overview of the Technology Acceptance
Model: Origins, Developments, and Future Directions,” outlines the findings of a number of
researchers, including Schultz and Slevin, who conducted an exploratory survey in 1975 that was
the basis for future researchers, including Davis. Schultz and Slevin found that “perceived
usefulness provided a reliable prediction for selfpredicted use of a decision model.”
However, demographic characteristics of the learners must be taken into consideration when
determining the effectiveness of training on staff; researchers have suggested that, due to the
difference in the way that men and women perceive technology, training may need to be
customized for men and women (Venkatesh & Morris, 2000):
Page 18 of 99

“[T]hey may wish to emphasize usefulness issues for men, while offering women a more
balanced analysis that includes productivity aspects, process issues, and testimonials
from peers or superiors. These recommendations also have implications for marketing
professionals who may find these findings useful in designing advertising campaigns
designed to appeal to a specific target group within the population. Again, by targeting
outcome expectations vs. process expectations and/or social factors, one may pinpoint
important issues related to technology adoption for men and women, respectively. The
overall pattern of gender differences also presents organizations with important
information in terms of designing organizational and managerial interventions that can
foster acceptance and use of new technologies both in the short and the longterm”
(130).
Research investigating the impact of training on the technology acceptance model and
technology adoption has shown that training can have a positive impact on not only TAM but
also organizational culture and innovation (Caudill, 2015; Sung & Choi, 2011; Black & Lynch,
2001; Boothby et al, 2010).
Changing demands of customers forces organizations to require employees to continually learn
in an effort to maintain relevance in a technologycentered world; workplace learning is not only
designed to help employees learn new skills, but to develop a culture where learning
opportunities are used to develop the capacity of employees and drive positive change for the
organization (Caudill, 2015).
Page 19 of 99

Khan (2012) reports how Maslow’s hierarchy of needs relates to training and motivation on
employees; if motivation is closely related to achievement, which produces job satisfaction, then
employees can thus be trained and motivated with positive rewards, such as certificates, rewards,
and trophies, which will then encourage adoption of systems. Khan’s research examined the
connection between training and motivation in the enhancement of an employee’s performance.
His hypothesis was that there was a direct correlation between the factors, and his research
showed that this was indeed the case (93). But if we examine the works of Davis and others, we
know that training does not always lead to a direct increase in the perceived usefulness of a
system, especially if the training method in question itself could possibly create a technological
barrier, as in the case of elearning.
With the growing popularity of elearning, examining its role on the impact of the Technology
Acceptance Model is a natural next step for researchers.
2.3 BARRIERS TO ELEARNING EFFECTIVENESS
Despite easy access to elearning, this method of instruction may not be the most effective for all
employees. A wide range of barriers have been shown to affect learner satisfaction with
elearning, rate of completion of ecourses, and likelihood to engage in future elearning.
Page 20 of 99

Employees encounter several barriers that may prevent them from completing courses: technical
problems, time and support, personal motivation, technical skills, and academic skills all
influence whether or not students will finish online learning (TylerSmith, 2006; Sun et al, 2008;
McKay & Vilela, 2011). For elearners, these barriers can lead to high levels of attrition with
online students, and some studies have also shown that learners lack of satisfaction with the
course’s content, level of interaction, and assessment details will prevent them from starting
additional courses (Caudill, 2015; Sun et al, 2008).
Studies have also shown generational differences in the perception of the effectiveness of
elearning. Training and development content, and especially elearning modules and platforms,
are generally tailored for younger workers; older workers may not feel that elearning is effective
for learning new technology, and may prefer facetoface methods exclusively (Jeske et al,
2012). Users with a lack of workplace technology experience generally those with an extensive
work history prior to 1995 can have computer anxiety, leading to an unwillingness to engage in
elearning (Laguna, K. & Babcock, R., 1997). Previous studies have also indicated that older
workers require a longer time to complete training than their younger counterparts (Sterns &
Doverspike, 1989).
Recent studies suggest that completion of elearning modules may not be effective training tools
for older workers, for whom the computer is a significant barrier (Hickman, Rogers & Fisk,
2007). A study conducted in 1991 found that “older” workers in general saw themselves as being
Page 21 of 99
unsuited to new learning; researchers discovered that these workers often lacked confidence in
training situation (Plett & Lester).
In addition to age being a contributing factor to the satisfaction with elearning, research has
shown that gender can also play a large role in the acceptance of elearning as an instructional
method. In one study, the following was found:
“Men’s rating of computer selfefficacy, perceived usefulness, perceived ease of use, and
behavioral intention to use elearning are all higher than women’s. Additionally, we
found that women were more strongly influenced by perceptions of computer selfefficacy
and ease of use, and that men’s usage decisions were more significantly influenced by
their perception of usefulness of elearning. These findings also suggest that researchers
should take into consideration factors of gender in the development and testing of
elearning theories. Managers and coworkers, moreover, should realize that elearning
may be perceived differently by women and men” (Ong, C. S., & Lai, J. Y., 2006).
2.4 EXTENSION OF PREVIOUSLY CONDUCTED STUDIES
The foundation for this survey is based on several previously discussed constructs:
The role of public libraries is changing
Public library staff have an increased number of technologyrelated job tasks
Implementation of new technologies is occurring at greater frequencies in libraries
Training is an effective method to increase technology acceptance
Elearning is growing in popularity, due to several factors, including costeffectiveness
Page 22 of 99

This study, then, will attempt to synthesize the research previously conducted to determine if
elearning is an effective method of instruction to positively affect technology acceptance in
public libraries.
Researchers who have conducted similar studies have specifically studied the impact of learner
anxiety, elearning, and technology acceptance; generational differences that impact elearning
success; metacognitive awareness; and perceived usefulness and ease of use, among others
(Table 1). This study is an extension of these previous studies and research models and is
designed to show which factors affect this increasinglyused training method (elearning) and its
impact on an increasinglyimportant role (technology) in public libraries.
Page 23 of 99

Table 1. Related references about elearning and technology acceptance
Author(s) Factors
Sun et al (2006) Dimensions affecting perceived elearning satisfaction, including learners, instructors, technology and internet quality, perceived usefulness and ease of use
Fuller, Vician, & Brown (2006)
Computer anxiety, communication apprehension
Ahmad & Tarmudi (2011) Generational differences, learner satisfaction, training design & quality
Hugget (2014) Technology consideration, message management
Gallego et al (2011) Perceived ease of use, perceived usefulness, usage behavior, intention to use, user training, user fit, technological complexity, trainer support
Dunlap & Lowenthal (2013) Metacognitive awareness, social media, usage of web 2.0 tools
Hickman, Rogers, & Fisk (2007)
Age, memory span, reaction time, vision
Ong & Lai (2006) Gender, computer selfefficacy
Tarhini, Hone, & Liu (2014) Gender, age, computer selfefficacy, social norm
3. METHODS OF RESEARCH DESIGN AND DEVELOPMENT
This survey was designed on several constructs listed above; it closely follows studies conducted
by Gallego et al (2011) and Lee, Hsieh, & Chen (2011), which were extensions of Davis’s
Page 24 of 99

original 1989 study, and has been adapted to provide results with significance to the public
library field.
3.1 OVERVIEW & HYPOTHESES
This study examines whether completion of an elearning module is a factor that influences
users’ perceptions of elearning as a valuable tool to learn about technology and positively
impact technology acceptance, specifically in public libraries. The following hypotheses were
developed as a result of the research connecting elearning and training on technology
acceptance rates and on the impact that demographics have on the perceived effectiveness of
elearning.
3.1.1 Perceived effectiveness of elearning (PE) & completion of an elearning module (EL)
In the context of this study, perceived effectiveness of elearning is determined to be the user’s
belief that elearning is generally a valid and useful instructional tool and is a valuable
component in a staff development program. Users who have not previously completed an
elearning module may be apprehensive of its value and its effectiveness as a training tool
(Fuller, Vician, & Brown, 2006; Liaw & Huang, 2013). Therefore, we can form our first
hypothesis:
Hypothesis 1 (H1): Completion of an elearning module (EL) has a positive effect on the
perceived effectiveness of elearning (PE).
Page 25 of 99
3.1.2 Perceived usefulness of technology (PU), perceived ease of use of technology (PEU), and
usage behavior (UB)
These constructs were used in extension of the work of Technology Acceptance Model
developed by Davis (1989). In his original study, Davis emphasized the critical finding that
would go on to inform and serve as the foundation of many future studies: perceived usefulness
and perceived ease of use are very strong of future technology acceptance and usage behavior
(UB). As an extension of his work, this study aims to determine if the completion of elearning
impacts these constructs in the public library setting.
Hypothesis 2 (H2): Completion of elearning module (EL) has a positive effect on
perceived usefulness of technology (PU).
Hypothesis 3 (H3): Completion of an elearning module (EL) has a positive effect on
perceived ease of use of technology (PEU).
3.1.3 Demographics of study participants and impact on PE
Previous studies outlined above have determined that age and gender can affect a learner’s
perception of elearning; this study aims to apply this research to determine its validity in the
public library sector.
Hypothesis 4 (H4): The perceived effectiveness (PE) of elearning is different depending
Page 26 of 99

on the gender of the staff member.
Hypothesis 5 (H5): The perceived effectiveness (PE) of elearning is different
depending on the age of the staff member.
By extending Davis’s original Technology Acceptance Model to incorporate these additional
factors, we can formulate a new model (Figure 2). This figure demonstrates the impact of
elearning (EL) on its perceived effectiveness (PE), along with the impact of demographics (age
and gender, specifically) on the perceived effectiveness of elearning. The survey questionnaire
also included items to determine whether the prior completion of elearning had an impact on the
the perceived effectiveness of elearning modules as a tool to gain further understanding on the
usefulness and ease of use of technology. One aspect included in the research model, usage
behavior (UB), was not analyzed in this study. There is an opportunity for future researchers to
examine factors related to UB in the context of the public library.
Figure 2. New research model
Page 27 of 99

3.2 RESEARCH MEASURES
A questionnaire was developed to gather data from study participants. To ensure validity of the
questionnaire, each construct has been mapped to a specific item, which was developed as a
result of previous research, as outlined above. The questionnaire included three parts; one part to
determine public library experience and experience with elearning; one part to determine
demographic figures; and the final portion asking for agreement with several statements based on
theory constructions.
Figures 3 and 4 show the information gathered from the first portion of the study. Approximately
98% of respondents had experience in public libraries; 81% had previously completed an
elearning module for professional development. No responses were excluded from the study
based on either of these items; while public library experience was requested for participation,
the responses of nonpublic library staff were analyzed as well. The survey was only distributed
to library staff (see Section 3.3) and the likelihood of respondents having familiarity with public
libraries, if not direct experience working in them, was very high. Table 2 shows the
demographics of the respondents; age and gender information was gathered. No personally
identifying information was collected during the study.
Page 28 of 99

Figure 3. Public library experience
Figure 4. Elearning experience
Page 29 of 99
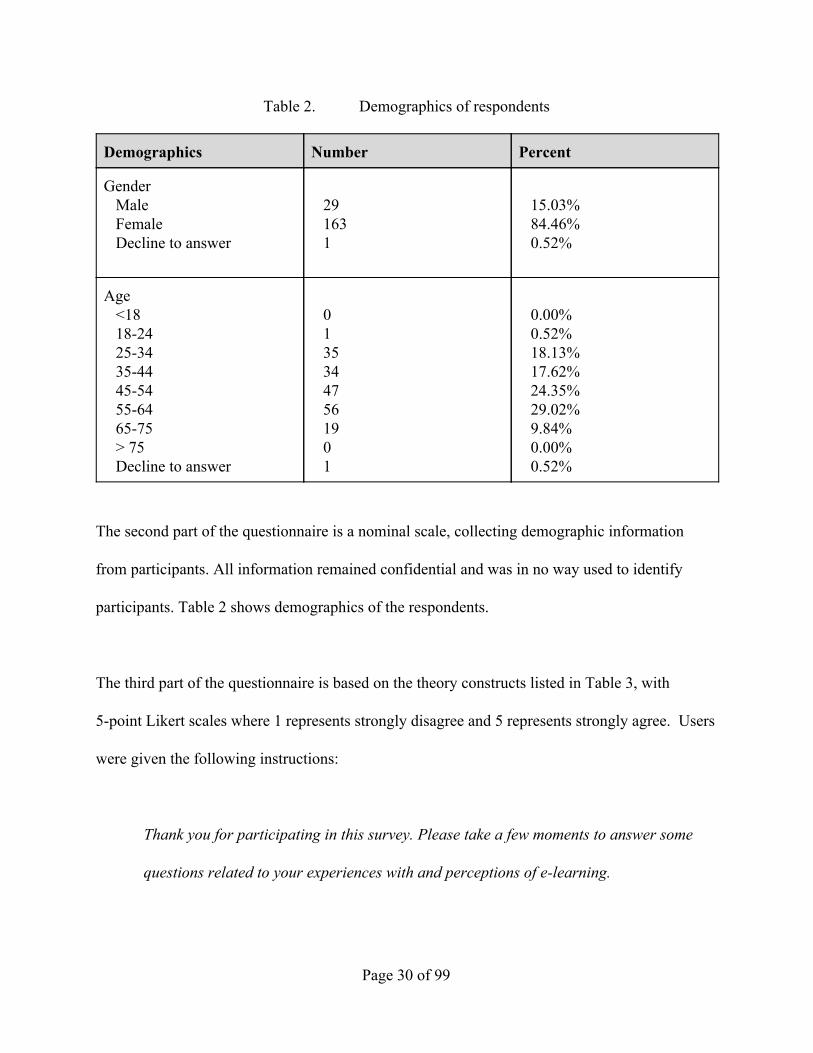
Table 2. Demographics of respondents
Demographics Number Percent
Gender Male Female Decline to answer
29 163 1
15.03% 84.46% 0.52%
Age <18 1824 2534 3544 4554 5564 6575 > 75 Decline to answer
0 1 35 34 47 56 19 0 1
0.00% 0.52% 18.13% 17.62% 24.35% 29.02% 9.84% 0.00% 0.52%
The second part of the questionnaire is a nominal scale, collecting demographic information
from participants. All information remained confidential and was in no way used to identify
participants. Table 2 shows demographics of the respondents.
The third part of the questionnaire is based on the theory constructs listed in Table 3, with
5point Likert scales where 1 represents strongly disagree and 5 represents strongly agree. Users
were given the following instructions:
Thank you for participating in this survey. Please take a few moments to answer some
questions related to your experiences with and perceptions of elearning.
Page 30 of 99
*Please note: elearning is generally defined as a learning opportunity delivered via
technology; examples include selfpaced online training, training videos on YouTube,
and webinars. Facetoface training would not be considered elearning.
Users were provided an opportunity to select “decline to answer” as an option for each item in
the questionnaire.
Page 31 of 99

Table 3. Questionnaire items
Theory construct Item definition
PE
Q5/PE1 Elearning is an effective way to learn new information.
Q6/PE2 Elearning modules are a valuable component in staff training programs.
Q7/PE3 Staff members who complete elearning modules are wellinformed.
Q8/PE4 Elearning provides a valuable opportunity to learn ondemand.
PU
Q9/PU1 Understanding the importance of new technology is easier if I have access to an elearning module.
Q10/PU2 Completing an elearning module could help me understand why new technology is being implemented in the library.
PEU
Q11/PEU1 Elearning modules are effective ways to learn how to use technology tools in libraries.
Q12/PEU2 Learning about new devices and technologies is easier through elearning than through other instructional methods, like facetoface classes or handson workshops.
UB
Q13/UB1 After completing an elearning module about new technology, it is likely that staff would feel confident using it in the library.
Q14/UB2 After completing an elearning module about new technology, it is likely that staff would feel confident sharing their knowledge with others.
Page 32 of 99

3.3 DATA COLLECTION
This study used a webbased survey to collect data for the qualitative portion of the research
study. The survey was built using SurveyMonkey, an online survey tool. To maintain
confidentiality and compliance with IRB protocol, IP addresses and other identifying information
was not gathered. 195 responses were collected.
Survey invitation emails (Appendix A) were sent to various group libraryfocused mailing lists
across the country, including one of the public library directors in Georgia, technical support
specialists in Georgia’s public libraries, the Tennessee Library Association, and the Learning
Round Table of the American Library Association (see Appendix B). Emails to participate in the
research study were sent beginning on June 10; the web collector was closed on June 24, 2016.
The invitation email stated the purpose of the study and included a URL to the survey. To begin
the survey, users were provided informed consent information and asked to provide consent to
participate in the research project (Appendix C). Users who were unwilling to accept the
informed consent procedures in the survey were thanked for their time and were exited
automatically from the survey process.
198 users began the survey. Of those, 195 agreed to the terms and gave consent to participate in
the research study. Of these respondents, 97.93% (189) had previously worked in public libraries
and 81.53% had previously completed an elearning module for professional development.
Page 33 of 99
Survey respondents were then provided with ten statements and asked to rate their level of
agreement with each question using a Likert scale anchored at Strongly Agree and Strongly
Disagree. The statements were adapted from previous, similar surveys that provided data for
other closely related research studies. In addition, users were given a “decline to answer” option
for each question.
4. RESULTS AND DISCUSSION
This study gathered nominal data from survey respondents: gender, age, library experience,
elearning experience were all collected, as detailed above. In addition, users were asked to
provide their level of agreement with several statements using a 5point Likert scale. The
descriptive statistics of the results of this portion of the survey are included in Table 4.
Page 34 of 99

Table 4. Summary of measurement scales
Construct/ Questionnaire Item
Mean Std Dev
Perceived effectiveness
PE1/Question 5 4.1277 0.7125
PE2/Question 6 4.1064 0.7595
PE3/Question 7 3.7287 0.7710
PE4/Question 8 4.3404 0.7320
Perceived usefulness
PU1/Question 9 3.8432 0.8024
PU2/Question 10 4.0319 0.7083
Perceived ease of use
PEU1/Question 11 3.8663 0.8021
PEU2/Question 12 2.6524 1.0011
Usage behavior
UB1/Question 13 3.3048 0.8848
UB2/Question 14 3.3422 0.8983
4.1 SURVEY RESULTS
This study tested 5 hypotheses related to elearning and technology acceptance (Table 5). Data
from the survey were analyzed to determine which hypotheses were supported by statistically
significant results.
Page 35 of 99
Of the 5 different hypotheses, only 2 were confirmed by the data: H1 and H5.
H1: Completion of an elearning module (EL) has a positive effect on the perceived
effectiveness of elearning (PE). This hypothesis was supported by significant p values
for 3 of 4 questions related to the construct.
H5: The perceived effectiveness (PE) of elearning is different depending on the age of
the staff member. This hypothesis was supported by significant p values for 2 of 4
questions related to the construct.
Three hypotheses were unconfirmed by the data:
H2: Completion of elearning module (EL) has a positive effect on perceived usefulness
of technology (PU).
H3: Completion of an elearning module (EL) has a positive effect on perceived ease of
use of technology (PEU).
H4: The perceived effectiveness (PE) of elearning is different depending on the gender
of the staff member.
Page 36 of 99

Table 5. Descriptive statistics
Construct & Hypothesis
Observed Differences Fisher’s Exact Test pvalue
Supported
EL > PE H1
Those with prior elearning experience rated elearning as:
An effective instructional method (Q5)
A valuable component of staff training (Q6)
A valuable opportunity to learn on demand (Q8)
Q5: p=0.022 Q6: p=0.004 Q7: p=0.31 Q8: p=0.078
Yes, 3 of 4 p values were significant (Q5, Q6, and Q8)
EL > PU H2
Q9: p=0.5717 Q10: p=0.2398
No
EL > PEU H3
Q11: p=0.4854 Q12: p=0.3239
No
Gender > PE H4
Q5: p=0.2791 Q6: p=0.2314 Q7: p=0.3577 Q8: p=0.6463
No
Age > PE H5
Younger survey respondents were more likely to consider elearning to be:
An effective instructional method (Q5)
A valuable opportunity to learn on demand (Q8)
Q5: p=0.10 Q6: p=0.43 Q7: p=0.26 Q8: p=0.05
Yes, 2 of 4 p values were statistically significant (Q5 and Q8)
To analyze the data, frequency histograms charts and graphs were created to determine the
impact of elearning. In addition, nonparametric Fisher’s Exact Tests were conducted using the
tool provided by Vassar at http://vassarstats.net/tab2x2.html. p values were considered
statistically significant at the following alpha levels:
Page 37 of 99

Greater than 0.1: no significance
Between 0.1 and 0.05: weak statistical significance
Between 0.05 and 0.01: statistically significant
Less than 0.01: overwhelmingly significant
Since the Likert scale used represents an ordinal scale, the statistical test relied on visually
comparing the distributions of agreement ratings followed by the nonparametric Fisher’s Exact
Test on the 2X2 contingency table where the negative and neutral ratings were collapsed into one
category and the two positive rating points on the Likert scale were collapsed in the other.
4.1.1 H1: Impact of elearning experience on perceived effectiveness
Elearning experience had a varying effect on study constructs (Table 6). Users who had
previously completed an elearning module were, on average, 13% more likely to believe it was
an effective way to learn more information (PE1); 12% more likely to believe that elearning is a
valuable component in staff training programs (PE2); 7% more likely to believe that staff
members who complete elearning modules are wellinformed (PE3); and 9% more likely to
believe that elearning provides a valuable opportunity to learn ondemand (PE4).
Table 6. Impact of prior elearning
EL Avg PE1
Avg PE2
Avg PE3
Avg PE4
Avg PU1
Avg PU2
Avg PEU1
Avg PEU2
Avg UB1
Avg UB2
No 3.74 3.74 3.53 4.03 3.74 3.97 3.85 2.71 3.41 3.53
Yes 4.21 4.19 3.77 4.41 3.87 4.05 3.87 2.64 3.28 3.30
Page 38 of 99
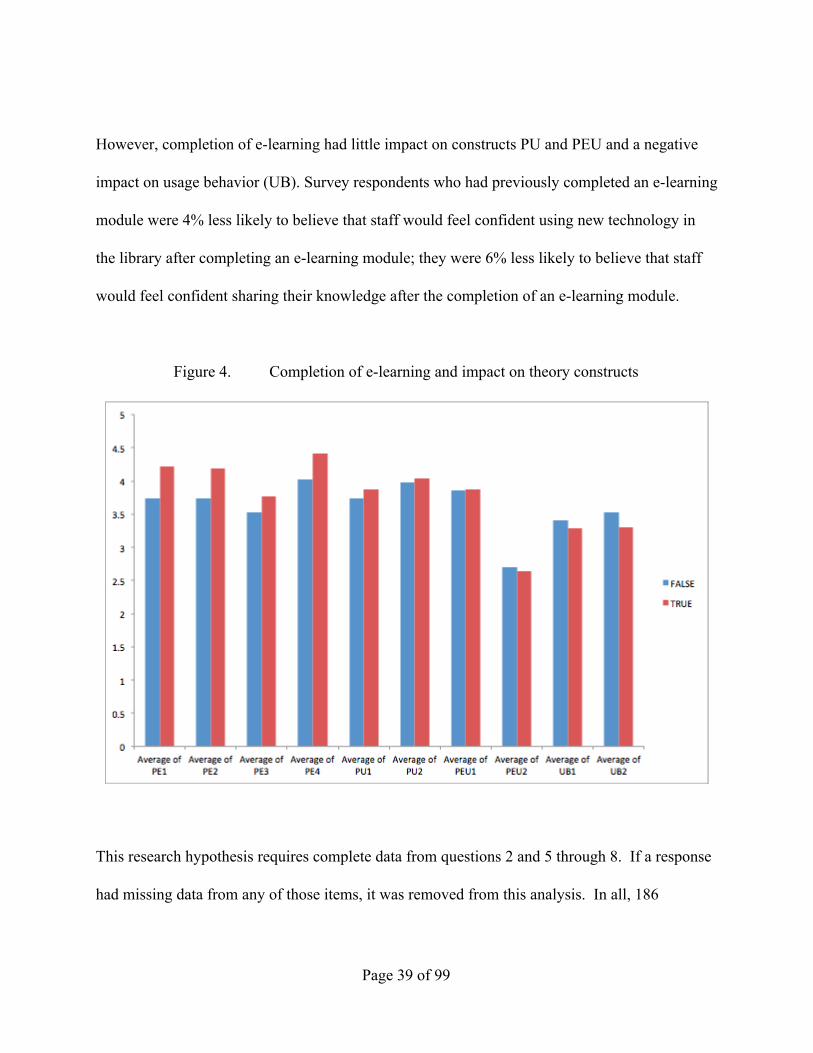
However, completion of elearning had little impact on constructs PU and PEU and a negative
impact on usage behavior (UB). Survey respondents who had previously completed an elearning
module were 4% less likely to believe that staff would feel confident using new technology in
the library after completing an elearning module; they were 6% less likely to believe that staff
would feel confident sharing their knowledge after the completion of an elearning module.
Figure 4. Completion of elearning and impact on theory constructs
This research hypothesis requires complete data from questions 2 and 5 through 8. If a response
had missing data from any of those items, it was removed from this analysis. In all, 186
Page 39 of 99

respondents were included in this analysis, where 33 had no prior elearning experience and 153
had at least one prior elearning experience. The data profile indicating support for the research
hypothesis was that the 153 who had prior elearning experience (question 2) would show a
higherlevel of agreement in the value and effectiveness of elearning as measured in questions
58:
5. Elearning is an effective way to learn new information.
6. Elearning modules are a valuable component in staff training programs.
7. Staff members who complete elearning modules are wellinformed.
8. Elearning provides a valuable opportunity to learn ondemand.
Results for Q5:
Figure 5. Relative Frequency Histogram: EL and Q5
Page 40 of 99
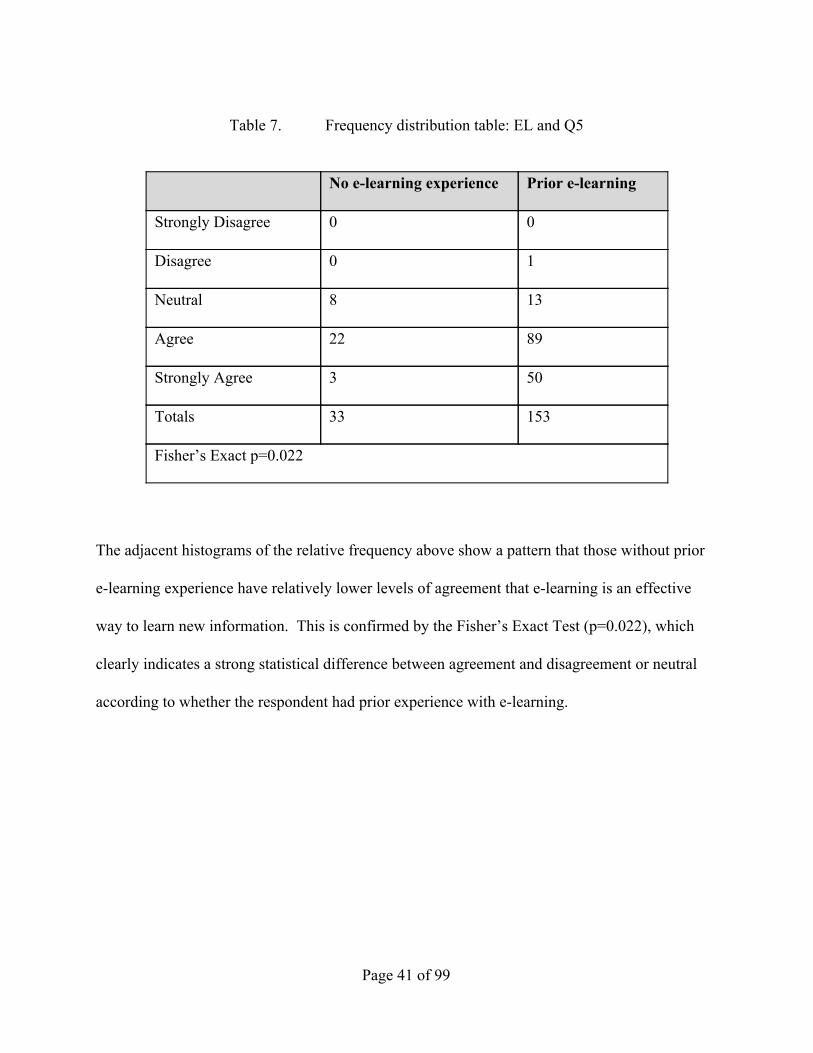
Table 7. Frequency distribution table: EL and Q5
No elearning experience Prior elearning
Strongly Disagree 0 0
Disagree 0 1
Neutral 8 13
Agree 22 89
Strongly Agree 3 50
Totals 33 153
Fisher’s Exact p=0.022
The adjacent histograms of the relative frequency above show a pattern that those without prior
elearning experience have relatively lower levels of agreement that elearning is an effective
way to learn new information. This is confirmed by the Fisher’s Exact Test (p=0.022), which
clearly indicates a strong statistical difference between agreement and disagreement or neutral
according to whether the respondent had prior experience with elearning.
Page 41 of 99

Results for Q6:
Figure 6. Relative Frequency Histogram: EL and Q6
Table 8. Frequency distribution table: EL and Q6
No elearning experience Prior elearning
Strongly Disagree 0 1
Disagree 0 1
Neutral 10 13
Agree 18 89
Strongly Agree 5 49
Totals 33 153
Fisher’s Exact Test p=0.004
Page 42 of 99

The adjacent histograms of the relative frequency above show a pattern that those without prior
elearning experience have relatively lower levels of agreement that elearning modules are a
valuable component in staff training programs. This is confirmed by the Fisher’s Exact Test
(p=0.004), which clearly indicates a very strong statistical difference between agreement and
disagreement or neutral according to whether the respondent had prior experience with
elearning.
Results for Q7:
Figure 7. Relative Frequency Histogram: EL and Q7
Page 43 of 99

Table 9. Frequency distribution table: EL and Q7
No elearning experience Prior elearning
Strongly Disagree 1 0
Disagree 0 2
Neutral 13 53
Agree 16 74
Strongly Agree 3 24
Totals 33 153
Fisher’s Exact Test p=0.31
The adjacent histograms of the relative frequency above show a nodifference pattern that those
without prior elearning experience same distribution of levels of agreement that staff member
who complete elearning modules are well informed. This is confirmed by the Fisher’s Exact
Test (p=0.31), which clearly indicates a no statistical difference between agreement and
disagreement or neutral according to whether the respondent had prior experience with
elearning.
Question 7 was slightly different than the other survey statements; while questions 5, 6, and 8
asked respondents to assess the impact of elearning and its value for learning new information
ondemand, question 7’s focus was on the perception of staff members who complete elearning
modules. Because previous research had determined that the perception of elearning can impact
Page 44 of 99
its adoption and that subjective norms are more impactful for certain groups than others, this
statement was chosen to test the validity of those constructs.
Results for Q8:
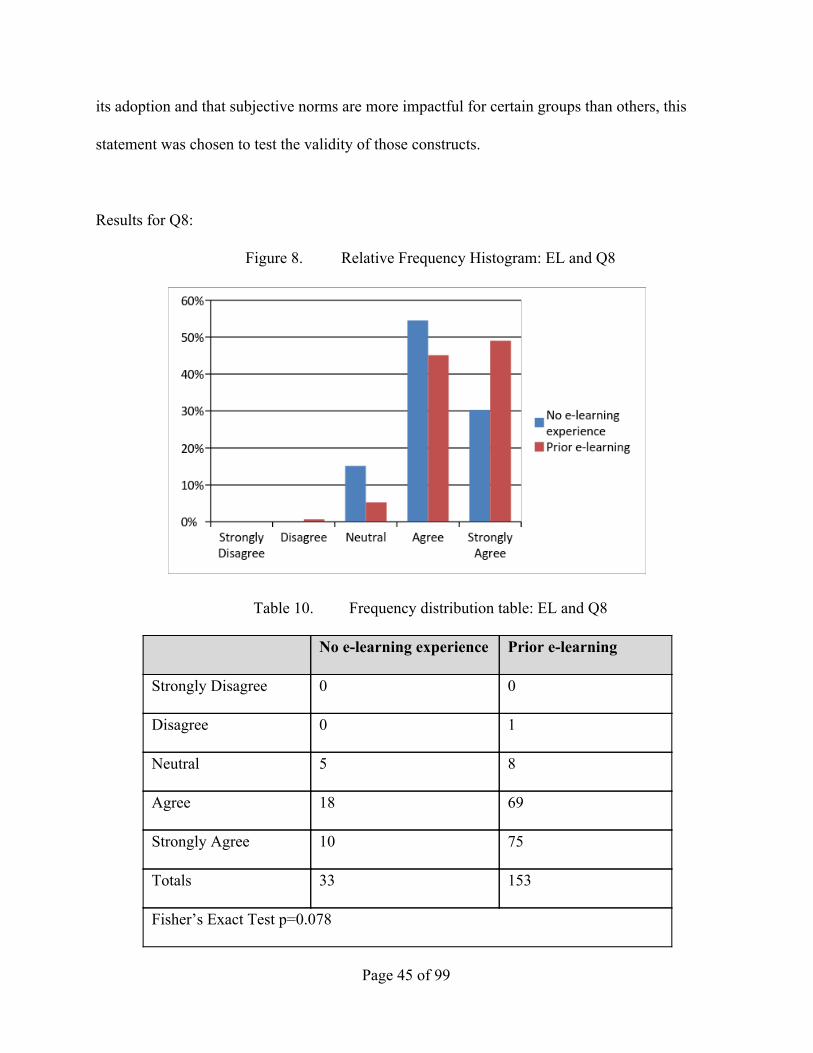
Figure 8. Relative Frequency Histogram: EL and Q8
Table 10. Frequency distribution table: EL and Q8
No elearning experience Prior elearning
Strongly Disagree 0 0
Disagree 0 1
Neutral 5 8
Agree 18 69
Strongly Agree 10 75
Totals 33 153
Fisher’s Exact Test p=0.078
Page 45 of 99

The adjacent histograms of the relative frequency above show a pattern that those without prior
elearning experience have relatively lower levels of agreement that elearning modules provide
a valuable opportunity to learn on demand. This is confirmed by the Fisher’s Exact Test
(p=0.078), which indicates a weak statistical difference between agreement and disagreement or
neutral according to whether the respondent had prior experience with elearning.
4.1.2 H2: Impact of elearning experience on perceived usefulness of technology
This research hypothesis requires complete data from questions 2, 9 and 10. If a response had
missing data from any of those items, it was removed from this analysis. In all, 184 respondents
were included in this analysis, where 33 had no prior elearning experience and 151 had at least
one prior elearning experience. The data profile indicating support for the research hypothesis
was that the 151 who had prior elearning experience (question 2) would show a higherlevel of
agreement in the perceived usefulness of technology, as shown in questions 9 and 10:
9. Understanding the importance of new technology is easier if I have access to an
elearning module.
10. Completing an elearning module could help me understand why new technology is being
implemented in the library.
Page 46 of 99

Results for Q9:
Figure 9. Relative Frequency Histogram: EL and Q9
Table 11. Frequency distribution table: EL and Q9
No elearning Prior elearning
Strongly disagree 0 0
Somewhat disagree 1 7
Neutral 8 34
Agree 19 82
Strongly agree 5 28
Total 33 151
Fisher’s Exact Test p=0.5717
Page 47 of 99

The adjacent histograms of the relative frequency above show a nodifference pattern; those
without prior elearning experience the same distribution of levels of agreement in the perceived
usefulness of technology as those who have completed prior elearning. This is confirmed by the
Fisher’s Exact Test (p=0.5717), which clearly indicates a no statistical difference between
agreement and disagreement or neutral according to whether the respondent had prior experience
with elearning.
Results for Q10:
Figure 10. Relative Frequency Histogram: EL and Q10
Page 48 of 99
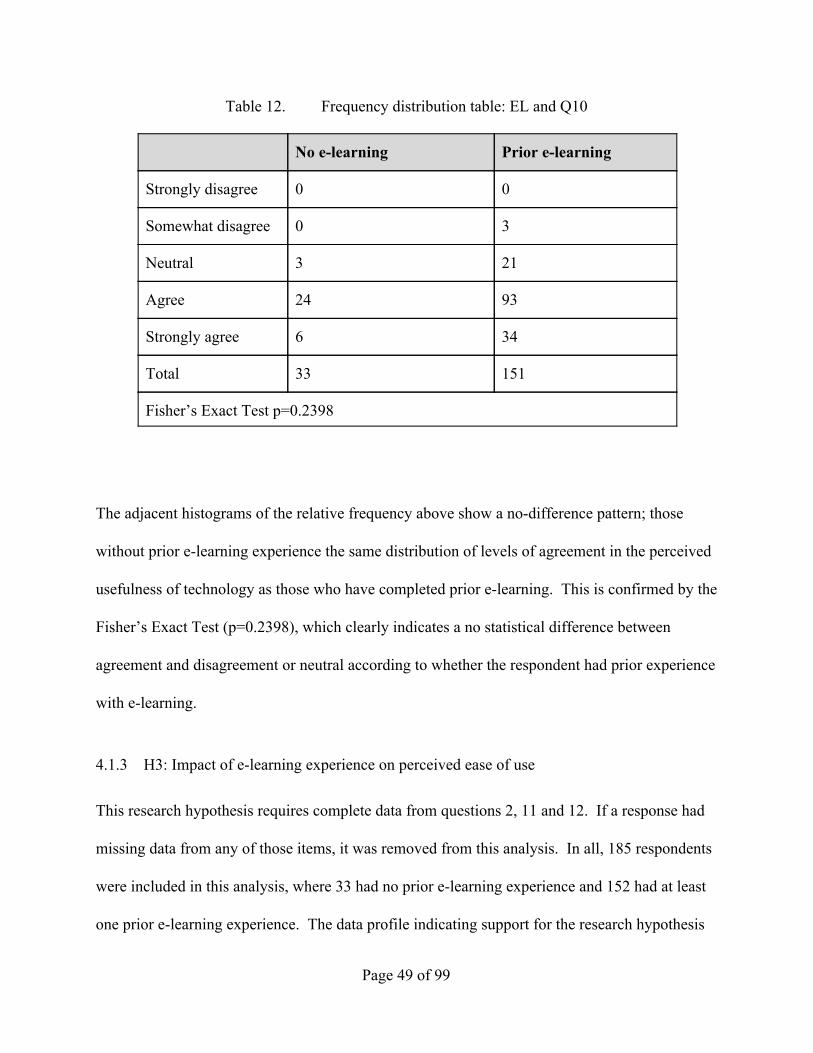
Table 12. Frequency distribution table: EL and Q10
No elearning Prior elearning
Strongly disagree 0 0
Somewhat disagree 0 3
Neutral 3 21
Agree 24 93
Strongly agree 6 34
Total 33 151
Fisher’s Exact Test p=0.2398
The adjacent histograms of the relative frequency above show a nodifference pattern; those
without prior elearning experience the same distribution of levels of agreement in the perceived
usefulness of technology as those who have completed prior elearning. This is confirmed by the
Fisher’s Exact Test (p=0.2398), which clearly indicates a no statistical difference between
agreement and disagreement or neutral according to whether the respondent had prior experience
with elearning.
4.1.3 H3: Impact of elearning experience on perceived ease of use
This research hypothesis requires complete data from questions 2, 11 and 12. If a response had
missing data from any of those items, it was removed from this analysis. In all, 185 respondents
were included in this analysis, where 33 had no prior elearning experience and 152 had at least
one prior elearning experience. The data profile indicating support for the research hypothesis
Page 49 of 99

was that the 152 who had prior elearning experience (question 2) would show a higherlevel of
agreement in the perceived ease of use of technology, as shown in questions 11 and 12:
11. Understanding the importance of new technology is easier if I have access to an
elearning module.
12. Completing an elearning module could help me understand why new technology is being
implemented in the library.
Results for Q11:
Figure 11. Relative Frequency Histogram: EL and Q11
Page 50 of 99

Table 13. Frequency distribution table: EL and Q11
No elearning Prior elearning
Strongly disagree 0 0
Somewhat disagree 0 5
Neutral 9 40
Agree 16 77
Strongly agree 8 30
Total 33 152
Fisher’s Exact Test p=0.4854
The adjacent histograms of the relative frequency above show a nodifference pattern; those
without prior elearning experience the same distribution of levels of agreement about the
effectiveness of elearning in affecting perceived ease of use of technology as those who have
completed prior elearning. This is confirmed by the Fisher’s Exact Test (p=0.4854), which
clearly indicates a no statistical difference between agreement and disagreement or neutral
according to whether the respondent had prior experience with elearning.
Page 51 of 99

Results for Q12:
Figure 12. Relative Frequency Histogram: EL and Q12
Table 14. Frequency distribution table: EL and Q12
No elearning Prior elearning
Strongly disagree 3 13
Somewhat disagree 12 63
Neutral 10 47
Agree 5 24
Strongly agree 3 5
Total 33 152
Fisher’s Exact Test p=0.3239
Page 52 of 99

The adjacent histograms of the relative frequency above show a nodifference pattern; those
without prior elearning experience the same distribution of levels of agreement with question
12, “Completing an elearning module could help me understand why new technology is being
implemented in the library,” as those who have completed prior elearning. This is confirmed by
the Fisher’s Exact Test (p=0.3239), which clearly indicates a no statistical difference between
agreement and disagreement or neutral according to whether the respondent had prior experience
with elearning.
4.1.4 H4: Impact of gender on perceived effectiveness of elearning
This research hypothesis requires complete data from questions 4 through 8. If a response had
missing data from any of those items, it was removed from this analysis. In all, 186 respondents
were included in this analysis, with gender distribution listed in the table below.
Table 15. Gender distribution frequency
Gender Frequency
Female 158
Male 28
Total 186
Page 53 of 99
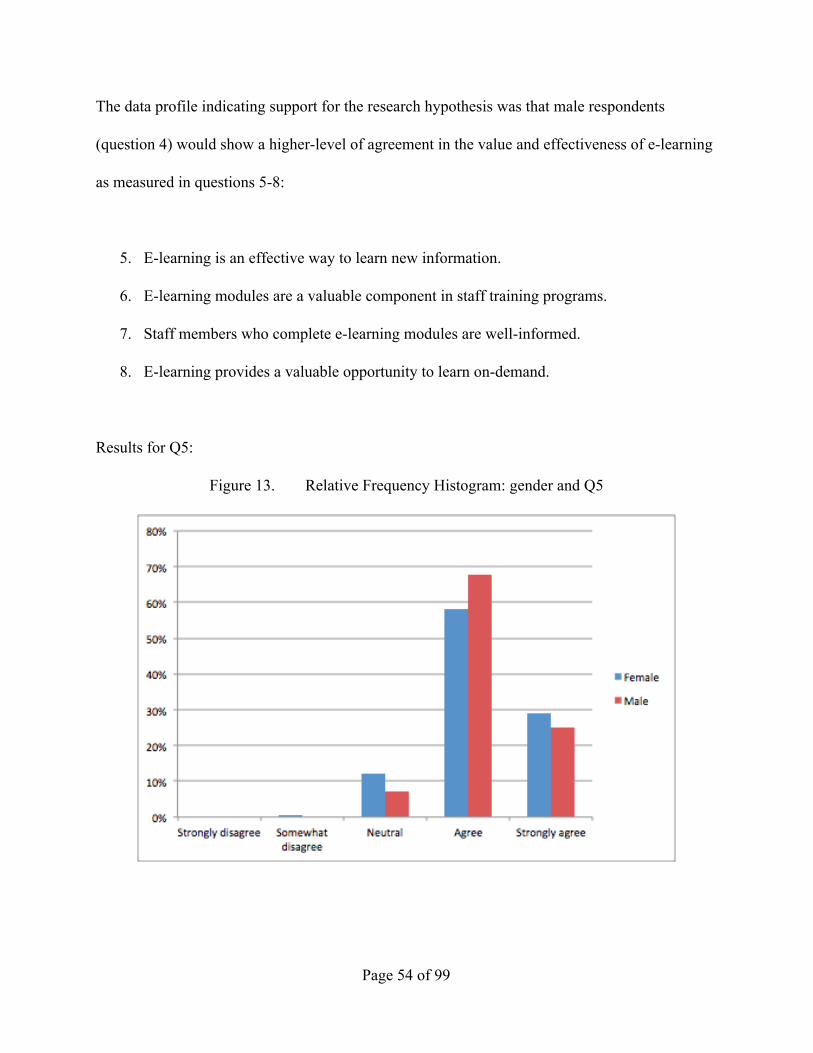
The data profile indicating support for the research hypothesis was that male respondents
(question 4) would show a higherlevel of agreement in the value and effectiveness of elearning
as measured in questions 58:
5. Elearning is an effective way to learn new information.
6. Elearning modules are a valuable component in staff training programs.
7. Staff members who complete elearning modules are wellinformed.
8. Elearning provides a valuable opportunity to learn ondemand.
Results for Q5:
Figure 13. Relative Frequency Histogram: gender and Q5
Page 54 of 99

Table 16. Frequency distribution table: gender and Q5
Female Male
Strongly disagree 0 0
Somewhat disagree 1 0
Neutral 19 2
Agree 92 19
Strongly agree 46 7
Total 158 28
Fisher's Exact Test p=0.2791
The adjacent histograms of the relative frequency above show a nodifference pattern; males
experience the same distribution of levels of agreement with Q5, “Elearning is an effective way
to learn new information,” as women. This is confirmed by the Fisher’s Exact Test (p=0.2791),
which clearly indicates a no statistical difference between agreement and disagreement or neutral
according to gender.
Results for Q6:
Page 55 of 99

Figure 14. Relative Frequency Histogram: gender and Q6
Table 17. Frequency distribution table: gender and Q6
Female Male
Strongly disagree 1 0
Somewhat disagree 1 0
Neutral 21 2
Agree 90 17
Strongly agree 45 9
Total 158 28
Fisher’s Exact p=0.2314
Page 56 of 99

The adjacent histograms of the relative frequency above show a nodifference pattern; males
experience the same distribution of levels of agreement with Q6, “Elearning modules are a
valuable component in staff training programs,” as women. This is confirmed by the Fisher’s
Exact Test (p=0.2314), which clearly indicates a no statistical difference between agreement and
disagreement or neutral according to gender.
Results for Q7:
Figure 15. Relative Frequency Histogram: gender and Q7
Page 57 of 99
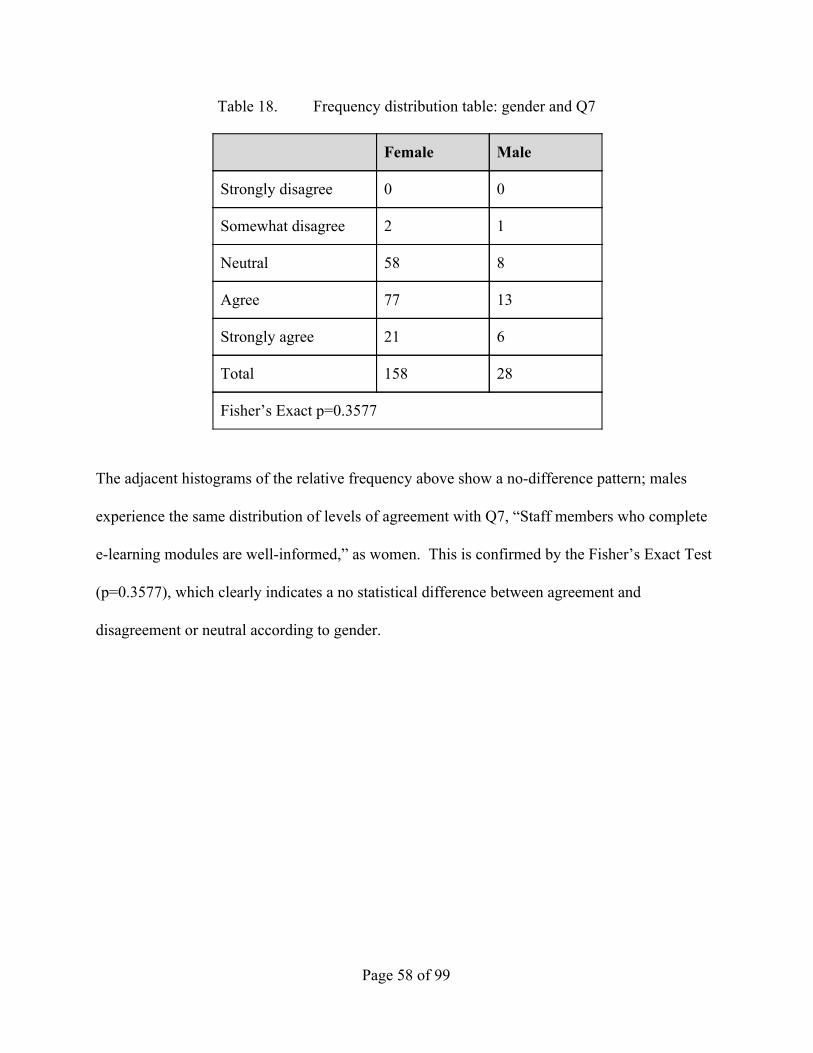
Table 18. Frequency distribution table: gender and Q7
Female Male
Strongly disagree 0 0
Somewhat disagree 2 1
Neutral 58 8
Agree 77 13
Strongly agree 21 6
Total 158 28
Fisher’s Exact p=0.3577
The adjacent histograms of the relative frequency above show a nodifference pattern; males
experience the same distribution of levels of agreement with Q7, “Staff members who complete
elearning modules are wellinformed,” as women. This is confirmed by the Fisher’s Exact Test
(p=0.3577), which clearly indicates a no statistical difference between agreement and
disagreement or neutral according to gender.
Page 58 of 99

Results for Q8:
Figure 16. Relative Frequency Histogram: gender and Q8
Table 19. Frequency distribution table: gender and Q8
Female Male
Strongly disagree 0 0
Somewhat disagree 1 0
Neutral 11 2
Agree 76 11
Strongly agree 70 15
Total 158 28
Fisher’s Exact p=0.6463
Page 59 of 99

The adjacent histograms of the relative frequency above show a nodifference pattern; males
experience the same distribution of levels of agreement with Q8, “Staff members who complete
elearning modules are wellinformed,” as women. This is confirmed by the Fisher’s Exact Test
(p=0.6463), which clearly indicates a no statistical difference between agreement and
disagreement or neutral according to gender.
On average, males were slightly more likely to consider elearning to be effective, as shown in
Table 20; however, these levels were not statistically significant. Males had a higher level of
agreement with each statement related to the perceived effectiveness of elearning, but not at a
level that would be considered significant.
These findings are inconsistent with previous research (Ong & Lai, 2006; Tarhini, Hone, & Liu,
2014). Hypothesis 6, “The perceived effectiveness (PE) of elearning is different depending on
the gender of the staff member,” is not confirmed. This presents an opportunity for future study.
Page 60 of 99

Table 20. Impact of gender on PE
Page 61 of 99
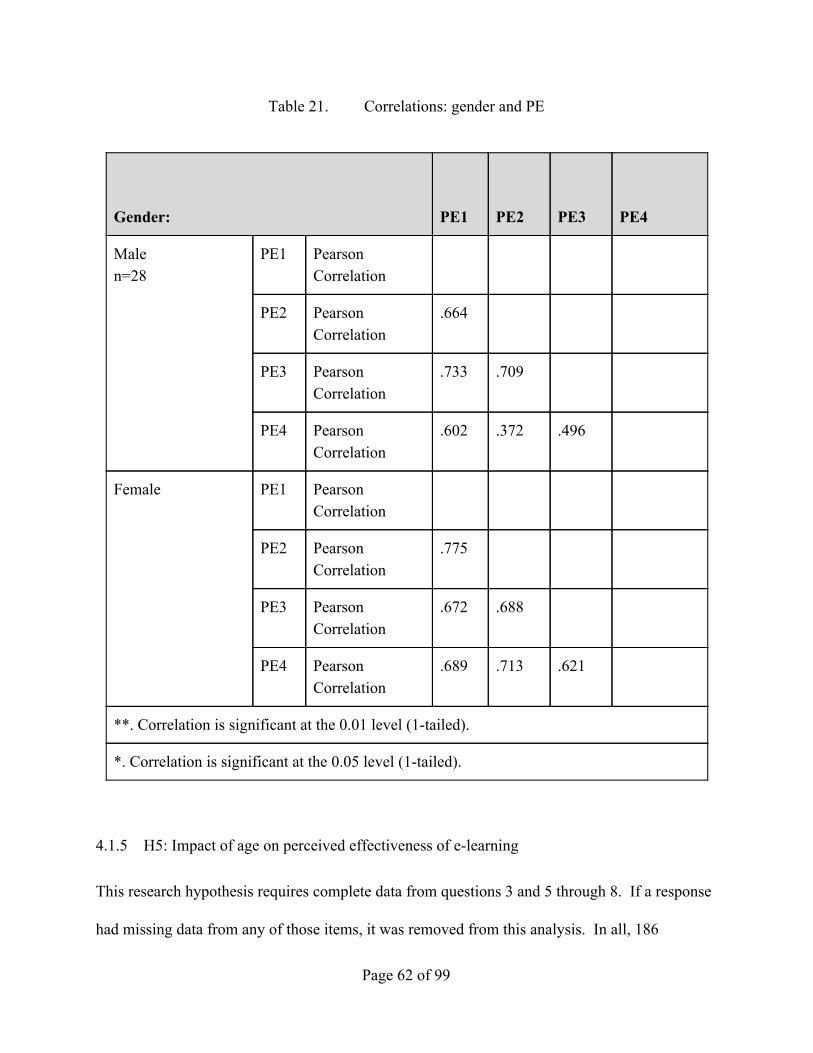
Table 21. Correlations: gender and PE
Gender: PE1 PE2
PE3
PE4
Male n=28
PE1 Pearson Correlation
PE2 Pearson Correlation
.664
PE3 Pearson Correlation
.733 .709
PE4 Pearson Correlation
.602 .372 .496
Female PE1 Pearson Correlation
PE2 Pearson Correlation
.775
PE3 Pearson Correlation
.672 .688
PE4 Pearson Correlation
.689 .713 .621
**. Correlation is significant at the 0.01 level (1tailed).
*. Correlation is significant at the 0.05 level (1tailed).
4.1.5 H5: Impact of age on perceived effectiveness of elearning
This research hypothesis requires complete data from questions 3 and 5 through 8. If a response
had missing data from any of those items, it was removed from this analysis. In all, 186
Page 62 of 99
respondents were included in this analysis, where the age distribution is in the table below.
Since the single respondent in the 20’s age category had a representative profile of the 30’s, that
respondent was added to that age category in these analyses.
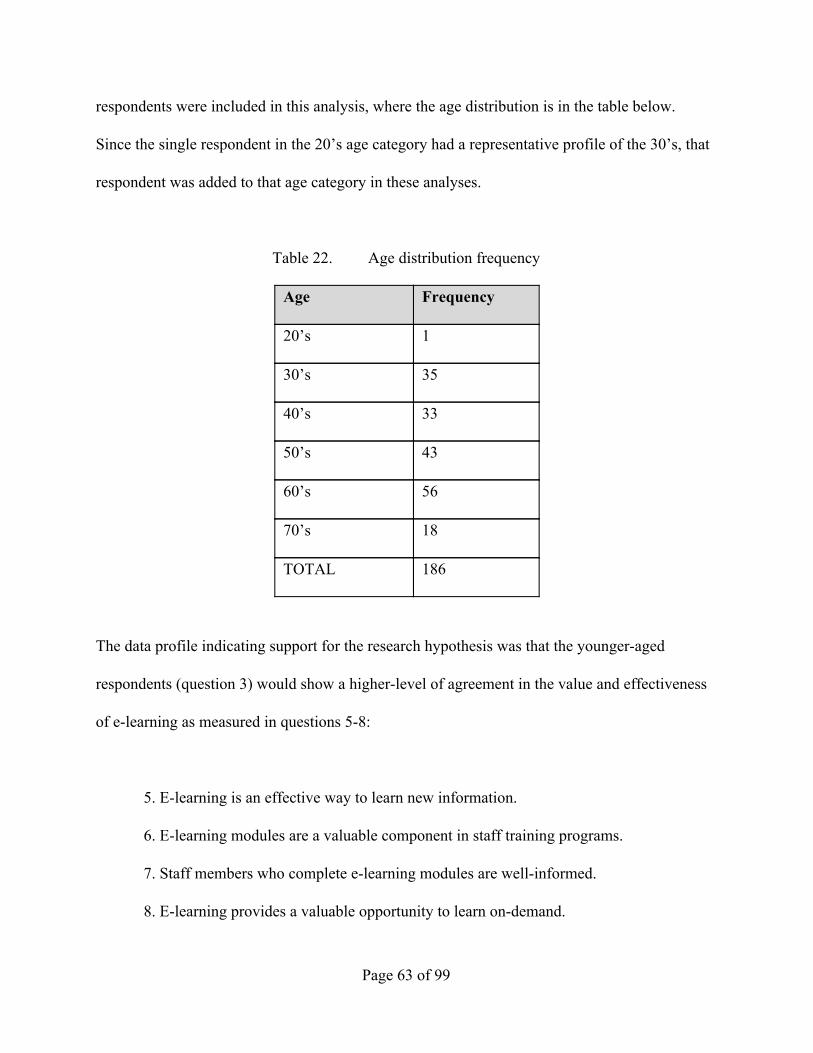
Table 22. Age distribution frequency
Age Frequency
20’s 1
30’s 35
40’s 33
50’s 43
60’s 56
70’s 18
TOTAL 186
The data profile indicating support for the research hypothesis was that the youngeraged
respondents (question 3) would show a higherlevel of agreement in the value and effectiveness
of elearning as measured in questions 58:
5. Elearning is an effective way to learn new information.
6. Elearning modules are a valuable component in staff training programs.
7. Staff members who complete elearning modules are wellinformed.
8. Elearning provides a valuable opportunity to learn ondemand.
Page 63 of 99
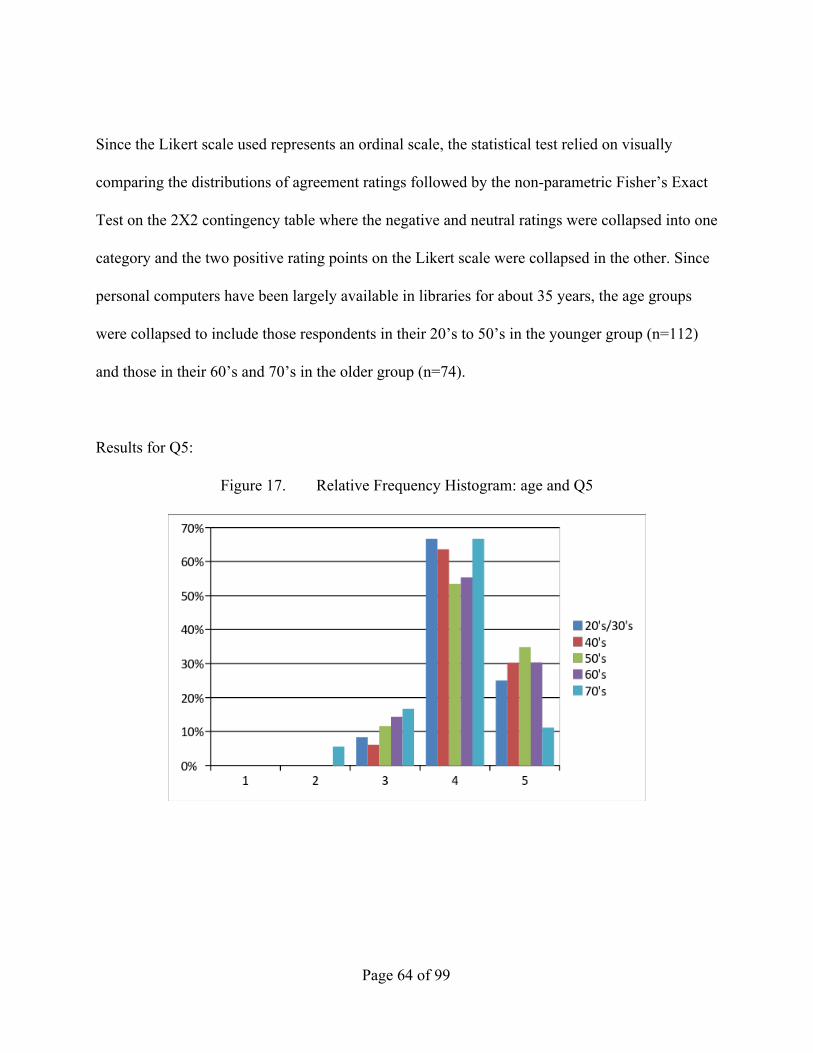
Since the Likert scale used represents an ordinal scale, the statistical test relied on visually
comparing the distributions of agreement ratings followed by the nonparametric Fisher’s Exact
Test on the 2X2 contingency table where the negative and neutral ratings were collapsed into one
category and the two positive rating points on the Likert scale were collapsed in the other. Since
personal computers have been largely available in libraries for about 35 years, the age groups
were collapsed to include those respondents in their 20’s to 50’s in the younger group (n=112)
and those in their 60’s and 70’s in the older group (n=74).
Results for Q5:
Figure 17. Relative Frequency Histogram: age and Q5
Page 64 of 99
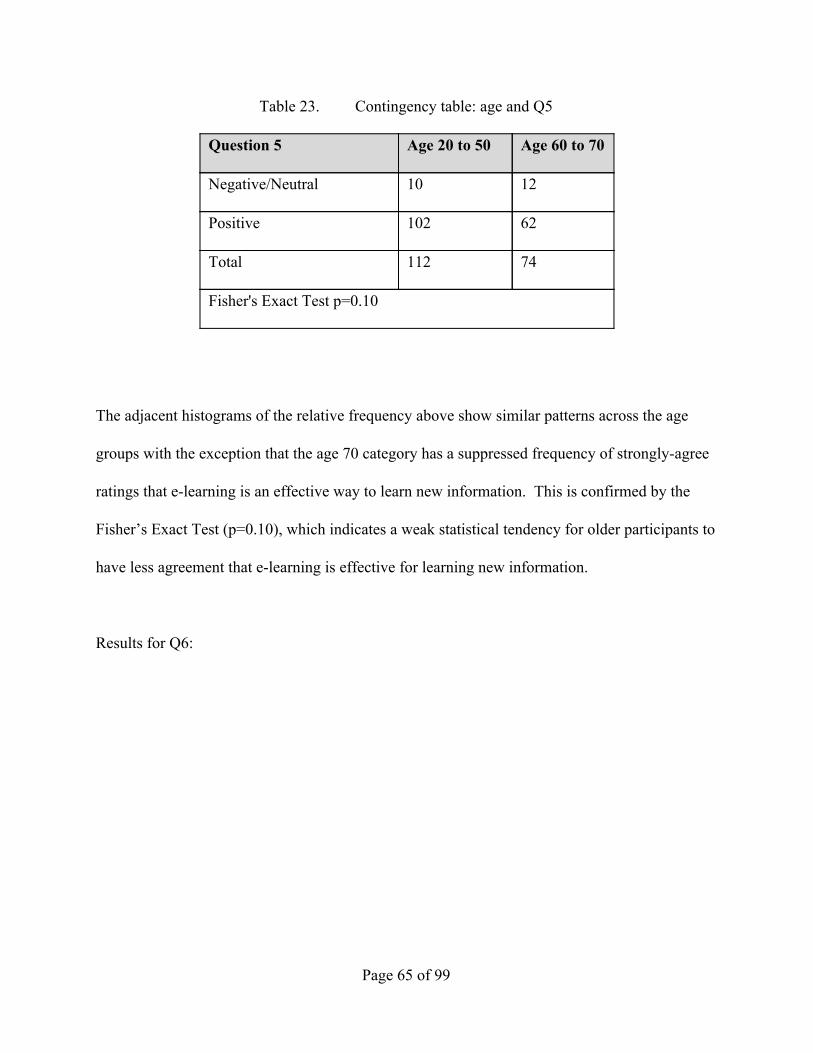
Table 23. Contingency table: age and Q5
Question 5 Age 20 to 50 Age 60 to 70
Negative/Neutral 10 12
Positive 102 62
Total 112 74
Fisher's Exact Test p=0.10
The adjacent histograms of the relative frequency above show similar patterns across the age
groups with the exception that the age 70 category has a suppressed frequency of stronglyagree
ratings that elearning is an effective way to learn new information. This is confirmed by the
Fisher’s Exact Test (p=0.10), which indicates a weak statistical tendency for older participants to
have less agreement that elearning is effective for learning new information.
Results for Q6:
Page 65 of 99

Figure 18. Relative Frequency Histogram: age and Q6
Table 24. Contingency table: age and Q6
Question 6 Age 20 to 50 Age 60 to 70
Negative/Neutral 16 9
Positive 96 65
Total 112 74
Fisher's Exact Test p=0.43
The adjacent histograms of the relative frequency above show a similar pattern of levels
agreement across all age categories that elearning modules are a valuable component in staff
training programs. This is confirmed by the Fisher’s Exact Test (p=0.43), which clearly
Page 66 of 99
indicates no statistical difference between agreement and disagreement or neutral according to
age.
Results for Q7:
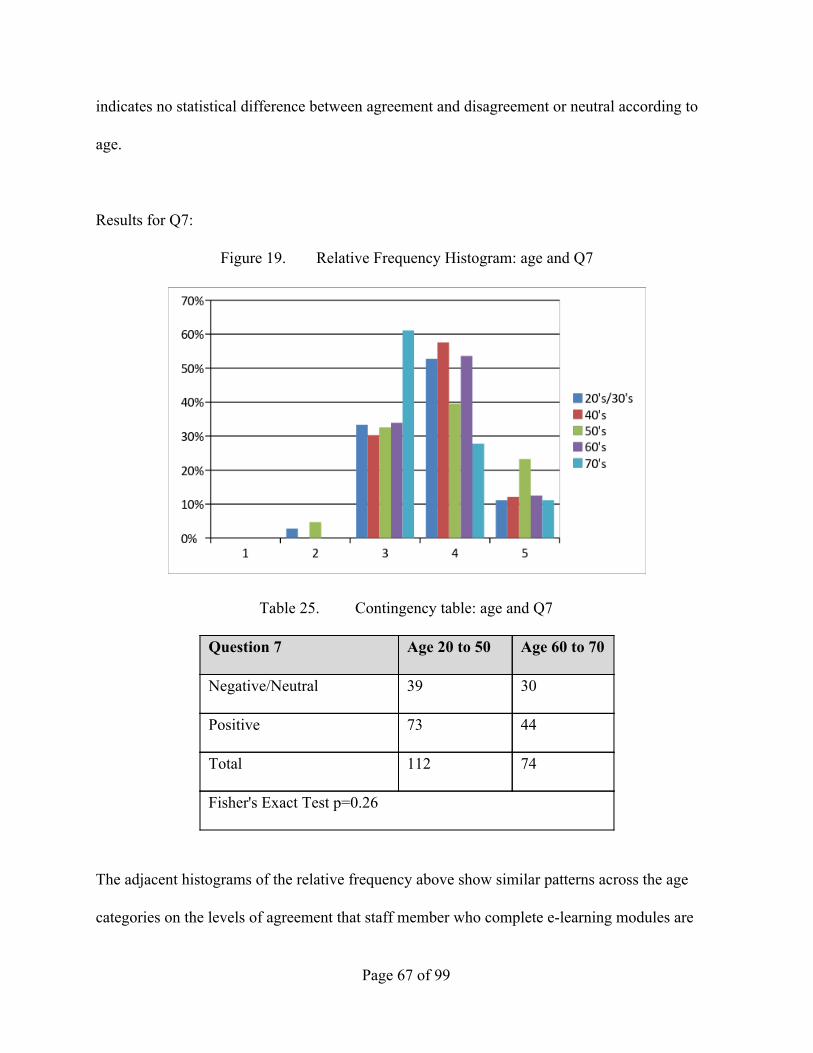
Figure 19. Relative Frequency Histogram: age and Q7
Table 25. Contingency table: age and Q7
Question 7 Age 20 to 50 Age 60 to 70
Negative/Neutral 39 30
Positive 73 44
Total 112 74
Fisher's Exact Test p=0.26
The adjacent histograms of the relative frequency above show similar patterns across the age
categories on the levels of agreement that staff member who complete elearning modules are
Page 67 of 99

well informed. This is confirmed by the Fisher’s Exact Test (p=0.26), which clearly indicates a
no statistical difference between agreement and disagreement or neutral according to the
respondent’s age.
Results for Q8:
Figure 20. Relative Frequency Histogram: age and Q8
Table 26. Contingency table: age and Q8
Question 8 Age 20 to 50 Age 60 to 70
Negative/Neutral 5 9
Positive 107 65
Total 112 74
Fisher's Exact Test p=0.05
Page 68 of 99

The adjacent histograms of the relative frequency above show a pattern that those in the older
age categories have lower levels of agreement that elearning modules provide a valuable
opportunity to learn on demand. This is confirmed by the Fisher’s Exact Test (p=0.05), which
indicates a strong statistical difference between agreement and disagreement or neutral according
to the respondent’s age.
The perceived effectiveness of elearning (PE) was significantly different depending on the age
of the survey respondent (Figure 21). We see a slight decline at the 4554 mark, followed by a
sharp decline at 5564.
Figure 21. Age and Average PE
Page 69 of 99

Users in the 6575 age group had a slightly lower opinion of elearning than their younger
counterparts (Table 27). When asked to rate their level of agreement with the statement
“Elearning in an effective way to learn new information,” users between ages 2564 had the
highest rating for the statement; users older than 65 and younger than 24 placed less value on the
effectiveness of elearning as a method of instruction.
Table 27. Age and average PE
Age Average Rating
2534 4.1143
3544 4.1591
4554 4.1802
5564 4.0893
6575 3.6842
Age was not a good predictor of previous completion of elearning; there was no correlation
between age and previous completion of elearning, as shown in Table 28.
Page 70 of 99

Table 28. Age and EL
Age Percentage who had previously completed an
elearning module
1824 100%
2534 83%
3544 97%
4554 77%
5564 73%
6575 84%
4.1.6 Results Summary
Based on the findings above, we can conclude the following:
Users who have previously completed an elearning module perceive elearning to be an
effective method of instruction. Users who have not previously completed an elearning
module may be hesitant to consider it an effective method of instruction. Experience with
elearning leads to positive opinions of its effectiveness.
Elearning may not have a positive effect on the perceived usefulness of technology.
Additional studies are needed.
Completion of an elearning module may not have a positive effect on the perceived ease
of use of technology. Additional studies are needed.
Page 71 of 99

The correlation between the perceived ease of use of technology and usage behavior may
not be affected by the completion of an elearning module. Additional studies are needed.
The correlation between the perceived usefulness of technology and usage behavior may
not be affected by the completion of an elearning module. Additional studies are needed.
The perceived effectiveness of elearning is not significantly different depending on the
gender of the staff members. Additional studies are needed.
The perceived effectiveness of elearning is different depending on the age of the staff
member; younger staff members are more likely to consider elearning to be an effective
instruction method.
4.2 PRACTICAL IMPLICATIONS AND RECOMMENDED BEST PRACTICES
This study demonstrates the impact of three factors on the effectiveness of elearning: previous
elearning experience, gender, and age. Only one of these factors, elearning experience, can be
easily manipulated; the others are relatively fixed and, for the practical purposes of this study,
will be considered unchangeable.
There are two significant findings of this study. The first, that prior elearning experience
increases the perceived effectiveness of elearning, provides practical advice for library
administrators; public library staff members who are hesitant to try elearning should be
encouraged and supported in their learning endeavors. These employees would then be more
confident in future elearning opportunities and would be more likely to perceive elearning in a
positive light. Previous studies have also suggested that requiring a basic computer literacy class
Page 72 of 99

prior to the beginning of any elearning modules would aid in the success of and satisfaction with
elearning modules (Sun et al, 2006). By increasing computer selfefficacy through traditional
learning methods, library staff may be more comfortable attempting elearning. Additional
studies to determine the effects of computer selfefficacy should be considered.
The second finding, that the age of the learner affects the perceived effectiveness of elearning,
also provides valuable information. As learning programs are designed and implemented, it is
important to understand the impact that perceived effectiveness of the learning method can have
on the learner. Those who are less likely to perceive that a specific instructional method, like
elearning, is effective may be resentful if all learning opportunities are shifted to a digital
platform. This finding encourages the offering of a multimodal training program for public
library staff.
In regards to the factors of age and gender, however, one must consider the social and
organizational structure that is affecting these results. Jeske et al (2012) recommend that
organizations create a learning culture that is more social to appeal to older workers who may be
uncomfortable with the technological nature of elearning. Also, as younger workers age, “older
workers” will no longer be those who may not have experience with elearning; there may be a
new technological innovation to consider. By fostering a positive, inclusive environment where
the experience and knowledge of the older worker is highlighted (instead of focusing on any lack
of technical acumen), older workers may become more comfortable with the concept of new
learning techniques like elearning.
Page 73 of 99

This fostering of a positive, inclusive learning culture could also impact women’s perspective of
elearning. If the social constructs surrounding elearning are changed for example, if there are
more female instructional designers or female characters in elearning modules then perhaps
women would feel more comfortable accepting elearning. These additional factors could be
studied in future research models to determine their impact on gender and the perception of
elearning.
4.3 OPPORTUNITIES FOR FUTURE STUDIES
Additional studies may want to extend the work of previous researchers and this model to
conduct future studies related to public libraries. Findings related to the user’s computer
selfefficacy, instructional design, and organizational support would provide valuable insight for
public library administrators. In addition, several social factors, like gender identity and the
increase of women in technological fields, may affect the findings of this study. Future studies
that more closely research the impact that these two social factors may have on elearning and
technology adoption would enhance this study’s results.
In addition, it can be assumed that there is a bias in the delivery of this survey that would impact
findings: since the survey was delivered electronically, users who responded may be more likely
to have experience with technology and may be more technologically comfortable, affecting the
results and skewing the data in a protechnology slant. Future studies should examine user
Page 74 of 99
motivation, technology selfefficacy, and computer anxiety as potential factors and should be
delivered via nonelectronic methods to eliminate this possible bias.
GENDER IDENTITY
Social and psychological constructs of gender have not been studied in the context of elearning
and its impact on technology adoption and innovation diffusion. While researchers can say that
women are influenced by certain factors and men by others, no studies have been done to
determine how those employees who identify as transgender, genderqueer, intersex or a
nonbinary gender may be influenced during the technology adoption process. This presents an
opportunity for researchers to conduct future studies, especially considering American libraries’
dedication to employing LGBTQ library staff and providing services and collections for
regardless of sex, gender identity, gender expression, and sexual orientation (American Library
Association, 2010).
INCREASING NUMBER OF WOMEN IN STEM ROLES
As women continue to increase their professional presence in STEM (science, technology,
engineering, and math) fields, it is likely that the subjective norm that had previously impacted
women’s acceptance of technology would normalize and more closely match their male
counterparts. Repeating previous studies with a group of female scientists, for example, may
yield very different results. Comparing these new results with the previous studies’ data to
determine how subjective norms have changed over the years would be a useful study.
Page 75 of 99
In addition, because several portions of our results were only partially explored, future studies
could determine what impact elearning has on certain constructs, like perceived usefulness of
technology and the perceived ease of use of technology. Additional factors, like training
effectiveness and organizational support, can be introduced into this model to determine if these
have any impact on PU and PEU. Finally, determining what factors impact the effect of
elearning on usage behavior could yield useful results for instructional designers and change
agents.
5. CONCLUSION
Virtually no research exists that has tested the impact of training of public library employees on
technology acceptance. This study is an attempt to understand the impact of elearning on the
technology acceptance rates of public library staff, with an intention to develop best practices
and guidelines in curriculum development and training delivery.
This study has identified two unique findings:
If a staff member in a public library has completed an elearning module, they are more
likely to consider it a valuable instructional method.
Older staff members in public libraries are generally less likely to perceive elearning as
effective, valid, and useful instructional tools.
Page 76 of 99

By bringing Davis’s Technology Acceptance Model into the realm of public libraries, we can
explore the factors and characteristics that affect technology acceptance at a time when
technology adoption is critical to the ongoing success of these community anchors. Future
studies that extend the research conducted here will be very valuable as public library staff
continue to offer new, innovative programs and services to meet the needs of the public.
Page 77 of 99
APPENDIX A. ONLINE SURVEY INVITATION EMAILS
Page 78 of 99

APPENDIX B. SURVEY INVITATION EMAIL AND DESTINATIONS
Destination/List Description Date Sent
[email protected] Mailing list administered by the Georgia Public Library Service; includes all public library directors in Georgia
June 10, 2016
[email protected] Mailing list administered by the Georgia Public Library Service; includes technology support personnel in public libraries
June 13, 2016
TLA[email protected] Mailing list administered by the University of TennesseeKnoxville; includes members of the Tennessee Library Association
June 13, 2016
[email protected] Open mailing list; administered by the American Library Association of all current and former members of the Learning Round Table
June 14, 2016
Page 79 of 99

APPENDIX C. INFORMED CONSENT AGREEMENT
Figure (#). Page 1 of Informed Consent Agreement
Page 80 of 99

Figure (#). Page 2 of Informed Consent Agreement.
Page 81 of 99

APPENDIX D. PARTICIPANT ONLINE SURVEY QUESTIONS
Thank you for participating in this survey. Please take a few moments to answer some questions
related to your experiences and perceptions of elearning.
1. I work in a public library. a. True b. False
2. I have previously completed an elearning module for professional development.
a. True b. False
3. Your age:
a. < 18 b. 1824 c. 2534 d. 3544 e. 4554 f. 5564 g. 6575 h. > 75 i. Decline to answer
4. Your gender:
a. Male b. Female c. Decline to answer
5. Elearning is an effective way to learn new information.
a. Strongly agree b. Agree c. Neutral d. Somewhat disagree e. Strongly disagree f. Decline to answer
6. Elearning modules are a valuable component in staff training programs.
a. Strongly agree b. Agree c. Neutral
Page 82 of 99

d. Somewhat disagree e. Strongly disagree f. Decline to answer
7. Staff members who complete elearning modules are wellinformed.
a. Strongly agree b. Agree c. Neutral d. Somewhat disagree e. Strongly disagree f. Decline to answer
8. Elearning provides a valuable opportunity to learn ondemand.
a. Strongly agree b. Agree c. Neutral d. Somewhat disagree e. Strongly disagree f. Decline to answer
9. Understanding the importance of new technology is easier if I have access to an
elearning module. a. Strongly agree b. Agree c. Neutral d. Somewhat disagree e. Strongly disagree f. Decline to answer
10. Completing an elearning module could help me understand why new technology is being
implemented in the library. a. Strongly agree b. Agree c. Neutral d. Somewhat disagree e. Strongly disagree f. Decline to answer
11. Elearning modules are effective ways to learn how to use technology tools in libraries.
a. Strongly agree b. Agree c. Neutral d. Somewhat disagree e. Strongly disagree f. Decline to answer
Page 83 of 99

12. Learning about new devices and technologies is easier through elearning than through
other instructional methods, like facetoface classes or handson workshops. a. Strongly agree b. Agree c. Neutral d. Somewhat disagree e. Strongly disagree f. Decline to answer
13. After completing an elearning module about new technology, it is likely that staff would
feel confident using it in the library. a. Strongly agree b. Agree c. Neutral d. Somewhat disagree e. Strongly disagree f. Decline to answer
14. After completing an elearning module about new technology, it is likely that staff would
feel confident sharing their knowledge with others. a. Strongly agree b. Agree c. Neutral d. Somewhat disagree e. Strongly disagree f. Decline to answer
Page 84 of 99
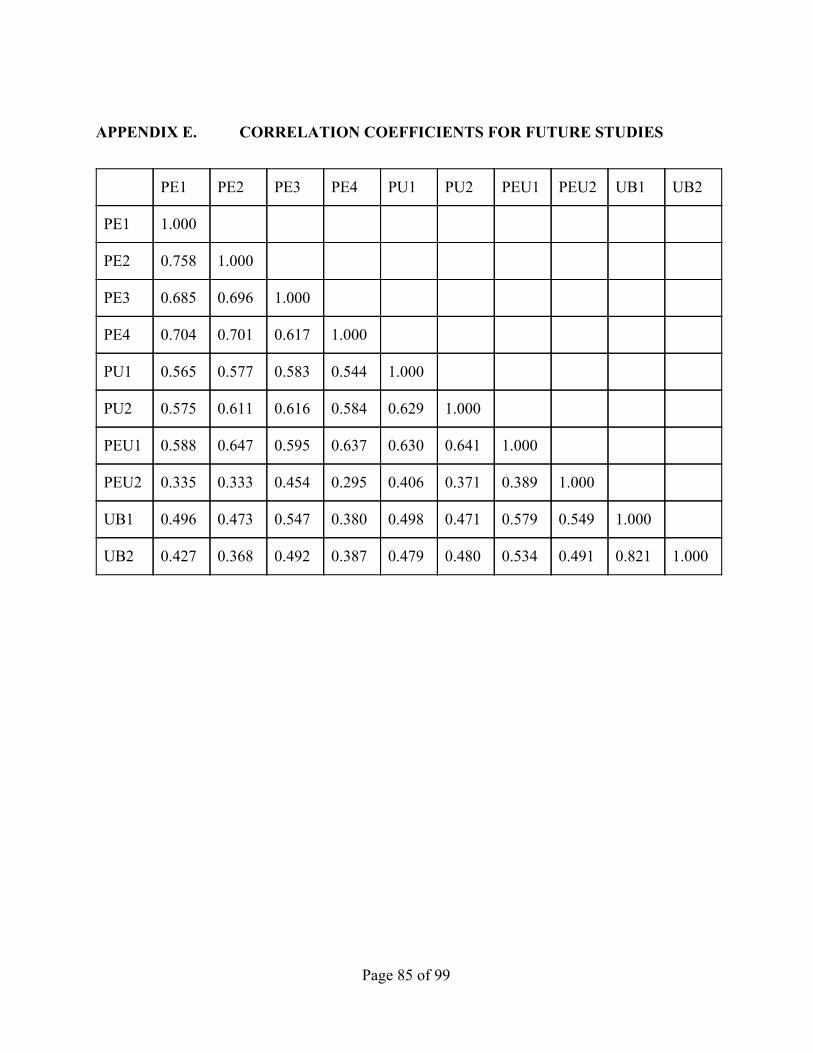
APPENDIX E. CORRELATION COEFFICIENTS FOR FUTURE STUDIES
PE1 PE2 PE3 PE4 PU1 PU2 PEU1 PEU2 UB1 UB2
PE1 1.000
PE2 0.758 1.000
PE3 0.685 0.696 1.000
PE4 0.704 0.701 0.617 1.000
PU1 0.565 0.577 0.583 0.544 1.000
PU2 0.575 0.611 0.616 0.584 0.629 1.000
PEU1 0.588 0.647 0.595 0.637 0.630 0.641 1.000
PEU2 0.335 0.333 0.454 0.295 0.406 0.371 0.389 1.000
UB1 0.496 0.473 0.547 0.380 0.498 0.471 0.579 0.549 1.000
UB2 0.427 0.368 0.492 0.387 0.479 0.480 0.534 0.491 0.821 1.000
Page 85 of 99
REFERENCES
Ahmad, M. A., & Tarmudi, S. M. (2012). Generational Differences in Satisfaction with
ELearning among Higher Learning Institution Staff. Procedia Social And Behavioral Sciences,
67 (3rd INTERNATIONAL CONFERENCE ON ELEARNING, ICEL 2011), 304311.
doi:10.1016/j.sbspro.2012.11.333
AlaMutka, K., Punie, Y., & Redecker, C. (2008). Digital competence for lifelong learning.
Institute for Prospective Technological Studies (IPTS), European Commission, Joint Research
Centre. Technical Note: JRC, 48708, 271282.
American Library Association. (2010). B.2.1.15 Access to Library Resources and Services
Regardless of Sex, Gender Identity, Gender Expression, or Sexual Orientation. Policy Manual.
Retrieved July 7, 2016 from
http://www.ala.org/aboutala/governance/policymanual/updatedpolicymanual/section2/53intellfre
edom#B.2.1.15.
AmoakoGyampah, K., & Salam, A. (2003). An extension of the technology acceptance model
in an ERP implementation environment. Information & Management, (41), 731745. Retrieved
December 1, 2014, from
Page 86 of 99

https://www.researchgate.net/publication/222687128_An_extension_of_the_technology_accepta
nce_model_in_an_ERP_implementation_environment
Arthur Jr, W., Bennett Jr, W., Edens, P. S., & Bell, S. T. (2003). Effectiveness of training in
organizations: a metaanalysis of design and evaluation features. Journal of Applied psychology,
88(2), 234.
Attwell, G. (2007). Web 2.0 and the changing ways we are using computers for learning: what
are the implications for pedagogy and curriculum. European Union.
Bellou, V., & Chatzinikou, I. (2015). Preventing employee burnout during episodic
organizational changes. Journal Of Organizational Change Management, 28(5), 673688.
Bertot, J. C., Jaeger, P. T., & McClure, C. R. (2011). Public libraries and the Internet: Roles,
perspectives, and implications. Santa Barbara, CA: Libraries Unlimited.
Black, S. E., & Lynch, L. M. (2001). How to compete: the impact of workplace practices and
information technology on productivity. Review of Economics and statistics, 83(3), 434445.
Blowers, H., & Reed, L. (2007). The C's of Our Sea Change: Plans for Training Staff, from Core
Competencies to Learning 2.0. Computers in Libraries, 27(2), 1015.
Page 87 of 99

Boothby, D., Dufour, A., & Tang, J. (2010). Technology adoption, training and productivity
performance. Research Policy, 39(5), 650661.
Butler, D. L., & Sellbom, M. (2002). Barriers to adopting technology. Educause Quarterly, 2,
2228.
Carliner, S., & Shank, P. (Eds.). (2008). The elearning handbook: past promises, present
challenges. John Wiley & Sons.
Carroll, S. J., Paine, F. T., & Ivancevich, J. J. (1972). The relative effectiveness of training
methods—expert opinion and research. Personnel Psychology, 25(3), 495509.
Casey, M. E., & Savastinuk, L. C. (2006). Service for the nextgeneration library. Library
Journal, 131(1), 4042.
Caudill, J. (2015). Employee motivations for workplace learning and the role of elearning in the
workplace. Internet Learning, 4(2).
Cheng, B., Wang, M., Moormann, J., Olaniran, B. A., & Chen, N. (2012). The effects of
organizational learning environment factors on elearning acceptance. Computers & Education,
58, 885899. doi:10.1016/j.compedu.2011.10.014.
Page 88 of 99

Cheng, B., Wang, M., Yang S., & Kinshuk, P. (2011). Acceptance of competencybased
workplace elearning systems: effects of individual and peer learning support. Computers &
Education, 57(1), 13171333.
Chief Officers of State Library Agencies (COSLA). (2014). 2014 Continuing Education State
Reports. Retrieved 7/14/16 from
http://www.cosla.org/documents/2014_CE_State_Reports436.pdf
Chief Officers of State Library Agencies (COSLA). (2015). 2015 Continuing Education State
Reports. Retrieved 7/14/16 from http://www.cosla.org/documents/2015_CE_State_Reports.pdf.
Chuttur, M. Yasser. (2009). “Overview of the Technology Acceptance Model: Origins,
Developments, and Future Directions,” Indiana University, USA. Sprouts: Working Papers on
Information Systems, 9(37). Retrieved November 21, 2014 from
http://sprouts.aisnet.org/785/1/TAMReview.pdf
Conley, L. (2010, January 1). Barriers to Integrating Technology The Digital Librarian.
Retrieved December 6, 2014, from
https://sites.google.com/site/thedigitallibrarian/barrierstointegratingtechnology
Czaja, S. J., Charness, N., Fisk, A. D., Hertzog, C., Nair, S. N., Rogers, W. A., & Sharit, J.
(2006). Factors predicting the use of technology: findings from the Center for Research and
Page 89 of 99

Education on Aging and Technology Enhancement (CREATE). Psychology and aging, 21(2),
333.
Davis, Fred D. (1989). Usefulness, Perceived Ease of Use, and User Acceptance of Information
Technology. MIS Quarterly, 3(14), 319340.
Decman, M. (2015). Modeling the acceptance of elearning in mandatory environments of higher
education: The influence of previous education and gender. Computers In Human Behavior, 272.
doi:10.1016/j.chb.2015.03.022
Dent, E. B., & Goldberg, S. G. (1999). Challenging “resistance to change”. The Journal of
Applied Behavioral Science, 35(1), 2541.
Dunlap, J. C., & Lowenthal, P. R. (2013). Learning, Unlearning, and Relearning: Using Web 2.0
Technologies to Support the Development of Lifelong Learning Skills. IT Policy and Ethics:
Concepts, Methodologies, Tools, and Applications: Concepts, Methodologies, Tools, and
Applications, 170.
Fuller, R. M., Vician, C., & Brown, S. A. (2006). Elearning and individual characteristics: The
role of computer anxiety and communication apprehension. Journal of Computer Information
Systems, 46(4), 103115.
Page 90 of 99

Gallego, M. Dolores , Bueno, S., José Racero, F., & Noyes, J. (2015). Open source software: The
effects of training on acceptance. Computers In Human Behavior, (49) 390399.
doi:10.1016/j.chb.2015.03.029
Hameed, M. A., & Counsell, S. (2014). User Acceptance Determinants of Information
Technology Innovation in Organizations. International Journal Of Innovation & Technology
Management, 11(5), 1. doi:10.1142/S0219877014500333
Harhai, M., & Krueger, J. (2016). Competencybased Professional Development. Journal of
Library Administration, 118.
Hayes, J. (2014). The theory and practice of change management. Palgrave Macmillan.
Hickman, J. M., Rogers, W. A., & Fisk, A. D. (2007). Training older adults to use new
technology. The Journals of Gerontology Series B: Psychological Sciences and Social Sciences,
62(Special Issue 1), 7784.
Hoffman, Judy, John Carlo Bertot, and Denise M. Davis. (2012). Libraries Connect
Communities: Public Library Funding & Technology Access Study 20112012. Digital
supplement of American Libraries magazine, June 2012. Available at
http://viewer.zmags.com/publication/4673a369.
Page 91 of 99

Horrigan, J. B. (2016). “Lifelong learning and technology.” Pew Research Center.
Huggett, C. (2014). Make virtual training a success. T+D, 68(1), 4045.
Huprich, Julia. (2016). 2016 Library CE Needs Assessment. In press.
Huprich, Julia. (2016). BiteSized Staff Training: Transform Staff Development for Busy
Employees. Presented at the Public Library Association Conference, April 2016.
Igbaria, M., Zinatelli, N., Cragg, P., & Cavaye, A. M. (1997). Personal Computing Acceptance
Factors in Small Firms: A Structural Equation Model. MIS Quarterly, 21(3), 279305.
Jeske, Deborah & StamovRosnagel, Christian. (2012). Success by inclusion: “Agefair”
elearning practices. Organizational Dynamics; 41, 302307.
Jiao, H. & Zhao, G. (2013). When will employees embrace managers’ technological
innovations? The mediating effects of employees’ perceptions of fairness on their willingness to
accept change and its legitimacy. Journal of Product Innovation Management, 2014; 31(4),
780798.
Jones, G. R. (2010). Organizational theory, design, and change. Upper Saddle River: Pearson.
Page 92 of 99
Keen, P. G. (1981). Information systems and organizational change.Communications of the
ACM, 24(1), 2433.
Khan, Muhammad Ikhlas. (2012). The Impact of Training and Motivation on Performance of
Employees. IBA Business Review, 7(2), 8495.
King, W. R., & He, J. (2006). A metaanalysis of the technology acceptance model. Information
& Management, 43, 740755.
Klein, H. J., Noe, R., & Wang, C. (2006). Motivation to learn and course outcomes: the impact
of delivery mode, learning goal orientation, and perceived barriers and enablers. Personnel
Psychology, 59, 665702.
Knox, K. C. (2011). Implementing technology solutions in libraries: Techniques, tools, and tips
from the trenches. Medford, NJ: Information Today.
Koerber, J. (2015). Manage the device deluge: create an effective program to train staff to teach
tech to the public in a time of rapid change and gadget proliferation. Library Journal, (9). 28.
Koh, K., & Abbas, J. (2015). Competencies for information professionals in learning labs and
makerspaces. Journal of Education for Library and Information Science, 56(2), 114.
Page 93 of 99

Kruger, K. (2000). Using information technology to create communities of learners. New
directions for higher education, 2000(109), 5970.
Laguna, K., & Babcock, R. L. (1997). Computer anxiety in young and older adults: Implications
for humancomputer interactions in older populations.Computers in human behavior, 13(3),
317326.
Lee, Y., Hsieh, Y., & Chen, Y. (2013). An investigation of employees' use of elearning systems:
applying the technology acceptance model. Behaviour & Information Technology, 32(2),
173189.
Legris, P., Ingham, J., & Collerette, P. (2003). Why do people use information technology? A
critical review of the technology acceptance model. Information & Management, 40(3), 191204.
Liaw, S. S., & Huang, H. M. (2013). Perceived satisfaction, perceived usefulness and interactive
learning environments as predictors to selfregulation in elearning environments. Computers &
Education, 60(1), 1424.
Libraries Connect Communities: Public Library Funding & Technology Access Study,
20062007. American Library Association, 2007.
Page 94 of 99

Libraries Connect Communities: Public Library Funding & Technology Access Study,
20112012. American Library Association, 2012.
McKay, E., & Vilela, C. (2011). Corporate sector practice informs online workforce training for
Australian government agencies: towards effective educationallearning systems design.
Australian Journal of Adult Learning, 51(2).
Meyer, J. (2011). Workforce age and technology adoption in small and mediumsized service
firms. Small Business Economics, 37(3), 305324.
Morris, M. G., & Venkatesh, V. (2000). Age differences in technology adoption decisions:
Implications for a changing work force. Personnel psychology, 53(2), 375403.
Morris, M. G., Venkatesh, V., & Ackerman, P. L. (2005). Gender and age differences in
employee decisions about new technology: An extension to the theory of planned behavior. IEEE
transactions on engineering management,52(1), 6984.
Ong, C. S., & Lai, J. Y. (2006). Gender differences in perceptions and relationships among
dominants of elearning acceptance. Computers in human behavior, 22(5), 816829.
Palmour, V. E. (1980). A Planning Process for Public Libraries.
Page 95 of 99

Park, Y., Son, H., & Kim, C. (2011). Investigating the determinants of construction
professionals’ acceptance of webbased training: an extension of the technology adoption model.
Automation in Construction, 22, 377386.
Plett, P. C., Lester, B. T., & Yocum, K. L. (1991). Training for older people: a handbook.
International Labour Organization.
Putnam, L. L. (2016). Library 2.015 Conference: An Open Dialog About the Future of Libraries.
International Information & Library Review, 48(1), 6365.
Riddell, W. C., & Song, X. (2012). The role of education in technology use and adoption:
Evidence from the Canadian workplace and employee survey.
Ross, L., & Sennyey, P. (2008). The library is dead, long live the library! The practice of
academic librarianship and the digital revolution. The Journal of Academic Librarianship, 34(2),
145152.
Rousseau, D. M., & Tijoriwala, S. A. (1999). What's a Good Reason to Change? Motivated
Reasoning and Social Accounts in Promoting Organizational Change. Journal Of Applied
Psychology, 84(4), 514528.
Page 96 of 99
Scott, J. E. (2008). Technology Acceptance and ERP Documentation Usability. Communications
Of The ACM, 51(11), 121. doi:10.1145/1400214.1400239
Spacey, R., Goulding, A., & Murray, I. (2003). ICT and change in UK public libraries: does
training matter?. Library Management, 24(1/2), 6169.
Stanleigh, M. (2008). Effecting successful change management initiatives.Industrial and
commercial training, 40(1), 3437.
Sterns, H. L., & Doverspike, D. (1989). Aging and the training and learning process.
Straub, E. T. (2009). Understanding technology adoption: Theory and future directions for
informal learning. Review of educational research, 79(2), 625649.
Sun, P. C., Tsai, R. J., Finger, G., Chen, Y. Y., & Yeh, D. (2008). What drives a successful
eLearning? An empirical investigation of the critical factors influencing learner satisfaction.
Computers & education, 50(4), 11831202.
Sung, S. & Choi, J. (2014). Do organizations spend wisely on employees? Effects of training and
development investments on learning and innovation in organizations. Journal of Organizational
Behavior, 35, p. 393412.
Page 97 of 99

Tarhini, A., Hone, K., & Liu, X. (2014). Measuring the Moderating Effect of Gender and Age on
ELearning Acceptance in England: A Structural Equation Modeling Approach for an Extended
Technology Acceptance Model. Journal Of Educational Computing Research, 51(2), 163184.
Thatcher, J. B., & Perrewe, P. L. (2002). An empirical examination of individual traits as
antecedents to computer anxiety and computer selfefficacy. MIS Quarterly, 381396.
TylerSmith, K. (2006). Early attrition among first time eLearners: A review of factors that
contribute to dropout, withdrawal and noncompletion rates of adult learners undertaking
eLearning programmes. Journal of Online learning and Teaching, 2(2), 7385.
"United States Corporate Training Market 20152019 Growing Adoption of Elearning
Training Solutions." PR Newswire US 15 Sept. 2015:Newswires. Web. 4 June 2016.
Varnum, K. J. (2014). The top technologies every librarian needs to know: LITA guide. London:
Facet.
Venkatesh, V., & Davis, F. D. (2000). A Theoretical Extension of the Technology Acceptance
Model: Four Longitudinal Field Studies. Management Science, (2). 186204.
Page 98 of 99

Venkatesh, V., & Morris, M. G. (2000). Why don't men ever stop to ask for directions? Gender,
social influence, and their role in technology acceptance and usage behavior. MIS quarterly,
115139.
Venkatesh, V., Morris, M. G., & Ackerman, P. L. (2000). A longitudinal field investigation of
gender differences in individual technology adoption decisionmaking processes. Organizational
behavior and human decision processes,83(1), 3360.
Waddoups, C. J. (2016). Did Employers in the United States Back Away from Skills Training
during the Early 2000s?. Industrial & Labor Relations Review, 69(2), 405434.
doi:10.1177/0019793915619904
Watkins, K. E., & Marsick, V. J. (1993). Sculpting the learning organization: Lessons in the art
and science of systemic change. JosseyBass Inc., 350 Sansome Street, San Francisco, CA
941041310.
Weick, K. E., & Quinn, R. E. (1999). Organizational change and development. Annual review of
psychology, 50(1), 361386.
Zickuhr, K., Rainie, L., & Purcell, K. (2013). Library Services in the Digital Age. Pew Internet
& American Life Project.
Page 99 of 99