perceptions about physical activity and its associated
TRANSCRIPT
Perceptions about physical activity and its associated benefits among
employees
Case Study in 12 Multinational Companies in Pakistan
Farrukh Feroze
University of Jyväskylä
Faculty of Sport and Health Sciences
Master’s Thesis in Social Sciences of Sport
Autumn 2016

UNIVERSITY OF JYVÄSKYLÄ
Department of Sport Sciences/Faculty of Sport and Health Sciences
FEROZE, FARRUKH:
Perceptions about physical activity and its associated benefits among employees
Case Study in 12 Multinational Companies in Pakistan
ABSTRACT
Master’s Thesis, 78 pages, 5 appendix pages
MDP in Social Sciences of Sports
2016
-------------------------------------------------------------------------------------------------------------
This thesis focus on the perceptions of the employees working in Multinational
Corporations (MNCs) in Pakistan, with regards to their physical activity and its associated
benefits. Previous research has shown that physical activity is positively associated with
on-job productivity and life satisfaction of the employees across the world. With no such
research being carried out in Pakistan before, this thesis aims to focus on the same factors,
but uses employees’ perceptions rather than employing an intervention study. Furthermore
associated benefits of physical activity such as reduced healthcare cost, decrease in
exposure to various heath-risks and reduced presenteeism were also addressed within the
scope of this thesis. An attempt was made to use recalled levels of physical activity to
check whether the benefits associated with physical activity can be observed within the
target audience as well or not.
In order to collect relevant data, an e-questionnaire was utilized and sent out to relevant
Human Resources departments of the MNCs operating in Pakistan. After completing the
analysis on the collected data, this study found out that employees working in MNCs
operating in Pakistan did positively associate physical activity with their on-job
productivity and life satisfaction. Though it was noted that the duration of the recalled
level of physical activity did not have an impact on the presenteeism cost and the number
of health risks that the employees were exposed. In addition to that it was observed that
obesity was a bigger issue in the younger employees and was the most frequently reported
health risk by the employees. Furthermore, presenteeism costs were higher for employees
who reported being obese as compared to those employees who did not report being obese.
If the employers implement the findings of this thesis, it can help reduce presenteeism
costs and therefore help in increasing the productivity of their workforce. Trying to
physically activate the workforce can help improve job and life satisfaction of the
employees.
Keywords: physical activity, work productivity, life satisfaction, Pakistan, multinational
corporations
TABLE OF CONTENTS
ABSTRACT..........................................................................................................................2
1 INTRODUCTION....................................................................................................8
2 THE PAKISTANI SOCIETY AND PHYSICAL ACTIVITY: HISTORICAL,
CULTURAL AND POLITICAL CONTEXT…………………………..………11
2.1 Political Culture in Pakistan………………………………………….……12
2.2 Average Pakistani and the Middle class……………………….…………..13
2.3 Physical activity culture in Pakistan……………………………………….15
2.4 Physical activity culture in MNCs operating in Pakistan………………….17
3 PHYSICAL ACTIVITY IN A GLOBAL PERSPECTIVE……………………20
3.1 Physical activity and health promotion in the world today………………..20
3.2 PA and Health enhancing physical activity: Why the need? ......................22
3.3 International health promotion programs………………………………….25
3.4 Theoretical Framework……………………………………………………29
4 RESEARCH DESIGN AND METHODOLOGY………………………………32
4.1 Research question.........................................................................................32
4.2 Research method..........................................................................................33
4.3 Data Collection.............................................................................................34
4.4 Data Anaylsis...............................................................................................37

5 RESULTS………………………………………………………………………....43
5.1 Association between perceived PA and employee productivity…………..43
5.2 Association between perceived PA and life satisfaction…………………..44
5.3 Association between life satisfaction and employee productivity …….………..45
5.4 Perceived impact of PA on employee productivity and recalled PA……...47
5.5 Impact of age on perceived physical exertion levels………………………49
5.6 Impact of physical inactivity on exposure to relevant health risks………..51
5.7 Impact of age on reported obesity…………………………………………53
5.8 Impact of physical inactivity on annual health expenditure……………….55
5.9 Role of PA in presenteeism cost…………………………………………..56
5.10 Role of obesity in presenteeism…………………………………………...58
6 DISCUSSION & CONCLUSION……………………………….………………60
6.1 Dilemma of PA in Pakistan…..……………………………………………60
6.2 Issues with recalled data …………..……………………………………....61
6.3 The menace of obesity …………..………………………………………...62
6.4 Avoiding presenteeism and the social stigma associated with absenteeism
……………………………………………………………………………..64
6.5 Limitations of this Research and Recommended future Research ………..65
REFERENCES…………………………………………………………………………...67
APPENDICES……………………………………………………………………………74

LIST OF TABLES
Table 1 Prevalence of CAD and common risk factors for NCDs in Pakistan
Table 2 Examples of moderate and vigorous intensity activities
Table 3 Characteristics and Results of Worksite Wellness Programs studied
Table 4 Criteria for Choosing Statistical Tests
Table 5 Items measuring perceived employee productivity and life satisfaction
Table 6 Detailed data analysis
Table 7 Descriptive statistics for variable measuring association between perceived
PA and employee life satisfaction
Table 8 Correlation results between employee productivity and life satisfaction
Table 9 One-way ANOVA results comparing different levels of recalled PA
Table 10 Pearson correlation results for Age of respondent against perceived level of
physical exertion
Table 11 One-way ANOVA for number of health risks respondents exposed to
depending on recalled PA levels
Table 12 Independent sample t-test results to compare mean age of obese and not-
obese employees
Table 13 Pearson Chi-square test results for duration of PA against change in
healthcare costs for employees (N=67) …
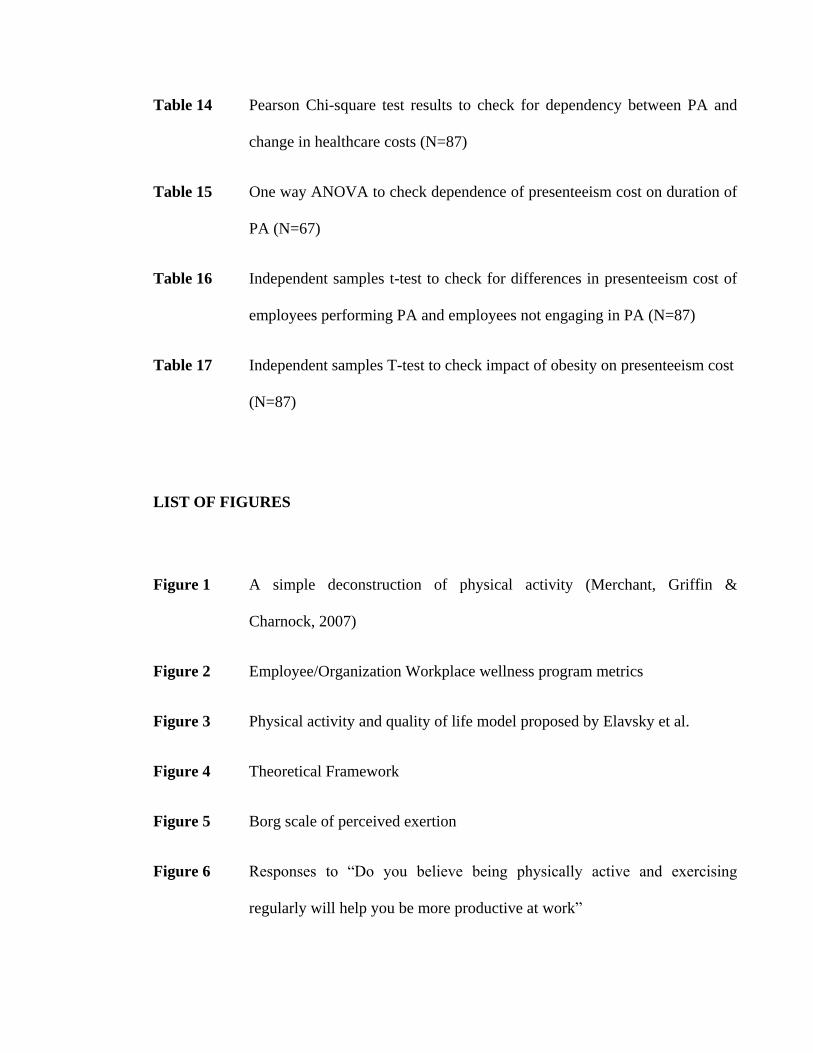
Table 14 Pearson Chi-square test results to check for dependency between PA and
change in healthcare costs (N=87)
Table 15 One way ANOVA to check dependence of presenteeism cost on duration of
PA (N=67)
Table 16 Independent samples t-test to check for differences in presenteeism cost of
employees performing PA and employees not engaging in PA (N=87)
Table 17 Independent samples T-test to check impact of obesity on presenteeism cost
(N=87)
LIST OF FIGURES
Figure 1 A simple deconstruction of physical activity (Merchant, Griffin &
Charnock, 2007)
Figure 2 Employee/Organization Workplace wellness program metrics
Figure 3 Physical activity and quality of life model proposed by Elavsky et al.
Figure 4 Theoretical Framework
Figure 5 Borg scale of perceived exertion
Figure 6 Responses to “Do you believe being physically active and exercising
regularly will help you be more productive at work”

Figure 7 Scatter plot for perceived employee productivity in relation to PA versus
perceived life satisfaction in relation to PA
Figure 8 Trend-line showing mean values of variable for perceived PA in relation to
employee productivity against time spent on PA per week
Figure 9 Scatterplot along with trend line showing negative relationship between age
and perceived level of physical exertion
Figure 10 Scatter-plot displaying negative relationship between mean numbers of
health risks employees are exposed in relation to recalled PA levels
1 INTRODUCTION
Physical activity (PA) is nowadays widely recognized as a practical tool in the domain of
health promotion. In the developed world the impact physical activity has on the lives of
individuals and society as a whole has been well researched now. However, due to the
technological advances over the years lifestyle in the western world has tended to move
towards a more sedentary one and steps are taken on a regular basis to improve the
situation and to keep the society more active as a whole (Ten key facts on physical activity
in the WHO European Region, 2016). It is a well-researched fact that PA is positively
associated with an individual’s day to day performance. It allows an individual to feel
more active and positively impact his or her efficiency (Berry, Mirabito, & Baun, 2010).
Numerous researches in Europe and North America have also pointed out the impact that
PA has on productivity of the employees at the workplace. The idea of life satisfaction or
quality of life is something that has been researched for workplace wellness program when
it comes to identify the reasons impacting employees’ on-job performance. Unfortunately
the concept of PA and its association with employee productivity and life satisfaction is
something that is not well researched in the developing part of the world. Employee
productivity is critical to the success of any organization. In any organization employee
productivity is defined as the output per worker or output per hour. Though due to the
prevalence of part-time jobs companies focus more on the output per working hour
definition of employee productivity. (Chron, 2016.) In this thesis employee productivity
will be perceived in a similar manner but in a more qualitative way. Knowing that the
target audience is not directly involved in producing any tangible output, it is difficult to
measure their productivity using the same definition of output per working hour.
Being from a developing country like Pakistan myself I felt it was important to take the
first step so as to bring the truth about PA out in the open. Rather than going for a mass
target group so as to generalize the situation of PA in the entire country, I decided to go
with a more thoughtful and practical approach. The aim here is to get some relevant output
from the research so that other researchers may be tempted to take a look within this

9
domain for a Pakistani setting. Rather than the entire Pakistani society a certain spectrum
of the society was identified for the research. Being a part of a multinational organization
myself, I decided to focus on the employees who work in a similar setting within Pakistan.
Knowing that sedentary lifestyle is more prevalent in desk jobs where there is not much
PA involved in the daily routine, white collar employees were targeted for this research.
Due to geographical and financial constraints it was difficult to perform a controlled study
on how PA impact employee productivity. Therefore the entire research was narrowed
down to employees’ perceptions on how they believed PA impact their on-job
performance, life satisfaction and other relevant issues they faced due to a sedentary
lifestyle. Ultimately the main research questions after all the narrowing down can be
summed up as: “Is physical activity positively associated with perceived employee
productivity for employees working in MNCs operating in Pakistan?”
On one hand this research poses questions regarding employee wellbeing and health but on
the other hand it also provides multinational corporations to consider employee wellbeing
as an investment. It is logical to infer that a more productive employee will tend to be more
beneficial for the corporation in terms of revenue and cost saving. Employee wellbeing is
commonly associated with decreased healthcare costs, reduced insurance premium on
employees, decreased presenteeism and absenteeism cost incurred by the companies on
behalf of the employees. (Sharifzadeh, 2013.) The research also tries to cover this aspect of
costs associated with employee wellbeing by trying to quantify them so as to get some
tangible results. Once again the quantified results will be based on how employees
perceive it to be rather than through official figures. Various studies carried out in the more
developed regions of the world have tried to quantify employee wellbeing programs using
company provided data. The output of these wellbeing programs was measured using the
concept of “Return on Investment”. For every dollar spent on the wellbeing program
companies saved various amount on healthcare, presenteeism and absenteeism costs.
(Baicker, Cutler & Song, 2010.)
Presenteeism refers to employees who are legitimately ill but continue to come to work.
There are inherent problems with presentees: (1) if they are contagious, they put other
employees at risk of becoming ill and (2) being ill often reduces the level of productivity
10
and the quality of work.” (Gatchel & Schultz, 2012). Similarly ”presenteeism cost” can be
defined as the cost the company has to incur due to the employee not performing at his or
her optimal productivity. On the other hand “Absenteeism” refers to employees who are
unable to attend to come to work due to a legitimate illness, but this concept will not be
looked in detail in regards to this thesis. The thesis focuses on the second aspect of
presenteeism where it effects the level of productivity and the quality or work. More
importantly, I will focus on those illnesses that are caused due to lack of physical activity
in the employee’s daily routine. This research will help pave way for similar researches,
carried out in the developed world, to be carried out in the Pakistani setting.
The main target audience of my research were employees working in multinational
corporations (MNCs) in Pakistan. The idea was to involve as many participants within the
study as possible so as to get a reasonable data set to work with. Knowing that the aim was
to target a bigger audience and develop statistical inferences, quantitative approach was
taken. Due to the pioneering nature of the study in the Pakistani study it is important that
the methods support the repeatability of the study so that other researchers may build their
work on this thesis and come up with some more practical implications (Glenn, 2010).
Quantitative approach allows researchers to be more objective and unbiased regarding the
study when it comes to testing hypotheses. Furthermore from the business perspective of
the companies quoting numbers and figures in the results can have a greater impact on
result and output driven managers of MNCs. The results were promising as statistically
significant number of employees indicated that they perceived PA to have a positive
impact on their on-job productivity. Similar results were observed in regards to life
satisfaction as well where employees positively associated PA with life satisfaction as
well.

11
2 THE PAKISTANI SOCIETY AND PHYSICAL ACTIVITY:
HISTORICAL, POLITICAL AND CULTURAL CONTEXT
After being ruled by the British for almost 100 years the Indian sub-continent got
independent in the year 1947. The independence itself was not a very smooth process
either as the Indian sub-continent got divided on the basis of religion of with the Muslim
majority area came to be known as Pakistan while the Hindu majority areas called what as
India. Pakistan itself was a unique country in compromising of two parts not connected to
each other by land. The western part was known as West Pakistan while the eastern part
known as East Pakistan with India in between the two parts of a single country.
Furthermore during the independence the province of Kashmir got disputed as well
because of being a Muslim majority area with a Hindu ruler who wanted to merge with
India. The Kashmir issue stands till this date as a thorn in the Indo-Pakistan relation. Three
wars have been fought between India and Pakistan with the last major one in 1971 leading
to the formation of East Pakistan as a separate nation now known as Bangladesh (Indo-
Pakistan war of 1971, 2016).
With a population of almost 193 million, Pakistan is currently ranked at number six in the
list of most populated countries (Worldometers, 2016). Out of the 193 million only a mere
75 million live in the urban areas (Pakistaneconomist, 2015). The country has a male to
female ratio of ten to nine and the median age is approximately 23 years (Worldometers,
2016). The life expectancy in the country is pretty low as compared to any western society
and is approximated to be around 66 years. Unfortunately the country has the one of the
highest infant mortality rate in the world with almost 66 out of 1000 infants dying at birth
(The World Bank, 2016). Alongside all this the country is in top 10 nuclear powers of the
world with almost a 100 nuclear warheads (Top 10 nuclear power countries in the world,
2014). The country is predominantly Muslim majority with 97 percent of the population
following Islam. There have been reported issues of religious freedom in the country with
minorities being attacked by hardcore Muslim extremist group such as Taliban
(Freedomhouse, 2015).

12
2.1 Political Culture in Pakistan
The political culture in Pakistan is of intense power struggle between handfuls of political
parties. Being a relatively newly independent country (1947) the culture is still in its
development stage. Though Pakistan was formed on democratic basis, unfortunately
multiple military dictator eras have stopped the development process and prevented the
political culture from maturing. With a history of almost 68 years half of it has been ruled
by military dictators. (Hashim, 2013.) The first thing the dictators do after coming in
power is to set up a dummy democratic parliament to present Pakistan as a democratic
nation to the outer world. Here one cannot completely hold the dictators responsible as the
ruling democratic parties in different periods were not competent and capable enough thus
leading to army takeovers. (Bahadur, 1998, 33-46.) Power struggle, corruption, biased
decision making and family based political parties have never allowed the true democratic
political parties to flourish in the country. With a considerable support for army at the
masses level and a maximum vote turnover of 53 percent (International IDEA, 2013) in
general elections throughout the history of the country; a clear indication of people’s lack
of trust in the ruling democratic parties of Pakistan.
To further worsen the situation the regional situation has never let things settle down
within Pakistan as well. With the Russian invasion of Afghanistan during the cold war and
the Russians eventually being beaten caused instability in the region for the last two
decades. The constant threat of Taliban from the Pak-Afghan border has taken too much of
the country’s resources and has caused attention to be diverted from internal issues like
power crisis and many others. With Pakistan’s long and intense political history and rivalry
with India at the eastern front Governance could not have been any more difficult. Since
the bloody independence in 1947 where Pakistan got separated from a united India
(formerly known as sub-continent) and the unresolved Kashmir Issue between the two
nations things have never restored to normalcy. “The Kashmir dispute dates from 1947.
The partition of the Indian sub-continent along religious lines led to the formation of India
and Pakistan. However, there remained the problem of over 650 states, run by princes,
existing within the two newly independent countries. Because of its location, Kashmir
could choose to join either India or Pakistan. Maharaja Hari Singh, the ruler of Kashmir,
13
was Hindu while most of his subjects were Muslim. Unable to decide which nation
Kashmir should join, Hari Singh chose to remain neutral.” (A brief history of the Kashmir
conflict, 2001). It was eventually take over by the Indians through a military incursion
while Pakistan still claims right to it on the basis of it being a Muslim majority area. Since
independence Pakistan and India have been involved in three wars with Pakistan losing
East Pakistan, now known as Bangladesh, in the last war fought in 1971. This further
infuriated the situation in the region. To add to it military turnovers due to lackluster
democratic governments has not allowed a strong foreign policy to address the issue. Many
experts deem Pak-India relations to be a pre-requisite for a stable and peaceful
environment in the South Asia region. (Suleri, 2014.)
2.2 Average Pakistani and the Middle class
It is important to realize that Pakistan is not merely a developing country but a country
facing multiple problems at the same time. According to the new poverty line set by the
government of Pakistan back in 2014 estimated that 60 million Pakistani currently live
below the poverty line. The poverty line is defined in monetary terms as 3,030 Pakistani
rupees (equivalent to $30) per equivalent adult per month. It is an alarming situation
knowing that approximately one-third of the population is living below one dollar a day
(Khan, 2016). Pakistan is often called a rich country with poor people, which is an accurate
description of the country. The country holds the fourth biggest slump of the world in
Orangi town (Karachi) hosting an estimated 1.8 million people (Joshua, 2014). The
country had faced short growth periods in between long periods of crisis and recession. For
the people living below or around the poverty line it is difficult to even afford a couple of
meals a day. The situation gets sometimes even worse as periods of high inflation making
the lives of the poor even more miserable. With all these troubles it is difficult to imagine
the poor population of Pakistan being worried about their daily or monthly PA targets as
for them PA might be extremely low on their priority list.
Talking about education in Pakistan the situation is not much different. More than five
million children are out of school as of 2010 which was almost eight percent of the world’s
population of children out of school. The situation is even worse for girls with two-thirds
of the children out of school being females. When it comes to the adults the situation is not

14
much different with an estimated 50 million adults illiterate with two third of them being
women. This huge number of adult population being illiterate is the third largest globally.
It is no surprise that Pakistan is ranked 113 out of the 120 countries in the Education
Development Index (UNESCO, 2012). Pakistan spends a meagre 2.4 percent of its GDP on
education. At the national level 89 percent of this budget goes to education expenditure
comprising of current expenses such as teachers’ salaries, while only 11 percent comprises
of development expenditure which is not sufficient to raise quality of education. It does not
come as a surprise that an average Pakistani spends only 5.7 years on education which is
by far extremely low for a developing country as well (The average Pakistani spends just
5.7 years on education, 2010). Due to such low literacy levels there is a high percentage of
unskilled labor. Out of the unemployed labor force in Pakistan 92 percent of them are
unskilled people without any proper education (Khan, 2015).
In a country where the average income per capita is estimated to be $1,513 per year and an
average family size of 6.8 people, it is difficult to meet ends with a single earning member
of the family (Pakistan Demographic and Health Survey, 2013). Poor education and
healthcare system makes the life of an average Pakistani even difficult. Private education is
something that an average Pakistani cannot afford for his or her children. Thinking about
the adults of the society who on average have 5.7 years of education and earn $125 a
month while trying to sustain a family of six to seven individuals is something that seems
to extremely tiring mentally and physically as well. It is difficult to imagine that after such
mental and physical stress an individual would have the time to think about PA as an
integral part of his or her daily routine.
Between all this issues and problems consistently troubling the masses of Pakistan, the
middle class has somehow evolved. Pakistan’s middle class is currently the 18th largest in
the world with 6.27 million out of the 111 million adults considered to be a part of it
(Alam, 2015). “A workable definition by the economist is that the middle class refers to
people who have approximately one-third of their income available to spend after meeting
their basic needs of food and shelter. In sociological terms, it can be defined by occupation,
occupational level, education or self-identification, the latter reflecting a sense of self-
ascription: one belongs to the middle class because one envisions a middle-class lifestyle
15
and identity for oneself. It is the class of seekers and strivers putting in the most effort for
change in search of a secure future.” (Kardar, 2014). Most common professions for people
within this class in Pakistan include senior government officials, managers of large
businesses, bankers, professionals like accountants, tax consultants and architects, large
farmers, academics in upmarket private schools and in public and private universities and
those providing a whole range of services in the sectors of telecommunication, IT, media
and retail and allied services, etc. (Kardar, 2014). It is from this very class that the target
group for this thesis has been selected. Individuals who are well educated and have
maintained a certain lifestyle, which can to a certain extent be compared to that of the
western societies, as professionals in MNCs within Pakistan. Their activity levels are
highly influenced by the technologically advanced choices they make in their daily
routines.
2.3 Physical Activity Culture in Pakistan
In such an intense political situation that Pakistan is currently striving in, getting
government and masses focus on the idea of physical activity seems to be far from
realization. With a population of almost 200 million a meager budget allocation of $70
million for recreation, culture and religion can be considered a negligible amount.
(Government of Pakistan Finance division, 2014.)
It is unfortunate to know that the physical activity culture in Pakistan has never been
researched at any level and if researched the results never published. The very fact that
there is not a single reputed educational institute offering any physical activity related
courses in their faculties in the country shows the level of interest of the society as a whole
in this certain sector. The situation is worse in the urbanized areas where mechanized
lifestyle has further reduced the everyday physical activities individuals had to perform
(Nanan, 2011). The situation is much better in villages where the physical nature of jobs
and simple lifestyle has kept people in some form of physical activity related for example
to the agriculture and dairy sector
As for the urban areas the situation as can be seen from the health stats in table 2 (National
Action Plan for Prevention and Control of Non-Communicable Diseases and Health

16
Promotion in Pakistan, 2004) comparing some common health conditions in both urban
and rural areas of Pakistan. High blood pressure and obesity are such conditions that can
give us a good idea of the prevalent Physical activity culture in the country. It is researched
that almost 40 percent of the urban population aged 45-64 is hypertensive while a
staggering 37 percent of the women and 22 percent of men aged 35-44 are overweight in
the urban areas as can be seen in table 2 (National Action Plan, 2004).
Table 1. Prevalence of CAD and common risk factors for NCDs in Pakistan (National Action
Plan for Prevention and Control of Non-Communicable Diseases and Health Promotion in
Pakistan, 2004)
According to Arshad (2008) 79.4 percent of the female population of Pakistan are labeled
as housewives, who are solely responsible for managing the household. The physical
activities available for housewives are quite limited. The culture of joining fitness gyms,
yoga classes or any other such activity is non-existent within the lower class. The nearest
they ever get to physical activity is during daily household chores where activities like
cleaning and cooking help contribute to the physical activity counter. For the middle and

17
upper class urban housewives this time is further reduced due to maids available at low
wage rates to perform most of the daily household chores. There is no research data but it
is safe to say that the average time spent by a housewife on physical activity is less than 30
minutes per day which is an extremely alarming situation.
The majority of the female population are housewives which leads to the fact that most
men are responsible for managing the financial requirements of the entire family. Here I
will focus on the urban male population who work five to six days a week to earn a living.
According to a worldwide study by Lee, McCann, & Messenger (2007) on working hours,
almost 42 percent of Pakistani working men spend more than 49 hours at work per week
which is an extremely high number. Most of the white collar jobs like anywhere in the
world are desk jobs with an extremely low on job physical activity requirement. (Leslie,
Braun, Novotny & Mokuau, 2013.) Such a laid back office environment discourages the
employees from any physical activity. It is understandable that a person who works
approximately 10 hours a day will be mentally drained off that he may not want to go for a
gym session or a run in the park after getting free from work. In essence the concept of
physical activity is relatively new both in urban and rural areas of Pakistan and people are
not yet self-aware regarding the idea of physical activity and wellbeing and its impact on
their daily lives. Due to the concept being a relatively new one there does not seem to be
any major societal pressure where individuals feel the need to be more physically active
and fit to be a more involved part of the society. It seems that PA is still very much a
personal choice for the target group of this thesis but at the same time the PA culture
around them doesn’t help their cause either.
2.4 Physical Activity Culture in MNCs operating in Pakistan
A multinational corporation (MNC) is considered to be a corporation which has at least
one of its facilities or assets in another country other than its home country. Though these
companies may have offices and sometimes manufacturing facilities in other countries but
the main core operation runs from the head office located in the home country
(Investopedia, 2016). Similarly for this thesis this definition is very much applicable with
all the multinational corporations involved in the study, having their head offices located

18
somewhere outside Pakistan. Nonetheless all the participants’ involved in the study work
in multinational companies’ offices active in Pakistan.
Here I will try to narrow down my approach to the target audience defined as the
employees of the multinational companies operating in Pakistan and specifically white
collar employees. White collar work is something that is associated with being mentally
challenging rather than being physical in nature. It is performed in an office or in a similar
setting. The work requires formal education and the worker enjoys more autonomy, cleaner
and safer workplace and higher paid as compared to their counterparts performing physical
jobs (blue-collar jobs). (Horn & Schaffner, 2003, 597-598.) The definition of white collar
work also follows the same criteria for sample set involved in this thesis. Employees
working within MNCs majorly indulge in mental tasks, in an office setting, requiring a
high formal education and a safe work environment.
Once again it is unfortunate that no research or data is available on any MNC’s physical
activity culture operating in Pakistan. Currently most of the MNCs operating in Pakistan
are utilizing Pakistan as a market and most of the products they produce are imported. This
leads to the fact that most of the people employed in these companies have white collar
jobs in areas such as sales, marketing, finance, IT, HR and in some cases engineering if the
company has a manufacturing unit in Pakistan. It is important to mention that Pakistani job
market is an extremely competitive one with a great imbalance between number of fresh
graduates and number of jobs created every year. (International Labor Organization, 2013.)
People who are able to get into the MNCs consider themselves extremely fortunate and
lucky and will ensure to make the most of this opportunity. Long working hours are
extremely common with a standard working day starting at around 0900-0930 and going
up till 1900-2000. There have been unreported cases where the weekly working hours have
crossed the 60 hours line as well. (Lee, McCann, & Messenger, 2007.) During the office
time there is a lunch break that lasts for around one hour and beside individuals might take
two to three tea breaks each ranging from 10-15 minutes.
There does not exists any MNC in Pakistan which has a defined program on physical
activity for their employees or even consider it as an investment that can generate a
remarkable return on investment if planned and executed effectively. Apart from a handful

19
of offices and that mostly only the head offices, there is no on-site fitness center or gym
where employees can do any form of an exercise. Companies consider it as a way to
reduce their employees’ health bills and neither do the employees care about their long
term wellbeing. On average an employee might be walking for a maximum of 15-20
minutes while on job and that is the only physical activity they perform. This laid back
attitude and the availability of elevators discourage the employees even to use staircases.
Though there might be some sport activities conducted by the organizations those are often
rare and few once or twice a year and unfortunately the participation rate is extremely low
in those events. Due to such conditions lower back pain, high blood pressure, diabetes,
obesity and vertigo are extremely common in the employees who have been a part of this
system for a considerable time.

20
3 PHYSICAL ACTIVITY IN A GLOBAL PERSPECTIVE
It is necessary to introduce the reader to simpler concepts like PA and health promotion
and to more complex ones such as health enhancing physical activity (HEPA). As most of
these terms will be regularly used during the rest of this thesis therefore it is necessary for
the reader to know in what context these concepts are being used.
3.1 Physical activity (PA) and health promotion in the world today
“Physical activity, as a modern concept is multifaceted and includes within its
characteristics any bodily movement. It is therefore necessary to distinguish the sub-
categories of physical activity.” (Merchant, Griffin & Charnock, 2007, 24-25). Figure 1
presents the sub-categories of physical activity for the reader’s clarity.
Figure 1. A simple deconstruction of physical activity (Merchant, Griffin & Charnock, 2007,
24)
Physical Activity
Exercise
Chores
Work
RecreationCommuting
Spontaneous Movement
Sport

21
By default humans are physically active, it is a state of existence which every one of us
experiences through our body. For physical activity to occur two necessary conditions are
the purpose and intensity (Merchant et al., 2007). In the context of my study (as will be
discussed later as well) the definition of physical activity is the perceived definition that
participants have shared. In a country like Pakistan where the concept of physical activity
is not so well developed and established, one has to rely on perceptions. (Ranasinghe,
Ranasinghe, Jayawardene & Misra, 2013.)
Similarly the contemporary definition of health promotion cannot be covered in a single
line. Due to the every changing work routines and lifestyles, the definition of health
promotion is something that slightly varies from region to region but should be broad
enough to cover all the aspects in a global framework. Probably the best possible and most
comprehensive definition of health promotion is suggested by Linda Ewles and Ina
Simnett's Promoting Health, originally published in 1985. “There they have covered six
areas of health promotion which include:
• Physical health: concerned with the mechanistic functioning of the body
• Mental health: concerned with the ability to think clearly and coherently
• Emotional or affective health: the ability to recognize and express emotions appropriately
and to cope with stress, depression and anxiety
• Social health: the ability to make and maintain relationships
• Spiritual health: either related to religious beliefs and practices, or with ways of achieving
peace of mind
• Societal health: concerned with the capacity of the society in which an individual lives,
which supplies the human needs of freedom and opportunity as well as the basic
infrastructure for them to be exercised.” (Lucas & Lloyd, 2005).
In the context of my thesis, the physical, mental and social health promotion aspect will be
focused upon. Physical health will be discussed more in relation to the associated health
22
risks and costs. While for a measure of mental and social health promotion I will be taking
a look at our participants’ life satisfaction and work productivity.
3.2 PA and Health enhancing physical activity: Why the need?
The concept of health enhancing physical activity (HEPA) is a relatively new term that has
developed over the last three to four decades (Bauman, 2004). HEPA has been defined in
multiple ways but the most widely accepted definition is the one proposed by the World
Health Organization defining it as any activity that, when added to the baseline activity,
produces health benefits (WHO, 2010). The main aim here is to benefit one’s health with
minimum risks of being exposed to any new ones. The average level of recommended
physical activity for adults aged 18-64 is 150 minutes of moderate intensity physical
activity over the period of a week (WHO, 2010). Though this can be mixed and matched if
the person is performing vigorous physical activity as well. It is important to realize that
any activity performed above this 150 minutes mark is to be considered as HEPA.
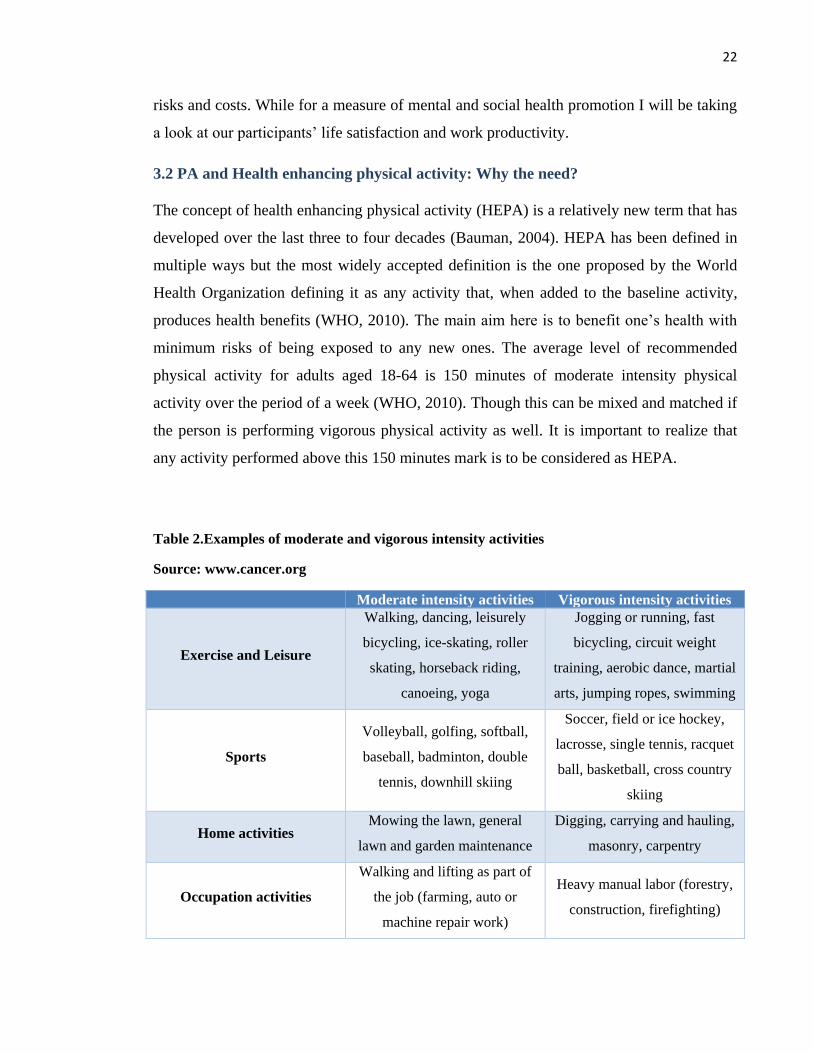
Table 2.Examples of moderate and vigorous intensity activities
Source: www.cancer.org
Moderate intensity activities Vigorous intensity activities
Exercise and Leisure
Walking, dancing, leisurely
bicycling, ice-skating, roller
skating, horseback riding,
canoeing, yoga
Jogging or running, fast
bicycling, circuit weight
training, aerobic dance, martial
arts, jumping ropes, swimming
Sports
Volleyball, golfing, softball,
baseball, badminton, double
tennis, downhill skiing
Soccer, field or ice hockey,
lacrosse, single tennis, racquet
ball, basketball, cross country
skiing
Home activities Mowing the lawn, general
lawn and garden maintenance
Digging, carrying and hauling,
masonry, carpentry
Occupation activities
Walking and lifting as part of
the job (farming, auto or
machine repair work)
Heavy manual labor (forestry,
construction, firefighting)
23
Table 2 gives a framework on how to categorize various activities either as moderate
intensity activity or vigorous intensity activity. The threshold levels for various health-
enhancing effects of PA are continuously sought. “It is likely that many of these effects are
not due to abrupt changes in the amount, intensity or frequency of PA that may cause one-
off effects, but rather due to subtle changes on a continuous scale.” (Vuori, 2004)
PA is positively associated with alleviating health conditions like lower back pains. Lower
back pains are experienced by 70 percent to 85 percent of the people at some point in life.
It is one of the most recurring health conditions faced by working aged population and is
recorded to be one of leading causes of absence from work. (Andersson, 1999.) PA can
help maintain and increase the strength of the back muscles and maintain their flexibility
this reducing the chance of injury (Suni, 2000). Though a direct relationship of physical
inactivity being associated with the risk of lower back pain is not exposed by any clear cut
study, nonetheless a cause and effect relationship is definitely observed. (Taimela, Takala,
Asklof, Seppala & Parviainen, 2000.) Similarly there are increased reported cases of lower
back pain in school-aged children with the symptoms being directly related to the amount
of time children spend sitting in classroom setting. (Salminen, Erkintalo, Pentti, Oksanen
& Kormano, 1999.)
Another health concern associated with lack of PA is overweight or obesity. The most
common causes of overweight is when a person’s overall energy intake exceeding the
expenditure (Blair & Nichaman, 2002). The need for energy expenditure for travelling,
work and in domestic chores has decreased due to technological advancements thus
promoting sedentary lifestyles. It is researched that even light to moderate PA can help
reduce the risk of obesity among women with sedentary lifestyles (Hu, Li, Colditz, Willett
& Manson, 2003). Though sometimes it is argued that low levels of PA are the merely the
consequence of being rather than the cause of obesity. (Peterson, Schnor & Sorensen,
2004.) PA itself can help weight reduction to a limited extent, nonetheless the risk of death
from causes such as coronary heart disease and diabetes are higher in physically inactive
obese as compared to their physically active obese counterparts (Blair & Brodney, 1999).
PA has the potential to bring the same amount of health benefits to an obese person who is
in more need of it as it would bring to a healthy individual. “Epidemiological studies have

24
provided evidence that part of the increased risk of morbidity and mortality associated with
excess body mass is not caused by obesity but by physical inactivity” (Vuori, 2004).
PA has the greatest preventive impact on subjects most susceptible to diabetes. Diabetes is
a very common and growing disease attributed to around four million deaths globally on
an annual basis (WHO, 2002). Females who spend more than 40 hours a week at work
while sitting have a 70 percent increased chance of being exposed to diabetes with women
who did not spend that much time in a sedentary position (Vuori, 2004). Several studies
have provided evidence that physical inactivity is directly linked to increase risk of
developing diabetes. PA is also beneficial for people who already are suffering from
diabetes by decreasing the need for drug treatment due to improved fitness. (Hamdy,
Goodyear & Horton, 2001.)
Similarly lower levels of regular physical inactivity are consistently associated with higher
blood pressure level and a 30 percent more chance of developing hypertension.
Hypertension is defined as the state when an individual’s blood pressure constantly stays
above the normal range. Mild to vigorous PA has substantial beneficial impact on blood
pressure. It is estimated that a single bout of PA can help reduce the blood pressure for the
next 20 hours. Studies have indicated that aerobic exercises at moderate to vigorous
intensity level can reduce both the systolic and diastolic blood pressure by 6-7mm of Hg in
hypertensive individuals (Hagberg, Park & Brown, 2000). PA helps decrease tension and
improve relaxation thus reducing hypertension.
Scientific evidence is convincing enough to safely say that physical inactivity is
detrimental to health and wellbeing of individuals globally. Though there might be other
bigger contributing factors like poor dietary choices, the lack of PA makes it even worse.
The remedy is as simple as performing a certain level of regular PA but economic, social
and financial factors might prevent individuals from reaching the optimal level of PA.
Society as a whole is responsible for providing individuals with enough opportunity and
information regarding regular physical activity and its associated benefits but at the same
time the individual has certain responsibilities as well.

25
3.3 International Health Promotion programs
Gebhardt & Crump (1990) write about different Health and Wellness programs being
implemented in different International organizations and what benefits have the programs
brought to the organizations and its employees. The main reason behind starting these
programs has been the rising health costs of the employees that the companies have to
bear. The estimated cost of cardiovascular diseases in terms of health costs and
absenteeism was estimated to be $10 billion in US in the year 1986 (Gebhardt & Crump,
1990). In this study by Gebhardt & Crump (1990) three different types of health and
wellness programs were observed. The type 1 program was more of a promotional
campaign while type II and type III being more formal fitness programs with proper
structure and participation. The type II and III were further classified into general fitness
programs and Job related fitness programs. The first being more appropriate for corporate
personnel and people with white collar jobs while the latter one for employees required to
be physically fit on job for example firefighters. A general fitness program conducted by
Prudential Insurance Company showed a decrease from 56 percent to 33 percent of people
in the low to fair fit group. This decrease was directly translated into an increase in the
category of people with average, good and high level of fitness (Gebhardt, & Crump,
1990).
Similarly Johnson & Johnson carried out a 30 month fitness program and categorized the
11,000 employees in three categories: 30 months participation, 18 to 30 months
participation and no participation at all. It was observed at the end of the program that the
inpatient health cost per capita for each group was $42, $43 and $ 76 respectively showing
a huge per capita saving due to the fitness program. Average savings of a quarter million
dollar per year were recorded against this fitness program. A similar program
implemented by Prudential Insurance Company resulted in a 20 percent decrease in
average sick days and a decrease in major health costs by $262 per participant of the health
program. The return on the fitness program was 1.93 to 1 meaning almost twice the
savings as compared to the fitness program cost. Cox et al. (1981) selected two similar
white collar insurance companies and demonstrated a significant reduction in absenteeism,

26
by 22 percent, with the institution of a fitness program leading to an estimated saving of
$83,265 (Gebhardt, & Crump, 1990).
NASA used a self-assessment on 237 executive employees to see adherence to and
effectiveness of fitness programs. The participants were categorized into three types with
high, medium and low adherence to the fitness program. It was noted that 50 percent of the
participants in the high adherence group reported increases in work performance and
positive work attitudes compared to 25 percent to 28 percent and 12 percent to 15 percent
for the moderate and low adherence groups, respectively (Gebhardt & Crump, 1990). The
research gives a good overall cost and benefit analysis of health and wellness programs at
workplaces. Taking multiple quantitative studies in different types of industries and
showing how wellness and fitness program can affect health costs, employee morale,
perceptions regarding productivity and other associated factors have shown how such
programs are independent of the industries they are carried out in. Such programs are not
only of advantage to the employees but the employers should realize that money spent on
such programs is more of an investment which can have exceptional returns if they ensure
to include the elements that are needed for a successful fitness program as discussed in the
end. (Gebhardt & Crump, 1990.)
Another interesting study (Berry, Mirabito, & Baun, 2010) discesses the output that the
companies can get through the wellness program. First and foremost is the decreased
health care cost. For example HEB, a retail grocery store chain, had a per capita decrease
of $1500 on health care costs of employees participating in the wellness program. SAS
software company get a return of $1.41 on every dollar spent on the wellness program
through decreased health care costs. The company estimated that by moving 10 percent of
its employees from high/medium risk to low risk gets an ROI of six to one. Second comes
the greater productivity achieved. The main problem here is “presenteeism” where people
come to work but under perform due to some sort of illness and thus causing decrease in
overall productivity. In 2002 DOW (Chemicals Company) estimated that for each
individual, Presenteeism costed them $6721 while per capita healthcare costs were around
$2,278. So the idea here is to increase productivity and hence decrease presenteeism cost.
Lastly health and wellness program also boost the morale of the employees due to the fact

27
that such programs need trust between higher management and employees at all levels.
Figure 2 (which is directly adopted from the article) shows a metric system to evaluate the
success of the program for all the stakeholders involved (Berry, Mirabito, & Baun, 2010).
Corporations that were discussed in the literature review have tried to cover each
characteristics of a successful wellness program in detail thus providing guidelines for
individuals or companies planning to carve out such a program within their own capacities.
Berry et al. try to cover both the employees end and the employer end and like any other
business talks about its viability and ROI to let other organizations that it is for their own
monetary benefit rather than only for the employees wellbeing.
Figure.2 Employee/Organization Workplace wellness program metrics (Berry, Mirabito, &
Baun, 2010)
To verify the results of the previous researches another research conducted by Baicker,
Cutler and Song (2010) on whether Healthcare Wellness Program can generate savings or
not can be utilized. The aim of the research was to look at multiple health and wellness
28
programs conducted and promoted by employers with the condition that program were
well established and had been running for a few years now. Only those programs were
selected which had a well-defined intervention and had a well-defined treatment and
comparison group leading to a sample group of 36 different disease prevention and
wellness programs. Healthcare costs and absenteeism studies were analyzed separately and
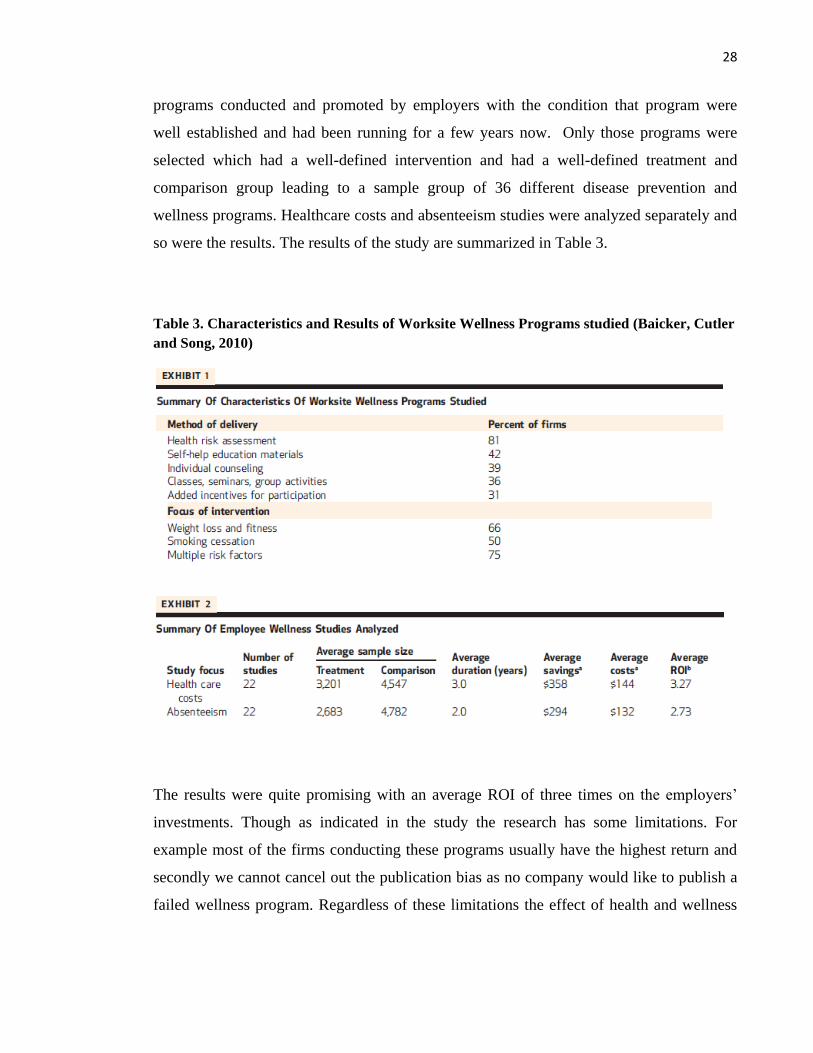
so were the results. The results of the study are summarized in Table 3.
Table 3. Characteristics and Results of Worksite Wellness Programs studied (Baicker, Cutler
and Song, 2010)
The results were quite promising with an average ROI of three times on the employers’
investments. Though as indicated in the study the research has some limitations. For
example most of the firms conducting these programs usually have the highest return and
secondly we cannot cancel out the publication bias as no company would like to publish a
failed wellness program. Regardless of these limitations the effect of health and wellness
29
program can be seen translated into employee productivity through decreased health care
costs and decreased absenteeism costs. (Baicker et al., 2010.)
Thinking it from the perspective of this thesis the international health promotion programs,
discussed in this sub-chapter involving various MNCs across the globe, are very relevant
to the setting faced by our target group working within MNCs in Pakistan. Regardless of
Pakistan being a developed country the culture within MNCs operating in Pakistan is not
much different from what is observed within the organizations across the globe. When
talking in regards to health promotion, something that is implemented and workable in the
office of an MNC located in the western part of the world, that concept can readily be
adopted and implemented in the organization’s Pakistan office as well. Though no such
health promotion programs are launched and researched in any MNC within Pakistan, this
does not mean that such programs cannot be implemented in the Pakistani MNC setting.
3.4 Theoretical Framework
The theoretical framework developed is a hybrid model derived from relevant frameworks
and professional opinions. Before looking into the models the dependent and independent
variables will be defined. The three dependent variables this thesis focuses on are
perceived employee productivity, employee life satisfaction and presenteeism cost while
level of physical activity being the independent variables in this case.
For perceived employee productivity the framework is based on this statement by
Zuckerman: “There’s no question that people who are fit are more productive; they enjoy
their work more and accomplish more” (Neck & Cooper, 2005). The aim is to prove or
disprove this statement. Though several on-job fitness programs have showed that PA and
productivity are positively associated it would be a good starting point for a country to
prove that PA is positively associated to perceived level of employee productivity so that a
case can be developed to introduce intervention studies as well. As for life satisfaction is
concerned the theory applied is from the study conducted by Elavsky, McAuley, Motl and
Konopack in 2005. The research focuses on how PA can impact the quality of life of older
adults through exercise, self-efficacy, physical self-esteem and affect (Elavsky, McAuley,
Motl & Konopack, 2005). Rather than using the entire model the impact of PA on quality

30
of life is adopted for this thesis. “Despite the inconclusive definition of life satisfaction,
life satisfaction could refer to subjective wellbeing for the elderly and it sometimes shares
commonality with quality of life.” (Grann, 2000). The terms of quality of life and life
satisfaction are sometimes used interchangeably in research therefore while adopting
Elavsky et al. theoretical framework the two terms will be interchanged too during the
adoption process. Figure 3 shows the proposed theoretical framework model proposed by
Elavsky et al. in 2005.
Figure 3. Physical activity and quality of life model (proposed by Elavsky et al., 2005)
Lastly the idea of presenteeism is also added in to the hybrid theoretical framework for this
thesis. This part of the framework is partly adopted from the idea behind physical activity
and employee productivity. Employees who are more physically active should logically
have a lower presenteeism cost associated to them. The question arises if people who are
more physically active are more productive leads to the point that is physical activity
positively associated with reduced presenteeism as well. The idea here is also to look at the
concept of absenteeism which is defined as a person being absent from work due to some
legitimate illness. Various physical fitness programs have reported reduced absenteeism,
particularly short and disruptive absences. (Kerr, Griffiths & Cox, 1996.) MNCs like
Johnson & Johnson reported a 15 percent decrease in absenteeism through the
implementation of a multiphase fitness program (Barker, 1988). The idea here is to extend
those finding related to absenteeism and use it for presenteeism. As the presenteeism data

31
is self-reported therefore it should be considered more of perceived presenteeism rather
than presenteeism obtained from any other intervention or experimental data. According to
Robertson and Cooper (2011, 2-24) positive psychological wellbeing is positively
associated with on-job performance. This thought process is included in the framework by
asking the question if employees who perceive to be more satisfied with life, perceive
themselves to be more productive at work too. The theoretical framework model when
tweaked and adopted from other frameworks and opinions is depicted below in figure 4.
The arrow indicates the effect of one variable on another, with the variable at the head of
the arrow being the dependent variable.
Figure 4. Theoretical Framework of the study
Physical Activity
Presnteeism
Perceived Employee
productivity
Employee Life
Satisfaction

32
4 RESEARCH DESIGN AND METHODOLOGY
4.1 Research Question
Apart from the main research question of physical activity being positively associated with
employee productivity or not, there are several other aspects that will be looked upon when
trying to answer multiple sub-hypotheses developed in the thesis. A conscious effort has
been made to look at the social aspect of this issue using the concept of life satisfaction.
Furthermore from a managerial perspective there was the need to look at the associated
healthcare and presenteeism cost and try to gather some tangible results to see if perceived
level of PA had any impact on such costs. Other factors such as age were also given some
weightage while formulating the sub research questions. The aim is to see the impact of
PA on other related aspects of employees’ lives as well that might eventually be of interest
to their employers as well. Some of the sub-hypotheses were developed in order to get a
deeper understanding of the answer for the main research question. To sum it up the
following questions will be used to test various sub-hypotheses of which some of them are
closely linked to the main research question.
1. Is PA positively associated with perceived life satisfaction for employees working in
MNCs operating in Pakistan?
2. Do people who positively associate PA with employee productivity are more active in
their daily lives in terms of time spent per week on preferred PA?
3. Does age of employees impact their level of perceived physical exertion?
4. Do people who are more physically inactive face more health risks associated with
sedentary lifestyle?
5. How has physical inactivity impacted the annual health expenditure of an individual
during the last two years?
6. Is presenteeism cost higher for employees who are more physically inactive in their
daily lives than employees who are relatively less physically inactive in terms of time
spent on any form of preferred PA?
33
4.2 Research Methods
The two most researched methods and the most prevalent in the domain of sport research
are the quantitative and qualitative methods. There have been cases where researchers have
tried to use a mix method involving both when it seems appropriate. For this research’s
questions it was more appropriate to use a quantitative approach as I am trying to test a
theory or explanation that is already well established (Curwin & Slater, 2008, 8-30). As
mentioned in the introduction section the research question revolves around the perceived
impact physical activity has on employee productivity and related issues in a multinational
corporation setting in Pakistan. If taken purely as a research problem the task is to identify
whether physical activity has an influence on employee productivity and life satisfaction of
the employees. In such a scenario where identification of factor(s) that influence a certain
outcome is/are to be observed, quantitative approach is the most applicable (Creswell,
2009).
“An individual trained in technical, scientific writing, statistics, and computer statistical
programs and familiar with quantitative journals in the library would most likely choose
the quantitative design.” (Creswell, 2009). Being at ease with technical writing and
computer aided softwares, I feel more confident with the quantitative approach.
Furthermore certain rules and procedures already exist when it comes to writing
quantitative studies thus making the process of writing a bit more organized and easier to
follow (Creswell, 2009).
After the academics this thesis’ secondary audience is the higher management of
multinational corporations operating in Pakistan. Like in any corporate organization
everything needs to be presented in a more quantifiable manner. The long term aim of this
study is to develop a culture of physical activity within such corporations in Pakistan and
for that it is required to consider how to influence the thought process of the upper
management who are also the policy makers within the organization. Therefore it is
important to realize that a quantitative approach can provide me with statistical and
numerical based results that will be of more value when presented to my target audience
(Creswell, 2009).

34
Knowing that this is the first ever research study on physical activity in relation to
employee productivity in a country like Pakistan, it is important to realize that the methods
support the repeatability of the study (Glenn, 2010). It is crucial to this area of research
within the country that new researchers can continue with and build upon this existing
research. The research involves multiple sub-questions that can be answered using
statistical inferences only thus requiring the need for a quantitative approach. Furthermore
unlike qualitative methods, quantitative approach can be considered more objective and
unbiased when it comes to testing hypotheses. It can allow to check for relationship
between variables even in a highly controlled environment as well (Glenn, 2010).
4.3 Data Collection
There are a couple of designs within quantitative research strategies when it comes to
research in the domain of health promotion and social sciences in general. “Survey
research provides a quantitative or numeric description of trends, attitudes, or opinions of a
population by studying a sample of that population.” (Creswell, 2009, 132). This method is
predominantly used in non-experimental research, where the researcher is more interested
in knowing the behavior of the participants rather than checking for the effects of an
intervention for example (Mrug, 2010). It allows the researcher to tailor the questions
according to his or her research question with the option of gathering responses in a variety
of ways thus being flexible (Mrug, 2010). One limitation of this approach is that the
respondents might not be able to interpret the question correctly and therefore can create a
bias in the responses to that question (Mrug, 2010).
On the other hand experimental research tries to determine if a certain treatment can
impact or influence an outcome. The impact is measured by having a control group
(without treatment) and a test group (with treatment) where one of the group is deprived of
a certain treatment and later evaluated. The aim is to collect data in two or more conditions
that are identical in all aspects but one which the researcher tries to explore through the
variance in results (Chow, 2010). The basic form of experimental research involves an

35
independent variable, a dependent variable, control variables and a control procedure.
(Chow, 2010, 448-452).
As this thesis involves social behavior, attitudes and opinions rather than an intervention, I
decided to go with the quantitative survey design approach to deal with my research
question. The aim here is to get responses on individuals’ perception on how they perceive
physical activity can impact their on-job productivity. Other questions relating to perceived
level of PA, associated health risks, perceived life satisfaction etc. are also opinion and
attitude based questions and therefore can be covered well using a survey (Chow, 2010).
As the plan was to gather data using a larger sample set (approximately 100 individuals),
this meant that large amount of data was needed to be collected in a short period of time.
Using a survey was the most cost effective and practical method of data collection (Popper,
2004). Furthermore the use of surveys allows analyzing such quantity of data in a more
organized manner (Popper, 2004). The results can be quickly analyzed using tools like
SPSS and it fits my aim and purpose of the study perfectly. In the survey a very high
proportion of my questions are close-ended therefore allowing ease in analyzing and
comparing data. The survey was cross-sectional in nature with data being collected at one
point in time.
Knowing that the data was to be collected in Pakistan while I was residing in Finland
throughout the entire data collection, the only procedure of data collection used was an e-
questionnaire. The main instrument used in data collection was “Google Forms”, a very
reputable and widely used tool provided by Google Inc. It is a very easy to use tool which
allows the researcher to form sub-sections with varying number of questions. Furthermore
the user can apply settings for each question separately so as to create multiple choice
questions or other close-ended questions. The service being free makes the research
process even smoother. The questions were divided according to different themes being
covered within the questionnaire. Predominantly a 5-point Likert Scale was used with
answer choices varying from “Strongly Agree” to “Strongly Disagree”. The questionnaire
was divided into the following five sub-sections (See Appendix 1):
1. Demographics and background information
2. Perceived level of physical activity

36
3. Employee perception regarding physical activity and its effects on work
productivity
4. Employee perception regarding physical activity and its effects on life satisfaction
5. Employee physical inactivity related health problems and associated issues
A major proportion of the questions were adopted from pre-validated surveys. Rather than
formulating the questionnaire from scratch I used reliable pre-validated surveys to get
questions that could answer my research questions. Some of the questions were formulated
with the help of my supervisor Hanna Vehmas which I believed were integral to my study.
Due to geographical constraints pilot study could not be carried out for those questions.
Question involving perceived level of PA were semi-adopted from the “World Health
Organization Physical Activity Questionnaire” with the questions being slightly tweaked
according to the norms and cultures of the Pakistani society (Global physical activity
questionnaire, 2015). The sub section on life satisfaction in relation to PA was adopted
from the Rehabilitation survey used by The Rehabilitation Institute of Chicago (Rehab
Measures, 2010). Physical inactivity related health problems and associated issues
questions’ were taken from the study “Does Fitness and Exercises Increase Productivity?
Assessing Health, Fitness and Productivity Relationship” published in the American
Journal of Management. (Sharifzadeh, 2013.)
Exactly 12 MNCs operating within different sectors in Pakistan varying from the
manufacturing business to the service industry were contacted. Various methods were
employed to contact the target audience who had the potential to be a part of the sample
group. The main communication method used was e-mailing the questionnaire to the
Human Resource Managers of the respective MNCs after briefing them about my thesis
via e-mail or telephone. The e-questionnaire was e-mailed to the respective managers
during the month of October (2015) and responses were accepted till the end of the year
2015. Being a part of a multinational corporation myself from 2012-2014, personal links
and resources were utilized for data collection. Individuals were e-mailed the questionnaire
directly after taking their respective managers into confidence so as to ensure the
objectivity of the study. Only white-collar employees working within the MNCs were
37
contacted for the study as my research focuses on this certain target group only.
Approximately 200 individuals were approached out of which 86 replied indicating a
participation rate of 43 percent. The questionnaires were filled out anonymously with no
privacy laws of the country being broken or misused. Though the target was to ensure a
balanced male to female participation ratio but unfortunately out of the 86 respondents
only 12 were female, indicating the inherent gender imbalance in the workforce of the
MNCs operating within Pakistan. (Khan, 2009.)
4.4 Data Analysis
As already discussed I will be using a quantitative approach for my thesis. The most useful
tool when it comes to quantitative data analysis in the domain of social sciences is SPSS.
(Garrison, 2010, 124-125.) ”SPSS Statistics” tool is the most widely used statistical tool to
analyze quantitative data. “IBM SPSS Statistics is an integrated family of products that
addresses the entire analytical process from planning to data collection to analysis,
reporting and deployment.” (IBM, 2016). Before moving on with my data analysis section
I believe it is important to share some vital information on statistical test usually used
within quantitative research and the conditions and reasons behind using each test. Table 4
gives a summarized view on why each one of the popular statistical tests are used.

38
Table 4. Criteria for Choosing Statistical Tests (Creswell, 2009)
As discussed already the first (and the main) and second questions that I ask in my
research relate to how employees working within MNCs in Pakistan perceive the impact of
PA in relation to employee productivity and life satisfaction respectively. Data was
collected using a 7-item sub section for impacts related to employee productivity and a 6-
item sub section related to life satisfaction within the questionnaire, answered using a 5-
point Likert scale.
”Likert (pronounced lick-ert) scaling is a method of attitude, opinion, or
perception assessment of a unidimensional variable or a construct made up of
multidimensions or subscales. The Likert scale provides a score based on a
series of items that have two parts. One part is the stem that is a statement of
fact or opinion to which the respondent is asked to react. The other part is the
response scale. Likert was the first recognized for the use of a 5-point, ordinal

39
scale of strongly approve—approve—undecided—disapprove —strongly
disapprove. The scale is often changed to other response patterns such as
strongly agree—agree—neutral—disagree—strongly disagree.” (Barnette,
2010).
Table 5 presents the items included for the two questions and gives the reader an idea on
how the two variables of perceived employee productivity and life satisfaction were
measured. The employees were asked on how they believe PA would help them in the
items discussed below. The responses were analyzed using Pearson product moment
correlation. Correlation lets the researcher know about the magnitude and direction of
association between two variables measured on an interval scale (Creswell, 2009). The
main aim here is to reiterate the participants’ perceptions using multiple items rather than
relying on one item so as to get a more reliable measure than could be obtained using one
item. (Brill, 2008, 427-429.) For a more thorough analysis differences in opinion, on the
aforementioned research questions, depending on gender are also analyzed in the results
section using independent sample t-test.
Table 5- Items measuring perceived employee productivity and life satisfaction
Items to measure perceived
employee productivity Items to measure life satisfaction
1. To be more productive at work
2. To be more focused during
meetings
3. To think more clearly about
work related problems
4. To concentrate more on work
tasks
5. To enjoy work better
6. To related better to co-workers
7. To feel less drained out
nearing the end of day’s work
1. To be more satisfied with life in
general
2. To be motivated to keep in touch
with friends
3. To improve your relationship
with your immediate family
4. To be more satisfied with your
financial situation
5. To enjoy work better
6. To enjoy leisure activities in a
better manner
40
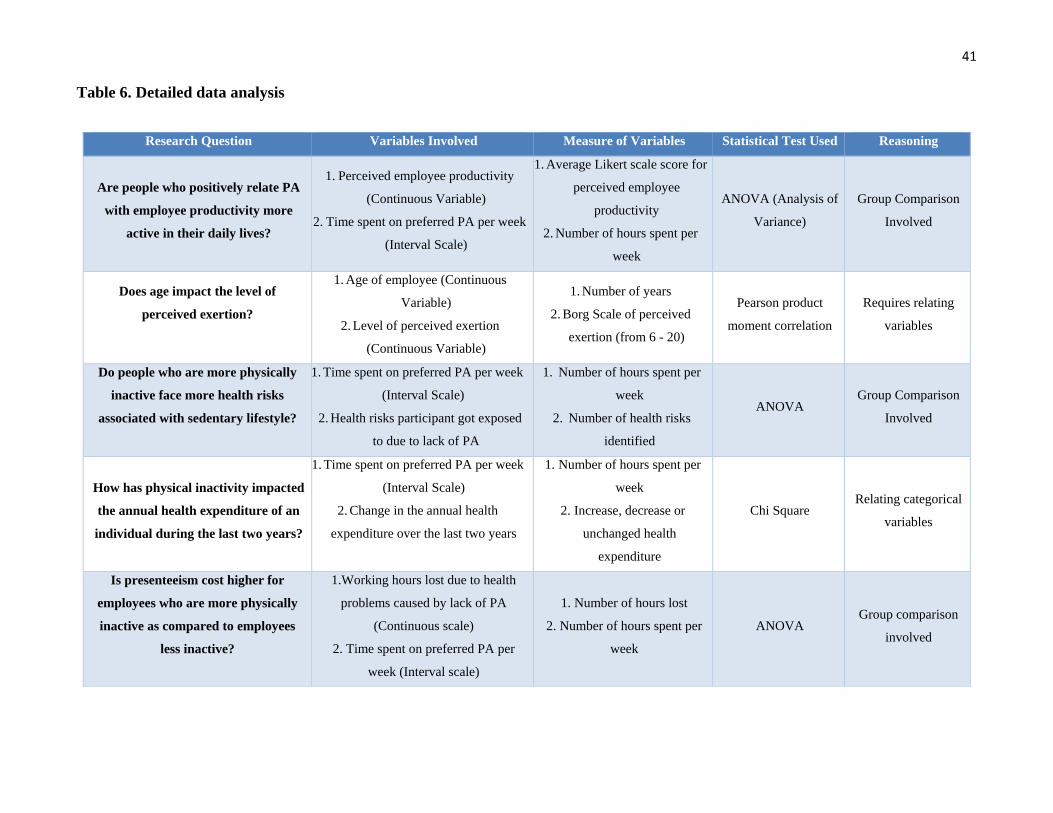
To make things more concise and reader friendly I have summarized the remaining
research questions along with variables involved, measure of variables, test used and
reasoning behind the test being used in table 6. Using predominant approaches in health
promotion researches, values have been assigned to Likert scale answer choices with
“Strongly Disagree” being assigned the numeric value ”1” while “Strongly Agree”
assigned the numeric value ”5” at the other end of the spectrum. For example for each
individual response the answers to all “items” representing life satisfaction are averaged
out for ease in comparison and analysis. (Brill, 2008, 427-429.) For example a participant
answering perceived employee productivity’s seven items will be assigned an average
value of ”3” if he or she has answered all the items as ”Undecided”.
41
Table 6. Detailed data analysis
Research Question Variables Involved Measure of Variables Statistical Test Used Reasoning
Are people who positively relate PA
with employee productivity more
active in their daily lives?
1. Perceived employee productivity
(Continuous Variable)
2. Time spent on preferred PA per week
(Interval Scale)
1. Average Likert scale score for
perceived employee
productivity
2. Number of hours spent per
week
ANOVA (Analysis of
Variance)
Group Comparison
Involved
Does age impact the level of
perceived exertion?
1. Age of employee (Continuous
Variable)
2. Level of perceived exertion
(Continuous Variable)
1. Number of years
2. Borg Scale of perceived
exertion (from 6 - 20)
Pearson product
moment correlation
Requires relating
variables
Do people who are more physically
inactive face more health risks
associated with sedentary lifestyle?
1. Time spent on preferred PA per week
(Interval Scale)
2. Health risks participant got exposed
to due to lack of PA
1. Number of hours spent per
week
2. Number of health risks
identified
ANOVA Group Comparison
Involved
How has physical inactivity impacted
the annual health expenditure of an
individual during the last two years?
1. Time spent on preferred PA per week
(Interval Scale)
2. Change in the annual health
expenditure over the last two years
1. Number of hours spent per
week
2. Increase, decrease or
unchanged health
expenditure
Chi Square Relating categorical
variables
Is presenteeism cost higher for
employees who are more physically
inactive as compared to employees
less inactive?
1.Working hours lost due to health
problems caused by lack of PA
(Continuous scale)
2. Time spent on preferred PA per
week (Interval scale)
1. Number of hours lost
2. Number of hours spent per
week
ANOVA Group comparison
involved

42
Before closing the data analysis it is extremely important to discuss the scale selected for
perceived physical exertion for the questionnaire. ”The Borg Scale takes into account your
fitness level: It matches how hard you feel you are working with numbers from 6 to 20;
thus, it is a “relative” scale. The scale starts with “no feeling of exertion,” which rates a 6,
and ends with “very, very hard,” which rates a 20. Moderate activities register 11 to 14 on
the Borg scale (“fairly light” to “somewhat hard”), while vigorous activities usually rate a
15 or higher (“hard” to “very, very hard”). Dr. Gunnar Borg, who created the scale, set it to
run from 6 to 20 as a simple way to estimate heart rate—multiplying the Borg score by 10
gives an approximate heart rate for a particular level of activity.” (The Borg scale of
perceived exertion, 2016.) Figure 5 gives an apt representation of the Borg scale as
discussed.
Figure 5. Borg scale of perceived exertion (Borg, G. A., 1982)

43
5 RESULTS
The results section is sub-divided on the basis of the research question being answered. To
make things easy and simple answer to each research question or sub question is being
catered for using separate sub-sections.
5.1 Association between perceived PA and employee productivity
The responses from the employees were overwhelming as expected. The results were
gathered using a 7-item five point Likert scale. A single variable was developed by
assigning each of the items numerical values from 1 (Strongly Disagree) to 5 (Strongly
Agree) and then averaging them out over the 7-items for each respondent. Averaged out
responses ranged from 1.86 to the maximum possible value of 5.0. The mean statistic for
the singular variable developed came out to be 3.93 with the 95 percent confidence interval
ranging from 3.80 to 4.06. A value of 3.93 suggests that on average the respondents agree
that their perceived physical activity is positively associated with their on-job productivity.
Figure 6 displays, through the use of a pie chart, the responses for one of the 7-items used
to measure the perceived PA in relation with employee productivity.
Figure 6. “Do you believe being physically active and exercising regularly will help you be
more productive at work?”
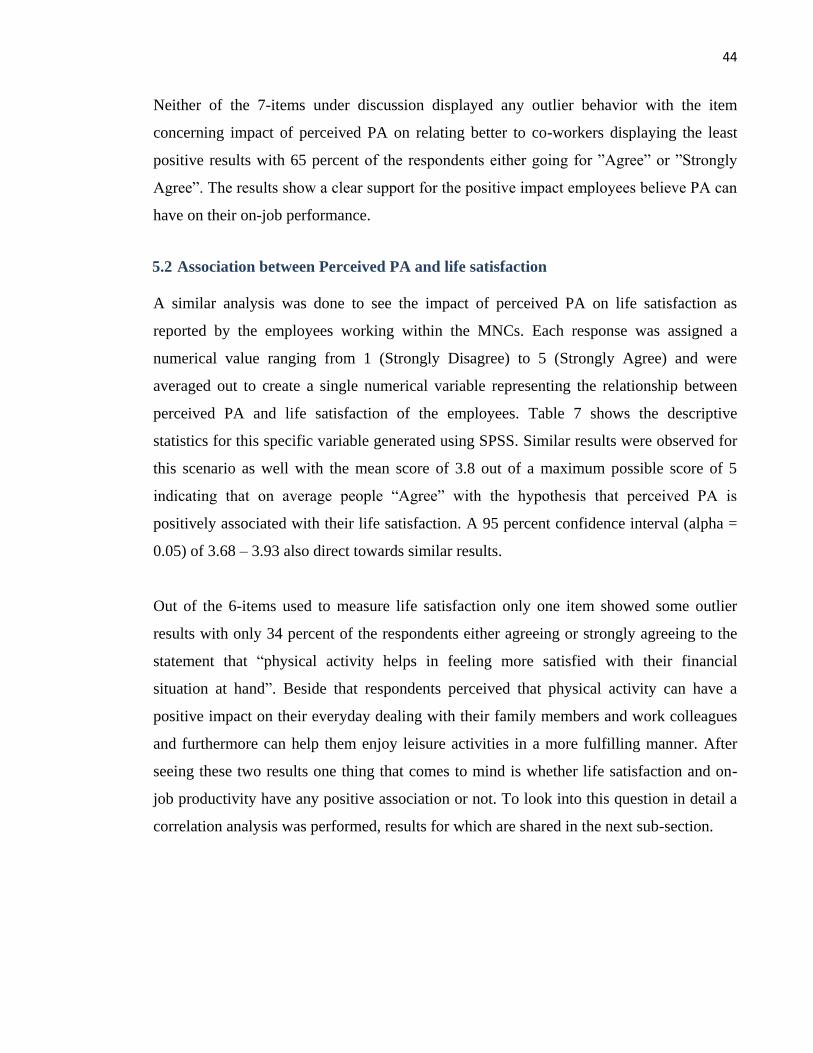
44
Neither of the 7-items under discussion displayed any outlier behavior with the item
concerning impact of perceived PA on relating better to co-workers displaying the least
positive results with 65 percent of the respondents either going for ”Agree” or ”Strongly
Agree”. The results show a clear support for the positive impact employees believe PA can
have on their on-job performance.
5.2 Association between Perceived PA and life satisfaction
A similar analysis was done to see the impact of perceived PA on life satisfaction as
reported by the employees working within the MNCs. Each response was assigned a
numerical value ranging from 1 (Strongly Disagree) to 5 (Strongly Agree) and were
averaged out to create a single numerical variable representing the relationship between
perceived PA and life satisfaction of the employees. Table 7 shows the descriptive
statistics for this specific variable generated using SPSS. Similar results were observed for
this scenario as well with the mean score of 3.8 out of a maximum possible score of 5
indicating that on average people “Agree” with the hypothesis that perceived PA is
positively associated with their life satisfaction. A 95 percent confidence interval (alpha =
0.05) of 3.68 – 3.93 also direct towards similar results.
Out of the 6-items used to measure life satisfaction only one item showed some outlier
results with only 34 percent of the respondents either agreeing or strongly agreeing to the
statement that “physical activity helps in feeling more satisfied with their financial
situation at hand”. Beside that respondents perceived that physical activity can have a
positive impact on their everyday dealing with their family members and work colleagues
and furthermore can help them enjoy leisure activities in a more fulfilling manner. After
seeing these two results one thing that comes to mind is whether life satisfaction and on-
job productivity have any positive association or not. To look into this question in detail a
correlation analysis was performed, results for which are shared in the next sub-section.

45
Table 7.Descriptive statistics for variable measuring association between perceived PA and
employee life satisfaction
Descriptive Statistics
Statistic Std. Error
Perceived physical
activity in relation to
life satisfaction
Mean 3.8046 .06179
95 percent Confidence
Interval for Mean
Lower
Bound 3.6818
Upper
Bound 3.9274
5 percent Trimmed Mean 3.8042
Median 3.8333
Variance .332
Std. Deviation .57635
Minimum 2.17
Maximum 5.00
Range 2.83
5.3 Association between life satisfaction and employee productivity
The concept of life satisfaction has been well researched and there have been contradicting
results on whether they are correlated or not. Averaged out variables created to measure
perception related to employee productivity and life satisfaction were used to perform the
correlation. Results of the correlation performed are displayed in table 8 and figure 7
(relevant results are in bold). The results show a strong positive association between life
satisfaction and employee productivity with a correlation coefficient of +0.682.
Furthermore a p-value of less than 0.05 also verifies the fact that the result is statistically
significant. This result is particularly interesting when seen in the context of the Pakistani
society where life satisfaction is not seen as a factor behind improved productivity by the
majority of the employers.
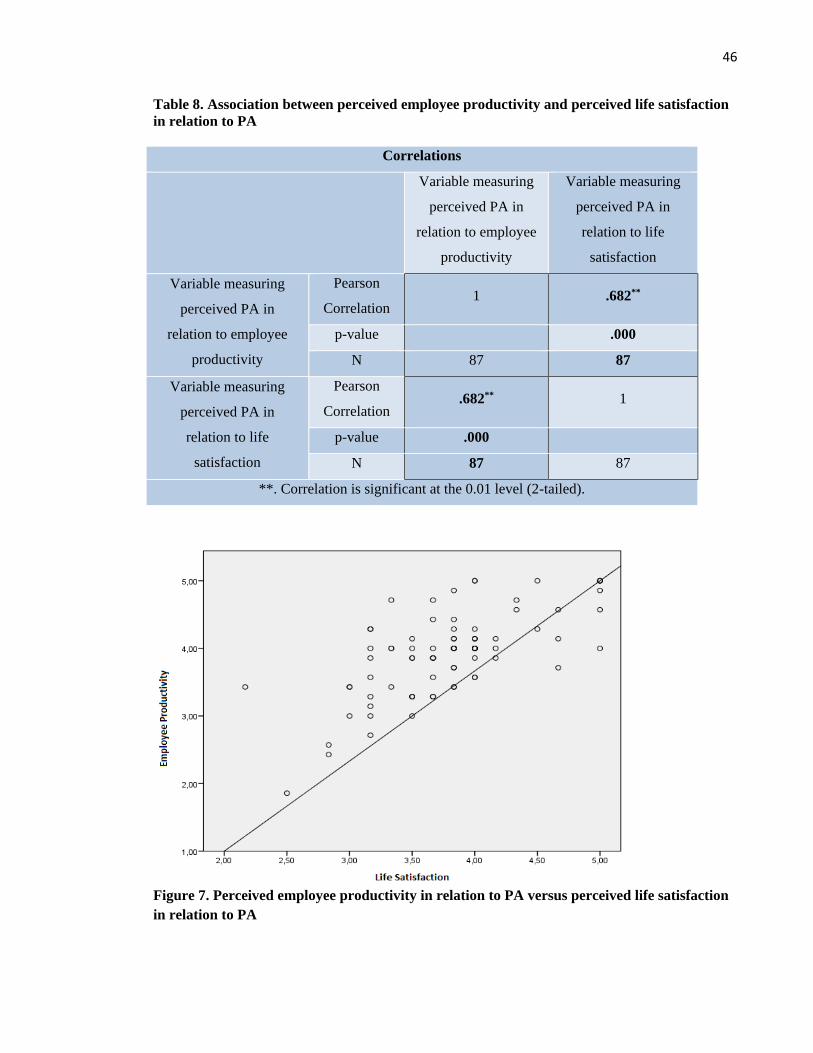
46
Table 8. Association between perceived employee productivity and perceived life satisfaction
in relation to PA
Correlations
Variable measuring
perceived PA in
relation to employee
productivity
Variable measuring
perceived PA in
relation to life
satisfaction
Variable measuring
perceived PA in
relation to employee
productivity
Pearson
Correlation 1 .682**
p-value .000
N 87 87
Variable measuring
perceived PA in
relation to life
satisfaction
Pearson
Correlation .682** 1
p-value .000
N 87 87
**. Correlation is significant at the 0.01 level (2-tailed).
Figure 7. Perceived employee productivity in relation to PA versus perceived life satisfaction
in relation to PA

47
5.4 Perceived impact of PA on employee productivity and recalled PA
Though this thesis aims to look at the perceptions of employees relating to physical
activity, however an attempt was made to extrapolate the results by using the concept of
recalled physical activity. Respondents were asked to recall if they have been recently
performing any physical activity and try to estimate the duration of the activity during a
week’s period. There were four options provided regarding the duration of their physical
activity and were asked to select one. Out of the 87 respondents 67 said they had
performed some sort of PA within their daily or weekly routine and therefore those 67
respondents were considered to for this hypothesis. As there is more than one independent
variable in this case (four to be exact) one way analysis of variance test was used to check
for the hypothesis.
Before performing one way ANOVA it was necessary to check if the sample set fulfills the
assumption required to run the test. The first condition of normality assumes that each of
the distributions within the sample is normal. Here the independent variable is amount of
time spent per week on some form of PA and the sample is divided into sub-samples
according to the independent variable. To check for normality of the distributions Shapiro-
Wilk normality test was performed as each distribution has degrees of freedom (df) less
than 50 (Testing for Normality using SPSS Statistics, 2013). For each distribution to be
normal the “sig.” value of each distribution needs to be greater than 0.05 and a value below
indicates that the distribution deviates significantly from the normal. Luckily each
distribution satisfied this condition of normality having significance values much greater
than 0.05. The second assumption behind ANOVA is the condition of homoscedasticity or
more commonly known of homogeneity of variances of the distributions being involved.
To check for this assumption Levene’s test was used and homoscedasticity was also
proven for the sample set.
The results of ANOVA, which are displayed in table 9, did not come out to be as expected.
There was no statistically significant difference to state that employees who positively
associate PA with employee productivity are more active in their daily lives as well. As
can be seen in the results there was no significance value less than 0.05 to indicate that any
of the four independent distribution/groups have different means for the variable
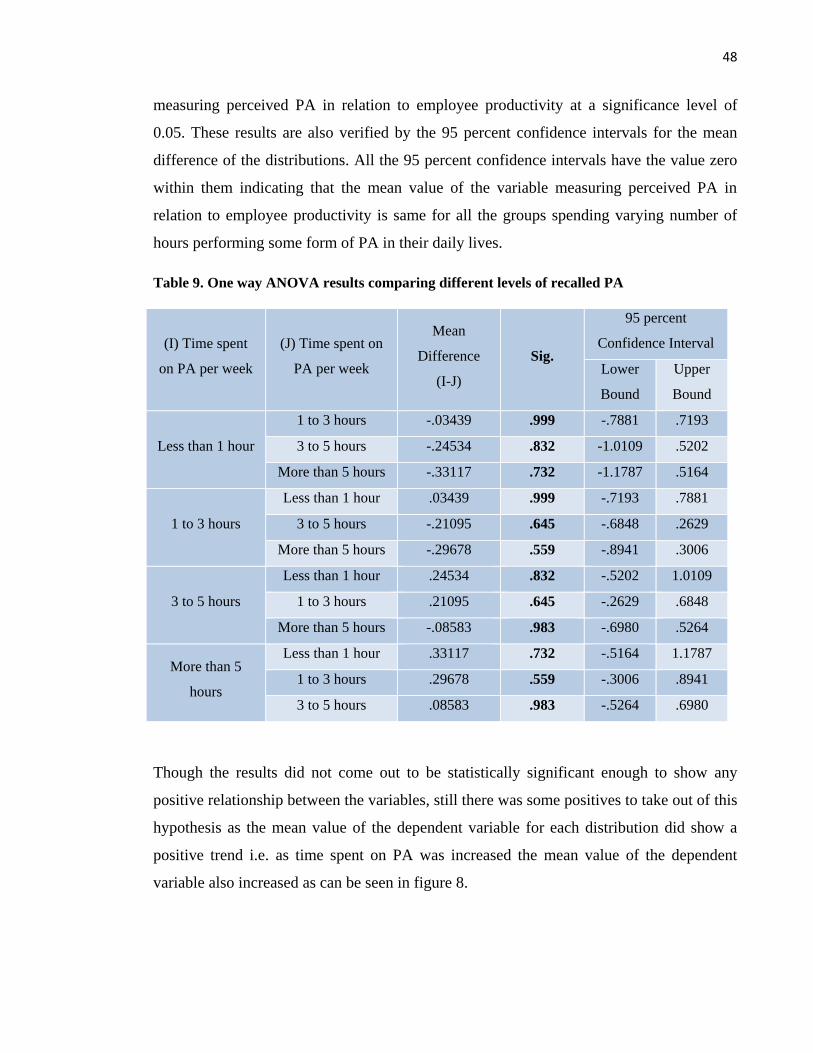
48
measuring perceived PA in relation to employee productivity at a significance level of
0.05. These results are also verified by the 95 percent confidence intervals for the mean
difference of the distributions. All the 95 percent confidence intervals have the value zero
within them indicating that the mean value of the variable measuring perceived PA in
relation to employee productivity is same for all the groups spending varying number of
hours performing some form of PA in their daily lives.
Table 9. One way ANOVA results comparing different levels of recalled PA
Though the results did not come out to be statistically significant enough to show any
positive relationship between the variables, still there was some positives to take out of this
hypothesis as the mean value of the dependent variable for each distribution did show a
positive trend i.e. as time spent on PA was increased the mean value of the dependent
variable also increased as can be seen in figure 8.
(I) Time spent
on PA per week
(J) Time spent on
PA per week
Mean
Difference
(I-J)
Sig.
95 percent
Confidence Interval
Lower
Bound
Upper
Bound
Less than 1 hour
1 to 3 hours -.03439 .999 -.7881 .7193
3 to 5 hours -.24534 .832 -1.0109 .5202
More than 5 hours -.33117 .732 -1.1787 .5164
1 to 3 hours
Less than 1 hour .03439 .999 -.7193 .7881
3 to 5 hours -.21095 .645 -.6848 .2629
More than 5 hours -.29678 .559 -.8941 .3006
3 to 5 hours
Less than 1 hour .24534 .832 -.5202 1.0109
1 to 3 hours .21095 .645 -.2629 .6848
More than 5 hours -.08583 .983 -.6980 .5264
More than 5
hours
Less than 1 hour .33117 .732 -.5164 1.1787
1 to 3 hours .29678 .559 -.3006 .8941
3 to 5 hours .08583 .983 -.5264 .6980

49
Figure 8. Trend-line showing mean values of variable for perceived PA in relation to
employee productivity against time spent on PA per week
5.5 Impact of age on perceived physical exertion levels
Knowing that age and its impact on physical exertion has not been well researched within
Pakistan I felt it necessary to analyze its impact within the scope of this thesis. Although
the sample set might be small and have a bias with the majority of respondents below 35
years of age, nonetheless the data seems adequate enough to measure the impact of age on
physical exertion if any. Here the independent variable is the age of the respondents while
the dependent variable is the perceived physical exertion which the employees choose
using the Borg scale of perceived exertion ranging from values from 6 (no exertion at all)
to 20 indicating maximum possible exertion. As both the variables are continuous in nature
therefore a Pearson correlation test suits best to know if there exists any relationship
between the two. Pearson correlation test results generated using SPSS are shown in table
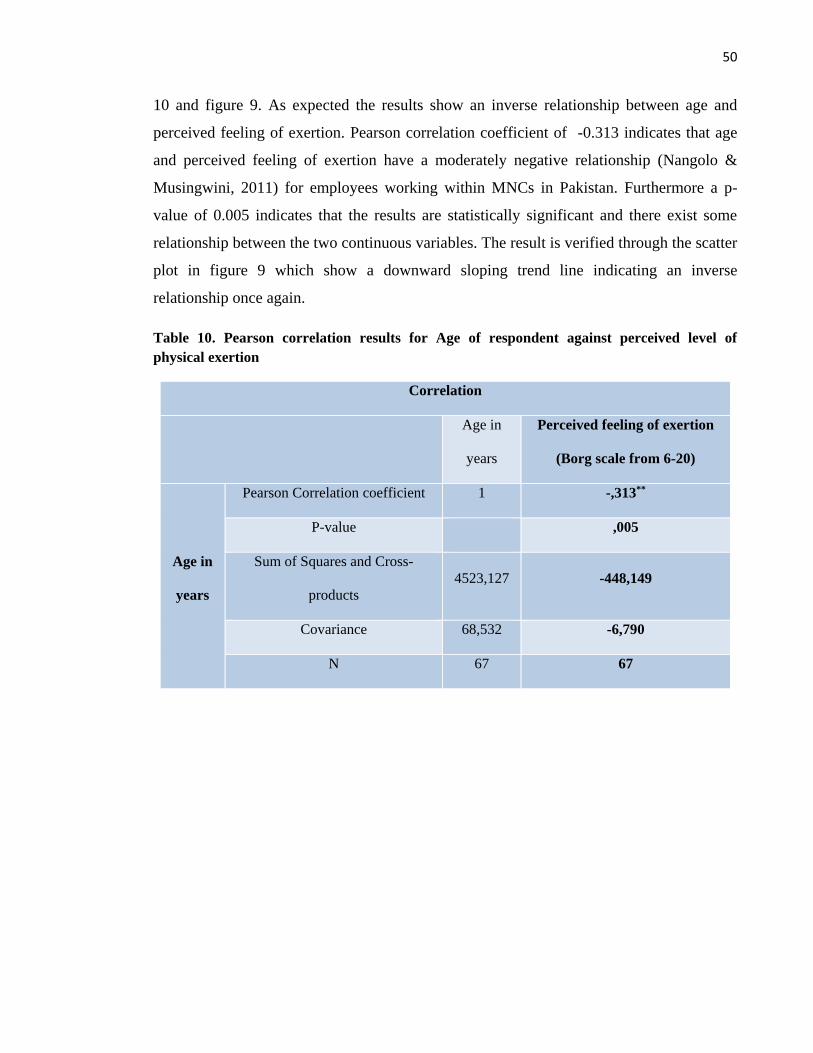
50
10 and figure 9. As expected the results show an inverse relationship between age and
perceived feeling of exertion. Pearson correlation coefficient of -0.313 indicates that age
and perceived feeling of exertion have a moderately negative relationship (Nangolo &
Musingwini, 2011) for employees working within MNCs in Pakistan. Furthermore a p-
value of 0.005 indicates that the results are statistically significant and there exist some
relationship between the two continuous variables. The result is verified through the scatter
plot in figure 9 which show a downward sloping trend line indicating an inverse
relationship once again.
Table 10. Pearson correlation results for Age of respondent against perceived level of
physical exertion
Correlation
Age in
years
Perceived feeling of exertion
(Borg scale from 6-20)
Age in
years
Pearson Correlation coefficient 1 -,313**
P-value ,005
Sum of Squares and Cross-
products
4523,127 -448,149
Covariance 68,532 -6,790
N 67 67

51
Figure 9.Scatterplot along with trend line showing negative relationship between age and
perceived level of physical exertion
5.6 Impact of physical inactivity on exposure to relevant health risks
Moving forward the focus is on chronic diseases associated with inactive lifestyle. Being a
part of the MNC culture myself the most commonly associated health risks were identified
which included hypertension commonly known as high blood pressure, diabetes, lower
back pain and obesity/unusual increase in weight. The aim was to see if there exists a
pattern associating level of recalled PA with the number of health risks a respondent is
exposed to during his or her professional career. The dependent variable in this case is the
number of health risks an employee is exposed to and can range from anywhere between 0-
4. The independent variables here are the different levels of recalled PA measured in hours
spent per week. As required ANOVA was performed on the variables involved and both
conditions of normality and homoscedasticity were satisfied by the distributions involved.
As can be seen in table 11 there did not seem to be any statistically significant difference

52
between the numbers of health risks employees got exposed to depending on their PA
levels either at a significance level of 0.05 or 0.1.
Table 11. ANOVA results for number of health risks respondents exposed to depending on
recalled PA levels
One thing to notice here is that both the recalled PA levels and health risks exposed to, are
reported by the employees themselves and might be subjected to slight bias depending on
the respondent. Nonetheless it was observed that the mean value of number of health risks
for each category did observe a clear trend in relation to recalled PA levels. Figure 10
shows the output through a scatter plot where a negative relationship between number of
health risks and recalled PA level can be observed.
Time per week spent
on preferred PA (I)
Time per week
spent on preferred
PA (J)
Mean
Difference
(I-J)
Sig.
90 percent
Confidence
Interval
Lower
Bound
Upper
Bound
Less than 1 hour
1 to 3 hours .167 .975 -.76 1.09
3 to 5 hours .471 .647 -.47 1.41
More than 5 hours .621 .507 -.42 1.66
1 to 3 hours
Less than 1 hour -.167 .975 -1.09 .76
3 to 5 hours .304 .615 -.28 .89
More than 5 hours .455 .474 -.28 1.19
3 to 5 hours
Less than 1 hour -.471 .647 -1.41 .47
1 to 3 hours -.304 .615 -.89 .28
More than 5 hours .150 .966 -.60 .90
More than 5 hours
Less than 1 hour -.621 .507 -1.66 .42
1 to 3 hours -.455 .474 -1.19 .28
3 to 5 hours -.150 .966 -.90 .60

53
Figure 10. Scatter-plot displaying negative relationship between mean number of health risks
employees are exposed in relation to recalled PA levels
5.7 Impact of age on reported obesity
It was noticed that obesity was the most common health risk employees said that they had
been exposed to. This seems understandable as the inactive lifestyle associated with
corporate multinational culture directly impact the weight of the employees. Out of 87 of
the respondents 29 reported that they had either faced obesity or an unusual increase in
weight since they had started working as a professional. Knowing that majority of the
respondents were below 35 years of age this statistic seemed quite alarming. To look into it
further an independent sample t-test was performed to compare the mean age of people
who reported obesity exposure as compared to the mean of sample who did not report
being obese or having faced an unusual increase in weight. The results of the independent
sample t-test as displayed in table 12 showed a very interesting phenomenon. Due to the p-
value for the Levene test being lower than 0.05 equal variances of the two independent

54
distributions involved were not assumed. The results of the independent sample t-test came
out to be statistically significant with a p-value of 0.024. Though the test was conducted at
an alpha of 0.1 nonetheless the p-value would have hold significant for an alpha=0.05 as
well.
The 90 percent confidence interval ranges from 0.84 to 5.23 years indicating that the
employees who did not report obesity had a higher mean age as compared to employees
who did report being obese. The 90 percent confidence interval of employees who did not
report obesity was 28.9 to 32.7 years while for employees reporting obesity it was 27.7 to
28.8 years. As the data is gathered on perceptions it can be argued that younger employees
might seem to be more health conscious and might perceive a smaller increase in weight to
be categorized as being obese as compared to the older employees’ perceptions.
Nonetheless the results indicate an interesting situation where apparently obesity has
affected the younger employees more.
Table 12. Independent sample t-test results to compare mean age of obese and not-obese
employees
Independent Samples Test
Levene's Test
for Equality
of Variances
t-test for Equality of Means
p-value
(homoscedast
icity)
df
P-value
(alpha=0.1)
90 percent
Confidence Interval
of the Difference
Lower Upper
Age
(in
years)
Equal
variances
assumed
,000 85 ,078 ,20609 5,86288
Equal
variances
not
assumed
81,272 ,024 ,84115 5,22782

55
5.8 Impact of physical inactivity on annual health expenditure
Health care costs are considered to be an essential component of costs associated with
inactive lifestyle when it comes to employees working in the service industry. Using data
gathered through the questionnaire an attempt was made to see if there exists any
relationship between the duration of PA and the healthcare costs of employees. Participants
of the study were asked if their annual health expenditure had increased, decreased or
remained the same over the last two years. Knowing that it is difficult to assess the exact
amount of healthcare costs, the data relies heavily on the perceptions of the respondents.
Knowing that both the duration of PA and the change in healthcare costs are categorical
variables therefore chi-square has been used to look if there exists any dependency
between the two variables.
The test could not have been performed using all four categories of the independent
variable i.e. duration of PA (less than 1 hour, 1-3 hours, 3-5 hours and more than 5 hours)
because the required assumptions behind the test were not met. Therefore categories of the
independent variable were combined with one category representing employees that
performed up to three hours of PA per week while the second category representing
employees performing PA up and above three hours. Using this setting the conditions for
the chi-square test were met and table 13 shows the results gathered for the test.
According to the results there exists no relationship between the duration of PA performed
by employees and the change in health care cost incurred on themselves during the last two
years. A Pearson chi-square significance value of 0.419, which is much greater than the
value of alpha=0.5, indicates that the two variables involved are independent of each other.
This is a surprising result as one would expect that a relationship between level of PA and
healthcare costs might exist. Similarly I tried to look if there exists any difference in
healthcare costs for employees who performed PA for any duration as compared to
employees who did not perform any PA at all. Chi-square test was performed again and the
results for the test are displayed in table 14. Once again the results showed that there
existed no difference when it came to change in healthcare costs during the last two years
for employees who performed any form of PA for any duration and employees who were

56
completely inactive. A significance value of 0.163 being bigger than alpha=0.5 indicates
independence between the two variables.
Table 13. Pearson Chi-square test results for duration of PA against change in healthcare
costs for employees (N=67)
Table 14. Pearson Chi-square test results to check for dependency between PA and change in
healthcare costs (N=87)
5.9 Role of PA in presenteeism cost
As discussed earlier presenteeism is the cost associated with the time lost due to some
health condition faced by the employees while on job. In the questionnaire an attempt was
made to measure the perceived presenteeism cost by asking employees how many hours
per month they believe were lost due to some health risk they have been exposed to since
they have started their professional career. In this sub-section I have tried to answer one of
the research questions that whether presenteeism cost is higher for employees who have
been more inactive in their daily lives or not. As there are more than two options for the
independent variable i.e. the duration of PA, therefore a one-way ANOVA was performed
Value df Asymp. Sig. (2-sided)
Pearson Chi-
Square 1,738a 2 .419
Likelihood Ratio 1,756 2 .416
N of Valid Cases 67
a.1 cells (16.7 percent) have expected count less than 5. The
minimum expected count is 4.93.
Value df Asymp. Sig. (2-sided)
Pearson Chi-
Square 3,632a 2 .163
Likelihood Ratio 3,673 2 .159
N of Valid Cases 87
a.1 cells (16.7 percent) have expected count less than 5. The
minimum expected count is 2.53

57
to look if there exists any dependence between the two variables. Before performing the
test once again assumptions like normality and homogeneity of variances were checked
through q-q plots and Levene’s test respectively. Table 15 displays the result of ANOVA
generated through SPSS. It was interesting to see that the p-value was 0.448 which is much
greater than the chosen value of alpha i.e. 0.05 thus failing to reject the null hypothesis that
presenteeism cost and duration of PA are dependent on each other.
Table 15. One way ANOVA to check dependence of presenteeism cost on duration of PA
(N=67)
ANOVA
Sum of Squares df Mean Square F p-value
Between Groups 302.288 3 100.763 .896 0.448
Within Groups 7086.854 63 112.490
Total 7389.142 66
Knowing that duration of PA had no impact on the presenteeism it seemed important to
check if any level of PA whatsoever has an impact on the presenteeism cost or not. An
independent sample t-test was performed to check whether mean presenteeism cost in
terms of hours lost per month differ for employees who did perform some sort of PA
against those employees who were completely inactive in their daily routines. Both of the
distributions were checked for normality using Shapiro Wilk test. There were a total of 67
employees who were engaged in some sort of PA every week regardless of the intensity of
their perceived exertion while on the other hand 20 employees indicated that they did not
perform any form of PA in their daily routines. A p-value of 0.913 at a significance level
of 0.05 indicated that the results were statistically insignificant to suggest whether there
exists any difference between the mean values of hours wasted per month for employees
performing PA and employees not engaging in any form of PA. Regardless of the
distributions having equal or unequal variances the null hypothesis cannot be rejected as
per table 16.

58
Table 16. Independent samples t-test to check for differences in presenteeism cost of
employees performing PA and employees not engaging in PA (N=87)
Independent Samples T-test
Levene's
Test for
Equality of
Variances
t-test for Equality of Means
p-value df Sig.(2-
tailed)
95 percent
Confidence Interval
of the Difference
Lower Upper
Presenteeism
cost (hours
wasted per
month)
Equal variances
assumed ,166 85 ,913 -4,7149 5,2626
Equal variances
not assumed 49,864 ,890 -3,7009 4,2487
5.10 Role of obesity in presenteeism
Obesity has been reported to be the most common health risks employees believed they
were exposed to with one-third of the employees indicating that they were facing it since
the start of their careers. Once again an independent sample t-test was performed to see if
there exists any difference in mean number of work hours wasted for employees who
reported being obese as compared to employees who did not. Levene’s test was performed
to see if equal variances assumption can be made for the two distributions but a p-value of
0.001 for the Levene’s test nullified the assumption of equal variances. As expected the
results of the independent samples t-test in table 17 suggested that obesity did impact the
presenteeism cost with employees not reporting obesity having lower number of mean
hours wasted. A p-value of 0.019 at a significance level of 0.05 verifies that indeed mean
of the distributions is different. The 95 percent confidence interval of the difference of the
means ranging from -11.9 to -1.1 hours affirms the finding that employees who did not
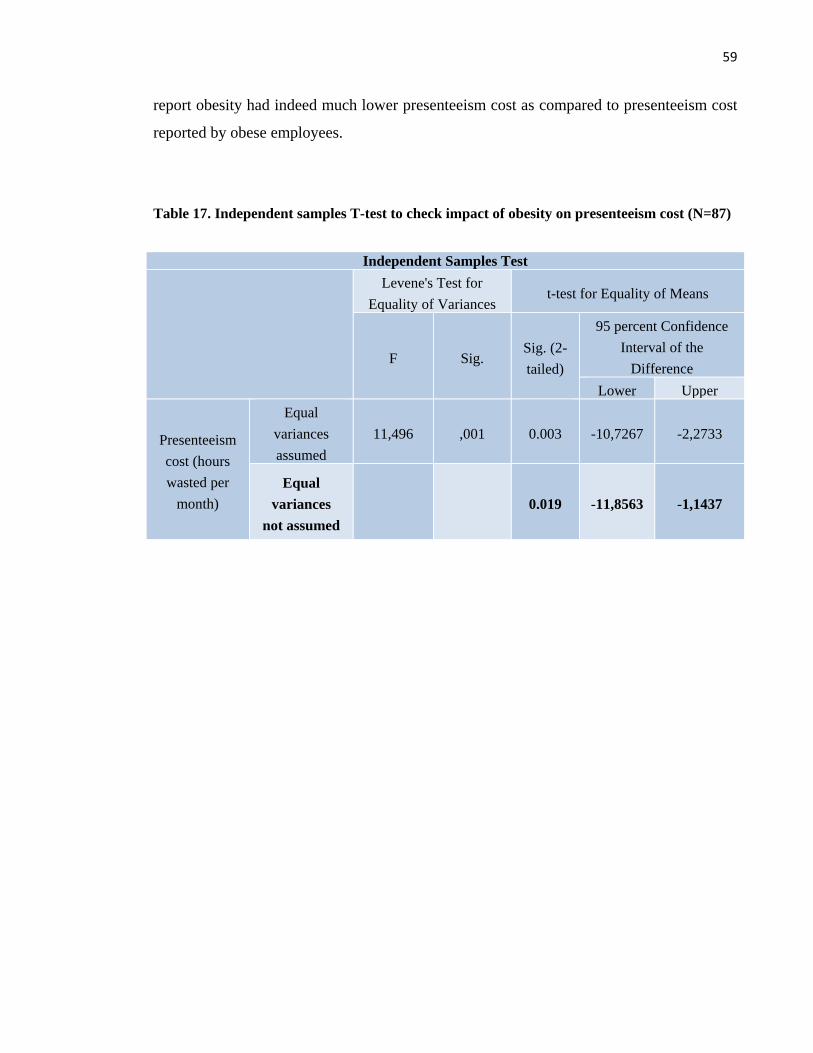
59
report obesity had indeed much lower presenteeism cost as compared to presenteeism cost
reported by obese employees.
Table 17. Independent samples T-test to check impact of obesity on presenteeism cost (N=87)
Independent Samples Test
Levene's Test for
Equality of Variances t-test for Equality of Means
F Sig.
Sig. (2-
tailed)
95 percent Confidence
Interval of the
Difference
Lower Upper
Presenteeism
cost (hours
wasted per
month)
Equal
variances
assumed
11,496 ,001
0.003
-10,7267 -2,2733
Equal
variances
not assumed
0.019
-11,8563 -1,1437

60
6 DISCUSSION AND CONCLUSIONS
This thesis aimed to cover various aspects associated with employee productivity within an
MNC setting in Pakistan. The vast majority of the research has been based on perceptions
of the employees and at times has tried to tie a knot between perceptions and the real-life
situation out there as well. To a certain extent invaluable insight has been provided on
different aspects of employee productivity by identifying various associated costs linked to
sedentary lifestyle. There have been some interesting results that I have come across in the
results section, some expected and some unexpected. It is imperative to discuss the
rationale behind these results as eventually the message behind the results is more
important than what is represented by tables and figures.
6.1 Dilemma of PA in Pakistan
This thesis has made an attempt to look at the PA trends in a specific setting in Pakistan.
Like in any country white collar employees working in MNCs are a true representation of
the middle or upper middle class of the society. Being well educated and being part of a
strong organization says a lot about the individual. With almost 50% of the respondents
earning over 100,000 Pakistani Rupees per month (equivalent to $12,000 per annum) the
employees working in MNCs in Pakistan represent the educated and reasonably wealthy
class of the society. To a certain extent the perceptions they have about PA speaks volume
about how PA is perceived in Pakistan. Though the results show that the employees did
perceive a positive association between PA and productivity nonetheless it was a
completely different story altogether when they were asked about what they believe PA is
and how would they define it. One of the participants defined PA as “Activities; done
manually, by hands, need physical involvement and exercise.” Another participant stated it
to be “Coming to office via stairs”. As this thesis from the very start focused on
perceptions it was interesting to see such varied perceptions about the definition of PA. A
big chunk of the respondents indicated PA to be any bodily movement that requires

61
energy. According to this definition sleeping should also be considered PA as the person
does burn quite a lot of calories while sleeping.
The worrying point here is that if this what the perception of the educated class is
regarding to PA what should one expect from the 50 million illiterate adults of the country
(UNESCO, 2012). It is necessary to realize the reason behind such an alarming situation
the roots of which lie within the public and private schools in Pakistan. Apart from a
handful of pro-active private schools physical education is not been given its due
importance. The realization that how important PA is for the body is never instilled in the
young educated minds of the country. “Physical education is not given the importance that
it deserves. It is still considered a co-curricular activity or a hobby for some. It should be as
considered as important as any other subject like English.” (Saeed, 2011). Lack of
qualified physical education teachers and the indifferent attitude the society has towards
PA has ultimately led to such a situation.
For the women in Pakistan the situation is even more difficult. “In many Indian and
Pakistani schools, lack of qualified teachers and facilities, inadequate inspection,
perception of physical education as a non-educational fun activity and inferiority to
academic subjects, collectively contribute to either minimal provision or to not even being
a feature of the curriculum. Girls are discouraged from participating in physical education
clubs in many rural areas especially because of what it will do to their bodies (render them
“unfeminine”). In Pakistan, cultural and religious constraints limit the scope of physical
education for girls, who are not allowed to take part in sports and physical activities except
within the four walls of the schools.” (Hardman, 2004). Physically active women being
stigmatized by the society is quite common in the rural areas of the country and is still
prevalent in the more developed urban areas of the country. It is imperative that PA is
taken just as seriously as any other subject at the school, so that the concept of PA and its
importance gets instilled in those young minds at an early stage.

62
6.2 Issues with recalled data
During the results an attempt was made to involve recalled levels of PA in a couple
research sub-questions to see if there exist any relationship between employees’ belief
about PA and whether they are true to that belief, by recording their recalled levels and
duration of PA. Similarly recalled PA durations were used to see if there exist any
association between PA duration and the number of health risks an employee is exposed to.
Using recalled data allows the researcher to tackle the issue of practicality and data
collection cost issues. But at the same time there is always the inherent chance of the data
being bias and misrepresented. “Although self-reports are useful for gaining insight into
the physical activity levels of populations, they have the capacity to over- or underestimate
true physical activity energy expenditure and rates of inactivity” (Prince, Adamo, Hamel,
Hardt, Gorber & Tremblay, 2008). Human beings being inherently imperfect, there is
always a chance that the recalled levels of PA might be misrepresented due to inaccurate
memory and social desirability (Prince et al., 2008).
Nonetheless an attempt was made during the questionnaire design to avoid the recall bias.
All the questions involving recalled PA were adopted from pre-validated surveys.
Furthermore before asking the participant about recalled levels of PA they were probed in
detail regarding their preferred PA by providing them several choices to make them think
deeper when answering question regarding recalled PA later in the questionnaire. The
participants were to a certain extent blinded from the sub-hypotheses at hand, which helped
in the objectivity of the recalled PA results (Hassan, 2005). Similarly the questionnaire
used a systematic approach to prompt and stimulate participants’ memories. For example
to measure perceived level of physical exertion the Borg scale of perceived exertion was
used. But at the same time while asking participants to rate their perceived levels of
physical exertion, they were provided with Borg scale rating of common physical activities
such as walking and running; they were also told the perceived feeling that comes along
with each level of exertion so that while responding they have a clear idea of how to rate
their own level of exertion (Richey & Klein, 2009).

63
6.3 The menace of obesity
Though obesity is mostly associated with the developed countries where technological
advancements have made lifestyles sedentary but the situation is not much different in
urban areas of the developing world either. As it was observed in the data gathered for this
thesis that obesity was reported as the most common health risk employees were exposed
to in their professional career. An employee working in a multinational company as a
white collar employee is typically in a highly urbanized area. Obesity came out to be
strongly associated with presenteeism cost directly affecting productivity of the employees.
“In South Asia, including Pakistan, social and environmental changes are occurring
rapidly, with increasing urbanization, changing lifestyles, higher energy density of diets,
and reduced physical activity.” (Nanan, 2002). The reported obesity levels in urban areas
in Pakistan was reported to be 22% for men and 37% for women in the age range of 25-44
years old (Nanan, 2002). This is not much different from the results gathered using the
sample set in this thesis where 33% of the participating employees reported either being
overweight or being obese.
Obesity was reported to be more prevalent in younger employees who were just at the start
of their careers. This also points out to the fact that younger adults are more conscious
about their health and weight. Whereas adults who have been in their professional life for
some time now might consider it to be a normal feature and unconsciously avoid reporting
it even if they are overweight or obese by definition. This is an even more serious situation
where a serious health risk is not being recognized as one by the subjects themselves and
the society at large. Though in a country like Pakistan where poverty and hunger is a major
issue, issues like obesity are sometimes brushed under the carpet. At the same time the
results indicating that obesity might be a bigger issue in the younger workforce cannot be
ignored. One logical reason behind this could be the sudden change in routine when one
moves from an academic career to a professional career. From relatively relaxed college
life to an almost 50 hours per week routine can have its toll on the individual. The time
which used to be spent on either some form of PA or extra-curricular activity is now taken
up by the office. It is important to realize that such a sudden change from a relatively
active lifestyle to a sedentary lifestyle within the office, needs to be counterbalanced to halt

64
any progress towards the person becoming overweight or obese. Setting a routine which
involves a more healthy lifestyle by squeezing in PA in the work life and going for
healthier diets can set the path for a more active and healthy professional career. At the
same time it might be initially difficult to make such changes to your routine in a country
like Pakistan where being lethargic is considered more of a sub-culture. If the menace of
obesity is not tackled at the early part of the professional career than later on the employee
might not consider it to be a menace anymore thus posing even greater threat to the health
and on-job productivity of the individual.
6.4 Avoiding presenteeism and the social stigma associated with absenteeism
Though within the limited scope of this thesis there was not enough to evidence to support
the claim whether duration of PA is associated with presenteeism, nonetheless it was
interesting to notice that according to the participants’ perception in total 500 hours were
lost as presenteeism cost for the 87 employees in total, averaging out to an approximately
six hours per employee per month lost due to presenteeism. Like in most MNCs
productivity is associated with being present at your desk rather than the marginal output
an employee adds on to the company. “Businesses use absenteeism rates as an indicator of
engagement and productivity because it’s easy to quantify. If your employee is at their
desk or on the work site, you can tick a box.” (EHSToday, 2016.) An employee’s presence
at work does not necessarily mean that he or she is performing well as well. Employers
need to realize that there is exist a probability of the employee being mentally absent
regardless of him or her being physically present. ”Unlike absenteeism, presenteeism
isn’t always apparent. You know when someone doesn’t show up for work, but you
often can’t tell when-or how much-illness or a medical condition hinders someone’s
performance.” (Hemp, 2004.)
The problem lies with the social stigma and job insecurity associated with
absenteeism. In a country like Pakistan where the job market is extremely competitive
as every year hundreds of thousands of students are graduating with a college degree,
the current job holders always feel the pressure of being challenged by others for the
same position. The situation is even more intense in MNCs where the competition is
cut throat. In such instances employees prefer to avoid being absent from office even

65
if they are sick so as to avoid any chances of any disciplinary action or bad repute
amongst the bosses. (Quazi, 2013, 130-150.) It is necessary for the employers to
realize that the cost associated with presenteeism is even higher than absenteeism and
the worst part is the employer can never fully estimate the presenteeism cost as
nobody knows how inefficient the employee is and how much his or her inefficiency
costing the organization in monetary terms. Therefore it is absolutely necessary to
develop a culture of acceptance towards absenteeism and rather target the cause
behind presenteeism or absenteeism such as obesity or other common health risks
associated with sedentary office lifestyle.
6.5 Limitation of this Research and Recommended future Research
Finally there are quite a few limitations within the thesis that need to be considered. Firstly
this thesis does not focus on all the MNCs operating within Pakistan. Only those MNCs
were targeted where the HR was supportive or where I have had friends or ex-colleagues
employed, who helped in getting in touch with the relevant people within the
organizations. Secondly though most of the MNCs operating in Pakistan have English as
their working and therefore the questionnaire was also developed in English but English is
not the mother tongue of any of the participants of this study. This might have caused a
slight bias as people who did not feel comfortable in filling out the questionnaire in
English could not have participated. Thirdly the sample set for this study was quite small.
Though the aim was to get somewhere around a couple of hundred employees for this
study but eventually only 87 employees filled out the questionnaire. This might have
resulted in some unexpected results which could have been on the other side of the
spectrum if there was a bigger sample set. Lastly though the thesis tried to cover several
aspect relating to employee productivity such as presenteeism, common health risks and
healthcare costs, still aspects like absenteeism and impact of long working hours were not
included in the scope of the thesis; including them could have helped get more insight into
the current situation.
This is a pioneering research in the domain of PA and employee productivity in Pakistan
and can open up doors for quite a few interesting research topics. Though it has tried to
cover a few aspects in relation to PA for MNC employees, a lot of further detailed research
66
can still be carried out in this domain. Using this research as a reference, a more detailed
research using experimental research methods can be implemented for a bigger target
group. Rather than going for employees’ perceptions, future researchers can try to
implement a control experiment where participants’ on-job productivity is measured
through certain parameters at various intervals within the research. Providing the
participants with a detailed daily PA plan and checking the impact it can have on their
productivity pre and post treatment can help tell the true impact PA has on employee
health and productivity. Though for such research to take place it is more feasible that the
researchers do not face any geographical barriers and are in constant contact with the
participants of the study.
To sum it all up, this thesis has tried to take a peek into the current PA trends of employees
working within MNCs in Pakistan. The thesis has primarily focused on participants’
perceptions to try to answer questions related to employee productivity in association to
PA and have tried to touch other aspects related to inactive lifestyle such as common
health risks, healthcare costs and presenteeism cost. The research has provided a variety of
results using data gathered via an e-questionnaire and analyzed primarily through SPSS.
This research has opened the door for future research in the neglected domain of health
promotion within Pakistan. It would be beneficial for future researchers take into
consideration this research if they intend to explore relevant areas of research in Pakistan.
Lastly employers should also try to utilize such pieces of research to improve the overall
efficiency of their workforce.

67
References
A brief history of the Kashmir conflict (2001, September 24). The Telegraph. Retrieved
from http://www.telegraph.co.uk/news/1399992/A-brief-history-of-the-Kashmir-
conflict.html
Alam, K. (2015). October 16). Pakistan has the 18th largest middle class. The Express
Tribune. Retrieved from http://tribune.com.pk/story/973649/pakistan-has-18th-
largest-middle-class-in-the-world-report/
Arshad, Z. (2008). The Economic Contribution of Pakistani Women through their Unpaid
Labor. Society for Alternative Media and Research and Health Bridge, 1, 1-29
Bahadur, K. (1998). Democracy in Pakistan: Crises and Conflicts. New Delhi: HAR-
ANAND Publications Pvt. Ltd.
Baicker, K., Cutler, D., & Song, Z. (2010). Workplace Wellness Programs can generate
savings. Health Affairs, 29(2), 304-311.
Barker, F. (1988). Worksite health promotion – today and tomorrow. In H. Myers (Eds.),
Decreasing barriers: A blueprint for Workplace Health in the Nineties (5-16).
Dallas: American Heart Association.
Bell, J. (2005). Doing your Research Project (4th ed.). Berkshire: Open University Press.
Berry, L. L., Mirabito, A. M., & Baun, W. B. (2010). What is the hard return on Employee
Wellness Program? Harvard Business Review, December 2010, 104-112.
Brill, J. E. (2008). Likert Scale. In Lavrakas, P. J. (Ed.), Encyclopedia of Survey Research
Methods (427-429). London: SAGE Publications.
Chow, S. L. (2010). Experimental Design. In Salkind, N. J. (Eds.), Encyclopedia of
Research design (448-452). London: SAGE Publications.
Curwin, J., & Slater, F. (2008). Quantitative methods for business decisions (6th ed.).
London: Thomson Learning.

68
Creswell, J. W. (2009). Research design: Qualitative, quantitative, and mixed methods
approaches. Los Angeles: Sage.
Elavsky, S., McAuley, E., Motl, R. W., Konopack, J. F., Marquez, D. X., Hu, L., Jerome,
G. J., & Diener, E. (2005). Physical activity enhances long-term quality of life in
older adults: Efficacy, esteem, and affective influences. Annals of Behavioral
Medicine, 30(2), 138–145. doi: 10.1207/s15324796abm3002_6
Employee productivity (2016). Retrieved on June 12, 2016 from
http://smallbusiness.chron.com/employee-productivity-efficiency-calculations-
841.html
Freedomhouse (2015). Retrieved on 25 August, 2016 from
https://freedomhouse.org/report/freedom-world/2015/Pakistan
Garrison, B. (2010). Successful strategies for computer-assisted reporting. New York:
Routledge
Gebhardt, D. L., & Crump, C. E. (1990). Employee fitness and wellness in the workplace.
American Psychologist, 45(2), 262-272.
Glenn, J. C. (2010). Handbook of Research Methods. New Delhi: Oxford Book Company.
Global Physical Activity Questionnaire (2015). Retrieved on September 28, 2015 from
http://www.who.int/chp/steps/GPAQ/en/
Government of Pakistan. Finance Division. 2014. Federal Budget 2014-15: Budget in
Brief. Retrieved from http://finance.gov.pk/budget/Budget_in_Brief_2014_15.pdf
Grann, J. D. (2000). Assessment of emotions in older adults: Mood disorders, anxiety,
psychological well-being, and hope. In R. L. Kane & R. A. Kane (Eds.), Assessing
older persons measures, meaning, and practical applications. United States of
America: Oxford University Press.
Hagberg, J. M., Park, J. J., & Brown, M. D. (2000).The Role of Exercise Training in the
Treatment of Hypertension: An Update. Sports Medicine. 30(3), 193-206.
69
Hamdy, O., Goodyear, L. J., & Horton, E. S. (2001). Diet and exercise in type 2 diabetes
mellitus. Endocrinology Metabolism Clinics of North America, 30(4); 883-907.
Hashim, A. (2013, April 30). Pakistan: A political timeline. ALJAZEERA. Retrieved from
http://www.aljazeera.com/indepth/interactive/2012/01/20121181235768904.html
Hassan, E. (2005). Recall Bias can be a Threat to Retrospective and Prospective Research
Designs. The Internet Journal of Epidemiology, 3(2), 1-7.
http://print.ispub.com/api/0/ispub-article/13060
Hemp, P. (2004). PRESENTEEISM: AT WORK BUT OUT OF IT. Harvard Business Review,
82(10), 49-58. https://hbr.org/2004/10/presenteeism-at-work-but-out-of-it
Howard, K.J., Howard, J.T., & Smyth, A.F. (2012). The Problem of Absenteeism and
Presenteeism in the Workplace. In Gatchel, R. J., & Schultz, I. Z. (Eds.), Editors
Handbook of Occupational Health and Wellness (151-179). USA: Springer.
IBM SPSS Software (2016). Retrieved on May 25, 2016 from
http://www.ibm.com/analytics/us/en/technology/spss/
Indo-Pakistan war of 1971 (2016). Retrieved on September 9, 2016 from
http://www.globalsecurity.org/military/world/war/indo-pak_1971.htm
International Institute for Democracy and Electoral Assistance (IDEA) (2013). Retrieved
June 6, 2016 from http://www.idea.int/vt/countryview.cfm?CountryCode=PK
International Labor Organization: Pakistan Labor Market Update (2013). Retrieved on
June 7, 2016 from http://www.ilo.org/wcmsp5/groups/public/---asia/---ro-
bangkok/---ilo-islamabad/documents/publication/wcms_222834.pdf
Joshua B. (2014, February 27). 10 of the biggest slumps in the world. The Richest.
Retrieved from http://www.therichest.com/rich-list/poorest-list/10-of-the-largest-
slums-in-the-world/
Kardar, S. (2014, October 28). The growing middle class. DAWN. Retrieved from
http://www.dawn.com/news/1140783

70
Khan, M. Z. (2009, November 9). Women represent 28pc of workforce. DAWN. Retrieved
from http://www.dawn.com/news/762797/women-represent-28pc-of-workforce
Khan, M. Z. (2016, April 8). New poverty line makes a third of Pakistanis poor. DAWN.
Retrieved from http://www.dawn.com/news/1250694
Khan, Y. H. (2015, July 13). A hotbed of unskilled force. The News. Retrieved from
http://labourwatchpakistan.com/hotbed-unskilled-force/
Lee, S., McCann, D., & Messenger, J., C. (2007). Working Time around the World: Trends
in working hours, laws and policies in a global comparative perspective. Routledge
Studies in the modern world economy, 2, 199-200.
Leslie, J. H., Braun, K. L., Novotny, R., & Mokuau, N. (2013). Factors Affecting Healthy
Eating and Physical Activity Behaviors among Multiethnic Blue- and White-collar
Workers: A Case Study of One Healthcare Institution. Hawaii J Med Public
Health, 72(9), 300-6.
Lucas, K., & Lloyd, B. (2005). Health and health promotion: ‘Theory’, models and
approaches. Health promotion: Evidence and experience (pp. 5-22). London:
SAGE Publications.
Merchant, J., Griffin, B. L., & Charnock, A. (2007). Sport and physical activity: The role
of health promotion, 1, 24-25.
Mrug, S. (2010). Survey. In Salkind, N. J. (Eds.), Encyclopedia of Research design (1472-
1476). London: SAGE Publications.
Multination corporation-MNC (2016). Retrieved on June 12, 2016 from
http://www.investopedia.com/terms/m/multinationalcorporation.asp
Nanan, D. (2001). HEALTH STATUS OF THE PAKISTANI POPULATION. American
Journal of Public Health, 91(10), 1545.

71
Nanan, D. (2002). The obesity pandemic-implications for Pakistan. Journal of Pakistan
Medical Association, 52(8), 342-6.
jpma.org.pk/full_article_text.php?article_id=2356
National Action Plan for Prevention and Control of Non-Communicable Diseases and
Health Promotion in Pakistan (2004). Retrieved November 8, 2015 from
http://www.physicalactivityplan.org/resources/Pakistan.pdf
National Institute of Population Studies [Pakistan] and ICF International. 2013. Pakistan
Demographic and Health Survey 2012-13. Calverton, Maryland, USA: National
Institute of Population Studies and ICF International. Retrieved from
http://www.nips.org.pk/abstract_files/PDHS%20Key%20Findings%20FINAL%20
1.24.14.pdf
Neck, C. P., & Cooper, K. H. (2000). The Fit Executive: Exercise and Diet Guidelines for
Enhancing Performance. The Academy of Management Executive (1993-2005),
14(2), 72-8
Pakistaneconomist: Demographics Indicators of Pakistan (2015). Retrieved on 26 August,
2016 from http://www.pakistaneconomist.com/database2/feedback/dem-ind.php
Popper, K. (2004). The logic of scientific discovery. New York: Routledge.
Prince, S. A., Adamo, K. B., Hamel, M. E., Hardt, J., Gorber, S. C., & Tremblay, M.
(2008). A comparison of direct versus self-report measures for assessing physical
activity in adults: a systematic review. The International Journal of Behavioral
Nutrition and Physical Activity, 5, 56. http://doi.org/10.1186/1479-5868-5-56
Quazi, H. (2013). Presenteeism: The invisible cost to organizations. London: Palgrave
Macmillan.
Ranasinghe, C. D., Ranasinghe, P., Jayawardena, R., & Misra, A. (2013). Physical activity
patterns among south-asian adults: A systematic review. International Journal of
Behavioral Nutrition and Physical Activity, 10(116). doi:10.1186/1479-5868-10-
116

72
Rehab Measures: Life Satisfaction Questionnaire 9 (2010). Retrieved on October 1, 2015
from http://www.rehabmeasures.org/Lists/RehabMeasures/DispForm.aspx?ID=958
Research Methods Knowledge Base (2006). Introduction to Validity. Retrieved February
8, 2010 from http://www.socialresearchmethods.net/kb/introval.php
Richey, R. C., & Klein, J. D. (2009). Design and Development Research: Methods,
Strategies, and Issues. New York: Routledge
Robertson, I., & Cooper, C. (2011). Well-being: Productivity and Happiness at Work.
London: Palgrave Macmillan.
Saeed, M. F. (2011, June 1). Physical education. Pakistan Today. Retrieved from
http://www.pakistantoday.com.pk/2011/06/01/comment/physical-education/
Sharifzadeh, M. (2013). Does Fitness and Exercises Increase Productivity? Assessing
Health, fitness and Productivity Relationship. American Journal of Management,
13(1), 32-52.
Suleri, A. Q. (2014, August 31). Prerequisite to stability. SDPI. Retrieved from
https://www.sdpi.org/media/media_details1902-article-2014.html
Ten key facts on physical activity in the WHO European Region (2016). Retrieved on May
29, 2016 from http://www.euro.who.int/en/health-topics/disease-
prevention/physical-activity/data-and-statistics/10-key-facts-on-physical-activity-
in-the-who-european-region
Testing for Normality using SPSS Statistics (2013). Retrieved on July 15, 2016 from
https://statistics.laerd.com/spss-tutorials/testing-for-normality-using-spss-
statistics.php
The average Pakistani spends just 5.7 years on education (2010, October 5). The Express
Tribune. Retrieved from http://tribune.com.pk/story/58526/the-average-pakistani-
spends-just-5-7-years-on-education/

73
The Borg Scale of perceived exertion (2015). Retrieved on September 30, 2015 from
https://www.hsph.harvard.edu/nutritionsource/borg-scale/
The World Bank: Mortality rate, infant (per 1,000 live births) (2016). Retrieved on August
4, 2016 from http://data.worldbank.org/indicator/SP.DYN.IMRT.IN
Top 10 nuclear power countries in the world (2014). Retrieved on 26 August, 2016 from
http://www.whichcountry.co/top-10-nuclear-power-countries-in-the-world/
UNESCO. (2012). Education in Pakistan. Education for All Global monitoring Report.
Retrieved from
http://www.unesco.org/new/fileadmin/MULTIMEDIA/HQ/ED/pdf/EDUCATION_
IN_PAKISTAN__A_FACT_SHEET.pdf
Van horn, C. E., & Schaffner, H. A. (2003). Work in America, an encyclopedia of history,
policy and society (1st ed.). USA: ABC-CLIO.
Vuori, I. (2004). Physical Inactivity as a disease risk and health benefits of increased
Physical Activity. In P. Oja & J. Borms (Eds.), Health Enhancing Physical Activity.
United Kingdom: Meyer & Meyer Sport (UK) Ltd.
World Health Organization, (2004). An up-date on the status of physical education in
schools worldwide: technical report for the world health organization. Geneva:
Hardman, K.
Worldometers (2016). Retrieved on August 2, 2016 from
http://www.worldometers.info/world-population/pakistan-population/

74
Appendices
Appendix 1. Master’s Thesis e-Questionnaire
Section 1: Background Information
Please fill out the following information before you move to the next section:
a. Age: __________ years
b. Gender: __________
c. Marital Status: __________
d. Family Size: __________
e. Work Experience: __________ years
f. Salary (per month):
i. Less than PKR 50,000 Pakistani Rupee
ii. 50,000 – 100,000 Pakistani Rupee
iii. 100,000-150,000 Pakistani Rupee
iv. 150,000-200,000 Pakistani Rupee
v. Above 200,000 Pakistani Rupee
Section 2: Level of Physical Activity
Q1. How do you define Physical Activity?
_________________________________________________________________________
_________________________________________________________________________
Q2. Do you spend any time doing any sort of physical activity either in home or out of home?
a. Yes
b. No
Q3. If yes, then please try to appraise your feeling of exertion as honestly as possible,
without thinking about what the actual physical load is. Your own feeling of effort and
exertion is important, not how it compares to other people. Look at the scales and the
expressions and then give a number.
Note: 9 corresponds to "very light" exercise. For a healthy person, it is like
walking slowly at his or her own pace for a few minutes
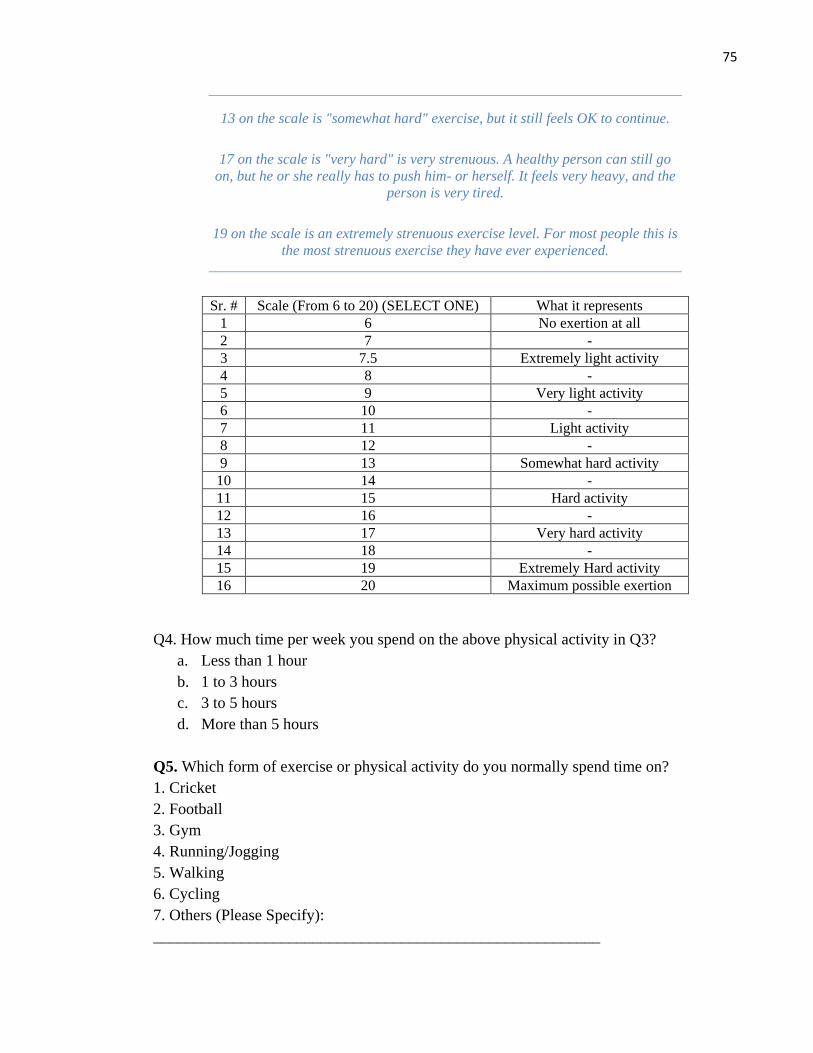
75
13 on the scale is "somewhat hard" exercise, but it still feels OK to continue.
17 on the scale is "very hard" is very strenuous. A healthy person can still go
on, but he or she really has to push him- or herself. It feels very heavy, and the
person is very tired.
19 on the scale is an extremely strenuous exercise level. For most people this is
the most strenuous exercise they have ever experienced.
Sr. # Scale (From 6 to 20) (SELECT ONE) What it represents
1 6 No exertion at all
2 7 -
3 7.5 Extremely light activity
4 8 -
5 9 Very light activity
6 10 -
7 11 Light activity
8 12 -
9 13 Somewhat hard activity
10 14 -
11 15 Hard activity
12 16 -
13 17 Very hard activity
14 18 -
15 19 Extremely Hard activity
16 20 Maximum possible exertion
Q4. How much time per week you spend on the above physical activity in Q3?
a. Less than 1 hour
b. 1 to 3 hours
c. 3 to 5 hours
d. More than 5 hours
Q5. Which form of exercise or physical activity do you normally spend time on?
1. Cricket
2. Football
3. Gym
4. Running/Jogging
5. Walking
6. Cycling
7. Others (Please Specify):
________________________________________________________
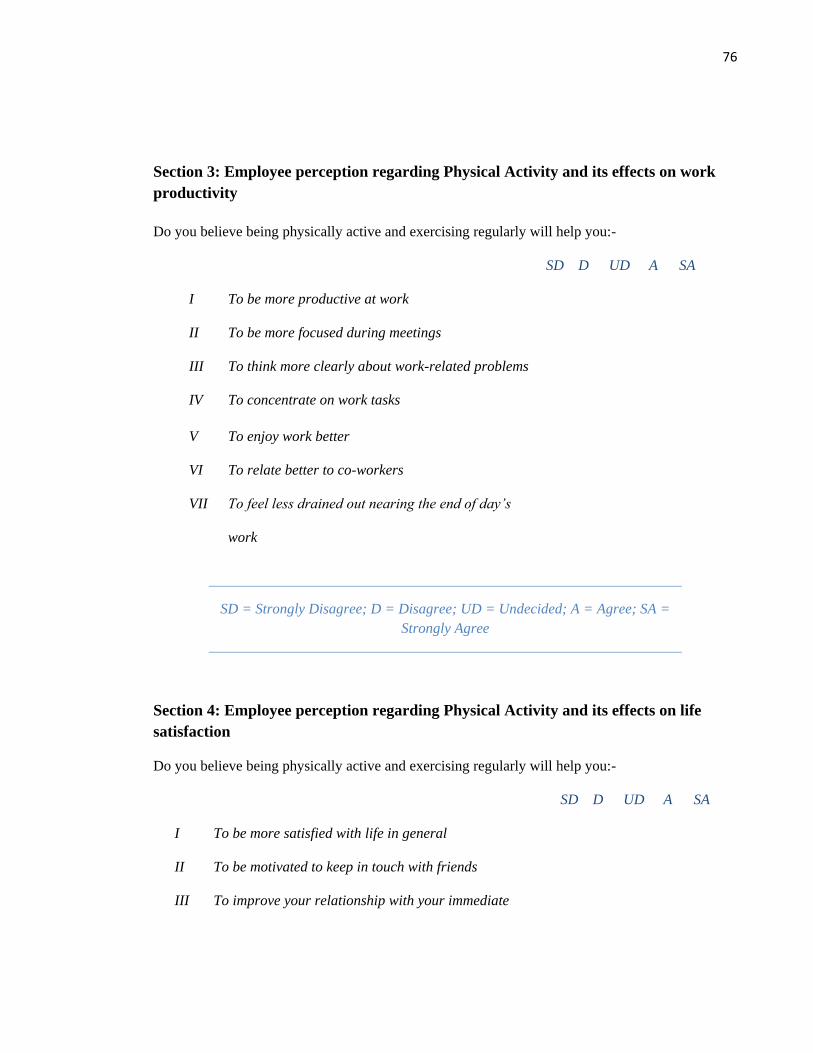
76
Section 3: Employee perception regarding Physical Activity and its effects on work
productivity
Do you believe being physically active and exercising regularly will help you:-
SD D UD A SA
I To be more productive at work
II To be more focused during meetings
III To think more clearly about work-related problems
IV To concentrate on work tasks
V To enjoy work better
VI To relate better to co-workers
VII To feel less drained out nearing the end of day’s
work
SD = Strongly Disagree; D = Disagree; UD = Undecided; A = Agree; SA =
Strongly Agree
Section 4: Employee perception regarding Physical Activity and its effects on life
satisfaction
Do you believe being physically active and exercising regularly will help you:-
SD D UD A SA
I To be more satisfied with life in general
II To be motivated to keep in touch with friends
III To improve your relationship with your immediate
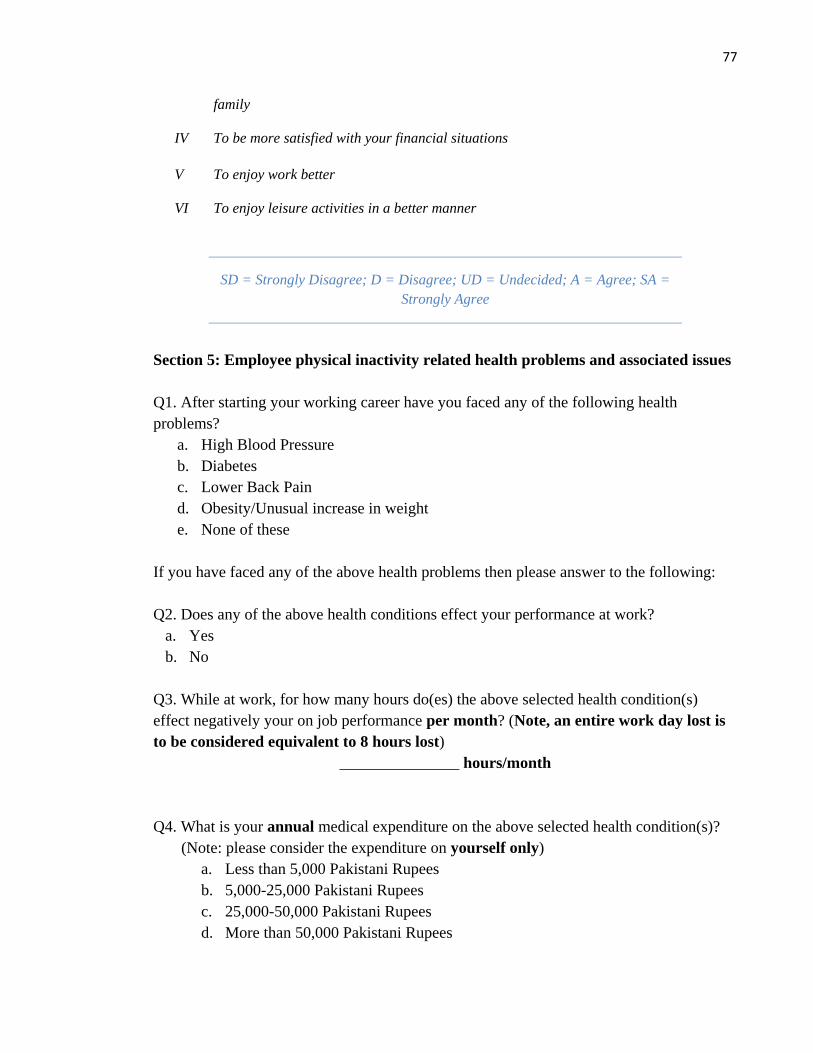
77
family
IV To be more satisfied with your financial situations
V To enjoy work better
VI To enjoy leisure activities in a better manner
SD = Strongly Disagree; D = Disagree; UD = Undecided; A = Agree; SA =
Strongly Agree
Section 5: Employee physical inactivity related health problems and associated issues
Q1. After starting your working career have you faced any of the following health
problems?
a. High Blood Pressure
b. Diabetes
c. Lower Back Pain
d. Obesity/Unusual increase in weight
e. None of these
If you have faced any of the above health problems then please answer to the following:
Q2. Does any of the above health conditions effect your performance at work?
a. Yes
b. No
Q3. While at work, for how many hours do(es) the above selected health condition(s)
effect negatively your on job performance per month? (Note, an entire work day lost is
to be considered equivalent to 8 hours lost)
_______________ hours/month
Q4. What is your annual medical expenditure on the above selected health condition(s)?
(Note: please consider the expenditure on yourself only)
a. Less than 5,000 Pakistani Rupees
b. 5,000-25,000 Pakistani Rupees
c. 25,000-50,000 Pakistani Rupees
d. More than 50,000 Pakistani Rupees

78
Q5. Has your annual medical expenditure on the selected health condition(s)
a. Increased
b. Remained the same
c. Decreased
during the last two years?