perceptions of patient safety culture in four health
TRANSCRIPT
Perceptions of Patient Safety Culture in Four Health Regions
Prepared by: Liane R. Ginsburg Assistant Professor
School of Health Policy & Management York University [email protected]
April 2006

Table of Contents
Background
…1
Subjects
…1
Questionnaire
…1
Response Rates
…2
Using Patient Safety Culture Data to Drive Change and Improvement
…3
Data Analysis & Reporting …3Comparing Mean Scores by Region, Staff Group and Sector …3Data for individual survey Questions …4
Results
…5
By region …5By staff category …7By Sector …8Site comparisons by question …9
Discussion and Interpretation
…11
Identifying Areas for Celebration and Areas for Improvement …11Identifying the Most Important Survey Questions …12Considering Performance and Importance
…12
Other Options for Considering These Data
…13
References
…14
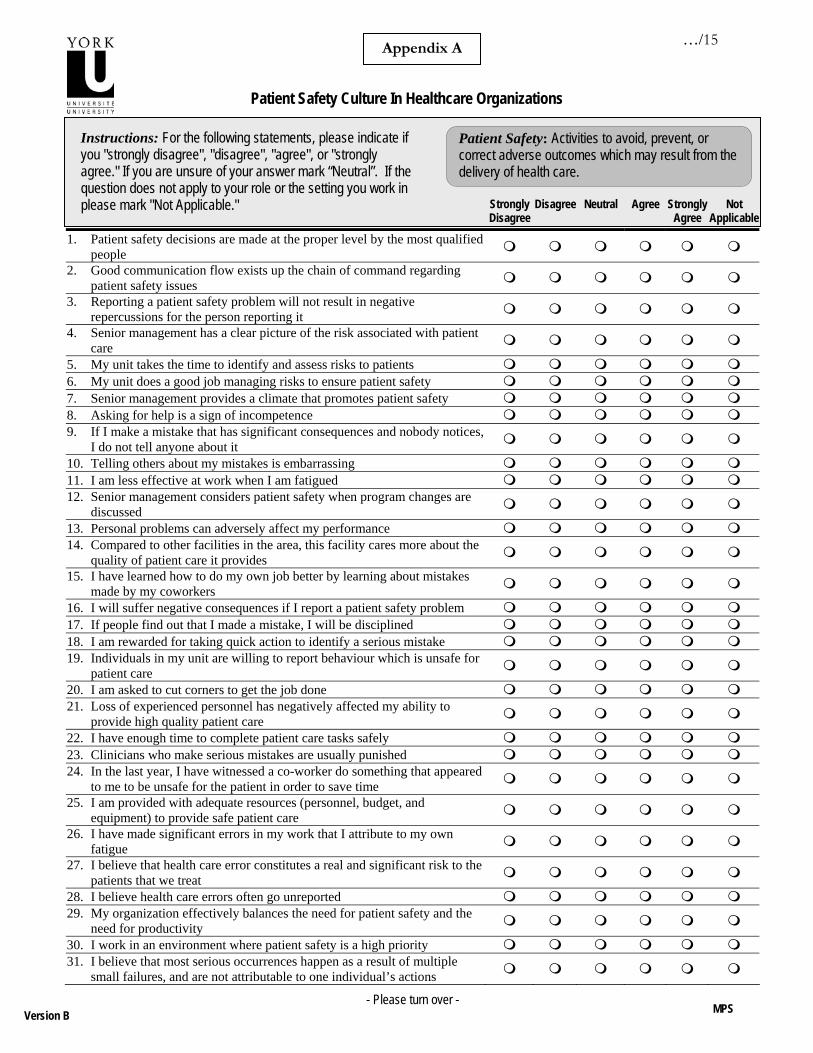
Appendix A – Patient Safety Culture Questionnaire …15 Appendix B – Data for Individual Questions by Region
…17
…/1
Perceptions of Patient Safety Culture in Four Health Regions
In the Fall of 2005 four Health Regions in one Canadian province participated in an initiative where each organizations collected questionnaire data from staff across their region to help examine patient safety culture. This report provides a summary of the data collected as part of this initiative. Background The provincial body undertook this initiative as part of its mandate to coordinate and promote activities that enhance patient safety and quality care in that Province. A variety of instruments that have been used to measure patient safety culture were examined and a decision was made to use the Modified Stanford Instrument (MSI). This instrument, initially developed by Singer, Gaba, et al., (2003), was modified by a group of Canadian researchers in 2002 and used in a study that examined the effects of a patient safety educational intervention on nurse leader perceptions of patient safety culture (Ginsburg, Norton, Casebeer, & Lewis, 2005). Since this decision to implement the MSI in these 4 provincial health Regions, a larger study has been funded by the Canadian Patient Safety Institute to more closely examine the properties of the MSI with multiple staff groups and multiple settings in several Canadian jurisdictions. This broader research, which is currently getting underway, will also examine links between patient safety culture and patient safety improvement activity. Subjects The safety body worked together with each of the 4 participating health regions to identify all staff members in the region whose role linked them with patient care (either directly or indirectly). This means that all staff in each region, with the exception of support staff in administrative departments, were identified to receive the MSI Patient Safety Culture Survey. Staff were surveyed in the fall of 2005. A three-stage mailing approach was used where all identified staff received a survey in October 2005 and a reminder card two weeks after the initial mailing. A second survey was sent to all non-respondents 4 weeks after the reminder cards were sent out. This approach led to the collection of data from direct care providers, clinical care managers, direct (E.g. unit clerk) and non-direct care support staff (E.g. maintenance staff) and non-direct care managers (e.g food services supervisor). Data were collected from staff in all sectors including pre-hospital care, acute care, long term (personal) care, community care, mental health. Questionnaire Staff were mailed a 36-item patient safety culture questionnaire (adapted from Singer, Gaba et al., 2003 and Ginsburg et al., 2005). The survey included items in four areas previously found to be valid, reliable, and meaningful: (1) Valuing safety at the organization and department level – 10 items; (2) Fear of repercussions – 4 items; (3) Perceived State of safety – 8 items; (4) Supervisory leadership – 4 items1. The first 3 grouping emerged from the initial Canadian Study and the 4th group was taken from the Agency for Healthcare Research and Quality Hospital Survey on Patient Safety Culture (AHRQ, 2005). Each of these questions were answered using a 5-point agree-disagree Likert type scale with a “not applicable” option.
1 The psychometric properties of the instrument were reported previously (Ginsburg et al., 2005).

…/2
The questionnaire also contained 2 items adapted from the AHRQ survey designed to provide an overall assessment of patient safety culture at the unit and regional level. These two questions were answered using an A (excellent) through F (Failing) rating scale. The questionnaire can be found in Appendix A. Response Rates The response rate was 30% across all 4 regions. Table 1 shows response rates by region and by staff category. For the regional response rates, the number of surveys mailed out and returned is not shown in order to protect the identity of the 4 regions that participated in the study. The number of respondents is also shown by sector and as a proportion of all responses. Response rates could not be calculated by sector as we relied on a combination of site information and respondent information to link respondents to sectors. The sector data should be interpreted with care as certain sectors are more likely to be underreported (MH and LTC) because of the way the questionnaire was structured.
Table 1 - Respondents # returned/
# sent out Response
rate Across Full Sample 1790/5993 30%
By Region Region 1 36% Region 2 31% Region 3 28% Region 4 26%
By Staff Category Nursing 563/1656 34% Care assistants 423/1626 26% Allied HPs, health care technicians, EMS staff 297/966 31% Direct Care Managers 177/297 60% Support Staff (direct care and non-direct care areas) 261/1253
21%
# returned in sector
Proportion of respondent
group By Sector
Acute Care 549 30.7% Long Term Care 445 24.9% Community / Out-Patient Care 435 24.3% Pre-hospital Care 103 5.8% Mental Health Services 56 3.1% Acute & Community Care 160 8.9% Corporate or unknown 42 2.3% TOTAL Returns 1790 100%

…/3
Using Patient Safety Culture Data to Drive Change and Improvement Survey items reflect perceptions of the importance of patient safety on the unit and in the organization, perceptions of how safety failures are handled, the state of attitudes and knowledge regarding patient safety issues and perceptions of the state of patient safety in the organization. There are many ways to consider and approach data such as these when it comes to driving change initiatives.
(1) Looking at high and low performance on individual survey items. It is reasonable and may be important to examine items where a fairly low proportion of staff give positive responses while at the same time celebrating those areas where an organization achieves a very high percentage of positive responses (e.g where over 80% of staff agree and strongly agree with various individual survey items).
(2) Focusing on questions that reflect areas that are the most important to staff. Using simple correlations between individual survey items and overall ratings of patient safety can help to prioritize which items are the most important contributors to overall safety ratings from staff members’ perspectives. Combining this knowledge with knowledge from (1) above can help regions focus in on areas that are particularly important and are achieving fewer positive responses.
(3) Benchmarking - Looking for high performing groups. Looking to other groups for which similar data are available can provide useful learning opportunities. It is reasonable to consider how other similar organizations perform using the same instrument and, in particular, how specific sites within a health region perform. Indeed, in a regionalized setting, it is likely that sites will provide richer sources of meaningful variation for comparison and learning purposes. There were 15 sites in this dataset with respondent groups large enough to permit meaningful comparisons (15 sites had >30 respondents). Comparing these data at a regional level is not recommended because (a) using a unit of analysis that is regional will be heavily biased by larger sites in the region, and (b) culture within a region is likely to be a heterogeneous aggregate of what are really more meaningful homogeneous site and professional sub-cultures.
Data Analysis & Reporting
In keeping with the above suggestions for how to use these data to foster change and improvement, data are reported in several ways. Comparing Mean Scores by Region, Staff Group and Sector. First, data are presented for groups of questions that were used to measure each of the four broad areas covered by the survey noted above: (1) Valuing safety at the organization and department level; (2) Fear of repercussions; (3) Perceived State of safety; and (4) Supervisory leadership (see Box 1 for questions in each dimension). Mean scores on each of these dimensions of patient safety culture are presented by staff group and by sector (for all 4 regions combined), and by region. These high level data are presented in tables 2 through 4 and are designed to show broad differences across these groups. The 95% Confidence Internal (CI) of the mean is provided to help make it clear when differences between groups should be considered statistically significant. If the lower and upper bounds of the 95% CI for 2 groups overlap, then differences between the groups are NOT statistically significant2. These data are presented in tables 2 through 4 and some discussion is 2 A Confidence Interval of the mean reflects the fact that mean scores are actually estimates of the mean (E.g the mean will vary from sample to sample of respondents with these 4 health regions). Instead of a single estimate for the mean, a confidence interval generates a lower and upper limit for the mean. The interval estimate gives an indication of how

…/4
provided indicating which differences are statistically significant as well as what level of difference should be considered clinically meaningful3. Data for individual survey Questions. More detailed data are shown by reporting the percentage of positive responses for each of the individual questions that make up these four dimensions. The percentage of positive responses includes the percentage of respondents who agreed or strongly agreed with the positively worded statements in the questionnaire and, for negatively worded statements, the percentage of respondents who disagreed or strongly disagreed with the statement. These data on individual questions are provided on a site by site basis. Consistent with the suggestions above, Regions are encouraged to look at and learn from their own high and low performing questions, as well as lower performing areas where another site performed very well and might provide opportunities for networking, data sharing and learning. The safety body that initiated the project will facilitate this networking process by brokering contacts between sites wishing to share current practice in these areas. Responses for individual questions for each Region are provided in Appendix B.
Box 2 – Survey Items in Each of the Four Dimensions
Valuing Safety Senior management provides a climate that promotes patient safety Patient safety decisions are made at the proper level by the most qualified people Good communication flow exists up the chain of command regarding patient safety issues Senior management has a clear picture of the risk associated with patient care My organization effectively balances the need for patient safety and the need for productivity My unit does a good job managing risks to ensure patient safety Senior management considers patient safety when program changes are discussed I work in an environment where patient safety is a high priority My unit takes the time to identify and assess risks to patients I am rewarded for taking quick action to identify a serious mistake Fear of Repercussions I will suffer negative consequences if I report a safety problem (%disagree) If people find out I made a mistake, I will be disciplined (%disagree) Clinicians who make serious mistakes are usually punished (%disagree) Reporting a patient safety problem will not result in negative repercussions for the person reporting it
State of Safety Loss of experienced personnel has negatively affected my ability to provide high quality patient care (%disagree) I have enough time to complete patient care tasks safelyI believe that health care error constitutes a real and significant risk to the patients that we treat (%disagree) In the last year, I have witnessed a co-worker do something that appeared to me to be unsafe for the patient in order to save time (%disagree) I have made significant errors in my work that I attribute to my own fatigue (%disagree) I believe health care errors often go unreported (%disagree) I am provided with adequate resources (personnel, budget, and equipment) to provide safe patient care Supervisory Leadership My supervisor says a good word when he/she sees a job done according to established patient safety procedures My supervisor seriously considers staff suggestions for improving patient safety Whenever pressure builds up, my supervisor wants us to work faster, even if it means taking shortcuts (% disagree) My supervisor overlooks patient safety problems that happen over and over (%disagree)
much uncertainty there is in the estimate of the true mean. The narrower the interval, the more precise the estimate and the smaller the size of the respondent group, the larger the confidence interval. 3 Effect sizes are used to comment on how clinically meaningful differences between groups are.

…/5
Results Comparing Mean Scores by Region, Staff Group and Sector. Table 2 shows the scores on each of the 4 safety culture dimensions by Region. Table 2 shows that regions tend to score between 3.5 and 4 out of 5 on three of the four dimensions, with lower scores (averaging closer to 3.0) on the state of safety dimension. This shows that responses to question in these dimensions tended to fall between 3 and 4 on a five-point scale where 1 is strongly disagree, 3 is neutral and 5 is strongly agree (with the statements in the dimension). Any negatively phrased items in the dimension were recoded so that a 1 = strongly agree and 5 = strongly disagree. Accordingly, a higher mean score is always a more positive score. None of the differences between the regions in Table 2 are significant which means that when data are rolled up to the region level, scores are the same across regions. For this reason and for reasons mentioned above (e.g larger sites bias region-level data), region-level data are not discussed in the remainder of the report.
Table 2 - Safety Culture Dimension Scores by Region
95% CI for Mean
N Mean Std.
Deviation Lower Bound
Upper Bound
Valuing Safety Region 1 3.71 0.64 3.63 3.78 Region 2 3.67 0.65 3.62 3.71 Region 3 3.60 0.67 3.54 3.65 Region 4 3.63 0.72 3.54 3.72 All Regions 1783 3.65 0.67 3.62 3.68 Fear of Repercussions Region 1 3.77 0.61 3.70 3.84 Region 2 3.71 0.60 3.67 3.75 Region 3 3.64 0.64 3.58 3.70 Region 4 3.70 0.67 3.62 3.79 All Regions 1784 3.70 0.62 3.67 3.73 State of Safety Region 1 3.01 0.66 2.94 3.09 Region 2 3.09 0.66 3.04 3.14 Region 3 3.08 0.62 3.02 3.13 Region 4 3.06 0.66 2.98 3.14 All Regions 1783 3.07 0.65 3.04 3.10 Supervisory Leadership Region 1 3.75 0.80 3.65 3.84 Region 2 3.65 0.77 3.60 3.71 Region 3 3.61 0.82 3.54 3.69 Region 4 3.64 0.84 3.53 3.74 All Regions 1760 3.65 0.80 3.62 3.69

…/6
Table 3 shows the scores on each of the 4 safety culture dimensions by staff group. There are several differences between various groups on these dimensions. On the Valuing Safety dimension, nurses and physicians score significantly lower than healthcare aides, clinical care managers, and support staff. On the fear of repercussions dimension, clinical care managers score more positively than all other groups and EMS staff score lower than nurses and health care aides on this dimension. Interestingly, on the state of safety dimension clinical care managers score LOWER than health care aides, allied and technicians, and support staff. Health care aides and support staff feel more positively about the state of safety than most clinicians (nurses, physicians and clinical care managers). In terms of supervisory leadership, clinical care managers give significantly more positive scores than both nurses and physicians. Effect sizes4 tell us about the clinical significance of these differences. Differences between groups of 0.2 or 0.3 on this 5-point scale would be considered small to medium effects. Differences between groups that approach 0.5 would be considered large effects. For instance, physicians score nearly 0.5 lower than clinical care managers on the valuing dimension, the fear of repercussions dimension and the supervisory leadership dimension.
4 Effect sizes are differences expressed as a proportion of the standard deviation. 0.2 is considered a small
effect, 0.5 a medium effect and 0.8 a large effect (Cohen & Cohen, 1983)

…/7
Table 3 - Safety Culture Scale Scores by Staff Category
95% CI for Mean
Staff Group N Mean Std.
Deviation Lower Bound
Upper Bound
Valuing Safety Nursing 558 3.51 0.69 3.46 3.57 Care assistant 423 3.70 0.70 3.63 3.76 Allied & technicians 208 3.65 0.60 3.57 3.73 Clinical Care manager 177 3.82 0.55 3.74 3.90
Direct & non-direct care support staff 260 3.73 0.57 3.66 3.80
Physicians 30 3.31 0.56 3.10 3.52 EMS staff 88 3.57 0.78 3.41 3.74 All Staff Groups 1744 3.64 0.67 3.61 3.67 Fear of Repercussions Nursing 559 3.71 0.62 3.65 3.76 Care assistant 423 3.69 0.62 3.63 3.75 Allied & technicians 209 3.64 0.55 3.56 3.71 Clinical Care manager 177 4.01 0.58 3.93 4.10
Direct & non-direct care support staff 259 3.60 0.60 3.53 3.67
Physicians 30 3.52 0.72 3.25 3.79 EMS staff 88 3.41 0.66 3.27 3.55 All Staff Groups 1745 3.69 0.62 3.66 3.72 State of Safety Nursing 559 3.02 0.63 2.97 3.07 Care assistant 422 3.17 0.64 3.11 3.23 Allied & technicians 208 3.11 0.57 3.03 3.18 Clinical Care manager 176 2.88 0.60 2.79 2.97
Direct & non-direct care support staff 261 3.19 0.71 3.10 3.28
Physicians 30 2.75 0.80 2.45 3.04 EMS staff 88 3.05 0.68 2.90 3.19 All Staff Groups 1744 3.07 0.65 3.04 3.10 Supervisory Leadership Nursing 555 3.59 0.79 3.52 3.65 Care assistant 420 3.71 0.86 3.63 3.79 Allied & technicians 207 3.65 0.72 3.55 3.75 Clinical Care manager 172 3.83 0.67 3.73 3.93
Direct & non-direct care support staff 255 3.59 0.81 3.49 3.69
Physicians 26 3.30 0.70 3.02 3.58 EMS staff 88 3.64 0.94 3.44 3.84 All Staff Groups 1723 3.65 0.80 3.61 3.69

…/8
Table 4 shows the scores on each of the 4 safety culture dimensions by sector. There are few differences between the sectors on these 4 safety culture dimensions. The pre-hospital care sector provides lower scores on the fear of repercussions dimension than acute, LTC and community sectors. The Mental Health sector also provides lower scores than acute care on this dimension. Finally on the state of safety dimension, the acute care sector provided lower scores than the community sector. All of these differences reflect relatively small effects. None of the differences between sectors on the valuing safety dimension or the supervisory leadership dimension are significant.
Table 4 - Safety Culture Scale Scores by Sector
Sector 95% CI for Mean
N Mean Std. DeviationLower Bound
Upper Bound
Valuing Safety Acute 547 3.62 0.66 3.56 3.67 LTC 445 3.68 0.68 3.62 3.75 Community 430 3.70 0.62 3.64 3.76 Pre-Hospital 103 3.62 0.77 3.47 3.76 Mental Health 56 3.55 0.60 3.39 3.71 All Sectors 1783 3.65 0.67 3.62 3.68 Fear of Repercussions Acute 546 3.75 0.57 3.71 3.80 LTC 444 3.72 0.64 3.66 3.77 Community 433 3.70 0.62 3.65 3.76 Pre-Hospital 103 3.49 0.68 3.35 3.62 Mental Health 56 3.46 0.67 3.28 3.64 All Sectors 1784 3.70 0.62 3.67 3.73 State of Safety Acute 548 3.01 0.68 2.96 3.07 LTC 444 3.09 0.65 3.03 3.15 Community 431 3.17 0.64 3.11 3.23 Pre-Hospital 103 3.03 0.66 2.90 3.16 Mental Health 56 3.04 0.48 2.91 3.17 All Sectors 1783 3.07 0.65 3.04 3.10 Supervisory Leadership Acute 542 3.63 0.78 3.56 3.69 LTC 441 3.63 0.82 3.55 3.71 Community 421 3.76 0.75 3.69 3.84 Pre-Hospital 103 3.66 0.93 3.48 3.84 Mental Health 56 3.54 0.79 3.32 3.75 All Sectors 1760 3.65 0.80 3.62 3.69

…/9
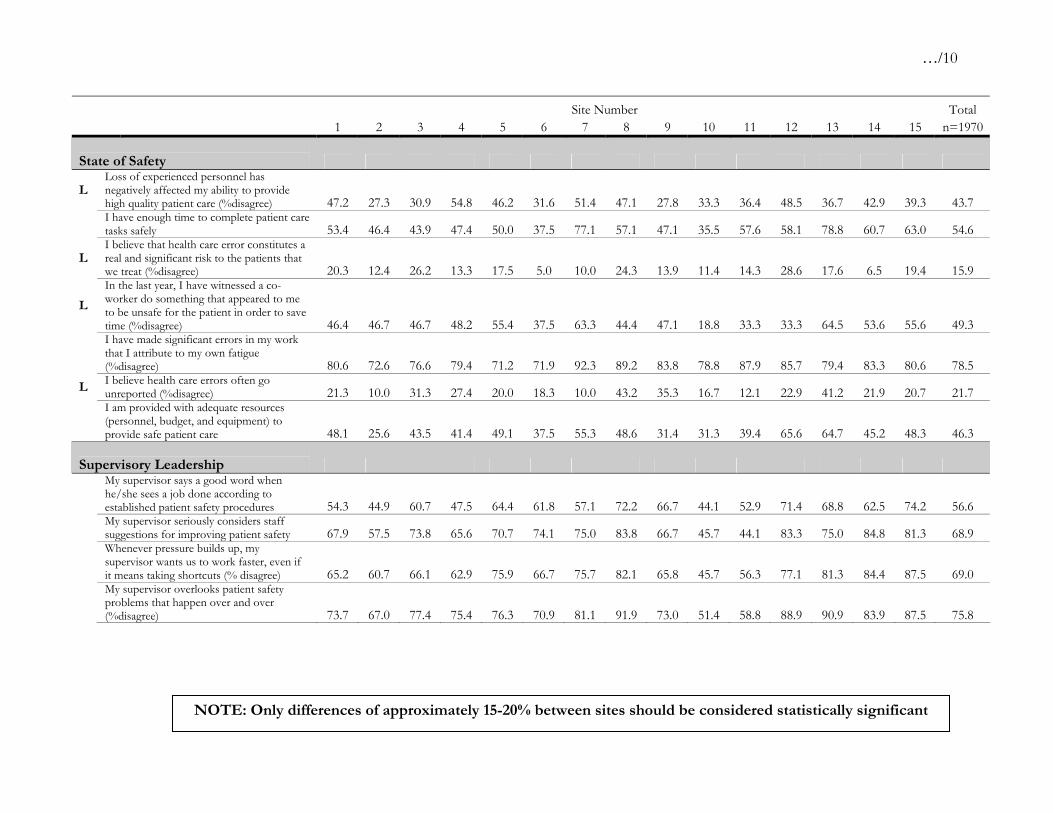
Data for individual survey Questions Table 5 and the remainder of the data presented focus on the proportion of positive responses to individual questions in the 4 dimension of patient safety culture. As noted, it is often these more detailed data that can best help drive specific change and improvement efforts.
Table 5 - Percentage of Positive Responses on Each Question by Site
Site Number Total 1 2 3 4 5 6 7 8 9 10 11 12 13 14 15 n=1970 Valuing Safety
Senior management provides a climate that promotes patient safety 64.7 51.8 53.3 60.3 83.6 54.2 71.8 75.7 68.4 65.7 48.6 91.2 79.4 90.9 70.0 66.7
Patient safety decisions are made at the proper level by the most qualified people 74.8 55.2 66.7 75.8 80.3 75.0 71.8 89.7 89.5 52.8 51.4 83.3 69.7 77.4 90.0 71.8
Good communication flow exists up the chain of command regarding patient safety issues 71.0 47.9 59.4 57.1 75.0 58.3 75.0 86.8 68.4 33.3 54.3 77.8 81.8 81.8 69.0 65.7
Senior management has a clear picture of the risk associated with patient care 62.8 45.5 40.6 54.8 64.5 58.3 61.5 89.2 57.9 50.0 55.9 72.2 81.8 81.8 43.3 58.7
My organization effectively balances the need for patient safety and the need for productivity 57.8 31.7 46.8 46.0 57.1 33.9 64.1 63.9 50.0 30.6 37.1 65.7 63.6 77.4 65.5 53.9
H My unit does a good job managing risks to ensure patient safety 91.2 71.9 80.6 75.9 86.7 76.8 78.9 97.4 89.5 81.8 82.4 94.3 87.5 96.9 87.1 83.1
Senior management considers patient safety when program changes are discussed 47.0 35.4 55.0 49.2 66.7 48.3 70.0 70.3 69.4 45.5 50.0 77.1 77.4 72.7 48.3 56.5
I work in an environment where patient safety is a high priority 83.6 63.9 85.9 71.4 88.3 63.9 74.4 89.7 91.9 69.4 71.4 91.7 94.1 100.0 84.4 79.9
H My unit takes the time to identify and assess risks to patients 83.9 73.0 85.7 79.7 83.3 72.7 74.4 91.9 91.7 81.8 80.0 91.4 84.4 100.0 83.9 83.1
L I am rewarded for taking quick action to identify a serious mistake 35.6 25.9 41.0 41.0 27.1 25.0 45.7 27.0 35.1 37.5 28.6 37.1 47.1 40.6 41.9 33.2
Fear of Repercussions H I will suffer negative consequences if I
report a safety problem (%disagree) 85.1 76.5 85.9 88.9 90.2 93.3 80.0 94.9 92.1 88.2 64.7 82.9 90.9 90.9 87.5 83.5
If people find out I made a mistake, I will be disciplined (%disagree) 56.7 53.4 56.7 66.7 60.7 53.3 61.5 55.3 50.0 51.4 39.4 55.6 66.7 56.3 55.2 53.8
L Clinicians who make serious mistakes are usually punished (%disagree) 41.8 34.3 50.0 44.4 27.3 50.9 47.2 40.0 35.7 51.6 21.4 25.8 41.4 37.0 30.8 40.8
Reporting a patient safety problem will not result in negative repercussions for the person reporting it 79.3 67.5 79.7 88.9 85.5 90.0 77.5 94.9 89.5 69.4 68.6 77.8 81.8 78.8 71.0 78.9
NOTE: Only differences of approximately 15-20% between sites should be considered statistically significant
…/10
Site Number Total 1 2 3 4 5 6 7 8 9 10 11 12 13 14 15 n=1970 State of Safety
L Loss of experienced personnel has negatively affected my ability to provide high quality patient care (%disagree) 47.2 27.3 30.9 54.8 46.2 31.6 51.4 47.1 27.8 33.3 36.4 48.5 36.7 42.9 39.3 43.7
I have enough time to complete patient care tasks safely 53.4 46.4 43.9 47.4 50.0 37.5 77.1 57.1 47.1 35.5 57.6 58.1 78.8 60.7 63.0 54.6
L I believe that health care error constitutes a real and significant risk to the patients that we treat (%disagree) 20.3 12.4 26.2 13.3 17.5 5.0 10.0 24.3 13.9 11.4 14.3 28.6 17.6 6.5 19.4 15.9
L
In the last year, I have witnessed a co-worker do something that appeared to me to be unsafe for the patient in order to save time (%disagree) 46.4 46.7 46.7 48.2 55.4 37.5 63.3 44.4 47.1 18.8 33.3 33.3 64.5 53.6 55.6 49.3
I have made significant errors in my work that I attribute to my own fatigue (%disagree) 80.6 72.6 76.6 79.4 71.2 71.9 92.3 89.2 83.8 78.8 87.9 85.7 79.4 83.3 80.6 78.5
L I believe health care errors often go unreported (%disagree) 21.3 10.0 31.3 27.4 20.0 18.3 10.0 43.2 35.3 16.7 12.1 22.9 41.2 21.9 20.7 21.7
I am provided with adequate resources (personnel, budget, and equipment) to provide safe patient care 48.1 25.6 43.5 41.4 49.1 37.5 55.3 48.6 31.4 31.3 39.4 65.6 64.7 45.2 48.3 46.3
Supervisory Leadership
My supervisor says a good word when he/she sees a job done according to established patient safety procedures 54.3 44.9 60.7 47.5 64.4 61.8 57.1 72.2 66.7 44.1 52.9 71.4 68.8 62.5 74.2 56.6
My supervisor seriously considers staff suggestions for improving patient safety 67.9 57.5 73.8 65.6 70.7 74.1 75.0 83.8 66.7 45.7 44.1 83.3 75.0 84.8 81.3 68.9
Whenever pressure builds up, my supervisor wants us to work faster, even if it means taking shortcuts (% disagree) 65.2 60.7 66.1 62.9 75.9 66.7 75.7 82.1 65.8 45.7 56.3 77.1 81.3 84.4 87.5 69.0
My supervisor overlooks patient safety problems that happen over and over (%disagree) 73.7 67.0 77.4 75.4 76.3 70.9 81.1 91.9 73.0 51.4 58.8 88.9 90.9 83.9 87.5 75.8
NOTE: Only differences of approximately 15-20% between sites should be considered statistically significant

…/11
Discussion and Interpretation Identifying Areas for Celebration and Areas for Improvement While table 5 reveals differences between sites on the proportion of positive responses for individual survey questions, it is also clear that the same groups of questions seem to receive higher and lower proportions of positive responses across all sites. Recall that the individual survey items reflect perceptions regarding leadership for safety at the unit level and in the organization, responses to reporting of safety failures and the state of safety in the organization. The far right column in table 5 reveals the %age of positive responses to each question across the 4 regions combined. Regions tend to receive a higher proportion of positive response to questions about how safety is valued and handled in the unit/organization and fewer positive responses to questions about the actual state of safety. These data are consistent with the idea that positive leadership support and cultural change around safety must precede real improvements in the state of safety. A summary of table 5 suggests opportunities for celebration on three areas where the regions achieved >80% positive responses (these items have an H on the left in table 5):
Q16. I will suffer negative consequences if I report a safety problem (%disagree)
83.5% disagree
Q6. My unit does a good job managing risks to ensure patient safety 83.1% agree
Q5. My unit takes the time to identify and assess risks to patients 83.1% agree
In terms of identifying opportunities for improvement, it may be useful to consider the five areas where the regions achieved fewer than 50% positive responses (these items have an L on the left in table 5):
Q24. In the last year, I have witnessed a co-worker do something that appeared to me to be unsafe for the patient in order to save time (%disagree)
49.3% disagree
Q21. Loss of experienced personnel has negatively affected my ability to provide high quality patient care (% disagree)
43.7% disagree
Q23. Clinicians who make serious mistakes are usually punished (%disagree)
40.8% disagree
Q18. I am rewarded for taking quick action to identify a serious mistake 33.2% agree
Q28. I believe health care errors often go unreported (%disagree) 21.7% disagree
Q27. I believe that health care error constitutes a real and significant risk to the patients that we treat (%disagree)
15.9% disagree

…/12
Identifying the Most Important Survey Questions Another approach to prioritizing areas for change and improvement is to try to identify which questions are the most important for patient safety. One way to do this is to look at those questions on the survey that contribute most to overall ratings of patient safety for the organization. To accomplish this each of the survey questions was correlated with the question on the survey which asked respondents to give an overall grade to their region on patient safety (q38). Questions with the highest correlation can be considered to be among the most important contributors to respondents overall safety rating. Box 2 shows 9 questions that were among the most highly correlated5 with overall safety ratings in all 4 regions in this initiative.
Box 2 Q2. Good communication flow exists up the chain of command regarding patient safety issues
Q4. Senior management has a clear picture of the risk associated with patient care
Q7. Senior management provides a climate that promotes patient safety
Q25. I am provided with adequate resources (personnel, budget, and equipment) to provide safe patient care
Q29. My organization effectively balances the need for patient safety and the need for productivity
Q30. I work in an environment where patient safety is a high priority
*Q40. The people who run this organization are quick to spend money to improve the quality of our services
*Q41. Senior managers in this organization are completely committed to the idea that if we study the way we do our work, we can make things better around here
*Q43. The organizational leaders are extremely active in identifying priority areas for improvement
*These 3 questions were asked at the end of the questionnaire using a different scale in a section with 9 questions on the organization’s improvement orientation. These questions are not included with other analyses because of the different response scale that was used (7-point agree-disagree Likert-type instead of 5-point). Considering Performance and Importance Finally, figure 1 on the next page plots (1) an items performance (percentage of agree/strongly agree responses –or disagree/strongly disagree for negatively worded questions) as the percentage of positive responses on the X axis, and (2) the item’s correlation with the overall patients safety rating question (q38) as the importance rating on the Y-axis. This plot is useful for identifying items with strong performance and high importance to celebrate (top right quadrant), items with strong performance but less importance (bottom right quadrant). Items with weaker performance and high importance (the top left quadrant) may be the areas to prioritize and target for change and improvement. Items in the bottom left quadrant can also be targeted for action, though they are less important to overall patient safety scores given by staff. Note that the lines are somewhat arbitrary and simply help to group items into the areas just described. This grid is provided with all 4 regions data combined given the lack of variation in performance and importance at the region level.
5 r = at least 0.35 for all of these questions and r>0.4 for most of them (the r-squared range is .12 to .36)

…/13
Figure 1 – Performance - Importance Grid
Other Options for Considering These Data Provided that caution is used, the Regions may be interested to see how other hospitals have scored on some of these survey items. Singer, Gaba, and colleagues (2003) reported on data from 15 U.S hospitals where a similar questionnaire was completed. Raw data on a question by question basis are presented in their paper. When making any comparisons, it is important to recognize that personnel surveyed in the Singer et al. study may not be identical. Also note that Singer et al. report on the percentage of “problematic responses” (those who disagree and strongly disagree with positively worded items and agree to negatively worded items). Frequencies for each question by Region are provided in Appendix B and these are the data that should be used if you are seeking similar comparisons to the Singer et al. data. Finally, as this instrument achieves more widespread use across Canada as part of a recently funded study by the Canadian Patient Safety Institute (Ginsburg & Tregunno, Principal Investigators), there will be additional hospitals and health regions to work with in efforts to understand and improve perceptions of hospital patient safety culture. Although this is the first time these Regions used this survey, this instrument allows organizations to track change in safety culture over time if implemented at regular intervals.
100.0080.0060.0040.0020.000.00
Percent Positive Responses
0.50
0.40
0.30
0.20
0.10
0.00
Cor
rela
tion
to O
vera
ll Sa
fety
Rat
ing
q36q35
q34
q33
q30q29
q28
q27
q26
q25
q23
q22
q21
q18
q17
q16
q12
q7
q6
q5
q4
q3
q2
q1
High importance, weaker performance
items High importance, high performance
items
…/14
References Cohen, J., & Cohen, P. (1983). Applied Multiple Regression / Correlation Analysis for the Behavioral Sciences (2nd ed.). Hillsdale, NJ: Lawrence Erlbaum Ginsburg. L., Norton,P.G., Casebeer,A., Lewis, S. (2005). An Educational Intervention to Enhance Nurse Leaders’ Perceptions of Patient Safety Culture. Health Services Research, 40(4):997-1020. Singer, S.J., Gaba, D.M., Geppert, J.J., Sinaiko, A.D., Howard, S.K., & Park, K.C. (2003). The culture of safety: results of an organization-wide survey in 15 California hospitals. Quality and Safety in Health Care, 12: 112-118. Sorra, J. A. & Nieva, V. F. (2004). Hospital Survey on Patient Safety Culture. Rockville, MD: Agency for Healthcare Research and Quality.
…/15
Instructions: For the following statements, please indicate if you "strongly disagree", "disagree", "agree", or "strongly agree." If you are unsure of your answer mark “Neutral”. If the question does not apply to your role or the setting you work in please mark "Not Applicable."
Patient Safety: Activities to avoid, prevent, or correct adverse outcomes which may result from the delivery of health care.
Patient Safety Culture In Healthcare Organizations
Strongly Disagree
Disagree Neutral Agree Strongly Agree
Not Applicable
1. Patient safety decisions are made at the proper level by the most qualified people
2. Good communication flow exists up the chain of command regarding patient safety issues
3. Reporting a patient safety problem will not result in negative repercussions for the person reporting it
4. Senior management has a clear picture of the risk associated with patient care
5. My unit takes the time to identify and assess risks to patients 6. My unit does a good job managing risks to ensure patient safety 7. Senior management provides a climate that promotes patient safety 8. Asking for help is a sign of incompetence 9. If I make a mistake that has significant consequences and nobody notices,
I do not tell anyone about it 10. Telling others about my mistakes is embarrassing 11. I am less effective at work when I am fatigued 12. Senior management considers patient safety when program changes are
discussed 13. Personal problems can adversely affect my performance 14. Compared to other facilities in the area, this facility cares more about the
quality of patient care it provides 15. I have learned how to do my own job better by learning about mistakes
made by my coworkers 16. I will suffer negative consequences if I report a patient safety problem 17. If people find out that I made a mistake, I will be disciplined 18. I am rewarded for taking quick action to identify a serious mistake 19. Individuals in my unit are willing to report behaviour which is unsafe for
patient care 20. I am asked to cut corners to get the job done 21. Loss of experienced personnel has negatively affected my ability to
provide high quality patient care 22. I have enough time to complete patient care tasks safely 23. Clinicians who make serious mistakes are usually punished 24. In the last year, I have witnessed a co-worker do something that appeared
to me to be unsafe for the patient in order to save time 25. I am provided with adequate resources (personnel, budget, and
equipment) to provide safe patient care 26. I have made significant errors in my work that I attribute to my own
fatigue 27. I believe that health care error constitutes a real and significant risk to the
patients that we treat 28. I believe health care errors often go unreported 29. My organization effectively balances the need for patient safety and the
need for productivity 30. I work in an environment where patient safety is a high priority 31. I believe that most serious occurrences happen as a result of multiple
small failures, and are not attributable to one individual’s actions
- Please turn over - Version B MPS
Appendix A

…/16
These questions are about overall patient safety
Thinking about your organization over the last year, for each of the following statements please indicate the extent to which you agree or disagree with the following statements using this 7-point scale.
Strongly Disagree
Disagree Neutral Agree Strongly Agree
Not Applicable
32. I would probably self report a “near miss” (an event that had the potential to harm a patient) if the patient was not harmed
33. My supervisor/manager says a good word when he/she sees a job done according to established patient safety procedures
34. My supervisor/manager seriously considers staff suggestions for improving patient safety
35. Whenever pressure builds up, my supervisor/manager wants us to work faster, even if it means taking shortcuts
36. My supervisor/manager overlooks patient safety problems that happen over and over
A Excellent
B Very Good
C Acceptable
D Poor
F Failing
37. Please give your unit an overall grade on patient safety 38. Please give the Region an overall grade on patient safety
strongly disagree
neutral strongly agree
39. This organization devotes an enormous amount of energy trying to learn what patients need and want
40. The people who run this organization are quick to spend money to improve the quality of our services
41. Senior managers in this organization are completely committed to the idea that if we study the way we do our work, we can make things better around here
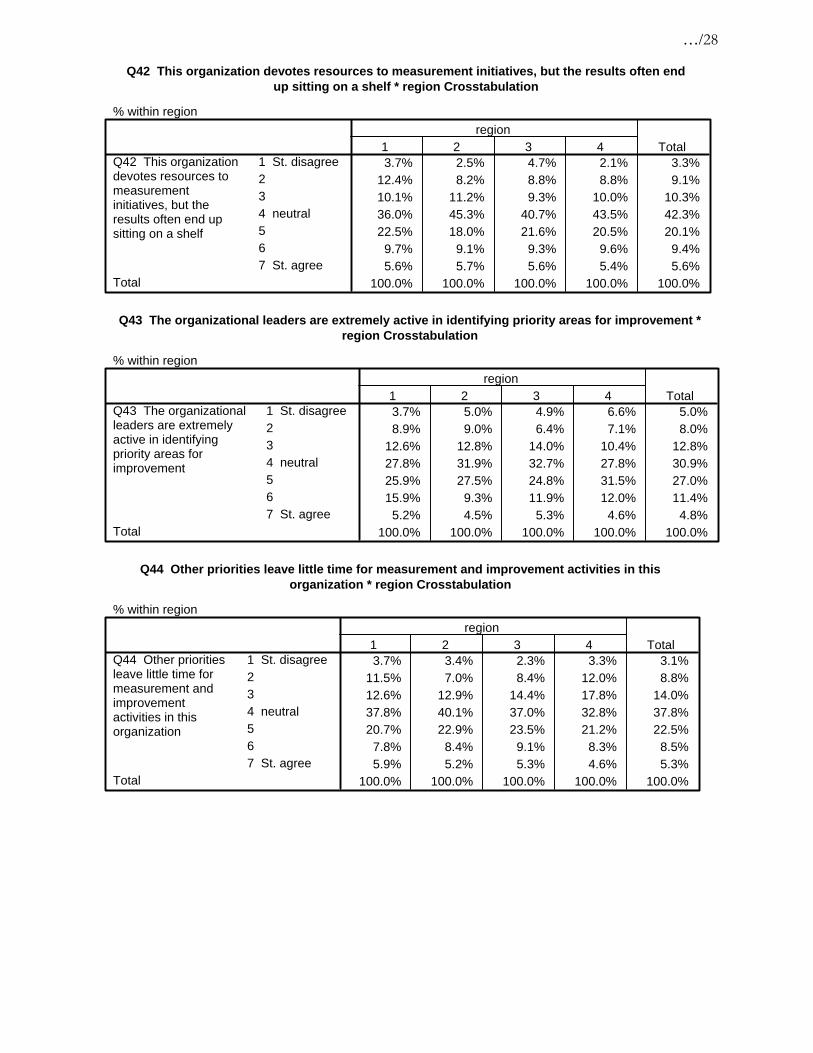
42. This organization devotes resources to measurement initiatives, but the results often end up sitting on a shelf
43. The organizational leaders are extremely active in identifying priority areas for improvement
44. Other priorities leave little time for measurement and improvement activities in this organization
45. My organization focuses on underlying processes and systems as causes of failure as opposed to singling out individuals
46. There is a leader(s) in this organization who truly promotes/champions measurement and improvement activities
47. This organization devotes significant resources to follow up on satisfaction survey results
Please take a moment to respond to 3 additional questions to help us check the wording of a few items. These may remind you of some earlier questions.
Strongly Disagree
Disagree Neutral Agree Strongly Agree
Not Applicable
(a) My department takes the time to identify and assess risks to patients (b) My department does a good job managing risks to ensure patient safety (c) Individuals in my department are willing to report behaviour which is
unsafe for patient care
48. Finally, please help us by providing the following information: Age: 18-25 Time in 0-6 months Role: RN Work Inpatient Gender: Female 26-30 facility: 6 months – 1 yr LPN Setting: Outpatient Male 31-40 2-5 years MD Community 41-50 6-10 years Nurse Manager 51-60 > 10 years Healthcare Aide > 60 0-6 months Other________
Thank you for helping us to evaluate this patient safety initiative
Adapted with permission from:

…/17
Appendix B
Q1 Patient safety decisions are made at the proper level by the most qualified people * regionCrosstabulation
% within region
.8% 1.7% 1.6% 2.9% 1.7%9.8% 10.9% 13.2% 12.7% 11.7%
14.7% 14.7% 15.1% 15.2% 14.9%50.0% 51.0% 56.6% 50.4% 52.4%24.8% 21.7% 13.6% 18.9% 19.4%
100.0% 100.0% 100.0% 100.0% 100.0%
1 St. disagree2 disagree3 neutral4 agree5 St. agree
Q1 Patient safetydecisions are madeat the proper level bythe most qualifiedpeople
Total
1 2 3 4region
Total
Q2 Good communication flow exists up the chain of command regarding patient safety issues *region Crosstabulation
% within region
3.4% 3.6% 3.7% 5.7% 3.9%14.6% 15.0% 17.2% 17.9% 16.0%17.5% 14.6% 14.1% 11.0% 14.4%46.6% 51.0% 50.3% 48.8% 49.8%17.9% 15.7% 14.7% 16.7% 15.9%
100.0% 100.0% 100.0% 100.0% 100.0%
1 St. disagree2 disagree3 neutral4 agree5 St. agree
Q2 Good communicationflow exists up the chain ofcommand regardingpatient safety issues
Total
1 2 3 4region
Total
Q3 Reporting a patient safety problem will not result in negative repercussions for the personreporting it * region Crosstabulation
% within region
1.1% 1.5% 2.7% 2.0% 1.9%5.6% 6.3% 7.6% 6.9% 6.6%
14.6% 13.4% 11.7% 10.2% 12.6%47.0% 48.6% 54.6% 52.8% 50.7%31.7% 30.3% 23.5% 28.0% 28.2%
100.0% 100.0% 100.0% 100.0% 100.0%
1 St. disagree2 disagree3 neutral4 agree5 St. agree
Q3 Reporting a patientsafety problem will notresult in negativerepercussions for theperson reporting it
Total
1 2 3 4region
Total
Q4 Senior management has a clear picture of the risk associated with patient care * regionCrosstabulation
% within region
5.6% 5.5% 4.6% 7.5% 5.5%13.3% 19.4% 19.4% 13.7% 17.7%23.0% 16.8% 17.8% 17.4% 18.1%39.3% 40.9% 45.5% 40.2% 41.9%18.9% 17.5% 12.7% 21.2% 16.8%
100.0% 100.0% 100.0% 100.0% 100.0%
1 St. disagree2 disagree3 neutral4 agree5 St. agree
Q4 Senior managementhas a clear picture of therisk associated withpatient care
Total
1 2 3 4region
Total

…/18
Q5 My unit takes the time to identify and assess risks to patients * region Crosstabulation
% within region
1.2% 1.3% 1.6% 2.1% 1.5%5.0% 5.8% 6.7% 7.2% 6.1%7.4% 8.1% 10.8% 11.4% 9.3%
57.8% 55.3% 57.6% 47.9% 55.3%28.7% 29.5% 23.3% 31.4% 27.8%
100.0% 100.0% 100.0% 100.0% 100.0%
1 St. disagree2 disagree3 neutral4 agree5 St. agree
Q5 My unit takesthe time to identifyand assess risksto patients
Total
1 2 3 4region
Total
Q6 My unit does a good job managing risks to ensure patient safety * region Crosstabulation
% within region
1.1% 1.0% 1.8% 2.2% 1.4%6.1% 5.2% 6.7% 6.5% 5.9%7.6% 8.8% 11.1% 10.4% 9.5%
53.4% 54.8% 56.6% 53.5% 54.9%31.7% 30.2% 23.8% 27.4% 28.2%
100.0% 100.0% 100.0% 100.0% 100.0%
1 St. disagree2 disagree3 neutral4 agree5 St. agree
Q6 My unit does agood job managingrisks to ensure patientsafety
Total
1 2 3 4region
Total
Q7 Senior management provides a climate that promotes patient safety * region Crosstabulation
% within region
2.2% 3.1% 3.3% 6.2% 3.5%9.4% 10.2% 11.6% 7.1% 10.0%
16.9% 20.3% 20.8% 19.9% 19.9%48.3% 48.7% 49.6% 46.9% 48.6%23.2% 17.8% 14.7% 19.9% 18.0%
100.0% 100.0% 100.0% 100.0% 100.0%
1 St. disagree2 disagree3 neutral4 agree5 St. agree
Q7 Senior managementprovides a climate thatpromotes patient safety
Total
1 2 3 4region
Total
Q8 Asking for help is a sign of incompetence * region Crosstabulation
% within region
61.9% 54.8% 54.1% 60.7% 56.5%29.7% 35.0% 35.7% 31.8% 33.9%
2.2% 4.5% 3.7% 2.5% 3.6%4.0% 2.7% 4.1% 2.9% 3.3%2.2% 3.0% 2.5% 2.1% 2.6%
100.0% 100.0% 100.0% 100.0% 100.0%
1 St. disagree2 disagree3 neutral4 agree5 St. agree
Q8 Asking for help is asign of incompetence
Total
1 2 3 4region
Total
…/19
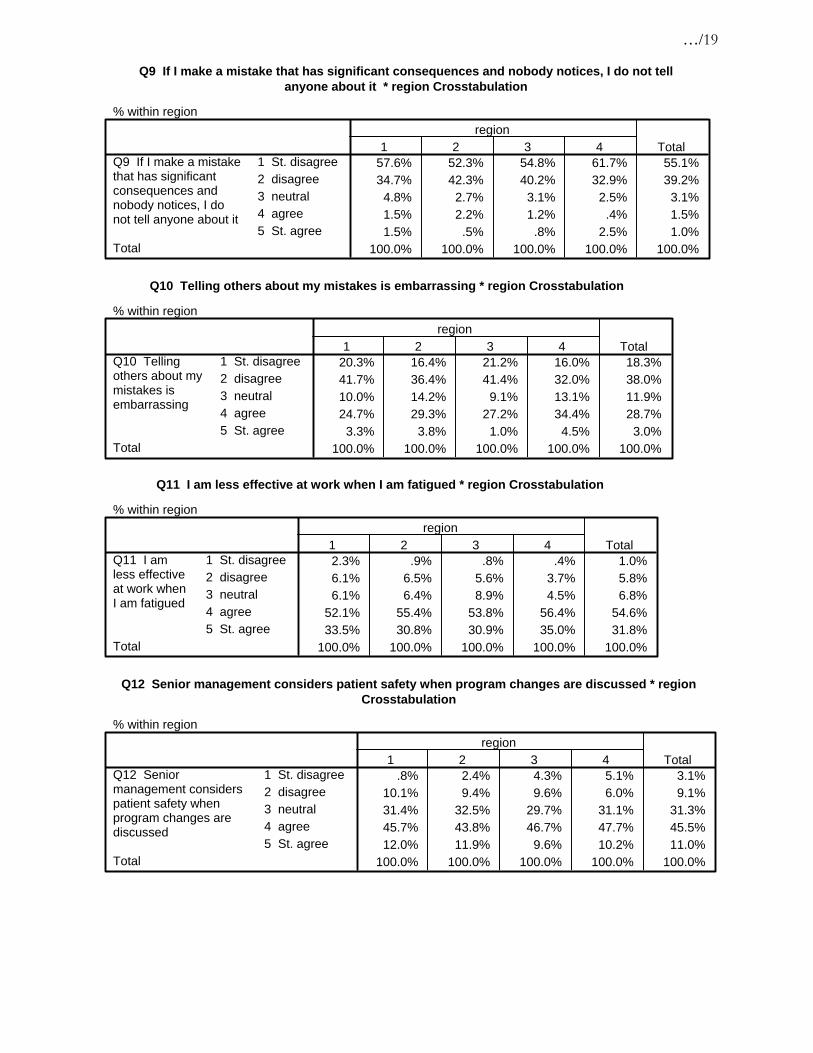
Q9 If I make a mistake that has significant consequences and nobody notices, I do not tellanyone about it * region Crosstabulation
% within region
57.6% 52.3% 54.8% 61.7% 55.1%34.7% 42.3% 40.2% 32.9% 39.2%
4.8% 2.7% 3.1% 2.5% 3.1%1.5% 2.2% 1.2% .4% 1.5%1.5% .5% .8% 2.5% 1.0%
100.0% 100.0% 100.0% 100.0% 100.0%
1 St. disagree2 disagree3 neutral4 agree5 St. agree
Q9 If I make a mistakethat has significantconsequences andnobody notices, I donot tell anyone about it
Total
1 2 3 4region
Total
Q10 Telling others about my mistakes is embarrassing * region Crosstabulation
% within region
20.3% 16.4% 21.2% 16.0% 18.3%41.7% 36.4% 41.4% 32.0% 38.0%10.0% 14.2% 9.1% 13.1% 11.9%24.7% 29.3% 27.2% 34.4% 28.7%
3.3% 3.8% 1.0% 4.5% 3.0%100.0% 100.0% 100.0% 100.0% 100.0%
1 St. disagree2 disagree3 neutral4 agree5 St. agree
Q10 Tellingothers about mymistakes isembarrassing
Total
1 2 3 4region
Total
Q11 I am less effective at work when I am fatigued * region Crosstabulation
% within region
2.3% .9% .8% .4% 1.0%6.1% 6.5% 5.6% 3.7% 5.8%6.1% 6.4% 8.9% 4.5% 6.8%
52.1% 55.4% 53.8% 56.4% 54.6%33.5% 30.8% 30.9% 35.0% 31.8%
100.0% 100.0% 100.0% 100.0% 100.0%
1 St. disagree2 disagree3 neutral4 agree5 St. agree
Q11 I amless effectiveat work whenI am fatigued
Total
1 2 3 4region
Total
Q12 Senior management considers patient safety when program changes are discussed * regionCrosstabulation
% within region
.8% 2.4% 4.3% 5.1% 3.1%10.1% 9.4% 9.6% 6.0% 9.1%31.4% 32.5% 29.7% 31.1% 31.3%45.7% 43.8% 46.7% 47.7% 45.5%12.0% 11.9% 9.6% 10.2% 11.0%
100.0% 100.0% 100.0% 100.0% 100.0%
1 St. disagree2 disagree3 neutral4 agree5 St. agree
Q12 Seniormanagement considerspatient safety whenprogram changes arediscussed
Total
1 2 3 4region
Total

…/20
Q13 Personal problems can adversely affect my performance * region Crosstabulation
% within region
4.4% 3.8% 4.6% 4.1% 4.2%19.6% 20.5% 18.8% 15.2% 19.1%13.0% 14.7% 13.9% 14.4% 14.1%46.7% 50.2% 50.9% 53.5% 50.3%16.3% 10.9% 11.8% 12.8% 12.2%
100.0% 100.0% 100.0% 100.0% 100.0%
1 St. disagree2 disagree3 neutral4 agree5 St. agree
Q13 Personalproblems canadversely affectmy performance
Total
1 2 3 4region
Total
Q14 Compared to other facilities in the area, this facility cares more about the quality of patient careit provides * region Crosstabulation
% within region
3.1% 3.4% 3.1% 3.4% 3.3%13.1% 9.8% 12.2% 8.6% 10.8%35.9% 44.8% 47.6% 48.9% 44.8%28.2% 25.6% 24.7% 28.8% 26.2%19.7% 16.4% 12.4% 10.3% 14.9%
100.0% 100.0% 100.0% 100.0% 100.0%
1 St. disagree2 disagree3 neutral4 agree5 St. agree
Q14 Compared to otherfacilities in the area, thisfacility cares more aboutthe quality of patient careit provides
Total
1 2 3 4region
Total
Q15 I have learned how to do my own job better by learning about mistakes made by mycoworkers * region Crosstabulation
% within region
3.0% 1.8% 2.2% .8% 2.0%11.4% 12.4% 13.1% 7.5% 11.8%21.4% 18.6% 16.7% 13.0% 17.7%49.4% 54.0% 57.9% 61.5% 55.4%14.8% 13.2% 10.1% 17.2% 13.1%
100.0% 100.0% 100.0% 100.0% 100.0%
1 St. disagree2 disagree3 neutral4 agree5 St. agree
Q15 I have learned howto do my own job betterby learning aboutmistakes made by mycoworkers
Total
1 2 3 4region
Total
Q16 I will suffer negative consequences if I report a patient safety problem * regionCrosstabulation
% within region
30.4% 25.1% 26.8% 24.0% 26.3%56.7% 59.7% 55.1% 55.0% 57.2%
8.9% 9.8% 9.1% 13.6% 10.0%3.3% 4.4% 6.8% 4.5% 4.9%
.7% 1.1% 2.1% 2.9% 1.6%100.0% 100.0% 100.0% 100.0% 100.0%
1 St. disagree2 disagree3 neutral4 agree5 St. agree
Q16 I will suffernegative consequencesif I report a patient safetyproblem
Total
1 2 3 4region
Total
…/21
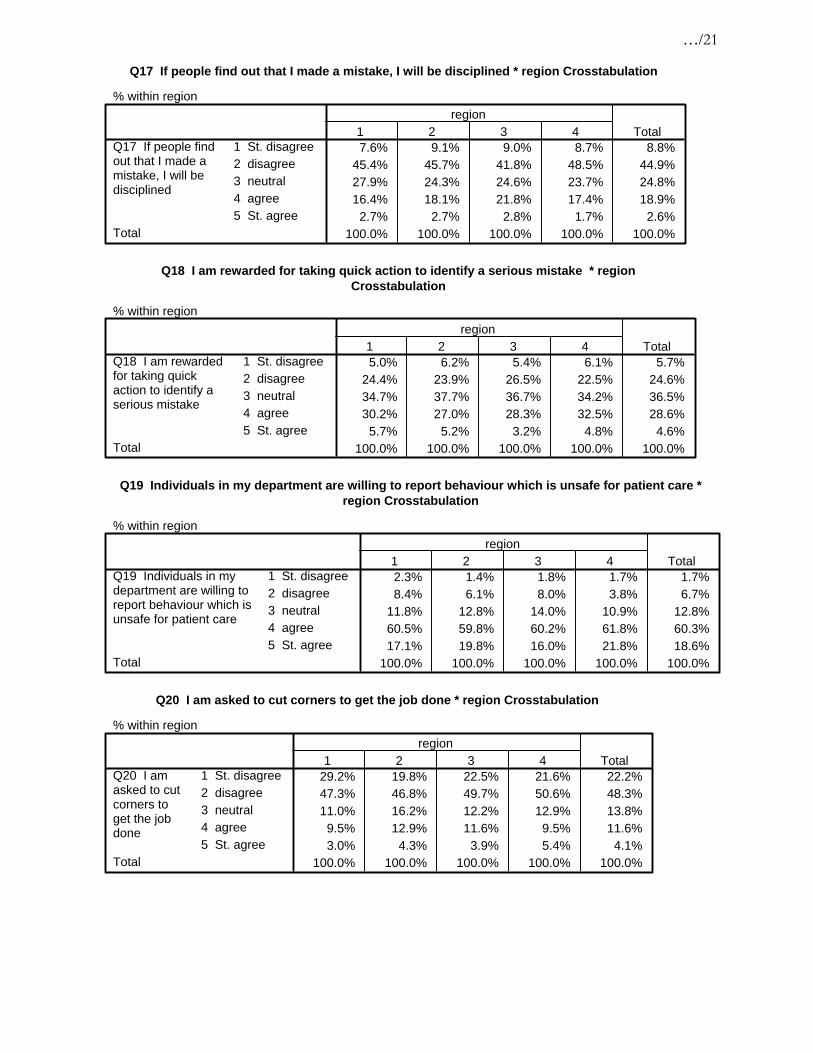
Q17 If people find out that I made a mistake, I will be disciplined * region Crosstabulation
% within region
7.6% 9.1% 9.0% 8.7% 8.8%45.4% 45.7% 41.8% 48.5% 44.9%27.9% 24.3% 24.6% 23.7% 24.8%16.4% 18.1% 21.8% 17.4% 18.9%
2.7% 2.7% 2.8% 1.7% 2.6%100.0% 100.0% 100.0% 100.0% 100.0%
1 St. disagree2 disagree3 neutral4 agree5 St. agree
Q17 If people findout that I made amistake, I will bedisciplined
Total
1 2 3 4region
Total
Q18 I am rewarded for taking quick action to identify a serious mistake * regionCrosstabulation
% within region
5.0% 6.2% 5.4% 6.1% 5.7%24.4% 23.9% 26.5% 22.5% 24.6%34.7% 37.7% 36.7% 34.2% 36.5%30.2% 27.0% 28.3% 32.5% 28.6%
5.7% 5.2% 3.2% 4.8% 4.6%100.0% 100.0% 100.0% 100.0% 100.0%
1 St. disagree2 disagree3 neutral4 agree5 St. agree
Q18 I am rewardedfor taking quickaction to identify aserious mistake
Total
1 2 3 4region
Total
Q19 Individuals in my department are willing to report behaviour which is unsafe for patient care *region Crosstabulation
% within region
2.3% 1.4% 1.8% 1.7% 1.7%8.4% 6.1% 8.0% 3.8% 6.7%
11.8% 12.8% 14.0% 10.9% 12.8%60.5% 59.8% 60.2% 61.8% 60.3%17.1% 19.8% 16.0% 21.8% 18.6%
100.0% 100.0% 100.0% 100.0% 100.0%
1 St. disagree2 disagree3 neutral4 agree5 St. agree
Q19 Individuals in mydepartment are willing toreport behaviour which isunsafe for patient care
Total
1 2 3 4region
Total
Q20 I am asked to cut corners to get the job done * region Crosstabulation
% within region
29.2% 19.8% 22.5% 21.6% 22.2%47.3% 46.8% 49.7% 50.6% 48.3%11.0% 16.2% 12.2% 12.9% 13.8%
9.5% 12.9% 11.6% 9.5% 11.6%3.0% 4.3% 3.9% 5.4% 4.1%
100.0% 100.0% 100.0% 100.0% 100.0%
1 St. disagree2 disagree3 neutral4 agree5 St. agree
Q20 I amasked to cutcorners toget the jobdone
Total
1 2 3 4region
Total

…/22
Q21 Loss of experienced personnel has negatively affected my ability to provide high qualitypatient care * region Crosstabulation
% within region
10.0% 7.8% 8.6% 8.5% 8.5%32.4% 33.8% 36.8% 39.0% 35.2%24.9% 23.1% 23.1% 15.7% 22.3%21.2% 23.7% 22.2% 27.4% 23.4%11.6% 11.5% 9.3% 9.4% 10.6%
100.0% 100.0% 100.0% 100.0% 100.0%
1 St. disagree2 disagree3 neutral4 agree5 St. agree
Q21 Loss ofexperienced personnelhas negatively affectedmy ability to providehigh quality patient care
Total
1 2 3 4region
Total
Q22 I have enough time to complete patient care tasks safely * region Crosstabulation
% within region
4.9% 5.7% 6.0% 7.2% 5.9%22.9% 24.2% 21.0% 22.4% 22.8%14.3% 19.7% 16.3% 11.2% 16.7%48.2% 42.8% 49.0% 51.6% 46.7%
9.8% 7.5% 7.7% 7.6% 7.9%100.0% 100.0% 100.0% 100.0% 100.0%
1 St. disagree2 disagree3 neutral4 agree5 St. agree
Q22 I have enoughtime to completepatient care taskssafely
Total
1 2 3 4region
Total
Q23 Clinicians who make serious mistakes are usually punished * region Crosstabulation
% within region
12.1% 9.6% 8.6% 10.0% 9.7%33.0% 29.3% 31.1% 34.1% 31.0%43.8% 48.3% 44.2% 41.7% 45.5%
9.8% 11.9% 13.1% 13.3% 12.1%1.3% .9% 3.0% .9% 1.6%
100.0% 100.0% 100.0% 100.0% 100.0%
1 St. disagree2 disagree3 neutral4 agree5 St. agree
Q23 Clinicianswho make seriousmistakes areusually punished
Total
1 2 3 4region
Total
Q24 In the last year, I have witnessed a co-worker do something that appeared to me to be unsafefor the patient in order to save time * region Crosstabulation
% within region
8.1% 9.9% 9.7% 10.8% 9.7%38.5% 38.2% 42.5% 39.2% 39.6%18.8% 21.1% 20.1% 16.5% 19.8%23.9% 25.8% 22.2% 25.5% 24.4%10.7% 5.0% 5.5% 8.0% 6.4%
100.0% 100.0% 100.0% 100.0% 100.0%
1 St. disagree2 disagree3 neutral4 agree5 St. agree
Q24 In the last year, Ihave witnessed aco-worker do somethingthat appeared to me tobe unsafe for the patientin order to save timeTotal
1 2 3 4region
Total

…/23
Q25 I am provided with adequate resources (personnel, budget, and equipment) to provide safepatient care * region Crosstabulation
% within region
8.7% 9.3% 8.8% 12.8% 9.6%28.2% 27.2% 24.3% 23.4% 26.0%11.9% 20.1% 17.4% 20.4% 18.1%44.0% 34.5% 43.6% 38.7% 39.2%
7.1% 8.9% 5.9% 4.7% 7.2%100.0% 100.0% 100.0% 100.0% 100.0%
1 St. disagree2 disagree3 neutral4 agree5 St. agree
Q25 I am provided withadequate resources(personnel, budget, andequipment) to providesafe patient care
Total
1 2 3 4region
Total
Q26 I have made significant errors in my work that I attribute to my own fatigue * regionCrosstabulation
% within region
23.7% 24.9% 25.8% 25.8% 25.1%54.6% 53.4% 52.6% 53.8% 53.4%11.5% 13.1% 12.2% 12.5% 12.5%
9.2% 6.8% 7.9% 6.7% 7.4%1.1% 1.8% 1.4% 1.3% 1.5%
100.0% 100.0% 100.0% 100.0% 100.0%
1 St. disagree2 disagree3 neutral4 agree5 St. agree
Q26 I have madesignificant errors inmy work that Iattribute to my ownfatigue
Total
1 2 3 4region
Total
Q27 I believe that health care error constitutes a real and significant risk to the patients that wetreat * region Crosstabulation
% within region
2.7% 3.9% 2.2% 4.6% 3.3%8.7% 16.1% 9.7% 12.6% 12.6%
17.9% 20.3% 18.6% 15.5% 18.8%45.2% 43.3% 45.7% 47.7% 44.9%25.5% 16.4% 23.8% 19.7% 20.4%
100.0% 100.0% 100.0% 100.0% 100.0%
1 St. disagree2 disagree3 neutral4 agree5 St. agree
Q27 I believe that healthcare error constitutes areal and significant riskto the patients that wetreat
Total
1 2 3 4region
Total
Q28 I believe health care errors often go unreported * region Crosstabulation
% within region
1.5% 4.1% 2.4% 2.9% 3.1%18.6% 18.7% 20.2% 15.4% 18.7%17.5% 26.8% 21.5% 22.4% 23.3%44.9% 38.5% 43.5% 46.1% 42.0%17.5% 11.8% 12.5% 13.3% 13.1%
100.0% 100.0% 100.0% 100.0% 100.0%
1 St. disagree2 disagree3 neutral4 agree5 St. agree
Q28 I believehealth careerrors oftengo unreported
Total
1 2 3 4region
Total

…/24
Q29 My organization effectively balances the need for patient safety and the need forproductivity * region Crosstabulation
% within region
4.6% 3.0% 2.7% 4.2% 3.3%11.8% 13.2% 12.8% 13.4% 12.9%28.6% 30.4% 29.3% 31.4% 29.9%48.9% 45.7% 48.7% 45.6% 47.0%
6.1% 7.8% 6.6% 5.4% 6.9%100.0% 100.0% 100.0% 100.0% 100.0%
1 St. disagree2 disagree3 neutral4 agree5 St. agree
Q29 My organizationeffectively balancesthe need for patientsafety and the needfor productivity
Total
1 2 3 4region
Total
Q30 I work in an environment where patient safety is a high priority * regionCrosstabulation
% within region
1.1% 2.2% 2.3% 2.9% 2.2%5.2% 4.5% 7.4% 7.4% 5.9%9.3% 12.0% 13.7% 11.9% 12.1%
55.0% 52.6% 53.0% 53.9% 53.3%29.4% 28.7% 23.5% 23.9% 26.6%
100.0% 100.0% 100.0% 100.0% 100.0%
1 St. disagree2 disagree3 neutral4 agree5 St. agree
Q30 I work inan environmentwhere patientsafety is a highpriority
Total
1 2 3 4region
Total
Q31 I believe that most serious occurrences happen as a result of multiple small failures, and arenot attributable to one individual's actions * region Crosstabulation
% within region
3.1% 2.0% 1.6% 3.0% 2.2%14.1% 11.1% 16.5% 13.1% 13.4%26.2% 32.0% 26.8% 31.2% 29.5%47.7% 43.9% 46.1% 43.5% 45.0%
9.0% 11.1% 9.1% 9.3% 9.9%100.0% 100.0% 100.0% 100.0% 100.0%
1 St. disagree2 disagree3 neutral4 agree5 St. agree
Q31 I believe that mostserious occurrenceshappen as a result ofmultiple small failures,and are not attributable toone individual's actionsTotal
1 2 3 4region
Total
Q32 I would probably self report a "near miss" (an event that had the potential to harm a patient) ifthe patient was not harmed * region Crosstabulation
% within region
1.5% 1.1% .8% .8% 1.1%8.0% 8.2% 6.5% 8.1% 7.6%
12.9% 16.3% 12.0% 10.6% 13.7%61.4% 59.1% 65.1% 61.4% 61.5%16.3% 15.3% 15.6% 19.1% 16.1%
100.0% 100.0% 100.0% 100.0% 100.0%
1 St. disagree2 disagree3 neutral4 agree5 St. agree
Q32 I would probablyself report a "near miss"(an event that had thepotential to harm apatient) if the patientwas not harmedTotal
1 2 3 4region
Total

…/25
Q33 My supervisor says a good word when he/she sees a job done according to establishedpatient safety procedures * region Crosstabulation
% within region
6.5% 6.0% 7.9% 7.8% 6.9%13.4% 15.9% 16.8% 14.8% 15.6%18.8% 21.7% 18.6% 25.7% 20.9%47.1% 45.6% 46.8% 39.6% 45.4%14.2% 10.8% 9.9% 12.2% 11.2%
100.0% 100.0% 100.0% 100.0% 100.0%
1 St. disagree2 disagree3 neutral4 agree5 St. agree
Q33 My supervisor saysa good word when he/shesees a job doneaccording to establishedpatient safety procedures
Total
1 2 3 4region
Total
Q34 My supervisor seriously considers staff suggestions for improving patient safety * regionCrosstabulation
% within region
4.2% 3.6% 5.8% 5.0% 4.5%6.4% 9.4% 11.3% 8.4% 9.4%
17.4% 19.4% 13.1% 18.8% 17.2%54.0% 50.8% 55.0% 50.2% 52.4%18.1% 16.8% 14.7% 17.6% 16.5%
100.0% 100.0% 100.0% 100.0% 100.0%
1 St. disagree2 disagree3 neutral4 agree5 St. agree
Q34 My supervisorseriously considersstaff suggestions forimproving patientsafety
Total
1 2 3 4region
Total
Q35 Whenever pressure builds up, my supervisor wants us to work faster, even if it means takingshortcuts (% disagree) * region Crosstabulation
% within region
21.1% 15.0% 15.8% 15.3% 16.2%53.0% 52.5% 52.7% 53.3% 52.8%15.0% 17.8% 17.3% 17.9% 17.2%7.5% 11.7% 11.5% 8.7% 10.6%3.4% 2.9% 2.7% 4.8% 3.2%
100.0% 100.0% 100.0% 100.0% 100.0%
1 St. disagree2 disagree3 neutral4 agree5 St. agree
Q35 Whenever pressurebuilds up, my supervisorwants us to work faster,even if it means takingshortcuts (% disagree)
Total
1 2 3 4region
Total
Q36 My supervisor overlooks patient safety problems that happen over and over (%disagree) *region Crosstabulation
% within region
25.9% 25.5% 23.7% 27.9% 25.4%51.1% 50.4% 50.8% 48.5% 50.4%15.0% 14.8% 13.8% 12.2% 14.2%5.6% 6.9% 8.2% 8.3% 7.3%2.3% 2.4% 3.5% 3.1% 2.8%
100.0% 100.0% 100.0% 100.0% 100.0%
1 St. disagree2 disagree3 neutral4 agree5 St. agree
Q36 My supervisoroverlooks patientsafety problems thathappen over andover (%disagree)
Total
1 2 3 4region
Total

…/26
Q37 Please give your unit an overall grade on patient safety * region Crosstabulation
% within region
16.7% 16.2% 12.8% 14.8% 15.1%52.8% 55.5% 51.8% 54.0% 53.8%26.8% 25.6% 29.9% 25.3% 27.0%2.6% 2.2% 4.1% 4.6% 3.2%1.1% .5% 1.4% 1.3% 1.0%
100.0% 100.0% 100.0% 100.0% 100.0%
1 A-Excellent2 B-Very Good3 C - Acceptable4 D - Poor5 F - Failing
Q37 Pleasegive your unit anoverall grade onpatient safety
Total
1 2 3 4region
Total
Q38 Please give the Region an overall grade on patient safety * region Crosstabulation
% within region
7.9% 8.2% 7.7% 5.4% 7.6%44.6% 40.7% 39.9% 45.7% 41.8%40.1% 45.0% 43.9% 39.8% 43.2%5.4% 5.1% 6.4% 7.2% 5.8%2.1% .9% 2.1% 1.8% 1.6%
100.0% 100.0% 100.0% 100.0% 100.0%
1 A-Excellent2 B-Very Good3 C - Acceptable4 D - Poor5 F - Failing
Q38 Pleasegive the Regionan overall gradeon patient safety
Total
1 2 3 4region
Total
…/27
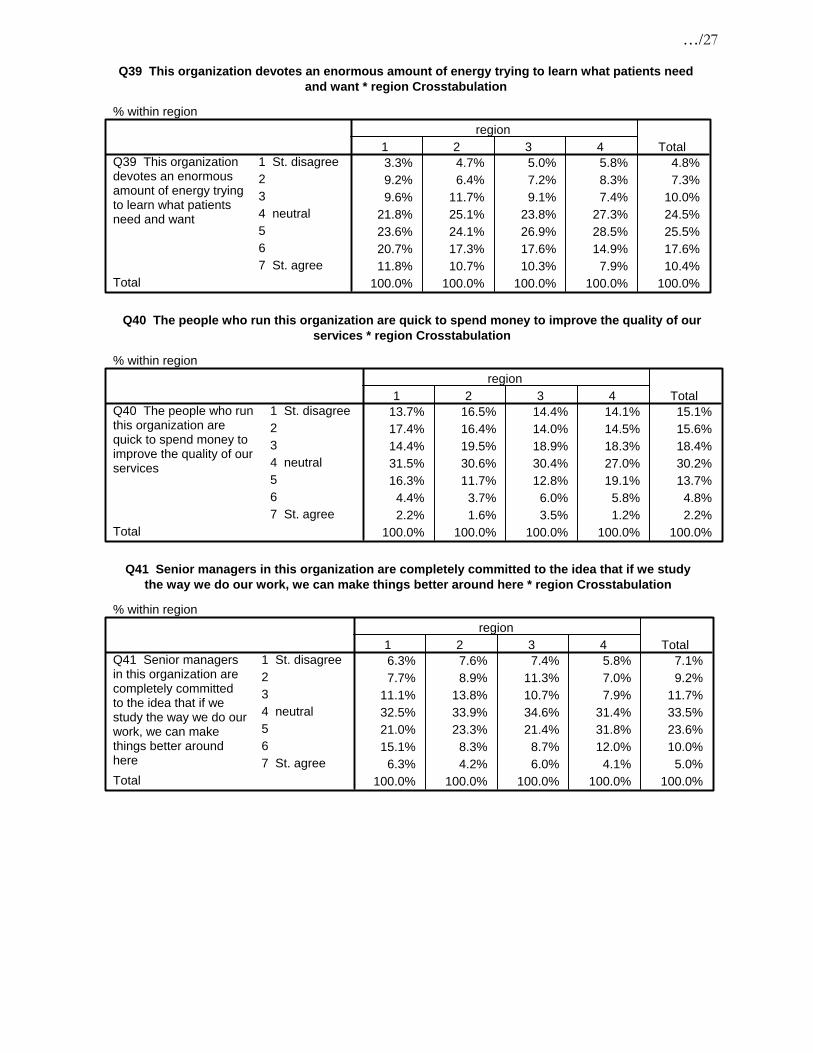
Q39 This organization devotes an enormous amount of energy trying to learn what patients needand want * region Crosstabulation
% within region
3.3% 4.7% 5.0% 5.8% 4.8%9.2% 6.4% 7.2% 8.3% 7.3%9.6% 11.7% 9.1% 7.4% 10.0%
21.8% 25.1% 23.8% 27.3% 24.5%23.6% 24.1% 26.9% 28.5% 25.5%20.7% 17.3% 17.6% 14.9% 17.6%11.8% 10.7% 10.3% 7.9% 10.4%
100.0% 100.0% 100.0% 100.0% 100.0%
1 St. disagree234 neutral567 St. agree
Q39 This organizationdevotes an enormousamount of energy tryingto learn what patientsneed and want
Total
1 2 3 4region
Total
Q40 The people who run this organization are quick to spend money to improve the quality of ourservices * region Crosstabulation
% within region
13.7% 16.5% 14.4% 14.1% 15.1%17.4% 16.4% 14.0% 14.5% 15.6%14.4% 19.5% 18.9% 18.3% 18.4%31.5% 30.6% 30.4% 27.0% 30.2%16.3% 11.7% 12.8% 19.1% 13.7%
4.4% 3.7% 6.0% 5.8% 4.8%2.2% 1.6% 3.5% 1.2% 2.2%
100.0% 100.0% 100.0% 100.0% 100.0%
1 St. disagree234 neutral567 St. agree
Q40 The people who runthis organization arequick to spend money toimprove the quality of ourservices
Total
1 2 3 4region
Total
Q41 Senior managers in this organization are completely committed to the idea that if we studythe way we do our work, we can make things better around here * region Crosstabulation
% within region
6.3% 7.6% 7.4% 5.8% 7.1%7.7% 8.9% 11.3% 7.0% 9.2%
11.1% 13.8% 10.7% 7.9% 11.7%32.5% 33.9% 34.6% 31.4% 33.5%21.0% 23.3% 21.4% 31.8% 23.6%15.1% 8.3% 8.7% 12.0% 10.0%
6.3% 4.2% 6.0% 4.1% 5.0%100.0% 100.0% 100.0% 100.0% 100.0%
1 St. disagree234 neutral567 St. agree
Q41 Senior managersin this organization arecompletely committedto the idea that if westudy the way we do ourwork, we can makethings better aroundhereTotal
1 2 3 4region
Total
…/28
Q42 This organization devotes resources to measurement initiatives, but the results often endup sitting on a shelf * region Crosstabulation
% within region
3.7% 2.5% 4.7% 2.1% 3.3%12.4% 8.2% 8.8% 8.8% 9.1%10.1% 11.2% 9.3% 10.0% 10.3%36.0% 45.3% 40.7% 43.5% 42.3%22.5% 18.0% 21.6% 20.5% 20.1%
9.7% 9.1% 9.3% 9.6% 9.4%5.6% 5.7% 5.6% 5.4% 5.6%
100.0% 100.0% 100.0% 100.0% 100.0%
1 St. disagree234 neutral567 St. agree
Q42 This organizationdevotes resources tomeasurementinitiatives, but theresults often end upsitting on a shelf
Total
1 2 3 4region
Total
Q43 The organizational leaders are extremely active in identifying priority areas for improvement *region Crosstabulation
% within region
3.7% 5.0% 4.9% 6.6% 5.0%8.9% 9.0% 6.4% 7.1% 8.0%
12.6% 12.8% 14.0% 10.4% 12.8%27.8% 31.9% 32.7% 27.8% 30.9%25.9% 27.5% 24.8% 31.5% 27.0%15.9% 9.3% 11.9% 12.0% 11.4%
5.2% 4.5% 5.3% 4.6% 4.8%100.0% 100.0% 100.0% 100.0% 100.0%
1 St. disagree234 neutral567 St. agree
Q43 The organizationalleaders are extremelyactive in identifyingpriority areas forimprovement
Total
1 2 3 4region
Total
Q44 Other priorities leave little time for measurement and improvement activities in thisorganization * region Crosstabulation
% within region
3.7% 3.4% 2.3% 3.3% 3.1%11.5% 7.0% 8.4% 12.0% 8.8%12.6% 12.9% 14.4% 17.8% 14.0%37.8% 40.1% 37.0% 32.8% 37.8%20.7% 22.9% 23.5% 21.2% 22.5%
7.8% 8.4% 9.1% 8.3% 8.5%5.9% 5.2% 5.3% 4.6% 5.3%
100.0% 100.0% 100.0% 100.0% 100.0%
1 St. disagree234 neutral567 St. agree
Q44 Other prioritiesleave little time formeasurement andimprovementactivities in thisorganization
Total
1 2 3 4region
Total

…/29
Q45 My organization focuses on underlying processes and systems as causes of failure asopposed to singling out individuals * region Crosstabulation
% within region
4.5% 3.0% 4.5% 2.5% 3.6%4.5% 4.5% 4.7% 4.2% 4.5%7.5% 8.0% 7.4% 10.5% 8.1%
36.2% 38.8% 40.2% 37.0% 38.6%27.6% 29.4% 26.6% 26.5% 27.9%14.2% 11.4% 11.3% 15.1% 12.3%
5.6% 4.8% 5.3% 4.2% 5.0%100.0% 100.0% 100.0% 100.0% 100.0%
1 St. disagree234 neutral567 St. agree
Q45 My organizationfocuses on underlyingprocesses and systemsas causes of failure asopposed to singling outindividuals
Total
1 2 3 4region
Total
Q46 There is a leader(s) in this organization who truly promotes/champions measurement andimprovement activities * region Crosstabulation
% within region
5.6% 5.9% 5.8% 5.0% 5.7%5.9% 5.5% 5.7% 6.2% 5.7%6.3% 9.9% 9.0% 9.1% 9.0%
34.1% 39.1% 33.9% 34.9% 36.2%22.6% 22.0% 25.9% 24.5% 23.6%18.5% 12.6% 12.1% 14.5% 13.6%
7.0% 4.9% 7.6% 5.8% 6.2%100.0% 100.0% 100.0% 100.0% 100.0%
1 St. disagree234 neutral567 St. agree
Q46 There is a leader(s)in this organization whotruly promotes/championsmeasurement andimprovement activities
Total
1 2 3 4region
Total
Q47 This organization devotes significant resources to follow up on satisfaction survey results *region Crosstabulation
% within region
6.8% 6.1% 4.7% 7.9% 6.1%8.7% 8.3% 7.4% 10.8% 8.5%8.7% 11.2% 9.6% 11.7% 10.4%
41.1% 46.4% 47.7% 45.8% 45.9%19.8% 18.7% 18.8% 17.1% 18.7%11.4% 6.1% 6.8% 4.6% 6.9%
3.4% 3.0% 5.1% 2.1% 3.5%100.0% 100.0% 100.0% 100.0% 100.0%
1 St. disagree234 neutral567 St. agree
Q47 This organizationdevotes significantresources to follow upon satisfaction surveyresults
Total
1 2 3 4region
Total