perceptual linear predictive (plp) analysis of speech linear predictive (plp) analysis of speech...
TRANSCRIPT
Perceptual linear predictive (PLP) analysis of speech Hynek Hermansky •) Speech Technology Labora tory' Division of Panasonic Technologies, Inc., 3888State Street Santa Barbora, California 93105
(Received 21 August 1989; accepted for publication 27 November 1989 )
A new technique for the analysis of sPeeCh, the perceptual linear predictive (PLP) technique, is presented and examined. This technique uses three concepts from the psychophysics of hearing to derive an estimate of the auditory spectrum: ( 1 ) the critical-band spectral resolution, (2) the equal-loudness curve, and (3) the intensity-loudness power law. The auditory spectrum is then approximated by an autoregressive all-pole model. A 5th-order all- pole model is effective in suppressing speaker-dependent details of the auditory spectrum. In .comparison with conventional linear predictive (LP) analysis, PLP analysis is more consistent with human hearing. The effective second formant F2' and the 3.5-Bark spectral-peak integration theories of vowel perception are well accounted for. PLP analysis is computationally efficient and yields a low-dimensional representation of speech. These prbpcrties are found to be useful in speaker-independent automatic-speech recognition.
PACS numbers: 43.72.Ar, 43.70.Fq, 43.71.Cq, 43.72.Ne
INTRODUCTION
The autoregressive all-pole model A(to) of the short- term power spectrum of speech P(co), estimated by linear predictive (LP) analysis (see, e]g., Makhoul, 1975 ), is wide- !y used. The all-pole model can be de. scribed in several differ- ent parametric spaces. Relatively simple and often computa- tionally efficient transformations between parametric sp•ces are available (see, e.g., Vishwanathan and Makhoul, 1975). When the order of the model is well chosen, A (co) approxi- mates the areas of high-energy concentration in P(co) while smoothing out the fine harmonic structure and other less- relevant spectral details. The approximated high-energy spectral areas often correspond to the resonance frequencies .of the vocal tract (formants). The LP model assumes the all- pole transfer function of the vocal tract with a specified num- ber of resonances within the analysis band. When this as- sumption is violated, P(•o) still approximates the spectral enyelope of speech but might be more corrupted by analysis artifacts.
Once we view LP analysi• as a means for obtaining the smoothed spectral envelope of P(co), we can see that one of the main disadvantages .of the LP all-pole model in speech analysis is that A (co) approximates P(co) equally well at all frequencies of the analysis band2 This property'is inconsis- tent with human hearing. Beyond about 80{) Hz, the spectral resolution of heating decreases with frequency. Further- more, for the amplitude levels typically encountered in con- versational speech, hearing is more sensitive in the middle frequency range of the audible spectrum. Consequently, the spectral details of P(co) are not always preserved or discard- ed by LP analysis according to their auditory prominence.
Several techniques have been proposed to alleviate this inconsistency. Itahashi and Yokoyama (1976) warp the spectrum of the high-order LP model into the mel scale and
'•Current affiliation: US WEST Advanced Technologies, Science and Technology, 6200 S. Quebec Street, Englewood, Colorado 80210.
pre•mphasize it through the equal-loudness curve prior to a' second (6th order) LP modeling. Makhoul and Cosell (1976) try several spectral-warping functions on P(co) prior to its approximation by//(co). Strube (1980) proposes reel- like spectral warping through all-pass filtering in the time domain.
Hermansky (1982) studies a class of spec.tral transform LP techniques that modify the power spectrum of speech prior to its approximation by the autoregressive model. The current paper adopts this approach to study auditorylike spectral modifications. The all-pole modeling is applied to an auditory spectrum. derived. by: (a) convolving P(co) with a simulated critical-band masking pattern, followed by, (b) resampling the critical-band spectrum at approximately 1- Bark intervals.; (c) pre-emphasis by a simulated fixed equal- loudness curve; and (d) compression of the redampled and preemphasized spectrum through the cubic-root nonlinear- ity, simulating the intensity-loudness power law. The low- order all-pole model of such an auditory spectrum is consis- tent with several phenomena observed in speech perception. Further, such a model can be employed with advantage in automatic speaker-independent speech recognition.
The paper is organized as follows. Section I describes the implementation details of the method, which we call per- ceptual linear predictive (PLP) analysis. The second section describes experiments aimed at finding the optimal model order with respect to modeling the linguistic information in speech. Section IlI shows that a 5th-order PLP analysis is consistent with the sensitivity of human heating to changes in several important speech parameters. Section IV shows that a 5th-order PLP analysis is consistent with two theories of vowel perception: (a) the effective second-formant theory (Fant and Risberg, 1962) and (b) the 3.5-Bark spectral peak integration theory (Chistovich et al., 1978). Section V discusses some results that support auditory normalization in speech perception. Section VI compares the performance of PLP analysis with conventional LP_analysis in speaker- independent digit recognition. Section VII contains the con-
1738 J. AcousL Soc. Am. 87 (4). Apd11990 0001-4966/90/041738-15500.80 ¸ 1990 Acoustical Society of America 1738
clusions. FORTRAN 77 code for PLP analysis is given in the Appendix.
I. THE PLP TECHNIQUE
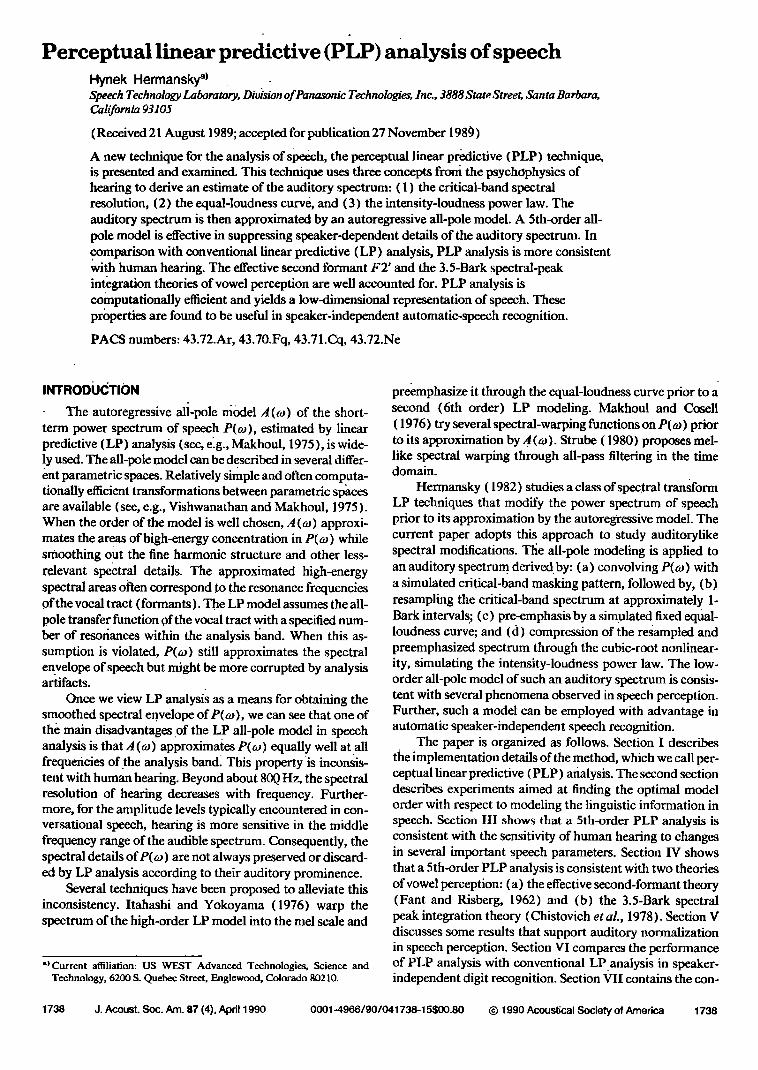
In the PLP technique, several well-known properties of hearing are simulated by practical engineering approxima- tions, and the resulting auditorylike spectrum of speech is approximated by an autoregressive all-pole model. A block diagram of the PLP method is shown in Fig. 1.
A. Spectral analysis
The speech segment is weighted by the Hamming win- dow
W(n) = 0.54 q- 0.46 cos[2rrn/(N - 1 ) ], ( 1 )
where N is the length of the window. The typical length of the window is about 20 ms. J The
discrete Fourier transform (DFT) transforms the win- dowed speech segment into the frequency domain. Typical- ly, the fast Fourier transform (FFT) is used here. For a 10- kHz sampling frequency, a 256-point FFT is needed for transforming the 200 speech samples from the 20-ms win- dow, padded by 56 zero-valued samples.
The real and imaginary components of the short-term speech spectrum are squared and added to get the short-term power spectrum
P((0) = Re[S((0) ]2 q- Im[S(a•) ]2. (2)
B. Critical-band spectral resolution
The spectrum P((0) is warped along its frequency axis (0 into the Bark frequency 11 by
11((0) = 6 ln{(0/1200rr + [ ((0/1200rr) 2 + 1 ]o.5}, (3)
where (0 is the angular frequency in rad/s. This particular Bark-hertz transformation is due to Schroeder (1977). 2 The resulting warped power spectrum is then convolved with the power spectrum of the simulated critical-band (Fletcher, 1940) masking curve q•(11). This step is similar to spectral processing in mel cepstral analysis (Bridle and Brown, 1974; Mermelstein, 1976), except for the particular shape of the critical-band curve. In our technique, the criti-
SPEECH
CRITICAL BAND ANALYSIS
EQUAL LOUDNESS I PRE-EMPHASIS
INTENSITY-LOUDNESS CONVERS ON
INVERSE OISCRETE I FOURIER TRANSFORM
SOLUTION FOR AUTOREGRESSIVE COEFFICIENTS
ALL-POLE MOOEL
FIG. 1. Block diagram of perceptual linear predictive (PLP) speech analy- sis.
cal-band curve is given by
Ii for 11 < - 1.3, 02'5<n+ø'•) for -- 1.3<11< --0.5, ß (11) = for --0.5<11<0.5, (4)
[,00- for 11>2.5.
This piece-wise shape for the simulated critical-band masking curve is our approximation to the asymmetric masking curve of Schroeder (1977). It is a rather crude ap- proximation of what is known about the shape of auditory filters. It exploits Zwicker's (1970) proposal that the shape of auditory filters is approximately constant on the Bark scale. The filter skirts are truncated at -- 40 dB.
The discrete convolution of ß (fl) with (the even sym- metric and periodic function) P((0) yields samples of the critical-band power spectrum
2.5
0(11,) = • P(11 -- 11,)q/(12). (5) fl-- 1.3
The convolution with the relatively broad critical-band masking curves q• (12) significantly reduces the spectral res- olution ofO(11) in comparison with the original P((0). This allows for the down-sampling of O(11). In our method, O(11) is sampled in approximately 1-Bark intervals. The exact value of the sampling interval is chosen so that an inte- gral number of spectral samples covers the whole analysis band. Typically, 18 spectral samples of O Ill ((0) ] are used to cover the 0-16.9-Bark (0-5-kHz) analysis bandwidth 3 in 0.994-Bark steps.
C. Equal-loudness preemphasis
The sampled ©[11(w) ] is preemphasized by the simu- lated equal-loudness curve
E[11((0)1 = E(ta)©[11((0) ]. (6)
The function E((0) is an approximation to the nonequal sen- sitivity of human hearing at different frequencies (Robinson and Dadson, 1956) and simulates the sensitivity of hearing at about the 40-dB level. Our particular approximation is adopted from Makhoul and Cosell (1976) and is given by
E((0) = [ (02 + 56.8 X 10⁶)04]/[ ((-02 q- 6.3 X 10⁶) 2
X ((02 + 0.38X 10⁹) ]. (7)
Equation (7) represents a transfer function of a filter with asymptotes of 12 dB/oct between 0 and 400 Hz, 0 dB/oct between 400 and 1200 Hz, 6 dB/oct between 1200 and 3100 Hz, and 0 dB/oct between 3100 Hz and the Nyquist frequen- cy. For moderate sound levels, this approximation is reason- ably good up to 5000 Hz. For applications requiring a higher Nyquist frequency, an additional term representing a rather steep (about - 18 dB/oct) decrease of the sensitivity of hearing for frequencies higher than 5000 I-tz might be found useful. Equation (7) would then become
E((0) = [((02 + 56.8 X 10⁶)(04]/[ ((02 q- 6.3 X 10⁶) 2
• ((02 + 0.38X 10 9) ((0 6 q- 9.58• 1026) ]. (7')
1739 J. Acoust. Soc. Am., Vol. 87, No. 4, April 1990 Hynok Hermansky: Perceptual linear predictive analysis 1739
Finally, the values of the first (0 Bark) and the last (Nyquist frequency) samples (which are not well defined) are made equal to the values of their nearest neighbors. Thus _• [fl(•o) ] begins and ends with two equal-valued samples.
D. Intensity-loudness power law
The last operation prior to the all-pole modeling is the cubic-root amplitude compression
(D(•'•) • .'•(•'•)0.33. (8)
This operation is an approximation to the power law of hear- ing (Stevens, 1957) and simulates the nonlinear relation be- tween the intensity of sound and its perceived loudness. To- gether with the psychophysical equal-loudness preemphasis, this operation also reduces the spectral-amplitude variation of the critical-band spectrum so that the following all-pole modeling can be done by a relatively low model order.
z 1.0 o
LU
..I
U.I
m 0.0 I 129
FREQUENCY [ FFT SPECTRAL POINT ]
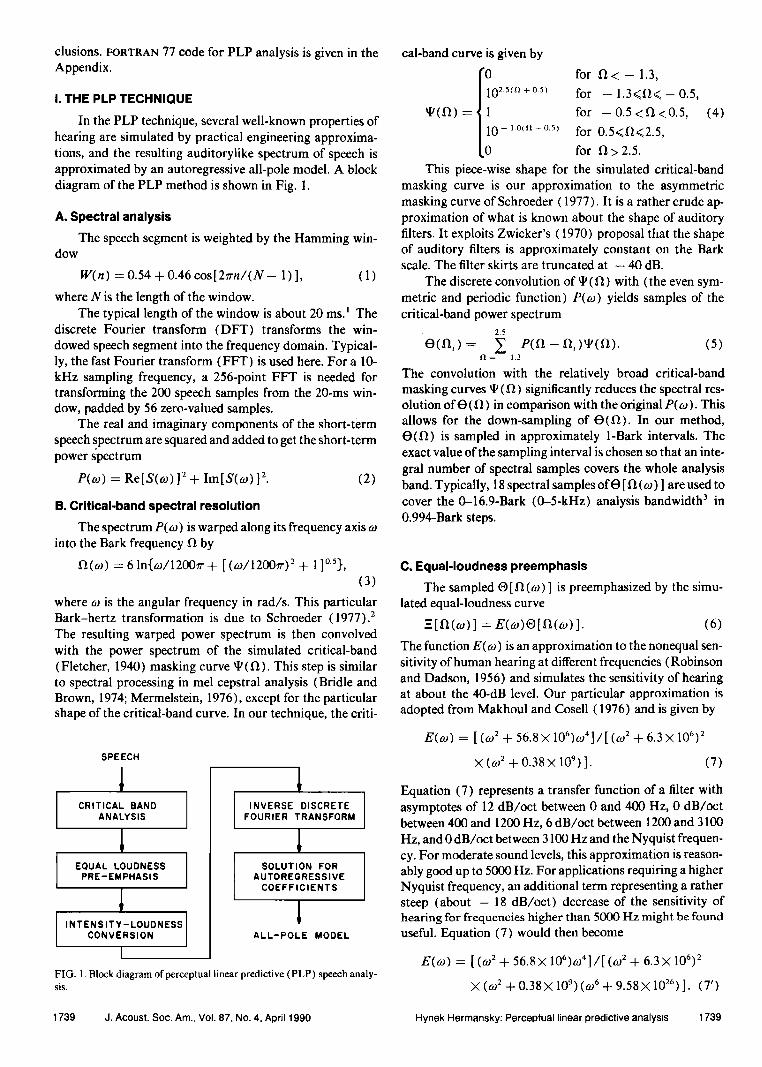
FIG. 2. The 16 weighting functions w• (o)) used for computing 16 samples of the auditory spectrum qb(f•) from the power spectrum P(w) of 20-ms frames from speech sampled at 10 kHz.
E. Autoregressive modeling In the final operation of PLP analysis, (P (fl) is approxi-
mated by the spectrum of an all-pole model using the auto- correlation method of all-pole spectral modeling. 4 Details of the spectral all-pole modeling are suffÉciently well described elsewhere (Makhoul, 1975), and we give here only a brief overview of its principle: The inverse DFT (IDFT) is ap- plied to (I)(fl) to yield the autocorrelation function dual to •(11). (Typically, a 34-point IDFT is used.) The IDFT is the better choice here than the inverse FFT, since only a few autocorrelation values are needed. The first M + I autocor- relation values are used to solve the Yule-Walker equations for the autoregressive coefficients of the M th-order all-pole model. The autoregressive coefficients could be further transformed into some other set of parameters of interest, such as cepstral coefficients of the all-pole model.
F. Practical considerations
In practice, the convolution and the preemphasis are carried out for each sample of E ( 11 k ) in the P(a• ) domain by one weighted spectral summation per spectral sample -- ( 12 i ). Thus the spectral sample -- [ 12 (a h ) ] is then given as
E[fl(w,)] = •, wi(oa)P(o)). (9)
The limits in the summation and the weighting functions wi are computed from Eqs. (4), (6), and (10) using the inverse of (3), which is given by
o) = 1200•r sinh ( fl/6 ). (10)
The weighting functions w• (a•) are precomputed for the giv- en sampling frequency and current size of the FFT. For illus- tration, the wi(oa) for a 10-kHz sampling frequency are shown in Fig. 2. Some basic properties of the weighting can be seen in the figure. The width of w• (o)), i.e., the spectral integration interval, increases with frequency as given by Eq. (3). The w• (w) are fiat on the top with exponentially shaped skirts, with low-frequency slopes typically less steep than the high-frequency slopes, as given by Eq. (4) inverted in fre-
quency by convolution and transformed from the II into the o) domain. The amplitude of the weighting increases with frequency as given by Eq. (7).
As shown later in Sec. VI, the computational require- ments of PLP analysis are comparable to the requirements of conventional LP analysis. Computationally, the most expen- sive operation is the FFT spectral calculation, followed in cost by the critical-band spectral integration and the cubic- root compression. The cost of the autoregressive modeling is negligible due to the low number of spectral samples of the auditory spectrum to be approximated. A table lookup could be used to compute the root in the intensity-loudness conver- sion to save on the computational cost.
The FORTRAN 77 code of the subroutine that computes the PLP model of one frame of speech (written with empha- sis on simplicity rather than on efficiency) is given in the Appendix.
G. Discussion
The underlying principle of PLP analysis is to approxi- mate the auditory spectrum of speech by an all-pole model. In this section, we have described one computationally rea- sonably efficient way of obtaining the estimate of the audi- tory spectrum: convolving the FFT spectrum with the criti- cal-band function, multiplying it by a fixed equal-loudness curve, and compressing its amplitude by a cubic-root func- tion. The engineering approximations to psychophysical laws were our personal choices, often directed in the first place by computational efficiency. We consequently ignored a number of known phenomena, e.g., the dependency of the critical-band shape or the equal-loudness curve on sound intensity. However, our experience suggests that, with re- spect to our current applications of PLP in speech research, their inclusion would not make a significant difference. Our view is supported by Mason and Gu (1988) who have ex- perimentally observed that the particular way of obtaining the auditory spectrum is not too critical and does not affect the fundamental properties of PLP analysis. Thus, depend- ing on the available hardware and software tools or on the
1740 d. Acoust. Soc. Am., Vol. 87, No. 4, April 1990 Hynek Hermansky: Perceptual linear predictive analysis 1740
personal preferences and beliefs of the user, a number of different ways of computing the estimate of the auditory spectrum can be used in PLP analysis.
One of weaker points of the current version of PLP anal- ysis is the dependency of the result on the overall spectral balance of P(•o) (on formant amplitudes). The spectral bal- ance is easily affected by factors such as the recording equip- ment, the communication channel or additive noise. The ef- fect of the overall spectral balance can to some extent be suppressed a posteriori by a proper distortion measure, as discussed in Sec. II A. Its reduction apriori in the analysis is of current research interest.
II. CHOICE OF THE ORDER OF THE AUTOREGRESSIVE PLP MODEL
The choice of the model order specifies the amount of detail in the auditory spectrum that is to be preserved in the spectrum of the PLP model. With increasing model order, the spectrum of the all-pole model asymptotically ap- proaches the auditory spectrum •(I•). Thus, for the auto- regressive modeling to have any effect at all, the choice of the model order for the given application is critical.
In speech processing, we are often interested in repre- senting the linguistic information in the speech signal. The following series of identification experiments 5 has been de- signed to determine the PLP model order that would be opti- mal for this task. The identification experiments resemble standard template-matching speaker-independent automat- ic speech recognition (ASR) experiments, except that, in- stead of using templates from a number of speakers sampled from the population of interest, the speech of one speaker is recognized using templates from only a single different speaker. Thus any extralinguistic information, e.g., speaker- dependent spectral factors, cannot be used to aid the identifi- cation. On the contrary, speaker-dependent factors in cross- speaker identification decrease the accuracy of the identification.
A. Spectral distortion measure for PLP
The group-delay distortion measure (Yegnanarayana and Reddy, 1979) is used in all our identification experi- ments using PLP analysis. This choice is based on our early ASR experiments that compared the conventional cepstral distortion measure with the group-delay distortion measure (Hermansky et al., 1986). The group-delay measure (que- frency-weighted measure, index-weighted cepstral measure, root-power-sum measure) is implemented by weighting cep- stral coefficients of the all-pole PLP model spectrum in the Euclidean distance by a triangular lifter. The cepstral coeffi- cients are computed recursively from autoregressive coeffi- cients of the all-pole model (see, e.g., Vishwanathan and Makhoul, 1975 ). The triangular liftering (the index weight- ing of cepstral coefficients) is equivalent to computing a fre- quency derivative of the cepstrally smoothed phase spec- trum (Yegnanarayana and Reddy, 1979). Consequently, the spectral peaks of the model are enhanced and its spectral slope is suppressed (Yegnanarayana, 1977). For a mini-
mum-phase model (such as the PLP all-pole model) com- puting the Euclidean distance between index-weighted cep- stral coefficients of two models is equivalent to evaluating the Euclidean distance between the frequency derivatives of the cepstrally smoothed power spectra of the models. Thus the group-delay distortion measure is closely related to the spectral slope measure proposed by Klatt (1982) for evalu- ating critical-band spectra.
The group-delay distortion measure is given by p
doD = (ll) i=1
where ci• and c•T are the cepstral coefficients of the reference and the test all-pole models, respectively, and p is the num- ber of cepstral coefficients in the cepstral approximation of the all-pole model spectra. In all experiments with PLP re- ported in this paper, the number of cepstral coefficients was set top = 5. The zeroth cepstral coefficient, i.e., the logarith- mic gain of the model, was excluded.
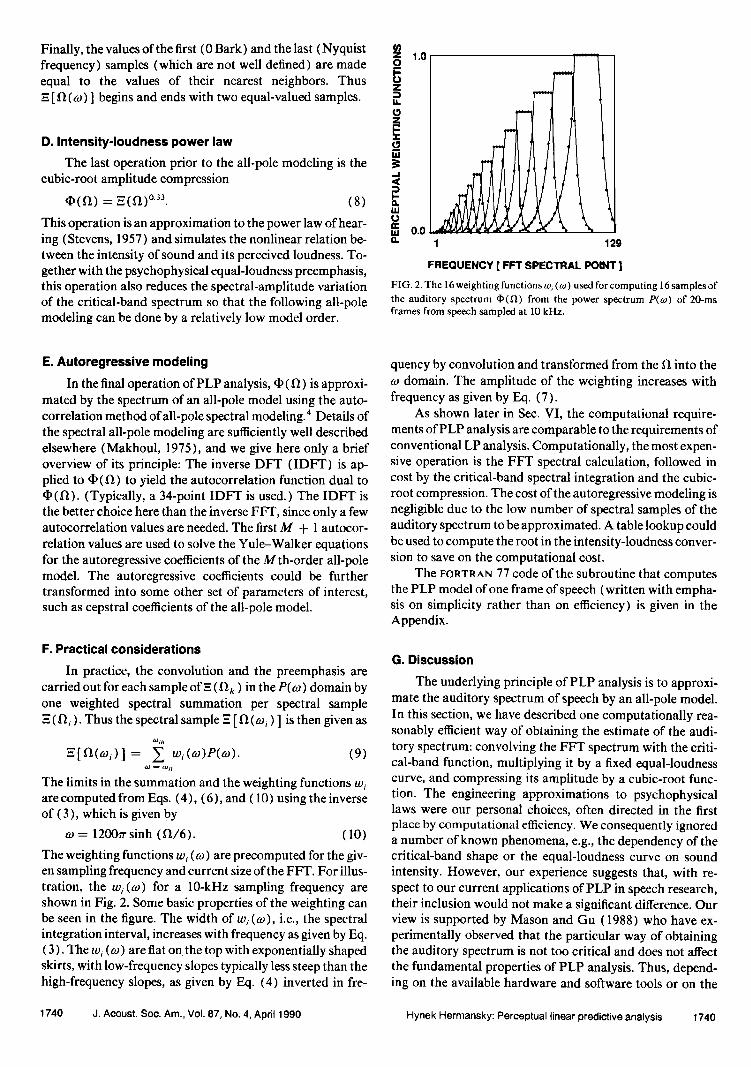
One important difference between the cepstral and the group-delay measures is illustrated in Fig. 3. This figure shows how the investigated distortion measures reflect the difference in the frequency of one spectral peak in two com- pared all-pole models. As is evident, the group-delay mea- sure is more sensitive to the actual value of the spectral peak width.
Hermansky and Junqua (1988) proposed that both the cepstral and the group-delay measures are special cases of the general exponential measure
p
da•xv = Z i•S(c'•- c,.,.):, (12)
where S•0 is a variable coefficient that allows for various degrees of peak enhancement. This exponential lifter is used for enhancing spectral peaks in the spectrograms shown in Sec. V.
B. Single-frame phoneme identification
Speech from two male and two female adult speakers, reading five repetitions of 104 words, corresponding to the names of typewriter keyboard characters, has been hand la- beled at well-identifiable points of each phoneme (the most
CEPSTRAL METRIC GROUP-DELAY METRIC
a.OAD PEAK I \ 0 1.2 -I.2 O 1.2
DISTANCE BET1NEEN TWO SPECTRAL PEAKS (tad/s)
FIG. 3. Cepstral and group-delay distances between two all-pole models that differ in the position of one of their complex poles. The group-delay metric is more sensitive to distance between narrow peaks.
1741 J. Acoust. Sec. Am., Vol. 87, No. 4, April 1990 Hynek Hermansky: Perceptual linear predictive analysis 1741
steady parts ofsonorants, maxima of energy in stops, centers of transition in diphthongs). The speech was sampled at 10 kHz, and the labeled points were analyzed by PLP analysis. Clusters of analysis vectors with identical phonemie values from each of the speakers were formed. The sizes of the clus- ters varied from 100 vectors to 5 vectors, reflecting the pho- netic balance of the database. The centroids of the clusters
were defined and found as averages of each cluster in the autocorrelation domain. Thus each speaker was character- ized by 41 phonemelike PLP vectors, representing the 41 phonemes occurring in the database.
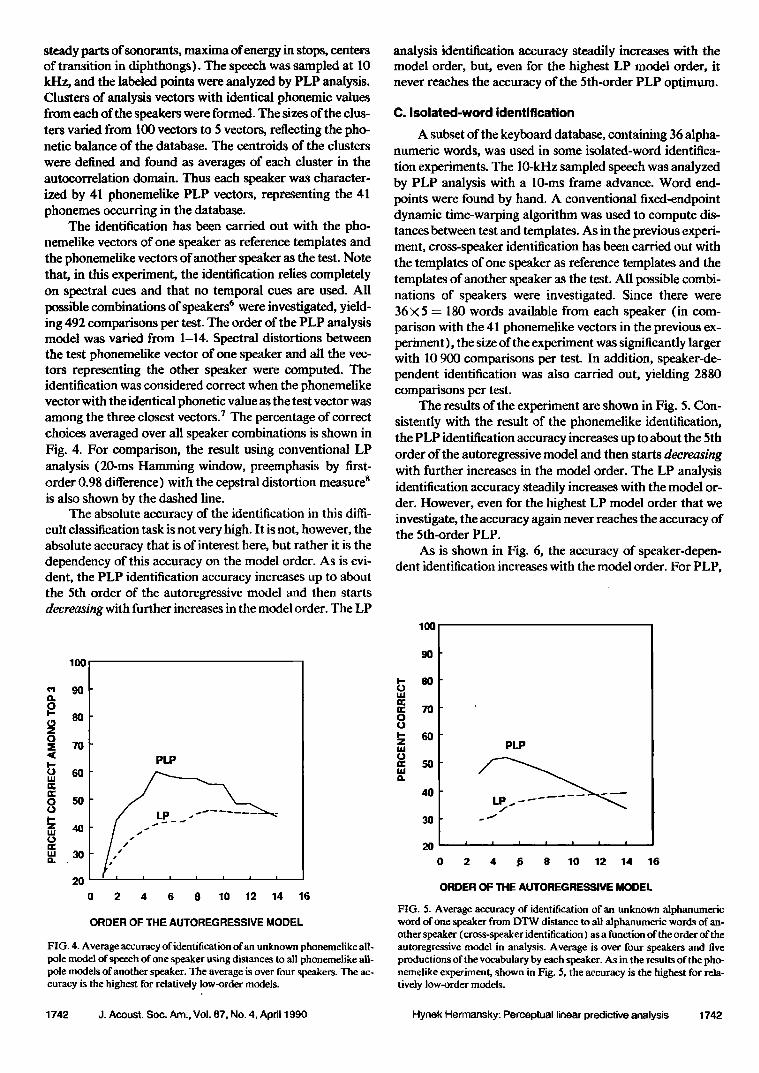
The identification has been carried out with the pho- nemelike vectors of one speaker as reference templates and the phonemelike vectors of another speaker as the test. Note that, in this experiment, the identification relies completely on spectral cues and that no temporal cues are used. All possible combinations of speakers 6 were investigated, yield- ing 492 comparisons per test. The order of the PLP analysis model was varied from 1-14. Spectral distortions between the test phonemelike vector of one speaker and all the vec- tors representing the other speaker were computed. The identification was considered correct when the phonemelike vector with the identical phonetic value as the test vector was among the three closest vectors. 7 The percentage of correct choices averaged over all speaker combinations is shown in Fig. 4. For comparison, the result using conventional LP analysis (20-ms Hamming window, preemphasis by first- order 0.98 difference) with the cepstral distortion measure s is also shown by the dashed line.
The absolute accuracy of the identification in this diffi- cult classification task is not very high. It is not, however, the absolute accuracy that is of interest here, but rather it is the dependency of this accuracy on the model order. As is evi- dent, the PLP identification accuracy increases up to about the 5th order of the autoregressive model and then starts decreasing with further increases in the model order. The LP
100
o • 70
I-
0 5o
z 40 uJ
Q.
0
PLP
2 4 6 8 10 12 14 16
ORDER OF THE AUTOREGRESSIVE MODEL
FIG. 4. Average accuracy of identification of an unknown phonemelike all- pole model of speech of one speaker using distances to all phonemelike all- pole models of another speaker. The average is over four speakers. The ac- curacy is the highest for relatively low-order models.
analysis identification accuracy steadily increases with the model order, but, even for the highest LP model order, it never reaches the accuracy of the 5th-order PLP optimum.
C. Isolated-word identification
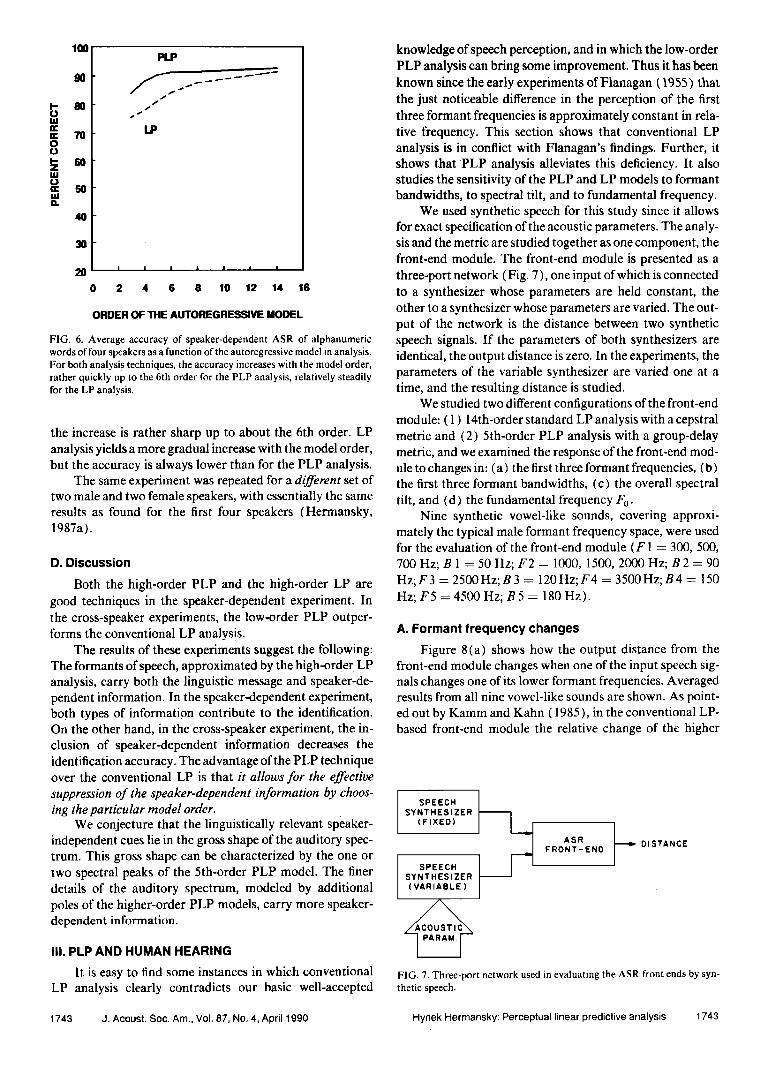
A subset of the keyboard database, containing 36 alpha- numeric words, was used in some isolated-word identifica- tion experiments. The 10-kHz sampled speech was analyzed by PLP analysis with a 10-ms frame advance. Word end- points were found by hand. A conventional fixed-endpoint dynamic time-warping algorithm was used to compute dis- tances between test and templates. As in the previous experi- ment, cross-speaker identification has been carried out with the templates of one speaker as reference templates and the templates of another speaker as the test. All possible combi- nations of speakers were investigated. Since there were 36X5 = 180 words available from each speaker (in com- parison with the 41 phonemelike vectors in the previous ex- periment), the size of the experiment was significantly larger with 10 900 comparisons per test. In addition, speaker-de- pendent identification was also carried out, yielding 2880 comparisons per test.
The results of the experiment are shown in Fig. 5. Con- sistently with the result of the phonemelike identification, the PLP identification accuracy increases up to about the 5th order of the autoregressive model and then starts decreasing with further increases in the model order. The LP analysis identification accuracy steadily increases with the model or- der. However, even for the highest LP model order that we investigate, the accuracy again never reaches the accuracy of the 5th-order PLP.
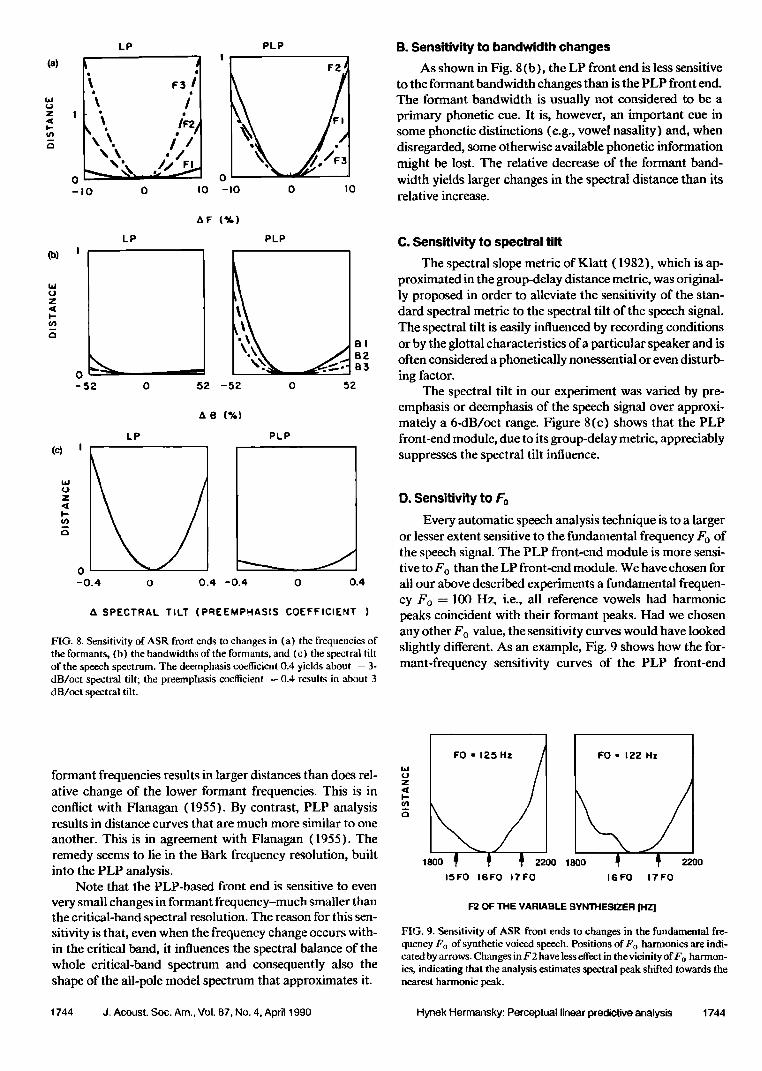
As is shown in Fig. 6, the accuracy of speaker-depen- dent identification increases with the model order. For PLP,
PLP
2 4 .6 8 10 12 14 16
ORDER OF THE AUTOREGRESSIVE MODEL
FIG. 5. Average accuracy of identification of an unknown alphanumeric word of one speaker from DTW distance to all alphanumeric words oran- other speaker (cross-speaker identification) as a function of the order of the autoregressive model in analysis. Average is over four speakers and five productions of the vocabulary by each speaker. As in the results of the pho- nemelike experiment, shown in Fig. 5, the accuracy is the highest for rela- tively low-order models.
1742 J. Acoust. Soc. Am., Vol. 87, No. 4, April 1990 Hynek Hermansky: Perceptual linear predictive analysis 1742
2 4 6 8 10 12 14 16
ORDER OF THE AUTOREGRESSIVE MODEL
FIG. 6. Average accuracy of speaker-dependent ASR of alphanumeric words of four speakers as a function of the autoregressive model in analysis. For both analysis techniques, the accuracy increases with the model order, rather quickly up to the 6th order for the PLP analysis, relatively steadily for the LP analysis.
the increase is rather sharp up to about the 6th order. LP analysis yields a more gradual increase with the model order, but the accuracy is always lower than for the PLP analysis.
The same experiment was repeated for a different set of two male and two female speakers, with essentially the same results as found for the first four speakers (Hermansky, 1987a).
D. Discussion
Both the high-order PLP and the high-order LP are good techniques in the speaker-dependent experiment. In the cross-speaker experiments, the low-order PLP outper- forms the conventional LP analysis.
The results of these experiments suggest the following: The formants of speech, approximated by the high-order LP analysis, carry both the linguistic message and speaker-de- pendent information. In the speaker-dependent experiment, both types of information contribute to the identification. On the other hand, in the cross-speaker experiment, the in- clusion of speaker-dependent information decreases the identification accuracy. The advantage of the PLP technique over the conventional LP is that it allows for the effective suppression of the speaker-dependent information by choos- ing the particular model order.
We conjecture that the linguistically relevant speaker- independent cues lie in the gross shape of the auditory spec- trum. This gross shape can be characterized by the one or two spectral peaks of the 5th-order PLP model. The finer details of the auditory spectrum, modeled by additional poles of the higher-order PLP models, carry more speaker- dependent information.
Ill. PLP AND HUMAN HEARING
It is easy to find some instances in which conventional LP analysis clearly contradicts our basic well-accepted
knowledge of speech perception, and in which the low-order PLP analysis can bring some improvement. Thus it has been known since the early experiments of Flanagan (1955) that the just noticeable difference in the perception of the first three formant frequencies is approximately constant in rela- tive frequency. This section shows that conventional LP analysis is in conflict with Flanagan's findings. Further, it shows that 'PLP analysis alleviates this deficiency. It also studies the sensitivity of the PLP and LP models to formant bandwidths, to spectral tilt, and to fundamental frequency.
We used synthetic speech for this study since it allows for exact specification of the acoustic parameters. The analy- sis and the metric are studied together as one component, the front-end module. The front-end module is presented as a three-port network (Fig. 7), one input of which is connected to a synthesizer whose parameters are held constant, the other to a synthesizer whose parameters are varied. The out- put of the network is the distance between two synthetic speech signals. If the parameters of both synthesizers are identical, the output distance is zero. In the experiments, the parameters of the variable synthesizer are varied one at a time, and the resulting distance is studied.
We studied two different configurations of the front-end module: ( 1 ) 14th-order standard LP analysis with a cepstral metric and (2) 5th-order PLP analysis with a group-delay metric, and we examined the response of the front-end mod- ule to changes in: (a) the first three formant frequencies, (b) the first three formant bandwidths, (c) the overall spectral tilt, and (d) the fundamental frequency F o.
Nine synthetic vowel-like sounds, covering approxi- mately the typical male formant frequency space, were used for the evaluation of the front-end module (F ! = 300, 500,
700 Hz; B 1 = 50 Hz; F2 ---- 1000, 1500, 2000 Hz; B2 = 90 Hz; F 3 = 2500 Hz; B 3 •- 120 Hz; F4 = 3500 Hz; B 4 -- 150 Hz; F5 -- 4500 Hz; B5 = 180 Hz).
A. Formant frequency changes
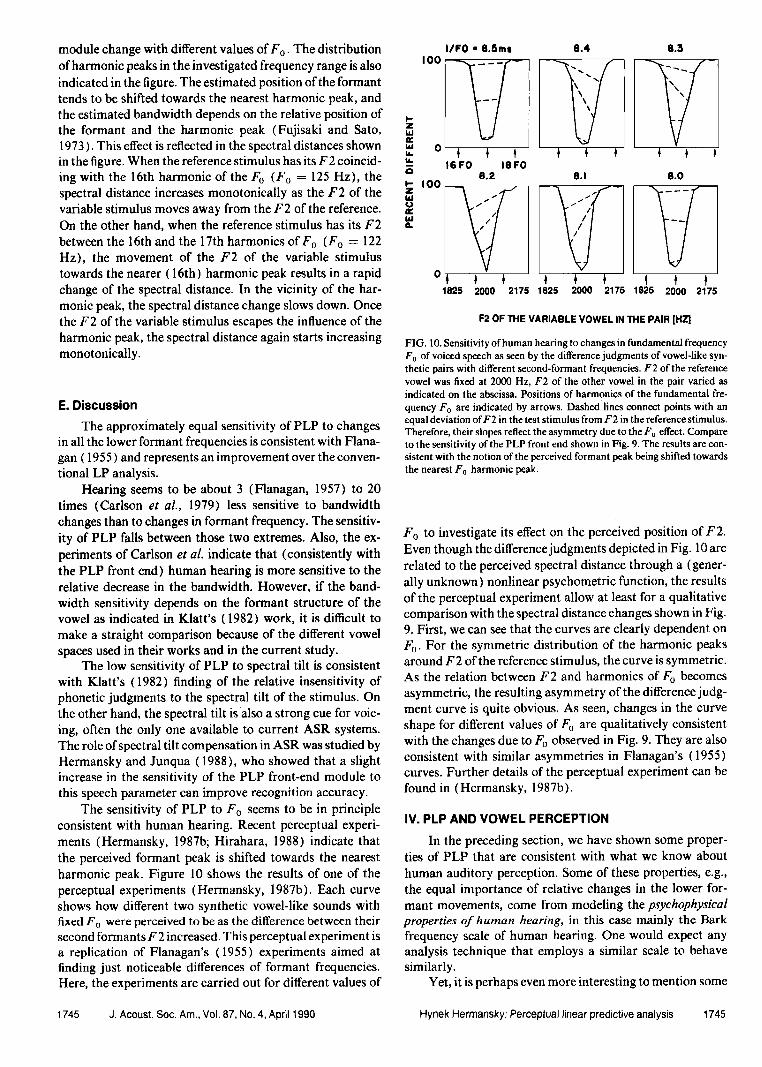
Figure 8(a) shows how the output distance from the front-end module changes when one of the input speech sig- nals changes one of its lower formant frequencies. Averaged results from all nine vowel-like sounds are shown. As point- ed out by Kamm and Kahn (1985), in the conventional LP- based front-end module the relative change of the higher
SPEECH SYNTHESIZER (FIXED)
• ASR • DISTANCE FRONT-ENO
I SPEECH SYNTHESIZER (VARIABLE)
FIG. 7. Three-port network used in evaluating the ASR front ends by syn- thetic speech.
1743 J. Acoust. Soc. Am., Vol. 87, No. 4, April 1990 Hynek Hermansky: Perceptual linear predictive analysis 1743
(a)
Co)
Z
LP
0
-IO o IO
PLP
-IO o IO
LP I
AF
o -5• o 52
(%)
PLP
BI
0 52
(c)
b a (%l
LP I
0
-0.4 0
PLP
0.4 -0.4 0 0.4
SPECTRAL TILT (PREEMPHASIS COEFFICIENT )
FIG. 8. Sensitivity of ASR front ends to changes in (a) the frequencies of the formants, (b) the bandwidths of the formants, and (c) the spectral tilt of the speech spectrum. The deemphasis coefficient 0.4 yields about -- 3- dB/oct spectral tilt; the preemphasis coefficient - 0.4 results in about 3 dB/oct spectral tilt.
B. Sensitivity to bandwidth changes
As shown in Fig. 8(b), the LP front end is less sensitive to the formant bandwidth changes than is the PLP front end. The formant bandwidth is usually not considered to be a primary phonetic cue. It is, however, an important cue in some phonetic distinctions (e.g., vowel nasality) and, when disregarded, some otherwise available phonetic information might be lost. The relative decrease of the formant band- width yields larger changes in the spectral distance than its relative increase.
C. Sensitivity to spectral tilt
The spectral slope metric of Klatt (1982), which is ap- proximated in the group-delay distance metric, was original- ly proposed in order to alleviate the sensitivity of the stan- dard spectral metric to the spectral tilt of the speech signal. The spectral tilt is easily influenced by recording conditions or by the glottal characteristics of a particular speaker and is often considered a phonetically nonessential or even disturb- ing factor.
The spectral tilt in our experiment was varied by pre- emphasis or deemphasis of the speech signal over approxi- mately a 6-dB/oct range. Figure 8(c) shows that the PLP front-end module, due to its group-delay metric, appreciably suppresses the spectral tilt influence.
D. Sensitivity to Fo
Every automatic speech analysis technique is to a larger or lesser extent sensitive to the fundamental frequency F o of the speech signal. The PLP front-end module is more sensi- tive to Fo than the LP front-end module. We have chosen for all our above described experiments a fundamental frequen- cy Fo = 100 Hz, i.e., all reference vowels had harmonic peaks coincident with their formant peaks. Had we chosen any other Fo value, the sensitivity curves would have looked slightly different. As an example, Fig. 9 shows how the for- mant-frequeney sensitivity curves of the PLP front-end
formant frequencies results in larger distances than does rel- ative change of the lower formant frequencies. This is in conflict with Fianagan (1955). By contrast, PLP analysis results in distance curves that are much more similar to one
another. This is in agreement with Flanagan (1955). The remedy seems to lie in the Bark frequency resolution, built into the PLP analysis.
Note that the PLP-based front end is sensitive to even
very small changes in formant frequency-much smaller than the critical-band spectral resolution. The reason for this sen- sitivity is that, even when the frequency change occurs with- in the critical band, it influences the spectral balance of the whole critical-band spectrum and consequently also the shape of the all-pole model spectrum that approximates it.
FO ß 122 Hz
16FO 17FO
F2 OF THE VARIABLE SYNTHESIZER [HZ]
FIG. 9. Sensilivity of ASR front ends to changes in the fundamental fre- quency F o of synthetic voiced speech. Positions off o harmonics are indi- cated by arrows. Changes in F 2 have less effect in the vicinity off o harmon- ics, indicating that the analysis estimates spectral peak shifted towards the nearest harmonic peak.
1744 J. Acoust. $oc. Am., VoL 87, No. 4, April 1990 Hynek Hermansky: Perceptual linear predictive analysis 1744
module change with different values ofFo. The distribution of harmonic peaks in the investigated frequency range is also indicated in the figure. The estimated position of the formant tends to be shifted towards the nearest harmonic peak, and the estimated bandwidth depends on the relative position of the formant and the harmonic peak (Fujisaki and Sato, 1973). This effect is reflected in the spectral distances shown in the figure. When the reference stimulus has its F 2 coincid- ing with the 16th harmonic of the Fo (Fo = 125 Hz), the spectral distance increases monotonically as the F2 of the variable stimulus moves away from the F2 of the reference. On the other hand, when the reference stimulus has its F2 between the 16th and the 17th harmonics ofFo (Fo = 122 Hz), the movement of the F2 of the variable stimulus towards the nearer (16th) harmonic peak results in a rapid change of the spectral distance. In the vicinity of the har- monic peak, the spectral distance change slows down. Once the F2 of the variable stimulus escapes the influence of the harmonic peak, the spectral distance again starts increasing monotonically.
E. Discussion
The approxi'mately equal sensitivity of PLP to changes in all the lower formant frequencies is consistent with Flana- gan ( 1955) and represents an improvement over the conven- tional LP analysis.
Hearing seems to be about 3 (Flanagan, 1957) to 20 times (Carlson et al., 1979) less sensitive to bandwidth changes than to changes in formant frequency. The sensitiv- ity of PLP falls between those two extremes. Also, the ex- periments of Carlson et al. indicate that (consistently with the PLP front end) human hearing is more sensitive to the relative decrease in the bandwidth. However, if the band- width sensitivity depends on the formant structure of the vowel as indicated in Klatt's (1982) work, it is difficult to make a straight comparison because of the different vowel spaces used in their works and in the current study.
The low sensitivity of PLP to spectral tilt is consistent with Klatt's (1982) finding of the relative insensitivity of phonetic judgments to the spectral tilt of the stimulus. On the other hand, the spectral tilt is also a strong cue for voic- ing, often the only one available to current ASR systems. The role of spectral tilt compensation in ASR was studied by Hermansky and Junqua (1988), who showed that a slight increase in the sensitivity of the PLP front-end module to this speech parameter can improve recognition accuracy.
The sensitivity of PLP to Fo seems to be in principle consistent with human hearing. Recent perceptual experi- ments (Hermansky, 1987b; Hirahara, 1988) indicate that the perceived formant peak is shifted towards the nearest harmonic peak. Figure 10 shows the results of one of the perceptual experiments (Hermansky, 1987b). Each curve shows how different two synthetic vowel-like sounds with fixed F o were perceived to be as the difference between their second formants F 2 increased. This perceptual experiment is a replication of Flanagan's (1955) experiments aimed at finding just noticeable differences of formant frequencies. Here, the experiments are carried out for different values of
z
I/FO ß 8.Smt 100
o • • • 16 FO 18 FO
8.2 IO0
o ,• • 1825 2000 2175
8.4
1825 2000 2175 1825 2000 2175
F2 OF THE VARIABLE VOWEL IN THE PAIR [HZ]
FIG. 10. Sensitivity of human hearing to changes in fundamental frequency F o of voiced speech as seen by the difference judgments of vowel-like syn- thetic pairs with different second-formant frequencies. F2 of the reference vowel was fixed at 2000 Hz, F2 of the other vowel in the pair varied as indicated on the abscissa. Positions of harmonics of the fundamental fre-
quency Fo are indicated by arrows. Dashed lines connect points with an equal deviation ofF2 in the test stimulus from F2 in the reference stimulus. Therefore, their slopes reflect the asymmetry due to the Fo effect. Compare to the sensitivity of the PLP front end shown in Fig. 9. The results are con- sistent with the notion of the perceived formant peak being shifted towards the nearest Fo harmonic peak.
Fo to investigate its effect on the perceived position ofF2. Even though the difference judgments depicted in Fig. 10 are related to the perceived spectral distance through a (gener- ally unknown) nonlinear psychometric function, the results of the perceptual experiment allow at least for a qualitative comparison with the spectral distance changes shown in Fig. 9. First, we can see that the curves are clearly dependent on Fo. For the symmetric distribution of the harmonic peaks around F2 of the reference stimulus, the curve is symmetric. As the relation between F2 and harmonics of F o becomes asymmetric, the resulting asymmetry of the difference judg- ment curve is quite obvious. As seen, changes in the curve shape for different values of F o are qualitatively consistent with the changes due to Fo observed in Fig. 9. They are also consistent with similar asymmetries in Flanagan's (1955) curves. Further details of the perceptual experiment can be found in (Hermansky, 1987b).
IV. PLP AND VOWEL PERCEPTION
In the preceding section, we have shown some proper- ties of PLP that are consistent with what we know about
human auditory perception. Some of these properties, e.g., the equal importance of relative changes in the lower for- mant movements, come from modeling the psychophysical properties of human hearing, in this case mainly the Bark frequency scale of human hearing. One would expect any analysis technique that employs a similar scale to behave similarly.
Yet, it is perhaps even more interesting to mention some
1745 J. Acoust. Soc. Am., Vol. 87, No. 4, April 1990 Hynek Hermansky: Perceptual linear predictive analysis 1745
instances in which the 5th-order PLP is consistent with some
not yet fully accepted concepts of speech perception. These include the effective second formant F 2' concept (Fant and Risberg, 1962) and the 3.5-Bark spectral-peak integration theory (Chistovich et al., 1978). This section shows that the 5th-order PLP is consistent with both concepts.
A. The effective second formant
According to Chiba and Kajiyama ( 1941 ), two or one "proper tones" characterize Japanese front and back vowels, respectively. Their "proper tones" do not necessarily coin- cide with lowest formants. A similar conclusion was reached
by Delattre et al. (1954) who observed that two spectral peaks are all that are needed for simulating the phonetic qualities of front vowels, and that one spectral peak is suffi- cient for simulating back vowels. These observations are Suggestive of the amount of spectral reduction that human hearing might be performing on the vowel spectrum. In simi- lar two-peak simulations of Swedish vowels, Fant and Ris- berg (1962) propose that the first spectral peak be kept at the first formant frequency. For the second spectral peak, they use a so called effectioe secondformant FT. As already observed by Chiba and Kajiyama and by Delattre et al., F2' does not directly correspond to any particular formant, but is typically close to the second formant in simulating back vowels such as/a/and is close to the third or even the fourth
formant in simulating front vowels such as/i/. Later, Carl- Son et al. (1975), Bladon and Fant (1978), and Paliwal et al. (1983) used formulas for deriving F 2' as a weighted average of the first four formants. Carlson et al. (1975), Itahashi and YokOyama (1976), Hermansky et al. (1985), and Shamma (1988) have observed that auditory models often exhibit a peak close to FT.
We have replicated 18 synthetic cardinal vowels for which Bladon and Fant (1978) give values ofF2'. A serial synthesizer excited by Rosenberg's (1970) type (c) differen- tiated glottal pulse with Fo = 80 Hz, a 25% opening time and a 20% Closing time was used in the simulation. The output speech was low-pass filtered using a digital filter with a double real pole at z = 0.6. Formant frequencies were as given by Bladon and Fant (1978), and formant bandwidths wer e computed from corrected formulas given by Fant (1972).
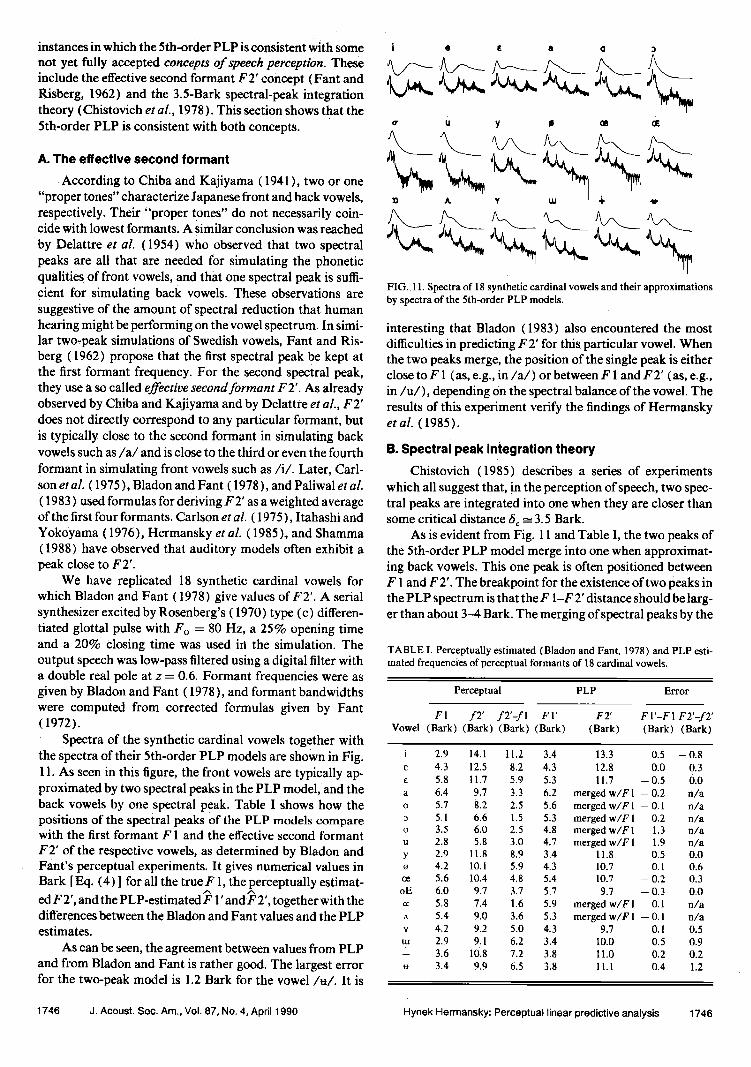
Spectra of the synthetic cardinal vowels together with the spectra of their 5th-order PLP models are shown in Fig. 11. As seen in this figure, the front vowels are typically ap- proximated by two spectral peaks in the PLP model, and the back vowels by one spectral peak. Table I shows how the positions of the speciral peaks of the PLP models compare with the first formant F 1 and the effective second formant F2' of the respective vowels, as determined by Bladon and Fant's perceptual experiments. It gives numerical values in
Bark [Eq. (4) ] for all the trueff 1, the•perCeptually estimat- ed F 2', and the PLP-estimated F 1' and F 2', together with the differences between the Bladon and Fant values and the PLP estimates.
As can be seen, the agreement between values from PLP and from Bladon and Fant is rather good. The largest error for the two-peak model is 1.2 Bark for the vowel/u?. It is
• A Y • '
FIG. 11. Spectra of 18 synthetic cardinal vowels and their approximations by spectra of the 5th-order PLP models.
interesting that Bladon (1983) also encountered the most difficulties in predicting F 2' for this particular vowel. When the two peaks merge, the position of the single peak is either close to F 1 (as, e.g., in/a/) or between F 1 and F 2' (as, e.g., in/u/), depending On the spectral balance of the vowel. The results of this experiment verify the findings of Hermansky et al. (1985).
B. Spectral peak integration theory
Chistovich (1985) describes a series of experiments which all suggest that, in the perception of speech, two spec- tral peaks are integrated into one when they are closer than some critical distance •5½ • 3.5 Bark.
As is evident from Fig. 11 and Table I, the two peaks of the 5th-order PLP model merge into one when approximat- ing back vowels. This one peak is often positioned between F 1 and F 2'. The breakpoint for the existence of two Peaks in the PLP spectrum is that the F I-F 2' distance should be larg- er than about 3-4 Bark. The merging of spectral peaks by the
TABLE I. Perceptually estimated (Bladon and Fant, !978) and PLP esti- mated frequencies of perceptual formants of 18 cardinal vowels.
Perceptual PLP Error
FI f2' f2'-fl FI' F2' FI'-FI F2'-f2' Vowel (Bark) (Bark) (Bark) (Bark) (Bark) (Bark) (Bark)
2.9 14.1 11.2
4.3 12.5 8.2 5.8 11.7 5.9
6.4 9.7 3.3
5.7 8.2 2.5 5.1 6.6 1.5 3.5 6.0 2.5
2.8 5.8 3.0
2.9 11.8 8.9 4.2 10.1 5.9
5.6 10.4 4.8
6.0 9.7 3.7 5.8 7.4 1.6
5.4 9.0 3.6
4.2 9.2 5.0
2.9 9.1 6.2
3.6 1•8 7.2 3.4 9.9 6.5
3.4 13.3 0.5 -0.8
4.3 12.8 0.0 0.3 5.3 11.7 --0.5 0.0
6.2 merg• w/F1 -- 0.2 n/a 5.6 merged w/F 1 -- 0.1 n/a 5.3 merged w/F 1 0.2 n/a 4.8 merged w/F1 1.3 n/a 4.7 merged w/F 1 1.9 n/a 3.4 11.8 0.5 0.0 4.3 10.7 0.1 0.6 5.4 10.7 --0.2 0.3
5.7 9.7 --0.3 0.0
5.9 mergedw/Fl 0.1 n/a 5.3 mergedw/F1 --0.1 n/a 4.3 9.7 0.1 0.5 3.4 I0.0 0.5 0.9 3.8 11.0 0.2 0.2 3.8 11.1 0.4 1.2
1746 d. Acoust. Soc. Am., Vol. 87, No. 4, April 1990 Hynek Hermansky: Perceptual linear predictive analysis 1746
PLP model at about 3.5 Barks has been also reported by Hermansky et al. (1985).
C. The significance of the bandwidth
Shortly after the F2' concept was proposed, Fujimura (1967) argued against it by demonstrating that pairs ofpho- netically distinct vowels with identical F 1 and F 2' exist. Such pairs of distinct vowels differ in the spread of the higher formant cluster. Later, Bladon (1983) attempted to alleviate this ambiguity by applying the 3.5-Bark spectral peak inte- gration rule to the F2-F3-F4 cluster. In this section, we show that the 5th-order PLP model alleviates Fujimura's ambiguity.
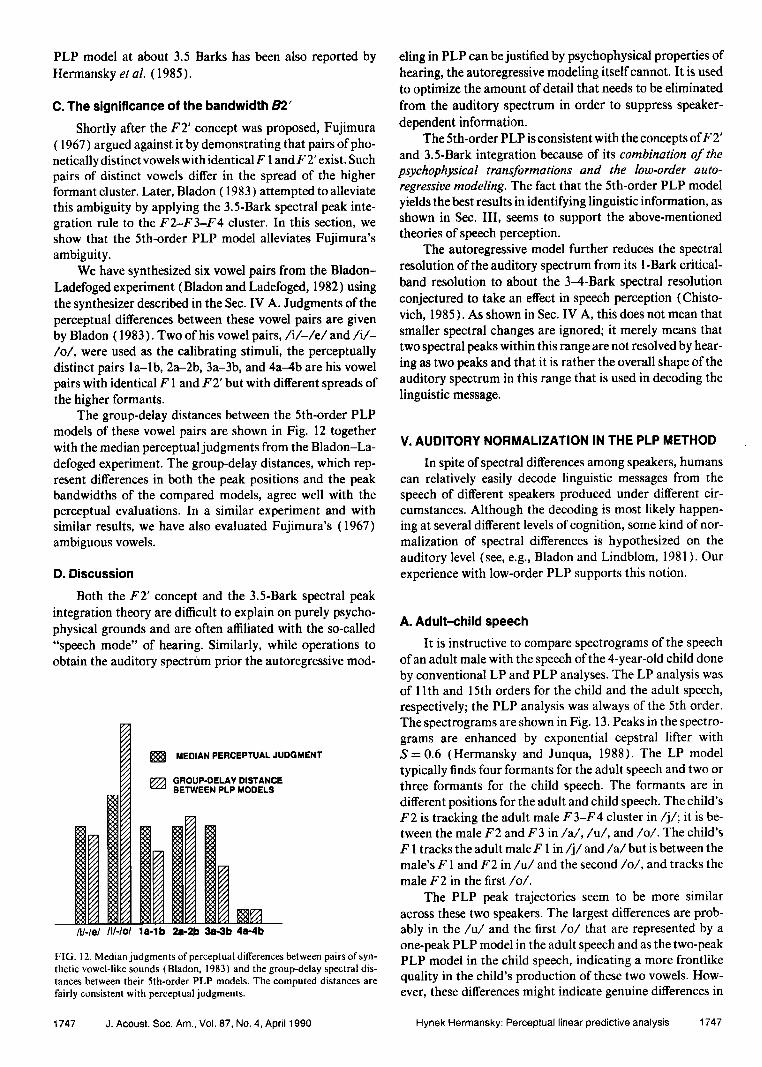
We have synthesized six vowel pairs from the Bladon- Ladefoged experiment (Bladon and Ladefoged, 1982) using the synthesizer described in the Sec. IV A. Judgments of the perceptual differences between these vowel pairs are given by Bladon (1983). Two of his vowel pairs,/i/-/e/and/i/- /o/, were used as the calibrating stimuli, the perceptually distinct pairs la-lb, 2a-2b, 3a-3b, and 4a-4b are his vowel pairs with identical F 1 and F2' but with different spreads of the higher formants.
The group-delay distances between the 5th-order PLP models of these vowel pairs are shown in Fig. 12 together with the median perceptual judgments from the Bladon-La- defoged experiment. The group-delay distances, which rep- resent differences in both the peak positions and the peak bandwidths of the compared models, agree well with the perceptual evaluations. In a similar experiment and with similar results, we have also evaluated Fujimura's (1967) ambiguous vowels.
D. Discussion
Both the F2' concept and the 3.5-Bark spectral peak integration theory are difficult to explain on purely psyche- physical grounds and are often affiliated with the so-called "speech mode" of hearing. Similarly, while operations to obtain the auditory spectram prior the autoregressive mod-
•] MEDIAN PERCEPTUAL JUDGMENT
• GROUP-OELA¾ DISTANCE BETWEEN PLP MODELS
/11-lel II1-1ol l a-lb 2•-210 3•3b 4a-4b
FIG. 12. Median judgments of perceptual differences between pairs of syn- thetic vowel-like sounds (Bladon, 1983) and the group-delay spectral dis- tances between their 5th-order PLP models. The computed distances are fairly consistent with perceptual judgments.
eling in PLP can be justified by psychephysical properties of hearing, the autoregressive modeling itself cannot. It is used to optimize the amount of detail that needs to be eliminated from the auditory spectrum in order to suppress speaker- dependent information.
The 5th-order PLP is consistent with the concepts ofF2' and 3.5-Bark integration because of its combination of the psychephysical transformations and the low-order auto- regressive modeling. The fact that the 5th-order PLP model yields the best results in identifying linguistic information, as shown in Sec. III, seems to support the above-mentioned theories of speech perception.
The autoregressive model further reduces the spectral resolution of the auditory spectrum from its 1-Bark critical- band resolution to about the 3-4-Bark spectral resolution conjectured to take an effect in speech perception (Chisto- vich, 1985). As shown in Sec. IV A, this does not mean that smaller spectral changes are ignored; it merely means that two spectral peaks within this range are not resolved by hear- ing as two peaks and that it is rather the overall shape of the auditory spectrum in this range that is used in decoding the linguistic message.
V. AUDITORY NORMALIZATION IN THE PLP METHOD
In spite of spectral differences among speakers, humans can relatively easily decode linguistic messages from the speech of different speakers produced under different cir- cumstances. Although the decoding is most likely happen- ing at several different levels of cognition, some kind of nor- malization of spectral differences is hypothesized on the auditory level (see, e.g., Bladon and Lindblom, 1981 ). Our experience with low-order PLP supports this notion.
A. Adult-child speech
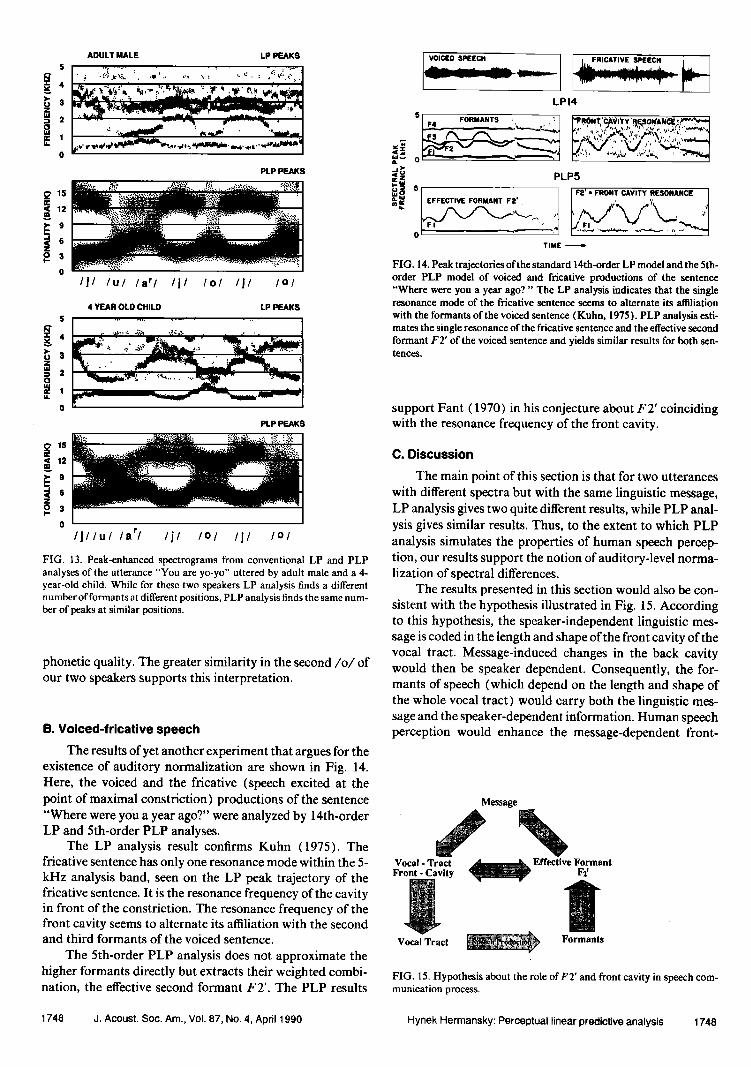
It is instructive to compare spectrograms of the speech of an adult male with the speech of the 4-year-old child done by conventional LP and PLP analyses. The LP analysis was of 11 th and 15th orders for the child and the adult speech, respectively; the PLP analysis was always of the 5th order. The spectrograms are shown in Fig. 13. Peaks in the spectro- grams are enhanced by exponential cepstral lifter with S= 0.6 (Hermansky and Junqua, 1988). The LP model typically finds four formants for the adult speech and two or three formants for the child speech. The formants are in different positions for the adult and child speech. The child's F2 is tracking the adult male F3-F4 cluster in/j/; it is be- tween the male F2 and F3 in/a/,/u/, and/o/. The child's F 1 tracks the adult male F 1 in/j/and/a/but is between the male's F 1 and F2 in/u/and the second/o/, and tracks the male F2 in the first/o/.
The PLP peak trajectories seem to be more similar across these two speakers. The largest differences are prob- ably in the/u/and the first/o/that are represented by a one-peak PLP model in the adult speech and as the two-peak PLP model in the child speech, indicating a more frontlike quality in the child's production of these two vowels. How- ever, these differences might indicate genuine differences in
1747 d. Acoust. Sec. Am., Vol. 87, No. 4, April 1990 Hynek Hermansky: Perceptual linear predictive analysis 1747
ADULT MALE LP PEAKS
I '"' -',.-,.•s•' : •.•' ß ',,•,,,.. I
PLP PEAKS
< 12
6
O 3 I,-
0
/j/ /u/ /at/ /j/ /O/ /j/ /O/
4 YEAR OLD CHILD LP PEAKS
5
'o PLPPEAKS
• 15 < 12
0:3 I-
o
/J/ lul /ar/ /jl /0/ /j/ I01 FIG. 13. Peak-enhanced spectrograms from conventional LP and PLP analyses of the utterance "You are yo-yo" uttered by adult male and a 4- year-old child. While for these two speakers LP analysis finds a different number of formants at different positions, PLP analysis finds the same num- ber of peaks at similar positions.
phonetic quality. The greater similarity in the second/o/of our two speakers supports this interpretation.
B. Voiced-fricative speech
The results of yet another experiment that argues for the existence of auditory normalization are shown in Fig. 14. Here, the voiced and the fricative (speech excited at the point of maximal constriction) productions of the sentence "Where were yOU a year ago?" were analyzed by 14th-order LP and 5th-order PLP analyses.
The LP analysis result confirms Kuhn (1975). The fricative sentence has only one resonance mode within the 5- kHz analysis band, seen on the LP peak trajectory of the fricative sentence. It is the resonance frequency of the cavity in front of the constriction. The resonance frequency of the front cavity seems to alternate its affiliation with the second and third formants of the voiced sentence.
The 5th-order PLP analysis does not approximate the higher formants directly but extracts their weighted combi- nation, the effective second formant FT. The PLP results
LPI4
•' FORMANTS '• I •I•RON•'•VI'I'Y t•?ON'A.N•I• [• •-- -•u•J .• • •.•,.. •.•.'•,•:;•.• .•.•,'•,•
•- o • '- -. m•""' '"•' •'•', •"• •z PLP5
'1 m m• EFFE•IVE FORMANT
TIME
FIG. 14. P•k traj•tofi• of the s•ndard 14th-order LP m•el and the 5th- order PLP m•el of voi•d and f•cative pr•uctions of the s•ten• "•crc were you a y•r ago?" The LP analysis ind•cat• that the single rc8on•ce m•c of the ffi•ti•e 8cn•n• •m8 [o •tc•ate its a•]iation
with the fo•ants of the voi• senten• (Kuhn, ] 975 ). PLP •aiys• •ti- mat• the s•ngle •onancc o• the ffi•tiVc sentence arid the eff•tivc fo•ant F2' of the •oiced sentence and yields similar •csults te•c•.
support Fant (1970) in his conjecture about F2' coinciding with the resonance frequency of the front cavity.
C. Discussion
The main point of this section is that for two utterances with different spectra but with the same linguistic message, LP analysis gives two quite different results, while PLP anal- ysis gives similar results. Thus, to the extent to which PLP analysis simulates the properties of human speech percep- tion, our results support the notion of auditory-level norma- lization of spectral differences.
The results presented in this section would also be con- sistent with the hypothesis illustrated in Fig. 15. According to this hypothesis, the speaker-independent linguistic mes- sage is coded in the length and shape of the front cavity of the vocal tract. Message-induced changes in the back cavity would then be speaker dependent. Consequently, the for- mants of speech (which depend on the length and shape of the whole vocal tract) would carry both the linguistic mes- sage and the speaker-dependent information. Human speech perception would enhance the message-dependent front-
Message
Vocal - Tract • Effective Formant Front - Cavity .• F•'
Vocal Tract : • ,• .• Formants FIG. 15. Hypothesis about the role ofF2' and front cavity in speech com- munication process.
1748 J. Acoust. Soc. Am., Vol. 87, No. 4, April 1990 Hynek Hermansky: Perceptual linear predictive analysis 1748
cavity contributions by extracting the front-cavity-affiliated effective second formant FT. This possibility is supported by works ofKuhn ( 1975, 1978) and is the topic of some current research (Hermansky and Broad, 1989; Broad and Her- mansky, 1989).
Vl. PLP IN SPEAKER-INDEPENDENT ASR
The topic of the preceding section was how similar is the auditorylike representation of utterances with different acoustic qualities but with the identical linguistic message. The question remains whether the auditorylike PLP speech representation is different enough for the utterances with different linguistic messages. Though this question was to some extent addressed in Sees. II-IV, the speaker-indepen- dent ASR experiments described in this section further ad- vance this issue.
Current speaker-independent ASR techniques typically handle speaker-to-speaker variations by extensive multi- speaker training. A technique that would suppress speaker- dependent information, and would thus allow for reducing the amount of training, is needed. If, as indicated in the pre- ceding sections, PLP could represent the linguistic informa- tion in speech better than does the conventional LP tech- nique, it might be used with advantage in speaker-independent ASR.
A. Recognition experiment
To evaluate PLP in speaker-independent ASR, we used a multitemplate, dynamic-time-warping-based recognizer for isolated-digit ASR. The 11 digits (0-9 and the word "oh"), produced once by each of 48 male and 48 female speakers, formed the experimental database. Two front-end modules were used for comparison in the ASR experiments: ( 1 ) a 5th-order PLP analysis with the group-delay metric, and (2) a 14th-order autocorrelation LP analysis with the eepstral metric. Both front ends used a 20-ms Hamming window and a 10-ms frame advance. Preemphasis by a first- order 0.98 difference was used with the LP analysis. The word boundaries were hand corrected. Half of the database
was used in training; the other half was used in test. No template clustering was used and the recognition was based on the nearest neighbor template. The number of templates per word varied between 2 and 23. In each experiment, 96 different template combinations were used. The examined template combinations were chosen at random. Thus the averaged ASR accuracy is based on more than 77 000 com- parisons per test.
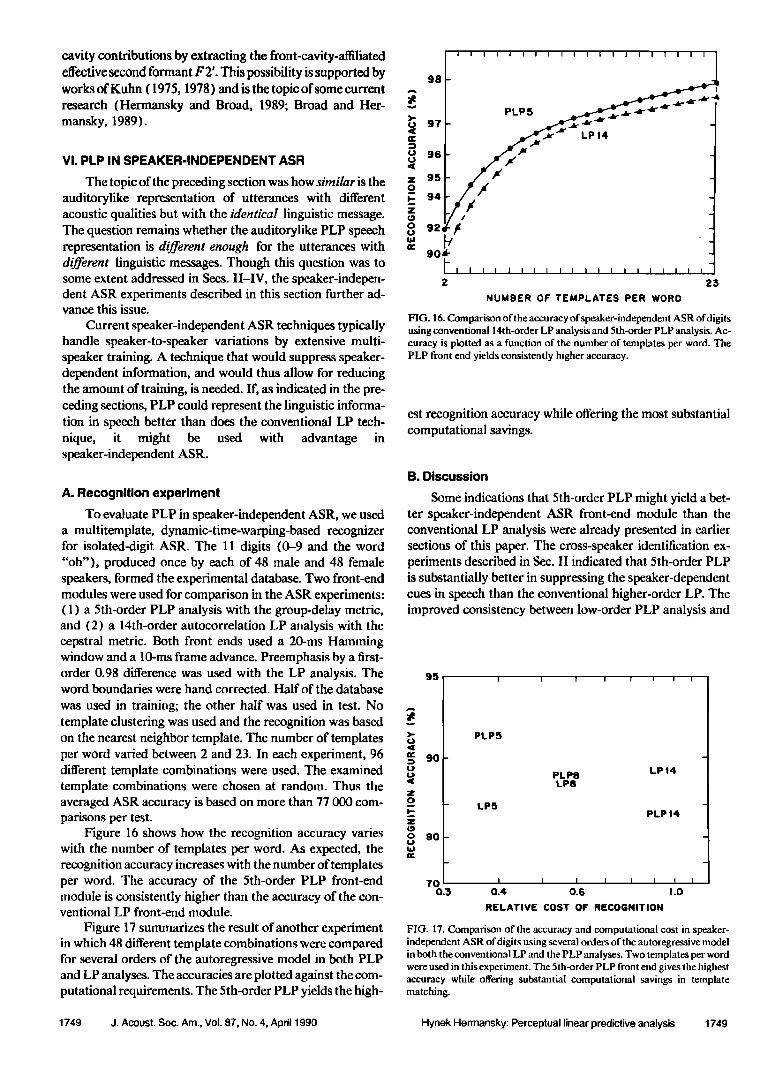
Figure 16 shows how the recognition accuracy varies with the number of templates per word. As expected, the recognition accuracy increases with the number of templates per word. The accuracy of the 5th-order PLP front-end module is consistently higher than the accuracy of the con- ventional LP front-end module.
Figure 17 summarizes the result of another experiment in which 48 different template combinations were compared for several orders of the autoregressive model in both PLP and LP analyses. The accuracies are plotted against the com- putational requirements. The 5th-order PLP yields the high-
96 ' ' ' • ,•, I
• PLP5
o 96 "•"
z 95' o
•- 94 z
•o 92
90
- I I I I I I I I I I J I | I I I I I I I
NUMBER OF TEMPLATES PER WORO
FIG. 16. Comparison of the accuracy of speaker-independent ASR of digits using conventional 14th-order LP analysis and 5th-order PLP analysis. Ac- curacy is plotted as a function of the number of templates per word. The PLP front end yields consistently higher accuracy.
est recognition accuracy while offering the most substantial computational savings.
B. Discussion
Some indications that 5th-order PLP might yield a bet- ter speaker-independent ASR front-end module than the conventional LP analysis were already presented in earlier sections of this paper. The cross-speaker identification ex- periments described in Sec. II indicated that 5th-order PLP is substantially better in suppressing the speaker-dependent cues in speech than the conventional higher-order LP. The improved consistency between low-order PLP analysis and
95
9O
80
PLP5
LP5
PLP8 LP8
LPI4
PLPI4
70 I I I I I • • I 0.:• 0.4 0.6 1.0
RELATIVE COST OF RECOGNITION
FIO. 17. Comparison of the accuracy and computational cost in speaker- independent ASR of digits using several orders of the autoregressive model in both the conventional LP and the PLP analyses. Two templates per word were used in this experiment. The 5th-order PLP front end gives the highest accuracy while offering substantial computational savings in template matching.
1749 J. Acoust. Soc. Am., VoL 87, No. 4, April 1990 Hynek Hermansky: Perceptual linear predictive analysis 1749
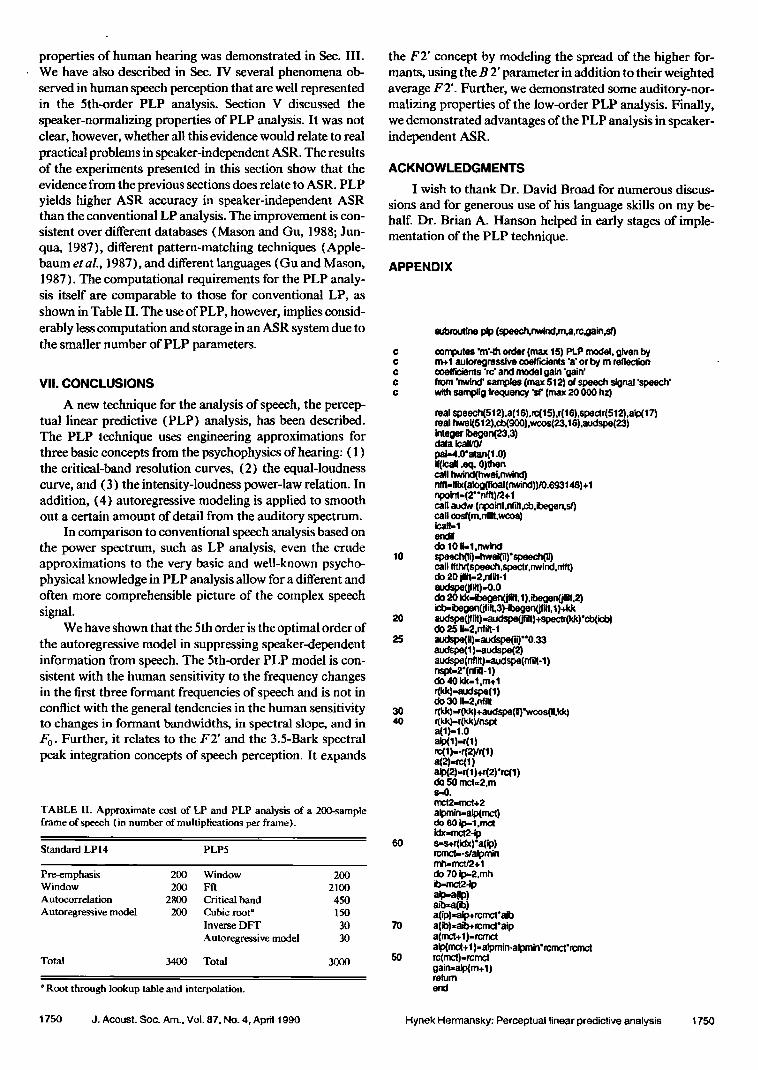
properties of human hearing was demonstrated in Sec. Ill. We have also described in Sec. IV several phenomena ob- served in human speech perception that are well represented in the 5th-order PLP analysis. Section V discussed the speaker-normalizing properties of PLP analysis. It was not clear, however, whether all this evidence would relate to real practical problems in speaker-independent ASR. The results of the experiments presented in this section show that the evidence from the previous sections does relate to ASR. PLP yields higher ASR accuracy in speaker-independent ASR than the conventional LP analysis. The improvement is con- sistent over different databases (Mason and Gu, 1988; Jun- qua, 1987), different pattern-matching techniques (Apple- baum et al., 1987), and different languages (Gu and Mason, 1987). The computational requirements for the PLP analy- sis itself are comparable to those for conventional LP, as shown in Table II. The use of PLP, however, implies consid- erably less computation and storage in an ASR system due to the smaller number of PLP parameters.
VII. CONCLUSIONS
A new technique for the analysis of speech, the percep- tual linear predictive (PLP) analysis, has been described. The PLP technique uses engineering approximations for three basic concepts from the psychophysics of hearing: ( 1 ) the critical-band resolution curves, (2) the equal-loudness curve, and (3) the intensity-loudness power-law relation. In addition, (4) autoregressive modeling is applied to smooth out a certain amount of detail from the auditory spectrum.
In comparison to conventional speech analysis based on the power spectrum, such as LP analysis, even the crude approximations to the very basic and well-known psycho- physical knowledge in PLP analysis allow for a different and often more comprehensible picture of the complex speech signal.
We have shown that the 5th order is the optimal order of the autoregressive model in suppressing speaker-dependent information from speech. The 5th-order PLP model is con- sistent with the human sensitivity to the frequency changes in the first three formant frequencies of speech and is not in conflict with the general tendencies in the human sensitivity to changes in formant bandwidths, in spectral slope, and in F 0. Further, it relates to the F2' and the 3.5-Bark spectral peak integration concepts of speech perception. It expands
TABLE II. Approximate cost of LP and PLP analysis of a 200-sample frame of speech (in number of multiplications per frame).
Standard LP 14 PLP5
Pre-emphasis 200 Window 200 Window 200 Fft 2100 Autocorrelation 2800 Critical band 450
Autoregressive model 200 Cubic root" 150 Inverse DFT 30
Autoregressive model 30
Total 3400 Total 3000
Root through lookup table and interpolation.
the F2' concept by modeling the spread of the higher for- mants, using the B 2' parameter in addition to their weighted average FT. Further, we demonstrated some auditory-nor- malizing properties of the low-order PLP analysis. Finally, we demonstrated advantages of the PLP analysis in speaker- independent ASR.
ACKNOWLEDGMENTS
I wish to thank Dr. David Broad for numerous discus-
sions and for generous use of his language skills on my be- half. Dr. Brian A. Hanson helped in early stages of imple- mentation of the PLP technique.
APPENDIX
c
c
c
c
c
lO
30 4o
•orr•tes 'm'4h on• {max 15) PLP model. given by m+l autoregressive coeffic. Mnts 'a' or by rn reflection coefficients 'rc' and moael gain 'gain' from 'r•vlnd' samp•s (max 512) of speech signal 'speech' with samplig frequency 'st' (max 20 000 hz)
real soeech(512).a(l$).rc(15).r(16).spectr(512).alp(t 7) real hwei(512).(::b(900).wcos(23.1 $),audspo(23) inleger ibegan(23.3) clala Icall/O/ p•-4.o'•tanO.o) If(Ica, .eq. o)then call hwind(hwei,nwind) nfft. lfix(alog(fioat(nvvind))/0.693 • 48)+1 nf•int-(2"nfft)/2,l c•ll auc•v (n•oint.ntilt.cb.ibegen.sO call cosf(m.nt It.woos)
endi do 10 #-l.nwind speech(,•-hwe'(,,)* speech(•) call ffthr(speech.spect r.nwind.nfft) clo 20 jf'lt-2.ntilt-I au•sPe(ifdt)-O.O
icb-k)egen(jfilt.3)-Ibeoen(jrdt. 1)+kk audspe(jf,,)-audspe(if,t)+spectr(•)'cb(k:b) do 2511..2.nfilt-1 auds•,)-auds•(ir}"0.33 audspe(l)-audspe(2) audspe(nf,•t)-audspe(nfilt4 ) nspt-2'(nf n-l) do 40 kk-l.m+l r(kk)-auds•(1) do 3011-2.ntill
a(0-1.0 akXl)-rO) rcO)--r(2yrO) a(2)-rcO) alp(2)-r(1)+r(2)ørc(1) do 50 mct=2.rn •,0. n'Ct2-fTtnt+2
alOmin-a•mct)
Idx-mct2-1p S=s.r(k:lx)'a(ip) rcmct..-s/alpmin rrtt-mct/2+l
do 70 ip..2.mh i•mct2-ip aip-a('p) aib--a(ib) a(ip)=aip+mmct'a'b a(ib)==,'b+rcmd'aip a(rnct+l)-rcmct alp(mct+1 )- alpmin.afpminørcmct-rcmct rc(mct).rcmct gain=alp(m+1) rerum end
1750 d. Acoust. Sec. Am., VoL 87, No. 4, April 1090 Hynek Hermansky: Perceptual linear predictive analysis 1750
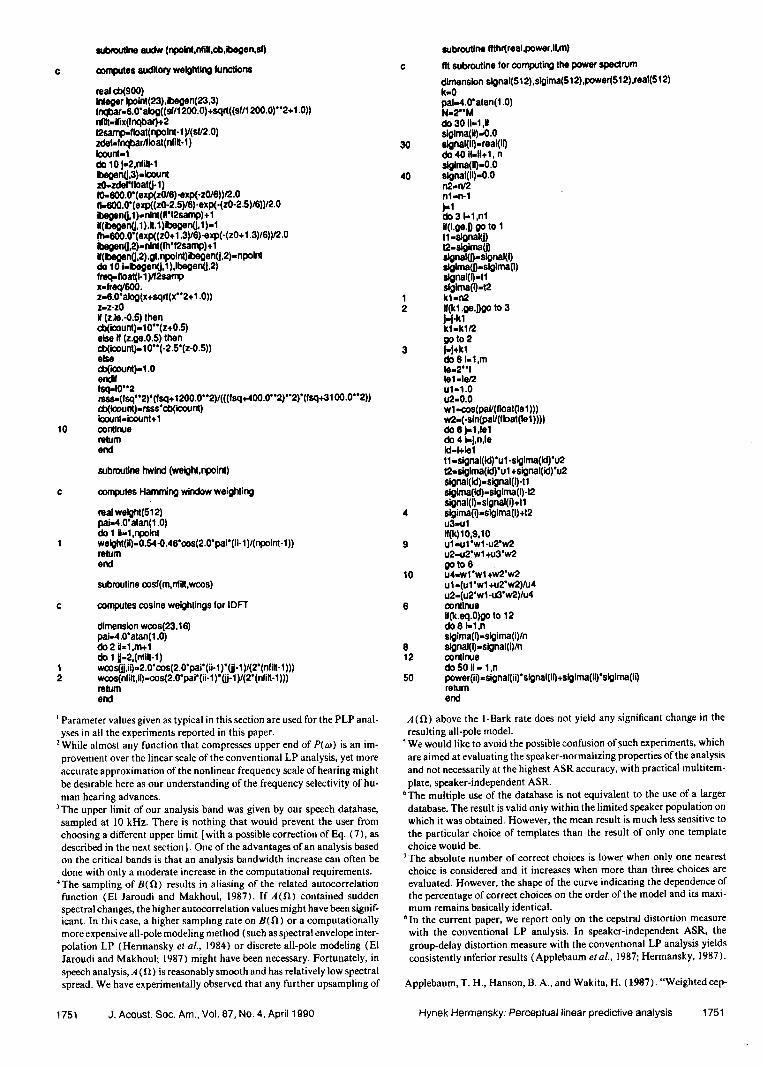
eubm•rm 8uclw (npoint,nfill,cb,ic)egen,d)
corepute$ auditory weighting functions
real d:)(900) Inleger Ipolnt(23) ,Ibege n(23,3) fncg)ar.$.0' aiog((sf/1200.0) +sqrt((sf/1200.0)"2+1.0)) rd'dt.ifix(fnqbar)+2 f2samp-float(npoin•-l¾(sf/2.0) zde•.fnc•rmoat(n•,-1) Icount-I
do l0 j.2,nfin-1 B:N,0en(j.3)-icoun• z0.zdol'float(}-l) K)-600.0ø(exp(z016)-exp(-z0/6))/2.0 fi-600.0'(exp((zO-2.5)16)-exp(-(z0-2.Sy6})12.0 i:)egen(],1).nin((fiø12samp) + 1 #(B)e0en(J.1).K.l)B)e0en(J.1)-I Ih-600.0'{exp((z0+1.3)16)-exp(-(z0+ 1.3)/6}y2.0 B)egen(] ?)-hint(lb' f2samp) + 1 il(13•en(j,2) .gl.npolnt) ibegen(J,2) - npolnt do 10 i.ic)egen(j,1),l10egen(J,2) freq. fioat(I-1 yf2samp x.freq/600. z.6.0'ak)g{x+sq•t(xøø2+ 1.0)) z.z-z0 # (zJe.-0.5) then cb(imunt), 10"(z+0.5) else # (z.ge.0.5) then cb(icount)- • 0"(-2.5'(z-0.5))
cl•k=ount)-1.0
mss,(Isqoo2)o(fsq+1200.0oo2)/(((Isq.,-400.0ø'2)"2)ø(Isq+3100.0"2)) clefcount). rsssøcb(k:•unt) I=ount.lcount+l
10 conUnue rerum
subroutine hwind (weloht,npoint)
c computes Hamming window weighting
real weight(512) pa•4.0'atan(1.0)
1 weioht(i•-0.S4-0.46'cos(2.0'pai'(ii- 1)l(npoint-1)) relum end
s•brouline oosf(m,nfilt,wcos)
C computes cosine wel0htings for IDFT
dimension wcos(23,• 6) pai-4.0'atan(1.0) do 2 ii=l,rn+l do I Ij-2,(nfm-1)
I wcos(jj,ii) -2.0'cos(2.0'pal'(ii- l)ø(jj- 1)l(2ø(nfilt- 1))) 2 wcos(nfilt,i•-cos(2.0'pai'(ii- 1)ø(jj- 1)l(2ø(nfilt-1)))
rerum end
Parameter values given as typical in this section arc used f`or the PLP anal- yses in all the experiments rcporred in this paper.
2While almost any œunction that compresses upper end oœ P(•)) is an im- provement over the ]incar scale oœ the conventional LP analysis, yet more accuratc approximation oœthc nonlinear œrcquency scale oœhcaring might bc (•csirahlc hcrc as our understanding oœ the frequency selectivity oœ hu- man hea•ng advances.
•The upper ]imi! of. our •Lnaiysis band was given •)y our speech clat,'Lbase, sampled at ]0 kHz. There is nothing that would prevent thc user t¾om choosing a ditTcrent upper •Jmit [with a possible corrccLion of` Eq. (7), as dcscd. bcd in the next section }. Onc oœ the advantages of an anaLlysis based on the critical bands is Lhat an analysis bandwidth increase can oœtcn b• done with only a modetaLc increase in the computational requirements. The sampling of •(•.) results in aliasing oœ the related autocon'clarion f`unc•ion (El .Taroudi and Makhoul, ]9•7). If •4(•.) contained sudden s•ctral changes, the higher autocorrelation values might have been s•gnif- icant. In this case, a higher sampling rate on •9(•.) or a computationally more expensive all-pole modeling method (such as spectra] envelope inter- polation L? (Hcn•lansky • a./., ]984) or discrete all-pole modeling (FI Ja•oudi and Ma•houl; 1987) might h•LVe been ncccssa•. Fortunatciy, in sp,•ch analysis, .,4 (•) •.s reasonably smooth and has relatively low spectra] spread. Wc have cxpe•mentally observcd that any further upsamplJnõ oœ
cubroutine ffthl•real,power,ll,m)
c fit subroutine for computing the Powe• spec(rum
dimension $1gnal(512),slgirna(S12),power(512),real($12) Re0 pal.4.0'alan(1.0)
do 30 I1-1,11 slglma(11)-0.0
30 eigrml(ll).real(il) do 40 il.ll+l, n S{glma(il)-O.O
40 slgnal(il)-O.O n2.rV2 nl.n-1
do 3 I-1 ,nl #(Lge.l) go to 1 t1-slOnal(j) t2.•glma(j) Ilgnal(I).slgnal(I)
•gna(•).t• slglma(I).t2
1 kl -n2
2 II(kl .ge.J)go to 3
kl.kl/2
goto2 3 •-j+kl
do 6 I,.1,m le-2"l lel .le/2 u1-1.0 u2.0.0 wl-cOs(pal/(float(lel))) w2.(-sinLoa•/(•k•at(•e I )))) do 6 J-l,lel do 4 I.[,n,le Id-I+lel
tl-signal(Id)*ul-sigima(id)*u2 t2-siglma(ia')'ul +signal(id)'u2 slgnal(Id). signal(i)-tl slglma(k:l) -slglma(I)-t2 signal(•.slgnal(i)+tl
4 sigirna(• .siglma(I) +t2 u3-ul •(k)•0,9J0
9 ul -u l*wl-u2'w2 u2-u2•wl+u3'w2 goto 6
10 u4-wl'wl +w2*w2 ul -(ul'wl +u2øw2)/u4 u2-(u2*wl-u3'w2)/u4
6 continue It(k.eq.0)go to 12 do 8 I..1,n slgima(•-slgima(i)/n
8 signal(I). signal(i)/n 12 continue
do 50 II - 1 ,n 50 power(it)= signal(it)' signal(i• +sigirna(ii)'sigirna(l•
rerum
end
•(•) above the t-Bark rate does not yicld any significant chan•e in the rcsu]ting all-polc mode].
• We would likc to avoid the possible confusion of•uch cxpe•ments, which are aimed at evaluating the speaker-normalizing properties oœthc analysis and not necessarily at the hiõbest ^$R accuracy, with practical multitem- plate, speaker-independent ASR.
OThe multiple use of the database is not ½quJvalcnt to the use of' database. The result is v=lid only within the limited speaker population on which it was obtained. However, the mcan result is much lcss sensitive to the particular choice of' templates than the result of' only one template choice would be.
?The absolute number of' correct choices is lower when only one nearest choicc is considered and it increases when more than three choices arc evaluated. [-lowever, the shape oœ the curve indicatin• the dependeric= the percentage of' correct choices on thc order of' the model and i•s maxi- mum remains basically identical.
e [n the current paper, wc report only on the cepstral distortion measure with the conventional L,P =na)ysJs. ]n speaker-independent ^$R, •roup-delay distortion measure with the conventional L,? analysis yields consistently inf'c•or results (^pplcbaum eta/., 1957; Hermansky, ] 957).
Applebaum, T. H., Hanson, B. ̂ ., and Wakita, H. (].987). "Weighted cep-
1751 J. Acoust. Soc. Am., Vol. 87, No. 4, April 1990 Hynek Hermansky: Perceptual linear predictive analysis 1751
stral distance measures in vector quantization based speech recognizers," in Proceedings of the IEEE International Conference on •4coustics, Speech, and Signal Processing 87, Paper 27.9, pp. 1155- I 158.
Bladon, A. (1983). "Two-formant models of vowel perception: shortcom- ings and enhancements," Speech Commun. 2, 305-313.
Bladon, A., and Fant, G., (1978). "A two-formant model and the cardinal
vowels," STL-QPRS 1, 1-8, Royal Institute of Technology, Stockholm. Bladon, A., and Ladefoyer, P. (1982). "A further test of a two-formant
model," J. Aeonst. Soc. Am. Suppl. 1 71, S104. Bladon, A., and Lindbiota, B. (1981}. "Modeling the judgment of vowel
quality differences," J. Acoust. Soc. Am. 69, 1414-1422. Bridle, J. S., and Brown, M.D. (1974). "An experimental automatic word
recognition system," JSRU Report No. 1003, Joint Speech Research Unit, Ruislip, England.
Broad, D. J., and Hermansky, H. (1989). The front-cavity/F2' hypothesis tested by data on tongue movements," J. Acoust. Soc. Am. Suppl. I 86, S13-S14.
Carlson, R., Oranstrom, B., and Fant, (}. (1970). "Some studies concern- ing perception of isolated vowels," STL-QPRS 2-3, 19-35, Royal Insti- tute of Technology, Stockholm.
Carlson, R., Fant, 13., and (}ranstrom, B. (197S). "Two-formant models, pitch and vowel perception," in Auditory Analysis and Perception of Speech, edited by 13. S. Fant and M. A. A. Tatham (Academic, New York), pp. 55-82.
Carlson, R., 13ranstrom, B., and Klatt, D. { 1979). "Vowel perception: the relative perceptual salience of selected acoustic manipulations," STL- QPSR 3-4, 73-83, Royal Institute of Technology, Stockholm.
Chiba, T., and Kajiyama, M. (1941). The Vowel: Its Nature and Structure (Tokyo Kaiseikan, Tokyo).
Chistovich, L. A., Sheikin, R. L., and Lublinskaja, V. V. (1978}." 'Centers of gravity' and spectral peaks as the determinants of vowel quality," in Frontiers of Speech Communication Research, edited by B. Linblom and S. Ohman (Academic, New York), pp. 143-157.
Chistovich, L. A. (1985). "Central auditory processing of peripheral vowel spectra," J. Acoust. Soc. Am. 77, 789-805.
Delattre, P., Liberman, A.M., Cooper, F. S., and Gerstman, L. J. (1952). "An experimental study of the acoustic determinants of vowel color," Word 8, 195-210.
El Jaroudi, A., and Makhoul, J. (1987}. "Discrete all-pole modeling," in Proceedings of the IEEE International Conference on ,4coustics, Speech, and Signal Processing 87. pp. 320-323.
Fant, G., and Risherg, A. (1962). "Auditory matching of vowels with two formant synthetic sounds," STL-QPRS 4, 7-11, Royal Institute of Tech- nology, Stockholm.
Fant, G. (1970). ,4coustic Theory of Speech Production (Mouton, The Hague), 2nd printing, p. 123.
Fant, G. (1972). "Vocal tract wall effects, losses and resonance band- widths," STL-QPRS 2-3, 28-52, Royal Institute of Technology, Stock- holm.
Flanagan, J. (1955). "Difference limen for vowel formant frequency," J. Acoust. Soc. Am. 27, 613-617.
Flanagan, J. (1957). "Estimates of maximum precision necessary in quan- tizing certain dimensions of vowel sounds," J. Acoust. Soc. Am. 29, 533- 534.
Fletcher, H. {1940). "Auditory patterns," Rev. Mod. Phys. 12, 47-65. Fujimura, O. (1967). "On the second spectral peak of front vowels: a per-
ceptual study of the role of the second and third formants," Lang. Speech, 10, 181-193.
Fujisaki, H., and Sato, Y. (1973). "Comparison of errors in formant fre- quencies obtained by various methods of formant extraction," Trans. Comm. Speech Res., Acoust. Soc. Japan, December 1973 (in Japanese).
Gu, Y., and Mason, J. S. D. (1987). "Vocal tract and auditory feature anal- ysis using Chinese utterance in ASR system," in Proceedings oflnterna- tional Conference on Chinese Information Processing, Beijung, China.
Hermansky, H. (1982). "Improved linear predictive analysis of speech based on spectral processing," Ph.D. dissertation, University of Tokyo.
Hermansky, H., Fujisaki, H., and Sato, Y. (1984}. "Spectral envelope sam- pling and interpolation in linear predictive analysis of speech" in Proceed- ings of the IEEE International Conference on ,4coustics; Speech, and Sig- nal Processing 84, pp. 221-224.
Hermansky, H., Hanson, B. A., and Wakita, H. (1985). "Low-dimensional representation of vowels based on all-pole modeling in the psychophys- ical domain," Speech Commun. 4, (1-3), 181-187.
Hermansky, H. (1987a). "An efficient speaker-independent automatic speech recognition by simulation of some properties of human auditory
perception," in Proceedings of the IEEE International Conference on ,4coustics; Speech, and Signal Processing 87, pp. 1159-1162.
Hermansky, H. (1987b). "Why is the formant frequency DL curve asym- metric?, "J. Acoust. Soc. Am. Suppl. 1 81, S 18; full text in STL Research Reports No. 1, Santa Barbara, 1987.
Hermansky, H., and Junqua, J. C. (1988}. "Optimization of perceptually based ASR front-end," in Proceedings of the IEEE International Confer- ence on Acoustics; Speech, and Signs!Processing 8& Paper S5.10, pp. 219- 222.
Hermansky, H., and Broad, D. J. (1989). "The effective second formant F2' and the vocal tract front cavity," in Proceedings of the lEEE lnterna- tional Conference on ,4coustics; Speech, and Signal Processing 89, Paper S10a.4, pp. 480-483.
Hirsharc, T. (1988). "On the role of fundamental frequency in vowel per- ception," J. Acoust. Soc. Am. Suppl. I 84, S156.
Itahashi, S., and Yokoyama, S. (1976). "Automatic formant extraction uti- lizing reel scale and equal loudness contour," in Proceedings of the IEEE International Conference on Acoustics; Speech, and Signal Processing 76• Paper 9.2, pp. 310-313.
Junqua, $. C. (1987). "Evaluation of ASR front-ends in speaker dependent and speaker independent recognition," J. Acoust. Soc. Am. Suppl. I 81, S93; Full text in STL Research Reports No. 1, Santa Barbara, 1987.
Karore, C., and Kahn, D. (1985}. "Relationship between LP residual spec- tral distances and phonetic judgement," J. Acoust. Soc. Am. Suppl. 1 78, S82.
Kuhn, 13. M. (1975). "On the front cavity resonance and its possible role in speech perception," J. Aconst. Soc. Am. 58, 428-433.
Kuhn, G. M. (I978). "Stop consonant place perception with single-for- mant stimuli: Evidence for the role of the front-cavity resonance.", I. Aconst. Soc. Am. 65, 774-788.
Klatt, D. (1982). "Prediction of perceived phonetic distance from critical- band spectra: a first step," in Proceedings of the IEEE International Con- ference on ,•eaustics; Speech, and Signal Processing 82, pp. 1278-1281.
Makhoul, I. (1975). "Spectral linear prediction: properties and applica- tions," IEEE Trans. ASSP-23, 283-296.
Makhoui, J., and Cosell, L. (1976). "LPCW: An LPC vocoder with linear predictive spectral warping," in Proceedings of the IEEE International Conference on/lcoustics; Speech, and Signal Processing 7• pp. 466-469, Philadelphia.
Mason, J. S., and (}u, Y. (1988). "Perceptually-based features in ASR," in Proceedings of lEEE Colloquium on Speech Processing, London.
Mermelstein, P. (1976). "Distance measures for speech recognition, psy- chological and instrumental," in Pattern Recognition and ,4rti. ficia! Intel- ligence, edited by C. H. Chen (Academic, New York}, pp. 374-388.
Paliwal, K. K., Lindsay, D., and Ainsworth, W. A. (1983). "A study of two-formanl models for vowel identification," Speech Commun. 2 (4}, 295-303.
Robinson, D. W., and Dadson, R. S. {1956). "A redetermination of the equal-loudness relations for pure tones," Br. J. Appl. Phys. 7, 166-181.
Rosenberg, A. (1970). "Effect ofglottal pulse shape on the quality of natu- ral vowels," J. Acoust. Soc. Am. 49, 583-590.
Schroeder, M. R. (1977). Recognition of Complex ,4coustic Signal& Life Sciences Research Report 5, edited by T. H. Bullock (Abakon Verlag, Berlin), p. 324.
Shamma, S. A. (1988). "The acoustic features of speech phoneroes in a model of auditory processing: Vowels and unvoiced frieatives," J. Phon. 16, 79-91.
Stevens, S.S. (1957). "On the psychophysieal law," Psychol. Rev. 64, 153- 181.
Strube, H. W. ( 1980 }. "Linear prediction on a warped frequency scale," J. Acoust. Soc. Am. 68, 1071-1076.
¾ishwanathan, R., and Makhoul, J. (1975). "Quantization properties of transmission parameters in linear predictive systems," IEEE Trans. ASSP-26, 587-596.
Yegnanarayana, B. (1977). "Formant extraction from linear prediction phase spectra," J. Acoust. Soc. Am. 63, 1638-1640.
Yegnanarayana, B., and Reddy, R. (1979). "A distance measure derived from the first derivative of the linear prediction phase spectra," in Pro- ceedings of the IEEE International Conference on Acoustics, Speech, and Signal Processing 79, pp. 744-747.
Zwicker, E. (1970). "Masking and psychological excitation as conse- quences of cat's frequency analysis," in Frequency Analysis and Periodic- ity Detection in Hearing, edited by R. Plomp and G. F. Smoorenburg (Sijthoff, Leyden, The Netherlands ).
1752 J. Acoust. Soc. Am., Vol. 87, No. 4, April 1990 Hynek Hermansky: Perceptual linear predictive analysis 1752