percolation study of nano-composite conductivity using
TRANSCRIPT

University of Central Florida University of Central Florida
STARS STARS
Electronic Theses and Dissertations, 2004-2019
2009
Percolation Study Of Nano-composite Conductivity Using Monte Percolation Study Of Nano-composite Conductivity Using Monte
Carlo Simulationpercolation Carlo Simulationpercolation
Jing Bai University of Central Florida
Part of the Mechanical Engineering Commons
Find similar works at: https://stars.library.ucf.edu/etd
University of Central Florida Libraries http://library.ucf.edu
This Masters Thesis (Open Access) is brought to you for free and open access by STARS. It has been accepted for
inclusion in Electronic Theses and Dissertations, 2004-2019 by an authorized administrator of STARS. For more
information, please contact [email protected].
STARS Citation STARS Citation Bai, Jing, "Percolation Study Of Nano-composite Conductivity Using Monte Carlo Simulationpercolation" (2009). Electronic Theses and Dissertations, 2004-2019. 4099. https://stars.library.ucf.edu/etd/4099

PERCOLATION STUDY OF NANO-COMPOSITE CONDUCTIVITY USING MONTE CARLO SIMULATION
by
JING BAI B.S. Jiang Nan University, 2007
A thesis submitted in partial fulfillment of the requirements for the degree of Master of Science
in the Department of Mechanical, Materials and Aerospace Engineering in the College of Engineering and Computer Science
at the University of Central Florida Orlando, Florida
Spring Term 2009
Major Professor: Kuo-Chi Lin

© 2009 Jing Bai
ii
ABSTRACT
A Monte Carlo model is developed for predicting electrical conductivity of carbon nanofiber
composite materials. The conductive nanofibers are models as both 2D and 3D network of finite
sites that are randomly distributed. The percolation behavior of the network is studied using the
Monte Carlo method, which leads to the determination of the percolation threshold. The effect of
the nanofiber aspect ratio on the critical nanofiber volume rate is investigated in the current
model, each of the nanofibers needs five independent geometrical parameters (i.e., three
coordinates in space and two orientation angles) for its identification. There are three controlling
parameters for each nanofiber, which includes the nanofiber length, the nanofiber diameter, and
the nanofiber aspect ratio. The simulation results reveal a relationship between the fiber aspect
ratio and the percolation threshold: the higher the aspect ratio, the lower the threshold. With the
simulation results obtained from the Monte Carlo model, the effective electrical conductivity of
the composite is then determined by assuming the conductivity is proportional to the ratio of the
number of nanofibers forming the largest cluster to the total number of nanofibers. The
numerical results indicate that as the volume rate reaches a critical value, the conductivity starts
to rise sharply. These obtained simulation results agree fairly with experimental and numerical
data published earlier by others. In addition, we investigate the convergence of the current
percolation model. We also find the tunneling effect does not affect the critical volume rate
greatly. We propose that the percolation model is not scalable as well.
iii

ACKNOWLEDGEMENTS
I would like to thank Dr. Kuo-Chi Lin, chair of thesis committee, for his excellent guidance
throughout this research. I would like to express my gratitude and deepest thanks to Dr. Li nan
An and Dr. Jian Gou, members of the thesis committee, for their support, guidance and
encouragement throughout this process.
My love and respect to my parents, for their sacrifices and dedication in making me a person I
want to be in my life. I would also like to thank my friends who were always encouraging me
and help me in completing this work in many ways. Thanks to all others who were a big support
during this thesis.
iv

TABLE OF CONTENTS LIST OF FIGURES ...................................................................................................................... vii
LIST OF TABLES ......................................................................................................................... ix
CHAPTER 1 INTRODUCTION AND OBJECTIVE ................................................................... 1
1.1 Introduction ........................................................................................................................... 1
1.2 Research Objectives .............................................................................................................. 6
CHAPTER 2 PERCOLATION CONCEPTS AND APPROACHES ............................................ 8
2.1 Background ........................................................................................................................... 8
2.2 Site percolation and bond percolation ................................................................................... 8
2.3 Effective Medium Theory ................................................................................................... 10
2.4 Excluded Volume Method .................................................................................................. 13
CHAPTER 3 NUMERICAL MODEL ......................................................................................... 18
3.1 Model generation ................................................................................................................ 18
3.2 Connection criterion ............................................................................................................ 19
3.3 Calculate the shortest distance between two fibers in space ............................................... 23
3.4 Computational implementation ........................................................................................... 25
CHAPTER 4 RESULTS AND DISCUSSION ............................................................................. 27
4.1 Simulation Results .............................................................................................................. 27
4.2 Convergence ....................................................................................................................... 32
4.3 Fiber aspect ratio effect ....................................................................................................... 37
4.4 Electrical conductivity ........................................................................................................ 41
4.5 Density distribution with various aspect ratios ................................................................... 44
4.6 Tunneling Effect ................................................................................................................. 47
v

4.7 Non-scalability of the percolation model ............................................................................ 49
CHAPTER 5 ................................................................................................................................. 54
CONCLUSIONS AND FUTURE WORK ................................................................................... 54
5.1 Conclusions ......................................................................................................................... 54
5.2 Future Work ........................................................................................................................ 55
APPENDIX: MONTE CARLO SIMULATION CODE .............................................................. 57
REFERENCES ............................................................................................................................. 84
vi

LIST OF FIGURES
Figure 1: Constructions used in calculating the voltage induced across one conductance, ,
surrounded by a uniform medium [51]. ........................................................................................ 11
0g
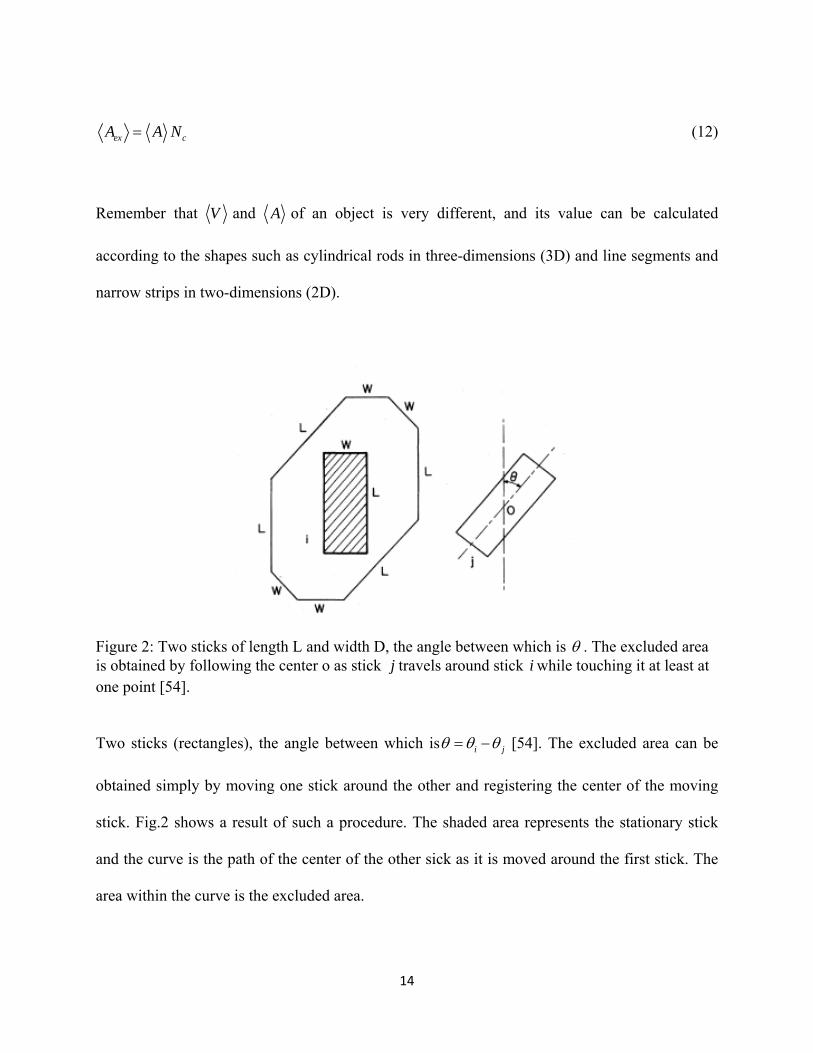
Figure 2: Two sticks of length L and width D, the angle between which is θ . The excluded area
is obtained by following the center o as stick j travels around stick i while touching it at least at
one point [54]. ............................................................................................................................... 14
Figure 3: .The sticks are capped rectangles. The length of the sticks is L , their width is D and
the radius of the cap is [54]. ................................................................................................. 16 / 2D
Figure 4: Diagram of the relationship between orientated fibers in different coordinate systems
[41]. ............................................................................................................................................... 22
Figure 5 : Diagram of determining bonding criterion of fibers with the identical orientation angle
[41]. ............................................................................................................................................... 22
Figure 6: Three patterns of fiber connection [63]. ........................................................................ 23
Figure 7: Two-dimension reduction of the shortest distance between two fibers ........................ 24
Figure 8: A set of nanofibers with 2.42% volume rate ................................................................. 28
Figure 9: A set of nanofibers with 2.87% volume rate ................................................................. 29
Figure 10: shows the result of the same set of nanofibers with the volume rate increased to 2.90%.
Percolation starts to happen. The largest cluster grows to about 72% of the total nanofibers .... 29
Figure 11: A set of nanofibers with 3.03% volume rate ............................................................... 30
Figure 12:A set of nanofibers with 3.63% volume rate ................................................................ 31
Figure 13: A set of nanofibers with 4.84% volume rate .............................................................. 31
Figure 14: Average critical volume rate VS number of runs when L/D=10, Te=0 ...................... 33
vii

Figure 15: Average critical volume rate VS number of runs when L/D=20, Te=0 ...................... 33
Figure 16: Average critical volume rate VS number of runs when L/D=50 and Te=0 ................ 34
Figure 17: critical volume rate VS number of runs when L/D=100 and Te=0 ............................. 35
Figure 18: Percolation percentage changes as the 1000 times independent runs ......................... 36
Figure 19: Comparison the percolation results under 200 and 1000 times run ............................ 37
Figure 20: Critical volume rate versus aspect ratio in 2D case ..................................................... 38
Figure 21: Aspect ratio vs critical value of fiber volume rate ...................................................... 39
Figure 22: Percolation percentage vs volume rate with the aspect ratio 10, 20, 50 and 100. ....... 40
Figure 23: Volume rate under the different aspect ratio at 100% percolation probability ........... 41
Figure 24: Conductivity vs volume rate in 2D case ...................................................................... 42
Figure 25: Nanofibers in the largest cluster/total nanofibers versus volume rate ......................... 43
Figure 26: Critical volume rates under 1000 random seeds ......................................................... 44
Figure 27: Histogram of the random data in 100 bins .................................................................. 45
Figure 28: Probability density estimate of the random data ......................................................... 46
Figure 29: Probability density distribution with various aspect ratios ......................................... 47
Figure 30: Tunneling effect to the critical volume rate ................................................................ 49
Figure 31: Percolation and lattice [64]. ......................................................................................... 50
Figure 32: Volume rates under different dimensions with L = 0.01, R = 0.0005, L/D = 10 ......... 51
Figure 33: Volume rates under different dimensions with L = 0.02, R = 0.0005, L/D = 20 ......... 52
Figure 34: Volume rates under different dimensions with L = 0.05, R = 0.0005, L/D = 50 ........ 53
viii

ix
LIST OF TABLES
Table 1: Aspect ratio vs critical value of fiber volume rate (3D) ................................................. 39
Table 2: Nanofibers in the largest cluster/total nanofibers versus volume rate ............................ 43
Table 3: Volume rates under different dimensions with L = 0.01, R = 0.0005, L/D = 10 ............ 50
Table 4: Volume rates under different dimensions with L = 0.02, R = 0.0005, L/D = 20 ............ 51
Table 5: Volume rates under different dimensions with L = 0.05, R = 0.0005, L/D = 50 ............ 52

CHAPTER 1
INTRODUCTION AND OBJECTIVE
1.1 Introduction
A variety of conductive particles or fibers have been added to polymer matrices to form
nanocomposites are finding important applications in aerospace and other industries. Carbon
nanotubes and carbon nanofibers have been an area of intense research and play a significant role
in current development of nanotechnology. They own unique characteristics and properties,
which includes low density, high surface area, good chemical stability, high electrical and
thermal conductivity, excellent mechanical properties and fire resistance. (Krishnan et al., 1998;
Yu et al., 2000; Sandler et al.,1999 ; Geng et al.,2002 ; Beguin et al., 2002 ; Subramony et al.,
1998 ; Kashiwagi et al., 2002; Kashiwagi et al., 2005). For example, as the volume fraction
increasing, there exists an insulator to conductor transition around a critical threshold ( Bigg,
1979). That is, there is a sharp increase of the electrical conductivity at a critical fiber volume
fraction. Polymer matrix composites reinforced by nickel nanostrands, which are pure nickel
filaments with nanometer diameters and high aspect ratios, are very promising nanocomposites
that can reduce lightning strike damage with minimum added weight (Hansen, 2005; Li et al,
2008).
1

Carbon nanotubes consist of graphitic cylinders with diameter of 1-100 nm and high aspect ratio
of a few micro lengths, leading to high Van der Waals force between adjacent tubes. The high
Van der Waals force and high aspect ratios with a combination of high flexibilities make these
nanotubes easily assemble into bundles or ropes. As a result, it becomes quite difficult to
disperse carbon nanotubes in polymer matrix. In addition, their manufacturing and purification
processes are still too complicated and expensive for mass production. All these factors limit
their application in manufacturing high performance carbon nanotubes/polymer composite (Hill
et al., 2005; Thess et al., 1996; Kokai et al., 1999).
Compared to carbon nanotubes, carbon nanofibers have recently gained considerable attention in
nanocomposite applications. Carbon nanofibers can be produced at lower cost by catalytic
chemical vapor deposition of carbon containing gases (Toebes et al., 2004; Ros et al., 2002;
Vieira et al., 2004; Dandekar et al., 1998; Durkic et al., 1997; Wang et al., 2003). They possess
less order and more edge sites on the outer wall (Kim and Lee, 2004; Werner et al., 2005), which
makes carbon nanofibers have better dispersion and wettability in polymer matrix. The higher
proportion of edge plane defects also may lead to more facile electron transfer (Salimin et al.,
2004; Banks and Compton, 2005). In fact, carbon nanofibers can be prepared having grapheme
sheets stacked either parallel (ribbon structure), perpendicular (platelet structure), or canted
(herring-bone structure) relative to their long axis (Rodriguez et al., 1995; Carneiro et al., 2003).
The exterior surface of carbon nanofibers possessing a herring-bone structure is composed of
highly reactive carbon or partially hydrogenated carbon edge-sites. This structural characteristic
provides a unique opportunity for covalent binding of linking molecules containing reactive
pendant functional groups to the surfaces of carbons nanofibers. The reaction of such surface-
2

bound pendant functional groups with polymers could make carbon nanofiber/polymer
nanocomposites exhibit exceptional carbon fiber-polymer wettability due to the presence of
covalent binding across the nanofiber-polymer interface (Zhong et al., 2004). Based on the as-
mentioned characteristics, an increasing number of carbon nanofiber/polymer nanocomposites
have been researched. (Thostenson and Chou, 2006; Yang et al., 2005; Lau et al., 2005; Shi et al.,
2007 ; Hirai et al., 2007 ; Cho and Bahadur, 2007 ; Hasan et al., 2007 ; Kobayashi and Kawai,
2007 ; Yang et al., 2007)
Percolation theory has been widely used to describe the effective conductivity of a composite
material (Kirkpatrick, 1973; Lebovka et al., 2006; Stauffer, 1979). Percolation theory, originally,
was to study the problem involving liquid passing through the porous materials and answer the
question that if the liquid can make it from hole to hole and reach the other side of the material.
It was later developed into a pure mathematical problem that describes the behavior of connected
clusters in a random graph. This model is perfect for our purpose that treats the nanofiber cluster
as the paths of electronics and study conductivity due to those paths.
In the “site percolation” and “bond percolation” model, the conductive fillers in a composite are
models as 2D and 3D, and they are randomly and regularly located in a composite system. In the
“bond percolation” model, a known fraction of bonds, distributed randomly, are missing from the
lattice and the current can not form between them. In the “site percolation” model, the absence of
a site means there is no current flow through any of the bonds which join the site to its neighbors.
So if the possibility of allowing the current to go through is p between each two neighboring
sites, then there is no connection between them with the possibility of1 p− . We have observed
3

the following phenomenon in the laboratory. In an insulated substrate, we add the conductive
carbon nanofiber to form a composite. When the volume ratio of the nanofiber is low, the
conductivity of the composite is very low and even zero. As the increasing of the nanofibers,
when the volume ratio reaches a critical value, the conductivity starts to rise sharply. Therefore,
there exists a threshold value cp , above which a continuous conductive path forms. The
probability of carbon nanofibers forming a conductive path is very low when the volume rate is
low. Accordingly, the conductivity of the composite is close to zero. After the volume rate
reaches a critical value, the carbon nanofibers start to form at least one conductive path and the
possibility of existing multiple conductive paths increases; therefore the conductivity of the
composite increases sharply. Many researchers has studied the electrical conductivity of the
composite system and investigated the percolation threshold in order to better understand the
principle of the sharp change in conductivity near the critical transition point.
Monte Carlo methods are a class of computational algorithms that rely on repeated random
sampling to compute their results. Monte Carlo methods are often used when simulating physical
and mathematical systems. Because of their reliance on repeated computation and random or
pseudo-random numbers, Monte Carlo methods are most suited to calculation by computer.
Monte Carlo methods tend to be used when it is infeasible or impossible to compute an exact
result with a deterministic algorithm.
Monte Carlo simulation methods are especially useful in studying systems with a large number
of coupled degrees of freedom, such as fluids, disordered materials, strongly coupled solids, and
4

cellular structures. More broadly, Monte Carlo methods are useful for modeling phenomena with
significant uncertainly inputs.
The Monte Carlo simulation is a widely used numerical technique of modeling the effects of
disorder resistor networks and can be applied to a wide range of situations. By using the method,
the percolation behavior is appropriately simulated with advanced computational algorithms and
the topological disorder of a random microstructure is directly constructed. In 1974, Pick and
Seager (1974) carried out a 2D study on composites filled by straight sticks. They assumed that
all the sticks have the equal length and no width. Their work was extended by Balberg and
Binenbaum (1983), who account for the macroscopic anisotropy induced by sticks with preferred
orientation and unequal length. Natsuki et al. (2005) considered the width of sticks in their
Monte Carlo simulation of 2D networks, which also predict the relationship between the
percolation threshold and the fiber aspect ratio and the orientation angle.
The Monte Carlo simulation can also be used to study the 3D percolation behavior. Balberg et al.
(1984) first conducted the 3D Monte Carlo study on percolation behavior of systems consisting
of randomly oriented sticks, and they explored the effects of the stick aspect ratio and
macroscopic anisotropy. By developing the study of Balberg et al and the effective medium
method, Taya and Ueda (1987) used the Monte Carlo approach to study the electrical
conductivity of a 3D composite reinforced by straight short fibers. Lee and Kim (1995) also
performed the 3D Monte Carlo simulation for unidirectional short-fiber reinforced composites.
In their research, the fiber orientation was predetermined and the fiber length distribution, fiber
volume fraction and fiber aspect ratio are allowed to change.
5

Few attentions have been paid to the effects of the fiber waviness on the percolation behavior of
fibrous composites. Ye et al. (2004) predicted that the increasing of the curliness of the fibers
cause the greatly increasing of the percolation threshold. Li and Chou reported a general
continuum percolation model for the composites with fibers of arbitrary shape in 2D scale. In 3D
aspect, Dalmas et al (2006) developed the simulation of 3D entangled fibrous networks using
spline-shaped fibers. They reported that the percolation threshold increased as the increase of the
fiber tortuosity and the larger fiber aspect ratio can also bring the larger effect of the tortusity.
However, they did not study the effect of the fiber width in the 3D simulations. Therefore, there
still need to develop 3D Monte Carlo models to explore the effects of the fiber aspect ratio, fiber
width, fiber length and fiber aspect ratio on the behavior of the composites system.
1.2 Research Objectives
This work has following research objectives:
1. Development of a conductivity percolation model for the carbon nanofiber composite
materials. The model is based on the randomly generated cylinders, which model the nanofibers,
forming clusters through the tunneling effect. When a cluster spans the substrate from one side
to the opposite side, percolation happens.
2. Using Monte Carlo simulation method, study the convergence of current model and by
statistical analysis, we get the density distribution of the critical volume rate.
6

3. Simulation results demonstrate the percolation phenomenon when the volume rate of the
nanofibers in the composite exceeds a critical value. Fundamentally understanding the
relationship between the nanofiber aspect ratio and the fiber volume rate.
4. The research also studies the tunneling effect to the average volume rate, and proposes the
percolation model is not a scalable system. The electrical conductivity also studied for both the
2D and 3D models.
5. The simulation model shows the qualitative characteristics of the nanocomposite percolation
behavior. This study will lead to the better understanding of the influence of certain parameters
to reduce the number trials and errors in the experiments.
7

CHAPTER 2
PERCOLATION CONCEPTS AND APPROACHES
2.1 Background
Percolation theory was to study the problem involving liquid passing through the porous
materials and answer the question that if the liquid can make it from hole to hole and reach the
other side of the material. It was later developed into a pure mathematical problem that describes
the behavior of connected clusters in a random graph. This model is perfect for our purpose that
treats the nanofiber clusters as the paths of electronics and study conductivity due to those paths.
The percolation models are composed of sites and of bonds between sites.
2.2 Site percolation and bond percolation
Broadbent and Hammersley (1957) proposed the first mathematical model of the classical
threshold. They reported a simplified “lattice percolation” model for the flow of a fluid through a
porous medium from one side to the other side and showed clearly their model possessed a
percolation threshold. The model requires fluid to go through the “bonds” which connect to the
nearest neighbors in a regular lattice of “sites”. In the “bond percolation”, some known fraction
of bonds, which distributed randomly, is missing from the lattice. In the “site percolation”, a
8
known fraction of the sites are missing from the lattice causes no current can flow through any of
the bonds which join that site to its neighbors, so no current can go through the sites.
The research of the Kirkpatrick (1973) pointed that in the case of the site percolation on a lattice
which includes sites, where the number is large. The parameters relevant to percolation are
defined in the limit , and will depend on the concentration of connected sites
N N
N →∞ x and the
geometry of the lattice. When the concentration is low, for example cx x≤ , the allowed sites are
single and in small separated clusters of adjacent allowed sites. As the increase of x , larger
cluster formed and the mean size of a cluster increased accordingly. As x approaches cx from
below, the larger clusters begin to merge and the mean cluster size diverges at cx in the limit
. For the finite , this indicates that there is a completed path of neighboring allowed
sites crossing the system, therefore the macroscopic flow through the system becomes possible.
If is large enough, there will be only one large cluster remains in the system, along with many
small ones. As
N →∞
N
N
x increases above cx , the infinite cluster grows rapidly and absorbs small
clusters. Accordingly, the site percolation probability rises greatly from zero just above
threshold, and the isolated clusters become rare. near threshold can be demonstrated by a
simple power law,
( ) ( )sP x
( )x( )sP
( ) ( ) ( )s scP x x x∝ − (1)
Where s is approximately the same for all three lattices.
0.3 0.4s≤ ≤ .
Thresholds of this type can be applied to all the lattices and are not restricted to nearest neighbor
percolation on regular lattices.
9

2.3 Effective Medium Theory
The effective medium theory, which was originally formulated to describe the conductivity of
binary mixture, has been developed to treat disordered networks. Moreover, some attempts to
generalize the theory to anisotropic random network were made to verify some general aspects of
conduction in anisotropic materials. During the evolution of such theories many methods have
been used to obtain statistical information about the heterogeneous systems [50].
The distribution of potential in a random resistor network to which a voltage has been applied
along one axis may be regarded as due to both an “external field” which increases the voltages
by a constant amount per row of nodes, and a fluctuating “local field,” whose average over any
sufficiently large region will be zero [51]. We use an effective medium, in which the total
medium inside is equal to the external field, to represent the average effects of the random
resistors by an effective medium. Such a medium should be homogenous. To simplify the model,
we consider it to be made up of a set of equal conductance, , connecting the nearest neighbors
on the cubic mesh. The criterion to fix is the extra voltages induced the local fields, when
individual conductance replaces , in this medium, should average to zero.
mg
mg
ijg mg
Consider one conductance oriented along the external field, surrounded by the effective medium,
and having the value . The solution of the network equation 0ABg = g
10

( )ij i jjg V V− =∑ 0 (2)
Figure 1: Constructions used in calculating the voltage induced across one conductance, , surrounded by a uniform medium [51].
0g
In the presence of is constructed by superposition. To the uniform field solution, in which
the voltages increase by a constant amount, , per row, we add the effects of a fictitious current,
, introduced at A and extracted at B. Since the uniform solution fails to satisfy current
conservation at A and B, the magnitude of is chosen to correct for this:
ABg
mV
0i
0i
0( )m mV g g i− = 0 (3)
The extra voltage, ,induced between A and B, can be calculated if we know the conductance
of the network between points A and B when is absent.
0V
'ABG ABg
'0 0 0/( )ABV i g G= + (4)
To calculate , we first obtain the conductance between A and B in the uniform effective
medium, since . A symmetry argument is useful: Express the current distribution
'ABG ABG
'AB AB mG G g= +
11

with as the sum of two contributions, a current , introduced at A and extracted at a
very large distance in all directions, and an equal current, introduced at infinity and extracted at
B. In each case, the current flowing through each of the z equivalent bonds at the point where the
current enters is , so that a total current of flows through the AB bond. This
determines the voltage developed across AB, and from that follows the result, , or
. Using Eqs.(3) and (4), we obtain:
0 mg g=
( / 2G z=
m mV V g= −
0i
z0 /i z
g
/[g
g
02 /i
( / 2)AB mG z g=
( )
' 1)AB m−
0 0( )g 0 ( / 2 1) mz g+ − ] (5)
valid in both 2D and 3D.
f gIf the value of a bond, , is distributed according to a probability distribution ij (which may
be either continuous or discrete), the requirement that the average of vanish gives a condition
determining :
0V
m
)dgf g∫
1f g
g
( )(g g
( ) (p g
/[m g− +
) (1
( / 2 1) ] 0z g− =m (6)
For a binary distribution, we have
) ( )p gδ δ α− − (7) = − +
As is appropriate to the percolation network models, Eq. (6) reduces to a quadratic equation for
: mg
{ }22 1)z g− +
( / 2)g z
( / (
1m p
/ 2)z
[ / 2
1 [ / 2(1 ) 1] ]m mp z p gα α− + − − 0− =
1p
(8)
The relevant root of Eq.(8)
{ } { }2 1(1 ) 1] /( 2) ( ( / 2) / 2(1 ) 1]z p z z z pα 1/ 22( 2) ( 2)z zα[ α −= − + − − − + + − − − − + −
(9)
12

Has a simple limiting form when 0α → :
( 0) 1 (1 ) /(1 2 / )mg p zα = = − − − (10)
A straight line in which goes to zero when mg 2 /p z= .
It was shown in Kirkpatrick (1971), the effective medium theory is accurate to within a few
percent at all concentrations whenever 0.1α ≥ for the bond percolation model. However, for the
site percolation model, it gives the wrong slope at high concentration (small concentrations of
missing sites).
2.4 Excluded Volume Method
There are several methods capable of predicting the critical concentration in percolating systems.
The excluded volume approach is effective in treating the problem of percolating systems in
which the objectives possess a large aspect ratio [53]. The excluded volume and excluded area in
two dimensions of an object is defined as the volume or area around an object into which the
center of another similar object is not allowed to enter if overlapping of the two objects is to be
avoided. The excluded volume for an elongated volume can be obtained by multiplying this
volume by , which is the critical number density of objects in the system. If cN V defines an
average excluded volume, the total excluded volume exV is given by
ex cV V= N (11)
Similarly, the total excluded area is
13
ex cA A= N (12)
Remember that V and A of an object is very different, and its value can be calculated
according to the shapes such as cylindrical rods in three-dimensions (3D) and line segments and
narrow strips in two-dimensions (2D).
Figure 2: Two sticks of length L and width D, the angle between which is θ . The excluded area is obtained by following the center o as stick j travels around stick while touching it at least at one point [54].
i
Two sticks (rectangles), the angle between which is i jθ θ θ= − [54]. The excluded area can be
obtained simply by moving one stick around the other and registering the center of the moving
stick. Fig.2 shows a result of such a procedure. The shaded area represents the stationary stick
and the curve is the path of the center of the other sick as it is moved around the first stick. The
area within the curve is the excluded area.
14

This excluded area is given by
2 2( sin cos )( sin cos ) ( )sin cosL D D L D L L Dθ θ θ θ θ+ + + + − + θ (13)
For the uniform distribution of angles we must consider all possible angles iθ and jθ and their
corresponding uniform probability
( ) 1/ 2iP μθ θ= (14)
in the interval 2 μθ . Hence the averaged excluded area is
/ 2 / 22
/ 2 / 2sin ( ) ( )i j i j iA L P P d d
π π
π π jθ θ θ θ θ θ− −
= −∫ ∫ × (15)
Substituting the distribution (14) and (15) yields the average excluded area
( )2 2 2 22 [1 1/ 2 (1 cos 2 )] ( )(4 2sin 2 ) /(4 )A DL L Wμ μ μ μ μθ θ θ θ= + − + + − θ (16)
The average excluded volume V for a CNT, modeled as a cylinder of length L and diameter D,
is given by [54]:
3 2 24 2 2 sin3
V D D L DLμ
π π θ= + + (17)
Where sinμ
θ is the average value of sinθ , and θ is an angle between two CNTs.
The term sinμ
θ describes the degree of CNT alignment. The calculation of sinμ
θ is complex.
However, it is easy to obtain sin 0μ
θ = when the CNTs are perfectly aligned. In the case of
random distribution, the value of sinμ
θ is calculated to be / 4π .
15

Another two-dimensional finite-width stick is the “capped” rectangular stick. The derivation of
the excluded area of this object indicates how to handle the three-dimensional problem. We
assume now a rectangle of length , width , and the caps of radius at its ends. Fig.3.
shows the capped rectangle and the excluded area which is formed around it. One can readily
find that the excluded area for these two sticks, which have an angle
L D / 2D
θ between them, is
2 24 sDL D L inπ θ+ + (18)
The average excluded area in the uniform and randomly orientated system is given as
2
24 [4 22LA DL D μμ
sin(2 )]μπ θθ
⎛ ⎞= + + −⎜ ⎟⎜ ⎟
⎝ ⎠θ (19)
Where W is the width of fibers and μθ is the orientation angle.
Figure 3: .The sticks are capped rectangles. The length of the sticks is , their width is and the radius of the cap is [54].
L D/ 2D
16
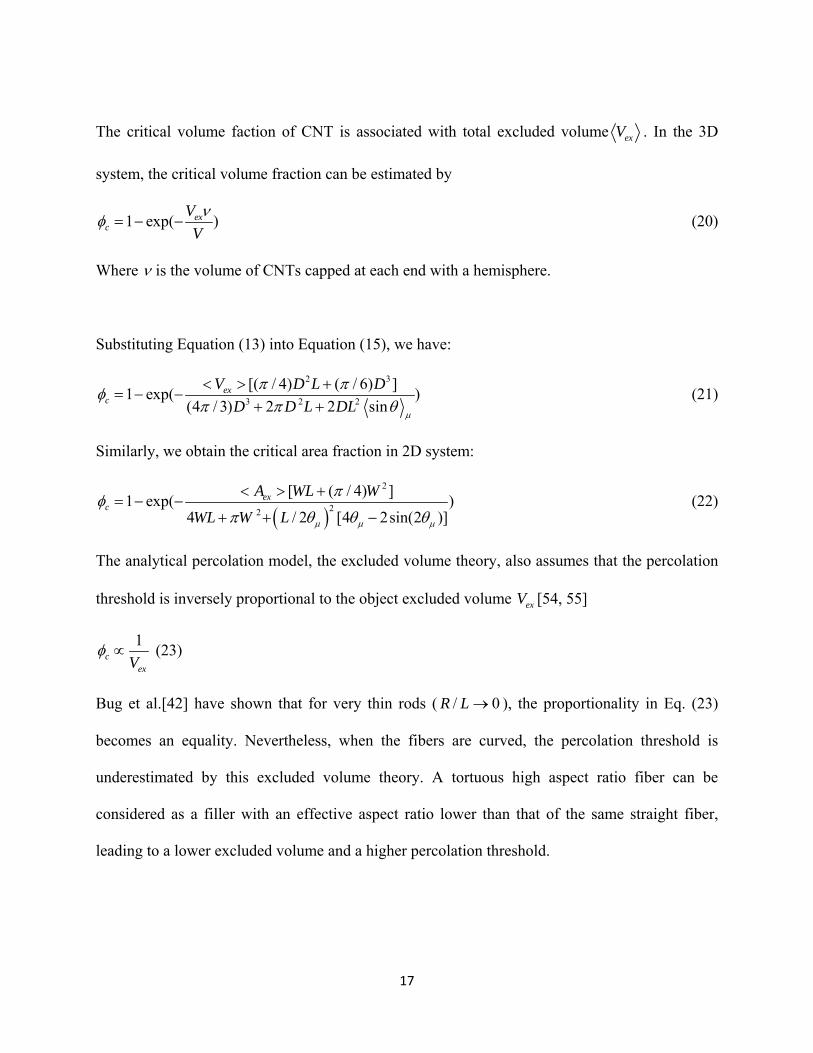
The critical volume faction of CNT is associated with total excluded volume exV . In the 3D
system, the critical volume fraction can be estimated by
1 exp( )exc
VVνφ = − − (20)
Where ν is the volume of CNTs capped at each end with a hemisphere.
Substituting Equation (13) into Equation (15), we have:
2 3
3 2 2
[( / 4) ( / 6) ]1 exp( )(4 / 3) 2 2 sin
exc
V D L DD D L DL
μ
π πφπ π< > +
= − −+ + θ
(21)
Similarly, we obtain the critical area fraction in 2D system:
( )2
22
[ ( / 4) ]1 exp( )4 / 2 [4 2sin(
exc
A WL W
WL W L μ μ μ
πφπ θ θ
< > += − −
+ + − 2 )]θ (22)
The analytical percolation model, the excluded volume theory, also assumes that the percolation
threshold is inversely proportional to the object excluded volume [54, 55] exV
1c
exVφ ∝ (23)
Bug et al.[42] have shown that for very thin rods ( ), the proportionality in Eq. (23)
becomes an equality. Nevertheless, when the fibers are curved, the percolation threshold is
underestimated by this excluded volume theory. A tortuous high aspect ratio fiber can be
considered as a filler with an effective aspect ratio lower than that of the same straight fiber,
leading to a lower excluded volume and a higher percolation threshold.
/R L → 0
17

CHAPTER 3
NUMERICAL MODEL
In this chapter, we present two steps involving in developing the Monte Carlo model. First of all,
the fibers with randomly location and random orientation are generated. Since the main goal of
this research is to determine the conductive filler volume rate at the onset of high electrical
conductivity, a non-dimensionalized unit cube will be used. In the second step, a percolation
criterion is applied to check the connectivity between each pair of fibers in the composite system.
The details of these two steps are described as follows.
3.1 Model generation
The following phenomena have been observed in the laboratory. Conductive carbon nanofiber is
added into an insulated substrate to form a composite. When the volume ratio of the nanofiber is
low, the conductivity of the composite is zero or very low. If we continue to add more
nanofibers into the composite, as the volume ratio reaches a critical value, the conductivity starts
to rise sharply. This phenomenon is theorized as follows. When the volume ratio is low, the
probability of carbon nanofibers forming a conductive path is very low. Therefore, the
conductivity of the composite is close to zero. As the volume ratio reaches a critical value, the
carbon nanofibers start to form at least one conductive path. As the increase of volume ratio, the
18

probability of forming multiple conductive paths increases; therefore the conductivity of the
composite increases sharply [56].
A numerical model of a nanofiber composite is built as the follows. A set of nanofibers,
modeled as cylinders, are generated within the domain of the substrate with their positions,
orientations, lengths, and radius following certain types of random distributions. All the fibers in
the system are identical, for example, they have the same length, diameter and orientation angles.
But they are randomly distributed and oriented. To generate numbers with sufficient randomness,
we adopt the most common computer technique for producing random sequences, the
multiplicative congruential generator.
3.2 Connection criterion
Percolation problem is to find the critical length by which an infinite cluster of connected sites
are formed. Let us consider a sample which is a unit-size square. In the square, we plant
randomly distributed sites
cL
sN , defined as a stick density. The next stage is to attach a stick of
length to each site according to a certain fiber orientation. A critical length of the percolation
threshold depends on the stick density in the sample. We can give the average lattice constant
normalized by [39]
L
1/s Sr π= N (24)
19

Percolation threshold is reached if and only if a continuous pathway of overlapping sticks exists
between connecting opposing edges. The critical length can be normalized by 2cL sr given by Eq.
(24). The value is dependent on the orientation angle and aspect ratio. / 2cL rs
Bonding criterions for two sticks with a finite-width can be analyzed by the schematic diagram
shown in Fig. (4) and (5). Sites are planted by generating random coordinates ( ,k kx y ),
. Each stick of length is centered on a site and has an assigned orientation
angle
1,2,..., Sk =
k
N kL
θ . Fig. 4 illustrates the relationship between two different coordinate systems that are
fixed on fibers. The axes 'y and ''y indicate the orientation angles of iθ and jθ , respectively. The
relationship between the Cartesian coordinates shown in Fig.4 can be expressed as
0 '
0
cos sinsin cos
i i i
i ii
x'
x xy y y
θ θθ θ
⎧ ⎫ ⎧ ⎫⎡ ⎤⎧ ⎫ ⎪ ⎪ ⎪ ⎪= +⎨ ⎬ ⎨ ⎬ ⎨ ⎬⎢ ⎥− ⎪ ⎪⎩ ⎭ ⎪ ⎪ ⎣ ⎦ ⎩ ⎭⎩ ⎭, (25)
0 ''
0
cos sin
sin cosj j j
j jj
x''
x xy y y
θ θ
θ θ
⎧ ⎫ ⎡ ⎤ ⎧ ⎫⎧ ⎫ ⎪ ⎪ ⎪ ⎪= + ⎢⎨ ⎬ ⎨ ⎬ ⎨ ⎬− ⎪ ⎪⎢ ⎥⎩ ⎭ ⎪ ⎪ ⎩ ⎭⎣ ⎦⎩ ⎭⎥ , (26)
Eliminating x and y from the above equations, we obtain
' '' ( cos sin ) cos( )
sin( )j j i j
j i
'x y xy
θ θ θ θθ θ
Δ −Δ + − −=
−
x (27)
' '''' ( cos sin ) cos( )
sin( )i i i
j i
x y x xy jθ θ θ
θ θΔ −Δ + − −
=−
θ (28)
Where
0 0
0 0
i j
i j
x xxy y y
⎧ ⎫−Δ⎧ ⎫ ⎪ ⎪=⎨ ⎬ ⎨ ⎬Δ −⎩ ⎭ ⎪ ⎪⎩ ⎭ (29)
20

Let us consider the case of a finite-width stick, as shown in Fig.4. Since bonding occurs when
two sticks overlap, the bonding criterions are satisfied by the following both conditions:
' ''
' ''
/ 2, / 2,
/ 2, / 2,
x D x D
y L y L
≤ ≤
≤ ≤ (30)
Where and are the stick width and length, respectively. When two sticks have the same
orientation angle (Fig. 5), the bonding criterions are given by
D L
sin( )2
iij ij i ij
L LA d θ γ
+= + ≤ j , (31)
and
cos( )ij ij i ijB d Dθ γ= + ≤ , (32)
Where
2( ) (ij i j i jd x x y y= − + − 2) (33)
1tan i jij
i j
y yx x
γ −⎛ ⎞−
= ⎜ ⎟⎜ ⎟−⎝ ⎠ (34)
For widthless sticks ( ), we can obtain the bonding criterions from Eqs.(27), (28) and
(30) as follows:
' '' 0x x= =
( )cos sinsin( ) 2
j j
j i
x y Lθ θ
θ θ
Δ −Δ≤
−, (35)
( )cos sinsin( ) 2
i i
j i
x y Lθ θθ θ
Δ −Δ≤
−. (36)
If the points of stick intersection are outside the unit square sample, the two sticks are not
considered intersection.
21

Figure 4: Diagram of the relationship between orientated fibers in different coordinate systems [41].
Figure 5 : Diagram of determining bonding criterion of fibers with the identical orientation angle [41].
For small aspect ratio, the geometry of fiber ends strongly affects the percolation threshold
because of the intersection between boundaries. Fig.6 shows there are three patterns of
overlapping between fibers: body-to- body, end-to-body, and body –to-end.
22

Figure 6: Three patterns of fiber connection [63].
For the end-to-end and end-to-body connection patterns, two fibers do not satisfy the above
bonding criterions but are still connected. The end-to-end and end –to- body connecting patterns
are more time consuming to model than the body-to-body connection in the Monte-Carlo
simulations. However, after examined the fraction of the number of these two types of
connections to the number of total connections among all fibers in the system, we found that this
fraction drastically decrease with the increase of the fiber aspect ratio. The difference in the
critical fiber volume fraction between these two sets of simulation results is found to be
negligibly small when the fibers have an aspect ratio larger than 24. Therefore, some previous
research has neglected the end-to-end and end-to-body connections for the sake of computational
efficiency.
3.3 Calculate the shortest distance between two fibers in space
23

Percolation occurs in the composite system if a continuous conducting pathway along any one or
all of the three coordinate axes can be identified. To evaluate the status of the system generated
above, each fiber in the system is checked against another to see whether they intersect. In the
current study, the connectivity between the i th and j th fibers is determined by comparing the
shortest distance between the critical threshold.
Fig. 7 is the simplified diagram which is used to explain the calculation procedure with vector.
Figure 7: Two-dimension reduction of the shortest distance between two fibers
We assume the following conditions:
The plane H is constructed parallel to PQuuur
.
PQDC is a rectangle.
2 2 2XZ XY YZ= +uuur uuuv uuv
, with ( , ) ( ,YZ dist PQ plane H dist PQ CD= =uuv uuuv uuuv uuuv
) (37)
24
Therefore, with
{ }3 min : ,d XZ X AB Z= ∈uuuv uuuv uuuv
PQ∈
{ }2 min : ,d XY X AB Y= ∈uuuv uuuv uuuv
CD∈
21
1 ( , ), tand dist PQ planeH a cons t=uuuuv
it follows
2 23 2d d d= + (38)
And there is a one-to-one correspondence between solutions of the two minimization problems.
Proof
{ }2min : ,XZ X AB Z PQ∈ ∈
uuuv uuuv uuuv
{ }{ }{ }{ }{ }{ }
{ }{ }
2
2 2
2 21
221
min min : :
min min : :
min min : :
min min : :
XZ Z PQ X AB
XY YZ Y CD X AB
XY d Y CD X AB
d XY Y CD X
= ∈ ∈
= + ∈
= + ∈ ∈
= + ∈ ∈
uuuv uuuv uuuv
uuuv uuv uuuv uuuv
uuuv uuuv uuuv
uuuv uuuv uuuvAB
∈ (39)
3.4 Computational implementation
The shortest distance between each pair of nanofibers is calculated. If this distance is below a
certain threshold, the two nanofibers are assigned to the same cluster. After all nanofibers are
25

assigned, each cluster is checked to see if it spans the substrate, i.e., providing a connection path
from one side to the opposite side. Once percolation happens, the conductivity is calculated
based on the cluster or clusters that constitute the connection paths. The process is repeated with
different distributions of the nanofiber sets to obtain statistical data.
Each fiber is assigned a fiber number and a cluster number, when the generation procedure is
completed. The fiber number and the cluster number are equal and range from 1 through N ,
where is the total number of fibers in the system, Then, each fiber is checked for connection
with other fibers whose fiber numbers are larger than its fiber number. For example, the i th fiber
will be checked against the th through the N th fiber. If two fibers satisfy the connection
criterion, they will be assigned a common cluster number which is the smaller one of the two
fiber number. As a result, all fibers within the same cluster have the same cluster number, and
two clusters are given the same cluster number if they have a common fiber.
N
1i +
If any two fibers in opposite boundary regions have the same fiber cluster number, then it can be
concluded that the system is percolated in the direction perpendicular to the two opposing
bounding surfaces. When the first percolating cluster is found, the system is said to be in the
critical state where the fiber critical volume fraction has been reached.
26

CHAPTER 4
RESULTS AND DISCUSSION
In the percolation model developed in the preceding chapter, there are three controlling
parameters for a given system: the fiber length , the fiber diameter and the fiber aspect ratio L D
α , which are all predetermined. The percolation threshold depends on these specified
parameters.
For a given set of the values of the three controlling parameters, the number of fibers in the
system will be increased in small increments (with the random number generator reset for
each increment) until the first cluster connecting the two opposite boundaries of the system is
identified, which corresponds to one critical value of the fiber volume fraction.
N
4.1 Simulation Results
The following are examples of the two dimensional cases for easy demonstration. There are no
major differences when the model is extended to the three-dimensional cases. The substrate is a
1 by 1 square (normalized dimension). The lengths of the nanofibers are between 0.10 and 0.12,
evenly distributed. The aspect ratio, L/D, of the nanofibers is 200; therefore, the radius of the
27

nanofiber is between 0.00025 and 0.00030, also evenly distributed. The threshold of the
tunneling effect is 0.0005.
Figure 8 shows the result of a set of nanofibers with 2.42% volume rate. The nanofibers in black
(darker) color are the largest cluster, which is of the size of about 25% of the total nanofibers.
The rest of the nanofibers, in the lighter color, are grouped into a number of smaller size clusters.
There is apparently no percolation and the conductivity is zero.
Figure 8: A set of nanofibers with 2.42% volume rate
Figure 9 shows the result of the set of nanofibers increased to a volume rate of 2.87%. The
additional nanofibers have made the size of the largest cluster grow to 47% of the total
nanofibers. From the figure, we can see there is still no percolation and the conductivity is zero.
However, with a few additional nanofibers, the percolation may happen.
28

Figure 9: A set of nanofibers with 2.87% volume rate
Figure 10: shows the result of the same set of nanofibers with the volume rate increased to 2.90%. Percolation starts to happen. The largest cluster grows to about 72% of the total nanofibers
29
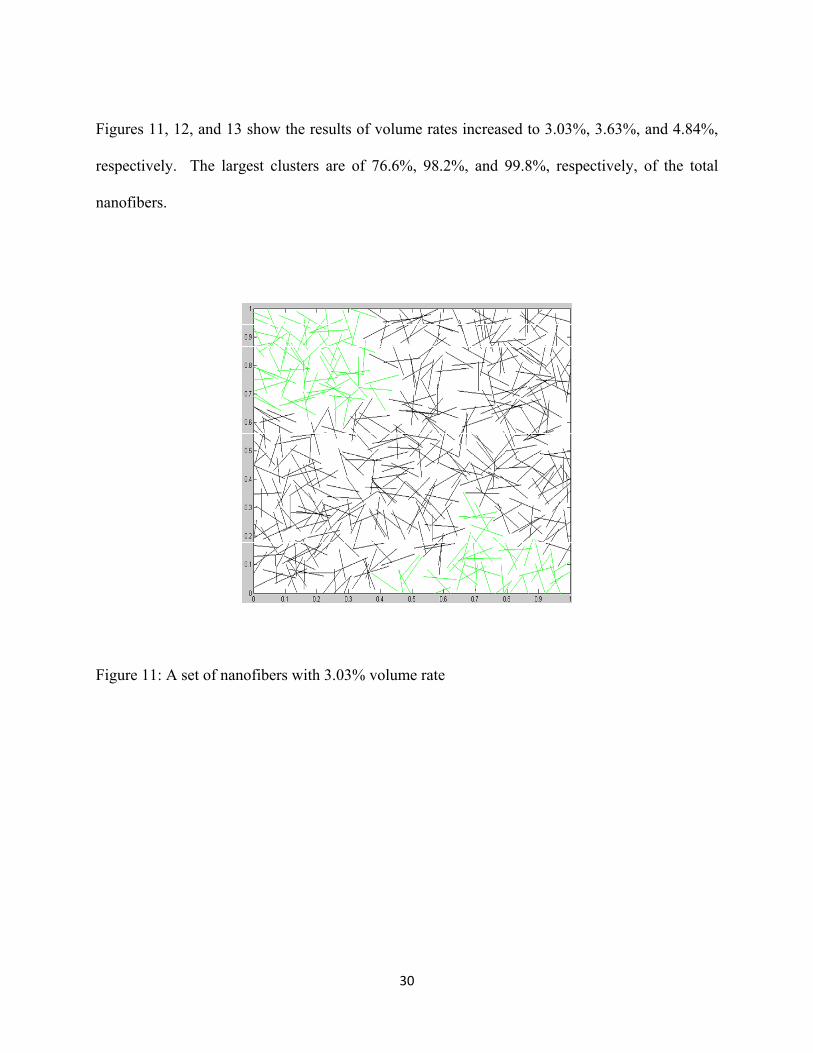
Figures 11, 12, and 13 show the results of volume rates increased to 3.03%, 3.63%, and 4.84%,
respectively. The largest clusters are of 76.6%, 98.2%, and 99.8%, respectively, of the total
nanofibers.
Figure 11: A set of nanofibers with 3.03% volume rate
30

Figure 12:A set of nanofibers with 3.63% volume rate
Figure 13: A set of nanofibers with 4.84% volume rate
31
4.2 Convergence
Monte Carlo simulation capable of predicting the percolation threshold of cylindrical nanotubes
embedded in a polymer matrix has been developed and applied to microscale particles. The
applicability of this approach to nanoscale systems is described in this section. The nanotubes are
modeled as capped cylinders of diameter D and length L with the randomly distributed orientation
angles. Numerical simulations have also been performed to determine the critical volume ratio
under the different aspect ratio and the convergence of the system. As above, the simulation
volume size and nanotube dimensions were rescaled to give a unit volume. Simulations were
carried out by starting with an empty polymermatrix and adding nanotubes until a percolating
cluster was formed. Percolation was defined as the point which two opposite walls of the cubic
simulation volume were connected by a continuous cluster of nanotubes. Statistics were
collected by performing 1000 independent runs.
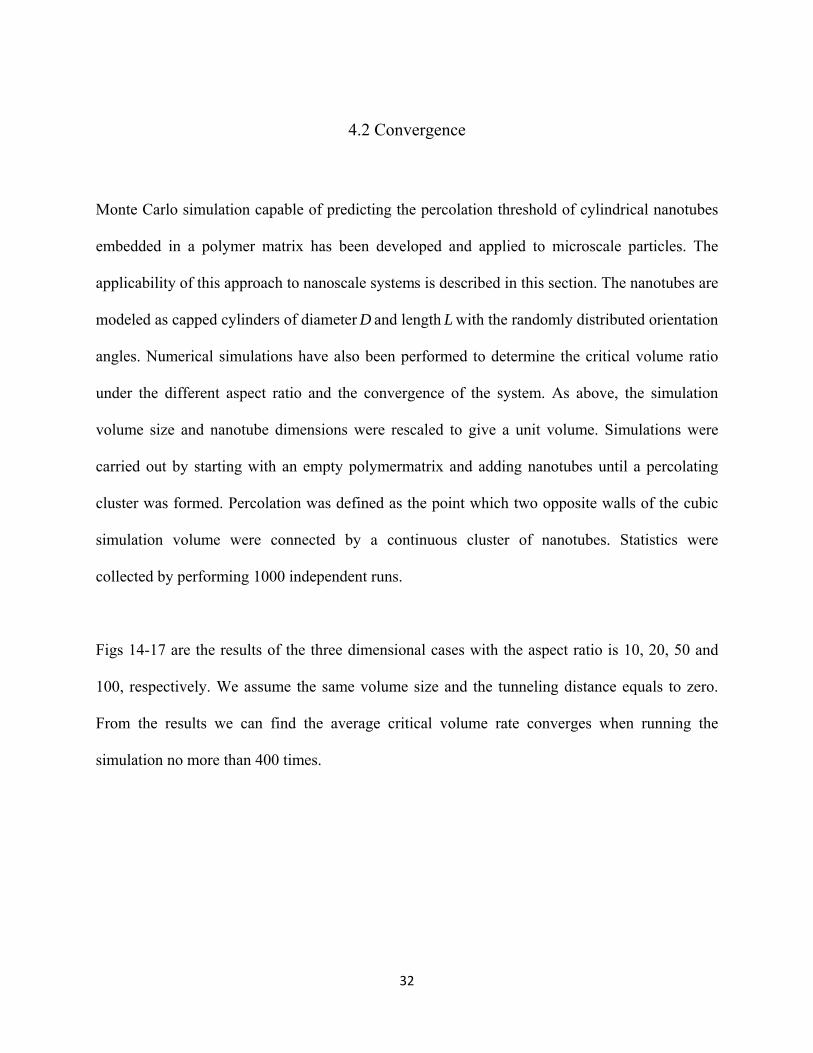
Figs 14-17 are the results of the three dimensional cases with the aspect ratio is 10, 20, 50 and
100, respectively. We assume the same volume size and the tunneling distance equals to zero.
From the results we can find the average critical volume rate converges when running the
simulation no more than 400 times.
32
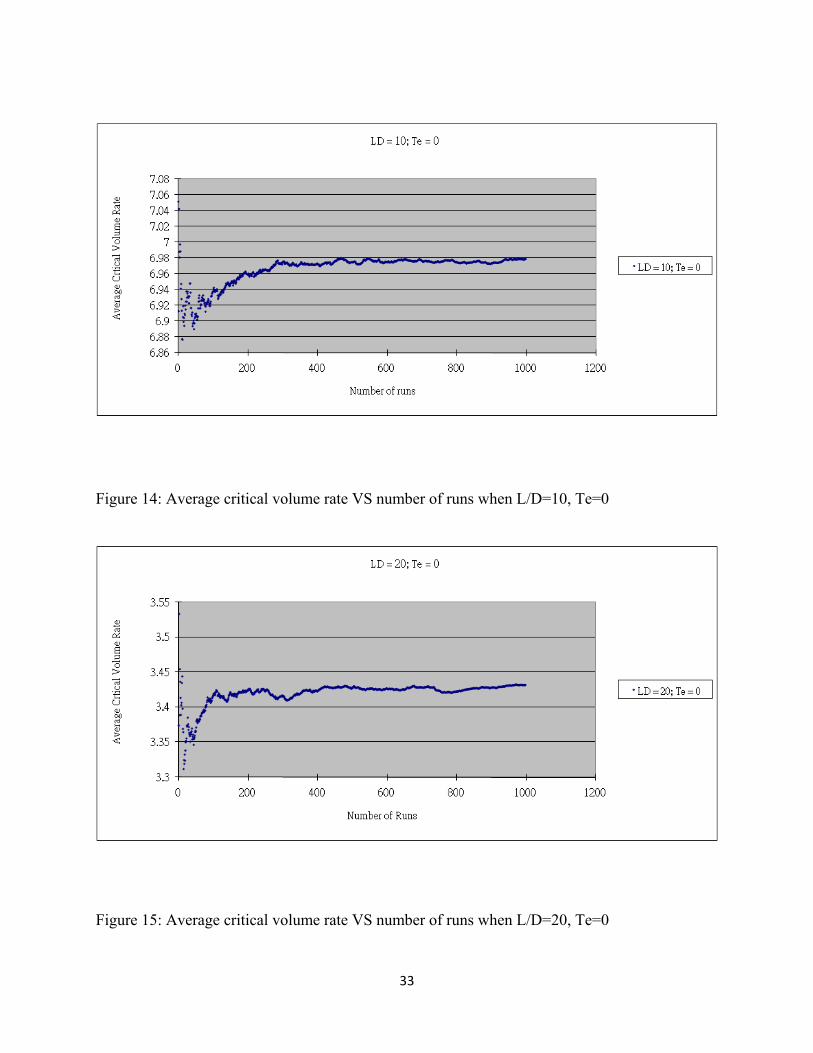
Figure 14: Average critical volume rate VS number of runs when L/D=10, Te=0
Figure 15: Average critical volume rate VS number of runs when L/D=20, Te=0
33

Figure 16: Average critical volume rate VS number of runs when L/D=50 and Te=0
34

Figure 17: critical volume rate VS number of runs when L/D=100 and Te=0
Next, let us further discuss the convergence of Monte Carlo simulation. We use the same Monte
Carlo method as mentioned above and take the following case as an example. In this case, the
size of the cubic nanocomposite is 0.25X Y Z= = = , the aspect ratio , and the volume
rate is 1.3%. The result shows the percolation percentage changes as the 1000 times independent
runs.
/ 5L D = 0
35

Figure 18: Percolation percentage changes as the 1000 times independent runs
From Fig.18, we found that after 350 runs, the Monte Carlo simulation converges. However, for
200 runs, the percolation percentage is 61.5% while the percentage is 57.7% for 1000 runs. The
error is about 6%.
The picture below compares the volume rates under 200 runs and 1000 runs. Under the same
condition, when the percolation percentage arrives to 100%, the volume rate is 1.46% for 200
runs and 1.5% for 100 runs. The error is 2.7%, which is acceptable. Therefore, in order to save
simulation time, 200 runs can be used in the simulations.
36

Figure 19: Comparison the percolation results under 200 and 1000 times run
4.3 Fiber aspect ratio effect
The aspect ratio has a very important effect on the percolation threshold. It was predicted in the
2D Monte Carlo study of Natsuki et al.[41] that the percolation threshold has a linear dependence
on the fiber aspect ratio in a log-log plot when the aspect ratio is above 40. Bigg[8] showed in
the experimental study for the 3D composites reinforced by straight short fibers the critical fiber
volume rate is strongly dependent on the aspect ratio.
In the current study, the effects of the fiber aspect ratio are investigated both in 2D and 3D cases.
In 2D case, the result for straight fibers with aspect ratio increasing from 50 to 200 is illustrated
in Fig.20.
37

Critical Volume Rate, L = 0.10 ~ 0.12
0
2
4
6
8
10
0 50 100 150 200 250
L/D
Volu
me
Rat
io in
%
Figure 20: Critical volume rate versus aspect ratio in 2D case
Figure 20 shows the higher the aspect ratios, the lower the critical volume rates. From analyzing
the data, if the length remains the same, lower aspect ratios represent larger diameters. It takes
fewer nanofibers to reach percolation. However, the volume rate increase is proportional to the
square of the increase of the nanofiber diameter. Therefore, the critical volume rates increase
with the decrease of the aspect ratios.
Table 1 and Figs. 21 and 22 show the results of the volume rate under the different aspect ratios
in 3D cases. The average volume rate and the standard deviation of the critical value for aspect
ratio with 10, 20, 50, 100, respectively are obtained. From the following results, we found that
the critical volume rate decreases as the increase of the aspect ratio.
38

Table 1: Aspect ratio vs critical value of fiber volume rate (3D)
L/D Average volume rate Stdev
10 6.6445 0.4126
20 3.3694 0.1293
50 1.3157 0.0443
100 0.6171 0.0352
0 20 40 60 80 100 1200
1
2
3
4
5
6
7
8
Figure 21: Aspect ratio vs critical value of fiber volume rate
39

In the following case, we run the Monte Carlo simulation by adding the nanotubes into the
polymermatrix gradually, each time we calculate the volume rate and percolation probability
percentage based on the current amount of the nanotubes. We assume all the 3D cases with the
same volume size and tunneling distance is zero. From Fig.22, we can compare the percolation
percentage changing with the different volume rate under the four aspect ratios, 10, 20, 50 and
100, respectively. Fig.23 shows at the threshold, where the percolation percentage just arrives to
100%, the volume rates change as the different aspect ratio, which is also called the critical
volume rate. We found the same conclusion, the higher the aspect ratio, the lower the critical
volume rate and the percolation networks are more easily to form.
Figure 22: Percolation percentage vs volume rate with the aspect ratio 10, 20, 50 and 100.
40

Figure 23: Volume rate under the different aspect ratio at 100% percolation probability
4.4 Electrical conductivity
According to the percolation theory [36,44], the effective electrical conductivity of a composite,
( te f c )σ σ φ φ= − , where fσ is the electrical conductivity of the conductive phase, φ is the volume
fraction of the conductive phase, cφ is the critical volume fraction, and t is the conductivity
exponent. It is proposed that in this theory t depends only on the space dimensionality. A
universal value of t was showed for 2D materials, and 1.3= 1.7 ~ 2.0t = was suggested for 3D
materials.
The simplest model to predict the conductivity of the composite after percolation happens is to
assume the conductivity is proportional to the ratio of the number of nanofibers forming the
41

largest cluster to the total number of nanofibers. Figure 24 shows the results of a single
simulation run, in which nanofibers are added to the substrate to increase the volume rate
gradually. Before the volume rate reaches the critical volume rate of 2.63%, the conductivity is
zero. After that the conductivity jumps to a certain value, which increases with the increasing
volume rates. After the volume rate reaches 4.84%, almost all nanofibers are connected into one
large cluster. The conductivity is a normalized value of 1.
0
0.2
0.4
0.6
0.8
1
1.2
0 1 2 3 4 5
Volume Rate in %
Conductivity
6
Figure 24: Conductivity vs volume rate in 2D case
The effective electrical conductivity of the composite varying with the fiber volume fraction is
shown in Fig. 25 and table 2. The results show that there is a sharp increase of the conductivity
near the threshold.
42

Figure 25: Nanofibers in the largest cluster/total nanofibers versus volume rate Table 2: Nanofibers in the largest cluster/total nanofibers versus volume rate
Volume Rate Nanofibers in the largest
cluster/total nanofibers
Volume Rate Nanofibers in the largest
cluster/total nanofibers
1.1 0.379 9.111 74.700
2.119 0.393 10.053 82.577
3.142 0.540 11.153 88.002
4.084 0.727 12.095 91.123
5.027 1.325 13.038 93.284
6.126 3.555 14.137 95.107
7.069 18.958 15.08 96.268
8.011 57.685 15.865 96.985
43
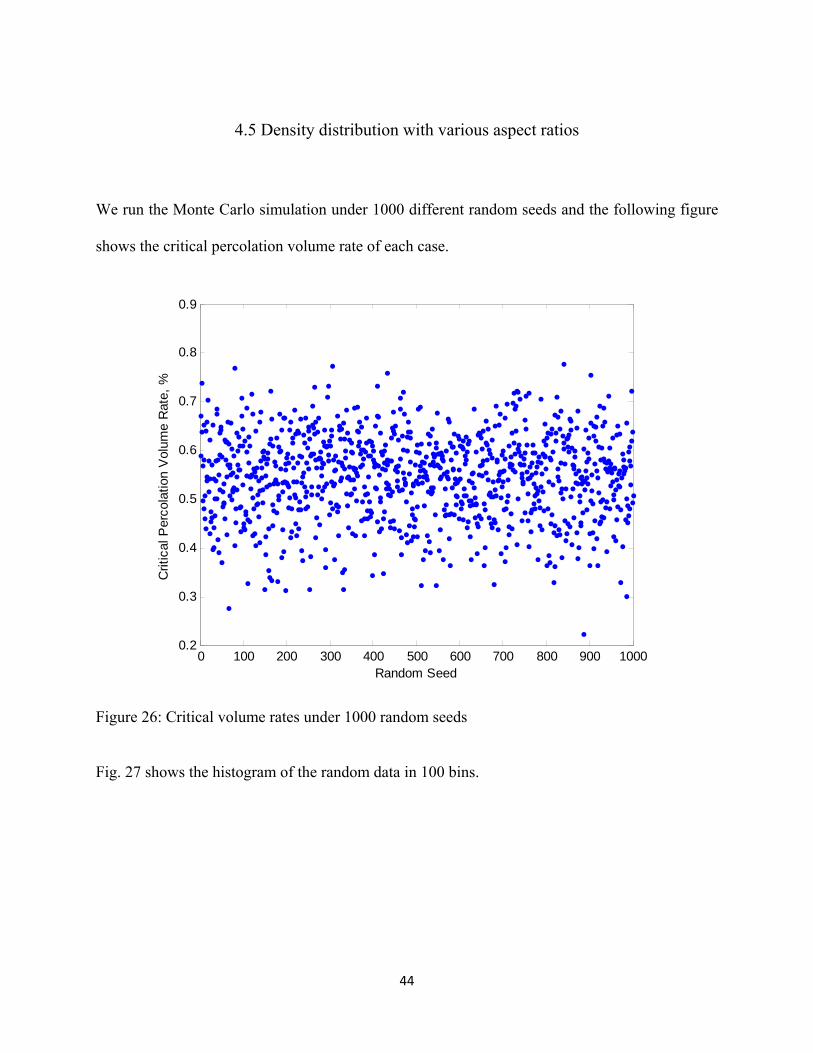
4.5 Density distribution with various aspect ratios
We run the Monte Carlo simulation under 1000 different random seeds and the following figure
shows the critical percolation volume rate of each case.
0 100 200 300 400 500 600 700 800 900 10000.2
0.3
0.4
0.5
0.6
0.7
0.8
0.9
Random Seed
Crit
ical
Per
cola
tion
Vol
ume
Rat
e, %
Figure 26: Critical volume rates under 1000 random seeds
Fig. 27 shows the histogram of the random data in 100 bins.
44

0.2 0.3 0.4 0.5 0.6 0.7 0.8 0.90
5
10
15
20
25
30
35
Critical percolation volume rate, %
Num
bers
out
of 1
000
Figure 27: Histogram of the random data in 100 bins
And then we use the statistics method and get the probability density estimate of the random data,
which evaluates the density estimate at 100 points covering the range of the data.
45

0.1 0.2 0.3 0.4 0.5 0.6 0.7 0.8 0.90
0.5
1
1.5
2
2.5
3
3.5
4
4.5
5
Critical percolation volume rate, %
Den
sity
, %
Figure 28: Probability density estimate of the random data
By using the same method, we got the probability density of critical percolation volume rate with
different aspect ratio of the nanotubes.
46

-1 0 1 2 3 4 5 6 7 80
0.5
1
1.5
2
2.5L/D = 100
Critical percolation volume rate, %
Den
sity
, %
L/D = 50
L/D = 20
L/D = 10
Figure 29: Probability density distribution with various aspect ratios
4.6 Tunneling Effect
In quantum mechanics, quantum tunneling (or the tunnel effect) is a nanoscope phenomenon in
which a particle violates the principles of classical mechanics by penetrating a potential barrier
or impedance higher than the kinetic energy of the particle [57]. Balberg [58] and later on Rubin
et al.[59] proposed a model based on interparticle tunneling conduction. This model implies a
diverging resistance distribution between spherical particles governed by a Hertz law depending
on the mean interparticle distance (which decreases with the particle content). Scarisbrickz [60]
has argued that in composites containing a large fraction of inclusions, the V-I relationship is
47

linear due to the actual touching of inclusions. Electron tunneling was proposed to be the
probable mechanism of electrical conduction in such composites. However, Reboul [61]
observed a linear V-I relationship in composites containing a low volume fraction of fibers,
which exhibited high resistivities and where fiber-fiber contacts were improbable. In general, the
tunneling distance between fibers is a parameter relative to a matrix and has a quite small value
(a few nanometers) [62]. The diameter of traditional carbon fibers is very larger in comparison
with the tunneling distance. The limit of tunneling distances depends on matrix used in
composite system but its determination for an actually given system is quite difficult.
Therefore, in our research, we used the Monte Carlo simulation to investigate the tunneling
effect on the critical volume rate of the nanofibers. Using the same simulation model and
approach as we descried before, we set the tunneling distance to be zero, 0.1R, 0.3R and 0.5R,
where R is the radius of the capped cylinders of the nanotube model. We plot the critical volume
rate distribution with the different tunneling distance under the 1000 times independent runs. As
Fig. 30 shows, the tunneling effect does not affect the critical volume rate too much. As the
tunneling distance changing from zero to 0.5R, the critical volume rates are almost the same.
48

Figure 30: Tunneling effect to the critical volume rate
4.7 Non-scalability of the percolation model
In this section, we intend to apply the percolation model to analyze and address percolation is not
a scalable mechanism. First, we define a typical percolation model. Imagine a two dimensional
lattice of dots, which are usually think as sites. The bonds, are the lines drawn between
neighboring sites. Each bond can be open with the probability p , or closed with the
probability (1 )p− . A cluster is formed when a group of sites connected by open bonds. We say a
cluster percolates the lattice if it extends from one side of the lattice to the opposite side. From
49
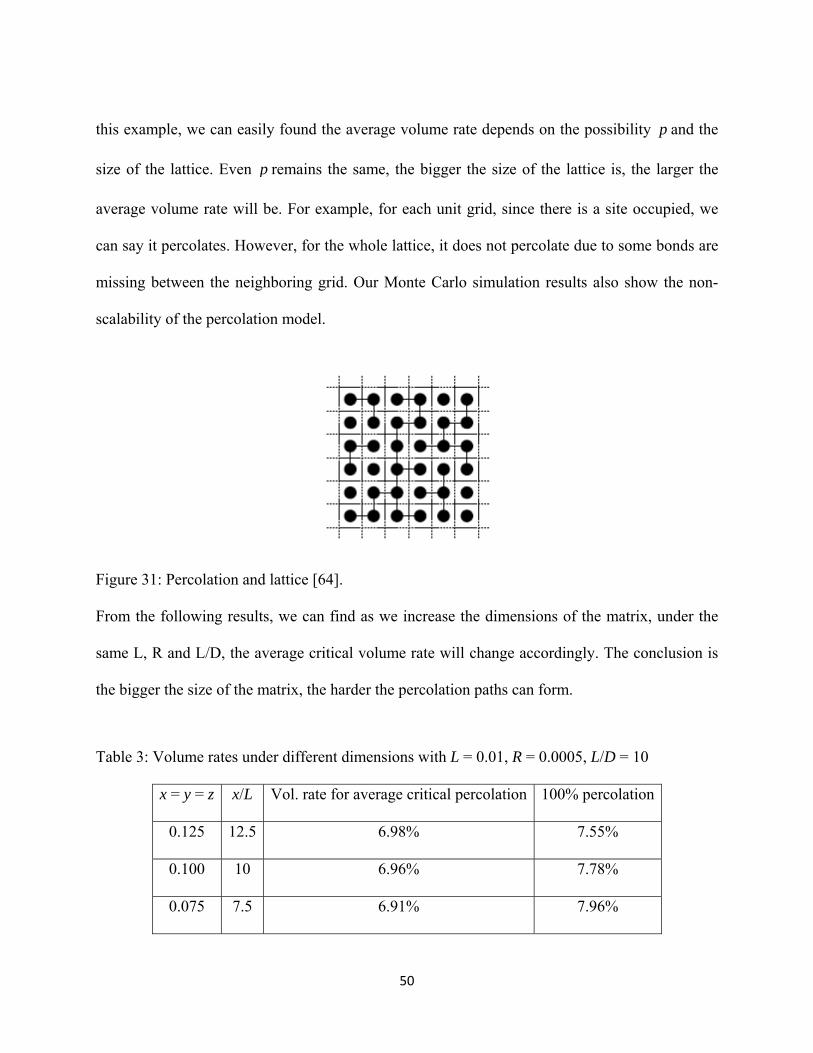
this example, we can easily found the average volume rate depends on the possibility p and the
size of the lattice. Even p remains the same, the bigger the size of the lattice is, the larger the
average volume rate will be. For example, for each unit grid, since there is a site occupied, we
can say it percolates. However, for the whole lattice, it does not percolate due to some bonds are
missing between the neighboring grid. Our Monte Carlo simulation results also show the non-
scalability of the percolation model.
Figure 31: Percolation and lattice [64]. From the following results, we can find as we increase the dimensions of the matrix, under the
same L, R and L/D, the average critical volume rate will change accordingly. The conclusion is
the bigger the size of the matrix, the harder the percolation paths can form.
Table 3: Volume rates under different dimensions with L = 0.01, R = 0.0005, L/D = 10
x = y = z x/L Vol. rate for average critical percolation 100% percolation
0.125 12.5 6.98% 7.55%
0.100 10 6.96% 7.78%
0.075 7.5 6.91% 7.96%
50

0.050 5 6.85% 8.69%
Figure 32: Volume rates under different dimensions with L = 0.01, R = 0.0005, L/D = 10
Table 4: Volume rates under different dimensions with L = 0.02, R = 0.0005, L/D = 20
x = y =
z
x/L Vol. rate for average critical
percolation
100%
percolation
0.200 10 3.48% 3.80%
0.125 6.25 3.43% 3.92%
0.100 5 3.42% 4.05%
0.075 3.75 3.36% 4.27%
51

Figure 33: Volume rates under different dimensions with L = 0.02, R = 0.0005, L/D = 20 Table 5: Volume rates under different dimensions with L = 0.05, R = 0.0005, L/D = 50
x = y =
z
x/L Vol. rate for average critical
percolation
100%
percolation
0.250 5 1.27% 1.46%
0.125 2.5 1.18% 1.71%
0.100 2 1.105% 1.78%
52

Figure 34: Volume rates under different dimensions with L = 0.05, R = 0.0005, L/D = 50
53

CHAPTER 5
CONCLUSIONS AND FUTURE WORK
This research work has performed the computational study of the qualitative characteristics of
the nanocomposite percolation behavior. The results of the research have enhanced our
understanding of the percolation theory and showed the model has the potential to be used in the
predition of the influence of certain parameters. It can help in reducing the number trials and
errors in the experiments.
5.1 Conclusions
A Monte Carlo model for predicting the percoaltion threshold and electrical conductivity of the
nanocomposite material is presented. The model accounts for the nanofiber aspect ratio effect by
using the randomly distributed and oriented nanofibers, which have three adjustable parameters
(i.e., the nanofiber length, the nanofiber diameter, and the nanofiber aspect ratio.)
The use of the Monte Carlo method leads to the determination of the percolation threshold, and
by assuming the conductivity is proportional to the ratio of the number of nanofibers forming the
largest cluster to the total number of nanofibers results in the prediction of the effective electrical
54

conductivity of the nanocomposite. We also explore the tunneling effect on the percolation
volume rate and propose the percolation model is not a scalable system.
The numerical results obtained using the developed model show a relationship between the
percolation threshold and the aspect ratio: the higher the nanofiber aspect ratio, the lower the
threshold. These predicted trends of the percolation threshold and composite conductivity are in
good agreement with existing experimental and simulation results.
5.2 Future Work
In our research, we assume the conductivity is proportional to the ratio of the number of
nanofibers forming the largest cluster to the total number of nanofibers. Based on that, we get the
estimate results to predict the conductivity of the percolation system. As we put more nanofibers
in the system, all the nanofibers will form one biggest cluster which occupied the whole system,
so the trend of the conductivity closes and normalizes to be one eventually. However, from the
physics, we know, we can not add the nanofibers into the composite without any limit. On the
other hand, even we say the ratio of the number of nanofibers forming the largest cluster to the
total number of nanofibers is 100%, every time when we add nanofibers, the conductivity will
change due to form the different electrical paths.
55

Therefore, in the future research, we will further study the area when the percolation percentage
reaches 100% and try to find out how the conductivity changes with the increase of the number
of nanofibers.
56

APPENDIX: MONTE CARLO SIMULATION CODE
57

function [percolation_flag,percolation_cluster_size]=main_all(n_tube,random_seed,xyz,length,radius,Te_ratio) %clear ; %clc ; global max_cluster idebug ; global P5 P6 PO N U V ; % for routine dist_3D_2_segments() %time_start=cputime; %n_tube = 100 ; %max_pair = n_tube*(n_tube-1)/2 ; max_cluster = n_tube ; % --------------------------------------- nano tubes ------------------- % int i, j, k, k1, i1, j1, i2, j2, k2, itmp, record_per_line, data_dim ; % double xlo, xhi, ylo, yhi, zlo, zhi, hlo, hhi, rlo, rhi, % filo, fihi, theta_lo, theta_hi ; % int n_pair, n_cluster, chaining ; % double dist, cluster_threshold ; % double **sc ; % int *pair_lst_i, *pair_lst_j, *cluster_ID ; % double *pair_dist ; % % int *x_sort_lst ; --- pre-processing : sort by x-coordinates --- % double *P1, *P2, *P3, *P4, *A, *B ; % FILE *fp_out_pair_dist, *fp_out_tube_cluster, *fp_out_pair_cluster ; % ----------------------- first executible statement ---------------- % ----------------------- first executible statement ---------------- xlo = 0.0 ; ylo = 0.0 ; zlo = 0.0 ; xhi = xyz ; yhi = xyz ; zhi = xyz ; hlo = length ; % nano tubes are cylinders with random heights hhi = length ; % nano tubes are cylinders with random heights rlo = radius ; % nano tubes are cylinders with random radii rhi = radius ; % nano tubes are cylinders with random radii filo = -pi/2 ; % -pi/2 the low value in range of latitude angle fihi = pi/2 ; % pi/2 the high value in range of latitude angle theta_lo = 0.0 ; % 0.0 the low value in range of longitute angle theta_hi = 2*pi ; % pi*2 the high value in range of longitute angle Te = Te_ratio*radius; % Tunnel Effect gap
58

%Average_Volume_ratio=n_tube*pi*[(rlo+rhi)/2]^2*(hlo+hhi)/2/((xhi-xlo)*(yhi-ylo)*(zhi-zlo)) %pause % ---------------------------------------- for cluster algorithm -------- % cluster_threshold = tiny, will includes all pairs as previous version %cluster_threshold = 2*( rlo + rhi )/2 + Te; % --- for cluster algorithm --- wall_threshold = ( rlo + rhi )/2 + Te; % --- for pecolation --- % If the "distance_sq_between_centers" > "distance_sq_between_centers_threshold" % dist = inf and no need to calculate the distance distance_sq_between_centers_threshold = ((hlo+hhi)/2 + ( rlo + rhi ) + Te)^2; data_dim=3; idebug=0; % /* ----------------- data structure of (line) segment centers --------- */ % /* ------------------------------------------------------------ % sc(i,1) : x-coordinate of center of tube i % sc(i,2) : y-coordinate of center of tube i % sc(i,3) : z-coordinate of center of tube i % sc(i,4) : height of tube i % sc(i,5) : radius of tube i % sc(i,6) : phi , latitude angle of tube i new version % sc(i,7) : theta, the ? angle of tube i % -------------------------------------------------------------------- */ %pair_dist = zeros ( 1, max_pair ) ; %pair_lst_i = zeros ( 1, max_pair ) ; %pair_lst_j = zeros ( 1, max_pair ) ; cluster_ID = zeros ( 1, max_cluster ) ; sc = zeros ( n_tube, 7 ) ; P1 = zeros ( 3, 1 ) ; % column vector, 3D P2 = zeros ( 3, 1 ) ; % column vector, 3D P3 = zeros ( 3, 1 ) ; % column vector, 3D P4 = zeros ( 3, 1 ) ; % column vector, 3D A = zeros ( 3, 1 ) ; % column vector, 3D B = zeros ( 3, 1 ) ; % column vector, 3D % /* --------------------- global for dist_3D_2_segments ------------------ */ % /* --------------------- global for dist_3D_2_segments ------------------ */ PO = zeros (3,1) ; %* -------------- mid-point of P1, P2 -------------- */ U = zeros (3,1) ; %* orthogonal basis { U, V, N } for plane through P0 */ V = zeros (3,1) ; %* orthogonal basis { U, V, N } for plane through P0 */ N = zeros (3,1) ; %* orthogonal basis { U, V, N } for plane through P0 */ P5 = zeros (3,1) ; %* orthogonal projection of P3,P4 onto plane thru P0 */ P6 = zeros (3,1) ; %* orthogonal projection of P3,P4 onto plane thru P0 */
59

% /* ---------------------- Ch 1 : begin with random data --------------- */ % /* ---------------------- Ch 1 : begin with random data --------------- */ sc = set_tube ( idebug, data_dim, ... n_tube, xlo,xhi,ylo,yhi,zlo,zhi,hlo,hhi,rlo,rhi, ... filo,fihi, theta_lo, theta_hi, random_seed ) ; % /* ------- Ch 2 : pre-processing : sort in x, link next 3 in y,z ------- */ % /* ------- Ch 2 : pre-processing : sort in x, link next 3 in y,z ------- */ %x_sort_lst = zeros ( 1, n_tube ) ; % /* ------------------------------------------------------------------------- % current version : linear sort % usage : x_sort_lst( sorted_by_x_in_increasing_order ) = original_index % ---------------------------------------------------------------------- */ x_sort_lst = linear_sort ( idebug, n_tube, sc ) ; %fprintf('\n Calculate dist of EACH pair ... \n') ; n_pair = 0 ; %dist_matrix=NaN(n_tube); connect_matrix=[]; % /* -------------------------------------------------------------------- */ for i1 = 1 : n_tube-1 % /* ----------------------------------------------------- % i1, j1 : increasing_order in x % i , j : original indices % ---------------------------------------------------- */ i = x_sort_lst(i1) ; for j1 = i1+1 : n_tube j = x_sort_lst(j1) ; % /* ------------ very good that having sorted by x-coordinate --- */ % /* ------------ very good that having sorted by x-coordinate --- */ if ( j1 > i1 ) % Calculate the distance of the center of i1 and j1 distance_sq_between_centers = (sc(i,1)-sc(j,1))^2+(sc(i,2)-sc(j,2))^2+(sc(i,3)-sc(j,3))^2; if distance_sq_between_centers > distance_sq_between_centers_threshold dist = inf; cluster_threshold = 0; else
60
% /* --- always true that angle phi is from -pi/2 to pi/2 --- */ % /* ------------------------------------- line segment 1 --- */ % /* --- P1, P2 : bottom and top disc centers on tube i --- */ cosi6=cos(sc(i,6)); cosi7=cos(sc(i,7)); sini6=sin(sc(i,6)); sini7=sin(sc(i,7)); nix=cosi6*cosi7; % x-component of unit vector of i tube niy=cosi6*sini7; % y-component of unit vector of i tube niz=sini6; % z-component of unit vector of i tube half_l_i=sc(i,4)/2; % Half length of tube i P2(1) = sc(i,1) + half_l_i*nix ; P2(2) = sc(i,2) + half_l_i*niy ; P2(3) = sc(i,3) + half_l_i*niz ; P1(1) = sc(i,1)*2 - P2(1) ; P1(2) = sc(i,2)*2 - P2(2) ; P1(3) = sc(i,3)*2 - P2(3) ; % /* ------------------------------------- line segment 2 --- */ % /* --- P3, P4 : bottom and top disc centers on tube j --- */ cosj6=cos(sc(j,6)); cosj7=cos(sc(j,7)); sinj6=sin(sc(j,6)); sinj7=sin(sc(j,7)); njx=cosj6*cosj7; % x-component of unit vector of i tube njy=cosj6*sinj7; % y-component of unit vector of i tube njz=sinj6; % z-component of unit vector of i tube half_l_j=sc(i,4)/2; % Half length of tube i P4(1) = sc(j,1) + half_l_j*njx ; P4(2) = sc(j,2) + half_l_j*njy ; P4(3) = sc(j,3) + half_l_j*njz ; P3(1) = sc(j,1)*2 - P4(1) ; P3(2) = sc(j,2)*2 - P4(2) ; P3(3) = sc(j,3)*2 - P4(3) ; % /* ------------------------------------------------------------- */ dist = dist_3D_2_segments ( idebug, P1,P2,P3,P4,A,B ); % dist_matrix(i1,j1)=dist; cos_theta_ij=nix*njx+niy*njy+niz*njz; cluster_threshold=sc(i,5) + sc(j,5) + Te; % end if dist < cluster_threshold connect_matrix=[connect_matrix;[i1,j1]]; end
61

end % /* ---------------------- done for tube pair (i,j) ----------- */ end %/* --- inner loop over tube j1 --- */ end % /* --- outer loop over tube i1 --- */ % Kurt Lin's code starts here %[connect_1,connect_2]=find(dist_matrix < cluster_threshold); %dist_matrix(79,107) %dist_matrix(107,134) %connect_matrix=[connect_1,connect_2]; connect_1=connect_matrix(:,1); connect_2=connect_matrix(:,2); n_connect_pairs=size(connect_1,1); tube_cluster=(-1)*ones(n_tube,1); cluster=[]; cluster_label=0; while ~isempty(connect_matrix) cluster_set=connect_matrix(1,:); connect_matrix(1,:)=[]; continue_flag=1; while continue_flag ~= 0 size(cluster_set,2); %cluster_set=cluster_set %pause n_cluster_set=size(cluster_set,2); cluster_set_new=[]; for i=1:n_cluster_set %Leftover=connect_matrix(1:3,:) index_col_1=find(connect_matrix(:,1)==cluster_set(i)); if ~isempty(index_col_1) for j=1:size(index_col_1,1) if isempty(find(cluster_set==connect_matrix(index_col_1(j),2))) cluster_set_new=[cluster_set_new,connect_matrix(index_col_1(j),2)]; end end connect_matrix(index_col_1,:)=[]; continue_1(i)=1; else continue_1(i)=0; end %Leftover=connect_matrix(1:3,:) index_col_2=find(connect_matrix(:,2)==cluster_set(i)); %if ~isempty(index_col_2)
62

% whatifound=connect_matrix(index_col_2,2) %end if ~isempty(index_col_2) for j=1:size(index_col_2,1) %Leftover=connect_matrix(1:index_col_2(j),:)' if isempty(find(cluster_set==connect_matrix(index_col_2(j),1))) cluster_set_new=[cluster_set_new,connect_matrix(index_col_2(j),1)]; end end connect_matrix(index_col_2,:)=[]; continue_2(i)=1; else continue_2(i)=0; end end cluster_set=[cluster_set,cluster_set_new]; %Leftover=connect_matrix(1:20,:)' continue_flag_1=sum(continue_1); continue_flag_2=sum(continue_2); continue_flag=continue_flag_1+continue_flag_2; %pause if continue_flag==0 %n_cluster_set=size(cluster_set,2); cluster_label=cluster_label+1; %cluster=[cluster;n_cluster_set]; %if n_cluster_set==69 % cluster_set=cluster_set % cluster_label=cluster_label %end for k=1:n_cluster_set tube_cluster(cluster_set(k))=cluster_label; end end end %pause end % Put the size of each cluster in an array number_of_cluster=cluster_label; for i=1:number_of_cluster cluster=[cluster;size(find(tube_cluster==i),1)]; end % Find largest cluster
63

[largest_cluster,n_max_cluster]=max(cluster); % Check percolation (3-D) x_largest_cluster_min=xhi; x_largest_cluster_max=xlo; y_largest_cluster_min=yhi; y_largest_cluster_max=ylo; z_largest_cluster_min=zhi; z_largest_cluster_max=zlo; for i=1:n_tube i_sorted=x_sort_lst(i); if tube_cluster(i)==n_max_cluster x1=sc(i_sorted,1) - 0.5*sc(i_sorted,4)*cos(sc(i_sorted,6))*cos(sc(i_sorted,7)); if x1 < x_largest_cluster_min x_largest_cluster_min=x1; end if x1 > x_largest_cluster_max x_largest_cluster_max=x1; end x2=sc(i_sorted,1) + 0.5*sc(i_sorted,4)*cos(sc(i_sorted,6))*cos(sc(i_sorted,7)); if x2 < x_largest_cluster_min x_largest_cluster_min=x2; end if x2 > x_largest_cluster_max x_largest_cluster_max=x2; end %output=[i_sorted,x1,x2,x_largest_cluster_max] %pause y1=sc(i_sorted,2) - 0.5*sc(i_sorted,4)*cos(sc(i_sorted,6))*sin(sc(i_sorted,7)); if y1 < y_largest_cluster_min y_largest_cluster_min=y1; end if y1 > y_largest_cluster_max y_largest_cluster_max=y1; end y2=sc(i_sorted,2) + 0.5*sc(i_sorted,4)*cos(sc(i_sorted,6))*sin(sc(i_sorted,7)); if y2 < y_largest_cluster_min y_largest_cluster_min=y2; end if y2 > y_largest_cluster_max y_largest_cluster_max=y2; end z1=sc(i_sorted,3) - 0.5*sc(i_sorted,4)*sin(sc(i_sorted,6)); if z1 < z_largest_cluster_min z_largest_cluster_min=z1; end
64

if z1 > z_largest_cluster_max z_largest_cluster_max=z1; end z2=sc(i_sorted,3) + 0.5*sc(i_sorted,4)*sin(sc(i_sorted,6)); if z2 < z_largest_cluster_min z_largest_cluster_min=z2; end if z2 > z_largest_cluster_max z_largest_cluster_max=z2; end end end x_percolation=0; if (x_largest_cluster_max > (xhi-wall_threshold))&(x_largest_cluster_min < (xlo+wall_threshold)) x_percolation=1; end y_percolation=0; if (y_largest_cluster_max > (yhi-wall_threshold))&(y_largest_cluster_min < (ylo+wall_threshold)) y_percolation=1; end z_percolation=0; if (z_largest_cluster_max > (zhi-wall_threshold))&(z_largest_cluster_min < (zlo+wall_threshold)) z_percolation=1; end percolation_flag=zeros(1,3); percolation_cluster_size=zeros(1,3); percolation_cluster_size(1)=largest_cluster; if x_percolation==1|y_percolation==1|z_percolation==1 %if x_percolation==1|y_percolation==1 %(For thin plate, only x and y are considered) percolation_flag(1)=1; % percolation_cluster_size(1)=largest_cluster; end % Find 2nd lagest cluster cluster_takeaway_max=cluster; cluster_takeaway_max(n_max_cluster)=0; [second_largest_cluster,n_second_max_cluster]=max(cluster_takeaway_max); % Check percolation x_2nd_largest_cluster_min=xhi; x_2nd_largest_cluster_max=xlo; y_2nd_largest_cluster_min=yhi; y_2nd_largest_cluster_max=ylo;
65
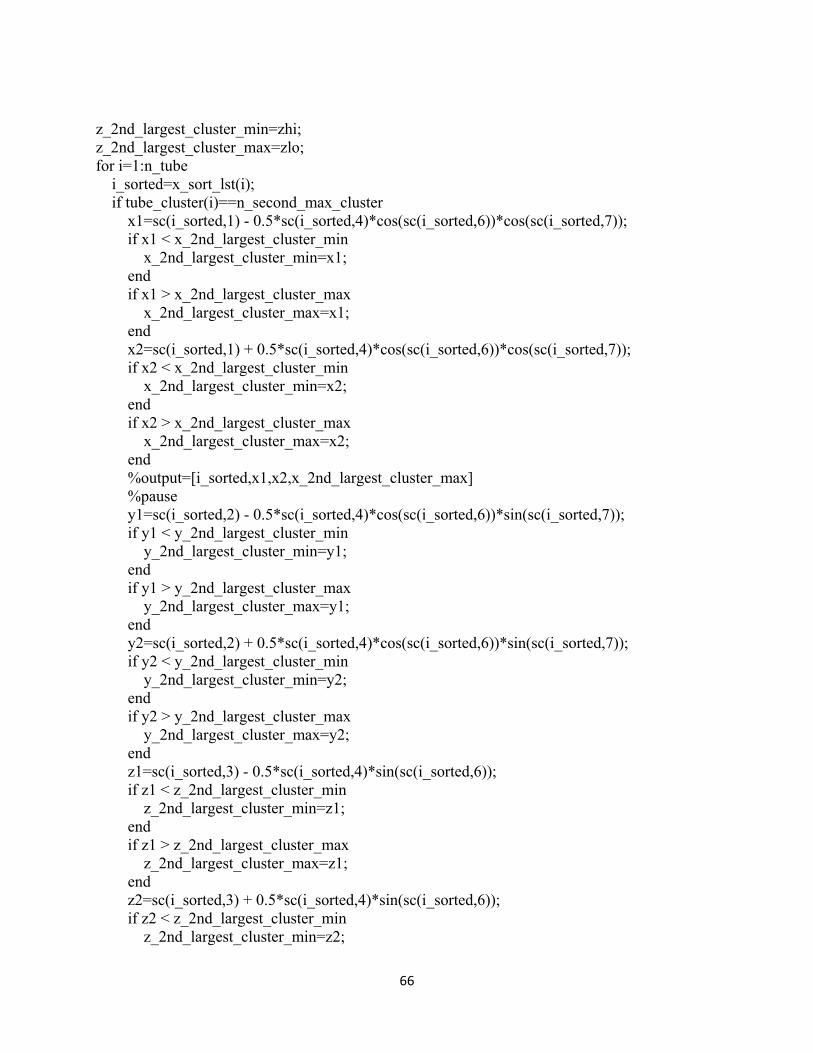
z_2nd_largest_cluster_min=zhi; z_2nd_largest_cluster_max=zlo; for i=1:n_tube i_sorted=x_sort_lst(i); if tube_cluster(i)==n_second_max_cluster x1=sc(i_sorted,1) - 0.5*sc(i_sorted,4)*cos(sc(i_sorted,6))*cos(sc(i_sorted,7)); if x1 < x_2nd_largest_cluster_min x_2nd_largest_cluster_min=x1; end if x1 > x_2nd_largest_cluster_max x_2nd_largest_cluster_max=x1; end x2=sc(i_sorted,1) + 0.5*sc(i_sorted,4)*cos(sc(i_sorted,6))*cos(sc(i_sorted,7)); if x2 < x_2nd_largest_cluster_min x_2nd_largest_cluster_min=x2; end if x2 > x_2nd_largest_cluster_max x_2nd_largest_cluster_max=x2; end %output=[i_sorted,x1,x2,x_2nd_largest_cluster_max] %pause y1=sc(i_sorted,2) - 0.5*sc(i_sorted,4)*cos(sc(i_sorted,6))*sin(sc(i_sorted,7)); if y1 < y_2nd_largest_cluster_min y_2nd_largest_cluster_min=y1; end if y1 > y_2nd_largest_cluster_max y_2nd_largest_cluster_max=y1; end y2=sc(i_sorted,2) + 0.5*sc(i_sorted,4)*cos(sc(i_sorted,6))*sin(sc(i_sorted,7)); if y2 < y_2nd_largest_cluster_min y_2nd_largest_cluster_min=y2; end if y2 > y_2nd_largest_cluster_max y_2nd_largest_cluster_max=y2; end z1=sc(i_sorted,3) - 0.5*sc(i_sorted,4)*sin(sc(i_sorted,6)); if z1 < z_2nd_largest_cluster_min z_2nd_largest_cluster_min=z1; end if z1 > z_2nd_largest_cluster_max z_2nd_largest_cluster_max=z1; end z2=sc(i_sorted,3) + 0.5*sc(i_sorted,4)*sin(sc(i_sorted,6)); if z2 < z_2nd_largest_cluster_min z_2nd_largest_cluster_min=z2;
66

end if z2 > z_2nd_largest_cluster_max z_2nd_largest_cluster_max=z2; end end end x_percolation=0; if (x_2nd_largest_cluster_max > (xhi-wall_threshold))&(x_2nd_largest_cluster_min < (xlo+wall_threshold)) x_percolation=1; end y_percolation=0; if (y_2nd_largest_cluster_max > (yhi-wall_threshold))&(y_2nd_largest_cluster_min < (ylo+wall_threshold)) y_percolation=1; end z_percolation=0; if (z_2nd_largest_cluster_max > (zhi-wall_threshold))&(z_2nd_largest_cluster_min < (zlo+wall_threshold)) z_percolation=1; end % percolation_cluster_size(2)=second_largest_cluster; if x_percolation==1|y_percolation==1|z_percolation==1 %if x_percolation==1|y_percolation==1 %(For thin plate, only x and y are considered) percolation_flag(2)=1; % percolation_cluster_size(2)=second_largest_cluster; end % Find 3rd lagest cluster cluster_takeaway_max(n_second_max_cluster)=0; [third_largest_cluster,n_third_max_cluster]=max(cluster_takeaway_max); % Check percolation x_3rd_largest_cluster_min=xhi; x_3rd_largest_cluster_max=xlo; y_3rd_largest_cluster_min=yhi; y_3rd_largest_cluster_max=ylo; z_3rd_largest_cluster_min=zhi; z_3rd_largest_cluster_max=zlo; for i=1:n_tube i_sorted=x_sort_lst(i); if tube_cluster(i)==n_third_max_cluster x1=sc(i_sorted,1) - 0.5*sc(i_sorted,4)*cos(sc(i_sorted,6))*cos(sc(i_sorted,7)); if x1 < x_3rd_largest_cluster_min x_3rd_largest_cluster_min=x1; end
67

if x1 > x_3rd_largest_cluster_max x_3rd_largest_cluster_max=x1; end x2=sc(i_sorted,1) + 0.5*sc(i_sorted,4)*cos(sc(i_sorted,6))*cos(sc(i_sorted,7)); if x2 < x_3rd_largest_cluster_min x_3rd_largest_cluster_min=x2; end if x2 > x_3rd_largest_cluster_max x_3rd_largest_cluster_max=x2; end %output=[i_sorted,x1,x2,x_3rd_largest_cluster_max] %pause y1=sc(i_sorted,2) - 0.5*sc(i_sorted,4)*cos(sc(i_sorted,6))*sin(sc(i_sorted,7)); if y1 < y_3rd_largest_cluster_min y_3rd_largest_cluster_min=y1; end if y1 > y_3rd_largest_cluster_max y_3rd_largest_cluster_max=y1; end y2=sc(i_sorted,2) + 0.5*sc(i_sorted,4)*cos(sc(i_sorted,6))*sin(sc(i_sorted,7)); if y2 < y_3rd_largest_cluster_min y_3rd_largest_cluster_min=y2; end if y2 > y_3rd_largest_cluster_max y_3rd_largest_cluster_max=y2; end z1=sc(i_sorted,3) - 0.5*sc(i_sorted,4)*sin(sc(i_sorted,6)); if z1 < z_3rd_largest_cluster_min z_3rd_largest_cluster_min=z1; end if z1 > z_3rd_largest_cluster_max z_3rd_largest_cluster_max=z1; end z2=sc(i_sorted,3) + 0.5*sc(i_sorted,4)*sin(sc(i_sorted,6)); if z2 < z_3rd_largest_cluster_min z_3rd_largest_cluster_min=z2; end if z2 > z_3rd_largest_cluster_max z_3rd_largest_cluster_max=z2; end end end x_percolation=0; if (x_3rd_largest_cluster_max > (xhi-wall_threshold))&(x_3rd_largest_cluster_min < (xlo+wall_threshold))
68

x_percolation=1; end y_percolation=0; if (y_3rd_largest_cluster_max > (yhi-wall_threshold))&(y_3rd_largest_cluster_min < (ylo+wall_threshold)) y_percolation=1; end z_percolation=0; if (z_3rd_largest_cluster_max > (zhi-wall_threshold))&(z_3rd_largest_cluster_min < (zlo+wall_threshold)) z_percolation=1; end % percolation_cluster_size(3)=third_largest_cluster; if x_percolation==1|y_percolation==1|z_percolation==1 %if x_percolation==1|y_percolation==1 %(For thin plate, only x and y are considered) percolation_flag(3)=1; % percolation_cluster_size(3)=third_largest_cluster; end fid=fopen('main_all_output.txt','a'); %random_seed=random_seed %n_tube=n_tube %percolation_flag=percolation_flag %percolation_cluster_size=percolation_cluster_size %fprintf(fid,'n_tube = %6d random_seed = %6d\n',n_tube,random_seed); fprintf(fid,'%6d %6d %6d %6d %6d %6d\n',n_tube,random_seed,percolation_flag,percolation_cluster_size(1)); fclose(fid); return ; function sc = set_tube ( idebug, data_dim, n_tube, ... xlo, xhi, ylo, yhi, zlo, zhi, ... hlo, hhi, rlo, rhi, filo, fihi, theta_lo, theta_hi, random_seed ) % float ran4(long *idum) ; % long idum ; % FILE *fp_out_tube ; % fprintf('\n To check_and_remove tubes extending out in six directions\n\n'); % fprintf(' 1 : yes, Else ( nonzero ) not, \n\n') ; % fprintf('\t Answer in condensed way, as follows : \n') ; % fprintf(' 111111 : yes, in all six directions : \n') ; % fprintf(' 222222 : No, in none of the six directions : \n') ; % fprintf(' 121212 : make sure 0 < x 0 < y 0 < z \n') ; % fprintf(' 212121 : make sure x < 1 y < 1 z < 1 \n') ;
69

% fprintf(' 112222 : make sure 0 < x < 1 \n') ; % chk = input('\n Enter a six-digit number to check some, check all, check none : \n'); chk=222222; % ------------------------------------------------------------------- % sc ( 1:n_tube, 1 ) are x-coordinate of the center % sc ( 1:n_tube, 2 ) are y-coordinate of the center % sc ( 1:n_tube, 3 ) are z-coordinate of the center % sc ( 1:n_tube, 4 ) are height of the tube % sc ( 1:n_tube, 5 ) are radius of the two tube faces % sc ( 1:n_tube, 6 ) are latitude angle, assume 0 to pi/2 % sc ( 1:n_tube, 7 ) are longitude angle, assume 0 to pi*2 % -------------------------------------------------------------------- rand('twister',random_seed); % Set random seed sc = zeros( n_tube, 7 ) ; % --------------------------------- examine the random data ---------- for i = 1 : n_tube i_random = 0 ; chk_valid = 0 ; sc(i,:) = rand(1,7); while ( chk_valid ~= 1 ) i_random = i_random + 1 ; for j = 1 : 7 if ( sc(i,j) < 0.0) fprintf(' sc(%d,%d) = %e ?\n',i,j,sc(i,j));pause end if ( sc(i,j) > 1.0) fprintf(' sc(%d,%d) = %e ?\n',i,j,sc(i,j));pause end end sc(i,1) = xlo + ( xhi - xlo )*sc(i,1) ; sc(i,2) = ylo + ( yhi - ylo )*sc(i,2) ; sc(i,3) = zlo + ( zhi - zlo )*sc(i,3) ; sc(i,4) = hlo + ( hhi - hlo )*sc(i,4) ; sc(i,5) = rlo + ( rhi - rlo )*sc(i,5) ; sc(i,6) = filo + ( fihi - filo )*sc(i,6) ; % latitude angle sc(i,7) = theta_lo + ( theta_hi - theta_lo)*sc(i,7) ; % longitude angle
70

if ( data_dim == 2 ) sc(i,3) = zlo ; % old sc(i,6) = pi/2 ; sc(i,6) = 0.0 ; % latitude angle end % ------------------------ must pause to check --------------------- % ------------------------ must pause to check --------------------- chk_valid = 1 ; if ( chk_valid < 1 ) sc(i,1:7) = rand(1,7) ; end end % --- end while --- end % --- end while --- return ; % ------------------- current version : linear sort --- function x_sort_lst = linear_sort ( idebug, n_tube, sc ) i_select = 0 ; mark_lst = zeros ( 1, n_tube ) ; %fprintf('\n --- Start sorting by x-coordinates ... \n') ; for i_least = 1 : n_tube % -------- assign an initial candicate, then comapre and update --- for k = 1 : n_tube if ( mark_lst(k) == 0 ) i_select = k ; break ; end end for j = 1 : n_tube if ( mark_lst(j) == 0 ) if ( sc(j,1) < sc(i_select,1) ) i_select = j ; end end end
71

x_sort_lst(i_least ) = i_select ; mark_lst (i_select) = 1 ; end return ; %* -------------------------------------------------------------------- % Input : % Four points in space % P1(x1,y1,z1), % P2(x2,y2,z2), % P3(x3,y3,z3), % P4(x4,y4,z4), % Output : the distance bewteen two line segments P1_P2, P3_P4, % -------------------------------------------------------------------- */ function dist_3 = dist_3D_2_segments ( idebug, P1, P2, P3, P4, A , B ) % int i, k, itmp, ierr ; % double p, q, r, s, ax, ay, bx, by, dist_2, l_half, dist_common, t3,t4, tmp ; % double ratio_1, ratio_2 ; % extern double *P5, *P6, *PO, *N, *U, *V ; % /* ------------------------------------------------------------------------ % PO : mid-point of segment P1_P2 % H : the plane passing through PO with normal N[] % P5 : orthogonal projection of P3 onto H, with relative coordinate (p,q) % P6 : orthogonal projection of P4 onto H, with relative coordinate (r,s) % U : orthogonal basis { U, V, N } for plane through P0 % V : orthogonal basis { U, V, N } for plane through P0 % N : orthogonal basis { U, V, N } for plane through P0 % ---------------------------------------------------------------------- */ % /* ---------- global allocated in main() ------- */ % /* ---------- global allocated in main() ------- */ % /* ---------------------------------------------- mid-point of P1, P2 --- */ PO = ( P1 + P2 ) /2 ; P1 = P1 - PO ; % local coordinate : shift origin to P0 P2 = P2 - PO ; % local coordinate : shift origin to P0 P3 = P3 - PO ; % local coordinate : shift origin to P0 P4 = P4 - PO ; % local coordinate : shift origin to P0 U = P2 ; % U = (P2-P1)/2 tmp = sqrt ( (U')*U ) ;
72

U = U /tmp ; % now a unit vector, done l_half = tmp ; % half length of P1_P2 V = P4 - P3 ; tmp = sqrt ( (V')*V ) ; V = V /tmp ; % now a unit vector, done N = tensor_3D(U,V) ; % N = P2_P1 x P3_P4 as normal to plane through P1 tmp = sqrt ( (N')*N ) ; if ( tmp > 1.0e-12 ) N = N /tmp ; % now a unit vector, done end V = tensor_3D ( N, U ) ; % (re)generate V tmp = sqrt ( (V')*V ) ; V = V /tmp ; % now a unit vector, done % ---------------------------- always check ------- t3 = (N')*P3 ; t4 = (N')*P4 ; % ------------------------------------------ always check ------------ t3 = 0.5*( t3 + t4 ) ; t4 = t3 ; dist_common = abs(t3) ; P5 = P3 - t3*N ; % P5-PO = P3-PO - t*N P6 = P4 - t4*N ; % P6-PO = P4-PO - t*N % ------------------------------------------- always check ------------ p = P5'*U ; % p = < P5-PO,U > q = P5'*V ; % q = < P5-PO,U > r = P6'*U ; % r = < P6-PO,V > s = P6'*V ; % s = < P6-PO,V > [ax ay bx by dist_2] = dist_2D_2_segments ( idebug, l_half, p, q, r, s ) ; dist_3 = sqrt ( dist_2*dist_2 + dist_common*dist_common ) ; % --------------------------------------------------------- bug here --- B = PO + bx*U + by*V + t3*N ; A = PO + ax*U + ay*V ; % ------------------------------------------------ missing was below ---
73

P1 = P1 + PO ; P2 = P2 + PO ; P3 = P3 + PO ; P4 = P4 + PO ; % ------------------------------- always check -------------- % ------------------------------- always check -------------- return ; % --------------------------------------------------------------------- % ------------------------------ 2D configuration --------------------- % --------------------------------------------------------------------- % Input : two line segments P1_P2 and P5_P6, with % % P1 = ( -l_half, 0 ) default % P2 = ( l_half, 0 ) default % P5 = ( p , q ) input % P6 = ( r , s ) input % % with q <= s, by construction of u,v in main % Output : % *dist_2 = shortest distance between P1_P2 and P5_P6 % A = (ax,ay) on line segment P1_P2 % B = (bx,by) on line segment P5_P6 % where the shortest dist occurs at A,B % % Algorithm : re-scale to P1=(-1,0), P2=(1,0), ... for code efficiency % --------------------------------------------------------------------- function [ax ay bx by dist_2] = dist_2D_2_segments ( idebug, l_half, p,q,r,s ) % /* ---------------------------------------------------------------------- % Reduction : P1 = ( -1 , 0 ), P2 = ( 1 , 0 ), % P5 = ( p/l_half, q/l_half ), P6 = ( r/l_half, s/l_half ) % ---------------------------------------------------------------------- */ p_sav = p ; q_sav = q ; r_sav = r ; s_sav = s ; p = p /l_half ; % OK for C, passed by value q = q /l_half ; % OK for C, passed by value r = r /l_half ; % OK for C, passed by value
74

s = s /l_half ; % OK for C, passed by value if ( ( p >= 1.0 ) && ( r >= 1.0 ) ) subcase= 10; elseif ( ( p <= -1.0 ) && ( r <= -1.0 ) ) subcase= 20; elseif ( ( abs(p) <= 1.0 ) && ( abs(r) <= 1.0 ) ) subcase= 30; elseif ( ( min(p,r) < 1.0 ) && ( 1.0 < max(p,r) ) ) subcase= 40; elseif ( ( min(p,r) < -1.0 ) && ( -1.0 < max(p,r) ) ) subcase= 50; else subcase = -1 ; pause end switch ( subcase ) case 10 % --- P5, P6 are both to the right of line x= 1 --- % ----- A = P2 */ ax = 1.0 ; ay = 0.0 ; [bx by dist_2] = dist_2D_pt_to_segment ( 1.0, 0.0, p, q, r, s ) ; case 20 % --- P5, P6 are both to the left of line x=-1 --- % ----- A = P1 */ ax = -1.0 ; ay = 0.0 ; [bx by dist_2] = dist_2D_pt_to_segment (-1.0, 0.0, p, q, r, s ) ; case 30 % --- P5, P6 are both between lines x=1, x=-1 --- % --- recall q < s, always --- */ if ( 0.0 < q ) % --- (p,q)=P5 is closest to segment P1_P2, on plane H --- % --- A = (p,0), B = P5 = (p,q) --- */ ax = p ; ay = 0.0 ; bx = p ; by = q ; dist_2 = q ; elseif ( s < 0.0 ) % --- (r,s)=P6 is closest to segment P1_P2, on plane H --- % --- A = (r,0), B = P6 = (r,s) --- */
75

ax = r ; ay = 0.0 ; bx = r ; by = s ; dist_2 = -s ; else % --- q < 0.0 < s , segments P1_P2 and P5_P6 intersect --- ay = 0.0 ; % A is on P1_P2 ax = ( p*s-q*r ) / ( s - q ) ; % some math bx = (ax) ; % B = A by = 0.0 ; % B = A dist_2 = 0.0 ; end case 40 % --- segment P5_P6 intersects with line x=1, and also x=-1 ? [ax ay bx by dist_2] = dist_2D_case_40 ( p,q, r,s ); case 50 % --- segment P5_P6 intersects with line x=-1, and also x=1 ? % --- apply reflection wrt x=0 and appeal to case 40 --- [ax ay bx by dist_2] = dist_2D_case_40 (-p,q,-r,s ); ax = -ax ; bx = -bx ; end % --------------------------------- re-scale ---------------- ax = ax*l_half ; ay = ay*l_half ; bx = bx*l_half ; by = by*l_half ; dist_2 = dist_2*l_half ; % /* --------------------------------------------------------- % -------------- prefer the next block, for accuracy % p *= l_half ; % q *= l_half ; % r *= l_half ; % s *= l_half ; % ------------------------------------------------------------ p = p_sav ; q = q_sav ; r = r_sav ;
76

s = s_sav ; % /* --------------------------------------------- always check ----- return ; function N = tensor_3D ( U, V ) N(3,1) = U(1,1)*V(2,1) - U(2,1)*V(1,1) ; N(1,1) = U(2,1)*V(3,1) - U(3,1)*V(2,1) ; N(2,1) = U(3,1)*V(1,1) - U(1,1)*V(3,1) ; return ; % ------------------------------------------------------------------- % ---------------------------- 2D configuration --------------------- % ------------------------------------------------------------------- % Input : point P and line segment A_B, with % P = ( px, py ) % A = ( ax, ay ) % B = ( bx, by ) % Output : distance from P to A_B % Algorithm : transform to case P=(0,0), ... for code efficiency % Reduction : P = (0,0), A = (ax-px,ay-py), B = (bx-px,by-py) % Projection of P(0,0) to line A_B with A(ax,ay) B(bx,by) is Q(qx,qy), by % choosing n = (nx,ny), a unit normal to line A_B % then % dist = | nx*ax+ny*ay | or | nx*bx+ny*by | % and % qx = nx/(nx*nx+ny*ny)*(nx*ax+ny*ay) ; % qy = ny/(nx*nx+ny*ny)*(nx*ax+ny*ay) ; % transform back % ( qx, qy ) += ( px, py ) % ---------------------------------------------------------------------- function [qx qy dist] = dist_2D_pt_to_segment ( px, py, ax, ay, bx, by ) global idebug ; % int i, itmp, numerical_chk, local_debug, ierr ;
77

% double nx, ny, ab_x, ab_y, tmp1, tmp2, x_chk, y_chk ; % --------------------------------------------------------------------- local_debug = 0 ; ab_x = bx - ax ; ab_y = by - ay ; ax = ax - px ; % OK for C, passed by value ay = ay - py ; % OK for C, passed by value bx = bx - px ; % OK for C, passed by value by = by - py ; % OK for C, passed by value % ---------------------------------------------------------------------- dist = sqrt ( ab_x*ab_x + ab_y*ab_y ) ; % temporary usage nx = -ab_y/dist ; ny = ab_x/dist ; tmp1 = ax*ab_x + ay*ab_y ; % < A-P, B-A > % ------ bug was below --- % ------ bug was below --- if ( tmp1 >= ( 0.0 - 1.0e-10 ) ) % --- exterior angle(A-P,B-A) <= 90, interior >= 90, then Q = A --- dist = sqrt ( ax*ax + ay*ay ) ; qx = ax + px ; qy = ay + py ; else % ----------- angle(A-P,B-A) <= 90 --- tmp2 = bx*ab_x + by*ab_y ; % < B-P, B-A > if ( tmp2 <= ( 0.0 + 1.0e-10 ) ) % --- angle(B-P,B-A) >= 90_degree, then Q = B --- dist = sqrt ( bx*bx + by*by ) ; qx = bx + px ; qy = by + py ; else % --- triangle PAB is acute % ------------------------------- case : Q is bewteen A, B --- dist = nx*ax + ny*ay ; % temporary usage for < n, a > qx = nx*(dist) + px ; qy = ny*(dist) + py ; dist = abs(dist) ;
78

end end % -------------------------------------- check ------------------ % ----------------------- numerical verification ------ return ; % ------------------------------------------------------------------------- % Background : P1 = ( -1, 0 ), P2 = ( 1, 0 ), on plane % Input : P5 = ( p, q ), P6 = ( r, s ) % Output : dist ( P1_P2, P5_P6 ) % A (ax,ay) on P1_P2 % B (bx,by) on P5_P6 % such that % dist ( A, B ) = dist ( P1_P2, P5_P6 ) % ------------------------------------------------------------------------- function [ax ay bx by dist_2] = dist_2D_case_40 ( p, q, r, s ) global idebug ; % int i, j, subcase=-1, itmp, numerical_chk, ierr_1=0, ierr_2=0 ; % double b_star, n1, n2, x1_chk, y1_chk, x2_chk, y2_chk, tmp ; if ( ( r < 1.0 ) && ( 1.0 < p ) && ( 0.0 < q ) ) %* --- case 4a ------- segment P5_P6 intersects with line x=1 --- %* ----------------------------------------------------------------- % dist ( P1_P2, P5_P6 ) = dist ( P1_P2, P5_Bstar ) % = dist ( P2, P5_Bstar ) % ----------------------------------------------------------------- subcase = 41 ; % bug b_star = ( (p-1)*s - (1-r)*q ) / (p-r) ; b_star = ( (p-1)*s + (1-r)*q ) / (p-r) ; ax = 1.0 ; % i.e., A = P2 ay = 0.0 ; [bx by dist_2] = dist_2D_pt_to_segment (1.0,0.0,p,q,1.0,b_star) ; elseif ( ( p < 1.0 ) && ( 1.0 < r ) && ( s < 0.0 ) ) % --- recall q < s, always --- % --- case 4h ------- segment P5_P6 intersects with line x=1 ---
79

% ----------------------------------------------------------------- % dist ( P1_P2, P5_P6 ) = dist ( P1_P2, Bstar_P6 ) % = dist ( P2, Bstar_P6 ) % ----------------------------------------------------------------- subcase = 42 ; % bug b_star = ( (1-p)*s - (r-1)*q ) / (r-p) ; b_star = ( (1-p)*s + (r-1)*q ) / (r-p) ; ax = 1.0 ; % i.e., A = P2 ay = 0.0 ; [bx by dist_2] = dist_2D_pt_to_segment (1.0,0.0,1.0,b_star,r,s) ; elseif ( ( p < 1.0 ) && ( 1.0 < r ) && ( 0.0 < q ) ) % --- case 4b ------- segment P5_P6 intersects with line x= 1 --- % -------------------------------------------------------------------- % dist ( P1_P2, Bstar_P6 ) = dist ( P2, Bstar_P6 ) % s.t. dist ( P1_P2, P5_P6 ) = dist ( P1_P2, P5_Bstar ) OK % = dist ( P1_P2, P5 ) wrong % i.e., = dist ( A , B ) wrong % with A=(p,0) B=P5 wrong % ------------------------------------------------------------------- % ------------------- was bug -------- if ( p >= -1.0 ) subcase = 43 ; % --------------- A=(p,0) B=P5 --- bx = p ; by = q ; ax = bx ; ay = 0.0 ; dist_2 = by ; else subcase = 44 ; % --------------- A=P1, B=? --- ax = -1.0 ; ay = 0.0 ; b_star = q + ( s - q ) / ( r - p ) * ( -1.0 - p ) ; [bx by dist_2] = dist_2D_pt_to_segment(-1.0,0.0,p,q,-1.0,b_star); end elseif ( ( p > 1.0 ) && ( 1.0 > r ) && ( s < 0.0 ) ) % --- case 4g ------- segment P5_P6 intersects with line x= 1 --- % ---------------------------------------------------------------- % dist( P1_P2, P5_P6 ) = dist( P1_P2, Bstar_P6 ) OK % = dist( P1_P2, P6 ) wrong % with B = P6, A = (r,0) wrong % ----------------------------------------------------------------
80

%* ------------------- was bug --------- if ( r >= -1.0 ) subcase = 45 ; bx = r ; by = s ; ax = bx ; ay = 0.0 ; dist_2 = -by ; else subcase = 46 ; ax = -1.0 ; ay = 0.0 ; b_star = q + ( s - q ) / ( r - p ) * ( -1.0 - p ) ; [bx by dist_2] = dist_2D_pt_to_segment(-1.0,0.0,-1.0,b_star,r,s); end elseif ( ( r < 1.0 ) && ( 1.0 < p ) && ( q < 0.0 ) && ( 0.0 < s ) ) % ---------------- bug was here ----- % solve for the intersect (*,0) of the line (p,q)_(r,s) and line y=0 ax = p - q*(r-p)/(s-q) ; %* may be of temporary storage if ( ax > 1.0 ) % ------------------------------------------------------------------ % case 4c : P5_P6 intersects with both lines x=1, y=0, but not P1_P2 % dist( P1_P2, P5_P6 ) = dist( P2, p5_P6 ), with % A = P2, and B in interior of P5_P6, in quadrant I % -------------------------------------------------------------- subcase = 47 ; ax = 1.0 ; ay = 0.0 ; n1 = (q-s)/sqrt((r-p)*(r-p)+(s-q)*(s-q)) ; n2 = (r-p)/sqrt((r-p)*(r-p)+(s-q)*(s-q)) ; dist_2 = n1*(p-1.0)+n2*(q-0.0) ; bx = ax + dist_2*n1 ; by = ay + dist_2*n2 ; dist_2 = abs(dist_2) ; elseif ( ( -1.0 <= ax ) && ( ax <= 1.0 ) ) % ---------------------------------------------------------------- % case 4e : P5_P6 intersects with both lines x=1, y=0, also P1_P2 % dist( P1_P2, P5_P6 ) = dist( A, B ) = 0, since A = B % -------------------------------------------------------------- subcase = 48 ; dist_2 = 0.0 ;
81

ay = 0.0 ; bx = ax ; by = 0.0 ; elseif ( ax < -1.0 ) % ------------------------------------------------------------------ % case 4+ : P5_P6 intersects with both lines x=1, y=0, but not P1_P2 % dist( P1_P2, P5_P6 ) = dist( P1, p5_P6 ), with % A = P1, and B in interior of P5_P6, in quadrant III % -------------------------------------------------------------- subcase = 49 ; ax = -1.0 ; ay = 0.0 ; n1 = (q-s)/sqrt((r-p)*(r-p)+(s-q)*(s-q)) ; n2 = (r-p)/sqrt((r-p)*(r-p)+(s-q)*(s-q)) ; dist_2 = n1*(p-(-1.0))+n2*(q-0.0) ; bx = ax + dist_2*n1 ; by = ay + dist_2*n2 ; dist_2 = abs(dist_2) ; end elseif ( ( p < 1.0 ) && ( 1.0 < r ) && ( q < 0.0 ) && ( 0.0 < s ) ) % ------------------------------------ bug was here ---------------- % solve for the intersect (*,0) of the line (p,q)_(r,s) and line y=0 ax = p - q*(r-p)/(s-q) ; % may be of temporary storage if ( ax > 1.0 ) % ------------------------------------------------------------------ % case 4f : P5_P6 intersects with both lines x=1, y=0, but not P1_P2 % dist( P1_P2, P5_P6 ) = dist( P2, p5_P6 ), with % A = P2, and B in interior of P5_P6, in quadrant IV % -------------------------------------------------------------- subcase = 50 ; ax = 1.0 ; ay = 0.0 ; n1 = (q-s)/sqrt((r-p)*(r-p)+(s-q)*(s-q)) ; n2 = (r-p)/sqrt((r-p)*(r-p)+(s-q)*(s-q)) ; dist_2 = n1*(p-1.0)+n2*(q-0.0) ; bx = ax + dist_2*n1 ; by = ay + dist_2*n2 ; dist_2 = abs(dist_2) ; elseif ( ( -1.0 <= ax ) && ( ax <= 1.0 ) )
82

% ---------------------------------------------------------------- % case 4d : P5_P6 intersects with both lines x=1, y=0, also % the segment P1_P2 % such that % dist( P1_P2, P5_P6 ) = dist( A, B ) % with (A,B) in segment P1_P2, % -------------------------------------------------------------- subcase = 51 ; dist_2 = 0.0 ; ay = 0.0 ; bx = ax ; by = 0.0 ; elseif ( ax < -1.0 ) % ------------------------------------------------------------------ % case 4+ : P5_P6 intersects with both lines x=1, y=0, but not P1_P2 % dist( P1_P2, P5_P6 ) = dist( P1, p5_P6 ), with % A = P1, and B in interior of P5_P6, in quadrant II % -------------------------------------------------------------- subcase = 52 ; ax = -1.0 ; ay = 0.0 ; n1 = (q-s)/sqrt((r-p)*(r-p)+(s-q)*(s-q)) ; n2 = (r-p)/sqrt((r-p)*(r-p)+(s-q)*(s-q)) ; dist_2 = n1*(p-(-1.0))+n2*(q-0.0) ; bx = ax + dist_2*n1 ; by = ay + dist_2*n2 ; dist_2 = abs(dist_2) ; end end %/ return ;
83

REFERENCES
Krishnan, A., Dujardin E, Ebbesen TW, Yianilos PN, and Treacy MMJ (1998), Young’s
modulus of single-walled nanotubes, Phys Rev B, 58(20),14013-14019.
Yu, M.F., B.S.Files, S. Arepalli, and R.S. Ruoff (2000), “Tensile loading of ropes of single wall
carbon nanotubes and their mechanical properties,” Phys Rev Lett, 84(24), 5552-5556.
Sandler, J., M. Shaffer, T. Prasse, W. Bauhofer, K. Schulte, and A.H. Windle
(1999),“ Development of a depersion process for carbon nanotubes in an epoxy matrix and the
resulting electrical properties,” Polymer, 40(21), 5967-5971.
Geng, H., R. Rosen, B.Zheng, H. Shimoda, L. Fleming, and J.Z.Liu (2002), “ Fabrication and
Properties of Composites of Poly (ethylene oxide) and Functionalized Carbon Nanotubes,” Adv
Mater, 14(19),1387-1390.
Subramoney, S.(1998), “Novel nanocarbons, Structure, properties, and potential applications,”
Adv Mater, 10(15),1157-1173.
Kashiwagi, T., E. Grulke, J. Hilding, R. Harris, W. Awad, and J. Douglas (2002), “ Thermal
degradation and flammability properties of poly(propylene)/carbon nanotube composites,”
Macromol Rapid Commu, 2002,23(13), 761-765.
84

Kashiwagi, T., F. Du, J. Douglas, W. Winey, R. Harris, J. Shields (2005), Nanoparticle networks
reduce the flammability of polymer nanocomposites. Nature Mater, 4(12), 928-933.
Bigg, D.M., 1979, Mechanical, thermal, and electrical properties of metal fiber-filled polymer
composites, Polymer. Eng. Sci. 19, 1188-1192.
Hansen, G., 2005, High aspect ratio sub-micron and nano-scale metal filaments, SAMPE J. 41.
24-33.
Li, K., Gao, X.-L., Fielding, J.C. and Benson Tolle, T., 2008, Modeling of electrical conductivity
of nickel nanostrand filled polymer matrix composites, J. Comput. Theoretical Nanoscience, in
press.
Hill, D., Y. Lin, L.W. Qu, A. Kitaygorodskiy, G.W.Connell, L.F.Allard, and Y.P. Sun (2005),
“ Functionalization of carbon nanotubes with derivatized polymide,” Macromol,38(18),7670-
7675.
Thess, A., Lee R., P. Nikolaev, H. Dai, P. Petit, and J. Robert (1996), “ Crystalline ropes of
metallic carbon nanotubes,” Science, 273, 483-487.
Kokai, F.K. Tahahashi, M. Yudasaka, R. Yamada, T. Ichihashi, and S. Iijima (1999). “ Growth
dynamics of single-wall carbon nanotubes synthesized by CO2 laser vaporization,” J.PHYS.
Chem. B, 103(21), 4346-4351.
85

Τοebes, M.L., j.m.p. Van Heeswijk, J.H. Bitter, A. Jos van Dillen, and K. P. de Jong (2004),
“ The influence of oxidation on the texture and the number of oxygen-containing surface groups
of carbon nanofibers,” Carbon, 42(2), 307-322.
Ros, T.G., A. J. Dillen, J.W. Geus, and D.C.Koningsberger (2002), “ Surface oxidation of carbon
nanofibers,” Chem Eur J, 8(5),1151-1162.
Vieira. R., M J. Ledoux, C. Pham-Huu (2004), “Synthesis and charaterisation of carbon
nanofibers prepared using electrospinning,” Synth Met, 138(3), 423-427.
Dandekar, A., R.T.K. Baker, and M.A.Vannice (1998), “ Characterization of activated carbon,
graphitized carbon fibers and synthetic diamond powder using TPD and DRIFTs,” Carbon,
36(12), 1821-1831.
Durkic, T., A. Peric, M. Lausevic, A. Dekanski, O. Neskovic, and M. Veljkovic (1997). “Boron
and phosphorus doped glassy carbon: I Surface properties,” Carbon, 35(10-11), 1567-1572.
Wang, Y., S. Serrano, and J.J.Santiago (2003), “Raman characterization of carbon nanofibers
prepared using electrospinning,” Synth Met, 138(3), 423-427.
Kim. S.U., and K.H.Lee (2004), “ Carbon nanofiber composites for the electrodes of
electrochemical capacitors,” Chem. Phys. Let, 400(1-3), 253-257.
86

Werner, P., R. Verdejo, F. Wollecke, V. Altstadt., J.K.W. Sandler, and M.S.P. Shaffer
(2005),“Carbon Nanofibers Allow Foaming of Semicrystalline Poly(ether ketone),” Adv Mater,
17(23), 2864-2869.
Salimi, A., R.G.Compton, and R. Hallaj (2004), Anal. Biochem., 333, 49-56.
Banks., C.E. and R.G. Compton (2005), “ Exploring the electrocatalytic sites of carbon
nanotubes for NADH detection: an edge plane pyrolytic graphite electrode study.”Analyst,
130(9), 1232-1239.
Rodriguez, N.M., a. Chambers, and R.T.K. Baker (1995), “ Catalytic engineering of carbon
nanostructures,” Langmuir, 11(10), 3862-3864.
Carneiro, O.C., M.S.Kim, J.B.Yim, N.M.Rodriguez, and P.T.K.Baker 92003), “ Growth of
graphit nanofibers from the iron-copper catalyzed decomposition of CO/H2 mixtures,” J. Phys.
Chem.B, 107, 4237-4244.
Zhong, W.H., J. Li, L.R.Xu, J.A.Michel, L.M.Sullivan, and C.M.Lukehart (2004), “Graphitic
arbon nanofiber (GCNF)/polymer materials. I. GCNF/ epoxy monoliths using hexanediamine
linker molecules,” J. Nanosci. Nanotechnol, 4(7), 794.
Thostenson, E.T. and T.W. Chou (2006), “ Processing structure multi-functional property
relationship in carbon nanotube/epoxy composites,” Carbon,44(14),3022-3029.
87

Yang, Z., B. Dong, Y. Huang, L. Liu, F.Y. Yan, and H.L.Li (2005),“ A study on carbon
nanotubes reinforced poly (methyl methacrylate) nanocomposites,” Material Letters, 59, 2128-
2132.
Lau, K.T., M. Lu, C.K. Lam, H.Y. Cheung, F.L.Sheng, and H.L. Li (2005), “ Thermal and
mechanical properties of single-walled carbon nanotubes bundle-reinforced epoxy
nanocomposites: the role of solvent for nanotube dispersion,” Composites Science and
Technology, 65, 719-725.
Shi, Y.J., X. Feng, and H.Y. Wang (2007), “Tribological and mechanical properties of carbon-
nanofiber filled polytetrafluorothylene composites,” J. Appl. Polym. Sci., 104(4), 2430-2437.
Hirai, T., M.H. Islam, M.Takasaki (2007), “Behavior of bending motion of polyurethane film
with carbon nanofiber as electrode,” J. Appl. Phys., 101(5), 53533-53538.
Cho. M.H. and S. Bahadur (2007), “ A study of the thermal, dynamic mechanical, and
tribological properties if polyphenylene sulfide composites reinforced with carbon nanofibers,”
Tribology Lett, 25(3), 237-245.
Hasan, M.M., Y.X.Zhou, and S. Jeelani (2007), “Thermal and tensile properties of aligned
carbon nanofiber reinforced polypropylene,” Mater. Lett., 61(4-5), 1134-1136.
88

Kobayashi, S. and W. Kawai (2007), “ Development of carbon nanofiber reinforced
hydroxyapatite with enhanced mechanical properties. Composite Part A,” Applied science and
manufacturing, 38(1), 114-123
.
Yang, Y.L., M.C.Grupta, and K.L.Dudley 92007), “ Electromagnetic interference shielding
characteristics of carbon nanofiber-polymer composites,” J. Nanosci & Nanotech, 7(2), 549-554.
Kirkpatrick, S.(1973), “ Percolation and conduction,” Rev. Mod. Phys., 45(4), 574-588.
Lebovka, N.M. Lisunova, Y.P. Mamunya, and N. Vygornitskii (2006), “ Scaling in percolation
behavior in conductive insulating composites with particles of different size,” J. Phys. D: Appl.
Phys,.39,2264-2271.
Stauffer, D.(1979), “ Scaling theory of percolation clusters,” Phys. Rep, 54,1-74.
Pick, G.E. and Seager, C.H., 1974, Percolation and conductivity: a computer study. I, Phys. Rev.
B 10, 1421-1434.
Balberg, I. and Binenbaum, N., 1983, Computer study of the percolation threshold in a two-
dimensional anisotropic system of conducting sticks, Phys. Rev.B28, 3799-3812.
Natsuki, T., Endo, M and Takahashi, T., 2005, Percolation study of orientated short-fiber
composites by a continuum model, Physica A352, 498-508.
89

Balberg, I., Binenbaum, N., 1985, Cluster structure and conductivity of three-dimensional
continuum sticks system, Phy. Rev. Lett.52, 1465-1468.
Taya, M. and Ueda, N., 1987, Prediction of the in-plane electrical conductivity of a misoriented
short fiber composite: fiber percolation model versus effective medium theory, ASME J. Eng.
Mater. Tech. 109, 252-256.
Lee, Y.H. and Kim, H.C., 1995, Three-dimensional electrical percolation behavior in conductive
short-fiber composites, J. Mater. Sci. 30, 3033-3036.
Yi, Y. B., Berhan, L. and Sastry, A.M., 2004, Statistical geometry of random fibrous networks,
revisited: waviness, dimensionality, and percolation, J. Appl. Phys. 96, 1318-1327.
Li, C.and Chou, T.-W., 2007, Continuum percolation of nanocomposites with fillers of arbitrary
shapes, Appl. Phy. Lett. 90, 174108.
Dalmas, F., Dendievel, R., Chazeau, L., Cavaille, J.-Y., Gauthier, C., 2006, Carbon nanotube-
filled polymer composites. Numerical simulation of electrical conductivity in three-dimensional
entangled fibrous networks, Acta Mater. 54, 2923-2931.
Broadbent. S.R., and J.M.Hammersley, 1957, Proc. Camb. Philos. Soc. 53, 629.
90

Scott Kirkpatrick, 1973, Review of modern physics. 45, 4, 574-588.
Stefano Giordano, 2005, Int. J. Circ. Theor. Appl. 33:519-540.
Scott Kirkpatrick, 1973, Reviews of Modern Physics. 45,4,574-588.
Scott Kirkpatrick, 1971, Phys. Rev. Lett. 27, 1722.
Shi-Hong Wu and Iwamoto Masaharu, 2006, Journal of reinforced plastics and composites,
Vol.25, No. 18, 2006, 1957-1966.
Balberg, I., Anderson, C.H., Alexander, S. and Wagner, N. (1984). Excluded Volume and its
Relation to the Onset of Percolation, Phys. Rev. B., 30:3933-3943.
Onsager L. Ann NY Acad Sci 1949; 51: 629-659.
Kuo-Chi Lin, Jian Gou, Linan An, Jing Bai, Ligong Zhang and Daniel Lee (2008), “The
conductivity percolation model of carbon nanofiber composite,” Earth & Space, 11th ASCE
aerospace division international conference on engineering, science, construction and operation
in challenging environment, Long Beach, CA, March 2008.
Razavy, Mohsen (2003). Quantum Theory of Tunneling. World Scientific. ISBN 981-238-019-1.
91

92
Balberg I. Phys Rev Lett 1987; 59:1305–8.
Rubin Z, Sunchine SA, Heaney MB, Bloom I and Balberg I. Phys Rev B.1999;59:12196–9.
Scarisbrick, R. M., Electrically conducting mixtures. J.Phys. D, 6 (1973) 2098-2110.
Reboul, J. P., Ionic polarization and electronic conduction in carbon-black-filled
polyvinylchloride. J. Appl. Phys., 46 (1975) 2961-2965.
D. Toker, D. Azulay, N. Shimoni, I. Balberg and O. Millo, Phys. Rev. B 68 (2003) 041403-1.
H.M. Ma and X-L Gao, A three-dimensional monte carlo model for electrically conductive
polymer matrix composites filled with curved fibers (unpublished).
F. B. Kashani and Cyrus Shahabi, Computer Society, 2003.