performance analysis and thermodynamic modeling …
TRANSCRIPT
Journal of Thermal Engineering, Vol. 4, No. 3, pp. 1963-1983, April, 2018 Yildiz Technical University Press, Istanbul, Turkey
This paper was recommended for publication in revised form by Regional Editor Omid Mahian 1 Department of Mechanical Engineering, Faculty of Engineering, University of Mohaghegh Ardabili, P.O.B 179, Ardabil, IRAN *E-mail address: [email protected] Manuscript Received 28 December 2016, Accepted 11 March 2017
PERFORMANCE ANALYSIS AND THERMODYNAMIC MODELING OF A POLY GENERATION SYSTEM BY INTEGRATING A MULTI-EFFECT-DESALINATION THERMO-VAPOR COMPRESSION (MED-TVC) SYSTEM WITH A COMBINED
COOLING, HEATING AND POWER (CCHP) SYSTEM
H. Ghaebi 1,*, G. Abbaspour 1
ABSTRACT
In the present study, performance analysis of a multi effect distillation with thermos vapor compressor
(MED-TVC) desalination system coupled to a combined cooling, heating and power (CCHP) system with gas
turbine prime mover has been carried out to cogeneration of cooling, heating, power and potable water. The system
incorporates air compressor, combustion chamber, gas turbine, triple pressure heat recovery system generator
(HRSG), absorption chiller and MED-TVC. A thermodynamic modeling based on mass and energy balance
equations is applied for each component of the integrated system. The engineering equation solver (EES) software
was used for modeling. It is found that the efficiency of the integrated system reached to 84% (the efficiency of
the gas turbine cycle was 32%). Furthermore, a parametric study has been presented in order to investigate the
effects of the operational parameters on the performance of the integrated system.
Keywords: Desalination, CCHP, Gas turbine, MED-TVC, Thermodynamic analysis
INTRODUCTION
Energy and energy saving are one of the crucial items all around the world. Problems with energy supply
and its use are related not only to global warming, but also to environmental concerns such as air pollution, acid
precipitation, ozone depletion, forest destruction and emission of radioactive substances [1]. These issues must be
taken into our consideration simultaneously if humanity is to achieve a bright energy future with minimal
environmental impacts [2-4].
Cogeneration is one of the best energy saving methods to make a more efficient usage of fuels and achieve
environmental improvements. Cogeneration makes it possible to produce electricity and useful thermal energy
from the same energy resource. The requirements of cogeneration may be met in many ways, such as steam and
gas turbines, fuel cells and Sterling engines [5-6]. A part of heat production of a site may be used for handling an
absorption chiller and thereby the cooling demand of the site will be covered and/or for operating a desalination
plant to produce fresh water. In fact, in such a case the most beneficial way to use primary energy is applied,
because it makes system possible to produce power, heat, cold and fresh water simultaneously.
Water exists in huge amount on earth but only a small fraction has suitable conditions for drinking and
irrigation [7]. Desalination is one of the most important processes to provide water to population in water scarcity
areas. But desalination processes consume a lot of energy that unfortunately the majority of their energy
requirements is obtained from oil or natural gas [8].
Today, distillation and membrane methods are the two main seawater desalination processes. Among these
methods, multi stage flash (MSF), multi effect distillation (MED), vapor compression (VC) and reverse osmosis
(RO) are suitable for the large and medium capacity of freshwater production [9]. MSF and MED seawater
desalination systems are suitable for being coupled with power plants because they could utilize the waste heat
from power cycle for improving the fuel efficiency of the whole plants. In the other words, they usually use the
waste energy of flue gas (which is emitted from gas turbine cycles) and extracted vapor of steam turbines or heat
recovery steam generator (HRSG). Compared with the most widely used MSF desalination, MED and multi effect
distillation thermal vapor compression (MED-TVC) have the advantages of lower corrosion and scaling rates,
lower capital cost, longer operation life and less pumping power consumption [10].
So far, many researchers have studied dual purpose (combined power and water) plants. Johansen et al
[11] evaluated four combined heat and power (CHP) plants coupled to several desalination processes. They showed
Journal of Thermal Engineering, Research Article, Vol. 4, No. 3, pp. 1963-1983, April, 2018
1964
that by using a gas turbine, an HRSG and a back pressure steam turbine together with a MED-RO desalination
system, high effective energy utilization can be achieved.
Wade [12] reviewed energy and cost allocation methods in dual purpose plant of power and desalination.
He studied the integration of gas turbine power plants and CHP cycles with RO and MSF desalination plants.
Cardona and Piacentino [13] optimized a combined cycle with both production of electricity and fresh water from
the exergo-economics point of view. Their study involved a combination of RO and MSF desalination systems in
which exhaust waste energy from the power cycle entered to the MSF section and also power was supplied to the
RO section and MSF auxiliary equipment. Darwish and Najem [14] proposed using gas turbine with RO and MSF
desalination units for efficient usage of the same energy source. Rensonnet et al [15] carried out thermoeconomic
analysis of different configurations of gas turbine dual purpose power and desalination and also hybrid plants.
They modeled combined Gas turbine with RO, combined cycle with RO, combined cycle with MED and a hybrid
plant arrangement combining combined cycle, MED and RO. Wang and Lior [16-17] presented a thermodynamic
model for integrated MED-TVC and humidified gas turbine cycle. Chacartegui [18] considered the performance
of a cogeneration plant – combined power plant and desalination – with a stationary lumped volume model.
Khoshgoftar Manesh and Amidpour [19] applied an evolutionary algorithm to multi-objective thermoeconomic
optimization of coupling MSF plant with a pressurized water reactor (PWR) nuclear power plant. Ansari et al [20]
carried out thermoeconomic optimization of a typical PWR plant coupled to a MED-TVC desalination system.
They used Total Revenue Requirement (TRR) method for economic analysis. Hosseini et al [21] investigated the
effects of equipment reliability in thermoeconomic analysis of a combined power and MSF water desalination
plant. In the other research, Hosseini et al [22] performed cost optimization of a dual production plant considering
exergetic, environmental and reliability concepts. Shakib et al [23] studied thermodynamic and economic aspects
of MED-TVC. The MED-TVC was combined with gas turbine power plants, an Alstom GE13E plant that had
stood at the south of Iran, near seashore, and had a nominal output power of 165 MW. In the other research [24],
they performed an optimization using two heuristic algorithms, namely, genetic algorithm (GA) and particle swarm
optimization (PSO). Esfahani and Yoo [25] conducted a feasibility study of an integrated system comprising a
steam injected gas turbine and MED-TVC. Almutairi et al. [26] carried out energetic and exergetic analysis of a
gas turbine integrated with ME-TVC-MED system. They concluded that by increasing of the compressor pressure
ratio and feed water temperature, the efficiency of the combined system improved. Hanafi et al [27] performed
thermoeconomic analysis of a combined gas turbine MED-TVC system. Their results showed that the production
cost of the power and potable water is 20.6 % less than their standalone production. Sanaye and Asgari [28]
modeled, analyzed and optimized an integrated gas-turbine combined-cycle power plant with Multi-stage Flash
(MSF) desalination unit using multi-objective genetic algorithm method.
However, to our knowledge, no previous investigation has proposed or assessed the integration of MED-
TVC with gas turbine based CCHP plant. The sub-objectives of this research paper are multi-fold, and include:
To develop a novel configuration of gas turbine based CCHP plant integrated with MED-TVC to
combined cooling, heating, power and potable water.
To consider a triple pressure HRSG to produce steam in three levels.
To comprehensively thermodynamic model of the proposed system.
To perform parametric study to see the effect of variations of operating parameters on the performance of
the integrated system.
SYSTEM DESCRIPTION
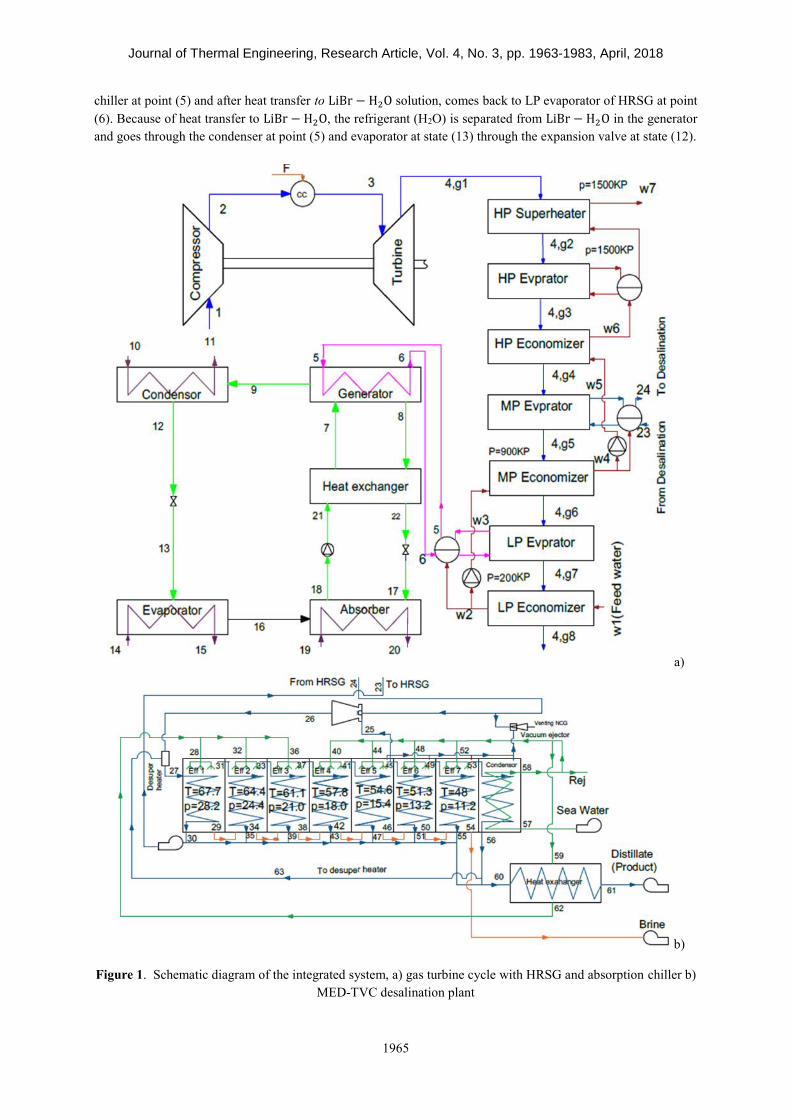
The schematic diagram of the proposed system is shown in Fig.1. This plant consists of air compressor,
combustion chamber, gas turbine, triple-pressure HRSG, lithium bromide-water absorption chiller and MED-TVC.
Ambient air enters the air compressor at point (1) and, after compression at point (2), it leaves compressor.
This hot air enters combustion chamber at point (2) which is fueled by fuel injected into the combustion chamber
at point (F). After combustion reaction, hot exhaust gas is produced at point (3). Next, the hot gases leaving
combustion chamber are expanded through a gas turbine to produce power. At point (4) hot flue gases leave gas
turbine and enter heat recovery steam generator (HRSG) in which energy of flue gases is being utilized to produce
steam. Here we used triple pressure HRSG to produce steam in three levels (saturated low pressure (LP) steam,
saturated medium pressure (MP) steam and superheated high pressure (HP) steam). The LP steam is used to run a
single effect LiBr − H2O absorption chiller for cooling purpose. This steam supplied to generator of absorption
Journal of Thermal Engineering, Research Article, Vol. 4, No. 3, pp. 1963-1983, April, 2018
1965
chiller at point (5) and after heat transfer to LiBr − H2O solution, comes back to LP evaporator of HRSG at point
(6). Because of heat transfer to LiBr − H2O, the refrigerant (H2O) is separated from LiBr − H2O in the generator
and goes through the condenser at point (5) and evaporator at state (13) through the expansion valve at state (12).
a)
b)
Figure 1. Schematic diagram of the integrated system, a) gas turbine cycle with HRSG and absorption chiller b)
MED-TVC desalination plant
Journal of Thermal Engineering, Research Article, Vol. 4, No. 3, pp. 1963-1983, April, 2018
1966
The water vapor after boiling in evaporator enters the absorber at point (16). In the absorber, it mixes with
weak solution that enters absorber at point (17) and its heat is rejected by cooling water (19-20). The strong solution
leaves the absorber at point (18) and pumped to the pressure of the point (21). This strong and high pressure
solution is heated through heat exchanger and enters generator at point (7). The exhaust weak and high pressure
solution of heat exchanger enters absorber at point (17) after pressure drop through expansion valve.
The saturated MP steam is used to run a MED-TVC desalination plant. The main components of that are
the steam ejector (which acts as the heart of the system), falling film evaporators (effects) and a condenser (Fig.1b).
The saturated steam which is fed from HRSG enters steam ejector at point (24) and after mixing with the return
steam from the nth effect (point (25)) expands to the pressure of the first effect at point (26). This steam is converted
to superheated steam because of expansion and it needs to become saturated steam to enter the first effect. Then a
de-superheater is used in that a part of leaving fresh water from the last effect is mixed with the superheated steam
(point (26)) to convert to saturated steam (point (27)). The saturated steam enters the first effect and rejects its
latent heat to the sea water and condenses and a part of it (equal of the amount of the steam that fed from HRSG)
returns to HRSG by a pump. The remainder joints to the fresh water line. The vapor formed in the first effect (point
(31)) is directed to the second effect. Another part of the seawater that is named brine (point (29)) enters the next
effect. The vapor generated in each effect is passed through demisters and enters the next effect to transfer heat to
the feed seawater. This trend is continued all over the effects and the heat of the last effect is absorbed by condenser
and used to preheat the seawater. The brine is collected from all of the effects and rejected to sea (point (54)). Also
a heat exchanger is used to preheat the feed seawater that enters the first three effect (point (62)). The fresh water
is left at the desired temperature at point (61).
Feed-water preheating has two advantages: the first one is preheating of the feed for the effects number
1, 2 and 3, which leads to reduction of the total energy consumption and exergy destruction, the second advantage
is reduction of the product water temperature which reduces the amount of exergy loss to environment.
The superheated HP steam that is generated by the HP evaporator of the HRSG will be utilized as process
steam, directly (point (w7)).
THERMODYNAMIC ANALYSIS
The energy analysis is presented in this section. Engineering Equation Solver (EES) is used as the main
software for all calculations. For thermodynamic analysis, the principles of mass and energy conservations are
applied to each system component. The following assumptions are considered in this work:
All processes are considered to be working as state and steady flow.
The volumetric composition of the inlet air is 75.98% N2, 20.18% O2, 0.03% CO2 and 3.81% H2O [29].
Pressure drop along the HRSG and combustion chamber is supposed to be 5% and 3%, respectively [5].
The fuel is methane with a low heating value of 50,010 kJ/kg [5].
Air compressor and gas turbine are considered adiabatic [5].
There is no pressure drop heat loss in pipelines.
There is no heat loss in absorption chiller and MED-TVC components [24].
Vapor formed in each effect is free of salt [24].
Final reject salinity is assumed 70000 ppm [24].
Heat transfer area of evaporators 2 to N is the same [24].
The following equations are the energy balance for the components of the system:
Gas Turbine Cycle
To calculate the air compressor efficiency (ηC) Equation (1) is used, which is presented by Korakianitis
and Wilson [30]:
ηc = 1 − (0.04 +rc−1
150) (1)
rc is the compressor pressure ratio. The compressor required power is calculated as below:
��𝑐 = mair(1 + ω1)(h2 − h1) (2)

Journal of Thermal Engineering, Research Article, Vol. 4, No. 3, pp. 1963-1983, April, 2018
1967
where w is the humidity ratio and h is the enthalpy.
The heat input of cycle is obtained by energy balance on combustion chamber:
Qin = mair(1 + λ)(h3 − h2) (3)
where λ is the fuel to air ratio.
The gas turbine efficiency is calculated through Equation (4), as compressor efficiency [30]:
η𝑐 = 1 − (0.03 +𝑟𝑐−1
180) (4)
The turbine power generation is as follow:
��𝑡 = m𝑔𝑎𝑠(h3 − h4) (5)
After calculating the above mentioned parameters, the net power output of the cycle is calculated:
��𝑛𝑒𝑡 = ��𝑡 − ��𝑐 (6)
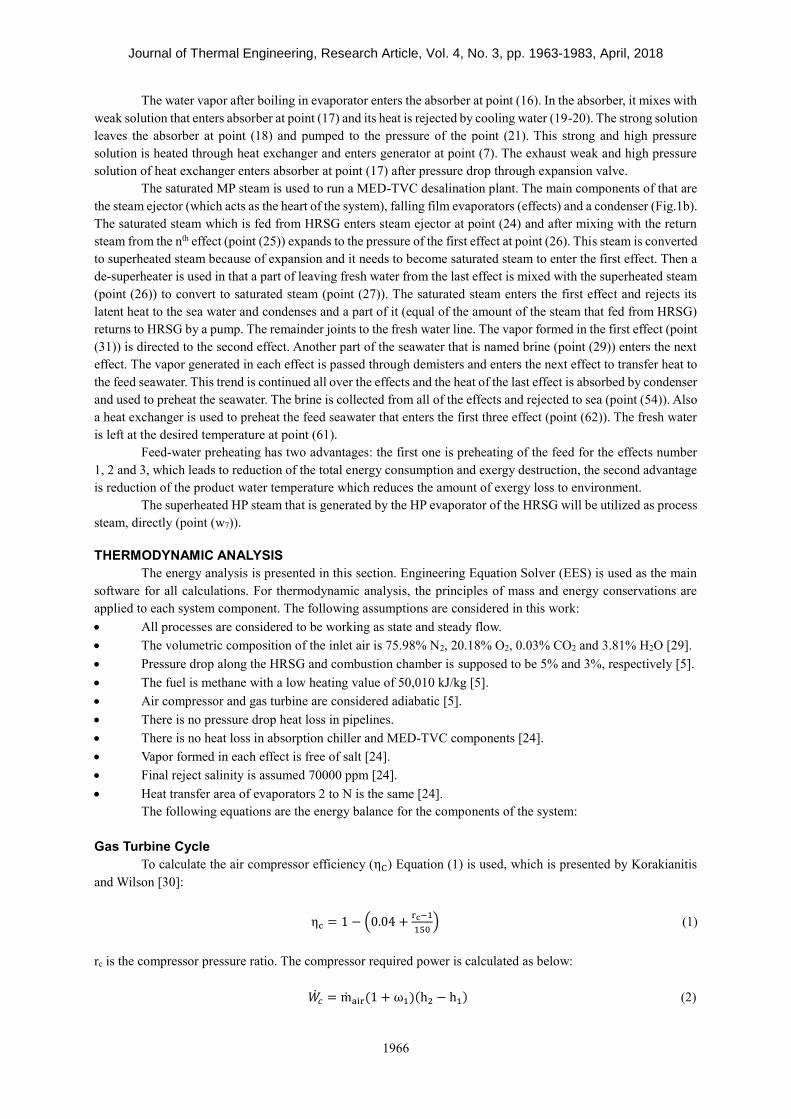
HRSG
In the proposed system a triple-pressure (LP, MP and HP) HRSG with three economizers (LP, MP and
HP), three evaporators (LP, MP and HP) and a super heater (HP) is used to generate LP saturated steam, MP
saturated steam and HP superheated steam. The temperature profile of HRSG is indicated in Fig. 2.
Figure 2. Temperature profile in HRSG
The pinch-point is defined as the temperature difference between the exhaust gas at the end of the
evaporator (side economizer) and the saturated steam. The triple-pressure HRSG has three pinch points (PPLP,
PPMP and PPHP). Also the temperature difference between the water leaving the economizers (Tw2, Tw4 and Tw6)
and the saturated steam of evaporators (Tsat,LP, Tsat,MP and Tsat,HP) are called the approach points (APLP, APMP
and APHP). The approach points depend on economizers tube layouts. Here we supposed that they are the same
and equal to 5℃.
The feed water enters to LP economizer with temperature of Tw1 and is heated to Tw2 by extracting heat
of the flue gas. The Tw2 is calculated as follows:
Tw2 = Tsat,LP − APLP (7)
Journal of Thermal Engineering, Research Article, Vol. 4, No. 3, pp. 1963-1983, April, 2018
1968
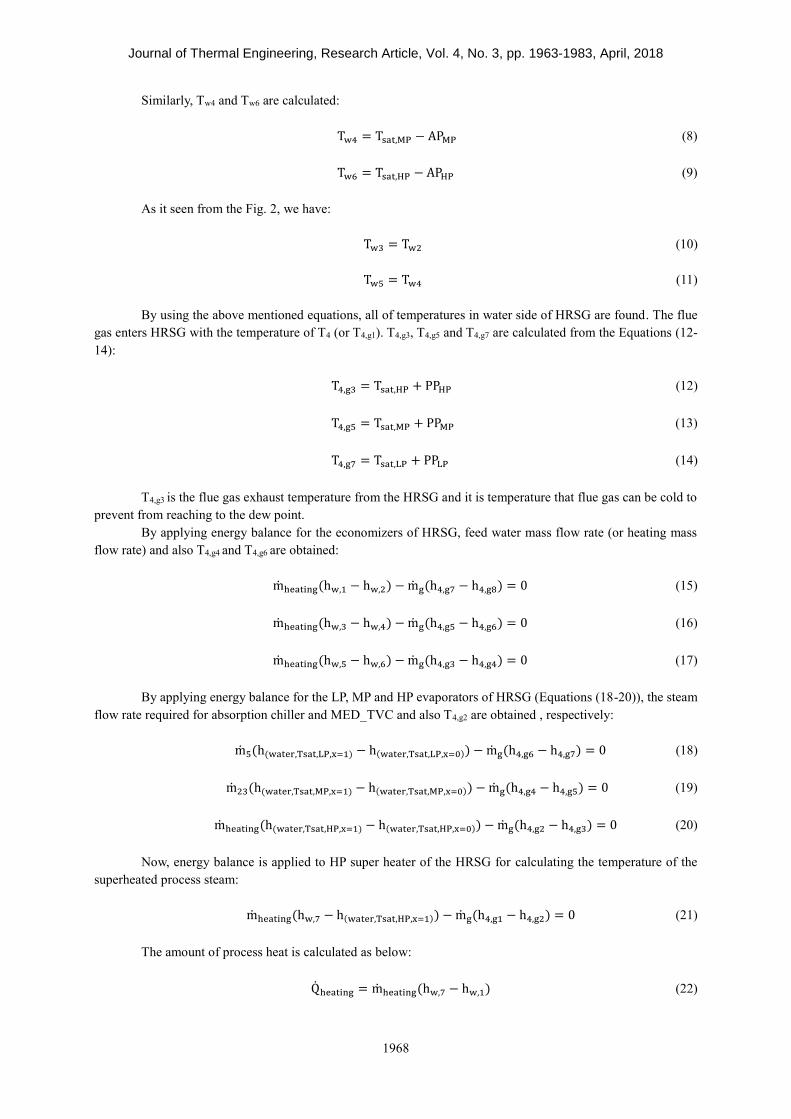
Similarly, Tw4 and Tw6 are calculated:
Tw4 = Tsat,MP − APMP (8)
Tw6 = Tsat,HP − APHP (9)
As it seen from the Fig. 2, we have:
Tw3 = Tw2 (10)
Tw5 = Tw4 (11)
By using the above mentioned equations, all of temperatures in water side of HRSG are found. The flue
gas enters HRSG with the temperature of T4 (or T4,g1). T4,g3, T4,g5 and T4,g7 are calculated from the Equations (12-
14):
T4,g3 = Tsat,HP + PPHP (12)
T4,g5 = Tsat,MP + PPMP (13)
T4,g7 = Tsat,LP + PPLP (14)
T4,g3 is the flue gas exhaust temperature from the HRSG and it is temperature that flue gas can be cold to
prevent from reaching to the dew point.
By applying energy balance for the economizers of HRSG, feed water mass flow rate (or heating mass
flow rate) and also T4,g4 and T4,g6 are obtained:
mheating(hw,1 − hw,2) − mg(h4,g7 − h4,g8) = 0 (15)
mheating(hw,3 − hw,4) − mg(h4,g5 − h4,g6) = 0 (16)
mheating(hw,5 − hw,6) − mg(h4,g3 − h4,g4) = 0 (17)
By applying energy balance for the LP, MP and HP evaporators of HRSG (Equations (18-20)), the steam
flow rate required for absorption chiller and MED_TVC and also T4,g2 are obtained , respectively:
m5(h(water,Tsat,LP,x=1) − h(water,Tsat,LP,x=0)) − mg(h4,g6 − h4,g7) = 0 (18)
m23(h(water,Tsat,MP,x=1) − h(water,Tsat,MP,x=0)) − mg(h4,g4 − h4,g5) = 0 (19)
mheating(h(water,Tsat,HP,x=1) − h(water,Tsat,HP,x=0)) − mg(h4,g2 − h4,g3) = 0 (20)
Now, energy balance is applied to HP super heater of the HRSG for calculating the temperature of the
superheated process steam:
mheating(hw,7 − h(water,Tsat,HP,x=1)) − mg(h4,g1 − h4,g2) = 0 (21)
The amount of process heat is calculated as below:
Qheating = mheating(hw,7 − hw,1) (22)
Journal of Thermal Engineering, Research Article, Vol. 4, No. 3, pp. 1963-1983, April, 2018
1969
Absorption Chiller
In the absorption chiller, mass conservation includes the mass balance of total mass and each component
of the solution [31]:
∑(ṁ. x)i − ∑(ṁ. 𝑥)e = 0 (23)
ṁ is the mass flow rate and x is mass concentration of LiBr in the solution.
The energy balance equation is applied for each component of the absorption chiller:
Evaporator
Qevap = m13(h16 − h13) (24)
Absorber
m18x18 = m17x17 (25)
Qabs = m18h18 − m17h17 − m16h16 (26)
Pump
Wpump = m18v18(P18 − P21) (27)
Heat Exchanger
m21h21 + m8h8 = m22h22 + m7h7 (28)
Generator
m8x8 = m7x7 (29)
Qgen = m8h8 + m9h9 − m7h7 (30)
Condenser
Qcond = m12(h12 − h9) (31)
The amount of cooling capacity of the chiller is equal to the evaporator load:
Qcooling = −Qevap = m13(h13 − h16) (32)
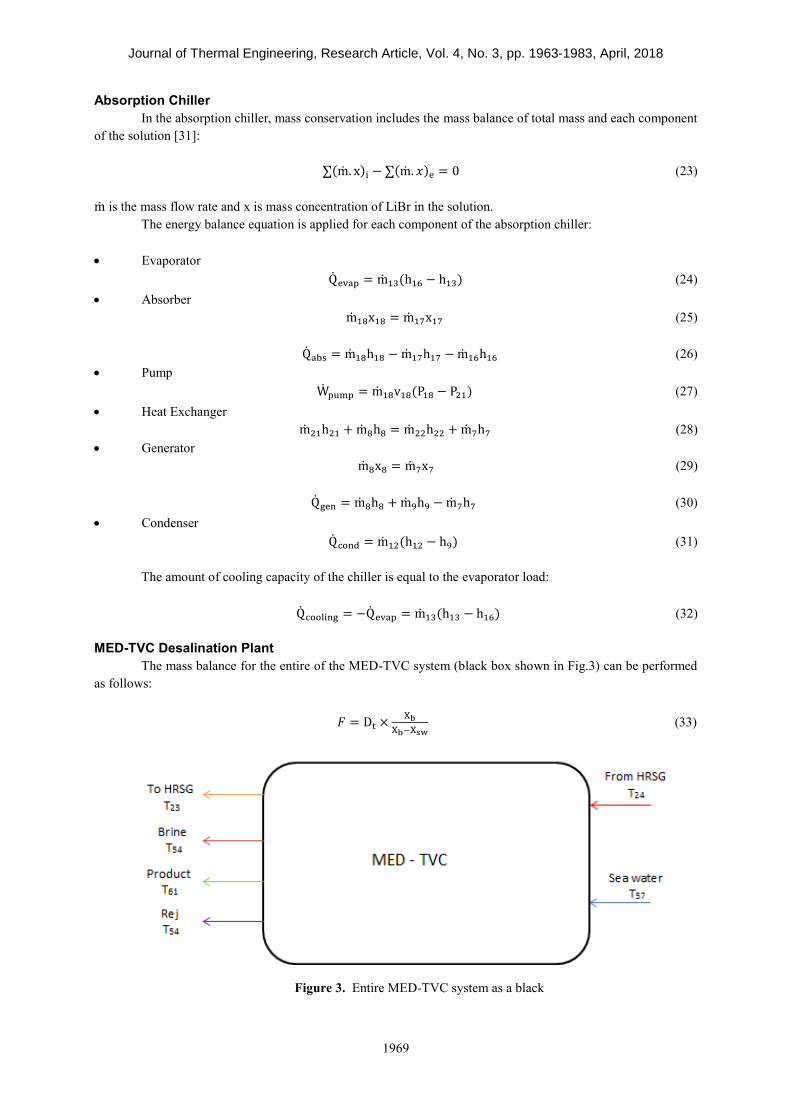
MED-TVC Desalination Plant
The mass balance for the entire of the MED-TVC system (black box shown in Fig.3) can be performed
as follows:
𝐹 = Dt ×Xb
Xb−Xsw (33)
Figure 3. Entire MED-TVC system as a black
Journal of Thermal Engineering, Research Article, Vol. 4, No. 3, pp. 1963-1983, April, 2018
1970
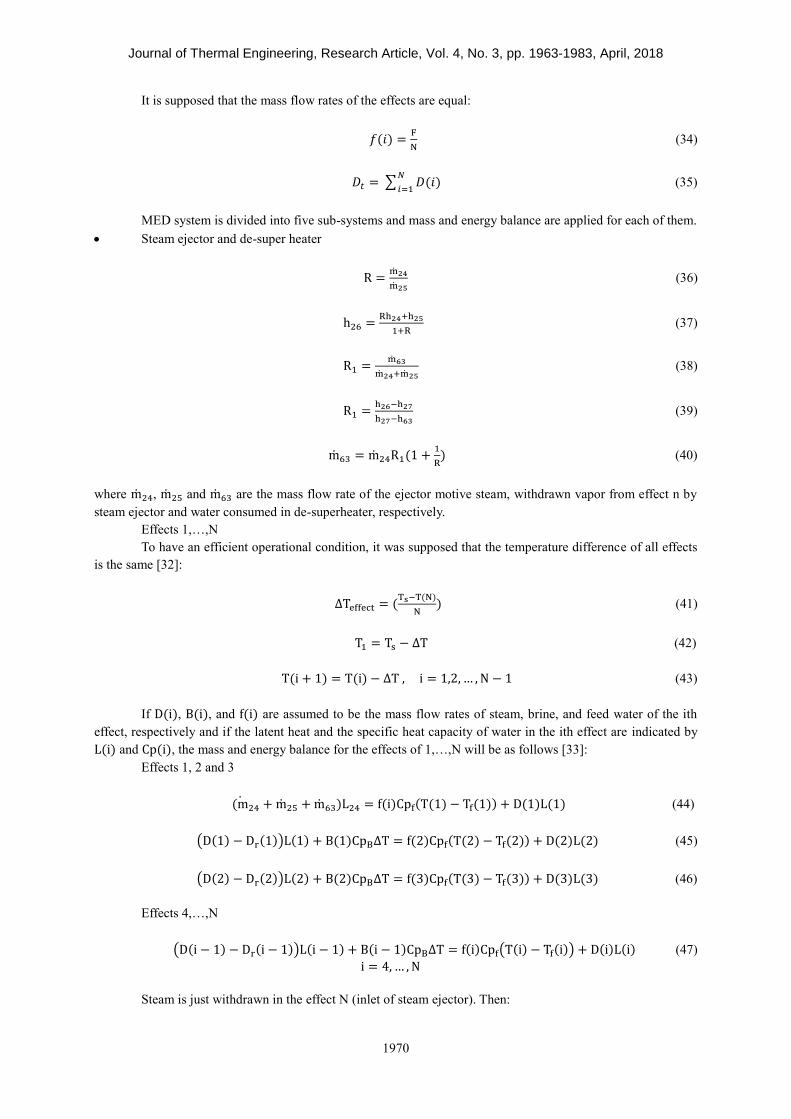
It is supposed that the mass flow rates of the effects are equal:
𝑓(𝑖) =F
N (34)
𝐷𝑡 = ∑ 𝐷(𝑖)𝑁
𝑖=1 (35)
MED system is divided into five sub-systems and mass and energy balance are applied for each of them.
Steam ejector and de-super heater
R =m24
m25 (36)
h26 =Rh24+h25
1+R (37)
R1 =m63
m24+m25 (38)
R1 =h26−h27
h27−h63 (39)
m63 = m24R1(1 +1
R) (40)
where m24, m25 and m63 are the mass flow rate of the ejector motive steam, withdrawn vapor from effect n by
steam ejector and water consumed in de-superheater, respectively.
Effects 1,…,N
To have an efficient operational condition, it was supposed that the temperature difference of all effects
is the same [32]:
∆Teffect = (Ts−T(N)
N) (41)
T1 = Ts − ∆T (42)
T(i + 1) = T(i) − ∆T , i = 1,2, … , N − 1 (43)
If D(i), B(i), and f(i) are assumed to be the mass flow rates of steam, brine, and feed water of the ith
effect, respectively and if the latent heat and the specific heat capacity of water in the ith effect are indicated by
L(i) and Cp(i), the mass and energy balance for the effects of 1,…,N will be as follows [33]:
Effects 1, 2 and 3
(m24 + m25 + m63)L24 = f(i)Cpf(T(1) − Tf(1)) + D(1)L(1) (44)
(D(1) − Dr(1))L(1) + B(1)CpB∆T = f(2)Cpf(T(2) − Tf(2)) + D(2)L(2) (45)
(D(2) − Dr(2))L(2) + B(2)CpB∆T = f(3)Cpf(T(3) − Tf(3)) + D(3)L(3) (46)
Effects 4,…,N
(D(i − 1) − Dr(i − 1))L(i − 1) + B(i − 1)CpB∆T = f(i)Cpf(T(i) − Tf(i)) + D(i)L(i) (47)
i = 4, … , N
Steam is just withdrawn in the effect N (inlet of steam ejector). Then:

Journal of Thermal Engineering, Research Article, Vol. 4, No. 3, pp. 1963-1983, April, 2018
1971
i ≠ n → Dr(i) = 0 (48)
B(i) = ∑ f(i)Ni=1 − ∑ D(i)N
i=1 , i = 1,2, … , N (49)
Feed water heater
The energy balance for feed-water heater can be calculated as follows:
∑ D(i)(hf(i) − hf(N))N−1
i=1+ m24 × [hf24 (R1 +
1+R1
R) −
hf24
R− hfN (R1 +
R1
R)] =
(f(1) + f(2) + f(3))Cpf(Tf(1) − Tf) (50)
Condenser
A vapor produced in the last effect enters the condenser and condenses by seawater. Also seawater is
preheated. Another part of seawater used as coolant in the condenser is rejected to the sea. The mass and energy
balance for the condenser are as follows:
Tf = T(N) − ∆Tmin,cond (51)
m57 = F + Rej (52)
(D(N) − Dr(N))L(N) = (F + Rej)Cpsw(Tf − Tsw) (53)
where m57, F, and Rej are the mass flow rates of condenser cooling water, feed water MED and the rejected water
from desalination system, respectively. D(N) is the total rate of the exhaust steam of the effect Dr(N) is the rate of
the withdrawn steam from the effect N. Tf and Tsw are the feed water and sea water temperatures, respectively.
One of the most important characteristics of thermal desalination plants is gain output ratio (GOR), the ratio
between the mass of produced fresh water and that of the consumed motive steam:
GOR =m61
m24 (54)
The useful load of the MED-TVC plant is obtained as follows:
Qdesalination = m61(h61 − hsw) (55)
The thermal efficiency defines as the ratio of useful forms of energies produced by the system (cold, heat,
power and fresh water) to the input energy of fuel that is supplied to the system. According to this definition, the
efficiency for the proposed system is given by:
ηsystem =Ẇnet+Qheating+Qcooling+Qdesalination
ṁfuel∗LHV (56)
where, LHV is the low heating value of the fuel (methane).
DISCUSSION AND RESULTS
Model Verification
To validate the present model and simulation results, for gas turbine cycle, absorption chiller and MED-
TVC, the available data in the References [5] and [33] were used. A comparison of the simulation results with
those reported in the literature, for the stand alone gas turbine cycle, absorption chiller and MED-TVC was shown
in Tables 1-3. The results indicate a good agreement between the values of parameters calculated in this work and
those reported in the literature.

Journal of Thermal Engineering, Research Article, Vol. 4, No. 3, pp. 1963-1983, April, 2018
1972
Table 1. Performance parameters for the gas turbine cycle a) present model b) Ref. [5]
Parameters a b Error (%)
Compressor isentropic efficiency 0.75 0.75 0
Turbine isentropic efficiency 0.75 0.75 0
Compressor pressure ratio 14 14 0
Gas turbine inlet temperature (oC) 1300 1300 0
Mass flow rate of fuel (kg/s) 1.21 1.21 0
Mass flow rate of air (kg/s) 87.26 81.44 -6.67
Wnet (kW) 19.44 19.23 -1.08
Gas turbine outlet temperature (oC) 767.4 787.53 2.62
Cycle efficiency (%) 32.11 31.78 -1.03
Table 2. Performance parameters for the absorption chiller, a) present model b) Ref. [5]
Parameters a b Error (%)
Load of Evaporator (MW) 7.12 6.96 -2.25
Load of Generator (MW) 10.29 10.17 -1.17
Load of Absorber (MW) 11.36 11.05 -2.73
Load of Condenser (MW) 6.98 6.74 -3.44
COP 0.692 0.684 -1.16
Table 3. Performance parameters for the MED-TVC system a) present model b) Ref. [33]
Parameters a b Error (%)
Capacity of the MED-TVC system (kg/s) 23.2 23.15 -0.22
Inlet salt composition of the sea water (%) 0.039 0.039 0
Salt composition of the outlet brine (%) 0.067 0.065 -2.99
Number of effects 7 7 0
Temperature of the vapor enters to the first effect (°C) 71 71 0
Total Steam consumption (kg/s) 2.568 2.568 0
Total feed flow rate for all effects (kg/s) 57.76 57.87 0.19
Total brine outlet flow rate (kg/s) 35.58 34.72 -2.42
Total flow rate of the inlet sea water (kg/s) 141.1 134.72 -4.52
Gain output ratio(GOR) 9.033 9.01 -0.25
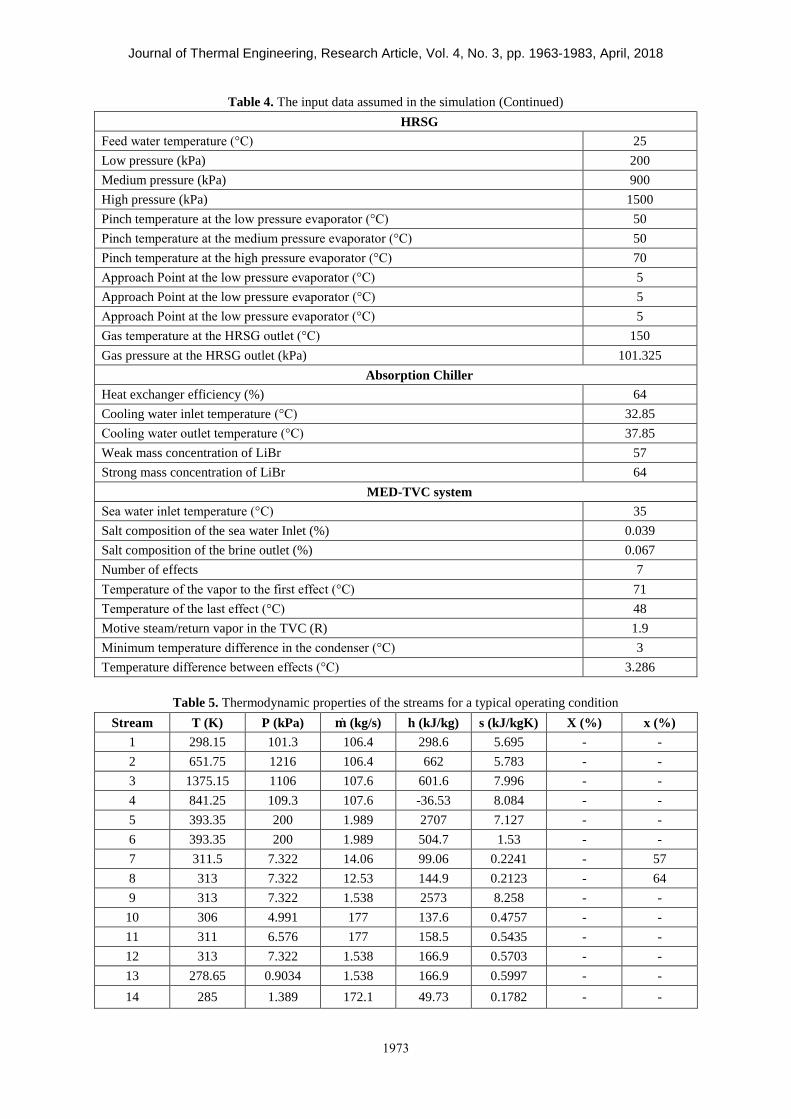
Energy Analysis Result For the considered system, the input data and assumptions are listed in Table 4. These parameters are used
for the thermodynamic evaluation of the system in the base case.
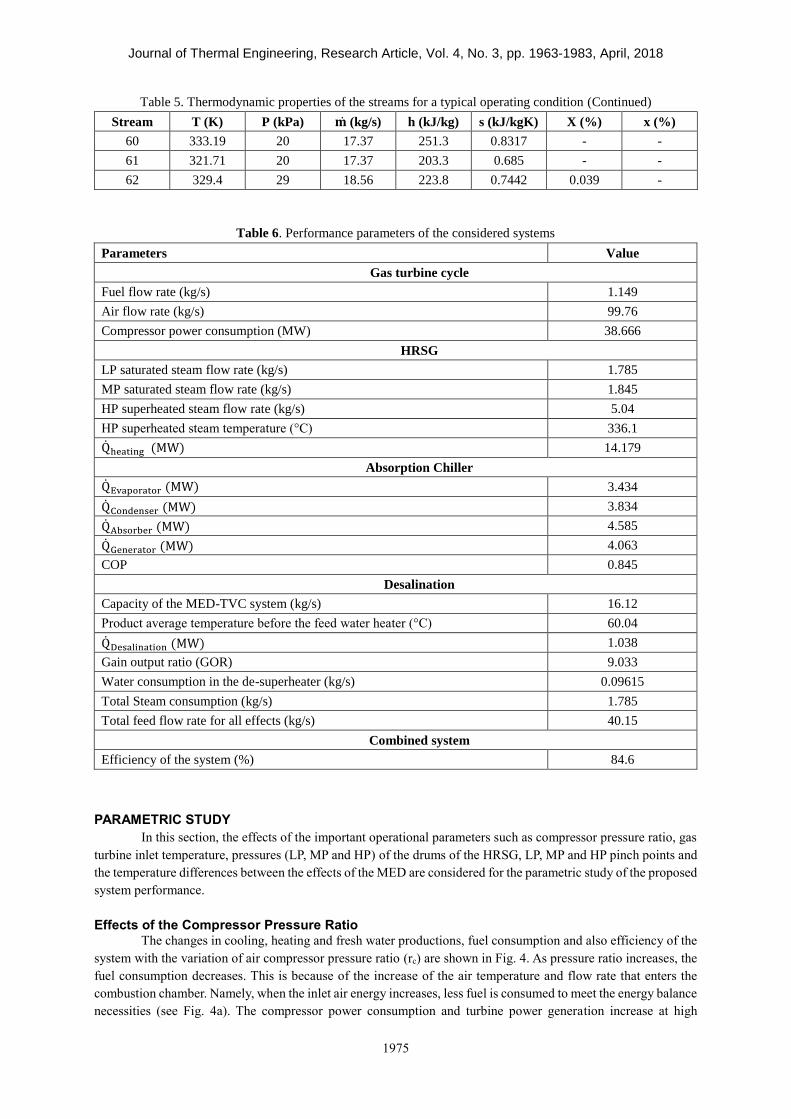
Table 5 shows the thermodynamic properties as the temperature, pressure, mass flow rate, enthalpy and
entropy for the points (states) of the combined cycle (see Fig.1) operating on the conditions that specified in the
Table 4. The figures given in Table (5) could be helpful to evaluate streams’ characteristics. The main operational
and performance parameters of the considered cycles and also combined cycle are listed in Table 6.
Table 4. The input data assumed in the simulation
Value Parameters
Gas turbine cycle
25 Air compressor inlet temperature (°C)
1100 Gas turbine inlet temperature (°C)
0.9 Turbine isentropic efficiency
0.85 Compressor isentropic efficiency
12 Compressor Pressure ratio
30 Net Power of gas turbine cycle (MW)
Journal of Thermal Engineering, Research Article, Vol. 4, No. 3, pp. 1963-1983, April, 2018
1973
Table 4. The input data assumed in the simulation (Continued)
HRSG
25 Feed water temperature (°C)
200 Low pressure (kPa)
900 Medium pressure (kPa)
1500 High pressure (kPa)
50 Pinch temperature at the low pressure evaporator (°C)
50 Pinch temperature at the medium pressure evaporator (°C)
70 Pinch temperature at the high pressure evaporator (°C)
5 Approach Point at the low pressure evaporator (°C)
5 Approach Point at the low pressure evaporator (°C)
5 Approach Point at the low pressure evaporator (°C)
150 Gas temperature at the HRSG outlet (°C)
101.325 Gas pressure at the HRSG outlet (kPa)
Absorption Chiller
64 Heat exchanger efficiency (%)
32.85 Cooling water inlet temperature (°C)
37.85 Cooling water outlet temperature (°C)
57 Weak mass concentration of LiBr
64 Strong mass concentration of LiBr
MED-TVC system
35 Sea water inlet temperature (°C)
0.039 Salt composition of the sea water Inlet (%)
0.067 Salt composition of the brine outlet (%)
7 Number of effects
71 Temperature of the vapor to the first effect (°C)
48 Temperature of the last effect (°C)
1.9 Motive steam/return vapor in the TVC (R)
3 Minimum temperature difference in the condenser (°C)
3.286 Temperature difference between effects (°C)
Table 5. Thermodynamic properties of the streams for a typical operating condition
Stream T (K) P (kPa) 𝐦 (kg/s) h (kJ/kg) s (kJ/kgK) X (%) x (%)
1 298.15 101.3 106.4 298.6 5.695 - -
2 651.75 1216 106.4 662 5.783 - -
3 1375.15 1106 107.6 601.6 7.996 - -
4 841.25 109.3 107.6 -36.53 8.084 - -
5 393.35 200 1.989 2707 7.127 - -
6 393.35 200 1.989 504.7 1.53 - -
7 311.5 7.322 14.06 99.06 0.2241 - 57
8 313 7.322 12.53 144.9 0.2123 - 64
9 313 7.322 1.538 2573 8.258 - -
10 306 4.991 177 137.6 0.4757 - -
11 311 6.576 177 158.5 0.5435 - -
12 313 7.322 1.538 166.9 0.5703 - -
13 278.65 0.9034 1.538 166.9 0.5997 - -
14 285 1.389 172.1 49.73 0.1782 - -

Journal of Thermal Engineering, Research Article, Vol. 4, No. 3, pp. 1963-1983, April, 2018
1974
Table 5. Thermodynamic properties of the streams for a typical operating condition (Continued)
Stream T (K) P (kPa) 𝐦 (kg/s) h (kJ/kg) s (kJ/kgK) X (%) x (%)
15 280 0.9918 172.1 28.79 0.1041 - -
16 278.65 0.9034 1.538 2511 9.011 - -
17 311.08 0.9034 12.53 141.6 0.2015 - 64
18 310 0.9034 14.06 96.1 0.2145 - 57
19 306 4.991 204.8 137.6 0.4757 - -
20 311 6.576 204.8 158.5 0.5435 - -
21 310 7.322 14.06 96.1 0.2145 - 57
22 311.08 7.322 12.53 141.6 0.2015 - 64
23 448.55 900 1.924 742.8 2.095 - -
24 448.55 900 1.924 2774 6.622 - -
25 327.71 15.44 1.012 2599 7.997 - -
26 388.25 32.93 2.936 2713 7.968 - -
27 344.15 32.93 3.04 2628 7.739 - -
28 329.4 28.98 6.185 223.8 0.7442 0.039 -
29 340.85 28.24 3.278 258.1 0.8302 0.073 -
30 344.15 32.59 3.04 297.2 0.9671 - -
31 340.85 28.24 2.907 2622 7.788 - -
32 329.4 24.4 6.147 223.8 0.7442 0.039 -
33 337.56 24.4 2.828 2616 7.839 - -
34 337.56 24.4 6.597 245.7 0.7943 0.072 -
35 340.85 28.24 2.907 283.4 0.9268 - -
36 329.4 21.02 6.227 223.8 0.7442 0.039 -
37 334.28 21.02 2.802 2611 7.89 - -
38 334.28 21.02 10.02 233 0.7565 0,072 -
39 337.56 24.4 2.828 269.6 0.8862 - -
40 318.15 18.05 6.162 178,8 0.6054 0.039 -
41 330.99 18.05 2.711 2605 7.943 - -
42 330.99 18.05 13.47 220.6 0.7198 0.071 -
43 334.28 21.02 2.802 255.9 0.8453 - -
44 318.15 15.44 6.221 178.8 0.6054 0.039 -
45 327.71 15.44 1.663 2599 7.997 - -
46 327.71 15.44 17.02 207.9 0.6812 0.071 -
47 330.99 18.05 2.711 242.1 0.804 - -
48 318.15 13.16 6.245 178.8 0.6054 0.039 -
49 324.42 13.16 1.686 2593 8.053 - -
50 324.42 13.16 21.58 195.8 0.645 0.069 -
51 327.71 15.44 1.663 228.4 0.7623 - -
52 318.15 11.18 6.09 178.8 0.6054 0.039 -
53 321.13 11.18 1.766 2588 8.11 - -
54 321.13 11.18 25.9 183.5 0.6082 0.067 -
55 324.42 13.16 1.686 214.6 0.7201 - -
56 321.13 11.18 1.766 200.9 0.6776 - -
57 308.15 29 105.7 138.9 0.478 0.039 -
58 318.15 29 105.7 178.8 0.6054 0.039 -
59 318.15 29 18.56 178.8 0.6054 0.039 -
Journal of Thermal Engineering, Research Article, Vol. 4, No. 3, pp. 1963-1983, April, 2018
1975
Table 5. Thermodynamic properties of the streams for a typical operating condition (Continued)
Stream T (K) P (kPa) 𝐦 (kg/s) h (kJ/kg) s (kJ/kgK) X (%) x (%)
60 333.19 20 17.37 251.3 0.8317 - -
61 321.71 20 17.37 203.3 0.685 - -
62 329.4 29 18.56 223.8 0.7442 0.039 -
Table 6. Performance parameters of the considered systems
Value Parameters
Gas turbine cycle
1.149 Fuel flow rate (kg/s)
99.76 Air flow rate (kg/s)
38.666 Compressor power consumption (MW)
HRSG
1.785 LP saturated steam flow rate (kg/s)
1.845 MP saturated steam flow rate (kg/s)
5.04 HP superheated steam flow rate (kg/s)
336.1 HP superheated steam temperature (°C)
14.179 Qheating (MW)
Absorption Chiller
3.434 QEvaporator (MW)
3.834 QCondenser (MW)
4.585 QAbsorber (MW)
4.063 QGenerator (MW)
0.845 COP
Desalination
16.12 Capacity of the MED-TVC system (kg/s)
60.04 Product average temperature before the feed water heater (°C)
1.038 QDesalination (MW)
9.033 Gain output ratio (GOR)
0.09615 Water consumption in the de-superheater (kg/s)
1.785 Total Steam consumption (kg/s)
40.15 Total feed flow rate for all effects (kg/s)
Combined system
84.6 Efficiency of the system (%)
PARAMETRIC STUDY
In this section, the effects of the important operational parameters such as compressor pressure ratio, gas
turbine inlet temperature, pressures (LP, MP and HP) of the drums of the HRSG, LP, MP and HP pinch points and
the temperature differences between the effects of the MED are considered for the parametric study of the proposed
system performance.
Effects of the Compressor Pressure Ratio The changes in cooling, heating and fresh water productions, fuel consumption and also efficiency of the
system with the variation of air compressor pressure ratio (rc) are shown in Fig. 4. As pressure ratio increases, the
fuel consumption decreases. This is because of the increase of the air temperature and flow rate that enters the
combustion chamber. Namely, when the inlet air energy increases, less fuel is consumed to meet the energy balance
necessities (see Fig. 4a). The compressor power consumption and turbine power generation increase at high
Journal of Thermal Engineering, Research Article, Vol. 4, No. 3, pp. 1963-1983, April, 2018
1976
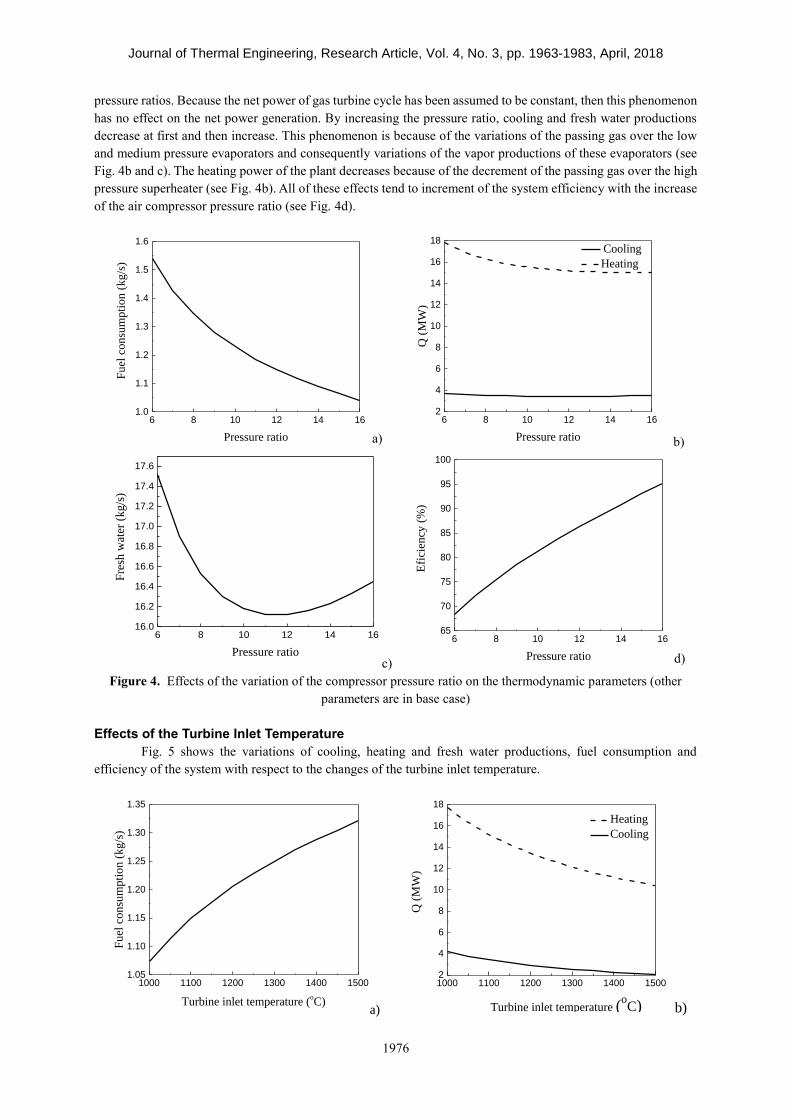
pressure ratios. Because the net power of gas turbine cycle has been assumed to be constant, then this phenomenon
has no effect on the net power generation. By increasing the pressure ratio, cooling and fresh water productions
decrease at first and then increase. This phenomenon is because of the variations of the passing gas over the low
and medium pressure evaporators and consequently variations of the vapor productions of these evaporators (see
Fig. 4b and c). The heating power of the plant decreases because of the decrement of the passing gas over the high
pressure superheater (see Fig. 4b). All of these effects tend to increment of the system efficiency with the increase
of the air compressor pressure ratio (see Fig. 4d).
Figure 4. Effects of the variation of the compressor pressure ratio on the thermodynamic parameters (other
parameters are in base case)
Effects of the Turbine Inlet Temperature
Fig. 5 shows the variations of cooling, heating and fresh water productions, fuel consumption and
efficiency of the system with respect to the changes of the turbine inlet temperature.
6 8 10 12 14 161.0
1.1
1.2
1.3
1.4
1.5
1.6
Fuel
consu
mpti
on
(kg/s
)
Pressure ratio a)
6 8 10 12 14 162
4
6
8
10
12
14
16
18
Q (
MW
)
Pressure ratio
Cooling
Heating
b)
6 8 10 12 14 1616.0
16.2
16.4
16.6
16.8
17.0
17.2
17.4
17.6
Fre
sh w
ater
(kg/s
)
Pressure ratioc)
6 8 10 12 14 1665
70
75
80
85
90
95
100
Efi
cien
cy (
%)
Pressure ratio d)
1000 1100 1200 1300 1400 15001.05
1.10
1.15
1.20
1.25
1.30
1.35
Fuel
consu
mpti
on (
kg/s
)
Turbine inlet temperature (oC)
a)
1000 1100 1200 1300 1400 15002
4
6
8
10
12
14
16
18
Heating
Cooling
Q (
MW
)
Turbine inlet temperature (oC) b)
Journal of Thermal Engineering, Research Article, Vol. 4, No. 3, pp. 1963-1983, April, 2018
1977
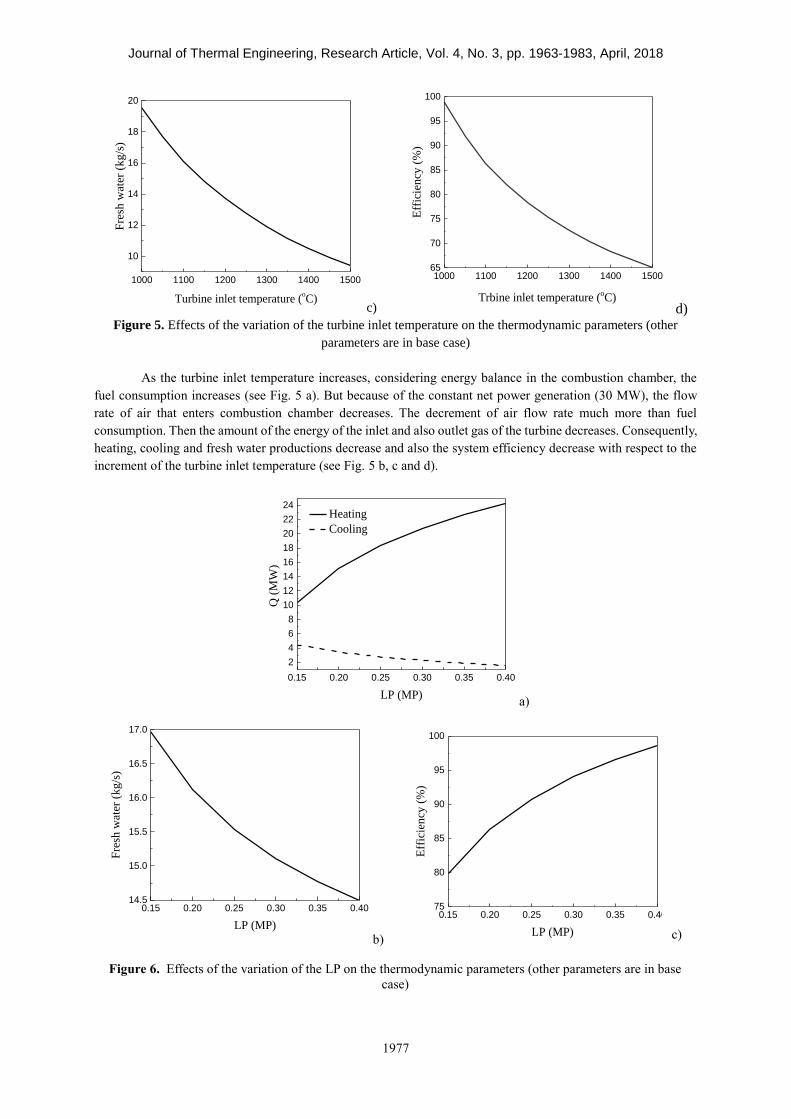
Figure 5. Effects of the variation of the turbine inlet temperature on the thermodynamic parameters (other
parameters are in base case)
As the turbine inlet temperature increases, considering energy balance in the combustion chamber, the
fuel consumption increases (see Fig. 5 a). But because of the constant net power generation (30 MW), the flow
rate of air that enters combustion chamber decreases. The decrement of air flow rate much more than fuel
consumption. Then the amount of the energy of the inlet and also outlet gas of the turbine decreases. Consequently,
heating, cooling and fresh water productions decrease and also the system efficiency decrease with respect to the
increment of the turbine inlet temperature (see Fig. 5 b, c and d).
1000 1100 1200 1300 1400 1500
10
12
14
16
18
20
Fre
sh w
ater
(kg/s
)
Turbine inlet temperature (oC)
c)
1000 1100 1200 1300 1400 150065
70
75
80
85
90
95
100
Eff
icie
ncy
(%
)
Trbine inlet temperature (oC) d)
0.15 0.20 0.25 0.30 0.35 0.40
2
4
6
8
10
12
14
16
18
20
22
24 Heating
Cooling
Q (
MW
)
LP (MP)a)
0.15 0.20 0.25 0.30 0.35 0.4014.5
15.0
15.5
16.0
16.5
17.0
Fre
sh w
ater
(kg/s
)
LP (MP)
b)
0.15 0.20 0.25 0.30 0.35 0.4075
80
85
90
95
100
Eff
icie
ncy
(%
)
LP (MP) c)
Figure 6. Effects of the variation of the LP on the thermodynamic parameters (other parameters are in base
case)
Journal of Thermal Engineering, Research Article, Vol. 4, No. 3, pp. 1963-1983, April, 2018
1978
Effects of Variations of the Pressure in LP Evaporator of the HRSG
The variation of the LP has no effect on the fuel consumption. Combustion is occurred in the combustion
chamber and just the energy of the turbine exhaust gas is recovered in the HRSG. Then the variation of pressures
in the evaporators of the HRSG has not any effect on the fuel consumption. By increasing the LP, the saturation
temperature in the LP evaporator of the HRSG and also the LP evaporator outlet gas temperature increase (Eq.
(14)). This effect tends to the increment of the heating flow rate Eq. (15) and also amount of the heating (see Fig.6
a). Conversely, LP increment tends to the decrement of the steam flow rates that are needed for the absorption
chiller and also MED-TVC (Eqs. (18) and (19)). Then amount of cooling and fresh water productions are decreased
(see Fig.6a and b). Whereas the increment of the heating power is much more than the cooling and fresh water
productions, then the system efficiency increases as the increment of the LP (see Fig.6 c).
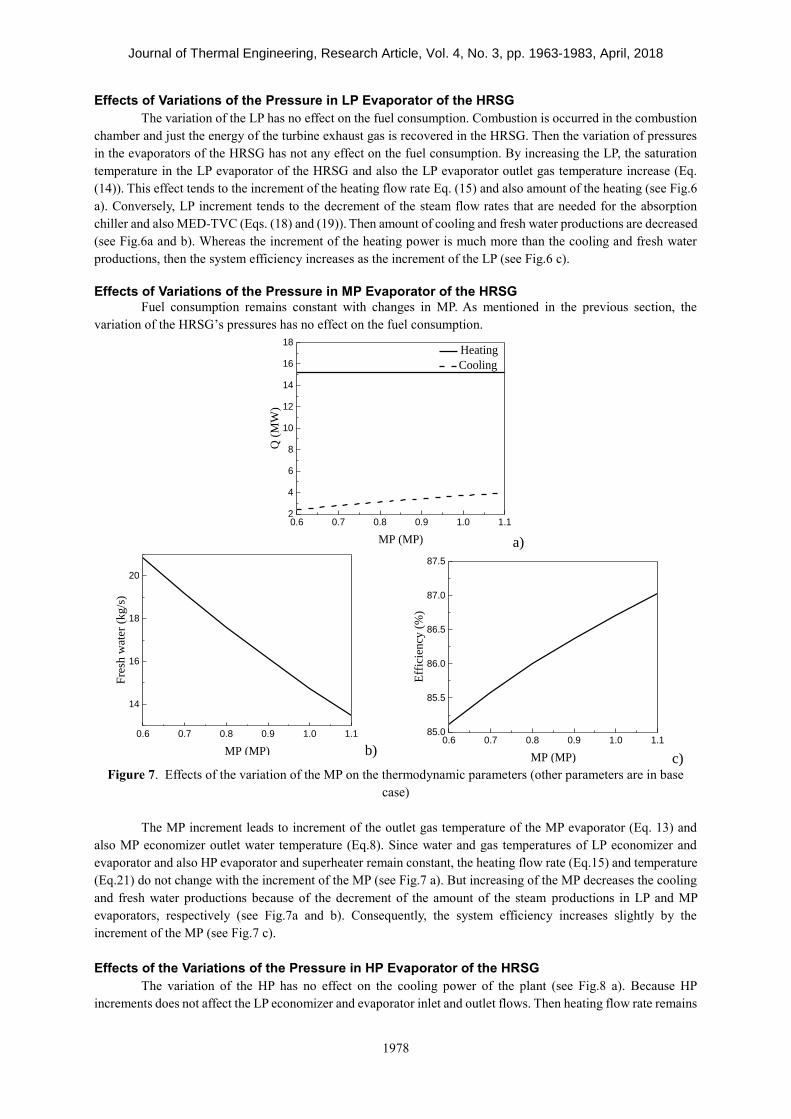
Effects of Variations of the Pressure in MP Evaporator of the HRSG
Fuel consumption remains constant with changes in MP. As mentioned in the previous section, the
variation of the HRSG’s pressures has no effect on the fuel consumption.
Figure 7. Effects of the variation of the MP on the thermodynamic parameters (other parameters are in base
case)
The MP increment leads to increment of the outlet gas temperature of the MP evaporator (Eq. 13) and
also MP economizer outlet water temperature (Eq.8). Since water and gas temperatures of LP economizer and
evaporator and also HP evaporator and superheater remain constant, the heating flow rate (Eq.15) and temperature
(Eq.21) do not change with the increment of the MP (see Fig.7 a). But increasing of the MP decreases the cooling
and fresh water productions because of the decrement of the amount of the steam productions in LP and MP
evaporators, respectively (see Fig.7a and b). Consequently, the system efficiency increases slightly by the
increment of the MP (see Fig.7 c).
Effects of the Variations of the Pressure in HP Evaporator of the HRSG
The variation of the HP has no effect on the cooling power of the plant (see Fig.8 a). Because HP
increments does not affect the LP economizer and evaporator inlet and outlet flows. Then heating flow rate remains
0.6 0.7 0.8 0.9 1.0 1.12
4
6
8
10
12
14
16
18 Heating
Cooling
Q (
MW
)
MP (MP) a)
0.6 0.7 0.8 0.9 1.0 1.1
14
16
18
20
Fre
sh w
ater
(k
g/s
)
MP (MP) b) 0.6 0.7 0.8 0.9 1.0 1.1
85.0
85.5
86.0
86.5
87.0
87.5
Eff
icie
ncy
(%
)
MP (MP) c)
Journal of Thermal Engineering, Research Article, Vol. 4, No. 3, pp. 1963-1983, April, 2018
1979
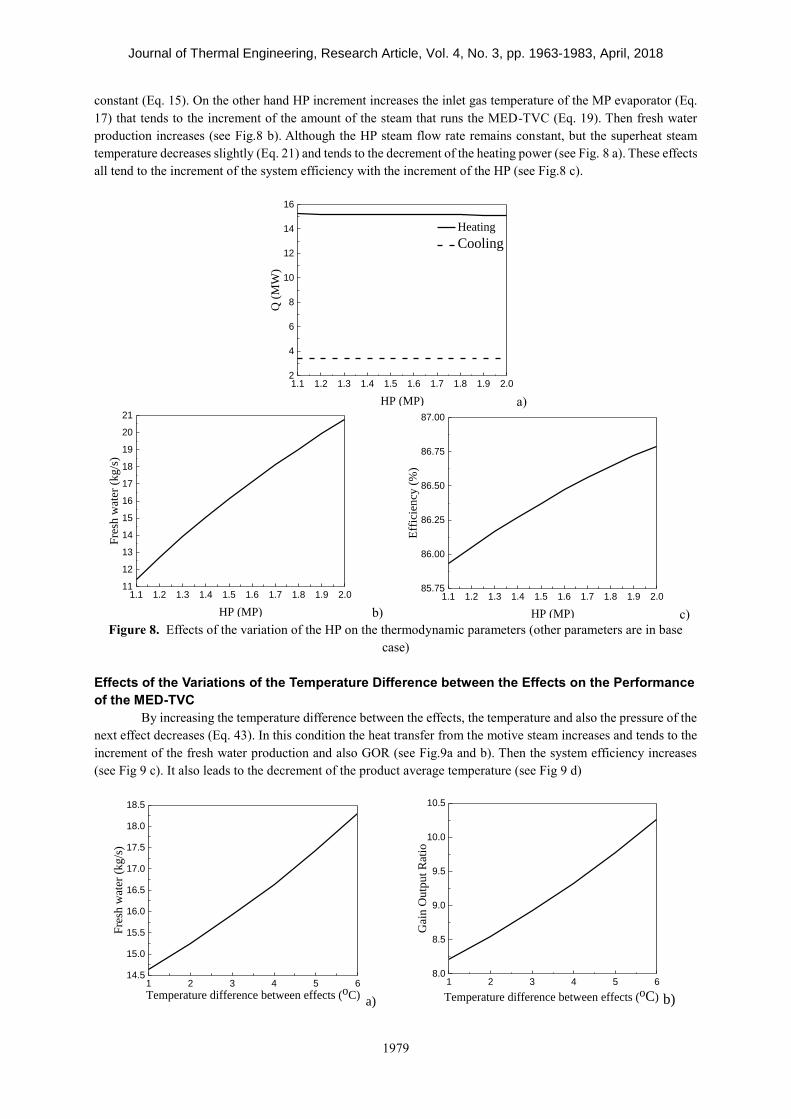
constant (Eq. 15). On the other hand HP increment increases the inlet gas temperature of the MP evaporator (Eq.
17) that tends to the increment of the amount of the steam that runs the MED-TVC (Eq. 19). Then fresh water
production increases (see Fig.8 b). Although the HP steam flow rate remains constant, but the superheat steam
temperature decreases slightly (Eq. 21) and tends to the decrement of the heating power (see Fig. 8 a). These effects
all tend to the increment of the system efficiency with the increment of the HP (see Fig.8 c).
Figure 8. Effects of the variation of the HP on the thermodynamic parameters (other parameters are in base
case)
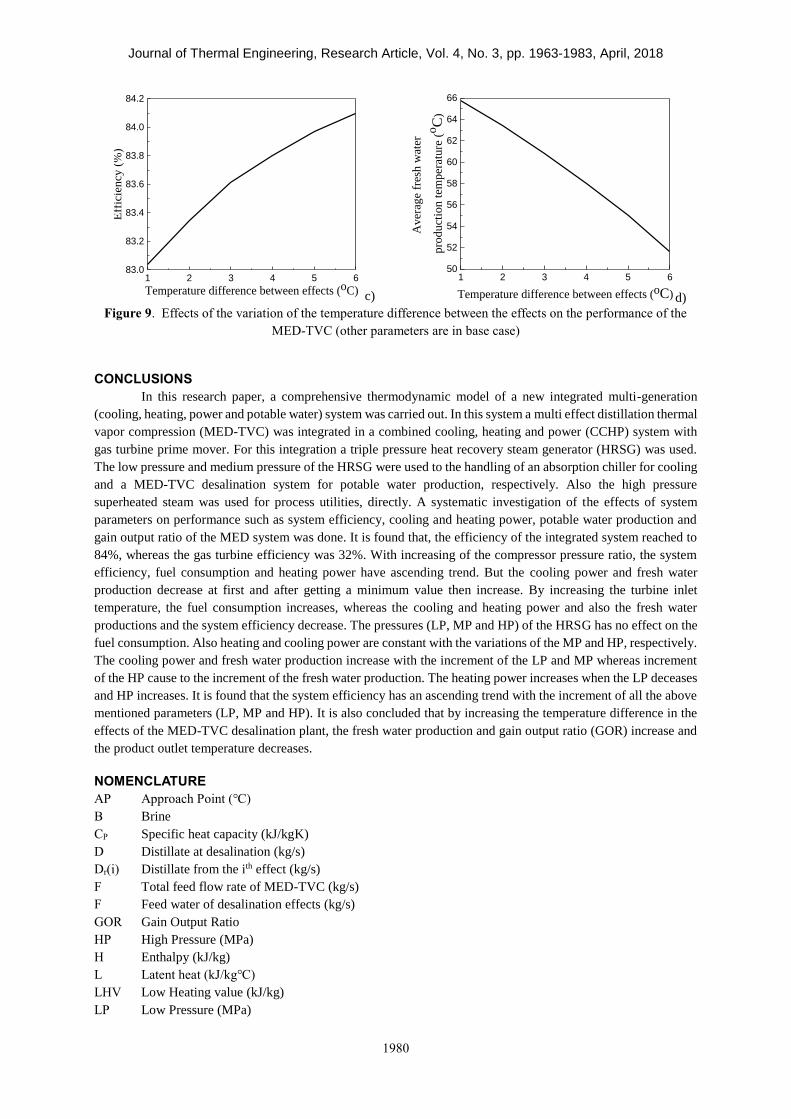
Effects of the Variations of the Temperature Difference between the Effects on the Performance
of the MED-TVC
By increasing the temperature difference between the effects, the temperature and also the pressure of the
next effect decreases (Eq. 43). In this condition the heat transfer from the motive steam increases and tends to the
increment of the fresh water production and also GOR (see Fig.9a and b). Then the system efficiency increases
(see Fig 9 c). It also leads to the decrement of the product average temperature (see Fig 9 d)
1.1 1.2 1.3 1.4 1.5 1.6 1.7 1.8 1.9 2.02
4
6
8
10
12
14
16
Heating
Cooling
Q (
MW
)
HP (MP) a)
1.1 1.2 1.3 1.4 1.5 1.6 1.7 1.8 1.9 2.011
12
13
14
15
16
17
18
19
20
21
Fre
sh w
ater
(kg/s
)
HP (MP) b)
1.1 1.2 1.3 1.4 1.5 1.6 1.7 1.8 1.9 2.085.75
86.00
86.25
86.50
86.75
87.00E
ffic
iency
(%
)
HP (MP) c)
1 2 3 4 5 614.5
15.0
15.5
16.0
16.5
17.0
17.5
18.0
18.5
Fre
sh w
ater
(kg/s
)
Temperature difference between effects (oC)a)
1 2 3 4 5 68.0
8.5
9.0
9.5
10.0
10.5
Gai
n O
utp
ut
Rat
io
Temperature difference between effects (oC) b)
Journal of Thermal Engineering, Research Article, Vol. 4, No. 3, pp. 1963-1983, April, 2018
1980
Figure 9. Effects of the variation of the temperature difference between the effects on the performance of the
MED-TVC (other parameters are in base case)
CONCLUSIONS
In this research paper, a comprehensive thermodynamic model of a new integrated multi-generation
(cooling, heating, power and potable water) system was carried out. In this system a multi effect distillation thermal
vapor compression (MED-TVC) was integrated in a combined cooling, heating and power (CCHP) system with
gas turbine prime mover. For this integration a triple pressure heat recovery steam generator (HRSG) was used.
The low pressure and medium pressure of the HRSG were used to the handling of an absorption chiller for cooling
and a MED-TVC desalination system for potable water production, respectively. Also the high pressure
superheated steam was used for process utilities, directly. A systematic investigation of the effects of system
parameters on performance such as system efficiency, cooling and heating power, potable water production and
gain output ratio of the MED system was done. It is found that, the efficiency of the integrated system reached to
84%, whereas the gas turbine efficiency was 32%. With increasing of the compressor pressure ratio, the system
efficiency, fuel consumption and heating power have ascending trend. But the cooling power and fresh water
production decrease at first and after getting a minimum value then increase. By increasing the turbine inlet
temperature, the fuel consumption increases, whereas the cooling and heating power and also the fresh water
productions and the system efficiency decrease. The pressures (LP, MP and HP) of the HRSG has no effect on the
fuel consumption. Also heating and cooling power are constant with the variations of the MP and HP, respectively.
The cooling power and fresh water production increase with the increment of the LP and MP whereas increment
of the HP cause to the increment of the fresh water production. The heating power increases when the LP deceases
and HP increases. It is found that the system efficiency has an ascending trend with the increment of all the above
mentioned parameters (LP, MP and HP). It is also concluded that by increasing the temperature difference in the
effects of the MED-TVC desalination plant, the fresh water production and gain output ratio (GOR) increase and
the product outlet temperature decreases.
NOMENCLATURE
AP Approach Point (℃)
B Brine
CP Specific heat capacity (kJ/kgK)
D Distillate at desalination (kg/s)
Dr(i) Distillate from the ith effect (kg/s)
F Total feed flow rate of MED-TVC (kg/s)
F Feed water of desalination effects (kg/s)
GOR Gain Output Ratio
HP High Pressure (MPa)
H Enthalpy (kJ/kg)
L Latent heat (kJ/kg℃)
LHV Low Heating value (kJ/kg)
LP Low Pressure (MPa)
1 2 3 4 5 683.0
83.2
83.4
83.6
83.8
84.0
84.2
Eff
icie
ncy
(%
)
Temperature difference between effects (oC) c)
1 2 3 4 5 650
52
54
56
58
60
62
64
66
Av
erag
e fr
esh
wat
er
pro
duct
ion t
emper
ature
(oC
)
Temperature difference between effects (oC) d)
Journal of Thermal Engineering, Research Article, Vol. 4, No. 3, pp. 1963-1983, April, 2018
1981
�� Mass flow rate (kg/s)
MP Medium Pressure (MPa)
PP Pinch Point (℃)
�� Heat (MW)
R Pressure ratio
Rej Sea water reject (kg/s)
T Temperature (℃)
�� Power (MW)
X Mass concentration (%)
Greek Symbols
Η Eficiency (%)
ω Humidity ratio
λ Fuel to air rati
∆T Temperature difference (℃)
Subscripts
a Air
abs Absorber
evap Evaporator
f Fluid
fuel Fuel
I Inlet
Gen Generator
G Gas
HP High pressure
liBr Litium bromid
LP Low pressure
MP Medium pressure
P Product
S First effect desalination inlet
sh Super heater
sat,LP Low pressure saturation
sat,MP Medium pressure saturation
sat,HP High pressure saturation
sat Saturation
sw Sea water
t Turbine
REFERENCES
[1] Dincer, I. (2000). Renewable energy and sustainable development: a crucial review. Renewable and sustainable
energy reviews, 4(2), 157-175.
[2] Dincer, I., & Rosen, M. A. (1998). A worldwide perspective on energy, environment and sustainable
development. International Journal of Energy Research, 22(15), 1305-1321.
[3] Dincer, I. (1998). Energy and environmental impacts: present and future perspectives. Energy sources, 20(4-
5), 427-453.
[4] Dincer, I., & Rosen, M. A. (1999). Energy, environment and sustainable development. Applied energy, 64(1-
4), 427-440.
[5] Ghaebi, H., Amidpour, M., Karimkashi, S., & Rezayan, O. (2011). Energy, exergy and thermoeconomic
analysis of a combined cooling, heating and power (CCHP) system with gas turbine prime mover. International
Journal of Energy Research, 35(8), 697-709.
Journal of Thermal Engineering, Research Article, Vol. 4, No. 3, pp. 1963-1983, April, 2018
1982
[6] Ghaebi, H., Saidi, M. H., & Ahmadi, P. (2012). Exergoeconomic optimization of a trigeneration system for
heating, cooling and power production purpose based on TRR method and using evolutionary algorithm. Applied
thermal engineering, 36, 113-125.
[7] Orhan, M. F., Dincer, I., Naterer, G. F., & Rosen, M. A. (2010). Coupling of copper–chloride hybrid
thermochemical water splitting cycle with a desalination plant for hydrogen production from nuclear energy.
International Journal of Hydrogen Energy, 35(4), 1560-1574.
[8] Uche, J., Serra, L., & Valero, A. (2001). Thermoeconomic optimization of a dual-purpose power and
desalination plant. Desalination, 136(1-3), 147-158.
[9] Zamen, M., Amidpour, M., & Soufari, S. M. (2009). Cost optimization of a solar humidification–
dehumidification desalination unit using mathematical programming. Desalination, 239(1-3), 92-99.
[10] Wang, Y., & Lior, N. (2006). Performance analysis of combined humidified gas turbine power generation
and multi-effect thermal vapor compression desalination systems—Part 1: The desalination unit and its
combination with a steam-injected gas turbine power system. Desalination, 196(1-3), 84-104. [11] J. Johansen,
R.F. Babus'Haq, S.D. Probert, An integrated CHP and desalination plant, Appl. Energy 53 (1996) 157–178.
[12] Wade, N. M. (1999). Energy and cost allocation in dual-purpose power and desalination plants. Desalination,
123(2-3), 115-125.
[13] Cardona, E., & Piacentino, A. (2004). Optimal design of cogeneration plants for seawater desalination.
Desalination, 166, 411-426.
[14] Darwish, M. A. (2004). Co-generation power desalting plants: new outlook with gas turbines. Desalination,
161(1), 1-12.
[15] Rensonnet, T., Uche, J., & Serra, L. (2007). Simulation and thermoeconomic analysis of different
configurations of gas turbine (GT)-based dual-purpose power and desalination plants (DPPDP) and hybrid plants
(HP). Energy, 32(6), 1012-1023.
[16] Wang, Y., & Lior, N. (2006). Performance analysis of combined humidified gas turbine power generation
and multi-effect thermal vapor compression desalination systems—Part 1: The desalination unit and its
combination with a steam-injected gas turbine power system. Desalination, 196(1-3), 84-104.
[17] Wang, Y., & Lior, N. (2007). Performance analysis of combined humidified gas turbine power generation
and multi-effect thermal vapor compression desalination systems—Part 2: The evaporative gas turbine based
system and some discussions. Desalination 207, 243–256.
[18] Chacartegui, R., Sanchez, D., Di Gregorio, N., Jiménez-Espadafor, F. J., Munoz, A., & Sanchez, T. (2009).
Feasibility analysis of a MED desalination plant in a combined cycle based cogeneration facility. Applied thermal
engineering, 29(2-3), 412-417.
[19] Manesh, M. K., & Amidpour, M. (2009). Multi-objective thermoeconomic optimization of coupling MSF
desalination with PWR nuclear power plant through evolutionary algorithms. Desalination, 249(3), 1332-1344.
[20] Ansari, K., Sayyaadi, H., & Amidpour, M. (2010). Thermoeconomic optimization of a hybrid pressurized
water reactor (PWR) power plant coupled to a multi effect distillation desalination system with thermo-vapor
compressor (MED-TVC). Energy, 35(5), 1981-1996.
[21] Hosseini, S. R., Amidpour, M., & Behbahaninia, A. (2011). Thermoeconomic analysis with reliability
consideration of a combined power and multi stage flash desalination plant. Desalination, 278(1-3), 424-433.
[22] Hosseini, S. R., Amidpour, M., & Shakib, S. E. (2012). Cost optimization of a combined power and water
desalination plant with exergetic, environment and reliability consideration. Desalination, 285, 123-130.
[23] Shakib, S. E., Amidpour, M., & Aghanajafi, C. (2012). A new approach for process optimization of a METVC
desalination system. Desalination and Water Treatment, 37(1-3), 84-96.
[24] Shakib, S. E., Amidpour, M., & Aghanajafi, C. (2012). Simulation and optimization of multi effect
desalination coupled to a gas turbine plant with HRSG consideration. Desalination, 285, 366-376.
[25] Esfahani, I. J., & Yoo, C. (2014). Feasibility study and performance assessment for the integration of a steam-
injected gas turbine and thermal desalination system. Desalination, 332(1), 18-32.
[26] Almutairi, A., Pilidis, P., Al-Mutawa, N., & Al-Weshahi, M. (2016). Energetic and exergetic analysis of
cogeneration power combined cycle and ME-TVC-MED water desalination plant: Part-1 operation and
performance. Applied Thermal Engineering, 103, 77-91.
[27] Hanafi, A. S., Mostafa, G. M., Fathy, A., & Waheed, A. (2015). Thermo-economic analysis of combined
cycle MED-TVC desalination system. Energy Procedia, 75, 1005-1020.
[28] Sanaye, S., & Asgari, S. (2013). Four E analysis and multi-objective optimization of combined cycle power
plants integrated with Multi-stage Flash (MSF) desalination unit. Desalination, 320, 105-117.
[29] Bejan, A., & Tsatsaronis, G. (1996). Thermal design and optimization. John Wiley & Sons.
[30] Korakianitis, T., & Wilson, D. G. (1994). Methods for prediction the performance of Brayton-cycle engines.
ASME Journal of Engineering for Gas Turbines and Power, 166, 381–388.
[31] Herold, K. E., Radermacher, R., & Klein, S. A. (2016). Absorption chillers and heat pumps. CRC press.
[32] Kamali, R. K., Abbassi, A., & Vanini, S. S. (2009). A simulation model and parametric study of MED–TVC
process. Desalination, 235(1-3), 340-351.

Journal of Thermal Engineering, Research Article, Vol. 4, No. 3, pp. 1963-1983, April, 2018
1983
[33] Sayyaadi, H., & Saffari, A. (2010). Thermoeconomic optimization of multi effect distillation desalination
systems. Applied Energy, 87(4), 1122-1133.