performance analysis of cloud computing architectures ... · 112 2.3 performance analysis of cloud...
TRANSCRIPT
112
2.3 Performance Analysis of Cloud Computing Architectures Using Discrete Event Simulation
Performance Analysis of Cloud Computing Architectures Using Discrete Event Simulation
John C Stocker & Andrew M. Golomb Booz Allen Hamitton, Inc .
stocker [email protected] [email protected]
Abstract. Cloud computing offers the economic benefit of on-demand resource allocation to meet changing enterprise computing needs. However, the nexibility of cloud computing is disadvantaged when compa red to traditional hosting in providing predictable application and service performance. Cloud computing relies on resource scheduling in a virtualized nelwork-cenlric server environment, which makes sIalic performance analysis infeasible. We developed a discrete event simulation model to evaluate the overall effectiveness of organizations in executing their work"ow in trad ~iona l and cloud computing architectures. The two part model frameworl< characterizes both the demand using a probabil rty distribution for each type of service request as well as enterprise computing resource constraints. Our simulations provkle quantitative analysis to design and provision computing architectures that maximize overall mission effectiveness. We share our analysis of key resource constraints in cloud computing architectures and findings on the appropriateness of cloud computing in various applications.
1.0 INTRODUCTION
1.1 Motivation Organizations migrating to cloud computing are faced with the challenge of either negotiating service level agreements with a cloud provider or allocating limited resources to develop their own cloud computing implementation. In weighing appropriate cloud providers or architectures in developing their own implementations, organizations should take care to maximize their overall mission performance while minimizing cost.
Government organizations are motivated by the cost savings that can be realized through a cloud computing, but are generally hesitant to use established commercial services because of concerns over privacy and information security, [2] , [4] , [9]. As a result of these issues, real and perceived, many government clients have focused on private and community cloud architectures. Determining the appropriate size for a private or communication cloud is a novel problem in the cloud computing community , as commercial sector enterprises growing more confident in leveraging commodity cloud services from established vendors, [2]. Details on the capacity and infrastructure among commercial cloud service providers are
closely held as trade secrets, and cannot benefit organizations looking to develop their own cloud infrastructure. Some providers even protect the number of data centers they operate, [5].
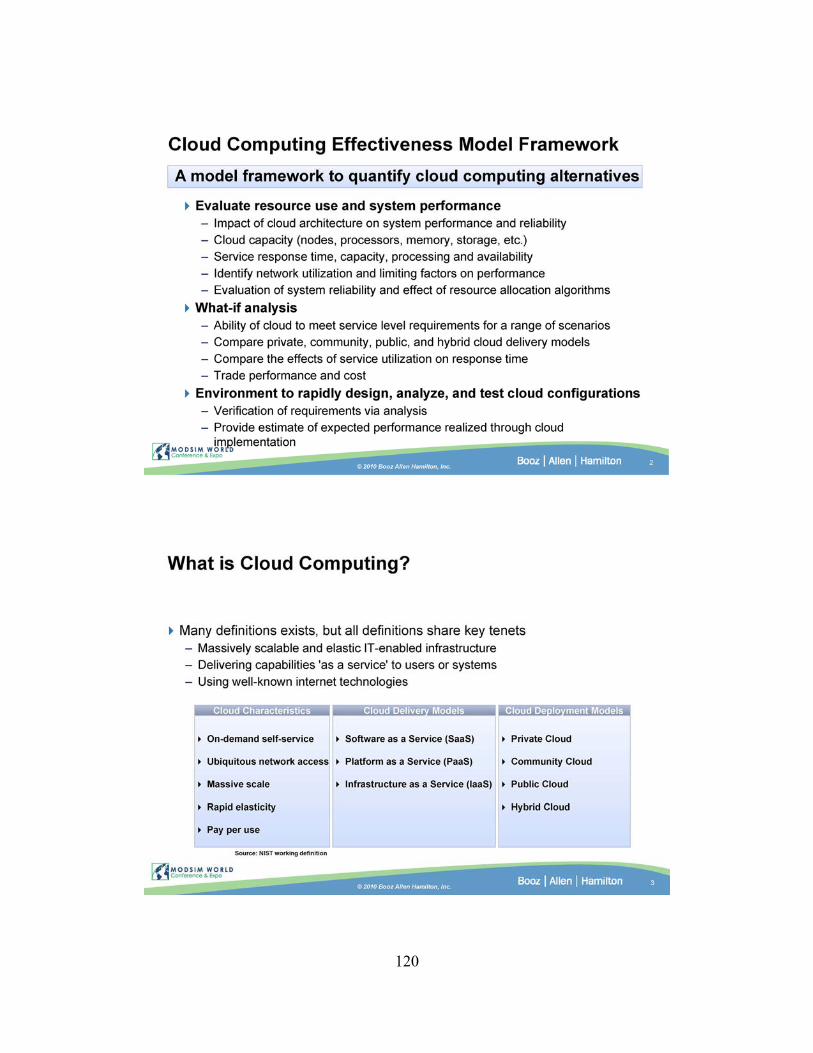
Appropriately resourcing cloud infrastructure that will both enable rapid elasticity as needed to meet user demand while not over building is a significant challenge. We present a quantitative cloud computing architecture effectiveness and performance model framework to support the design and analysis of cloud architecture implementations. Dynamic modeling is necessary to ensure that enterprise effectiveness is maintained as mission requ irements change over time. We anticipate two primary applications of our model framework:
• Cloud infrastructure design: Enable quantitative requirements analysis for the specification of cloud characteristics and infrastructure design.
• Service Level Agreement specification: Model anticipated service usage across the organization determine required quality of service (OoS) for cloud services.
https://ntrs.nasa.gov/search.jsp?R=20110012138 2018-07-05T16:33:11+00:00Z
113
1.2 Analyzing Cloud Effectiveness and Performance
We developed a cloud computing effectiveness and performance model framework to analyze the effectiveness of various doud computing architectures in meeting enterprise computing requirements by applying operations research techniques. The analytic model coupled with a companion cost analysis model [1] will enable the development of comprehensive migration strategies that right-size investments in developing private, community, and public cloud computing solutions. \M1ile previous research has analyzed the performance of cloud computing [10] , that work focused on cloud service requirements , and not detailed analysis of various cloud architectures. To the best of our knowledge, we are the first
to develop a generalized approach that can provide analysis of detailed cloud infrastructure characteristi cs.
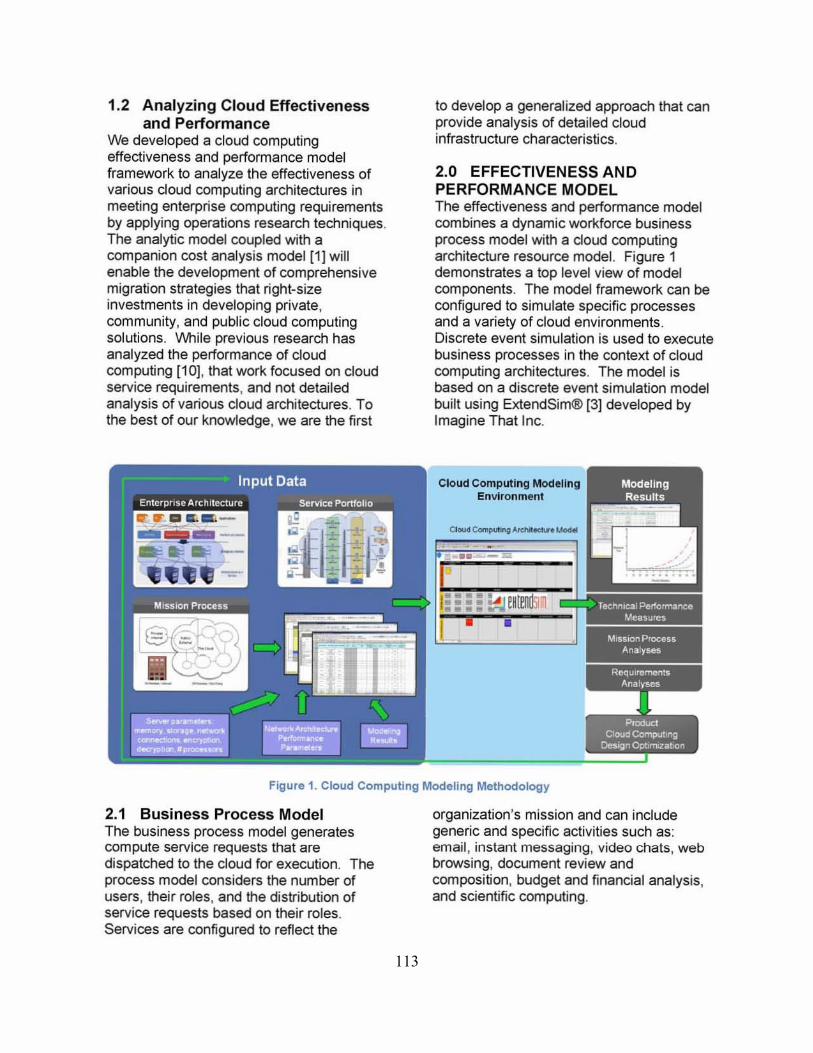
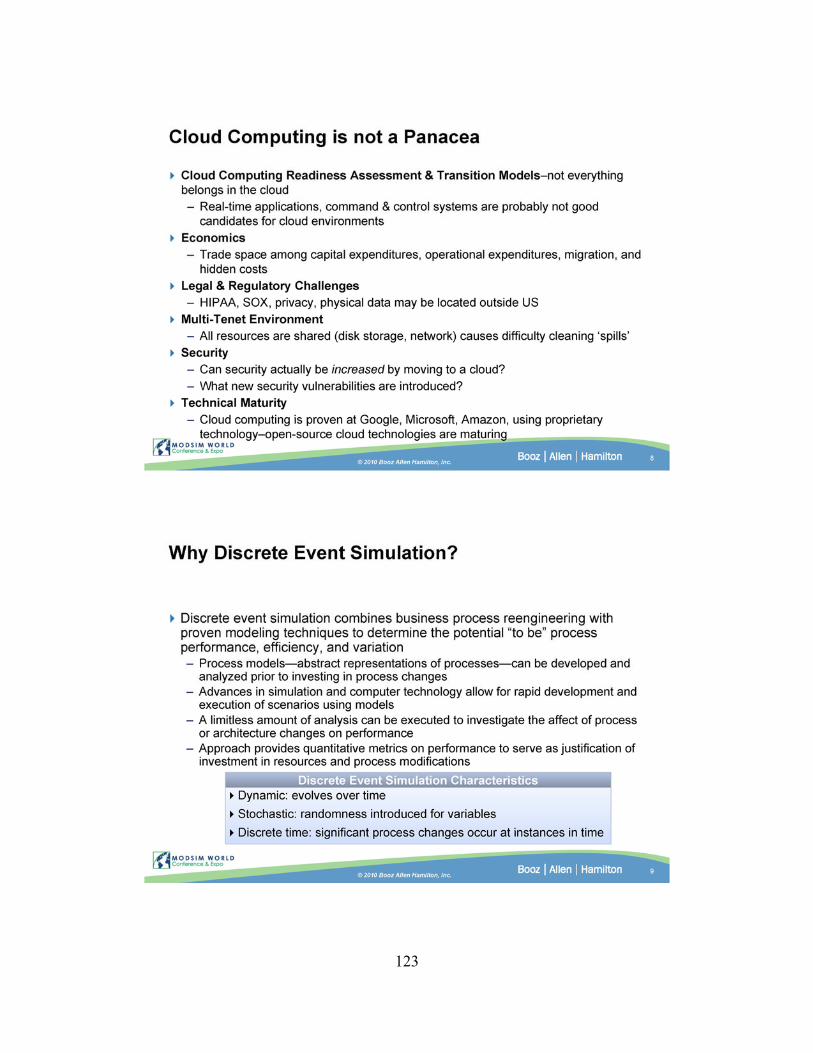
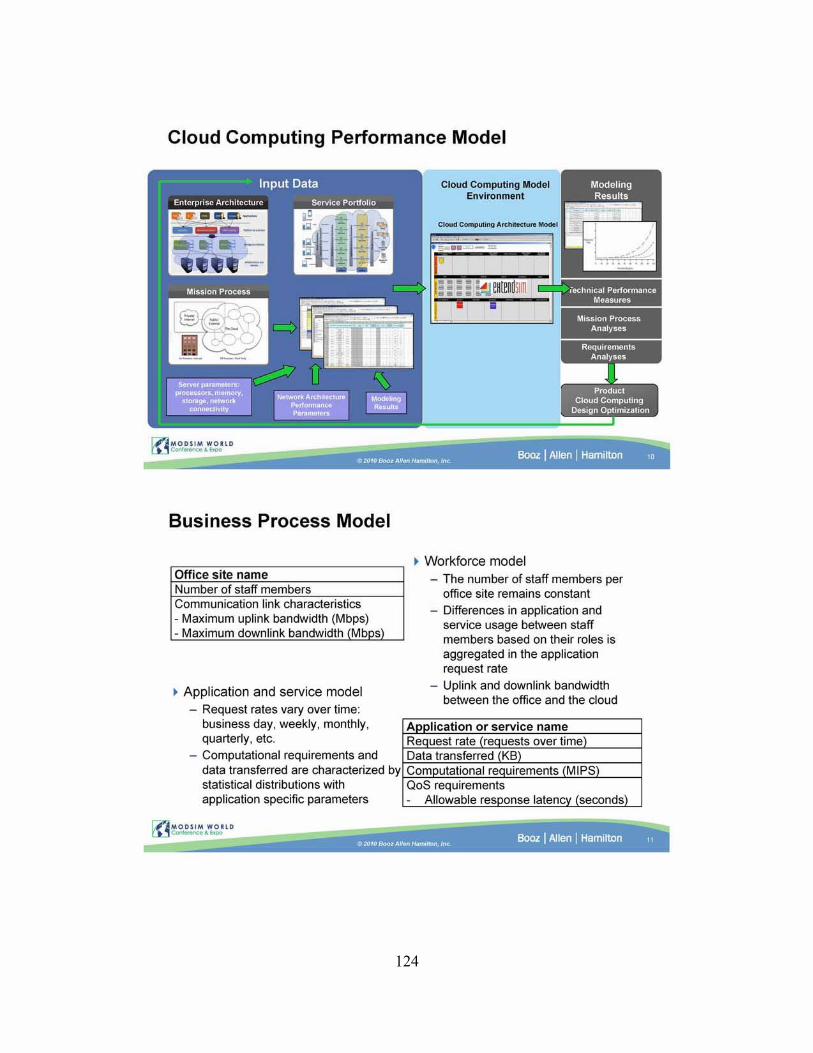
2.0 EFFECTIVENESS AN D PERFORMANCE MODEL The effectiveness and performance model combines a dynamic workforce business process model with a doud computing architecture resource model. Figure 1 demonstrates a top level view of model components. The model framework can be configured to simulate specific processes and a variety of cloud environments. Discrete event simulation is used to execute business processes in the context of cloud computing architectures. The model is based on a discrete event simulation model built using ExtendSim® [3] developed by Imagine That Inc.
Cloud Computing Modeling Environment
M'U10II Process Analyses
Figure 1. Cloud Computing Modeling Methodology
2.1 Business Process Model The business process model generates compute service requests that are dispatched to the cloud for execution. The process model considers the number of users, their roles, and the distribution of service requests based on their roles. Services are configured to reflect the
organization's mission and can include generic and specific activities such as: email, instant messaging, video chats, web browsing, document review and composition, budget and financial analysis, and scientific computing.
114
The business process model is currently comprised of two top level models:
• Office • Service
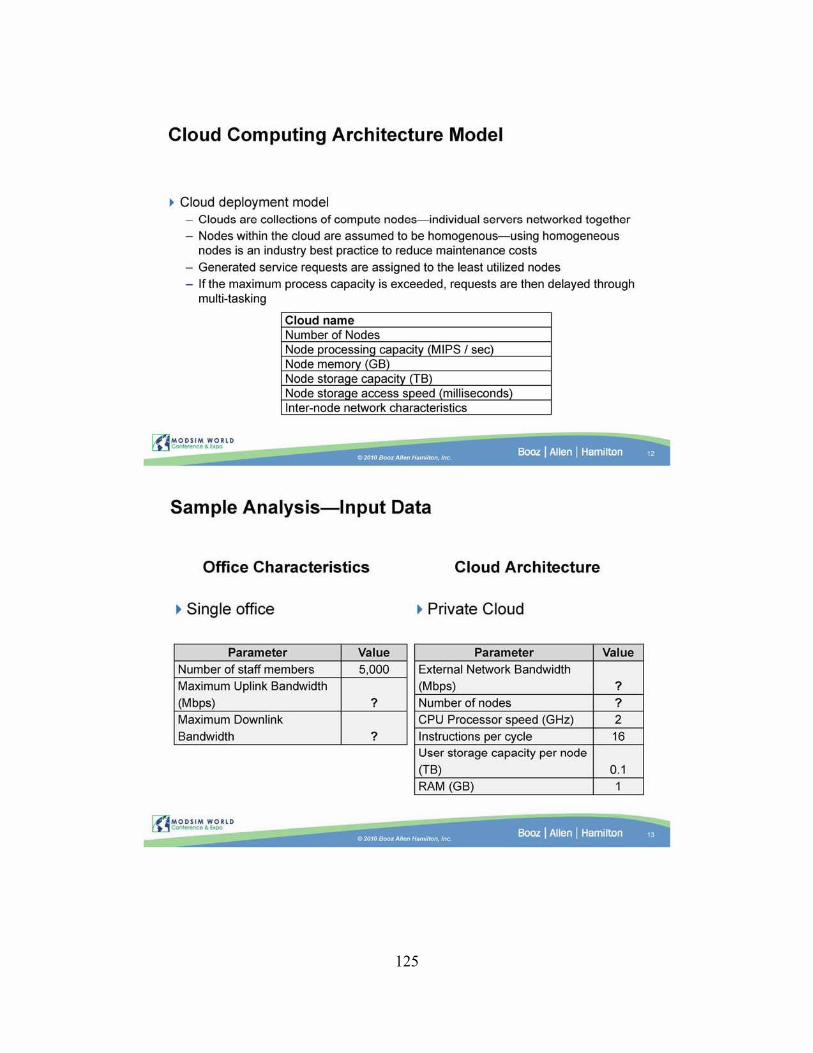
Numbers of staff are affiliated within offices to model the overall organization effectiveness in community cloud architectures. Network characteristics between users and cloud computing resources are specified at the office level to accurately model differences in network connectivity between users of community clouds. Table 1 describes the characteristics of the office model:
Office site name Number of staff members Communication link characteristics - Maximum uplink bandwidth (Mbps) • Maximum downlink bandwidth (MbDS)
Table 1. Office model
The business process model has sophisticated capability to generate service demand based on the rhythm in the workforce and enterprise needs. The process model can also represent surges in service demand that may be triggered by mission events. This capability is crucial in analyzing the benefits of cloud elasticity in meeting mission requirements. Table 2 defines the characteristics of the software or service modeled.
Aoolication or service name Reauest rate Data transferred (KB) Computational requirements (MIPS) OoS requirements
. Allowable response latency Table 2. Service model
The service model characterizes request rate in terms of on demand, hourly, daily, weekly, monthly, and quarterly. On demand requests are specified using a statistical distribution of demand rate or interarrival time. Data transferred and computational requirements are also statistical
distributions that define average and peak values.
Using statistical distributions permits significant flexibility in modeling various services and processes. Distributions can be varied (e.g., Gaussian, Poisson, triangular) to most accurately represent the specific enterprise and mission being modeled. The business process model framework is flexible and can represent diverse work streams throughout the enterprise.
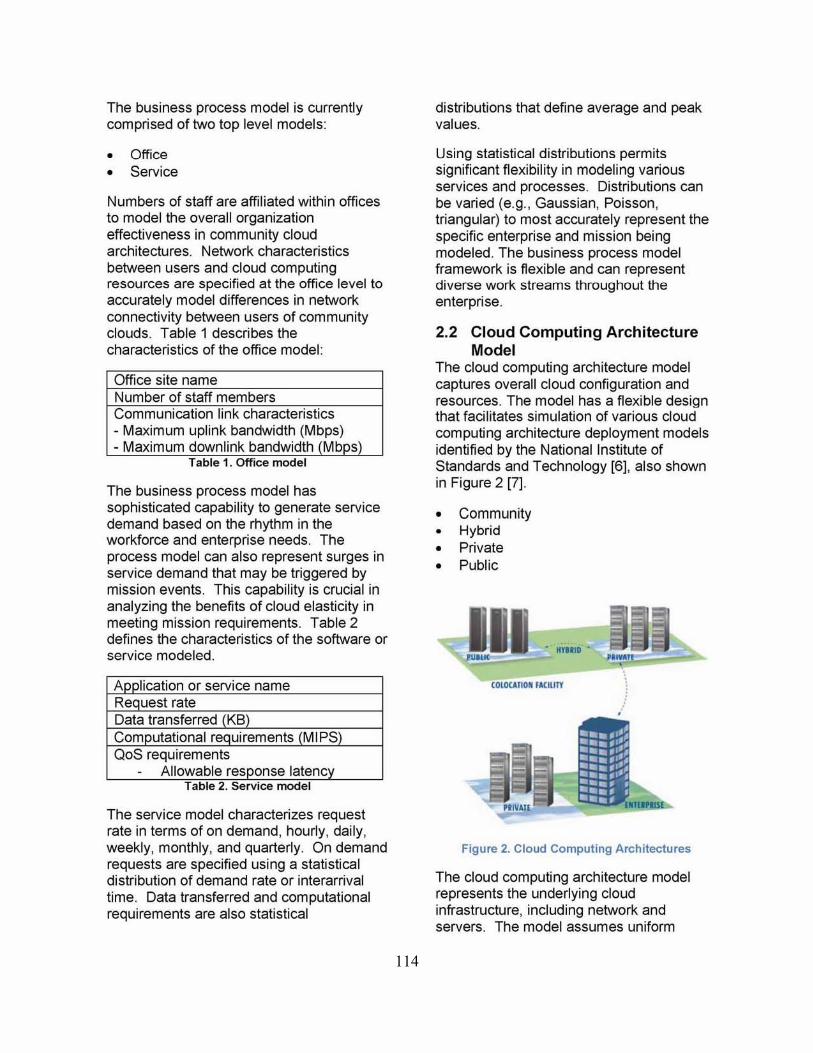
2.2 Cloud Computing Architecture Model
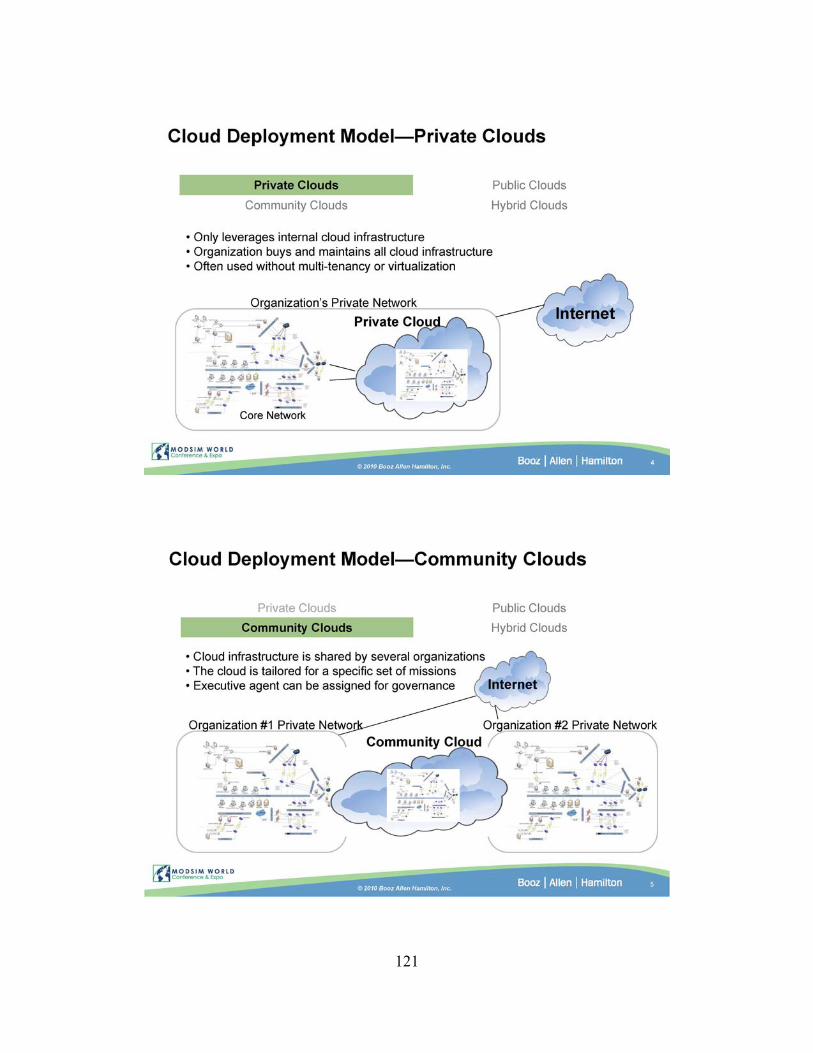
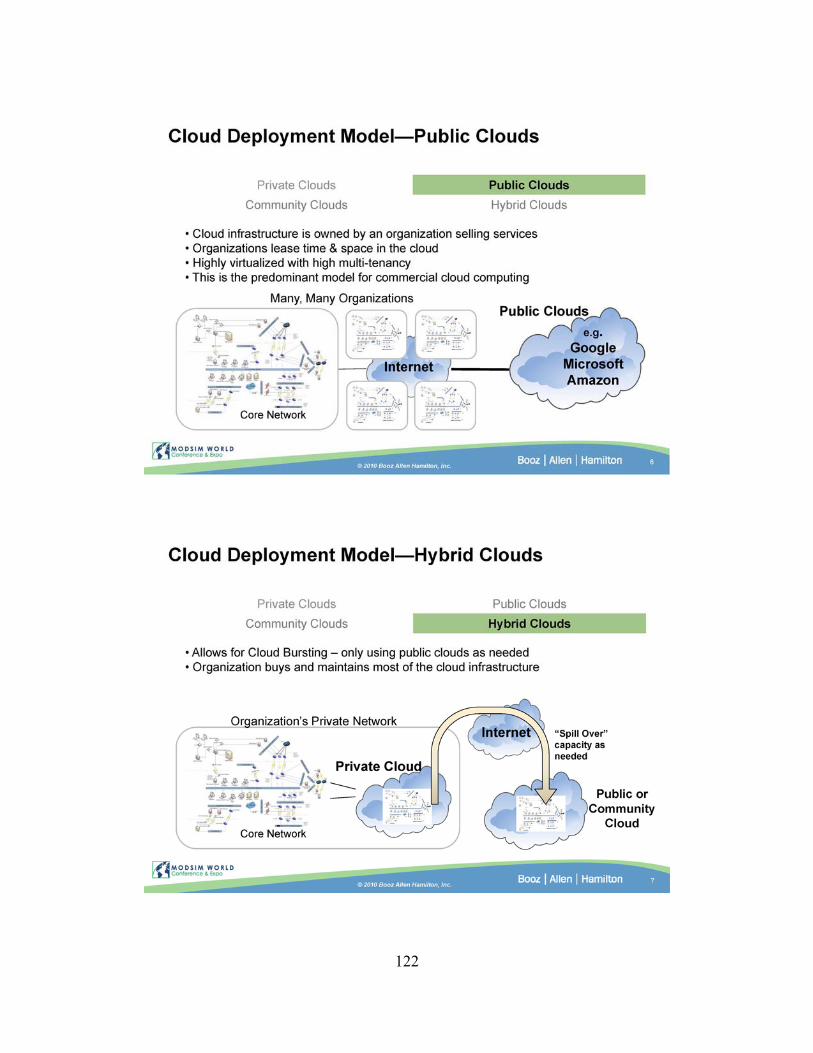
The cloud computing architecture model captures overall cloud configuration and resources. The model has a flexible design that faci litates simulation of various cloud computing architecture deployment models identified by the National Institute of Standards and Technology [6], also shown in Figure 2 [7] .
• Community • Hybrid
• Private • Public
t OUKAIlOIF fA(lLm
Figure 2. Cloud Computing Architectures
The cloud computing architecture model represents the underlying cloud infrastructure, including network and servers. The model assumes uniform
115
performance with respect to the three cloud service models: Software as a Service (SaaS), Platform as a Service (Paas), and Infrastructure as a Service (laaS). The distinctions between these service models are largely based on revenue models and not technical distinctions that affect overall performance of a cloud-based service solution.
NIST further describes the characteristics of cloud computing environments, including:
• On-demand self-service • Broad network access • Resource pooling • Rapid elasticity • Measured service
The scope of model focuses on providing an analysis of necessary cloud computing node resource characteristics, such as network access, processing capacity, memory, and storage. The model assumes that the nodes are homogenous. The internal network resources between cloud nodes are also modeled and can represent various server interconnectivity solutions. Table 3 specifies the characteristics captured in the cloud architecture model.
Number of Nodes Node processinQ capacity Node memorv Node storao. caoacii' Node storane access sneed Internode network characteristics
Table 3. Cloud model
A limitation of the cloud architecture model in its current state is its inability to represent hybrid cloud solutions that incorporate multiple instances of cloud environments into a single implementation. This limitation restricts current analysis to consider only private, community, and public infrastructure. Future work is planned to incorporate the ability to represent hybrid implementations that consider combinations of private, community , and public cloud environments.
It is important to note that the cloud architecture model framework is also flexible enough to represent traditional fixed hosting infrastructure to permit comparisons of service performance between cloud and traditional hosting environments.
3.0 EFFECTIVENESS AND PERFORMANCE METRICS
3.1 Measures of Effectiveness Measures of effectiveness focus on the ability of the cloud infrastructure to meet service demand in a timely fashion and enable the organization to perform its mission.
3.1.1 On-Time Response Rate On-time response rate is the cumulative distribution of service requests that are completed and responded to within the required latency. Acceptable latency is service and mission specific and typically varies in magnitude from fractions of seconds to minutes.
3.1.2 Service Latency Service latency is the delay experienced by users in processing service demand. This measure is an indicator of services along the critical path in mission execution and an indicator of potential idleness in the workforce.
3.2 Measures of Performance Measures of performance characterize cloud resource utilization in meeting the service demand. The measures of performance gauge cloud elasticity in the context of an enterprise's mission requirements.
3.2.1 Cloud Processing Utilization Cloud processing utilization, as measured by the usage of overall cloud processing capacity over time and across all services in the mission workflow, is an indication of overall processing demand.
116
3.2.2 Cloud Storage Utilization Cloud storage utilization, as measured by the usage of cloud storage capacity over time and across the workflow, is an indication of overall storage demand.
3.2.3 Cloud Communications Util ization
Cloud communication utilization is the percentage of communications resources over time. Individual measures are recorded for each office communications link as well as the cloud communications infrastructure.
4.0 ANALYSIS Quantitative cloud architecture analysis using the effectiveness and performance model will help answer fundamental design questions and support trade studies that refine specific cloud technologies and solution sets. Analyzing the impact of cloud architectures characteristics on the enterprise is crucial to designing specifying acceptable cloud architecture implementations.
The cloud computing effectiveness and performance model will help answer design questions such as:
• Is a cloud architecture appropriate for the mission?
• Is a private, community , or public cloud best su ited to meet performance
Email 30 soo Database access 3 5
Instant messaging 50 soo Ema il wi attachment 5 20
Wiki/Blog entry 1 4
Office app usage 30 100
Modell simulat ion 8 16
Financial Report Gen 1 3
Video cha t 5 20
4
3000
1
2000
2
8
200
10
6
• Does the cloud have sufficient elasticity for all enterprises, offices, users, and missions?
• \lVhat is the right size cloud to meet mission requirements and minimize cost?
• Do communications resources need to be upgraded when services are migrated to a cloud architecture?
These questions are best addressed by considering the overall on-time response rate across all service requests among all users relative to the performance metrics. Ideally, the on-time response rate is 100%, however, given the scale of requests across the enterprise and resulting peaks of acti vity it's impractical to build a cloud that can scale rapidly enough to meet 100% on-time response rate at all times.
4,1 Example sensitivity analysis We conducted sensitivity analysis of on-time response rate based on some of the key cloud characteristics for a sample private cloud infrastructure. The sensitivity analysis of on-time response rate was performed by varying cloud computing architecture resource parameters. We looked for deflection points where there were diminishing retums in the overall on-time response rate relative to additional cloud resources : either more additional nodes or increased bandwidth.
1000 2 0.1 10
60000 120 1000 10000
2 2 0.05 1
20000 '" 1 10
40 5 1 10
SOO 1 10 100
1 ()()()()()() 2400 100000 10000000
40 1200 10000 100000
40 1 1000 10000
117
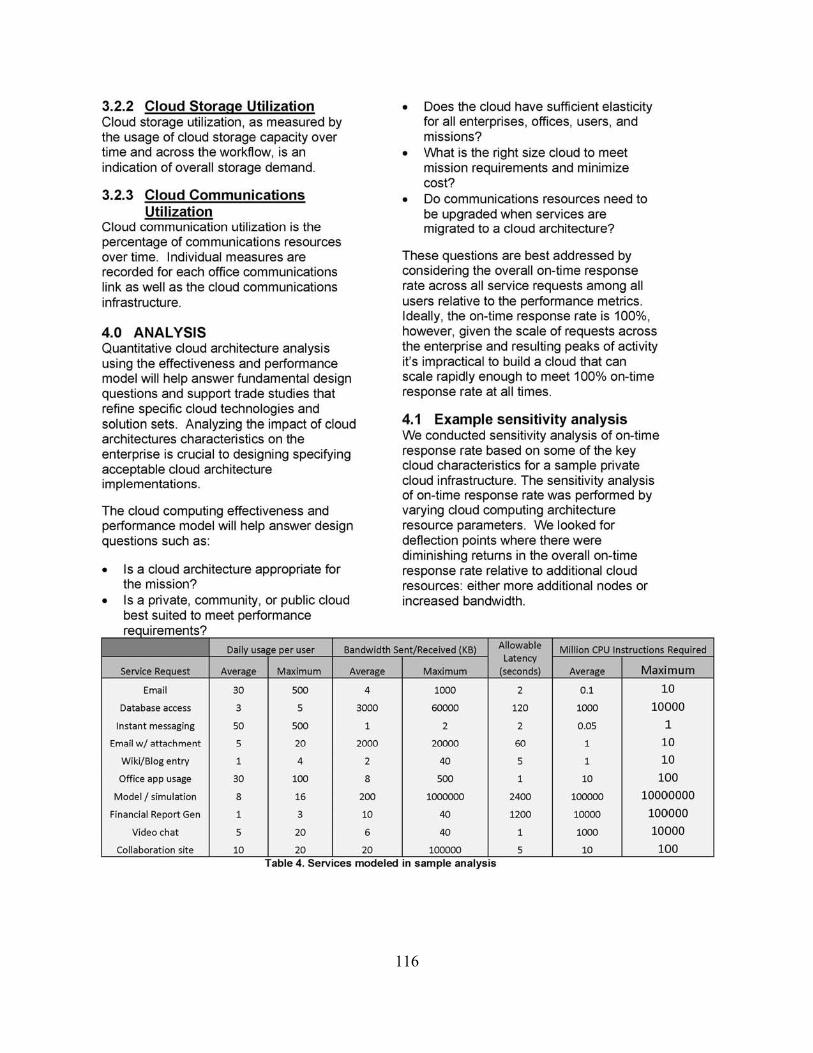
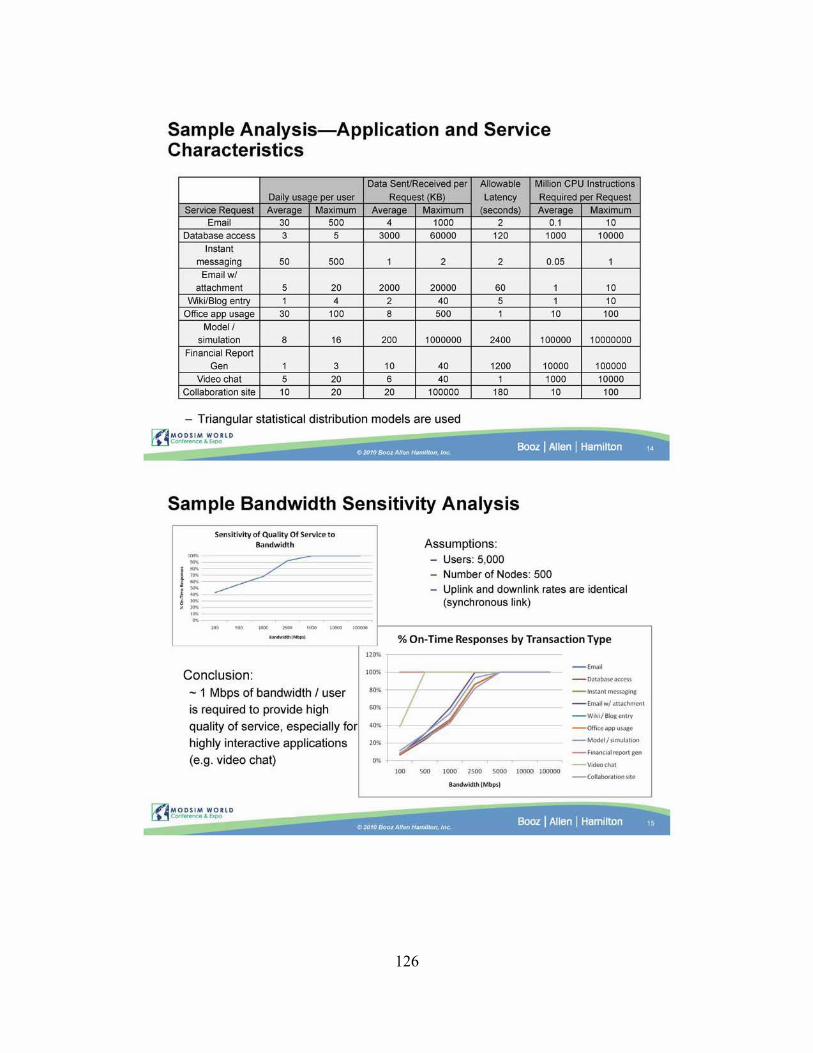
Our example sensitivity analysis considers a single enterprise office with 5,000 staff members using a private cloud infrastructure. In this sample sensitivity analysis we assumed that all users had uniform workflow and used services in equal distributions. It is reasonable to approximate usage at the service level across the enterprise instead of the user role level. Table 4 provides a summary ofthe service characteristics modeled in this example analysis.
Table 5 describes the cloud architecture characteristics used in this example analysis. Given the private cloud studied in this example, the bandwidth is the data rate between the office and the cloud implementation.
Bandwidth (Mbps) 5,000
Number of nodes 500 CPU Processor speed (GHz) 2
Instructions per cycle 16 Storage capacity per node (TB) 0.1
RAM (GB) 1 Table 5. Cloud architecture modehng In sample
analysis
In our sensitivity analysis we independently varied the available bandwidth between the office and cloud and the number of nodes to assess the impact of each on the on-time response rate. Other variables were held at values that would not impact effectiveness. In the sensitivity analysis, the cloud architecture was fixed at SOD nodes.
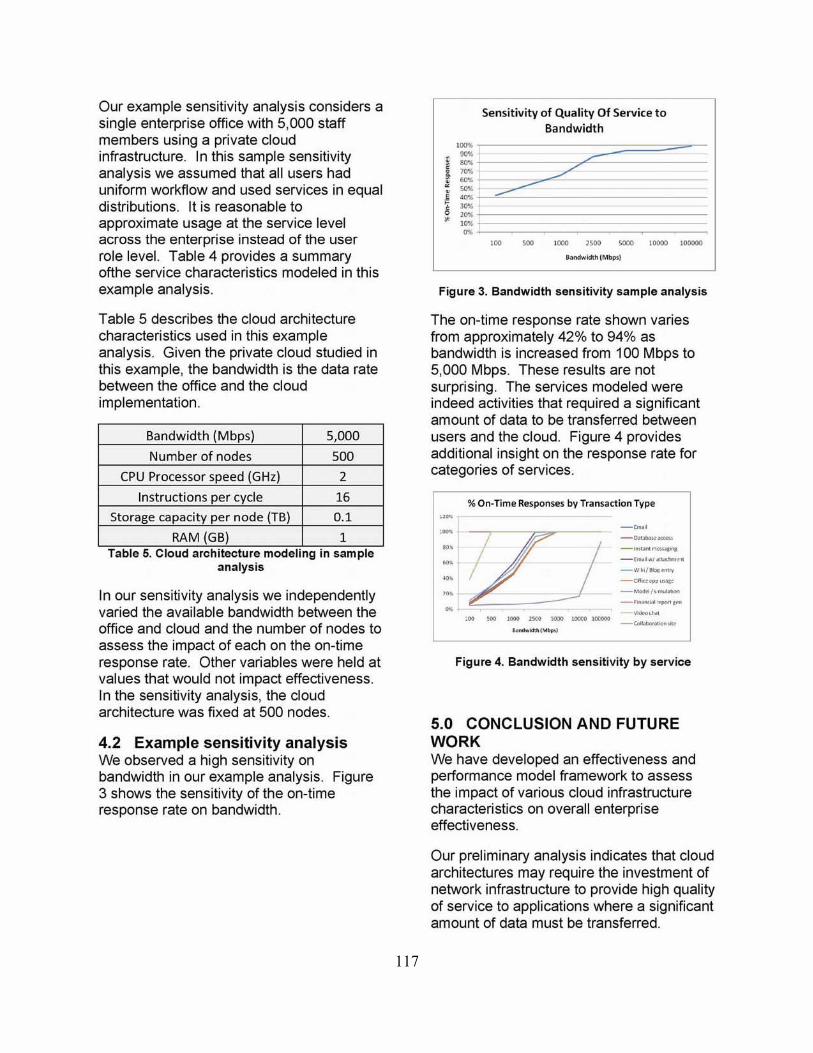
4.2 Example sensitivity analysis We observed a high sensitivity on bandwidth in our example analysis. Figure 3 shows the sensitivity of the on-time response rate on bandwidth.
Sensitivity of Qua lity Of Service to Bandwidth ,- -
I - -=-= - Z ,~
~
-----! ~ -, -,~ • ,~
~ , ,00 ~ ,~ "00 = ,0000 ,-
, ..-;.t,hIMlmI
Figure 3. Bandwidth sensitivity sample analysis
The on-time response rate shown varies from approximately 42% to 94% as bandwidth is increased from 100 Mbps to 5,000 Mbps. These results are not surprising. The services modeled were indeed activities that required a significant amount of data to be transferred between users and the cloud. Figure 4 provides additional insight on the response rate for categories of services.
., --•
% On-Time ResponSl:'$ by Transaction Type
-------~ - '-'-' "",,-, _ .",,'_ ....... -<~,. ...... --1 .... -------_ ...
Figure 4. Bandwidth sensitivity by service
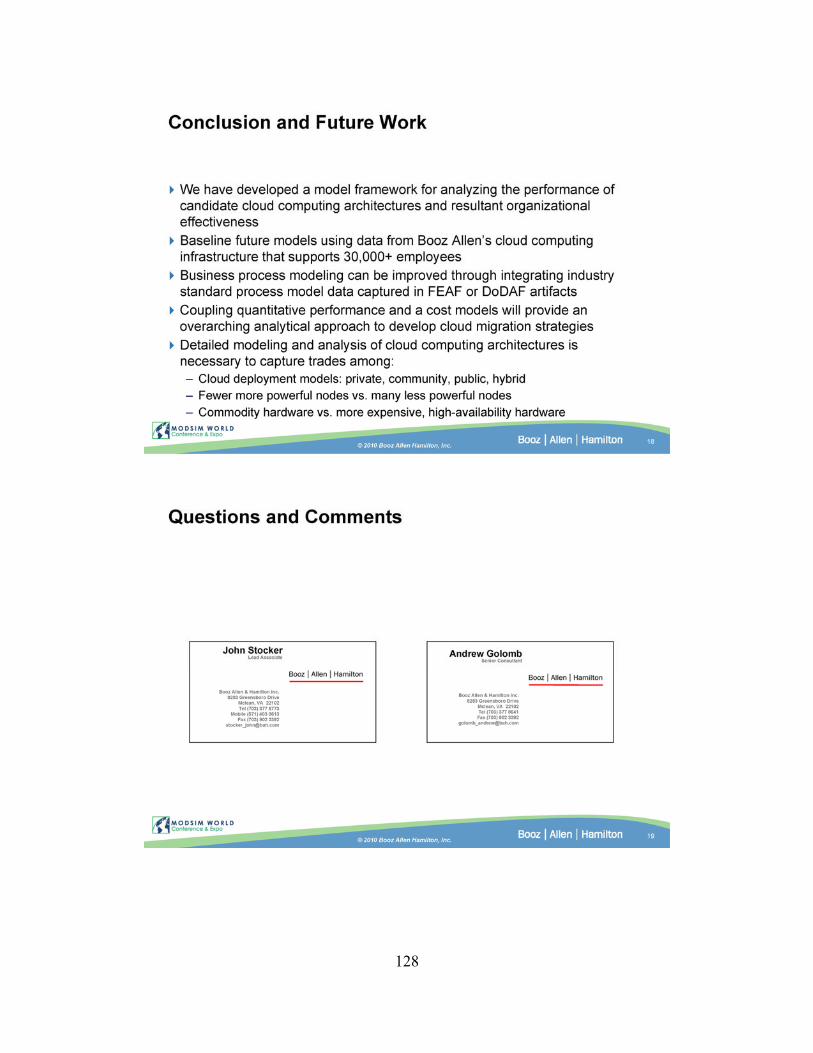
5.0 CONCLUSION AND FUTURE WORK We have developed an effectiveness and performance model framework to assess the impact of various cloud infrastructure characteristics on overall enterprise effectiveness.
Our preliminary analysis indicates that cloud architectures may require the investment of network infrastructure to provide high quality of service to applications where a significant amount of data must be transferred.
118
Additional effectiveness considerations to model in the future include assessing cloud availability and analyzing various cost options in maximizing availability through large·scale implementations of commodity hardware versus more deploying limited quantities of more expensive hardware.
In the future we plan to add to the fidelity of the business process model by considering the categorization of staff members by role and modeling service request generation on a role·by-role basis. We also plan to incorporate a hierarchical business process model in which required capabilities can be decomposed into dependent software applications and services. We will leverage existing work in modeling business processes using industry standard representations such as the Federal Enterprise Architecture Framework (FEAF), [8].
The cloud computing effective and performance model provides a quantitative approach to right·size private and community cloud investments. Coupling the cloud effectiveness model w ith the existing Booz Allen cost model [1] will provide an overarching analytical approach to shape cloud migration strategies. This integrated analytic capability would provide detailed performance and cost analysis of an organization's mission operations in a variety of cloud environments.
6.0 REFERENCES [1] T. Alford , G. Morton. "The Economics of Cloud Computing: Addressing the Benefits of Infrastructure in the Cloud," Booz Allen Hamilton, McLean, Virginia , 2009. [Online). Available : http://www.boozal len.com/media/file/Econo mics-of·Cloud·Computing.pdf
{2] Gartner Research, "Gartner Says Worldwide Cloud Services Market to Surpass $68 Billion in 2010," Gartner Research, June 22, 2010. [Online] Available :
http://www.gartner.com/iUpage.jsp?id=1389 313
[3] D. Krahl , "The Extend simulation environment," Simulation Conference, 2001. Proceedings of the Winter , vol.1 , pp.217· 225, 2001 .
[4] N. Leavitt, "Is Cloud Computing Really Ready for Prime Time?," Computer, vol. 42, no. 1, pp. 15-20, Jan. 2009.
[5] A. Li , X. Yang, S. Kandula , M. Zhang, "CloudCmp: Shopping for a Cloud Made Easy," in 2nd USENIX Workshop on Hot Topics in Cloud Computing (HotC/oud) , June 2010.
[6] P. Mell , T. Grance "The NIST Definition of Cloud Computing." National Institutes of Standards and Technology [6). Version 15. 7 October 2009. [Online] Available: http://csrc.nist.gov/groups/SNS/cloud· com puting/cloud·def·v 15. doc
(7) Sun Microsystems. Introduction to Cloud Computing Architecture, 1st edition, June 2009.
[8] United States. The Chief Information Officers Counci l. Federal Enterprise Architecture Framework, version 1.1 , September 1999. [Online] Available: www.cio .gov/documents/fedarch1.pdf
[9] United States. Federal Chief Information Officer. State of Public Sector Cloud Computing. May 20, 2010.
[10] Kaiqi Xiong , Harry Perros, "Service Performance and Analysis in Cloud Computing," services, pp.693-700, 2009 Congress on SeNices . I, 2009.
7.0 ACKNOWLEDGMENTS The authors thank Michael Farber, Michael Cameron, and Paul Brown for funding this study through the Booz Allen Cloud Computing Initiative. The authors also thank Adam Young, Matt Ostrander, and Justin Neroda for their subject matter expertise and guidance.
119
120
121
122
123
124
Cloud Computing Performance Model
Business Process Model
Office site name Number of staff members Communication link characteristics - Maximum uplink bandwidth (Mbps) - Maximum downlink bandwidth (Mbos)
~ Application and service model
- Request rales vary over lime:
I
Cloud Computing Model Environment
Cloud Computing An:h~O<fu,.
c... _w
1:::: :"'EHtefldilm ........ ~ L • •
.. Workforce model
foehn,c.' Porfonnanco Measur~s
M,ss"," Process AMlyses
- The number of staff members per office site remains constant
- Differences in application and service usage between staff members based on their roles is aggregated in the application request rate
- Uplink and downlink bandwidth between the office and the cloud
business day, weekly , monthly , Aoplication or service name quarterly, etc. Re uest rate re uesls over lime
- Computational requirements and Data transferred KB data transferred are characterized by Com utational re uiremenls MIPS statistical distributions with OoS requirements _ _ _ application specific parameters - Allowable resnonse latencv (seconds'
125
Cloud Computing Architecture Model
• Cloud deployment model - Clouds are collections of compute nodes-individual servers networked together
- Nodes within the cloud are assumed to be homogenous-using homogeneous nodes is an industry best practice to reduce maintenance costs
- Generated service requests are assigned to the least utilized nodes
- If the maximum process capacity is exceeded, requests are then delayed through multi-tasking
Cloud name Number of Nodes Node recessin ca aeit MIPS I sec Node memory 1GB) Node stora e ca adt B Node stofa e access seed milliseconds Inter-node network characteristics
f7'.JMOD$OM WO.'D M~· "'"
Sample Analysis-Input Data
Office Characteristics Cloud Architecture
• Single office • Private Cloud
Parameter Value Parameter
Number of staff members 5,000 External Network Bandwidth
Maximum Uplink Bandwidth (Mbps)
(Mbps) ? Number of nodes
Maximum Downlink CPU Processor speed (GHz)
Bandwidth ? Instructions per cycle User storage capacity per node
(TB)
RAM (GB)
Value
? ? 2 16
0.1 1
126
Sample Analysis-Application and Service Characteristics
Latency
2 2
- Triangular statistical distribution models are used f7jMOD$O M "OUD
M~· "'"
Sample Bandwidth Sensitivity Analysis
-s"n.itiYity of Qua lity 0 1 Se.vH:~ to
8.andwidt~ Assumptions: - Users: 5,000
0.05
- Number of Nodes: 500 l§ ~ i :: -----
- Uplink and downlink rates are identical . -. --• .., ,., - .... (synchronous link)
% On-Time Responses by Transaction Type
Conclusion: ,- t-- ,.--Z"'..----- - "....,...."'''''' - 1 Mbps of bandwidth I user
is required to provide high
quality of service, especially for ..".
highly interactive applications
(e.g. video chat)
f7jM QD .... WOUD [i...1~ •• -
1<'" "'" ''''''' '''''' ""'" ''''''''' l000D0
'-"'''1_ 1
- ""' .... -- ..".. .. /.",,-_ w*', ......... - 0IfI<e_"""" --, ........ -_ f.-.",,,,,,,,, ...
--~
127
Sample Node Count Sens itivity Analysis
Sen,k"'kyol Qu.l~y of Se .... lce '0 Node Count
-Conclusion:
- 20 nodes, or 250 users per node is required to provide
high quality of service
----
Assumptions: - Users: 5,000
- Bandwidth: 5 Gbps
- Uplink and downlink rates are identical (synchronous link)
- 0.1 TS user storage per node
%On-Time Responses by Transaction TVpe
--- "-'------- .... "' .. -- -' ... -------_1_-- '--'" --~ - ,," ,,.. "" -~.--
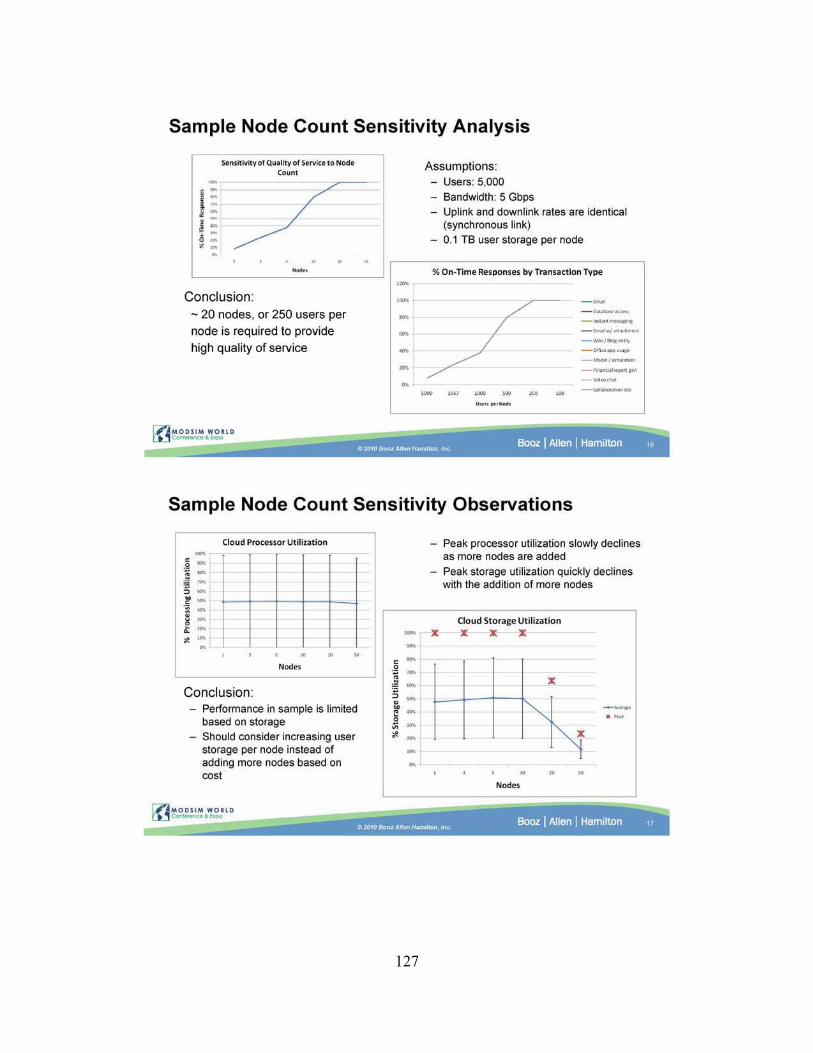
Sample Node Count Sensitivity Observations
Cloud Processor Uti lilatlon
0 -• .:!l --5 -~ -, -• ! • , -Conclusion:
Performance in sample is limited based on storage Should consider increasing user storage per node instead of adding more nodes based on ",,(
- x --i : , -j -, ---
Peak processor utilization slowly declines as more nodes are added Peak storage utilization quickly declines with the addition of more nodes
Cloud Storage Ulilizalion X X X
• • Node.
•
-.-
128