performance analysis of computersystems - tu dresden...improvement are flat-lining +new constraints...
TRANSCRIPT
Holger Brunst ([email protected])
Bert Wesarg ([email protected])
Performance Analysis of Computersystems Introduction and Motivation
Why is Performance Analysis Important?

Overview
� Development of hardware performance
� Implications on application performance
� Compute power at Technische Universität Dresden
� Research at ZIH
� Some advertising
Slide 22 LARS: Introduction and Motivation
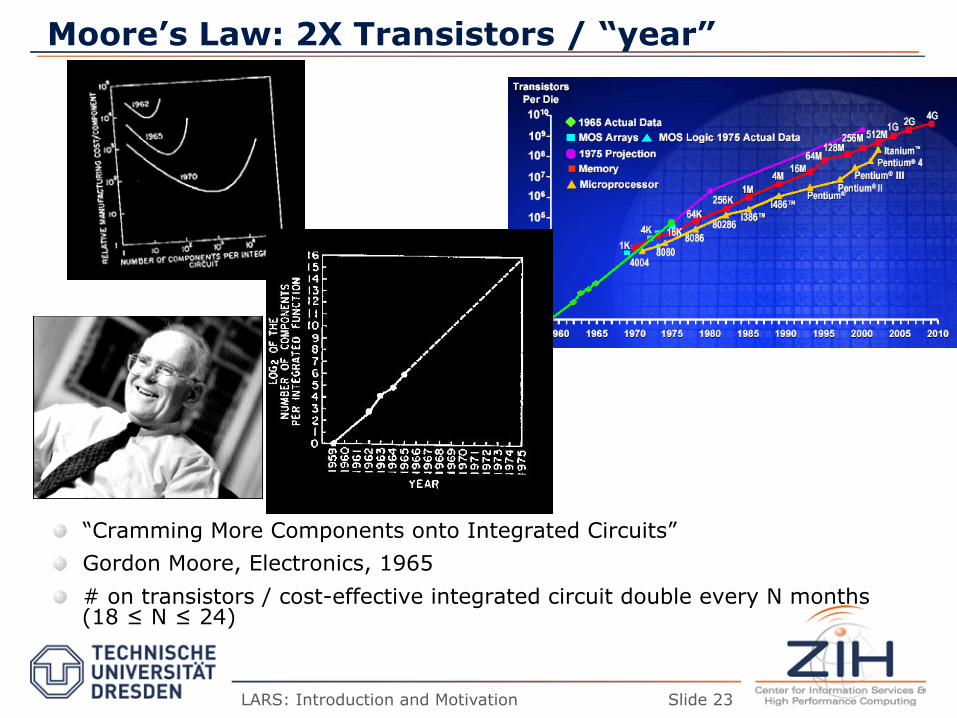
Moore’s Law: 2X Transistors / “year”
� “Cramming More Components onto Integrated Circuits” � Gordon Moore, Electronics, 1965 � # on transistors / cost-effective integrated circuit double every N months
(18 ≤ N ≤ 24)
Slide 23 LARS: Introduction and Motivation
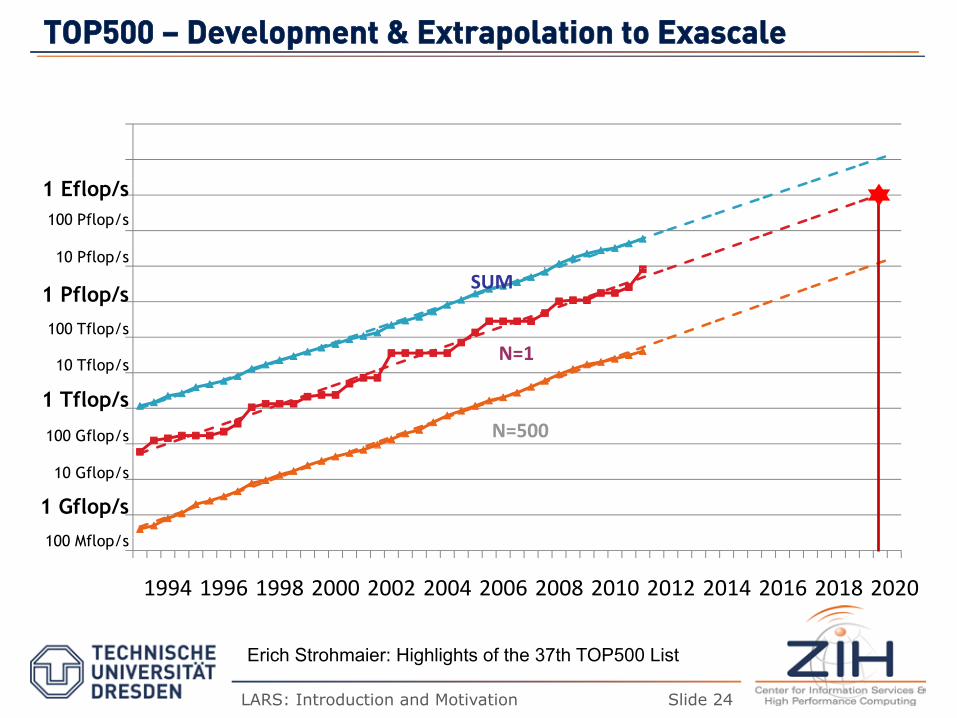
TTOOPP550000 –– DDeevveellooppmmeenntt && EExxttrraappoollaattiioonn ttoo EExxaassccaallee
1E+101E+11
0000000000001E+09100 Pflop/s
10 Pflop/s
1 Eflop/s
100000000000000000
SUM
N=1100 Tflop/s
1 Pflop/s
1001000
10000N 1
N=5001 Tflop/s
100 Gflop/s
10 Tflop/s
110100
1 Gflop/s
100 Mfl /
10 Gflop/s
0,1
1994 1996 1998 2000 2002 2004 2006 2008 2010 2012 2014 2016 2018 2020
100 Mflop/s
Erich Strohmaier: Highlights of the 37th TOP500 List
LARS: Introduction and Motivation Slide 24

John Shalf (NERSC, LBNL)
Slide 25 LARS: Introduction and Motivation
Traditional Sources of Performance Improvement are Flat-Lining
New Constraints
– 15 years of exponential clock
rate growth has ended
But Moore’s Law continues!
– How do we use all of those
transistors to keep
performance increasing at historical rates?
– Industry Response: #cores per
chip doubles every 18 months instead of clock frequency!
– Is this a good idea, or is it
completely brain-dead?
– Has industry run out of ideas?
Figure courtesy of Kunle Olukotun, Lance
Hammond, Herb Sutter, and Burton Smith 3
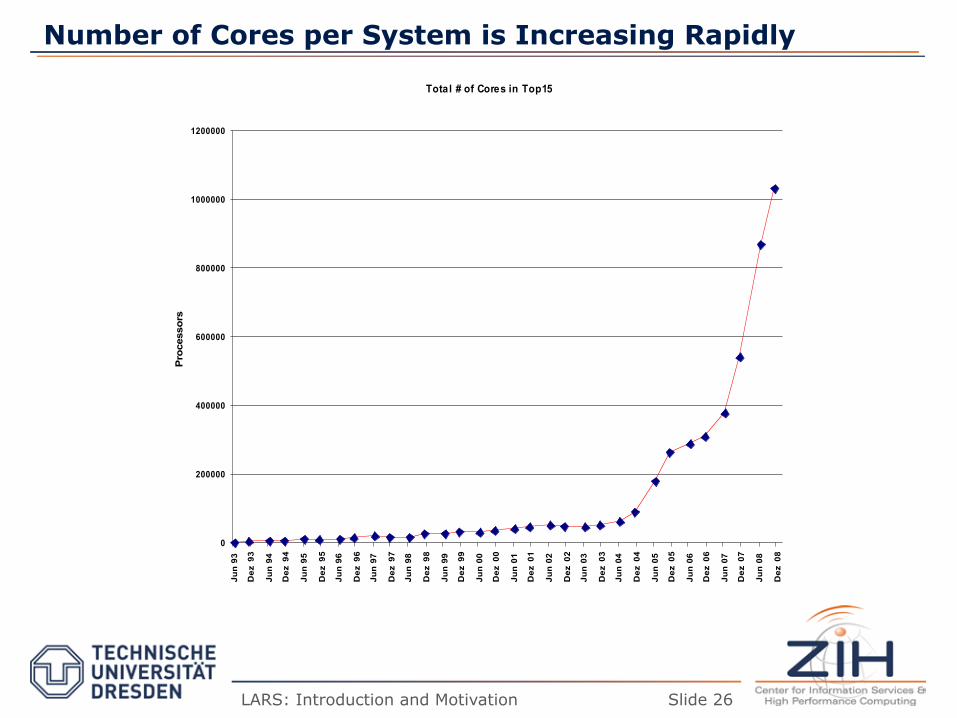
Number of Cores per System is Increasing Rapidly
Total # of Cores in Top15
0
200000
400000
600000
800000
1000000
1200000
Jun
93
Dez
93
Jun
94
Dez
94
Jun
95
Dez
95
Jun
96
Dez
96
Jun
97
Dez
97
Jun
98
Dez
98
Jun
99
Dez
99
Jun
00
Dez
00
Jun
01
Dez
01
Jun
02
Dez
02
Jun
03
Dez
03
Jun
04
Dez
04
Jun
05
Dez
05
Jun
06
Dez
06
Jun
07
Dez
07
Jun
08
Dez
08
Pro
cess
ors
Slide 26 LARS: Introduction and Motivation
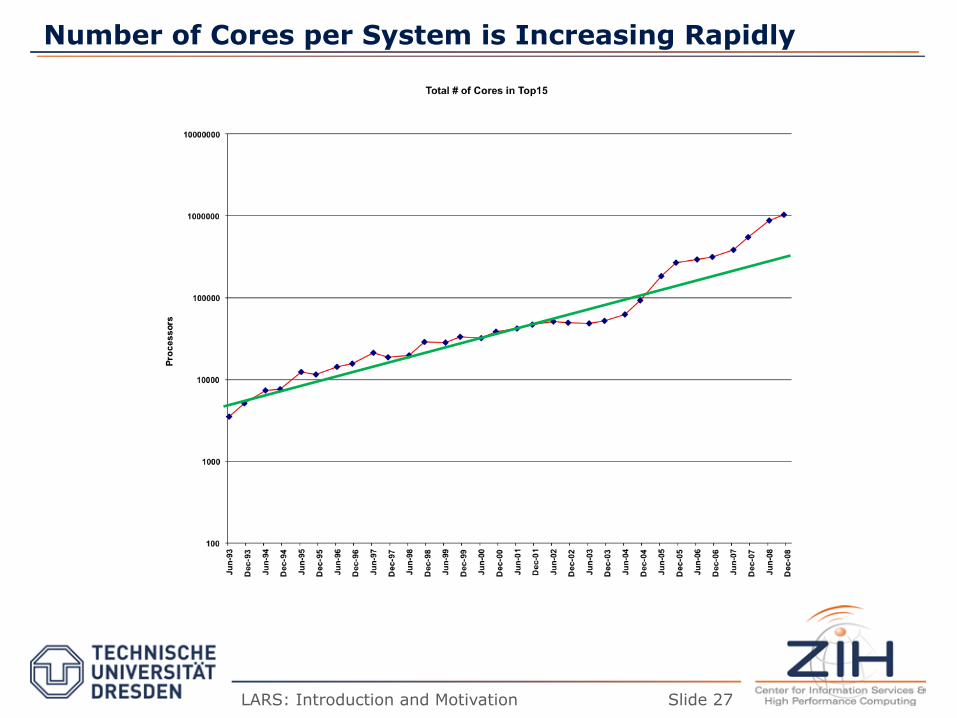
Number of Cores per System is Increasing Rapidly
Slide 27 LARS: Introduction and Motivation
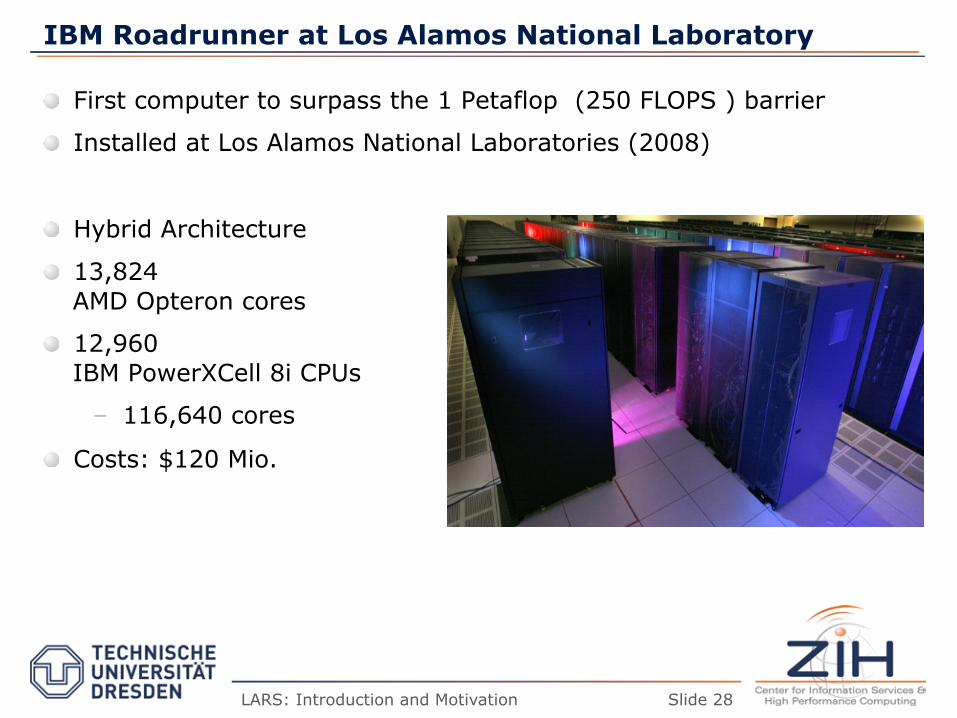
IBM Roadrunner at Los Alamos National Laboratory
� First computer to surpass the 1 Petaflop (250 FLOPS ) barrier
� Installed at Los Alamos National Laboratories (2008)
� Hybrid Architecture
� 13,824 AMD Opteron cores
� 12,960 IBM PowerXCell 8i CPUs
– 116,640 cores
� Costs: $120 Mio.
Slide 28 LARS: Introduction and Motivation
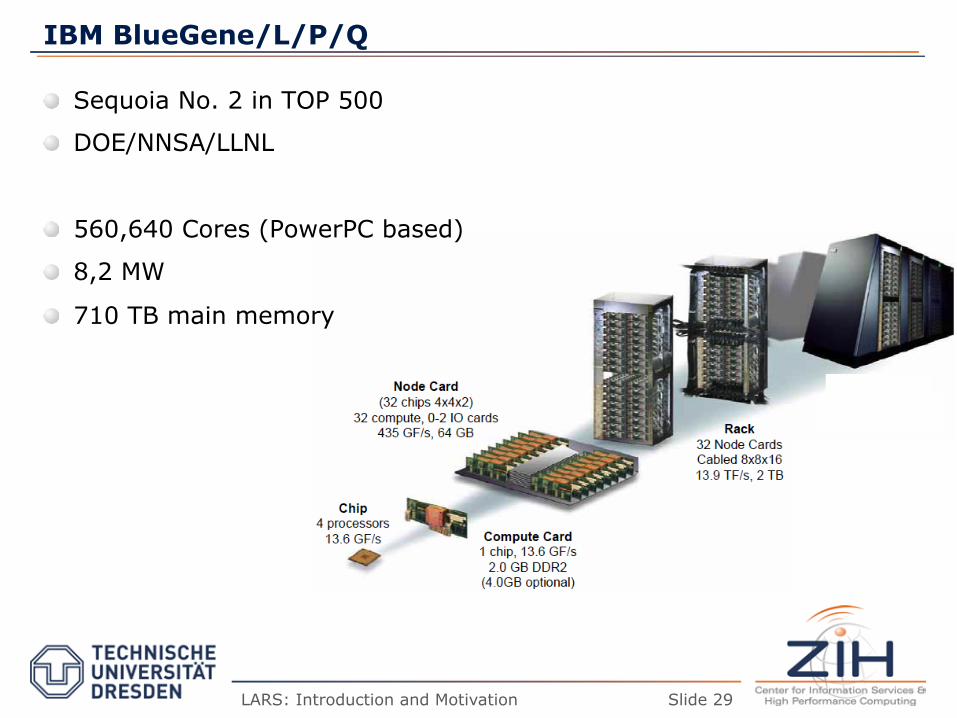
IBM BlueGene/L/P/Q
� Sequoia No. 2 in TOP 500
� DOE/NNSA/LLNL
� 560,640 Cores (PowerPC based)
� 8,2 MW
� 710 TB main memory
Slide 29 LARS: Introduction and Motivation
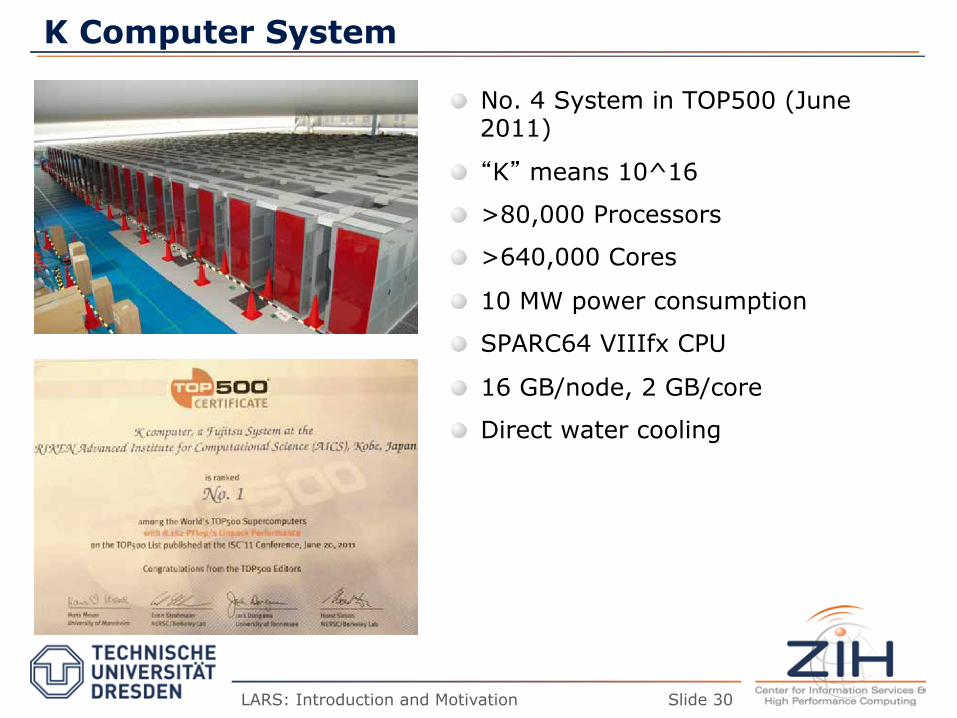
K Computer System
� No. 4 System in TOP500 (June 2011)
� “K” means 10^16
� >80,000 Processors
� >640,000 Cores
� 10 MW power consumption
� SPARC64 VIIIfx CPU
� 16 GB/node, 2 GB/core
� Direct water cooling
Slide 30 LARS: Introduction and Motivation
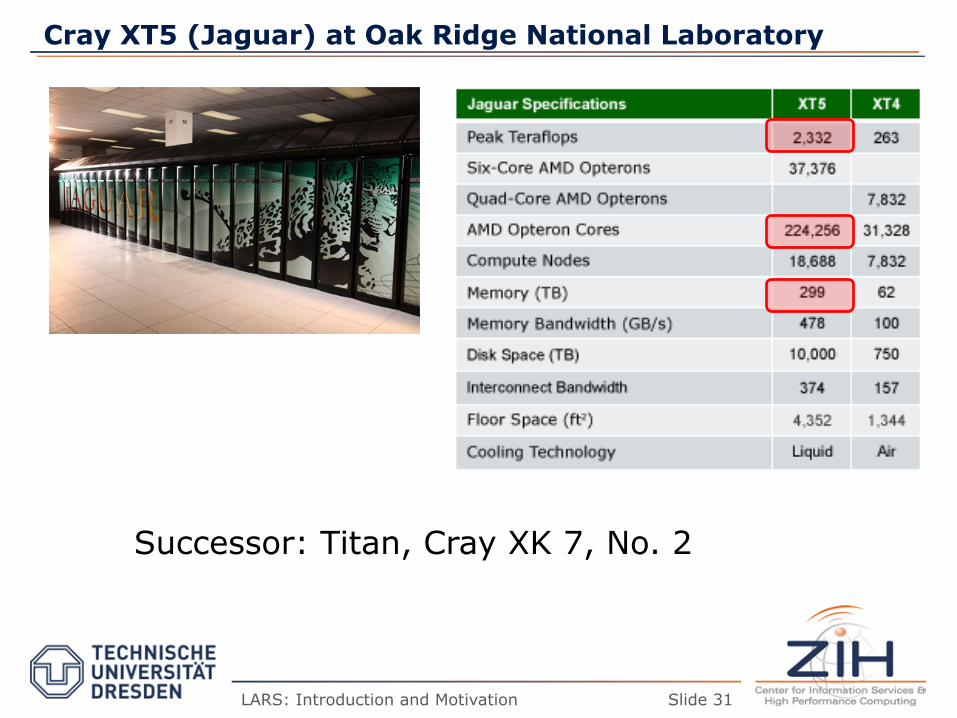
Cray XT5 (Jaguar) at Oak Ridge National Laboratory
Slide 31 LARS: Introduction and Motivation
Successor: Titan, Cray XK 7, No. 2

What Kind of Know-How is Required for HPC?
� Algorithms and methods
� Performance Analysis
� Programming (Paradigms and details of implementations)
� Operation of supercomputers (network, infrastructure, service, support)
Slide 32 LARS: Introduction and Motivation

Challenges
Scalability
Paradigms
Co-Array Fortran
Heterogeneous/ Hybrid
MPI+CUDA PGAS+CUDA MPI+Threads
MPI+ Accelerator+ Threads
MPI+ PGAS
Network Ethernet Infiniband Myrinet
System Architecture
Processors Memory hierarchy
SHMEM
Challenges
LARS: Introduction and Motivation Slide 33
Overview
� Development of hardware performance
� Implications on application performance
� Compute power at Technische Universität Dresden
� Research at ZIH
� Some advertising
Slide 34 LARS: Introduction and Motivation
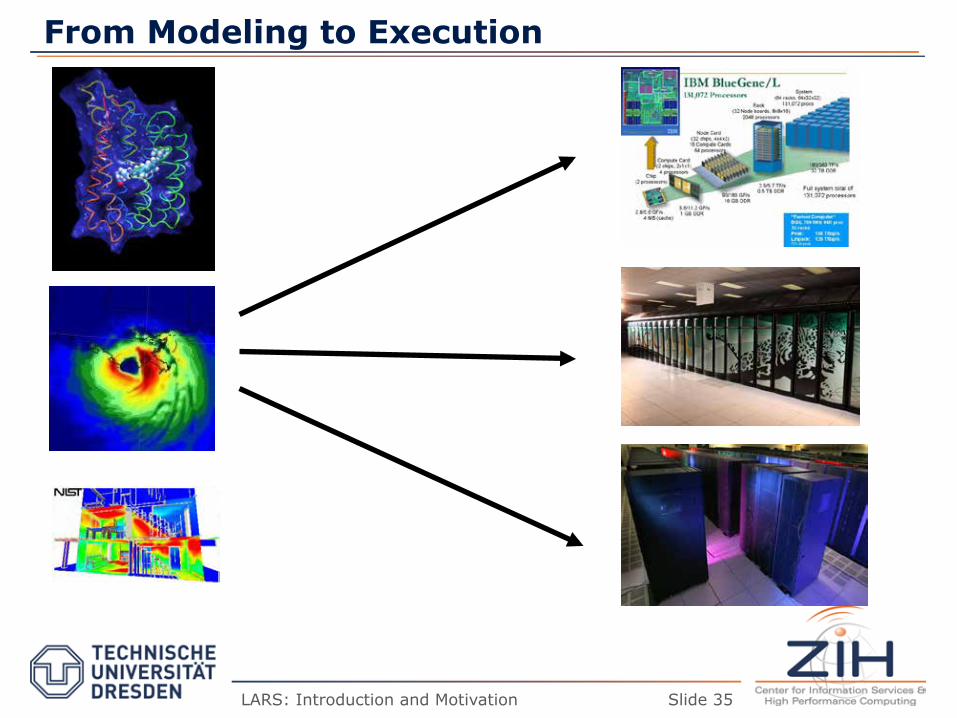
From Modeling to Execution
Slide 35 LARS: Introduction and Motivation

Environment / Machine Room
WWhhyy iiss EEnneerrggyy EEffffiicciieennccyy HHaarrddeerr??
– Both are vertical/cross cutting problems:
Digital Logic Level
Microarchitectur Level
Hardware
Instruction Set Architecture Level Operating System Machine Level Assembly Language Level Problem-oriented Language Level
Performance
Energy Efficiency
Design and Implementation Algorithm Mathematical Representation Modeling
LARS: Introduction and Motivation Slide 36
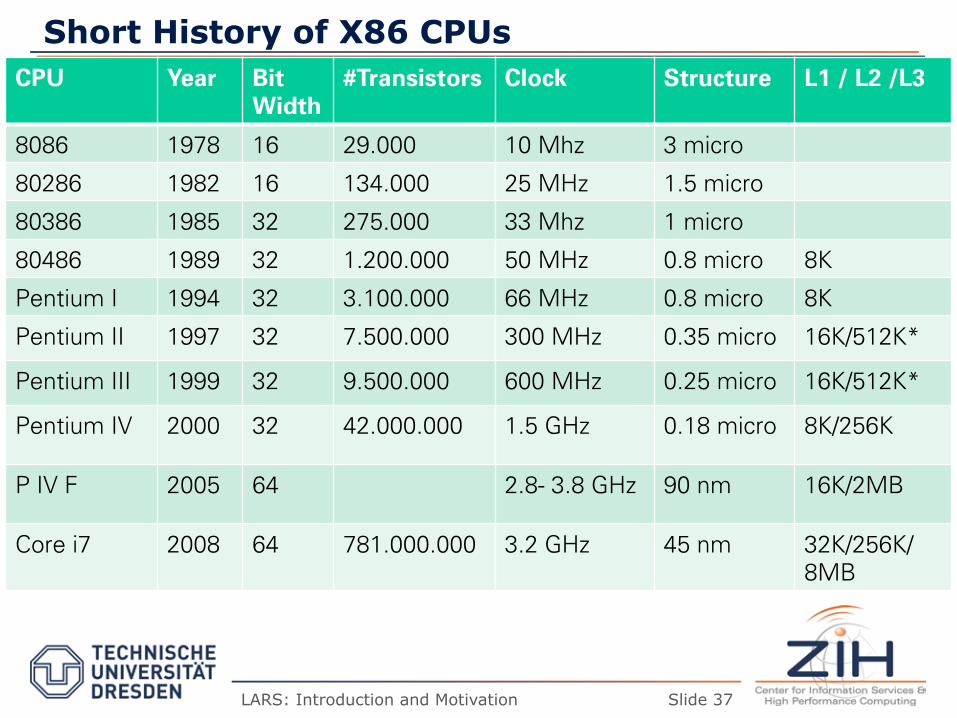
Short History of X86 CPUs CPU Year Bit
Width #Transistors Clock Structure L1 / L2 /L3
8086 1978 16 29.000 10 Mhz 3 micro
80286 1982 16 134.000 25 MHz 1.5 micro
80386 1985 32 275.000 33 Mhz 1 micro
80486 1989 32 1.200.000 50 MHz 0.8 micro 8K
Pentium I 1994 32 3.100.000 66 MHz 0.8 micro 8K
Pentium II 1997 32 7.500.000 300 MHz 0.35 micro 16K/512K*
Pentium III 1999 32 9.500.000 600 MHz 0.25 micro 16K/512K*
Pentium IV 2000 32 42.000.000 1.5 GHz 0.18 micro 8K/256K
P IV F 2005 64 2.8- 3.8 GHz 90 nm 16K/2MB
Core i7 2008 64 781.000.000 3.2 GHz 45 nm 32K/256K/8MB
Slide 37 LARS: Introduction and Motivation

Intel Nehalem
� Released 2008
� 4 cores
� 781.000.000 transistors
� 45nm technology
� 32 K L1Data, 32K L1Instruction
� 256 K L2
� 8 MB shared L3 cache
� Hyperthreading
� 3.2 GHz*4 cores*4 FLOPS/cycle = 51.2 Gflop/s peak
� Integrated memory controller
� QPI between processors
Slide 38 LARS: Introduction and Motivation
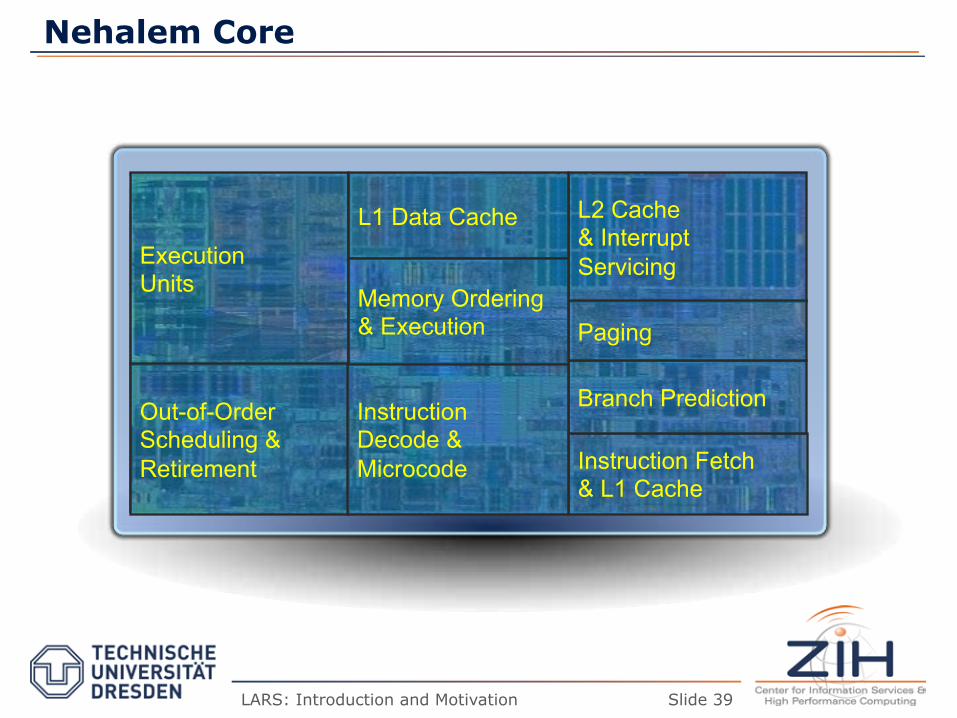
Nehalem Core
Execution Units
Out-of-Order Scheduling & Retirement
L2 Cache & Interrupt Servicing
Instruction Fetch & L1 Cache
Branch Prediction Instruction Decode & Microcode
Paging
L1 Data Cache
Memory Ordering & Execution
Slide 39 LARS: Introduction and Motivation
Potential Factors Limiting Performance
� “Peak performance”
� Floating point units
� Integer units
� … any other feature of micro architecture
� Bandwidth (L1,L2,L3, main memory, other cores, other nodes)
� Latency (L1,L2,L3, main memory, other cores, other nodes)
� Power consumption
Slide 40 LARS: Introduction and Motivation

Develops the Entire System at CPU speed?
µProc 60%/yr. (2X/1.5yr)
DRAM 9%/yr. (2X/10 yrs) 1
10
100
1000
1980 1981
1983 1984 1985 1986 1987 1988 1989 1990 1991 1992 1993 1994 1995 1996 1997 1998 1999 2000
DRAM
CPU
1982
Processor-Memory Performance Gap: (grows 50% / year)
Perform
ance
Time
“Moore’s Law”
Processor-DRAM Memory Gap (latency)
Slide 41 LARS: Introduction and Motivation
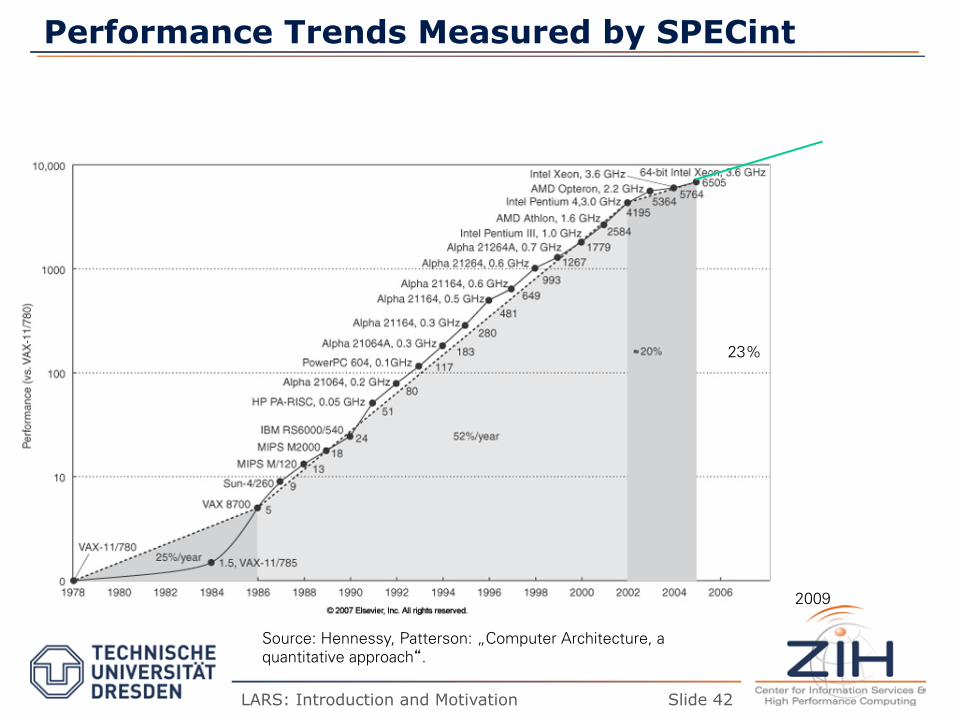
Performance Trends Measured by SPECint
2009
23%
Slide 42 LARS: Introduction and Motivation
Source: Hennessy, Patterson: „Computer Architecture, a quantitative approach“.
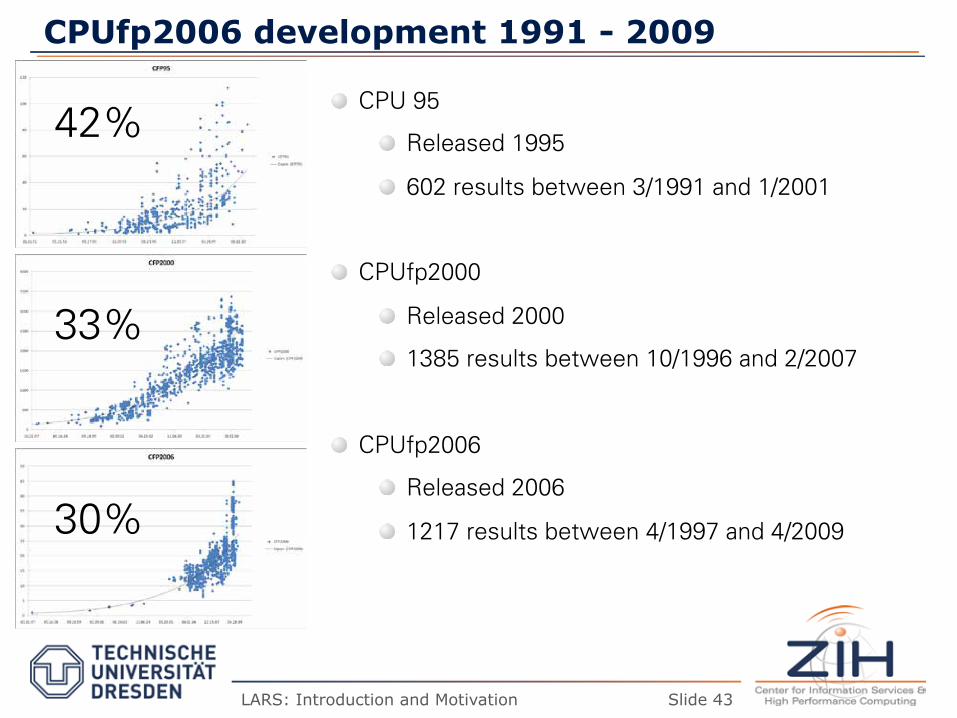
CPUfp2006 development 1991 - 2009
� CPU 95
� Released 1995
� 602 results between 3/1991 and 1/2001
� CPUfp2000
� Released 2000
� 1385 results between 10/1996 and 2/2007
� CPUfp2006
� Released 2006
� 1217 results between 4/1997 and 4/2009
42%
33%
30%
Slide 43 LARS: Introduction and Motivation
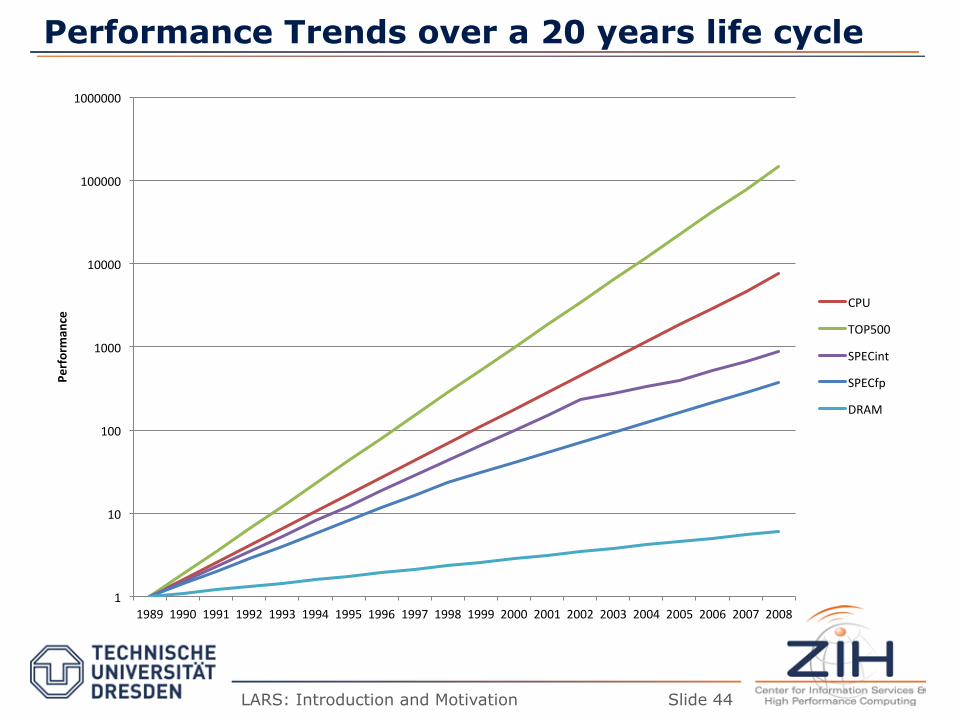
Performance Trends over a 20 years life cycle
1
10
100
1000
10000
100000
1000000
1989 1990 1991 1992 1993 1994 1995 1996 1997 1998 1999 2000 2001 2002 2003 2004 2005 2006 2007 2008
Performan
ce CPU
TOP500
SPECint
SPECfp
DRAM
Slide 44 LARS: Introduction and Motivation
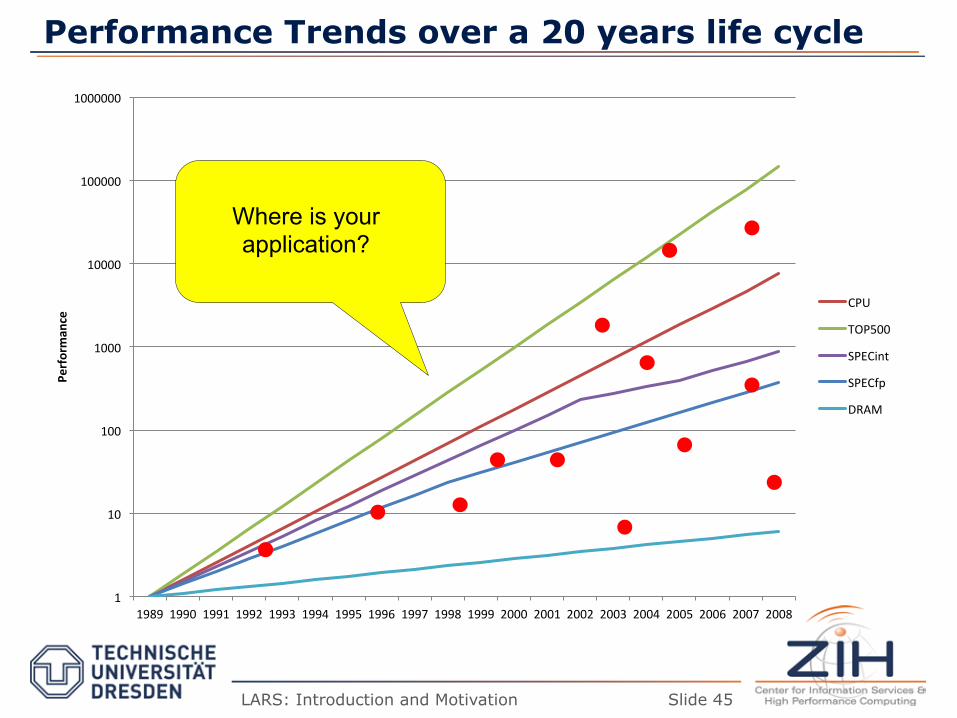
Performance Trends over a 20 years life cycle
1
10
100
1000
10000
100000
1000000
1989 1990 1991 1992 1993 1994 1995 1996 1997 1998 1999 2000 2001 2002 2003 2004 2005 2006 2007 2008
Performan
ce CPU
TOP500
SPECint
SPECfp
DRAM
Where is your application?
Slide 45 LARS: Introduction and Motivation
Overview
� Development of hardware performance
� Implications on application performance
� Compute power at Technische Universität Dresden
� Research at ZIH
� Some advertising
Slide 46 LARS: Introduction and Motivation
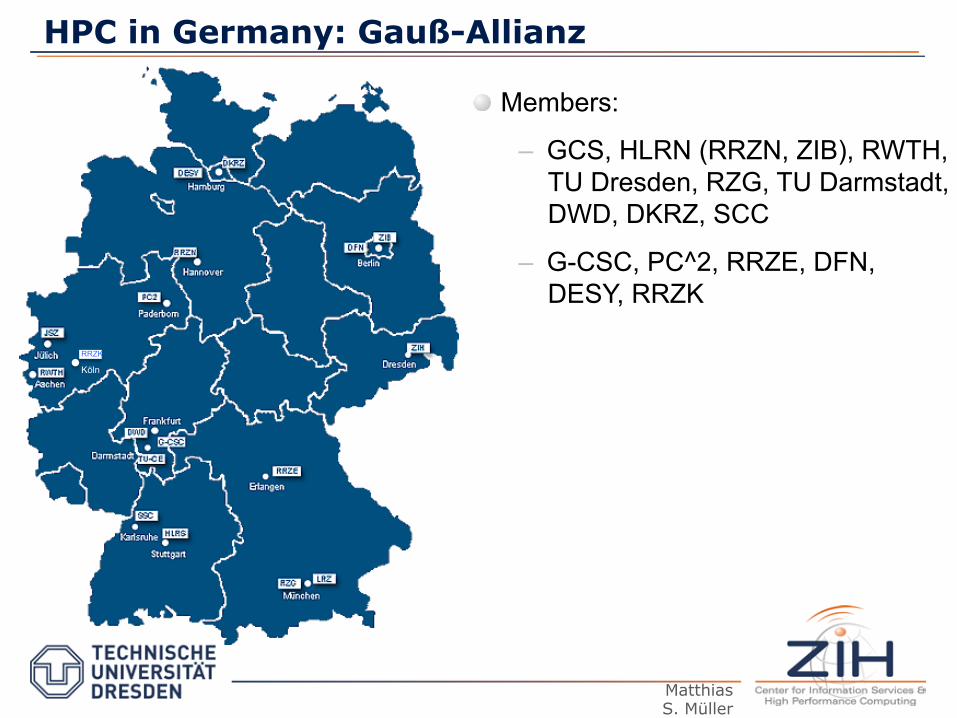
HPC in Germany: Gauß-Allianz
Matthias S. Müller
� Members:
– GCS, HLRN (RRZN, ZIB), RWTH, TU Dresden, RZG, TU Darmstadt, DWD, DKRZ, SCC
– G-CSC, PC^2, RRZE, DFN, DESY, RRZK
Köln
RRZK
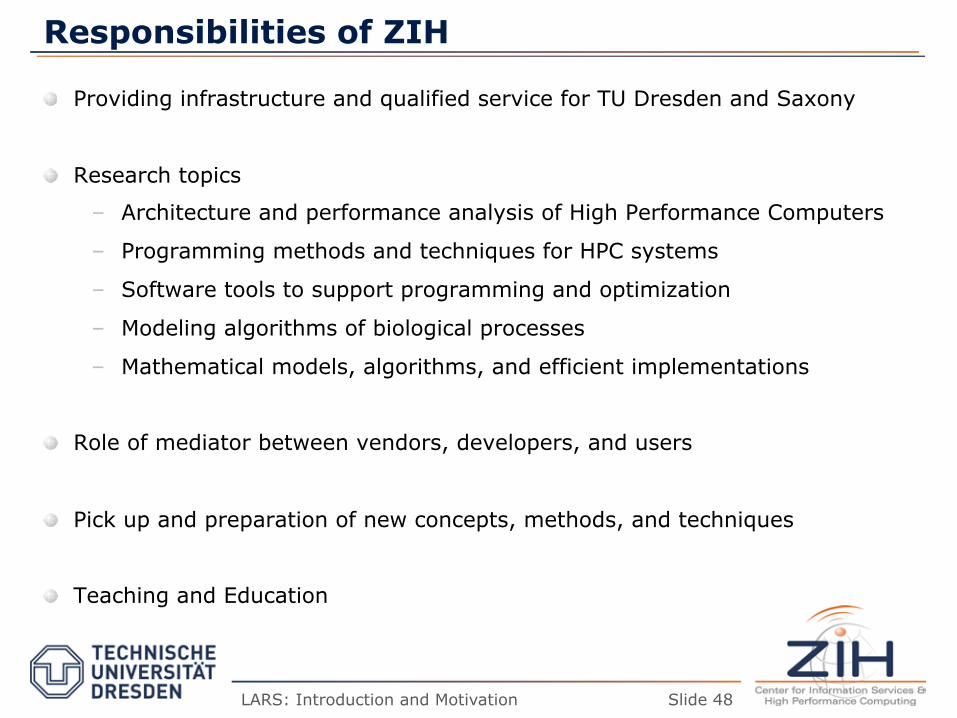
Responsibilities of ZIH
� Providing infrastructure and qualified service for TU Dresden and Saxony
� Research topics
– Architecture and performance analysis of High Performance Computers
– Programming methods and techniques for HPC systems
– Software tools to support programming and optimization
– Modeling algorithms of biological processes
– Mathematical models, algorithms, and efficient implementations
� Role of mediator between vendors, developers, and users
� Pick up and preparation of new concepts, methods, and techniques
� Teaching and Education
Slide 48 LARS: Introduction and Motivation
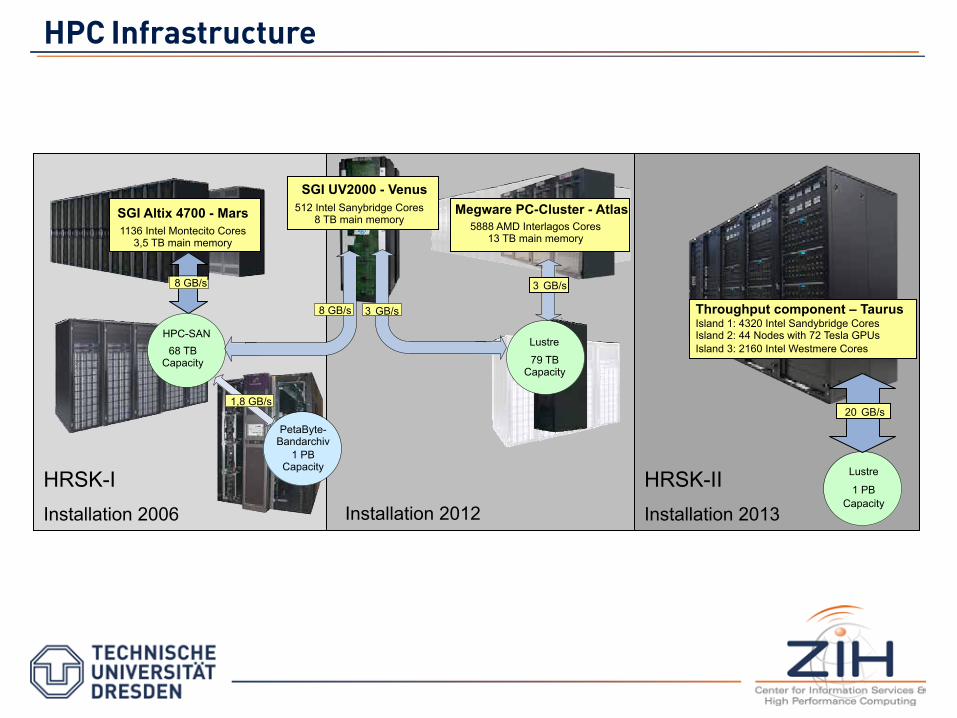
HPC Infrastructure
-
HPC-SAN
Lustre
79 TB Capacity
PetaByte- Bandarchiv
1 PB Capacity
8 GB/s 3 GB/s
1,8 GB/s
SGI Altix 4700 - Mars 1136 Intel Montecito Cores
3,5 TB main memory
Megware PC-Cluster - Atlas 5888 AMD Interlagos Cores
13 TB main memory
Installation 2012
HRSK-II Installation 2013
HRSK-I Installation 2006
SGI UV2000 - Venus 512 Intel Sanybridge Cores
8 TB main memory
Throughput component – Taurus Island 1: 4320 Intel Sandybridge Cores Island 2: 44 Nodes with 72 Tesla GPUs Island 3: 2160 Intel Westmere Cores
8 GB/s 3 GB/s
Lustre
1 PB Capacity
20 GB/s
68 TB Capacity
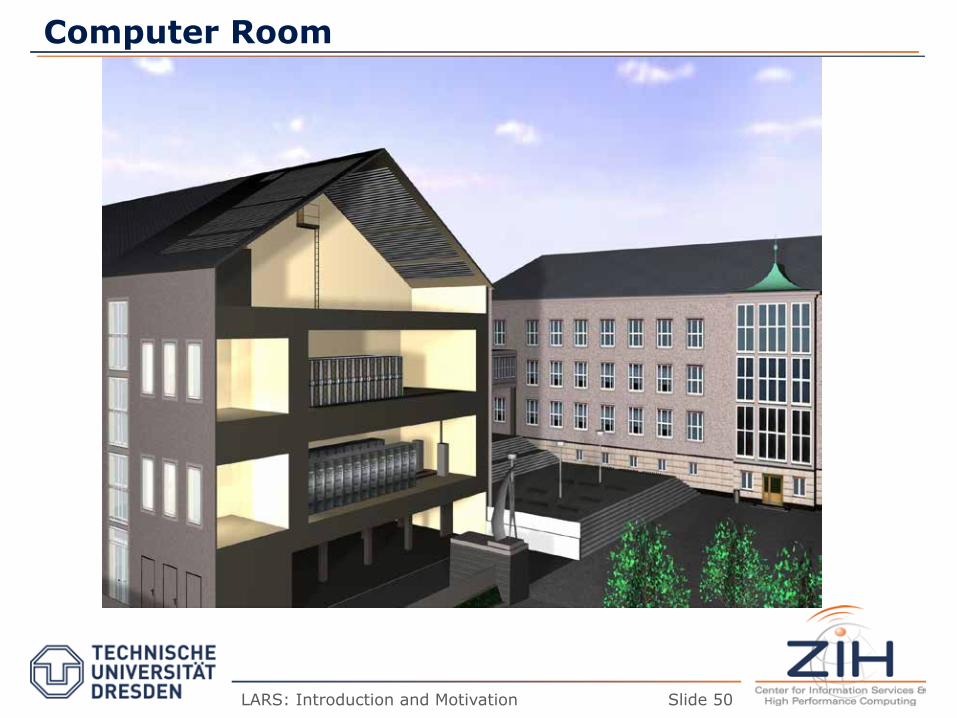
Computer Room
Slide 50 LARS: Introduction and Motivation

Performance of Supercomputers at ZIH
0.0001
0.001
0.01
0.1
1
10
100
1000
10000
TFLO
PS
Jahr
Cray T3E 28 GFlops Platz 237 VP200-EX
472 MFlops Platz 500
SGI Origin 2000 16,5 GFlops
Platz 236
SGI Origin 3800 85,4 GFlops
Platz 351
Rang 1 Rang 10 Rang 500
PC-Farm 10,88 TFlops
Platz 79
SGI Altix 11,9 TFlops
Platz 49
HRSK-II Stufe 1
HRSK-II Stufe 2 RWTH
300 TFlops
LARS: Introduction and Motivation Slide 51
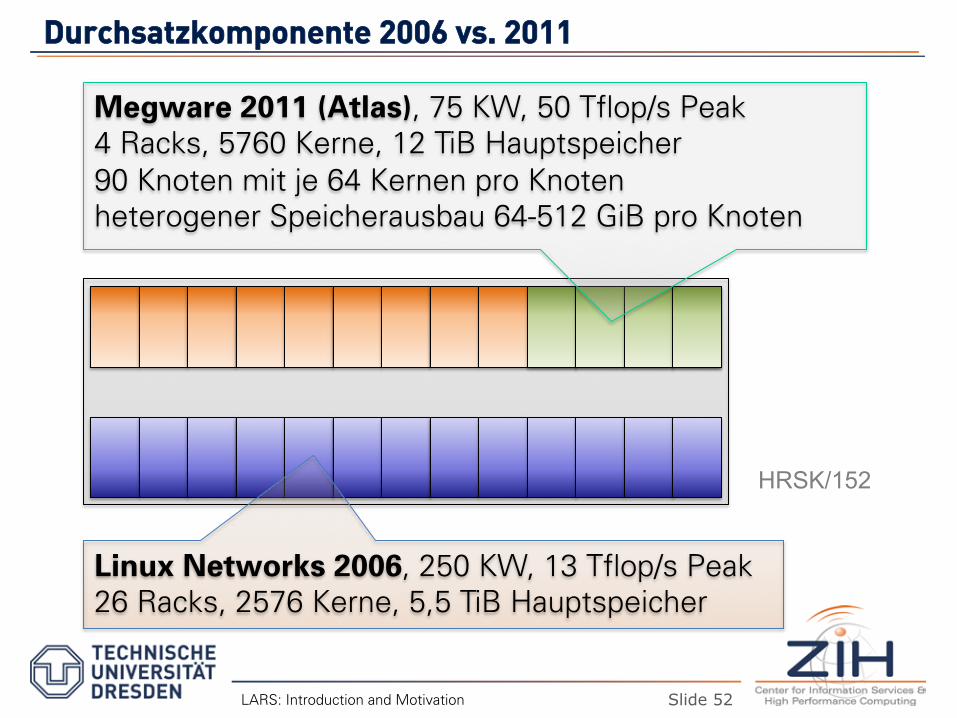
DDuurrcchhssaattzzkkoommppoonneennttee 22000066 vvss.. 22001111
LARS: Introduction and Motivation
Megware 2011 (Atlas), 75 KW, 50 Tflop/s Peak 4 Racks, 5760 Kerne, 12 TiB Hauptspeicher 90 Knoten mit je 64 Kernen pro Knoten heterogener Speicherausbau 64-512 GiB pro Knoten
Linux Networks 2006, 250 KW, 13 Tflop/s Peak 26 Racks, 2576 Kerne, 5,5 TiB Hauptspeicher
HRSK/152
Slide 52
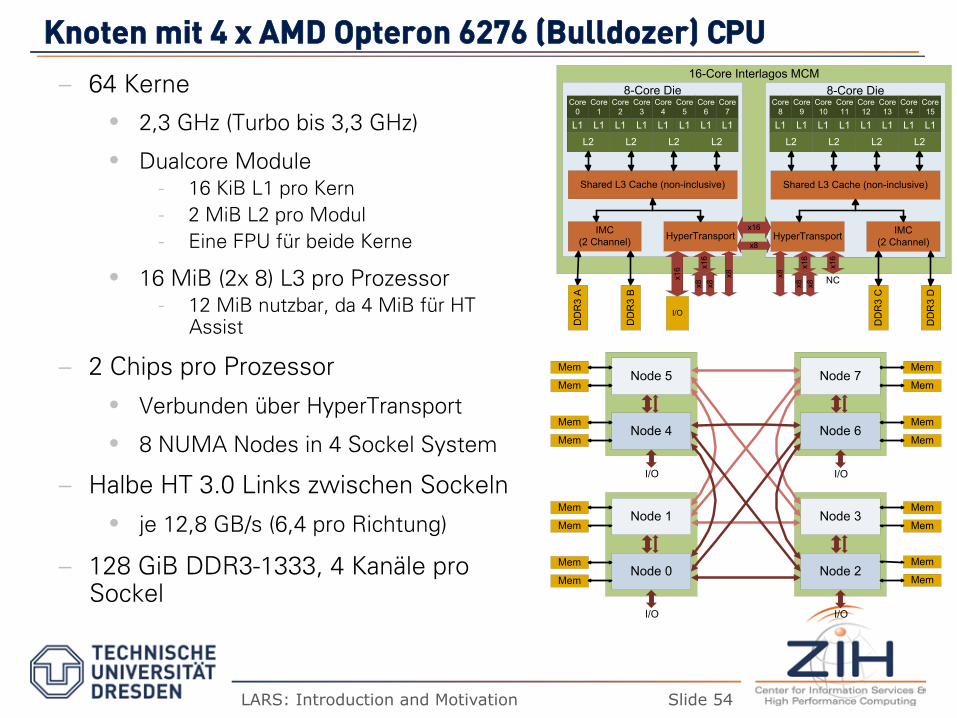
KKnnootteenn mmiitt 44 xx AAMMDD OOpptteerroonn 66227766 ((BBuullllddoozzeerr)) CCPPUU
– 64 Kerne
2,3 GHz (Turbo bis 3,3 GHz)
Dualcore Module - 16 KiB L1 pro Kern - 2 MiB L2 pro Modul - Eine FPU für beide Kerne
16 MiB (2x 8) L3 pro Prozessor - 12 MiB nutzbar, da 4 MiB für HT
Assist
– 2 Chips pro Prozessor
Verbunden über HyperTransport
8 NUMA Nodes in 4 Sockel System
– Halbe HT 3.0 Links zwischen Sockeln
je 12,8 GB/s (6,4 pro Richtung)
– 128 GiB DDR3-1333, 4 Kanäle pro Sockel
16-Core Interlagos MCM8-Core Die
Shared L3 Cache (non-inclusive)
IMC(2 Channel) HyperTransport
I/O
DD
R3
A
DD
R3
B
DD
R3
C
DD
R3
D
8-Core Die
Shared L3 Cache (non-inclusive)
HyperTransport IMC(2 Channel)
x16
x16
x16
x8
x8
x8
x16
x16
NCx8 x8x8 x8
Core 0
L1
Core 1
L1
L2
Core 2
L1
Core 3
L1
L2
Core 4
L1
Core 5
L1
L2
Core 6
L1
Core 7
L1
L2
Core 8
L1
Core 9
L1
L2
Core 10
L1
Core 11
L1
L2
Core 12
L1
Core 13
L1
L2
Core 14
L1
Core 15
L1
L2
Node 1
Node 0
Node 3
Node 2
Node 5
Node 4
Node 7
Node 6
Mem
Mem
Mem
Mem
Mem
Mem
Mem
Mem
Mem
Mem
Mem
Mem
Mem
Mem
Mem
Mem
I/O I/O
I/O I/O
LARS: Introduction and Motivation Slide 54
Folie 55
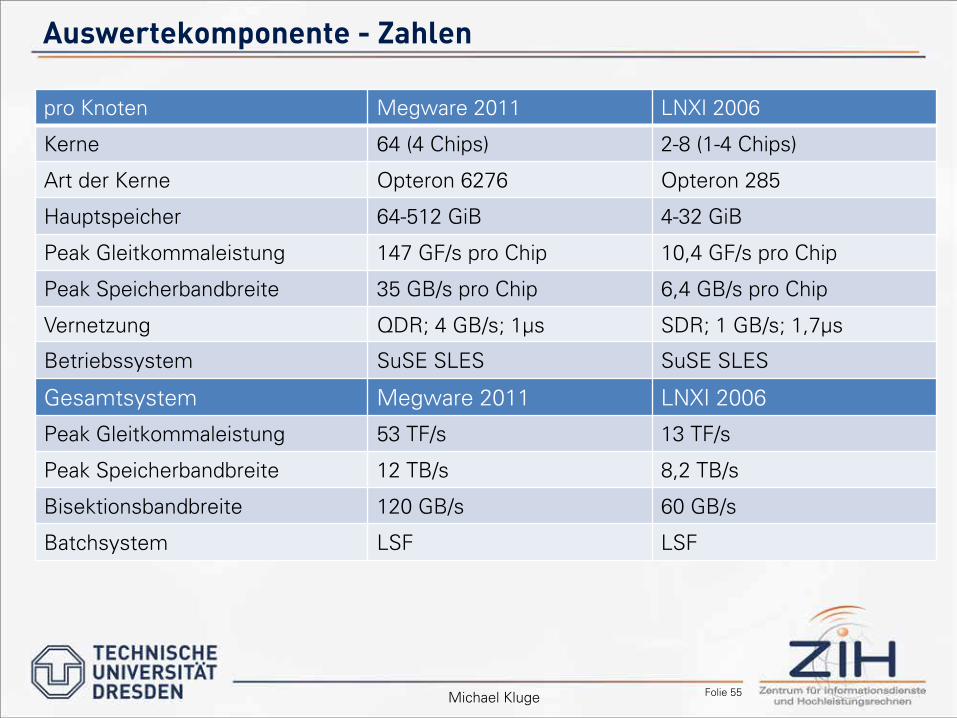
Auswertekomponente - Zahlen
Michael Kluge
pro Knoten Megware 2011 LNXI 2006
Kerne 64 (4 Chips) 2-8 (1-4 Chips)
Art der Kerne Opteron 6276 Opteron 285
Hauptspeicher 64-512 GiB 4-32 GiB
Peak Gleitkommaleistung 147 GF/s pro Chip 10,4 GF/s pro Chip
Peak Speicherbandbreite 35 GB/s pro Chip 6,4 GB/s pro Chip
Vernetzung QDR; 4 GB/s; 1µs SDR; 1 GB/s; 1,7µs
Betriebssystem SuSE SLES SuSE SLES
Gesamtsystem Megware 2011 LNXI 2006
Peak Gleitkommaleistung 53 TF/s 13 TF/s
Peak Speicherbandbreite 12 TB/s 8,2 TB/s
Bisektionsbandbreite 120 GB/s 60 GB/s
Batchsystem LSF LSF
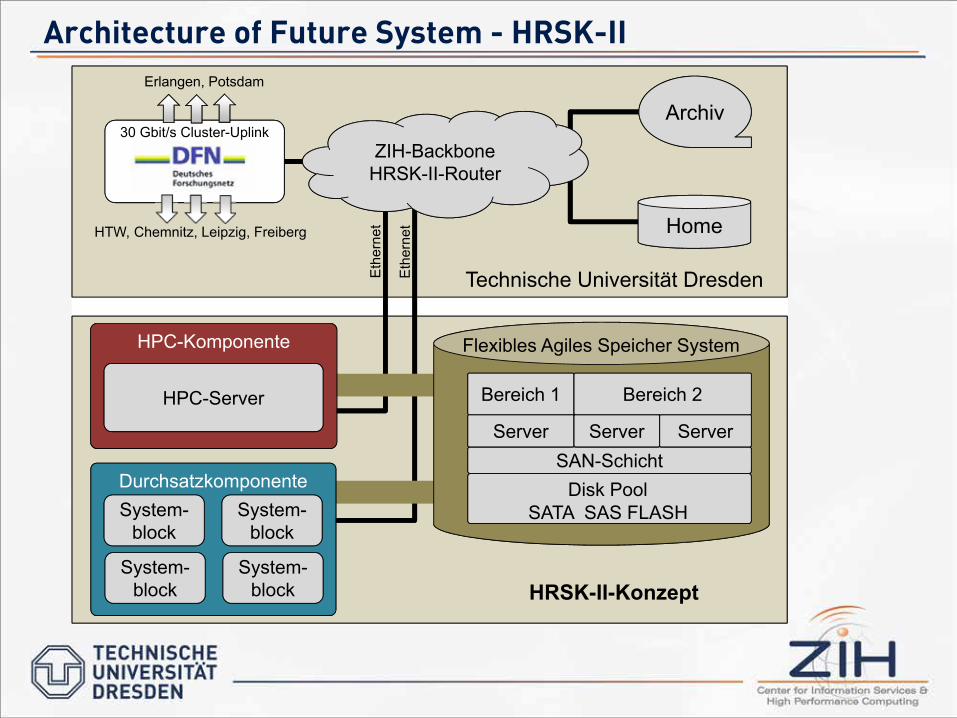
Architecture of Future System - HRSK-II
30 Gbit/s Cluster-Uplink
Durchsatzkomponente
HPC-Komponente
System-block
Archiv
Home
Eth
erne
t
Eth
erne
t
ZIH-BackboneHRSK-II-Router
HTW, Chemnitz, Leipzig, Freiberg
Erlangen, Potsdam
SAN-SchichtServer
Bereich 1
SATA SAS FLASHDisk Pool
ServerServer
Bereich 2HPC-Server
HRSK-II-Konzept
Flexibles Agiles Speicher System
System-block
System-block
System-block
Technische Universität Dresden
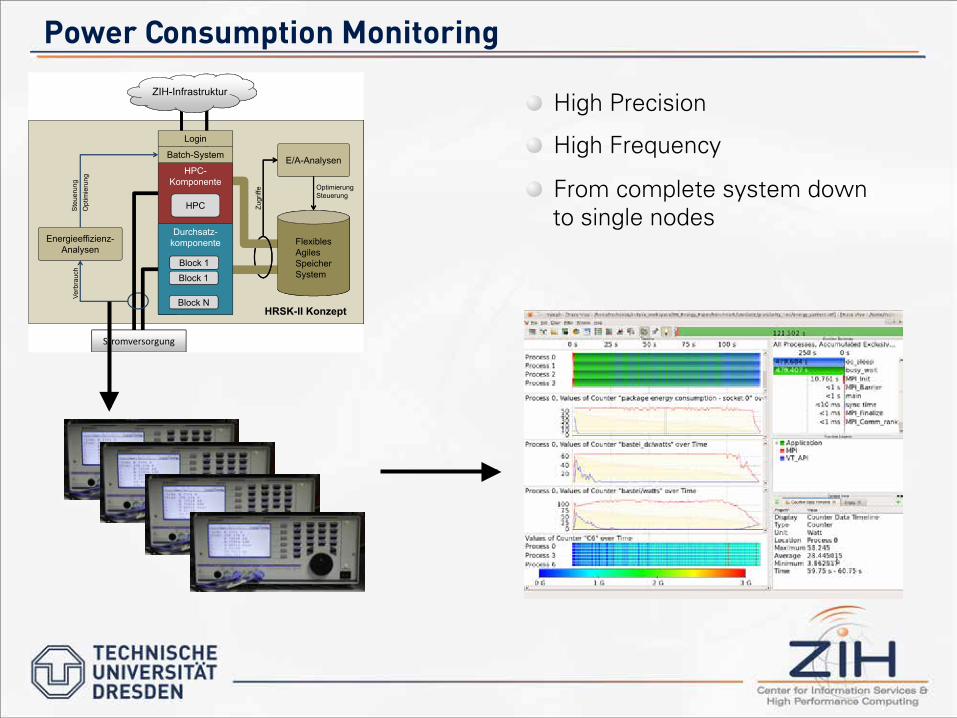
Power Consumption Monitoring
Durchsatz-komponente
HPC-Komponente
FlexiblesAgiles Speicher System
HRSK-II Konzept
Block 1
ZIH-Infrastruktur
Block 1
Block N
HPC
Batch-System
Login
E/A-Analysen
Energieeffizienz-Analysen
OptimierungSteuerung
Zugr
iffe
Stromversorgung
Verb
rauc
hS
teue
rung
Opt
imie
rung
� High Precision
� High Frequency
� From complete system down to single nodes

Storage HPC-Component
Throughput-Component
Architecture of storage concept (FASS)
Batch-System Login
Access statistics
Flexible Storage System (FASS)
User A
User Z
User A
… Server/File systems
…
User Z
…
Net
SSD
SAS
SATA
Server 1
Server 2
Server N
Sw
itch
2 S
witc
h 1 Analysis
Optimization and control
Transaction
Checkpoint.
Scratch
Export
ZIH-Infrastructure
SC
RAT
CH
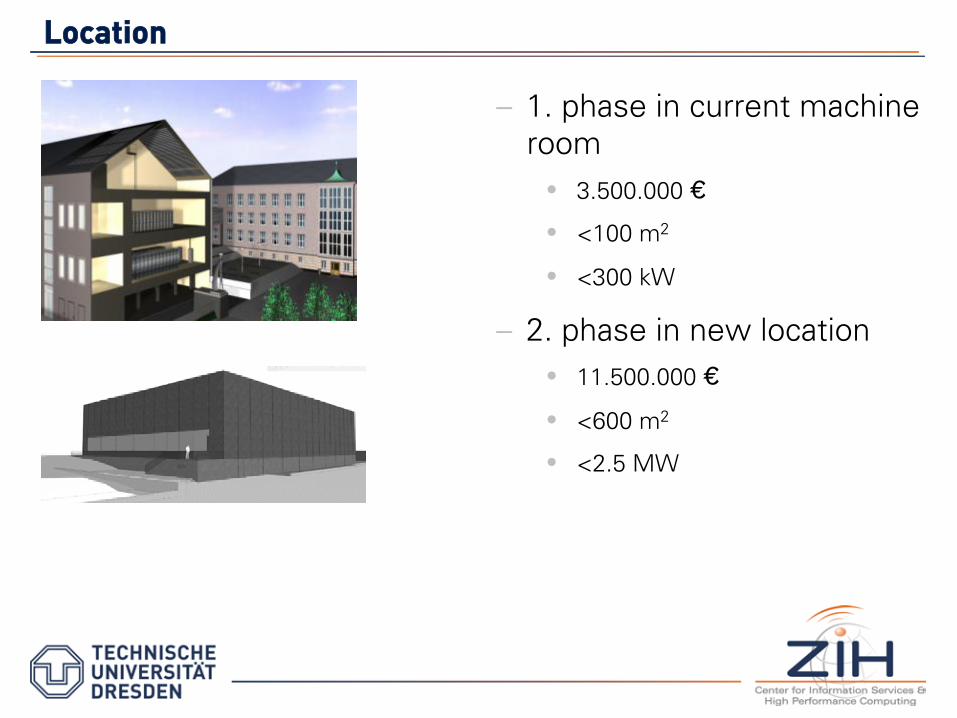
LLooccaattiioonn
– 1. phase in current machine room 3.500.000 €
<100 m2
<300 kW
– 2. phase in new location 11.500.000 €
<600 m2
<2.5 MW
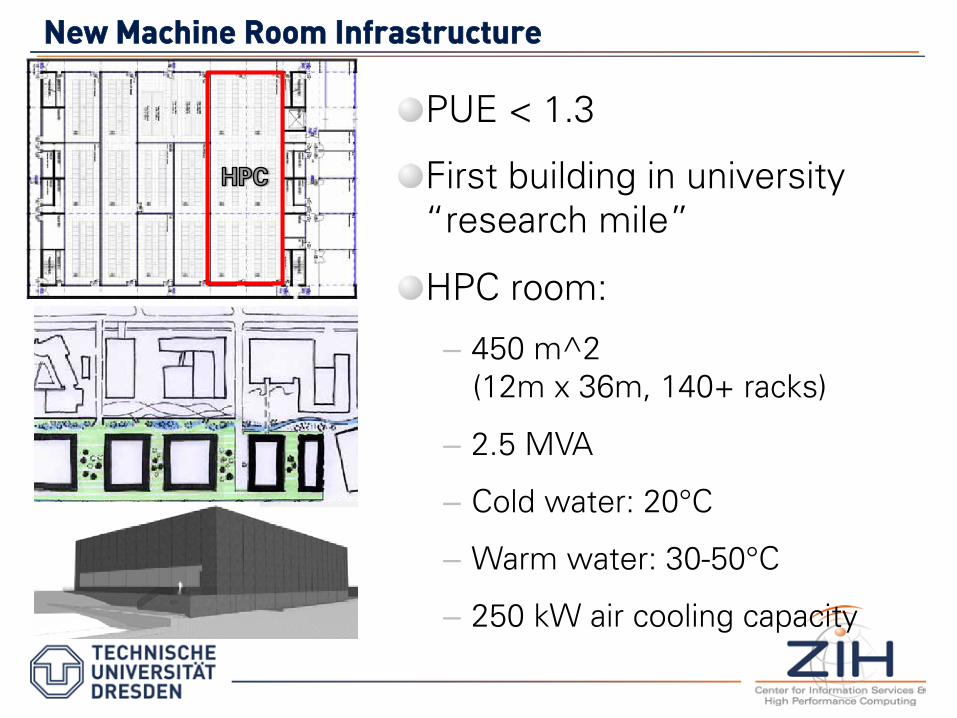
NNeeww MMaacchhiinnee RRoooomm IInnffrraassttrruuccttuurree
� PUE < 1.3
� First building in university “research mile”
� HPC room:
– 450 m^2 (12m x 36m, 140+ racks)
– 2.5 MVA
– Cold water: 20°C
– Warm water: 30-50°C
– 250 kW air cooling capacity

MMaacchhiinnee rroooomm:: BBuuiillddiinngg
Dr. Peter Fischer
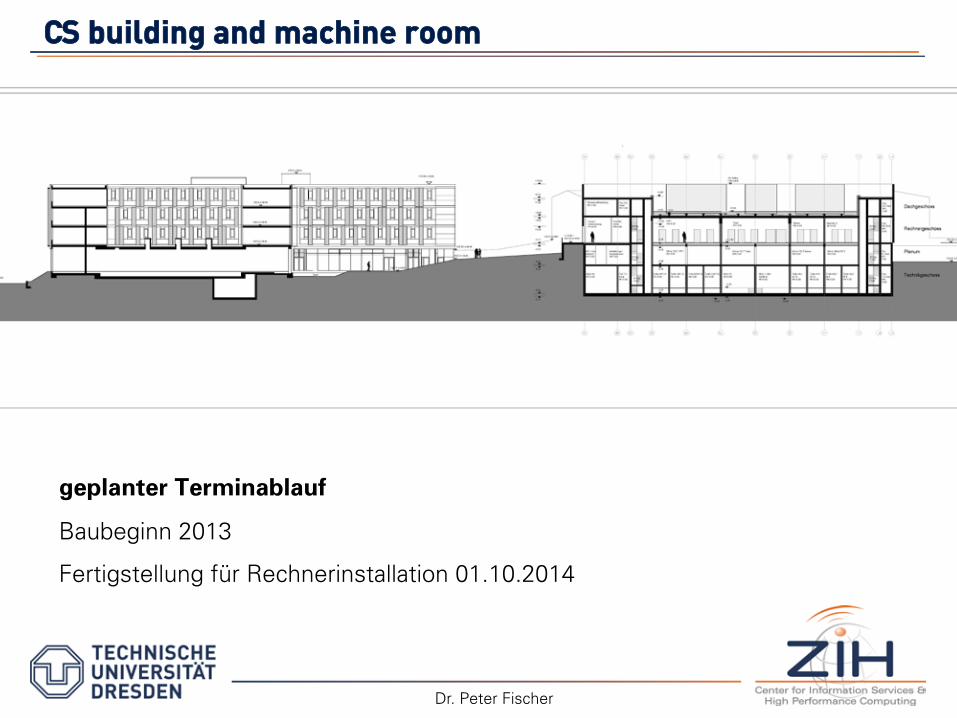
CCSS bbuuiillddiinngg aanndd mmaacchhiinnee rroooomm
geplanter Terminablauf
Baubeginn 2013
Fertigstellung für Rechnerinstallation 01.10.2014
Dr. Peter Fischer

Overview
� Development of hardware performance
� Implications on application performance
� Compute power at Technische Universität Dresden
� Research at ZIH
� Some advertising
Slide 63 LARS: Introduction and Motivation

Forschungsbereiche am ZIH
� Skalierbare Software-Werkzeuge zur Unterstützung der Anwendungsoptimierung auf HPC-Systemen
� Parallele Programmierung, Algorithmen und Methoden
� Verteiltes Rechnen und Cloud Computing
� Datenintensives Rechnen und Data Life Cycle
� Leistungs- und Energieeffizienz-Analyse für innovative Rechnerarchitekturen
� Datenanalyse, Methoden und Modellierung in den Life Sciences
Slide 64 LARS: Introduction and Motivation

Software-Werkzeuge …
� Vampir
– Visualisierung und Analyse von parallelen Anwendungen
� Marmot/MUST
– Erkennung von fehlerhafter Nutzung der MPI Kommunikationsbibliothek
Screenshots: Marmot for Windows
Slide 65 LARS: Introduction and Motivation
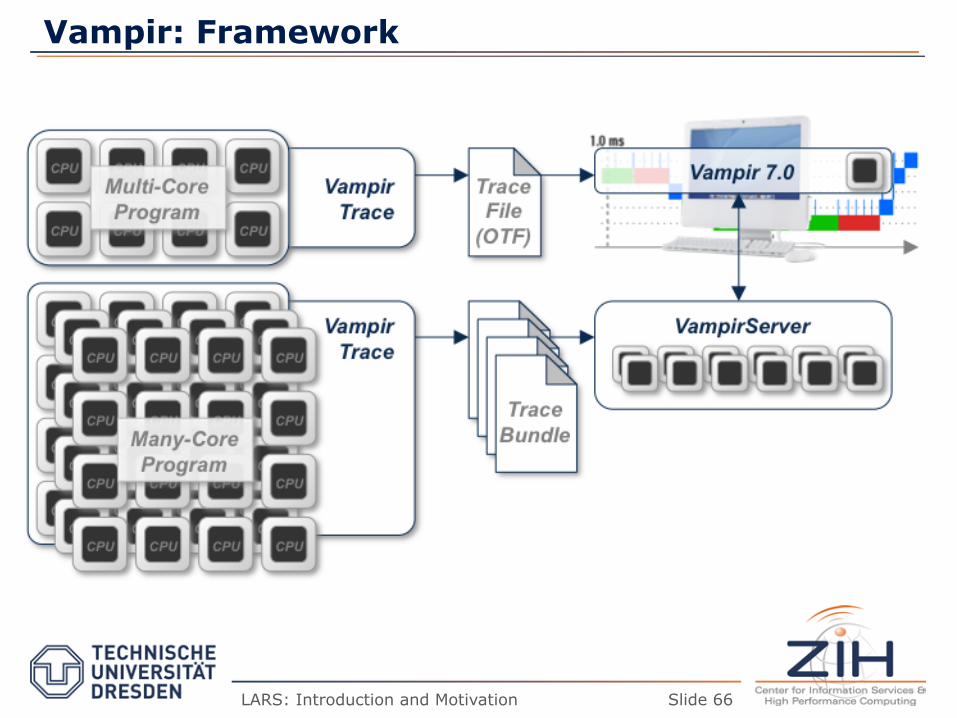
Vampir: Framework
Slide 66 LARS: Introduction and Motivation

Vampir: Timelines
Slide 67 LARS: Introduction and Motivation

Vampir: Summaries
Slide 68 LARS: Introduction and Motivation

Overview
� Development of hardware performance
� Implications on application performance
� Compute power at Technische Universität Dresden
� Research at ZIH
� Some advertising
Slide 69 LARS: Introduction and Motivation

Infrastruktur
� Hochleistungsrechner:
� Arbeitsplätze:
Slide 70 LARS: Introduction and Motivation

Internationale Zusammenarbeit Tracing
ParMA VI HPS
Open MPI
Slide 71 LARS: Introduction and Motivation
Zukunftsaussichten
� In der Many-Core Ära wird paralleles Rechnen immer wichtiger
� Kontakte zu internationalen Partnern
� Industriekontakte: IBM, SUN, Cray, SGI, NEC; Intel, AMD, …
� Mögliche Auslandsaufenthalte oder Industrieinternships
– Beispiele für Auslandsaufenthalte
LLNL, CA, U.S.A.
BSC, Barcelona, Spain
Eugene, OR, U.S.A.
ORNL, U.S.A.
– Beispiele für Internships:
Cray
IBM
NVIDIA
Slide 72 LARS: Introduction and Motivation
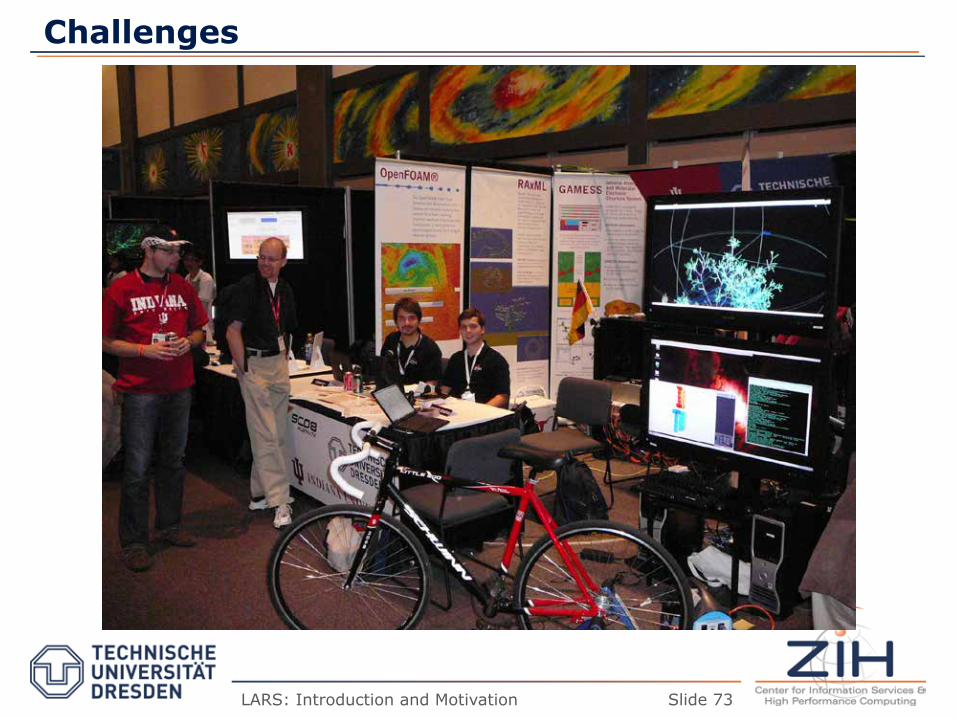
Challenges
Slide 73 LARS: Introduction and Motivation

Challenges
Slide 74 LARS: Introduction and Motivation
� Will the number of cores increase forever?
� How will (super-) computers be programed in 10 years from now?
� Impact of main-stream market?
� Wishes for the class?
Slide 75 LARS: Introduction and Motivation