performance and power optimization for cognitive processor ... performance and power optimization...
TRANSCRIPT
AFRL-RI-RS-TR-2010-076 Final Technical Report March 2010 PERFORMANCE AND POWER OPTIMIZATION FOR COGNITIVE PROCESSOR DESIGN USING DEEP-SUBMICRON VERY LARGE SCALE INTEGRATION (VLSI) TECHNOLOGY State University of New York at Binghamton
APPROVED FOR PUBLIC RELEASE; DISTRIBUTION UNLIMITED.
STINFO COPY
AIR FORCE RESEARCH LABORATORY INFORMATION DIRECTORATE
ROME RESEARCH SITE ROME, NEW YORK

NOTICE AND SIGNATURE PAGE Using Government drawings, specifications, or other data included in this document for any purpose other than Government procurement does not in any way obligate the U.S. Government. The fact that the Government formulated or supplied the drawings, specifications, or other data does not license the holder or any other person or corporation; or convey any rights or permission to manufacture, use, or sell any patented invention that may relate to them. This report was cleared for public release by the 88th ABW, Wright-Patterson AFB Public Affairs Office and is available to the general public, including foreign nationals. Copies may be obtained from the Defense Technical Information Center (DTIC) (http://www.dtic.mil). AFRL-RI-RS-TR-2010-076 HAS BEEN REVIEWED AND IS APPROVED FOR PUBLICATION IN ACCORDANCE WITH ASSIGNED DISTRIBUTION STATEMENT. FOR THE DIRECTOR: /s/ /s/ THOMAS RENZ EDWARD J. JONES, Deputy Chief Work Unit Manager Advanced Computing Division Information Directorate This report is published in the interest of scientific and technical information exchange, and its publication does not constitute the Government’s approval or disapproval of its ideas or findings.

REPORT DOCUMENTATION PAGE Form Approved OMB No. 0704-0188
Public reporting burden for this collection of information is estimated to average 1 hour per response, including the time for reviewing instructions, searching data sources, gathering and maintaining the data needed, and completing and reviewing the collection of information. Send comments regarding this burden estimate or any other aspect of this collection of information, including suggestions for reducing this burden to Washington Headquarters Service, Directorate for Information Operations and Reports, 1215 Jefferson Davis Highway, Suite 1204, Arlington, VA 22202-4302, and to the Office of Management and Budget, Paperwork Reduction Project (0704-0188) Washington, DC 20503. PLEASE DO NOT RETURN YOUR FORM TO THE ABOVE ADDRESS.1. REPORT DATE (DD-MM-YYYY)
MARCH 2010 2. REPORT TYPE
Final 3. DATES COVERED (From - To)
October 2008 – October 2009 4. TITLE AND SUBTITLE PERFORMANCE AND POWER OPTIMIZATION FOR COGNITIVE PROCESSOR DESIGN USING DEEP-SUBMICRON VERY LARGE SCALE INTEGRATION (VLSI) TECHNOLOGY
5a. CONTRACT NUMBER N/A
5b. GRANT NUMBER FA8750-09-2-0011
5c. PROGRAM ELEMENT NUMBER61101E
6. AUTHOR(S) Qing Wu and Qinru Qiu
5d. PROJECT NUMBER BINA
5e. TASK NUMBER CS
5f. WORK UNIT NUMBER 09
7. PERFORMING ORGANIZATION NAME(S) AND ADDRESS(ES)State University of New York at Binghamton Department of Electrical Engineering 4400 Vestal Parkway East Binghamton, NY 13902
8. PERFORMING ORGANIZATION REPORT NUMBER N/A
9. SPONSORING/MONITORING AGENCY NAME(S) AND ADDRESS(ES) AFRL/RITA 525 Brooks Road Rome NY 13441-4505
10. SPONSOR/MONITOR'S ACRONYM(S) N/A
11. SPONSORING/MONITORING AGENCY REPORT NUMBER AFRL-RI-RS-TR-2010-076
12. DISTRIBUTION AVAILABILITY STATEMENT APPROVED FOR PUBLIC RELEASE; DISTRIBUTION UNLIMITED. PA# 88ABW-2010-1156 Date Cleared: 15-March-2010 13. SUPPLEMENTARY NOTES 14. ABSTRACT In the first part of this project, we investigated the performance and power optimization techniques of the floating point unit design as a part of the Air Force Research Laboratory, AFRL cognitive processor project. Our main focus was on exploring different design and synthesis methodologies that lead to the optimized area and power consumption, while fulfilling the performance requirements. Other tasks in this part included tight integration and interaction of logic/physical synthesis, custom circuit design, etc. Simulation and timing analysis results show that our post-layout designs met the area, timing and power requirements of the project. In the second part of the project, we developed a multi-layer cognitive model and algorithm for intelligent text recognition. The algorithm integrates three layers of different cognitive computing models in order to achieve the best accuracy in optical text recognition, as well as the best computation performance on a massively parallel computing cluster. In the first layer, we developed a novel neural network model that performs character recognition from images. The new model is able to provide more than one answer to the input image that is essential for the second layer, word-level recognition based on cogent confabulation. The word confabulation layer also provides multiple candidates that will be cross-checked by the third layer, the sentence confabulation algorithm. We believe that the multi-layer cognitive model concept invented by this project has significant innovation potential in the area of optical text recognition, machine learning and natural language processing. 15. SUBJECT TERMS Floating Point, Synthesis, Cognitive Computing, Brain State in a Box, Confabulation
16. SECURITY CLASSIFICATION OF: 17. LIMITATION OF ABSTRACT
UU
18. NUMBER OF PAGES
35
19a. NAME OF RESPONSIBLE PERSON Thomas Renz
a. REPORT U
b. ABSTRACT U
c. THIS PAGE U
19b. TELEPHONE NUMBER (Include area code) N/A
Standard Form 298 (Rev. 8-98) Prescribed by ANSI Std. Z39.18
i
TABLE OF CONTENTS
1.0 Summary 1 2.0 Introduction 2
2.1 IEEE Standards in Floating Point Numbers and Computations 2 2.2 Cognitive Models and Algorithms for Intelligent Text Recognition 4
2.2.1 Brain-State-in-a-Box Neural Network Model. 4 2.2.2 Confabulation Theory 6
3.0 Floating Point Unit Design and Synthesis 8 4.0 Multi-layer Cognitive Model in Intelligent Text Recognition 13
4.1 Overview of the algorithms, software and hardware platforms 13 4.2 Modified BSB algorithm with racing mechanism 16 4.3 Performance evaluation of the intelligent text recognition program 21
5.0 Conclusions 27 6.0 References 28 7.0 List of Symbols, Abbreviations, and Acronyms 29
ii
LIST OF FIGURES
Figure 1: I/O pins and descriptions for single precision floating point adder/multiplier 2 Figure 2: A confabulation example 7 Figure 3: The ASIC-style design and synthesis flow for FPU 8 Figure 4: Screen shots of the final layouts 10 Figure 5: Projected performance and power roadmap for FPU 11 Figure 6: Mixed ASIC and custom design style for multipliers 11 Figure 7: Schematics of custom multiplier design 12 Figure 8: (a) A tainted text image (b) Layers of intelligent text recognition 13 Figure 9: Multi-layer hybrid cognitive model for ITR 14 Figure 10: Implementation platform for ITR at Binghamton University 15 Figure 11: Overall software flow and partition 16 Figure 12: Training vector for letter “a” in “Times” font 17 Figure 13: Illustration of the training and recall processes of character recognition 17 Figure 14: 1/2/3/5-scratch input images of “a” 18 Figure 15: Screen shot of the ITR program at work 21 Figure 16: Average word confabulation time versus scratch numbers 23 Figure 17: Average word confabulation time versus scratch numbers – Novel 24 Figure 18: Percentage of word confabulations vs. scratch probability 24 Figure 19: Percentage of incorrect word Confabulations vs. scratch severity - 20% 25 Figure 20: Percentage of incorrect word Confabulations vs. scratch severity - 40% 25
iii
LIST OF TABLES Table 1. IEEE 754 Rounding Modes 3 Table 2. IEEE 754 Status Flags 3 Table 3. Area and power consumption numbers after logic synthesis 9 Table 4. Area and timing numbers after physical synthesis 9 Table 5. Convergence numbers for 1-scratch images 19 Table 6. Convergence numbers for 5-scratch images 20 Table 7. Statistics of testing documents 22 Table 8. Sentence confabulation accuracy results 26
1
1.0 SUMMARY In the first part of this project, we investigated the performance and power optimization techniques of the floating point unit design as a part of the Air Force Research Laboratory, AFRL cognitive processor project. Our main focus was on exploring different design and synthesis methodologies that lead to optimized area and power consumption, while fulfilling performance requirements. Meanwhile we were also able to obtain accurate estimations of power and area of the final design, from the synthesis and simulation flow. Other tasks in this part included tight integration and interaction of logic/physical synthesis, custom circuit design, etc. Simulation and timing analysis results show that our post-layout designs met the area, timing and power requirements of the project. In the second part, we developed a multi-layer cognitive model and algorithm for intelligent text recognition. The algorithm integrates three layers of different cognitive computing models in order to achieve the best accuracy in optical text recognition, as well as the best computation performance on a massively parallel computing cluster. In the first layer, we developed a novel neural network model that performs character recognition from images. Different from other neural network models, the new model is able to provide more than one answer to the input image. This feature is essential for the second layer, which is word-level recognition based on cogent confabulation. Similarly the word confabulation layer is able to provide multiple candidates that will be cross-checked by the third layer, the sentence confabulation algorithm. In our approach, these three different cognitive models are made to work together to provide the best possible text recognition result. We believe that the multi-layer cognitive model concept invented by this project has significant innovation potential in the area of optical text recognition, machine learning and natural language processing.
2
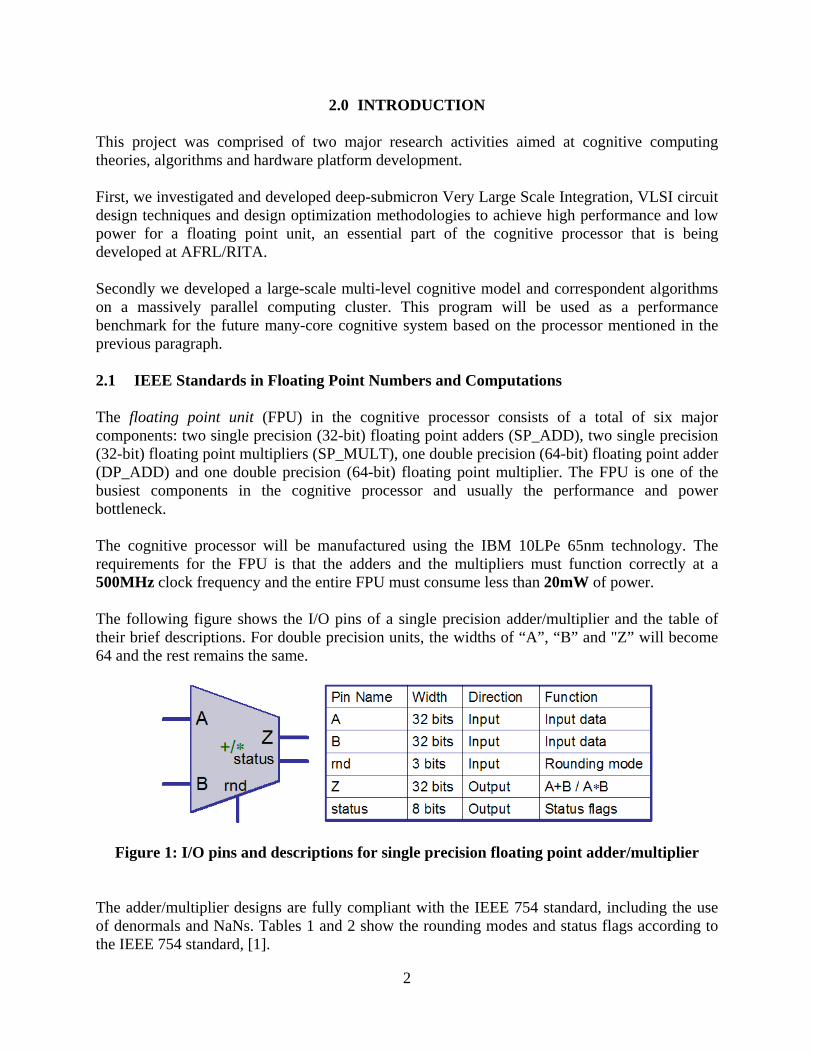
2.0 INTRODUCTION This project was comprised of two major research activities aimed at cognitive computing theories, algorithms and hardware platform development. First, we investigated and developed deep-submicron Very Large Scale Integration, VLSI circuit design techniques and design optimization methodologies to achieve high performance and low power for a floating point unit, an essential part of the cognitive processor that is being developed at AFRL/RITA. Secondly we developed a large-scale multi-level cognitive model and correspondent algorithms on a massively parallel computing cluster. This program will be used as a performance benchmark for the future many-core cognitive system based on the processor mentioned in the previous paragraph. 2.1 IEEE Standards in Floating Point Numbers and Computations The floating point unit (FPU) in the cognitive processor consists of a total of six major components: two single precision (32-bit) floating point adders (SP_ADD), two single precision (32-bit) floating point multipliers (SP_MULT), one double precision (64-bit) floating point adder (DP_ADD) and one double precision (64-bit) floating point multiplier. The FPU is one of the busiest components in the cognitive processor and usually the performance and power bottleneck. The cognitive processor will be manufactured using the IBM 10LPe 65nm technology. The requirements for the FPU is that the adders and the multipliers must function correctly at a 500MHz clock frequency and the entire FPU must consume less than 20mW of power. The following figure shows the I/O pins of a single precision adder/multiplier and the table of their brief descriptions. For double precision units, the widths of “A”, “B” and "Z” will become 64 and the rest remains the same.
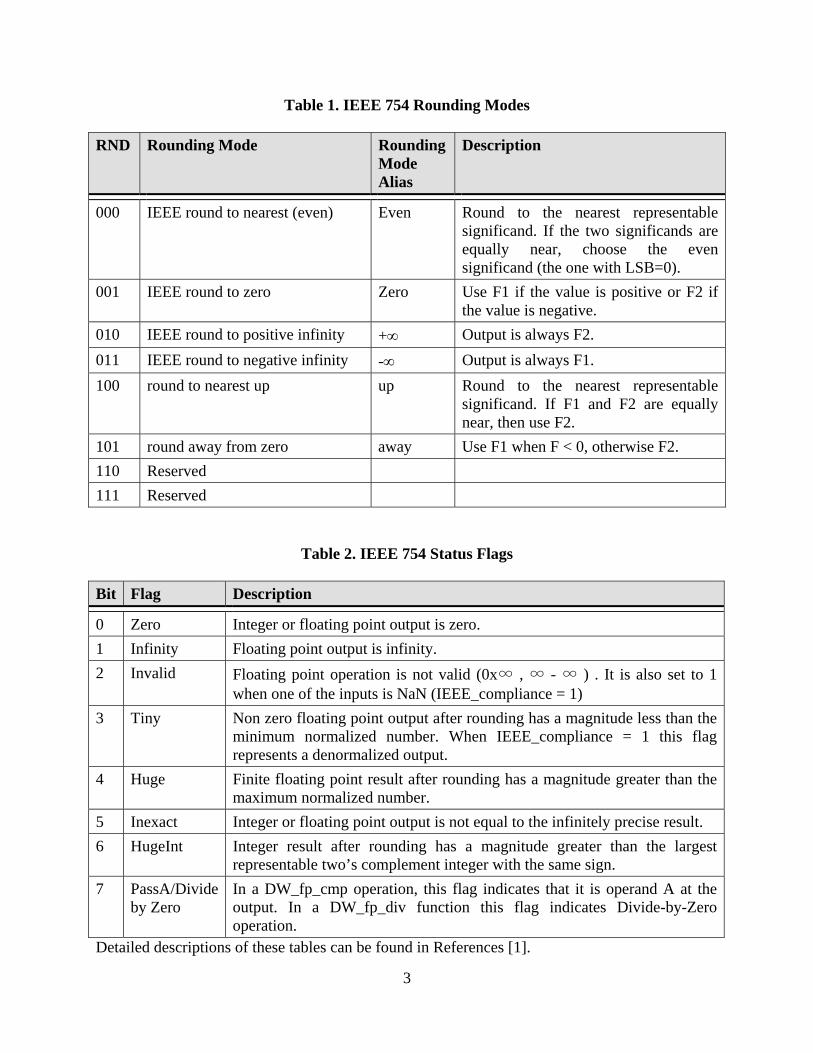
Figure 1: I/O pins and descriptions for single precision floating point adder/multiplier The adder/multiplier designs are fully compliant with the IEEE 754 standard, including the use of denormals and NaNs. Tables 1 and 2 show the rounding modes and status flags according to the IEEE 754 standard, [1].
3
Table 1. IEEE 754 Rounding Modes RND Rounding Mode Rounding
Mode Alias
Description
000 IEEE round to nearest (even) Even Round to the nearest representable significand. If the two significands are equally near, choose the even significand (the one with LSB=0).
001 IEEE round to zero Zero Use F1 if the value is positive or F2 if the value is negative.
010 IEEE round to positive infinity +∞ Output is always F2. 011 IEEE round to negative infinity -∞ Output is always F1. 100 round to nearest up up Round to the nearest representable
significand. If F1 and F2 are equally near, then use F2.
101 round away from zero away Use F1 when F < 0, otherwise F2. 110 Reserved 111 Reserved
Table 2. IEEE 754 Status Flags Bit Flag Description
0 Zero Integer or floating point output is zero. 1 Infinity Floating point output is infinity. 2 Invalid Floating point operation is not valid (0x∞ , ∞ - ∞ ) . It is also set to 1
when one of the inputs is NaN (IEEE_compliance = 1) 3 Tiny Non zero floating point output after rounding has a magnitude less than the
minimum normalized number. When IEEE_compliance = 1 this flag represents a denormalized output.
4 Huge Finite floating point result after rounding has a magnitude greater than the maximum normalized number.
5 Inexact Integer or floating point output is not equal to the infinitely precise result. 6 HugeInt Integer result after rounding has a magnitude greater than the largest
representable two’s complement integer with the same sign. 7 PassA/Divide
by Zero In a DW_fp_cmp operation, this flag indicates that it is operand A at the output. In a DW_fp_div function this flag indicates Divide-by-Zero operation.
Detailed descriptions of these tables can be found in References [1].
4
2.2 Cognitive Models and Algorithms for Intelligent Text Recognition
2.2.1 Brain-State-in-a-Box Neural Network Model. James A. Anderson, a pioneer in the area of artificial neural networks, writes in [5], “most memory in humans is associative. That is, an event is linked to another event, so that presentation of the first event gives rise to the linked event”. So the human brain has an enormous capability to recall the events, but only if a clue which is sufficient is presented to it. In general, a memory that can be accessed by the storage address is called an address addressable memory (AAM) and a memory that can be accessed by content is called a content addressable memory (CAM) or an associative memory. There are two types of associative memory: Autoassociative memory and Heteroassociative memory, [6]. In an Autoassociative memory, after prototype patterns are stored by a neural network, where patterns are usually represented as vectors, a distorted (noisy) version of a stored pattern is subsequently presented to the network. The task of the neural associative memory is to retrieve (recall) the original stored pattern from its noisy version. In Heteroassociative memory, a set of input patterns is paired with a different set of output patterns. Operation of a neural associative memory is characterized by two stages: storage phase, where patterns are being stored by the neural network, and recall phase, where memorized patterns are being retrieved in response to a noisy pattern being presented to the network. The property that is of primary significance for a neural network is the ability of the network to learn from its environment, and to improve its performance through learning. The improvement in performance takes place over time in accordance with some prescribed measure. A neural network learns about its environment through an interactive process of adjustments applied to its synaptic weights and bias levels. Ideally, the network becomes more knowledgeable about its environment after each iteration of the learning process. Learning in the context of neural networks can be defined as: Learning is a process by which the free parameters of a neural network are adapted through a process of stimulation by the environment in which the network is embedded. The type of learning is determined by the manner in which the parameter changes take place. This definition of the learning process implies the following sequence of events:
1. The neural network is stimulated by an environment. 2. The neural network undergoes changes in its free parameters as a result of this
stimulation. 3. The neural network responds in a new way to the environment because of the changes
that have occurred in its internal structure.
5
The Brain-State-in-a-Box (BSB) model was proposed by Anderson et al. in 1977, [7]. It can recognize an original stored pattern from its noisy version. It is a neural network that is considered to be an associative memory. This is because it can have asymptotically stable states that attract the neighboring states to develop in time. This behavior can be interpreted as an evolution of imperfect, noisy patterns toward the correct, stored pattern, hence the term associative memory. The BSB model gets its name from the fact that the network trajectory is constrained to reside in the hypercube Hn = [-1, 1]n. Each vertex of a hypercube has its basin of attraction. When the BSB model is used as an associative memory, asymptotically equilibrium states of the model represent the stored patterns. In other words, realization of associative memories with neural networks requires storage of a set of given patterns as asymptotically stable equilibrium states of the network. The states in basins of attraction about each stable equilibrium state correspond to noisy versions of the stored patterns. When a noisy version of a stored pattern is sufficiently close to a stable state, the network trajectory will converge to one of the basins of attraction state or stable equilibrium state and produces the corresponding correct pattern as output. The mathematical model of a BSB attractor can be represented in the following form. ))0()()(()1( xkxAkxSkx ×+××+×=+ γαλ (1) where: x is a N-dimensional real vector input A is a N-by-N weight matrix determined during the training procedure as shown in equation (3) α > 0 is the scalar constant feedback factor λ is an inhibition decay constant γ = 0 in our case. It is a nonzero constant, if there is a need to maintain the input stimulation. x(k) is the state of BSB network at time k S() is the “squash” function defined as follows:
⎪⎩
⎪⎨
⎧
≤−<<−
≥=
1111
11))((
i
ii
i
i
xifxifx
xifxS (2)
There are two main BSB operations: Training and Recall. Equation (1) is used in the recall operation. The training operation will use the following equations (3) & (4) to determine the weight coefficients in A. xxAxratelearnA ⊗×−×=Δ − )( (3) AAA Δ+= (4) where: x is the normalized N-dimensional real vector which signifies input training pattern learn_rate is the learning rate of the training pattern
is the operator for the outer product of two vectors.
6
The BSB attractor model discussed above is an autoassociative neural memory model. There are other autoassociative and heteroassociative models that have been studied extensively along with different learning algorithms. These models and learning algorithms have many similarities with the BSB model and training algorithm.
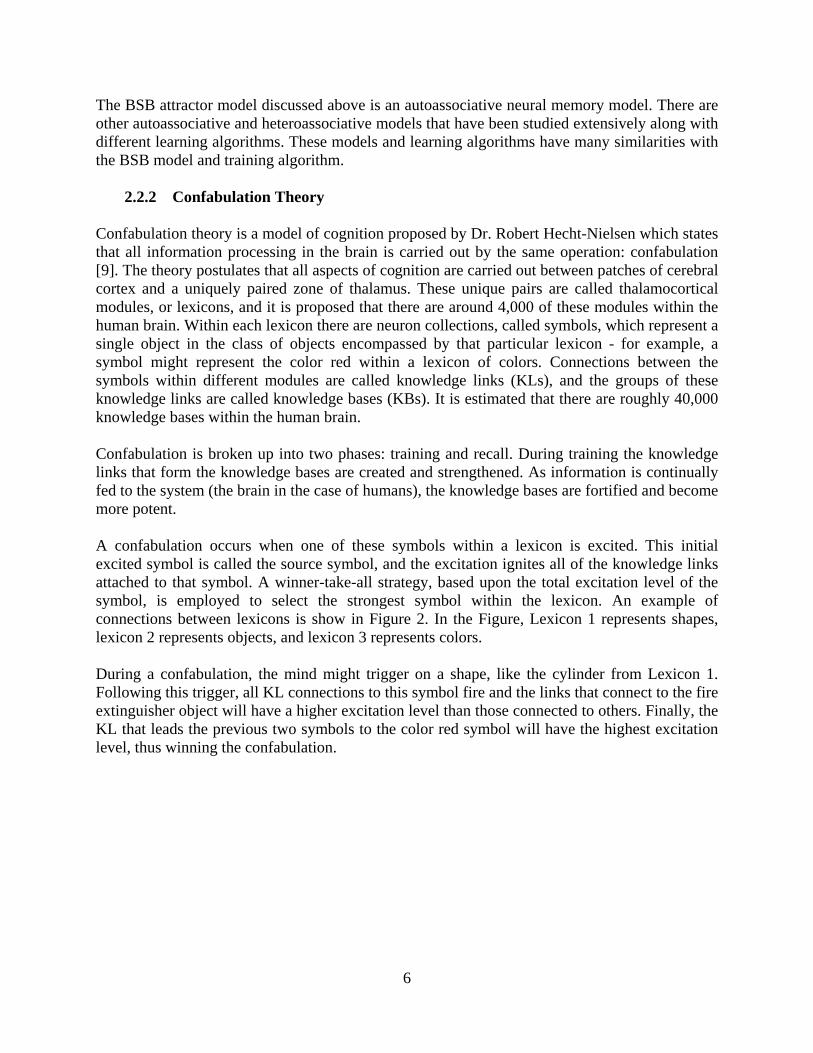
2.2.2 Confabulation Theory Confabulation theory is a model of cognition proposed by Dr. Robert Hecht-Nielsen which states that all information processing in the brain is carried out by the same operation: confabulation [9]. The theory postulates that all aspects of cognition are carried out between patches of cerebral cortex and a uniquely paired zone of thalamus. These unique pairs are called thalamocortical modules, or lexicons, and it is proposed that there are around 4,000 of these modules within the human brain. Within each lexicon there are neuron collections, called symbols, which represent a single object in the class of objects encompassed by that particular lexicon - for example, a symbol might represent the color red within a lexicon of colors. Connections between the symbols within different modules are called knowledge links (KLs), and the groups of these knowledge links are called knowledge bases (KBs). It is estimated that there are roughly 40,000 knowledge bases within the human brain. Confabulation is broken up into two phases: training and recall. During training the knowledge links that form the knowledge bases are created and strengthened. As information is continually fed to the system (the brain in the case of humans), the knowledge bases are fortified and become more potent. A confabulation occurs when one of these symbols within a lexicon is excited. This initial excited symbol is called the source symbol, and the excitation ignites all of the knowledge links attached to that symbol. A winner-take-all strategy, based upon the total excitation level of the symbol, is employed to select the strongest symbol within the lexicon. An example of connections between lexicons is show in Figure 2. In the Figure, Lexicon 1 represents shapes, lexicon 2 represents objects, and lexicon 3 represents colors. During a confabulation, the mind might trigger on a shape, like the cylinder from Lexicon 1. Following this trigger, all KL connections to this symbol fire and the links that connect to the fire extinguisher object will have a higher excitation level than those connected to others. Finally, the KL that leads the previous two symbols to the color red symbol will have the highest excitation level, thus winning the confabulation.
7
Figure 2: A confabulation example
8
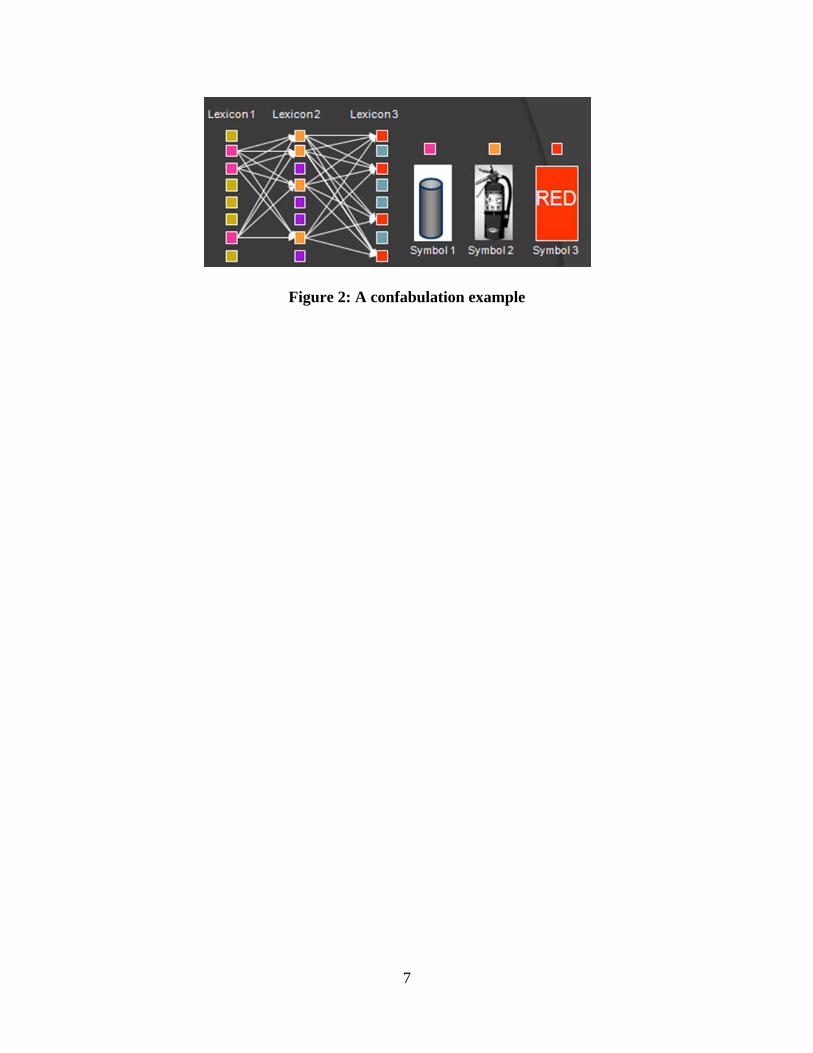
3.0 FLOATING POINT UNIT DESIGN AND SYNTHESIS When VLSI technology entered the 65-nanometer and 32-nanometer eras, many previously ignored (or low-impact) technology parameters became major design concerns. Among them, the important ones were: wire delay, interconnect power consumption, leakage current and process variation. Although the goal of VLSI design is still to achieve highest clock frequency, smallest area and lowest power consumption, we need to address these new design concerns by adopting new design constraints and techniques, as well as new methodology and flow in design, synthesis and verification. In this section we first introduce the ASIC-style synthesis flow and results, followed by some initial results for full-custom designs. The ASIC-style design and synthesis flow we used is shown in Figure 3.
Figure 3: The ASIC-style design and synthesis flow for FPU
In the above flow, we divide the floating-point unit into basic components: single precision adder (SP_ADD), double precision adder (DP_ADD), single-precision multiplier (SP_MULT), double-precision multiplier (DP_MULT) and the controller (FPU_CTRL). Each basic component is designed and synthesized individually with its own area and timing constraints. After obtaining the area information of the components, the final floorplan of the FPU can be generated and the aspect ratios of the components could be adjusted. The new area constraints and aspect ratios are then used to run the logic synthesis and physical synthesis flow one more time for the components, to form the final layout of the FPU. Top-level routing is done as the final step to connect the individual components.
9
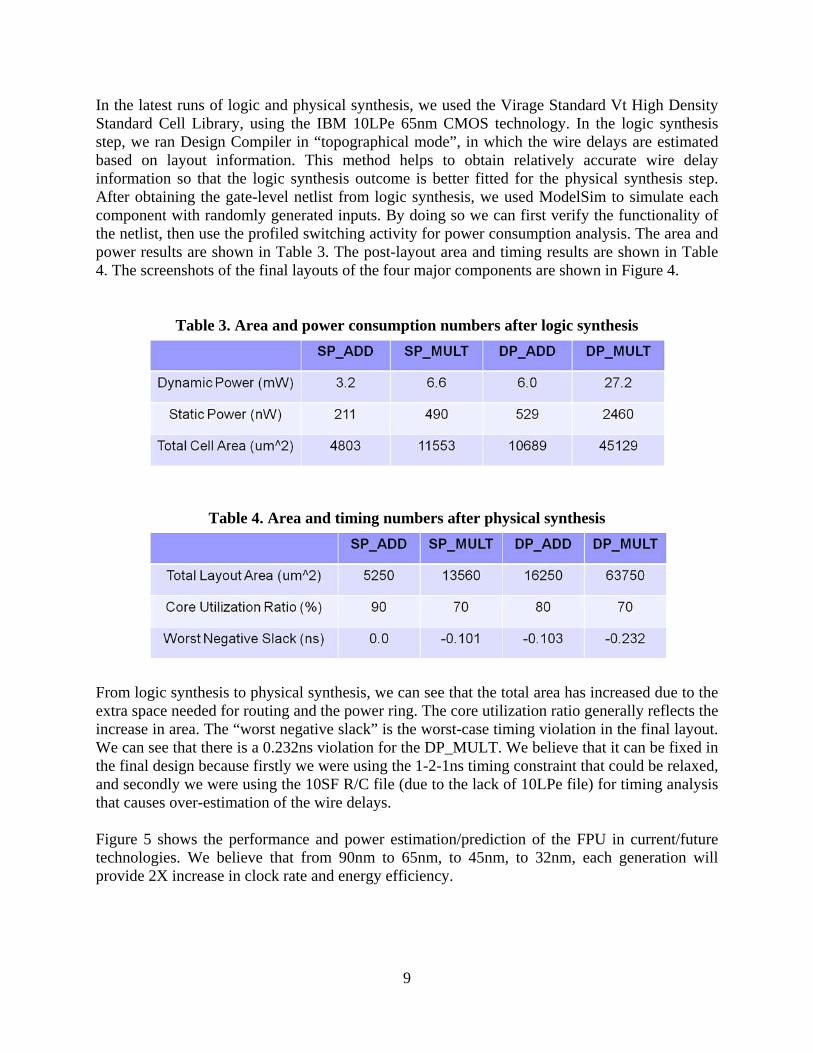
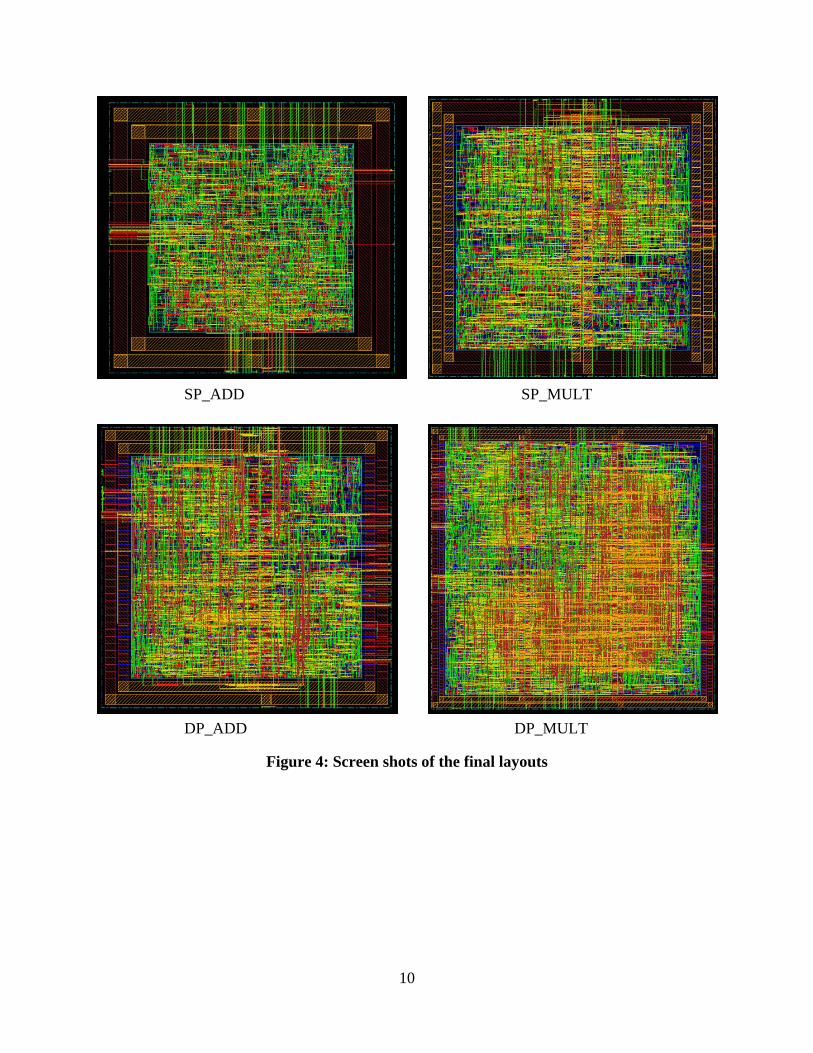
In the latest runs of logic and physical synthesis, we used the Virage Standard Vt High Density Standard Cell Library, using the IBM 10LPe 65nm CMOS technology. In the logic synthesis step, we ran Design Compiler in “topographical mode”, in which the wire delays are estimated based on layout information. This method helps to obtain relatively accurate wire delay information so that the logic synthesis outcome is better fitted for the physical synthesis step. After obtaining the gate-level netlist from logic synthesis, we used ModelSim to simulate each component with randomly generated inputs. By doing so we can first verify the functionality of the netlist, then use the profiled switching activity for power consumption analysis. The area and power results are shown in Table 3. The post-layout area and timing results are shown in Table 4. The screenshots of the final layouts of the four major components are shown in Figure 4.
Table 3. Area and power consumption numbers after logic synthesis
Table 4. Area and timing numbers after physical synthesis
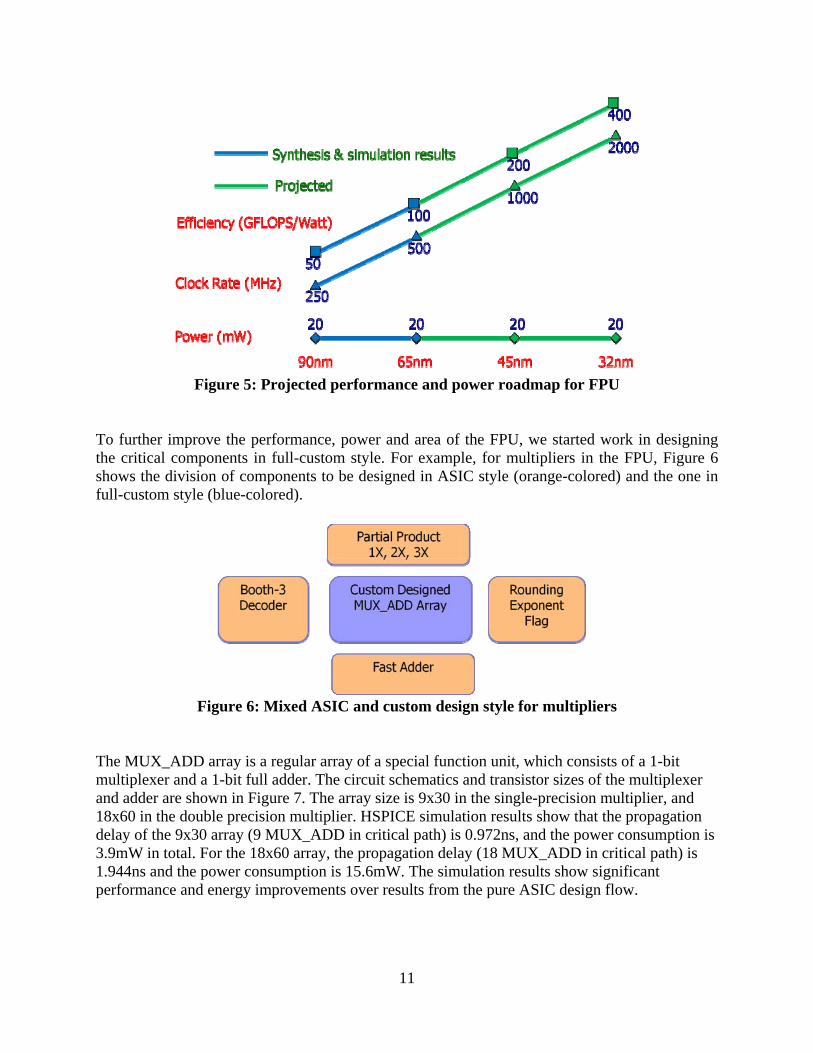
From logic synthesis to physical synthesis, we can see that the total area has increased due to the extra space needed for routing and the power ring. The core utilization ratio generally reflects the increase in area. The “worst negative slack” is the worst-case timing violation in the final layout. We can see that there is a 0.232ns violation for the DP_MULT. We believe that it can be fixed in the final design because firstly we were using the 1-2-1ns timing constraint that could be relaxed, and secondly we were using the 10SF R/C file (due to the lack of 10LPe file) for timing analysis that causes over-estimation of the wire delays. Figure 5 shows the performance and power estimation/prediction of the FPU in current/future technologies. We believe that from 90nm to 65nm, to 45nm, to 32nm, each generation will provide 2X increase in clock rate and energy efficiency.
10
Figure 4: Screen shots of the final layouts
SP_ADD SP_MULT
DP_ADD DP_MULT
11
Figure 5: Projected performance and power roadmap for FPU
To further improve the performance, power and area of the FPU, we started work in designing the critical components in full-custom style. For example, for multipliers in the FPU, Figure 6 shows the division of components to be designed in ASIC style (orange-colored) and the one in full-custom style (blue-colored).
Figure 6: Mixed ASIC and custom design style for multipliers
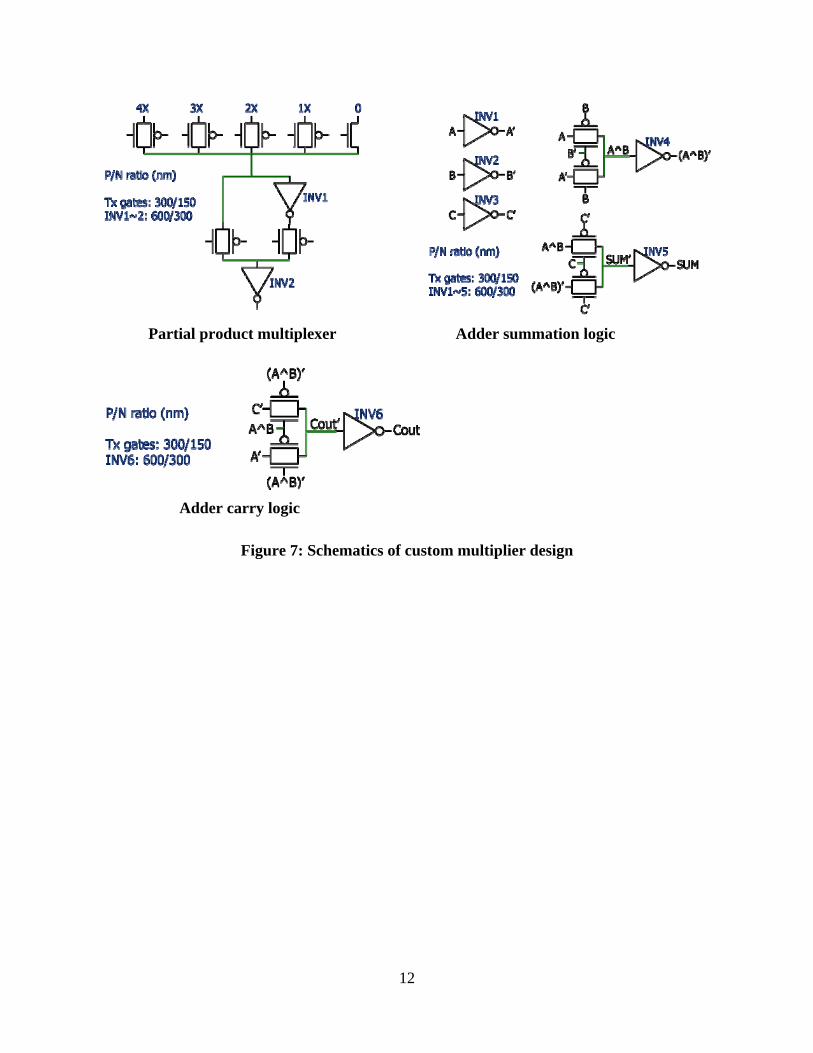
The MUX_ADD array is a regular array of a special function unit, which consists of a 1-bit multiplexer and a 1-bit full adder. The circuit schematics and transistor sizes of the multiplexer and adder are shown in Figure 7. The array size is 9x30 in the single-precision multiplier, and 18x60 in the double precision multiplier. HSPICE simulation results show that the propagation delay of the 9x30 array (9 MUX_ADD in critical path) is 0.972ns, and the power consumption is 3.9mW in total. For the 18x60 array, the propagation delay (18 MUX_ADD in critical path) is 1.944ns and the power consumption is 15.6mW. The simulation results show significant performance and energy improvements over results from the pure ASIC design flow.
12
Figure 7: Schematics of custom multiplier design
Partial product multiplexer Adder summation logic
Adder carry logic

13
4.0 MULTI-LAYER COGNITIVE MODEL IN INTELLIGENT TEXT RECOGNITION 4.1 Overview of the algorithms, software and hardware platforms Modern image processing software can perform image detection and pattern recognition with fairly high accuracy given the condition that the input image is clean and fully observable. Pattern recognition becomes extremely difficult, if not impossible, when the image is partially shaded or partially missing. For example, given the image in Figure 8(a), it would be impossible to recognize the middle character using only image processing techniques. However, such a task is not difficult for humans as we fill in the missing information based on its context.
Figure 8: (a) A tainted text image (b) Layers of intelligent text recognition In this project, we developed an intelligent text recognition (ITR) system that learns from what has been read and, based on the obtained knowledge; it anticipates and predicts the next input image (or the missing part of the current image). Such anticipation helps the system to overcome many kinds of noises that may occur during recognition. This application is mainly built on two cognitive computing models. They are the Brain-State-in-a-Box (BSB) Attractor Model and the Cogent Confabulation Model. Cogent confabulation is an emerging theory proposed by Hecht-Nielsen, [8]. Based on the theory, the information processing of human cognition is carried out by thousands of separate thalamocortical modules that are collectively referred to as a lexicon or a feature attractor module. Different collections of neurons in the thalamocortical module represent different symbols. Knowledge is stored as the links between neurons and the strength of the links. The cognitive information process consists of two steps: learning and recall. During the learning step, the knowledge links are established and strengthened as symbols are co-activated. During recall, a neuron receives excitations from other activated neurons. A “winner-take-all” strategy takes place within each lexicon. Only the neurons (in a lexicon) that represent the winning symbol will be activated, and the winning neurons activate other neurons through knowledge links The ITR system can be divided into 4 layers as shown in Figure 8 (b). The bottom layer is the input of the scanned text image. The second layer consists of character recognition software based on BSB models. It tries to match the input image with stored images of the English alphabet. The third and fourth layers are word and sentence recognition software based on cogent confabulation models.
(a) (b)
14
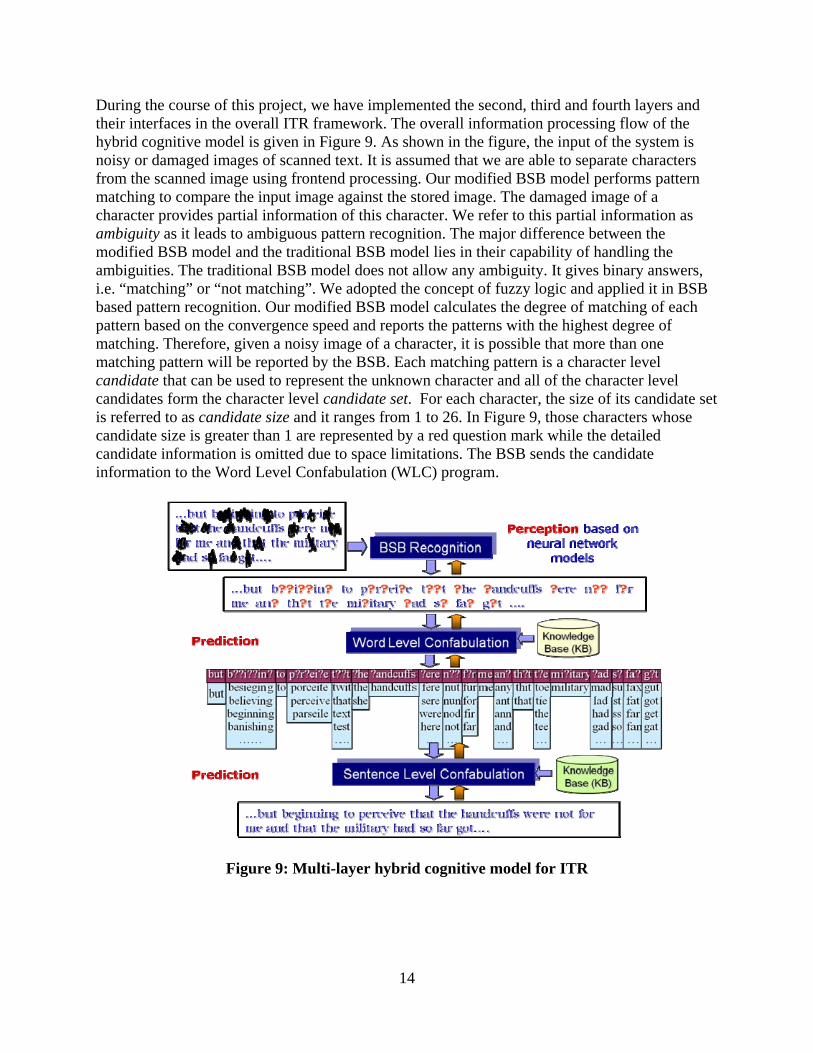
During the course of this project, we have implemented the second, third and fourth layers and their interfaces in the overall ITR framework. The overall information processing flow of the hybrid cognitive model is given in Figure 9. As shown in the figure, the input of the system is noisy or damaged images of scanned text. It is assumed that we are able to separate characters from the scanned image using frontend processing. Our modified BSB model performs pattern matching to compare the input image against the stored image. The damaged image of a character provides partial information of this character. We refer to this partial information as ambiguity as it leads to ambiguous pattern recognition. The major difference between the modified BSB model and the traditional BSB model lies in their capability of handling the ambiguities. The traditional BSB model does not allow any ambiguity. It gives binary answers, i.e. “matching” or “not matching”. We adopted the concept of fuzzy logic and applied it in BSB based pattern recognition. Our modified BSB model calculates the degree of matching of each pattern based on the convergence speed and reports the patterns with the highest degree of matching. Therefore, given a noisy image of a character, it is possible that more than one matching pattern will be reported by the BSB. Each matching pattern is a character level candidate that can be used to represent the unknown character and all of the character level candidates form the character level candidate set. For each character, the size of its candidate set is referred to as candidate size and it ranges from 1 to 26. In Figure 9, those characters whose candidate size is greater than 1 are represented by a red question mark while the detailed candidate information is omitted due to space limitations. The BSB sends the candidate information to the Word Level Confabulation (WLC) program.
Figure 9: Multi-layer hybrid cognitive model for ITR
15
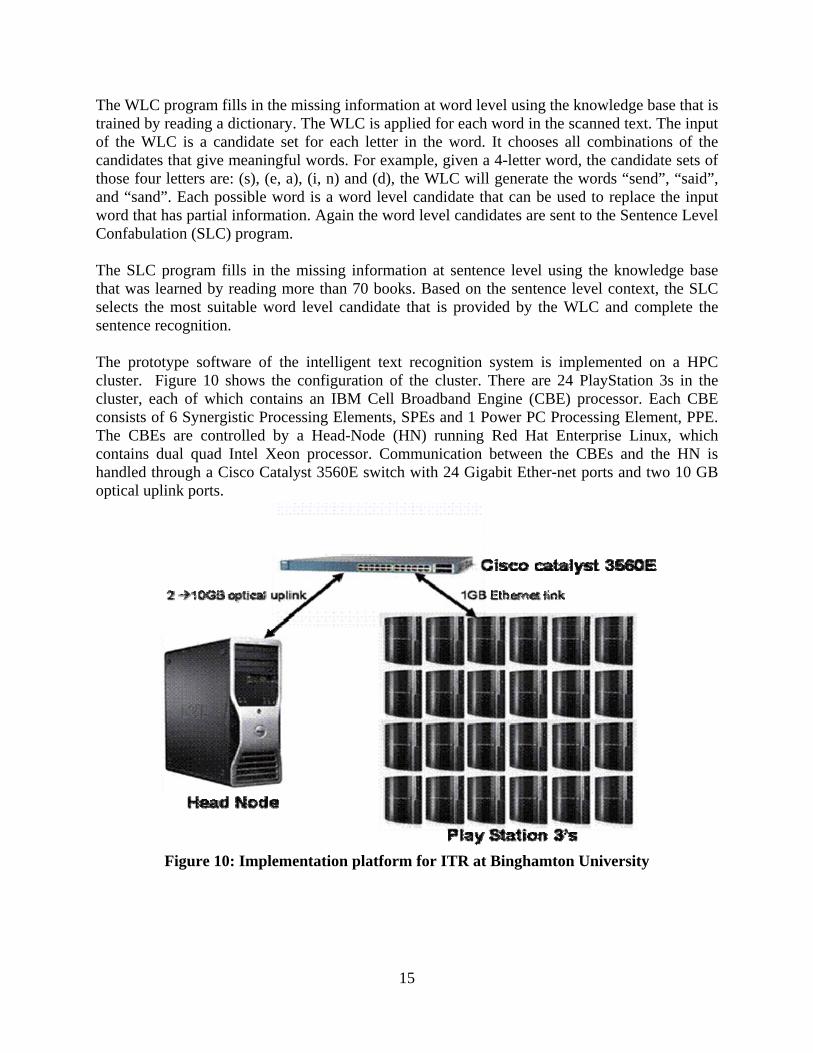
The WLC program fills in the missing information at word level using the knowledge base that is trained by reading a dictionary. The WLC is applied for each word in the scanned text. The input of the WLC is a candidate set for each letter in the word. It chooses all combinations of the candidates that give meaningful words. For example, given a 4-letter word, the candidate sets of those four letters are: (s), (e, a), (i, n) and (d), the WLC will generate the words “send”, “said”, and “sand”. Each possible word is a word level candidate that can be used to replace the input word that has partial information. Again the word level candidates are sent to the Sentence Level Confabulation (SLC) program. The SLC program fills in the missing information at sentence level using the knowledge base that was learned by reading more than 70 books. Based on the sentence level context, the SLC selects the most suitable word level candidate that is provided by the WLC and complete the sentence recognition. The prototype software of the intelligent text recognition system is implemented on a HPC cluster. Figure 10 shows the configuration of the cluster. There are 24 PlayStation 3s in the cluster, each of which contains an IBM Cell Broadband Engine (CBE) processor. Each CBE consists of 6 Synergistic Processing Elements, SPEs and 1 Power PC Processing Element, PPE. The CBEs are controlled by a Head-Node (HN) running Red Hat Enterprise Linux, which contains dual quad Intel Xeon processor. Communication between the CBEs and the HN is handled through a Cisco Catalyst 3560E switch with 24 Gigabit Ether-net ports and two 10 GB optical uplink ports.
Figure 10: Implementation platform for ITR at Binghamton University

16
The ITR system consists of 26 processes that were distributed across the cluster. There were 24 BSB processes, 1 confabulation process and 1 display process. The BSB processes ran on the CBEs. Each BSB process generated 6 BSB threads running on 6 SPEs on the same CBE. The confabulation and display processes ran on the head node due to their large memory requirement. The software communication between nodes in the cluster was through the OpenMPI implementation of the Message Passing Interface (MPI) standard. The overall software flow and partition is shown in Figure 11. .
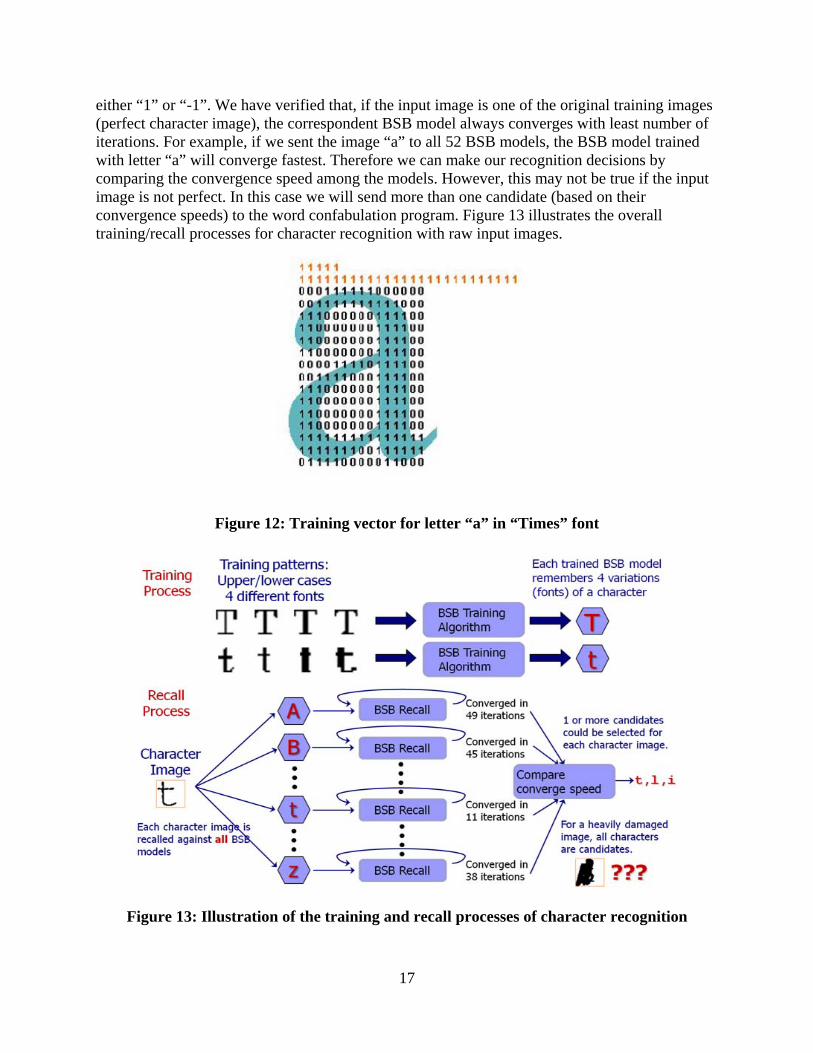
Figure 11: Overall software flow and partition 4.2 Modified BSB algorithm with racing mechanism In this project, we used 256-dimensional BSB models for character recognition. The original character image was defined as a 15x15-pixel black-and-white image. For the state vector of the BSB model, X[0..255], we used X[0..30] as the tag entries and X[31..255] for the character image. For example, Figure 12 shows the training vector of letter “a” in “Times” font. Please note that the value “0” in the entries will be converted to “-1” for BSB computations. We used “0” just for visual purposes. During the training process, each BSB model was trained for one specific character in four different fonts. Therefore for 26 letters in upper/lower cases, we obtained a total of 52 BSB models. During the recall process, given an un-recognized character image, we first formulated it into an input vector, with all tag entries set to “0”. Then the input vector was recalled by all 52 BSB models. The recall process of each BSB model consisted of multiple iterations of the same computation. We set the “convergence condition” to be when all entries in the stage vector are
17
either “1” or “-1”. We have verified that, if the input image is one of the original training images (perfect character image), the correspondent BSB model always converges with least number of iterations. For example, if we sent the image “a” to all 52 BSB models, the BSB model trained with letter “a” will converge fastest. Therefore we can make our recognition decisions by comparing the convergence speed among the models. However, this may not be true if the input image is not perfect. In this case we will send more than one candidate (based on their convergence speeds) to the word confabulation program. Figure 13 illustrates the overall training/recall processes for character recognition with raw input images.
Figure 12: Training vector for letter “a” in “Times” font
Figure 13: Illustration of the training and recall processes of character recognition
18
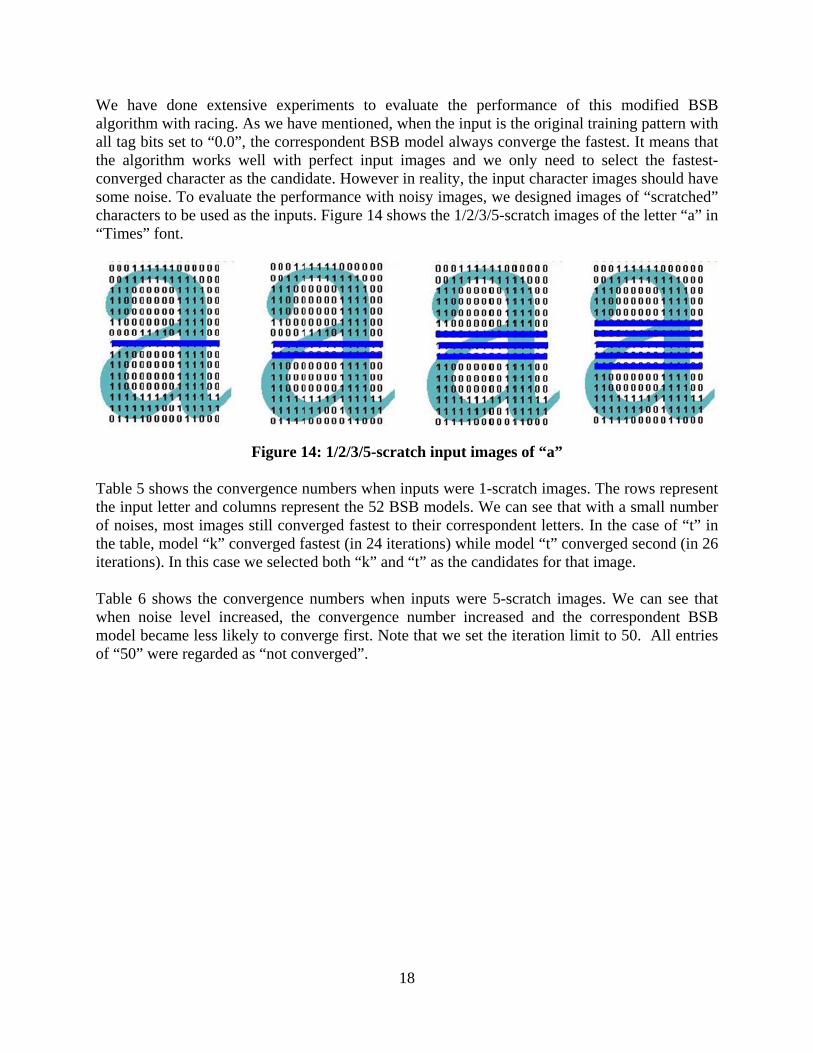
We have done extensive experiments to evaluate the performance of this modified BSB algorithm with racing. As we have mentioned, when the input is the original training pattern with all tag bits set to “0.0”, the correspondent BSB model always converge the fastest. It means that the algorithm works well with perfect input images and we only need to select the fastest-converged character as the candidate. However in reality, the input character images should have some noise. To evaluate the performance with noisy images, we designed images of “scratched” characters to be used as the inputs. Figure 14 shows the 1/2/3/5-scratch images of the letter “a” in “Times” font.
Figure 14: 1/2/3/5-scratch input images of “a”
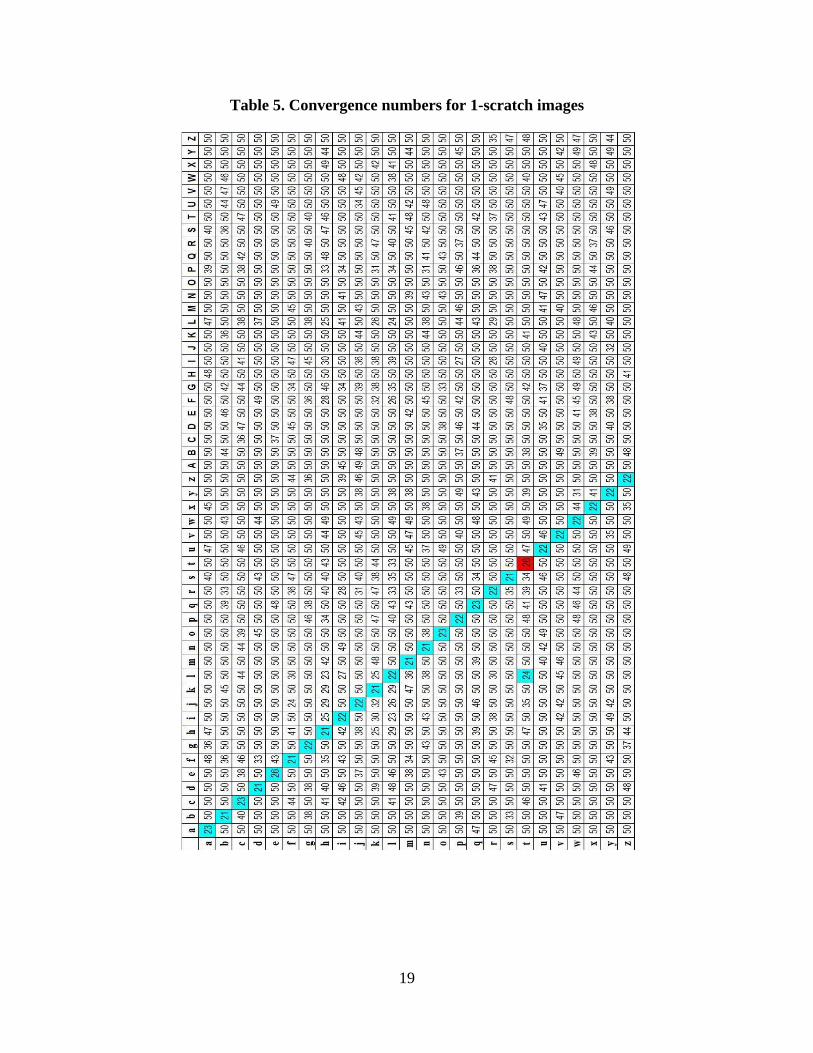
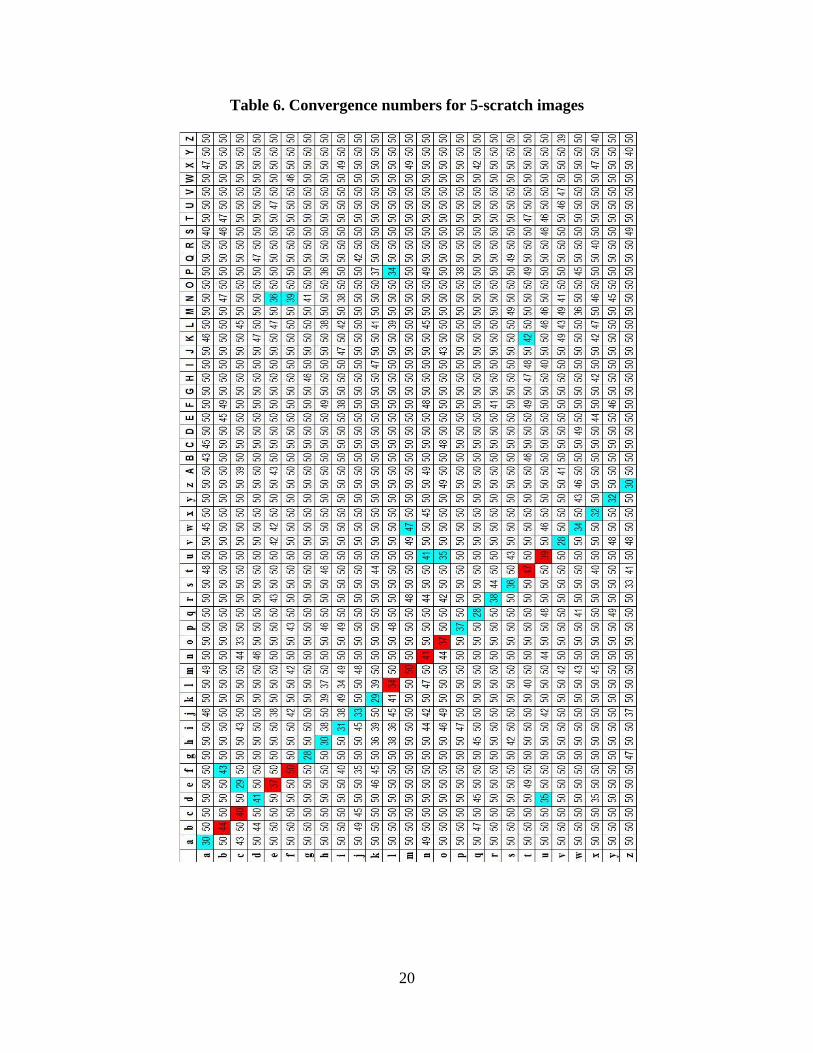
Table 5 shows the convergence numbers when inputs were 1-scratch images. The rows represent the input letter and columns represent the 52 BSB models. We can see that with a small number of noises, most images still converged fastest to their correspondent letters. In the case of “t” in the table, model “k” converged fastest (in 24 iterations) while model “t” converged second (in 26 iterations). In this case we selected both “k” and “t” as the candidates for that image. Table 6 shows the convergence numbers when inputs were 5-scratch images. We can see that when noise level increased, the convergence number increased and the correspondent BSB model became less likely to converge first. Note that we set the iteration limit to 50. All entries of “50” were regarded as “not converged”.
19
Table 5. Convergence numbers for 1-scratch images
20
Table 6. Convergence numbers for 5-scratch images
21
4.3 Performance evaluation of the intelligent text recognition program
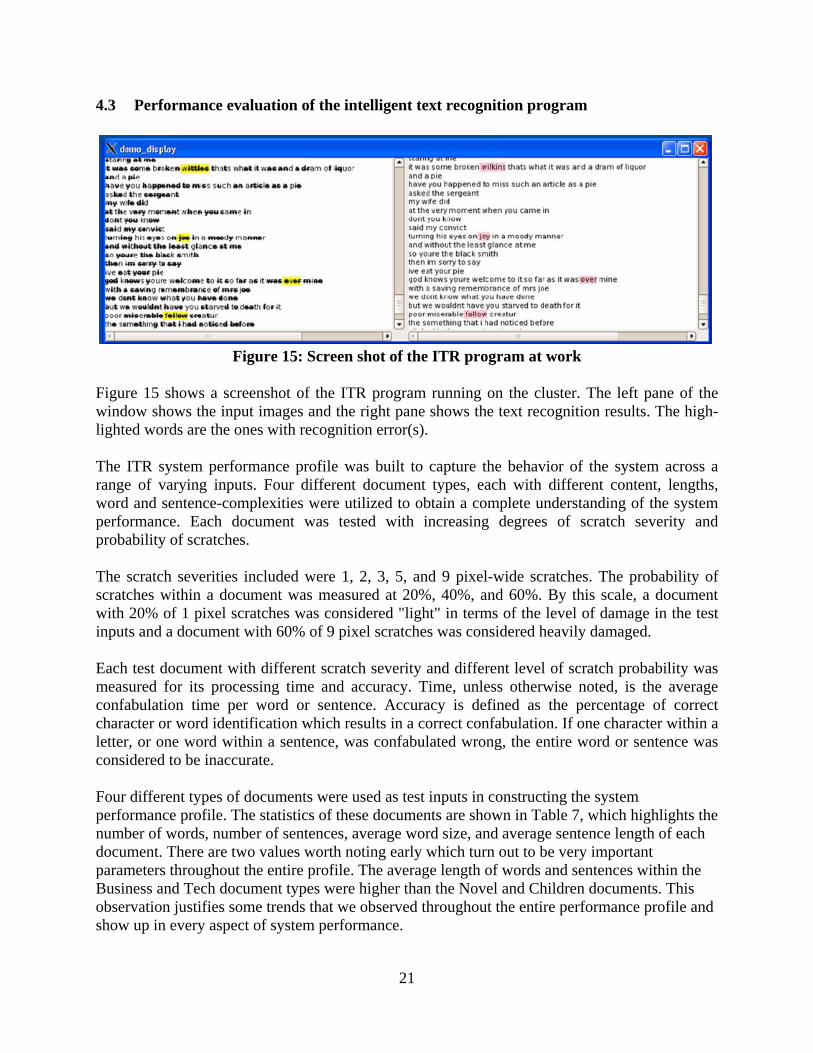
Figure 15: Screen shot of the ITR program at work
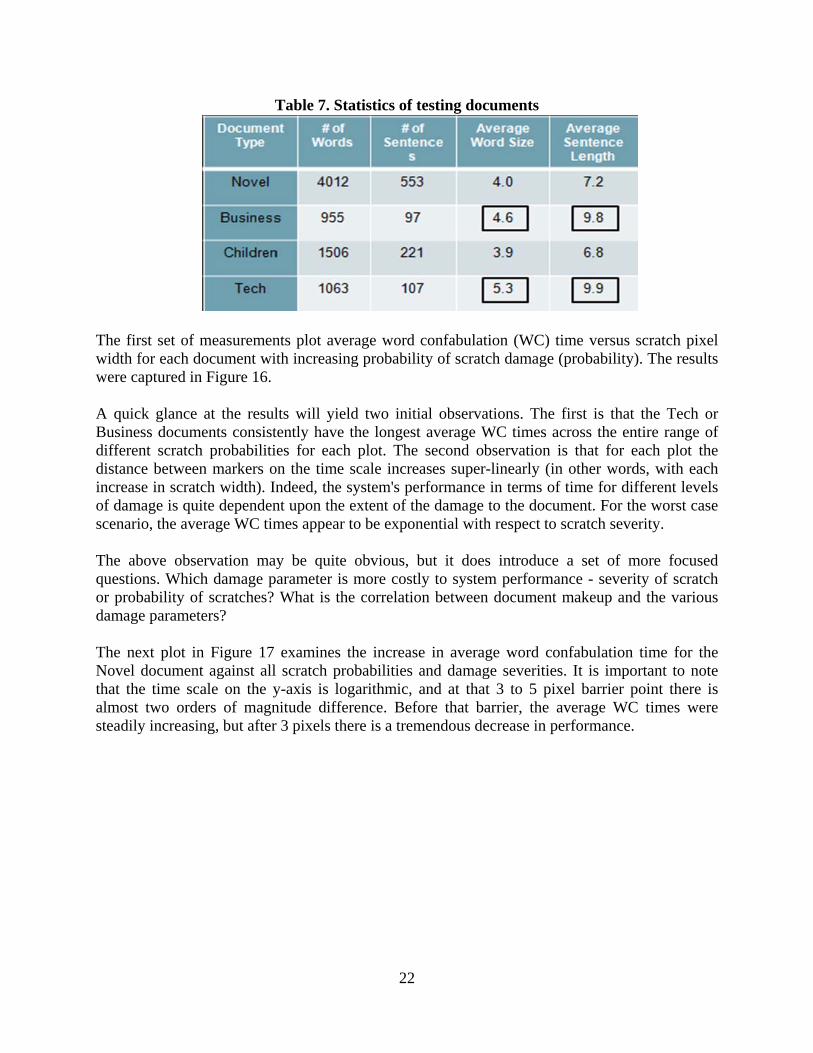
Figure 15 shows a screenshot of the ITR program running on the cluster. The left pane of the window shows the input images and the right pane shows the text recognition results. The high-lighted words are the ones with recognition error(s). The ITR system performance profile was built to capture the behavior of the system across a range of varying inputs. Four different document types, each with different content, lengths, word and sentence-complexities were utilized to obtain a complete understanding of the system performance. Each document was tested with increasing degrees of scratch severity and probability of scratches. The scratch severities included were 1, 2, 3, 5, and 9 pixel-wide scratches. The probability of scratches within a document was measured at 20%, 40%, and 60%. By this scale, a document with 20% of 1 pixel scratches was considered "light" in terms of the level of damage in the test inputs and a document with 60% of 9 pixel scratches was considered heavily damaged. Each test document with different scratch severity and different level of scratch probability was measured for its processing time and accuracy. Time, unless otherwise noted, is the average confabulation time per word or sentence. Accuracy is defined as the percentage of correct character or word identification which results in a correct confabulation. If one character within a letter, or one word within a sentence, was confabulated wrong, the entire word or sentence was considered to be inaccurate. Four different types of documents were used as test inputs in constructing the system performance profile. The statistics of these documents are shown in Table 7, which highlights the number of words, number of sentences, average word size, and average sentence length of each document. There are two values worth noting early which turn out to be very important parameters throughout the entire profile. The average length of words and sentences within the Business and Tech document types were higher than the Novel and Children documents. This observation justifies some trends that we observed throughout the entire performance profile and show up in every aspect of system performance.
22
Table 7. Statistics of testing documents
The first set of measurements plot average word confabulation (WC) time versus scratch pixel width for each document with increasing probability of scratch damage (probability). The results were captured in Figure 16. A quick glance at the results will yield two initial observations. The first is that the Tech or Business documents consistently have the longest average WC times across the entire range of different scratch probabilities for each plot. The second observation is that for each plot the distance between markers on the time scale increases super-linearly (in other words, with each increase in scratch width). Indeed, the system's performance in terms of time for different levels of damage is quite dependent upon the extent of the damage to the document. For the worst case scenario, the average WC times appear to be exponential with respect to scratch severity. The above observation may be quite obvious, but it does introduce a set of more focused questions. Which damage parameter is more costly to system performance - severity of scratch or probability of scratches? What is the correlation between document makeup and the various damage parameters? The next plot in Figure 17 examines the increase in average word confabulation time for the Novel document against all scratch probabilities and damage severities. It is important to note that the time scale on the y-axis is logarithmic, and at that 3 to 5 pixel barrier point there is almost two orders of magnitude difference. Before that barrier, the average WC times were steadily increasing, but after 3 pixels there is a tremendous decrease in performance.

23
Figure 16: Average word confabulation time versus scratch numbers
24
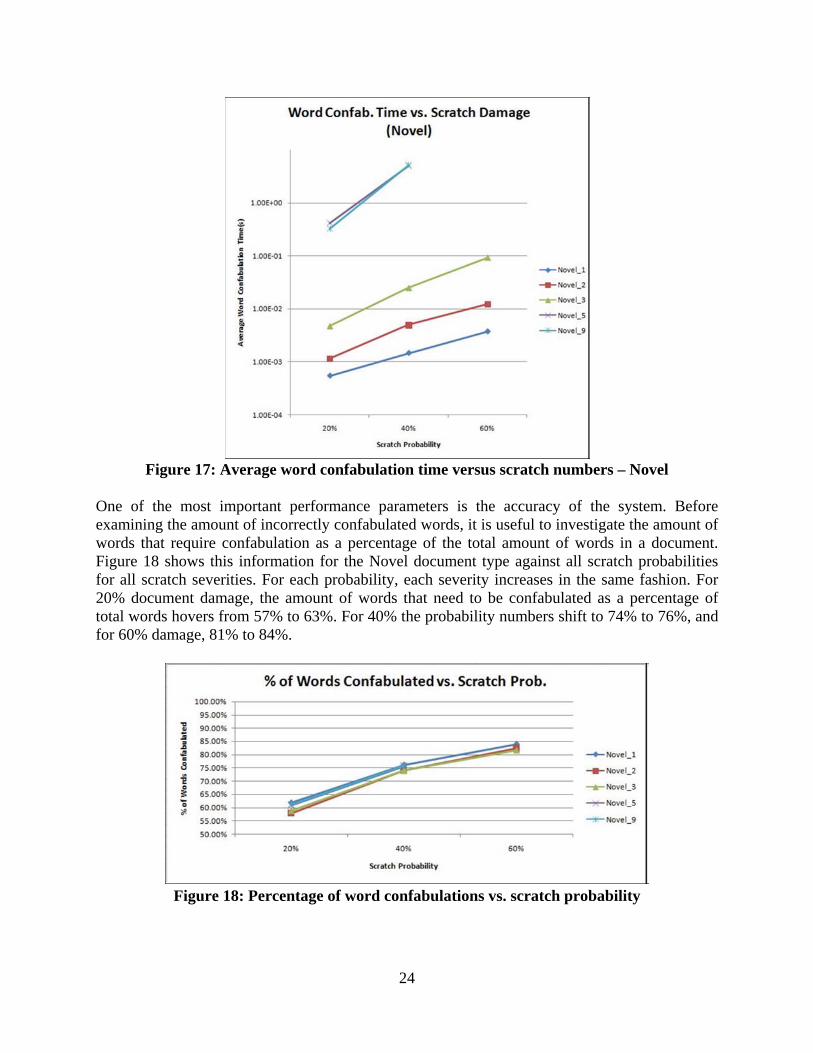
Figure 17: Average word confabulation time versus scratch numbers – Novel
One of the most important performance parameters is the accuracy of the system. Before examining the amount of incorrectly confabulated words, it is useful to investigate the amount of words that require confabulation as a percentage of the total amount of words in a document. Figure 18 shows this information for the Novel document type against all scratch probabilities for all scratch severities. For each probability, each severity increases in the same fashion. For 20% document damage, the amount of words that need to be confabulated as a percentage of total words hovers from 57% to 63%. For 40% the probability numbers shift to 74% to 76%, and for 60% damage, 81% to 84%.
Figure 18: Percentage of word confabulations vs. scratch probability
25
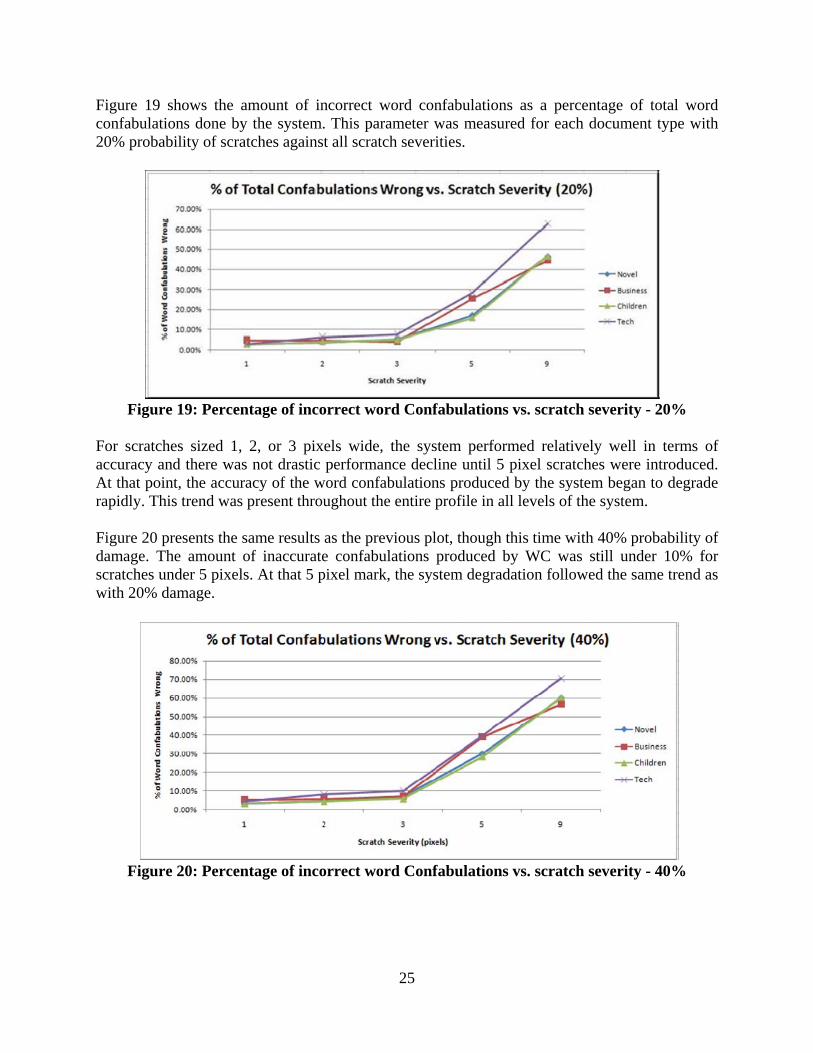
Figure 19 shows the amount of incorrect word confabulations as a percentage of total word confabulations done by the system. This parameter was measured for each document type with 20% probability of scratches against all scratch severities.
Figure 19: Percentage of incorrect word Confabulations vs. scratch severity - 20%
For scratches sized 1, 2, or 3 pixels wide, the system performed relatively well in terms of accuracy and there was not drastic performance decline until 5 pixel scratches were introduced. At that point, the accuracy of the word confabulations produced by the system began to degrade rapidly. This trend was present throughout the entire profile in all levels of the system. Figure 20 presents the same results as the previous plot, though this time with 40% probability of damage. The amount of inaccurate confabulations produced by WC was still under 10% for scratches under 5 pixels. At that 5 pixel mark, the system degradation followed the same trend as with 20% damage.
Figure 20: Percentage of incorrect word Confabulations vs. scratch severity - 40%
26
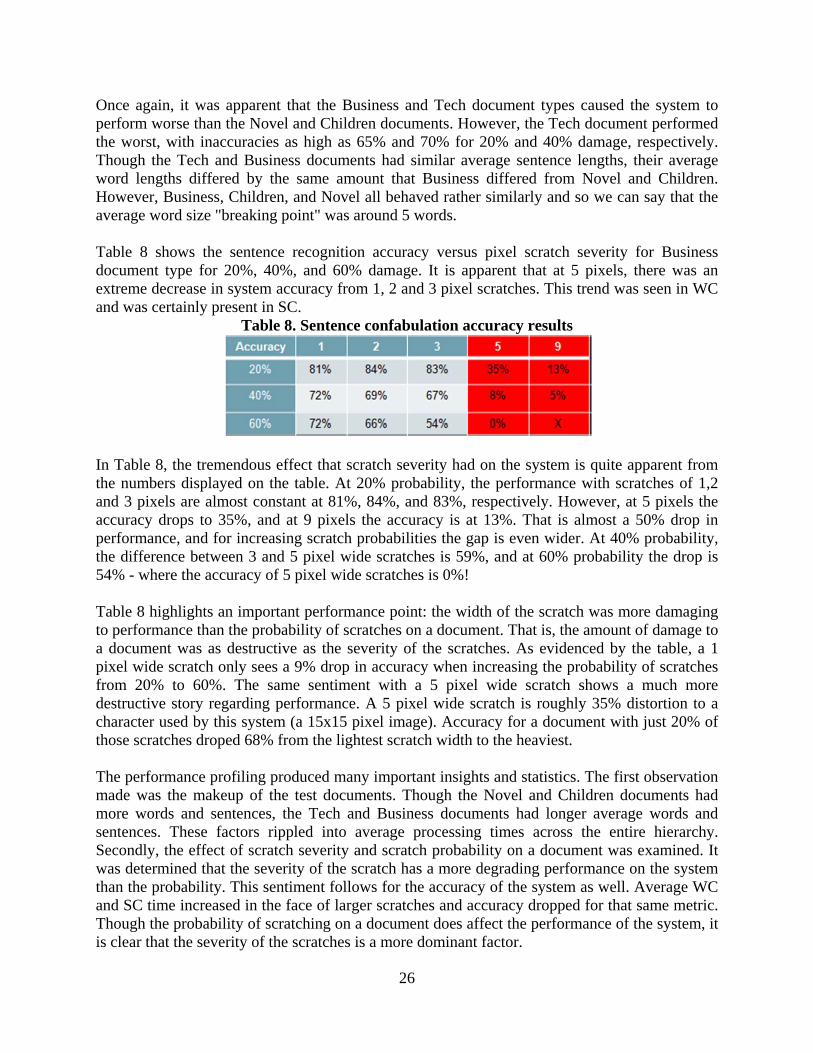
Once again, it was apparent that the Business and Tech document types caused the system to perform worse than the Novel and Children documents. However, the Tech document performed the worst, with inaccuracies as high as 65% and 70% for 20% and 40% damage, respectively. Though the Tech and Business documents had similar average sentence lengths, their average word lengths differed by the same amount that Business differed from Novel and Children. However, Business, Children, and Novel all behaved rather similarly and so we can say that the average word size "breaking point" was around 5 words. Table 8 shows the sentence recognition accuracy versus pixel scratch severity for Business document type for 20%, 40%, and 60% damage. It is apparent that at 5 pixels, there was an extreme decrease in system accuracy from 1, 2 and 3 pixel scratches. This trend was seen in WC and was certainly present in SC.
Table 8. Sentence confabulation accuracy results
In Table 8, the tremendous effect that scratch severity had on the system is quite apparent from the numbers displayed on the table. At 20% probability, the performance with scratches of 1,2 and 3 pixels are almost constant at 81%, 84%, and 83%, respectively. However, at 5 pixels the accuracy drops to 35%, and at 9 pixels the accuracy is at 13%. That is almost a 50% drop in performance, and for increasing scratch probabilities the gap is even wider. At 40% probability, the difference between 3 and 5 pixel wide scratches is 59%, and at 60% probability the drop is 54% - where the accuracy of 5 pixel wide scratches is 0%! Table 8 highlights an important performance point: the width of the scratch was more damaging to performance than the probability of scratches on a document. That is, the amount of damage to a document was as destructive as the severity of the scratches. As evidenced by the table, a 1 pixel wide scratch only sees a 9% drop in accuracy when increasing the probability of scratches from 20% to 60%. The same sentiment with a 5 pixel wide scratch shows a much more destructive story regarding performance. A 5 pixel wide scratch is roughly 35% distortion to a character used by this system (a 15x15 pixel image). Accuracy for a document with just 20% of those scratches droped 68% from the lightest scratch width to the heaviest. The performance profiling produced many important insights and statistics. The first observation made was the makeup of the test documents. Though the Novel and Children documents had more words and sentences, the Tech and Business documents had longer average words and sentences. These factors rippled into average processing times across the entire hierarchy. Secondly, the effect of scratch severity and scratch probability on a document was examined. It was determined that the severity of the scratch has a more degrading performance on the system than the probability. This sentiment follows for the accuracy of the system as well. Average WC and SC time increased in the face of larger scratches and accuracy dropped for that same metric. Though the probability of scratching on a document does affect the performance of the system, it is clear that the severity of the scratches is a more dominant factor.
27
5.0 CONCLUSIONS We would like to thank Richard Linderman, Thomas Renz, Daniel Burns and John Rooks of AFRL, for working closely with us on this project and providing timely and helpful advice. We have investigated the performance and power optimization techniques of the floating point unit design as a part of the AFRL cognitive processor project. Our main focus was on exploring different design and synthesis methodologies that lead to optimized area and power consumption, while fulfilling performance requirements. Meanwhile we were able to obtain accurate estimations of power and area of the final design, from the synthesis and simulation flow. Other efforts in this project included tight integration and interaction of logic/physical synthesis, custom circuit design, etc. Simulation and timing analysis results show that our post-layout designs have met the area, timing and power requirements of the project. We developed a multi-layer cognitive model and algorithm for intelligent text recognition. The algorithm integrates three layers of different cognitive computing models in order to achieve the best accuracy in optical text recognition, as well as the best computation performance on a massively parallel computing cluster. In the first layer, we developed a novel neural network model that performs character recognition from images. Different from other neural network models, the new model is able to provide more than one answer to the input image. This feature is essential for the second layer, which is word-level recognition based on cogent confabulation. Similarly the word confabulation layer is able to provide multiple candidates that will be cross-checked by the third layer: the sentence confabulation algorithm. In our approach, these three different cognitive models are made to work together to provide the best possible text recognition result. We believe that the multi-layer cognitive model concept invented by this project has significant innovation potential in the area of optical text recognition, machine learning and natural language processing.
28
6.0 REFERENCES [1] “Datapath – Floating Point Overview,” Synopsys Inc.,
http://www.synopsys.com/products/designware/docs/doc/dwf/datasheets/fp_overview2.pdf [2] “DesignWare Library Documentation,” Synopsys Inc.,
http://www.synopsys.com/products/designware/docs/toc/dwlibdocs.php [3] “DesignWare® IP Family Reference Guide,” Synopsys Inc.,
http://www.synopsys.com/dw/doc.php/doc/dwf/manuals/dw_qrg.pdf [4] “Switching Activity Interchange Format (SAIF),” Synopsys Inc.,
http://www.synopsys.com/partners/tapin/saif_wp1002.pdf [5] J. A. Anderson, “An Introduction to Neural Networks”, MIT Press, Cambridge, 1995. [6] “Associative Neural Memories: Theory and Implementation,” Mohamad H. Hassoun,
Editor, Oxford University Press, 1993. [7] J. A. Anderson, et.al., “Distinctive Features, Categorical Perception, and Probability
Learning: Applications of a Neural Model,” Psychological Review, 84, pp. 413-451 [8] Robert Hecht-Nielsen, Confabulation Theory: The Mechanism of Thought. Springer, 2007.
29
7.0 LIST OF SYMBOLS, ABBREVIATIONS, AND ACRONYMS AFRL Air Force Research Laboratory ASIC Application Specific Integrated Circuit BSB Brain-State-in-a-Box CAM Content Addressable Memory CBE Cell Broadband Engine CMOS Complementary Metal Oxide Semiconductor DP_ADD Double Precision Adder DP_MULT Double Precision Multiplier FPU Floating Point Unit HN Head Node HPC High Performance Computing IEEE Institute of Electrical and Electronics Engineers ITR Intelligent Text Recognition I/O Input/Output KB Knowledge Base KL Knowledge Link MPI Message Pass Interface NaN Not a Number PPE PowerPC Processing Element SC Sentence Confabulation SLC Sentence Level Confabulation SPE Synergistic Processing Element SP_ADD Single Precision Adder SP_MULT Single Precision Multiplier VLSI Very Large Scale Integration WC Word Confabulation WLC Word Level Confabulation