performance audit at the swedish supreme audit institution
TRANSCRIPT

LUND UNIVERSITY
PO Box 117221 00 Lund+46 46-222 00 00
Performance audit at the Swedish Supreme Audit Institution (SAI)
Bringselius, Louise
2011
Link to publication
Citation for published version (APA):Bringselius, L. (2011). Performance audit at the Swedish Supreme Audit Institution (SAI). (The Lund Institute ofEconomic Research Report Series; Vol. 2011-01). Lund Institute of Economic Research.
Total number of authors:1
General rightsUnless other specific re-use rights are stated the following general rights apply:Copyright and moral rights for the publications made accessible in the public portal are retained by the authorsand/or other copyright owners and it is a condition of accessing publications that users recognise and abide by thelegal requirements associated with these rights. • Users may download and print one copy of any publication from the public portal for the purpose of private studyor research. • You may not further distribute the material or use it for any profit-making activity or commercial gain • You may freely distribute the URL identifying the publication in the public portal
Read more about Creative commons licenses: https://creativecommons.org/licenses/Take down policyIf you believe that this document breaches copyright please contact us providing details, and we will removeaccess to the work immediately and investigate your claim.

The Lund Institute of Economic Research Report Series
PERFORMANCE AUDIT AT THE SWEDISH
SUPREME AUDIT INSTITUTION (SAI)
Louise Bringselius 2011-01
Summary Supreme Audit Institutions (SAIs) constitute important democratic institutions, providing citizens with an independent analysis on how the Governmental Offices and the central public administration function. This paper reports on findings from a survey, submitted to all performance auditors at the Swedish SAI, on 3 May, 2011. The response rate was 70 per cent (65 out of 93 respondents). The survey covered areas such as SAI performance, organisational culture, organisation design, leadership and audit approach. Although confidence in the three Auditors-General has increased considerably since new appointees have replaced these posts, serious problems are pointed out in other areas. Specifically, three areas stand out: SAI performance, SAI organisation and finally SAI compliance with international standards as well as with the Swedish Constitution. Only 3 out of 62 respondents believe that the number of managers at the Swedish SAI is reasonable and 5 out of 65 respondents believe that the organisation design works well. Only 23.8 per cent of respondents believe that the SAI itself meets the standards that it requires other agencies to meet and 26.7 per cent of respondents believe that the costs for the Swedish SAI are reasonable.
Key words
Supreme Audit Institution, SAI, performance audit, state audit, independence.

Author: Louise Bringselius, Ph.D. Research Fellow Lund University School of Economics and Management Lund Institute of Economic Research E-mail: [email protected] Address: Box 7080, SE-220 07 Lund (Sweden) Lund Business Press Lund Institute of Economic Research P.O. Box 7080, SE-220 07 Lund, Sweden ISBN-10 91-85113-49-2 ISBN-13 978-91-85113-49-1

1
1. Introduction Over the past few years, the number of sector specific audit institutions has increased in the Swedish public administration. A similar development can be seen throughout the world. Power (1997) talks about the rise of an audit society. This interest in audit follows partly from a trend where agencies under the central government have become increasingly autonomous. This means that central governments must take on a more distanced position to its agencies, and turn its focus from interventions before decisions, to evaluations after decisions.
These sector specific audit agencies generally report to the central government, but in most developed democracies, there is also an independent agency for state audit: A Supreme Audit Institution (SAI). The SAI audits the Government Offices and the agencies under the central government. This institution is at the heart of a democracy, providing citizens with independent information that will help him or her to hold the central government accountable in public elections. SAIs typically conduct compliance audit (focused especially on accounting) and performance audit, sometimes also referred to as Value For Money audit (Goolsarran 2007). The latter may be considered politically controversial and problematic in various regards (Lapsley and Pong 2000; Pollitt, Xavier, Lonsdale, Mul and Waerness 1999).
In order for the SAI to be considered trustworthy, it is imperative that it can show that it is indeed independent from political influence (ISSAI 1; INTOSAI 2001:13). In the literature on SAIs, there has been a strong emphasis on the constitutional arrangements that are meant to secure SAI independence. There is also a growing literature on how the SAI can account for its own performance (e.g. Talbot and Wiggan 2010; Pollitt and Summa 1997). However, there is less literature on how organisational arrangements may affect SAI performance or independence. In order to approach this area, we need to know more about areas such as culture, trust, organisation and the audit process. This is of particular interest in the area of performance audit, where audit design is more difficult to formalise than in financial (compliance) audit.
The purpose of this study is to explore attitudes towards organisation, culture, management and SAI performance among performance auditors at the Swedish SAI. However, the reader is asked to note that there will not be a very thorough review in this report (either in terms of statistics, or in terms of analysis). Instead, this analysis will be conducted in future research. The primary purpose of this report is to make available the findings from a survey in May 2011 to other researchers as well as practitioners. However, I will provide some initial reflections as to why these findings are interesting.
The report is basically organised in accordance with the survey (Chapters 4-8). A discussion section follows thereafter (Chapter 9), and finally, I will briefly introduce my forthcoming research in this area (Chapter 10). The report has deliberately been kept rather concise.
2. The Swedish Supreme Audit Institution (SSAI) The Swedish SAI (SSAI) is called Riksrevisionen. This agency was formed in year 2003, through the merger (in organisational terms) of the former audit institutions Riksrevisionsverket (RRV) and the Parliamentary Auditors (Riksdagens revisorer). (For a detailed description on the merger process, see Bringselius, 2008). Neither of these two former institutions was independent in the sense that the Intosai prescribes and the reform was considered a constitutional revolution in Sweden. Decades

2
of political discussions have preceded the decision to finally form this new SAI, with an independent position under the Swedish Parliament (Sveriges Riksdag).
Today, the SSAI is well established in Sweden. However, the road to its current position has not been without controversies. On the contrary, since the SSAI was formed in 2003, it has been subjected to extensive criticism in the media as well as in a Parliamentary investigation (Report from the Riksdag Administration 2008/09:URF1, 2008/09:URF3). The criticism concerns: the quality of the SSAI reports, the relevance of what they chose to audit, their lack of dialogue with external stakeholders and not least with the agency being audited, the way that the three Auditors-General lead and organised operations at the SSAI, the new performance audit approach (focused on compliance with formal norms and on defining a person or institution to be held accountable) and the performance of the SSAI itself. SSAI employee attitude surveys in 2004 and 2005 revealed that only 22-24 per cent of the SSAI employees had confidence in the Auditors-General (none of these first three Auditors-General remain today).
Because of the problems at the SSAI, in 2010, the Swedish Parliament chose to make some changes to the Swedish Act on Auditing of State Activities (SFS 2002:1022), specifying that performance audit should not be understood as merely compliance audit, but as a broader practice focused on ”the three E’s” (Economy, Efficiency, Effectiveness). It was also decided that there would no longer be a SSAI board. Instead, the SSAI should send its report directly to the specific Parliamentary committee responsible for the subject matter. Furthermore, the central government would be obliged to respond to each audit report within a 4 month time period.
3. Survey design Because much of my previous research on the SSAI has been mainly qualitative in character (see Bringselius, 2008), I wanted to supplement this research with more quantitative data, which would also allow me to understand the general attitudes. A survey was distributed to all performance auditors (including ‘programansvariga’, but excluding managers) who were on duty at the SSAI in May, 2011. A total of 93 respondents received the survey, and 65 responded, resulting in a response rate of 70 per cent. This response rate is considered satisfactory.
In order to ensure all respondents that their anonymity would be secured, the survey was disbursed by post. A pre-stamped envelope having my address was also enclosed. However, I received an e-mail from one of the respondents who was concerned that anonymity would not be preserved, due to a number on the response envelope. I explained that this number was standard on all envelopes from the Lund Institute of Economic Research. The e-mail indicates that anonymity was considered very important for some of the respondents.
A Likert scale was used for questions 1-28 in the survey, which are the only responses focused on in this report. Questions 29-32 had another design. Responses to these questions are not included in this report, since they need to be analysed using content analysis and a qualitative approach. Question 33 was an open-ended question allowing space for any types of comments. Questions 34-35 asked for background data (time at the SSAI and age). Some of the questions were the same as in previous employee attitude surveys, conducted by statistics institutes on the assignment by the SSAI itself. In future research, I intend to compare the results from these questions.
Questions 1-28 were organised in five sections. First, there was a section (Section A, questions 1-5) on general issues at the SSAI, most of which concerned culture. The next section (Section B,

3
questions 6-13) concerned attitudes towards the SSAI management. Thereafter questions on governance followed (Section C, questions 14-18), and the next section (Section D, questions 19-23) focused on the audit approach. Finally, there was a section (Section E, questions 24-28) on SSAI independence.
Following, I have translated all questions from Swedish into English. For those interested in the Swedish version, the full survey is enclosed in Appendix A.
4. Culture at the SSAI (Section A)
1. ”At the SSAI, I can express my opinion openly.”
Responses according to Table 1. In total 20.2 per cent (mostly or fully) disagree, 20.3 per cent hesitate and 59.4 per cent (mostly or fully) agree.
The mean was 3.55. The median was 4.00. Standard deviation was 1.126.
Table 1. Responses to survey question number 1.
2. ”The SSAI is a learning environment, where both positive and negative opinions are utilised.”
Responses according to Table 2. In total 26.6 per cent (mostly or fully) disagree, 29.7 per cent hesitate and 43.8 per cent (mostly or fully) agree.
The mean was 3.25. The median was 3.00. Standard deviation was 1.127.
Table 2. Responses to survey question number 2.
4
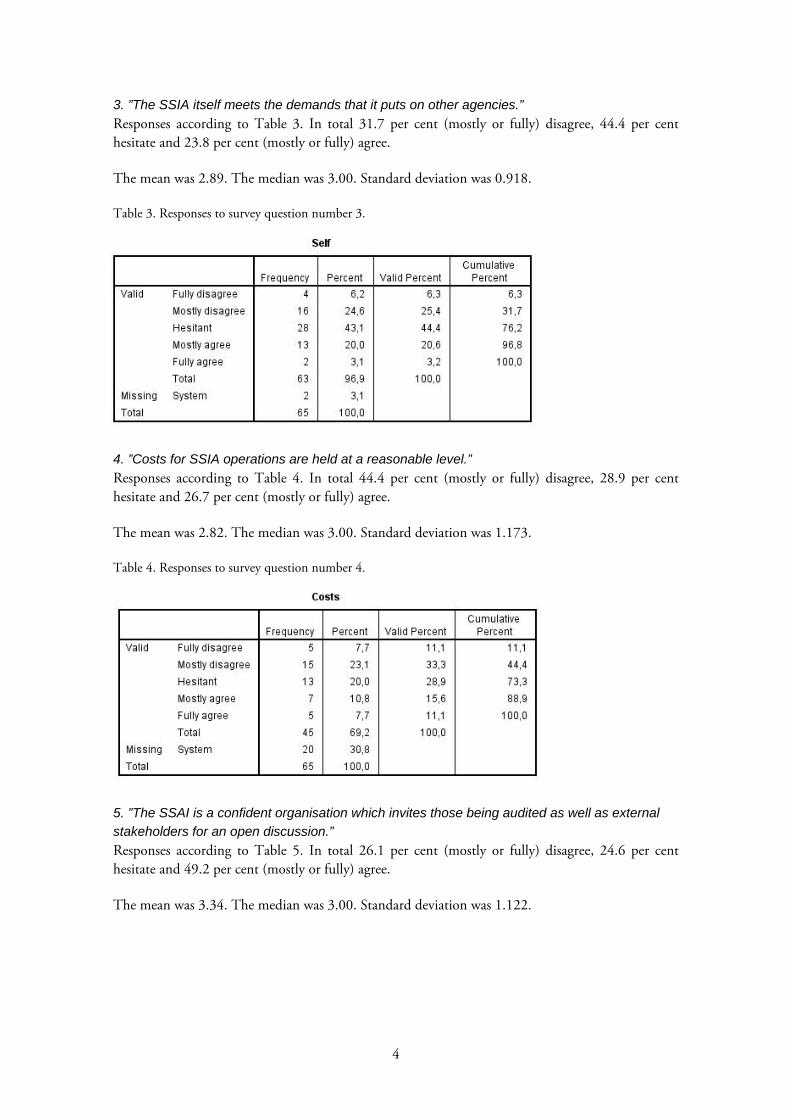
3. ”The SSIA itself meets the demands that it puts on other agencies.”
Responses according to Table 3. In total 31.7 per cent (mostly or fully) disagree, 44.4 per cent hesitate and 23.8 per cent (mostly or fully) agree.
The mean was 2.89. The median was 3.00. Standard deviation was 0.918.
Table 3. Responses to survey question number 3.
4. ”Costs for SSIA operations are held at a reasonable level.”
Responses according to Table 4. In total 44.4 per cent (mostly or fully) disagree, 28.9 per cent hesitate and 26.7 per cent (mostly or fully) agree.
The mean was 2.82. The median was 3.00. Standard deviation was 1.173.
Table 4. Responses to survey question number 4.
5. ”The SSAI is a confident organisation which invites those being audited as well as external
stakeholders for an open discussion.”
Responses according to Table 5. In total 26.1 per cent (mostly or fully) disagree, 24.6 per cent hesitate and 49.2 per cent (mostly or fully) agree.
The mean was 3.34. The median was 3.00. Standard deviation was 1.122.

5
Table 5. Responses to survey question number 5.
5. Attitudes to management (Section B)
6. ”The three Auditors-General cooperate well.”
Responses according to Table 6. In total 15.8 per cent (mostly or fully) disagree, 28.9 per cent hesitate and 55.3 per cent (mostly or fully) agree.
The mean was 3.45. The median was 4.00. Standard deviation was 0.828.
Table 6. Responses to survey question number 6.
7. ”The three Auditors-General treat the auditors with respect.”
Responses according to Table 7. In total 16.9 per cent (mostly or fully) disagree, 26.2 per cent hesitate and 57.0 per cent (mostly or fully) agree.
The mean was 3.54. The median was 4.00. Standard deviation was 1.076.
Table 7. Responses to survey question number 7.
6
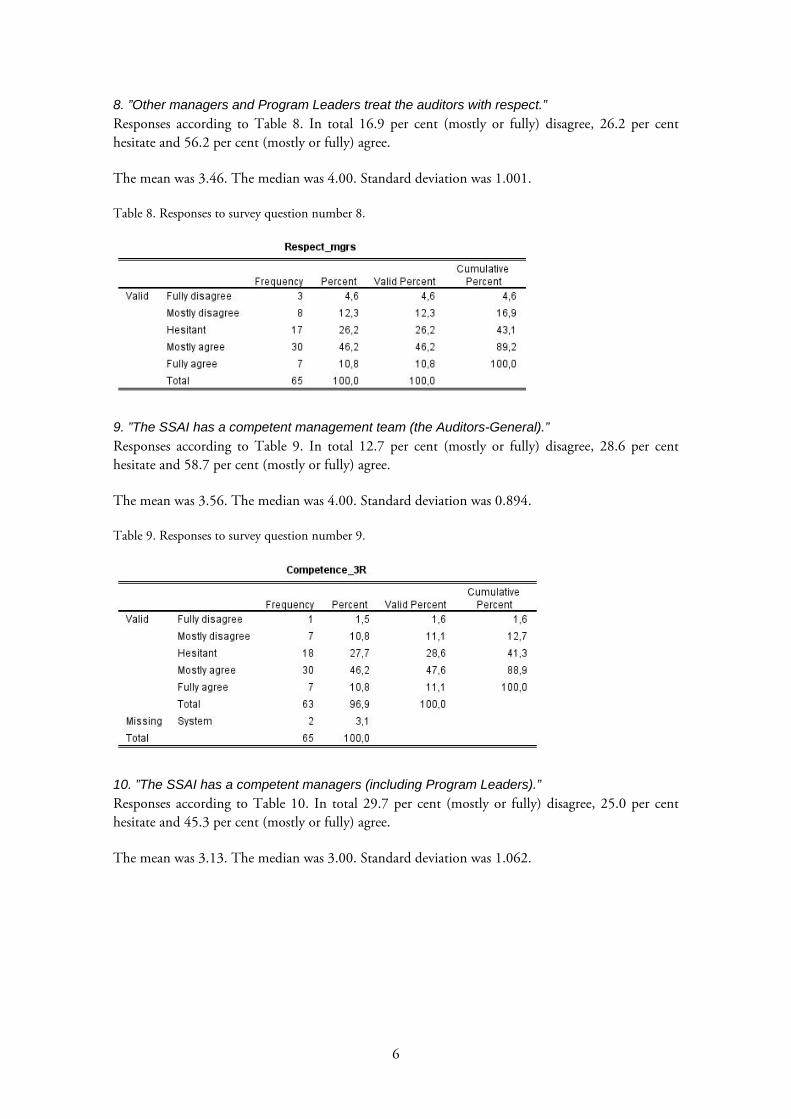
8. ”Other managers and Program Leaders treat the auditors with respect.”
Responses according to Table 8. In total 16.9 per cent (mostly or fully) disagree, 26.2 per cent hesitate and 56.2 per cent (mostly or fully) agree.
The mean was 3.46. The median was 4.00. Standard deviation was 1.001.
Table 8. Responses to survey question number 8.
9. ”The SSAI has a competent management team (the Auditors-General).”
Responses according to Table 9. In total 12.7 per cent (mostly or fully) disagree, 28.6 per cent hesitate and 58.7 per cent (mostly or fully) agree.
The mean was 3.56. The median was 4.00. Standard deviation was 0.894.
Table 9. Responses to survey question number 9.
10. ”The SSAI has a competent managers (including Program Leaders).”
Responses according to Table 10. In total 29.7 per cent (mostly or fully) disagree, 25.0 per cent hesitate and 45.3 per cent (mostly or fully) agree.
The mean was 3.13. The median was 3.00. Standard deviation was 1.062.

7
Table 10. Responses to survey question number 10.
11. ”At the SSAI, it does not happen that employees are subjected to bullying by managers.”
Responses according to Table 11. In total 48.0 per cent (mostly or fully) disagree, 16.7 per cent hesitate and 35.5 per cent (mostly or fully) agree.
The mean was 2.85. The median was 3.00. Standard deviation was 1.384.
Table 11. Responses to survey question number 11.
Although this response is interesting, it should be noted that respondents may refer to the same occasions of accused bullying, meaning that the extent of bullying may still not be extensive. A question for a future survey would be to what extent the respondent herself or himself experiences that she or he has been subjected to bullying by managers. Even in this case, however, it may be that this bullying is caused by a single manager and thus that it does not reveal a pattern that is generalisable to the whole organisation.
12. ”I have confidence in the three Auditors-General.”
Responses according to Table 12. In total 10.9 per cent (mostly or fully) disagree, 29.7 per cent hesitate and 59.7 per cent (mostly or fully) agree.
The mean was 3.61. The median was 4.00. Standard deviation was 0.953.

8
Table 12. Responses to survey question number 12.
13. ”The number of managers and managerial levels at the SSAI is perfectly reasonable.”
Responses according to Table 13. In total 77.4 per cent (mostly or fully) disagree, 17.7 per cent hesitate and 4.8 per cent (mostly or fully) agree.
The mean was 1.85. The median was 2.00. Standard deviation was 0.884.
Table 13. Responses to survey question number 13.
6. Attitudes to organisation (Section C)
14. ”The auditors at the SSAI are competent.”
Responses according to Table 14. In total 15.7 per cent (mostly or fully) disagree, 14.1 per cent hesitate and 84.4 per cent (mostly or fully) agree.
The mean was 4.13. The median was 4.00. Standard deviation was 0.701.

9
Table 14. Responses to survey question number 14.
15. ”The SSAI has a well functioning organisation structure.”
Responses according to Table 15. In total 56.9 per cent (mostly or fully) disagree, 35.4 per cent hesitate and 7.7 per cent (mostly or fully) agree.
The mean was 2.22. The median was 2.00. Standard deviation was 0.960.
Table 15. Responses to survey question number 15.
16. ”The relation between managers and employees is characterised by confidence (rather than
control).”
Responses according to Table 16. In total 26.1 per cent (mostly or fully) disagree, 33.8 per cent hesitate and 40.0 per cent (mostly or fully) agree.
The mean was 3.11. The median was 3.00. Standard deviation was 1.062.
Table 16. Responses to survey question number 16.

10
17. ”The quality assurance process functions as a support (rather than as a control function).”
Responses according to Table 17. In total 33.9 per cent (mostly or fully) disagree, 27.7 per cent hesitate and 38.5 per cent (mostly or fully) agree.
The mean was 3.06. The median was 3.00. Standard deviation was 1.074.
Table 17. Responses to survey question number 17.
18. ”There is a well functioning structure for continuous dialogue and learning between the SSAI
performance auditors.”
Responses according to Table 18. In total 43.1 per cent (mostly or fully) disagree, 32.3 per cent hesitate and 24.6 per cent (mostly or fully) agree.
The mean was 2.78. The median was 3.00. Standard deviation was 0.960.
Table 18. Responses to survey question number 18.
7. The audit process (Section D)
19. ”There is a continuous dialogue among managers and auditors at the SSAI, on international
standards and guidelines (Intosai).”
Responses according to Table 18. In total 63.0 per cent (mostly or fully) disagree, 27.8 per cent hesitate and 9.3 per cent (mostly or fully) agree.
The mean was 2.22. The median was 2.00. Standard deviation was 0.925.

11
Table 19. Responses to survey question number 19.
20. ”The meaning of the latest Parliamentary decision on the approach adopted in performance
audit (June, 2010), has been thoroughly discussed among managers and auditors.”
Responses according to Table 20. In total 30.5 per cent (mostly or fully) disagree, 32.2 per cent hesitate and 27.1 per cent (mostly or fully) agree.
The mean was 3.00. The median was 3.00. Standard deviation was 1.232.
Table 20. Responses to survey question number 20.
21. ”The same Parliamentary decision has lead to a stronger focus on
efficiency/efficacy/effectiveness in performance audit, as opposed to compliance audit.”
Responses according to Table 21. In total 15.5 per cent (mostly or fully) disagree, 12.1 per cent hesitate and 72.4 per cent (mostly or fully) agree.
The mean was 3.72. The median was 4.00. Standard deviation was 0.970.
Table 21. Responses to survey question number 21.

12
22. ”The same Parliamentary decision has led to a clear rejection on the side of the Auditors-
General, for issues of accountability.”
Responses according to Table 22. In total 42.0 per cent (mostly or fully) disagree, 38.0 per cent hesitate and 20.0 per cent (mostly or fully) agree.
The mean was 2.72. The median was 3.00. Standard deviation was 1.051.
Table 22. Responses to survey question number 22.
23. ”The SSAI performance audit is in practice (distinguish words from practice) no longer
focused on accountability.”
Responses according to Table 23. In total 28.3 per cent (mostly or fully) disagree, 39.6 per cent hesitate and 32.1 per cent (mostly or fully) agree.
The mean was 3.04. The median was 3.00. Standard deviation was 0.919.
Table 23. Responses to survey question number 23.
8. Independence (Section E)
24. ”The recruitment of managers from the office of central Government does not affect the
independence of the SSAI.”
Responses according to Table 24. In total 29.2 per cent (mostly or fully) disagree, 14.6 per cent hesitate and 56.2 per cent (mostly or fully) agree.
The mean was 3.44. The median was 4.00. Standard deviation was 1.253.

13
Table 24. Responses to survey question number 24.
25. ”The SSAI performance audit is meaningful even if measures are not immediately
undertaken.”
Responses according to Table 25. In total 1.6 per cent (mostly or fully) disagree, 9.4 per cent hesitate and 89.1 per cent (mostly or fully) agree.
The mean was 4.30. The median was 4.00. Standard deviation was 0.706.
Table 25. Responses to survey question number 25.
26. ”Conclusions in audit reports are never adapted in order to become more interesting to the
media or other external stakeholders.”
Responses according to Table 26. In total 22.2 per cent (mostly or fully) disagree, 14.3 per cent hesitate and 63.5 per cent (mostly or fully) agree.
The mean was 3.68. The median was 4.00. Standard deviation was 1.305.

14
Table 26. Responses to survey question number 26.
27. ”Decisions regarding audits are made without any external influence whatsoever.”
Responses according to Table 27. In total 22.1 per cent (mostly or fully) disagree, 18.6 per cent hesitate and 59.3 per cent (mostly or fully) agree.
The mean was 3.59. The median was 4.00. Standard deviation was 1.247.
Table 27. Responses to survey question number 27.
28. ”The SSAI avoids getting involved in politics.”
Responses according to Table 28. In total 8.0 per cent (mostly or fully) disagree, 17.7 per cent hesitate and 74.0 per cent (mostly or fully) agree.
The mean was 4.00. The median was 4.00. Standard deviation was 1.024.
Table 28. Responses to survey question number 28.
15
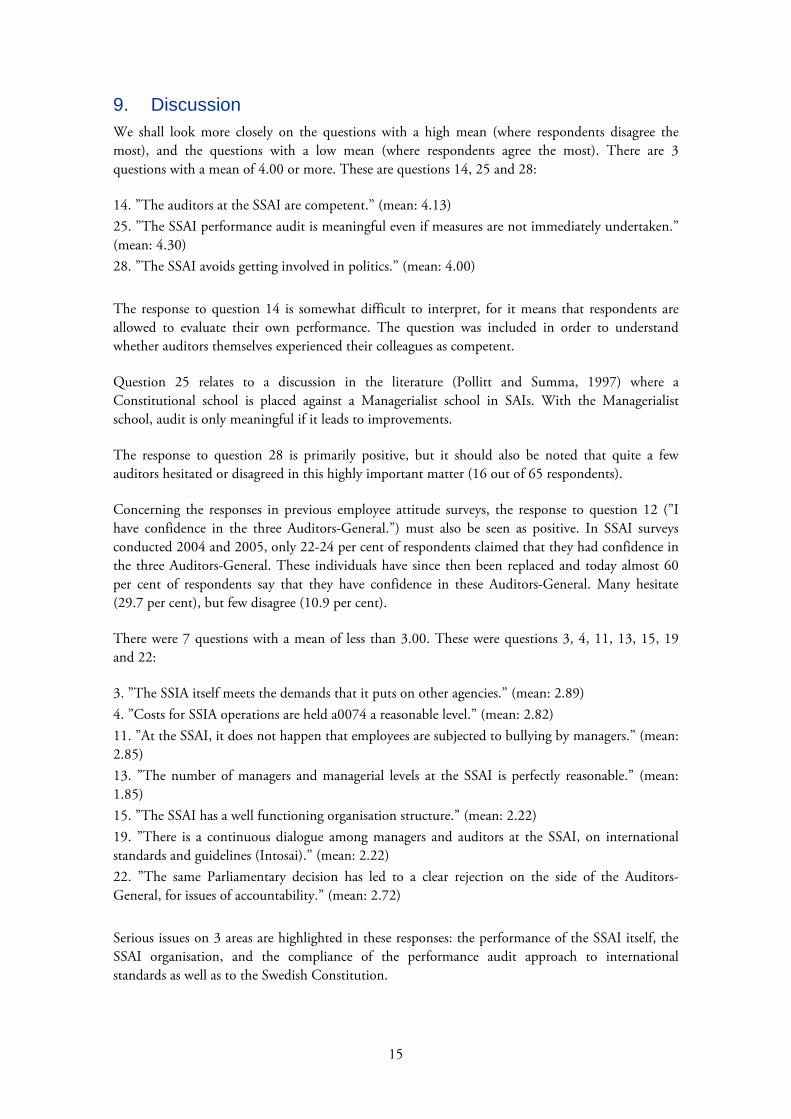
9. Discussion We shall look more closely on the questions with a high mean (where respondents disagree the most), and the questions with a low mean (where respondents agree the most). There are 3 questions with a mean of 4.00 or more. These are questions 14, 25 and 28:
14. ”The auditors at the SSAI are competent.” (mean: 4.13) 25. ”The SSAI performance audit is meaningful even if measures are not immediately undertaken.” (mean: 4.30) 28. ”The SSAI avoids getting involved in politics.” (mean: 4.00) The response to question 14 is somewhat difficult to interpret, for it means that respondents are allowed to evaluate their own performance. The question was included in order to understand whether auditors themselves experienced their colleagues as competent.
Question 25 relates to a discussion in the literature (Pollitt and Summa, 1997) where a Constitutional school is placed against a Managerialist school in SAIs. With the Managerialist school, audit is only meaningful if it leads to improvements.
The response to question 28 is primarily positive, but it should also be noted that quite a few auditors hesitated or disagreed in this highly important matter (16 out of 65 respondents).
Concerning the responses in previous employee attitude surveys, the response to question 12 (”I have confidence in the three Auditors-General.”) must also be seen as positive. In SSAI surveys conducted 2004 and 2005, only 22-24 per cent of respondents claimed that they had confidence in the three Auditors-General. These individuals have since then been replaced and today almost 60 per cent of respondents say that they have confidence in these Auditors-General. Many hesitate (29.7 per cent), but few disagree (10.9 per cent).
There were 7 questions with a mean of less than 3.00. These were questions 3, 4, 11, 13, 15, 19 and 22:
3. ”The SSIA itself meets the demands that it puts on other agencies.” (mean: 2.89) 4. ”Costs for SSIA operations are held a0074 a reasonable level.” (mean: 2.82) 11. ”At the SSAI, it does not happen that employees are subjected to bullying by managers.” (mean: 2.85) 13. ”The number of managers and managerial levels at the SSAI is perfectly reasonable.” (mean: 1.85) 15. ”The SSAI has a well functioning organisation structure.” (mean: 2.22) 19. ”There is a continuous dialogue among managers and auditors at the SSAI, on international standards and guidelines (Intosai).” (mean: 2.22) 22. ”The same Parliamentary decision has led to a clear rejection on the side of the Auditors-General, for issues of accountability.” (mean: 2.72) Serious issues on 3 areas are highlighted in these responses: the performance of the SSAI itself, the SSAI organisation, and the compliance of the performance audit approach to international standards as well as to the Swedish Constitution.

16
Question 11 is somewhat difficult to interpret, since respondents may refer to the same incidence of bullying. However, the number of respondents that experience that bullying occurs – from the side of managers – at the SSAI, is still surprisingly high (48.0) and many hesitate (16.7 per cent). The question needs to be further explored in order to fully understand the extent of bullying.
Concerning the performance of the SSAI itself, 31.7 per cent of respondents argue that the SSAI fails to meet the demands that it puts on other agencies, and even more respondents hesitate to respond (44.4 per cent). Only 23.8 per cent believe that the SSAI meets these demands. Costs for SSAI operations are part of this aspect. Only 26.7 per cent of respondent believe that these costs are reasonable.
How well the organisation is designed reflects on SAI performance. The most critical position among respondents can be found in question 13. Only 4.8 per cent (3 out of 62 respondents) believe that the number of managers at the SSAI is perfectly reasonable. The numbers are similar with regard to how well the organisation structure functions - only 7.7 per cent (5 out of 65 respondents) believe that this functions well.
The third area where the results stand out in a negative light concerns the SSAI compliance with international standards as well as with the Swedish Constitution. It appears as though the SSAI does not have much dialogue whatsoever concerning the international standards issued by the Intosai. Only 9.3 per cent of respondents believe that there is a continuous dialogue at the SSAI in this area, whereas 63.0 disagree. Furthermore, despite a clear message from the Swedish Parliament, requesting the SSAI to reduce its focus on accountability, only 20.0 per cent of respondents believe that the Auditors-General have actually rejected this approach in internal operations.
In many questions, there were a surprising number of respondents that hesitated in their response.
10. Conclusions and future research Survey responses indicate that the Swedish SAI (SSAI) continues to have serious organisational issues to deal with and a widespread discontent in three important areas: the performance of the SSAI itself, the SSAI organisation structure and the performance audit approach. Problems in each of these areas pose a threat to the legitimacy of the SSAI operations and accordingly, also the functioning of an important democratic institution. It is a democratic problem when an agency such as the SAI does not function as expected.
On the positive side, confidence in the three Auditors-General has increased since the employee attitude surveys in 2004 and 2005. There are also three new Auditors-General in position today.
From a democratic perspective, it is encouraging to see how performance auditors at the SSAI appear to direct their loyalties primarily to the mission of the SSAI, as they used this survey to point out important areas of improvement at the agency.
I have recently been awarded a generous grant from The Ragnar Söderberg Foundation. Thanks to this grant, my research on the SAI in Sweden and other countries can be continued. Some of this research will draw upon the survey data presented in this report. It is my hope that the report may also be of use to the Swedish SAI as it continues to develop its organisation and operations.

17
References Bringselius, L. (2008) Personnel resistance in public professional service mergers: The merging of
two national audit organisations. Lund: Lund Institute of Economic Research. Pollitt, C. and H. Summa (1997) Comparitive and International Administration Reflexive
Watchdogs? How Supreme Audit Institutions Account for Themselves. Public Administration, Vol. 75, No. 2, pp. 313-336.
Power, M. (1997) The Audit Society: Rituals of verification. Oxford: Oxford University Press. Goolsarran, S. (2007) The evolving role of supreme audit institutions. Journal of Government
Financial Management, Vol. 56, No. 3, pp. 28-32. Lapsley, I. and C. Pong (2000) Modernization versus Problematization: Value-for-Money Audit in
Public Services. European Accounting Review, Vol. 9, No. 4, pp. 541–67. Talbot, C. and J. Wiggan (2010) The public value of the National Audit Office. International
Journal of Public Sector Management, Vol. 23, No. 1, pp. 54-70. ISSAI 1 (1997) The lima declaration. [The International Standards of Supreme Audit Institutions is
part of INTOSAI.] INTOSAI (2001) Code of ethics and auditing standards. The Auditing Standards Committee at
the XVIth Congress of INTOSAI in 1998 in Montevideo, Uruguay. The Swedish Act on Auditing of State Activities (SFS 2002:1022). Pollitt, C. and H. Summa (1997) Comparitive and International Administration Reflexive
Watchdogs? How Supreme Audit Institutions Account for Themselves. Public Administration, Vol. 75, No. 2, pp. 313-336.
Pollitt, C., Xavier, C., Lonsdale, J., Mul, R. and Waerness, M. (Eds) (1999) Performance Audit and Public Management in Five Countries. Oxford: Oxford University Press.
Report from the Riksdag Administration 2008/09:URF1, Uppföljning av Riksrevisionsreformen: Riksrevisionens styrelse, ledning och hanteringen av effektivitetsgranskningar.
Report from the Riksdag Administration 2008/09:URF3 Uppföljning av Riksrevisionsreformen II: Effektivitetsrevisionen, den årliga revisionen och den internationella verksamheten.

1
Enkät till effektivitetsrevisorer
på Riksrevisionen
Lund, 3 maj 2011
Bästa/bäste effektivitetsrevisor,
Hur upplever Du som effektivitetsrevisor (utredare) att Riksrevisionens organisation fungerar? Detta är en av de
frågeställningar som vi arbetar med i en ny forskningsstudie om Riksrevisionen. Avsikten är bl a att förstå hur
verksamheten har utvecklats sedan myndighetens bildande år 2003. Studien omfattar denna enkät samt
tiotalet intervjuer. Vi vore mycket tacksamma om Du ville besvara enkäten och returnera i bifogat svarskuvert,
helst innan den 1 juni 2011. Du kan vara helt anonym. Frågorna i sektion G (personlig bakgrund) är frivilliga.
Sektion A-E i enkäten är utformad som ett antal påståenden och med ett kryss anger Du i vilken utsträckning
Du instämmer i dessa, på en skala från 1 till 5. Anser Du att påståendet stämmer helt, kryssar Du i rutan under
nr 5. Anser Du att påståendet inte stämmer alls, kryssar Du i rutan under nr 1. Det finns också tre steg
däremellan. Vet Du inte, så kryssar Du i en särskild ruta i högermarginalen.
Enkäten riktas till samtliga idag tjänstgörande medarbetare vid effektivitetsrevisionen, dock ej till chefer eller
programansvariga (dessa återkommer vi eventuellt till senare).
Kontakta mig gärna vid frågor. Tack på förhand för Din medverkan!
Vänliga hälsningar,
Louise Bringselius, fil dr
Forskare vid Lunds universitet
Institutet för ekonomisk forskning
Adress: Box 7080, 220 07 Lund
E-post: [email protected]
Tel. 0708-33 00 30

2
Sektion A. Allmänt om Riksrevisionen
1. På Riksrevisionen kan jag öppet säga vad jag tycker. …………………………………….
2. Riksrevisionen har en lärande miljö, där både positiva och negativa synpunkter tas till vara. ………………………………………………………………………………..
3. Riksrevisionen lever själv upp till de krav som man ställer på granskade myndigheter . ……………………………………………………………………………..
4. Kostnaderna för Riksrevisionens verksamhet är helt rimliga. ……………………..
5. Riksrevisionen är en trygg organisation som bjuder in såväl granskade verksamheter som externa kritiker för en öppen diskussion. ……………………..
Sektion B. Riksrevisionens chefer och ledning
6. Samarbetet mellan de tre riksrevisorerna fungerar bra. ……………………………..
7. Riksrevisorerna behandlar utredare med respekt. …..……….………………………..
8. Övriga chefer och programansvariga behandlar utredare med respekt. …….
9. Riksrevisionen har en kompetent ledning (riksrevisorerna)…………………………
10. Riksrevisionen har kompetenta chefer (inkl. programansvariga)…………………
11. På Riksrevisionen förekommer det inte att chefer mobbar medarbetare. ….
12. Jag känner förtroende för riksrevisorerna. …………………………………………………
13. Antalet chefer och chefsnivåer på Riksrevisionen är helt rimligt. ……………….
Sektion C. Styrning inom effektivitetsrevisionen
14. Riksrevisionen har kompetenta utredare. …………………………………………………….
15. Riksrevisionen har en väl fungerande organisationsstruktur. …………………….
16. Relationen mellan chefer och medarbetare präglas av förtroende (snarare än av kontroll). ……………………………………………………………………………..
17. Kvalitetssäkringen fungerar som ett stöd (snarare än en kontrollfunktion).
18. Det finns en fungerande struktur för löpande dialog och lärande mellan medarbetare inom effektivitetsrevisionen. …………………………………………………
Sektion D. Inriktning för effektivitetsrevisionen
19. Bland chefer och utredare förs en organiserad och kontinuerlig diskussion kring internationella standarder och riktlinjer (INTOSAI). ……………………………
20. Innebörden av det senaste riksdagsbeslutet om effektivitetsrevisionens inriktning (juni 2010) har ingående diskuterats bland chefer och utredare. ..
1 2 3 4 5Stämmer
inte a l ls
Stämmer
helt
Vet ej
1 2 3 4 5 Vet ej
1 2 3 4 5 Vet ej
1 2 3 4 5 Vet ej
1 2 3 4 5 Vet ej

3
21. Samma riksdagsbeslut (se punkt nr 2 ovan) har medfört en starkare betoning av effektivitet i granskningarna, snarare än regelefterlevnad. ……………………
22. Samma riksdagsbeslut (se punkt nr 2 ovan) har medfört ett klart avstånds- tagande från fokus på ansvarsutkrävande från Riksrevisionens ledning. …….
23. Effektivitetsrevisionen är i praktiken (jämför ord och handling) inte längre inriktad mot ansvarsutkrävande. …………………………………………………………………
Sektion E. Riksrevisionens oberoende
24. Riksrevisionens rekrytering av chefer från regeringskansliet påverkar inte myndighetens oberoende. ……………………………………………………………………
25. Effektivitetsrevisionen är meningsfull även om åtgärder inte omedelbart vidtas. ……………………………………….….……………………………………………………………..
26. Slutsatser i granskningar anpassas aldrig för att upplevas som mer intressanta för media och andra externa aktörer. ……………………………………….
27. Beslut om granskningar fattas helt utan yttre påverkan. …………………………….
28. Riksrevisionen undviker att bedriva politik. ………………………………………………..
Sektion F. Övriga frågor
29. Vilken av följande fyra yrkesroller upplever du att utredaren på Riksrevisionen mest kan liknas vid idag? Motivera gärna.
Domare
Forskare
Grävande journalist
Ledningskonsult
Ev. motivering: _________________________________________________
______________________________________________________________
30. Vilken av samma fyra yrkesroller anser du att utredaren på Riksrevisionen mest bör likna? Motivera gärna.
Domare
Forskare
Grävande journalist
Ledningskonsult
Ev. motivering: _________________________________________________
______________________________________________________________
31. Vilket av följande fem mått upplever du prioriteras när Riksrevisionens egen prestation utvärderas?
Antal rapporter per år.
Genomslag i granskad verksamhet.
Uppmärksamhet i media.
Rapporternas kvalitet.
Kostnad per rapport.
Vet ej
1 2 3 4 5 Vet ej
1 2 3 4 5 Vet ej
Vet ej

4
Ev. motivering: _________________________________________________
______________________________________________________________
32. Vilket av samma fem mått anser du att bör prioriteras när Riksrevisionens egen prestation utvärderas?
Antal rapporter per år.
Genomslag i granskad verksamhet.
Uppmärksamhet i media.
Rapporternas kvalitet.
Kostnad per rapport.
Ev. motivering: _________________________________________________
______________________________________________________________
33. Finns det någon intressant aspekt av verksamheten på Riksrevisionen som inte uppmärksammas i denna enkät eller vill du förklara vad du menar med ditt svar på någon specifik fråga ovan? Använd då gärna detta utrymme.
_____________________________________________________________________________
_____________________________________________________________________________
_____________________________________________________________________________
_____________________________________________________________________________
_____________________________________________________________________________
_____________________________________________________________________________
_____________________________________________________________________________
_____________________________________________________________________________
_____________________________________________________________________________
_____________________________________________________________________________
_____________________________________________________________________________
_____________________________________________________________________________
_____________________________________________________________________________
Sektion G. Personlig bakgrund
34. Jag har arbetat på Riksrevisionen (inkl. RRV och Riksdagens revisorer) följande antal år. …………………
35. Min ålder: .…………………………………………………………………
Varmt tack för Din medverkan!
0-5 6-10 11-15 16<
>30 31-40 41-50 51<