performance audit span of control - kansas city, missouri
TRANSCRIPT
5-2002
Performance Audit
Span of Control
April 2002
City Auditor’s Office
City of Kansas City, Missouri

April 24, 2002 Honorable Mayor and Members of the City Council: We conducted this performance audit to assess the organizational structures of city departments excluding police and fire. Span of control – the number of employees reporting to a supervisor – and management layers – the number of levels in an organization excluding line workers – are components that describe organizational structure. Organizational structure is important because it affects communication, decision-making, flexibility, employee morale, and resource allocation. Organizational structures tend to evolve over time. Periodically reviewing an organization’s structure and planning for changes provides an opportunity to improve effectiveness. The management trend since the 1990’s has been to widen span of control and decrease the number of management layers. Flattening organizations in this way is thought to provide advantages such as improved communication, faster decision-making, and cost savings. The city is currently making efforts to streamline operations through the KC-GO process. The city is also facing lower than expected revenues, which have resulted in hiring freezes and budget cuts. This span of control audit should provide a tool for the City Manager to use in streamlining operations and addressing the budget imbalance. However, changing organizational structure also carries risk. While management literature provides no single benchmark for an optimal span of control, the city’s span is narrower with more management layers than other government organizations that have completed similar studies. Average span of control in city departments ranges from 3.2 to 12.8 direct reports per supervisor. The city’s median span of control across departments is 4.6 direct reports per supervisor. The city has up to nine management layers between the City Manager and line workers. Span of control for individual supervisors ranges from 0 – where the subordinate employee position is vacant – to 30 direct reports. The “right” span of control in a given situation depends on a number of factors, however spans that are too high or too low can cause problems. We recommend that the City Manager direct department heads to review and justify cases where a supervisor has two or fewer direct reports, or has more than 12 direct reports. In addition, we recommend that the City Manager direct department heads to review vacant supervisory positions before filling them to determine whether the positions can be replaced with line positions. Also, the City Manager should direct the position review committee to consider span of control when approving positions.

During the course of this audit we found several instances of noncompliance with the city’s policies and with the Memorandum of Understanding between the city and Local 500 regarding the assignment of supervisory duties to non-supervisory employees. We recommend that the City Manager direct city departments to bring the assignment of supervisory duties into compliance with city policies. We sent a draft of this audit to the City Manager on March 28, 2002. His written response is appended. We appreciate the courtesy and cooperation extended to us by city staff during this project. The audit team for this project was Anatoli Douditski, Sue Polys, and Amanda Noble. Mark Funkhouser City Auditor
_____________________________________________________________________________________ Span of Control _____________________________________________________________________________________ Table of Contents Introduction 1
Objectives 1 Scope and Methodology 1 Background 3
Definition of Span of Control 3 Organizational Structure Influences Organizational Effectiveness 3
Findings and Recommendations 7
Summary 7 City’s Span of Control Narrow Compared to Other Governments 7
Span of Control in City Is Fairly Narrow 8 Other Government Agencies Have Reported Wider Spans of Control and Fewer Layers Than Kansas City 9 Span of Control for City Supervisors Ranges from 0 to 30 12 Span of Control and Management Layers Shape Organization 14
In Several Instances City Departments Not Compliant with City Policies 16 Recommendations 16
Appendices 17
Appendix A. Bibliography 17 Appendix B: City Manager’s Response 21
_____________________________________________________________________________________ List of Exhibits Exhibit 1. Span of Control Statistics for City Departments, October 2001 9 Exhibit 2. Span of Control, Management Layers 12 Exhibit 3. Frequency Distribution of Direct Reports Per Supervisor, October 2001 13 Exhibit 4. Factors Influencing Span of Control 14

1
_____________________________________________________________________________________ Introduction _____________________________________________________________________________________ Objectives
We conducted this audit to assess the city’s span of control under the authority of Article II, Section 13 of the Charter of Kansas City, Missouri, which establishes the Office of the City Auditor and outlines the City Auditor’s primary duties. A performance audit is an objective, systematic examination of evidence to independently assess the performance of a government organization, program, activity, or function in order to provide information to improve public accountability and facilitate decision-making.1 This audit was designed to answer the following questions:
• What is the span of control in the city and in departments?
• Are there areas where span of control appears to be too high or too low?
Span of control refers to “how many people a manager or supervisor can control while maintaining productivity and discipline.”2 More simply, it is the number of employees reporting to a supervisor. This audit of span of control should provide a tool for the City Manager to use in assessing budget concerns and supplement the KC-GO efforts to streamline operations.
_____________________________________________________________________________________ Scope and Methodology
The scope of our audit includes all city departments except the Police and Fire departments, which use hierarchical, military-like structures. Our audit findings also exclude the City Clerk’s Office, which declined to participate, and several divisions of the Parks and Recreation Department. We were unable to obtain and reconcile some data for the Parks and Recreation Department’s recreation, community centers, and golf and tennis divisions. We excluded the zoo because zoo employees are no longer city employees.
1 Comptroller General of the United States, Government Auditing Standards (Washington, DC: U.S. Government Printing Office, 1994), p. 14. 2 Anonymous, “Span of Control vs. Span of Support,” The Journal for Quality and Participation, Volume 23, Issue 4, Fall 2000, p. 15.

Performance Audit: Span of Control
2
We collected data to prepare detailed span of control charts for all other city departments showing supervisor/subordinate employee relationships as of the pay period ending October 19, 2001. We conducted this audit in accordance with generally accepted government auditing standards. Our audit methods included: • Reviewing management literature and audits from other
jurisdictions regarding organizational design, factors affecting span of control, current trends, and the advantages and consequences of flattening organizations.
• Interviewing city staff to learn how changes are made to the
workforce. • Compiling span of control data from city departments. • Preparing detailed organizational charts. We asked each department to prepare a spreadsheet listing supervisors and their subordinate employees for each division in their department as of October 19, 2001. We defined supervisor as the primary person to prepare and sign a subordinate employee’s performance evaluation. We chose this definition because the person doing the employee’s evaluation is also most likely responsible for hiring, assigning and directing work, and disciplining the employee. We asked departments to identify vacant, temporary, seasonal, part-time, and contract positions on their spreadsheets. We reviewed the information departments provided for completeness by comparing their lists to:
• payroll records; • the Human Resource Management Academy database of
employees completing supervisory training; • the Human Resources Department’s database of personal
services contracts; and • personnel history tables on the city’s mainframe.
We followed up with departments in cases where we found discrepancies between the department data and other sources. In a few cases, we

Introduction
3
checked personnel files to see who signed an employee’s last annual review as the primary rater. No information was omitted from this report because it was deemed privileged or confidential. We decided not to include the departmental organizational charts in the report due to volume. We provided copies of all the charts to the City Manager and Director of Human Resources, and the charts for each department to the department head, for their use in considering our recommendations.3
_____________________________________________________________________________________ Background
Definition of Span of Control Span of control refers to the number of employees reporting to a supervisor. Management layers refer to the number of levels in an organization excluding the bottom layer of non-supervisory line workers. Organizational Structure Influences Organizational Effectiveness Span of control and management layers are components of organizational structure. It is important to study and plan organizational structure and the span of control because they affect communication, decision making, flexibility, employee morale, and resource allocation. Other cities, such as Portland and Seattle, have examined spans of control in their organizations in order to redesign their organizational structures. In Kansas City government, changes are generally made incrementally. New positions are normally created through the annual budget process as decision packages or on a case-by-case basis during the year. A position review committee reviews requests for new positions, but no one in the organization monitors span of control or the number of management layers on an ongoing basis. While not uncommon, incremental changes without an overall strategy can be detrimental to the organization’s overall performance. Lack of planning and flexibility often result in abrupt organizational changes, which negatively affect employee morale and the organization’s ability to respond to changing economic and societal conditions.
3 Copies of the charts are available for review on our website (www.kcmo.org/auditor) or at our office.

Performance Audit: Span of Control
4
The city is currently undertaking initiatives to streamline internal processes. Kansas City Government Optimization (KC-GO)4 has made recommendations related to supervision. In the Water Services Department, Human Resources Department and the Finance Department’s Division of Purchases and Supplies, KC-GO has suggested staffing reorganizations, increased use of automation, moving office staff into the field, and making more use of self-managed teams. The information related to span of control in city departments should help in implementing KC-GO recommendations and selecting other areas for review.
4 Kansas City Government Optimization (KC-GO) is a citywide initiative to provide better services using competitive business practices.
Introduction
5
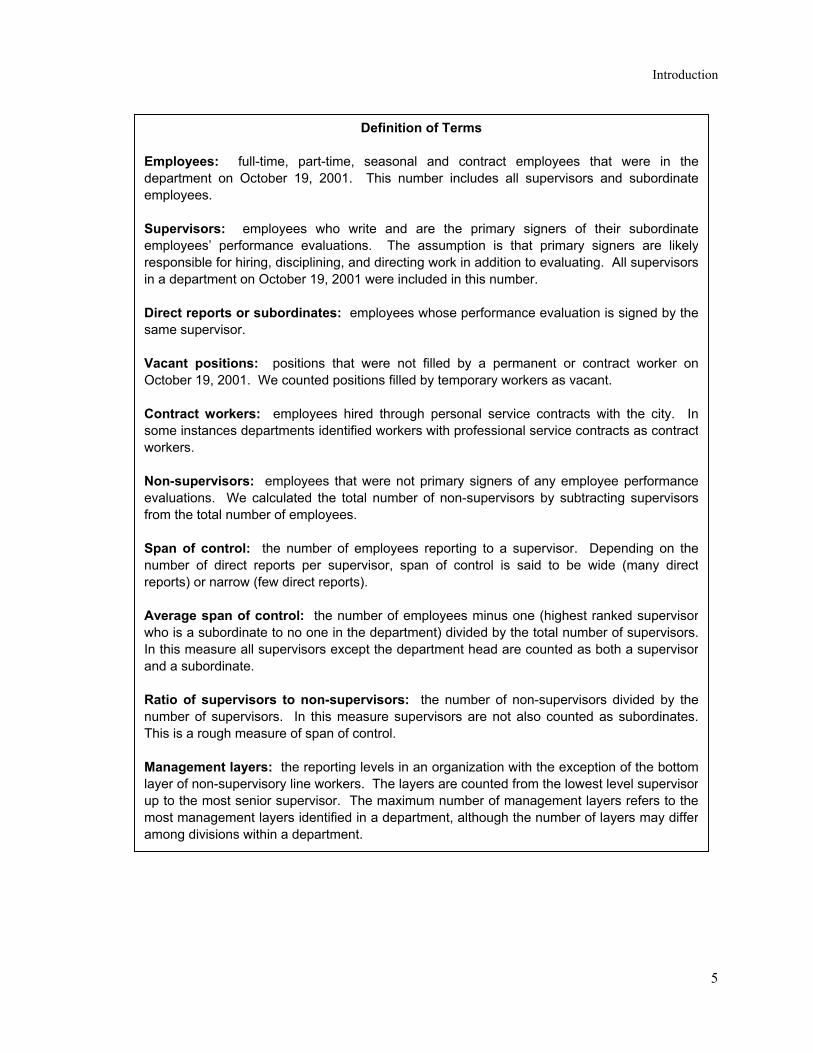
Definition of Terms Employees: full-time, part-time, seasonal and contract employees that were in thedepartment on October 19, 2001. This number includes all supervisors and subordinateemployees. Supervisors: employees who write and are the primary signers of their subordinateemployees’ performance evaluations. The assumption is that primary signers are likelyresponsible for hiring, disciplining, and directing work in addition to evaluating. All supervisorsin a department on October 19, 2001 were included in this number. Direct reports or subordinates: employees whose performance evaluation is signed by thesame supervisor. Vacant positions: positions that were not filled by a permanent or contract worker onOctober 19, 2001. We counted positions filled by temporary workers as vacant. Contract workers: employees hired through personal service contracts with the city. Insome instances departments identified workers with professional service contracts as contractworkers. Non-supervisors: employees that were not primary signers of any employee performanceevaluations. We calculated the total number of non-supervisors by subtracting supervisorsfrom the total number of employees. Span of control: the number of employees reporting to a supervisor. Depending on thenumber of direct reports per supervisor, span of control is said to be wide (many directreports) or narrow (few direct reports). Average span of control: the number of employees minus one (highest ranked supervisorwho is a subordinate to no one in the department) divided by the total number of supervisors.In this measure all supervisors except the department head are counted as both a supervisorand a subordinate. Ratio of supervisors to non-supervisors: the number of non-supervisors divided by thenumber of supervisors. In this measure supervisors are not also counted as subordinates.This is a rough measure of span of control. Management layers: the reporting levels in an organization with the exception of the bottomlayer of non-supervisory line workers. The layers are counted from the lowest level supervisorup to the most senior supervisor. The maximum number of management layers refers to themost management layers identified in a department, although the number of layers may differamong divisions within a department.

Performance Audit: Span of Control
6

7
_____________________________________________________________________________________ Findings and Recommendations _____________________________________________________________________________________ Summary
Compared to other government agencies that have studied span of control, Kansas City has fewer direct reports per supervisor and more management layers. Span of control for individual supervisors in the city varies widely. While management literature does not identify a single benchmark for an optimal span of control, organizations with narrow spans and many management layers can suffer from communication and morale problems and slow decision-making. Spans that are too wide also create problems such as inconsistent performance and inadequate supervision. We recommend that the City Manager direct department heads to review and justify cases where a supervisor has two or fewer direct reports, or has more than 12 direct reports. In addition, the City Manager should direct department heads to review vacant supervisory positions before filling them to determine whether the positions can be replaced with line positions. Also, the City Manager should direct the position review committee to consider span of control when approving new positions. During the course of this audit, we found several instances of noncompliance with city job descriptions and with the Memorandum of Understanding between the city and Local 500 regarding the assignment of supervisory duties to non-supervisory employees. We recommend that the City Manager direct city departments to bring the assignment of supervisory duties into compliance with city policies.
_____________________________________________________________________________________ City’s Span of Control Narrow Compared to Other Governments
Average span of control in city departments ranges from 3.2 to 12.8 direct reports per supervisor. The city’s median span of control across departments is 4.6 direct reports per supervisor. The city has up to nine management layers between the City Manager and line workers. While management literature provides no single benchmark for an optimal span of control, the city’s span is narrower than other government organizations that have completed similar studies. The trend in organizations since the 1990’s has been to widen organizational span of control and decrease management layers. Flattening organizations

Performance Audit: Span of Control
8
in this way may provide advantages such as cost savings, improved communication, and faster decision-making. However changing the organizational structure also carries risk. Span of control for individual supervisors ranges from 0 – where the subordinate employee position is vacant – to 30 direct reports per supervisor. About 77 percent of supervisors have 6 or fewer direct reports; about 30 percent of supervisors have 2 or fewer direct reports. Different factors including the nature of work, risk entailed, other responsibilities, and geographic dispersion should be considered when establishing a supervisor’s span of control. Span of Control in City Is Fairly Narrow Average span of control in city departments ranges from 3.2 to 12.8 direct reports per supervisor with a median across departments of 4.6. The maximum number of management layers in a department is 8 – this means there are 8 layers between the front line workers and the department head and 9 layers between the front line worker and the City Manager. The median number of management layers in a department is four. Other organizations provide data that suggest span of control in the city is narrow and the organization may have too many layers in some areas. Departments’ average span of control ranges from 3.2 to 12.8. The City Auditor’s Office, the smallest department with 20 employees, also has the narrowest span of control (3.2) among city departments. The Law Department has the widest span of control (12.8). Twenty-seven of Law’s 78 employees are part-time employees working in the City Prosecutor’s Office. Water Services, the largest department with 933 employees, has a span of control of 4.4. The median span of control across departments is 4.6 direct reports per supervisor. (See Exhibit 1.) The city’s median ratio of supervisors to non-supervisors, which is a rougher measure of span of control, is 3.6 non-supervisors for every supervisor. This number is lower than span of control. Departments’ ratio of non-supervisors to supervisors ranges from 2.3 to 12.0. (See Exhibit 1.) Management layers within departments range from 1 to 8. The Human Relations Department, with a total of 30 employees and the City Auditor’s Office, with 20 employees, both have at most 2 layers of management. The Water Services Department, with 933 employees, has a maximum of 8 layers. In some areas of the departments, the number of management layers may be less. A department has a minimum of one layer of management if the department director has a professional staff

Findings and Recommendations
9
person as a direct report and that staff member does not have any direct reports. (See Exhibit 1.)
Exhibit 1. Span of Control Statistics for City Departments, October 2001
Department Empl
oyee
s
Supe
rvis
ors
Vaca
ncie
s
Con
tract
Em
ploy
ees
Non
- s
uper
viso
rs
Aver
age
Span
of C
ontro
l
Rat
io o
f Non
- s
uper
viso
rs to
S
uper
viso
rs
Ran
ge o
f the
# o
f
Man
agem
ent
La
yers
Aviation 437 69 74 1 368 6.3 5.3 2 - 5 City Auditor's Office 20 6 1 2 14 3.2 2.3 2 City Manager's Office 84 18 5 10 66 4.6 3.7 2 - 4 City Planning and Development 84 22 16 23 62 3.8 2.8 2 - 3 Codes Administration 101 23 4 1 78 4.3 3.4 3 - 4 Convention & Entertainment Centers 224 45 37 42 179 5.0 4.0 2 - 5 Finance 162 47 16 0 115 3.4 2.4 2 - 5 Health 199 52 17 13 147 3.8 2.8 2 - 5 Housing & Community Development 40 10 9 8 30 3.9 3.0 1 - 3 Human Relations 30 6 1 1 24 4.8 4.0 1 - 2 Human Resources 39 11 2 1 28 3.5 2.5 1 - 5 Information Technology 90 23 4 15 67 3.9 2.9 2 - 4 Law 78 6 2 26 72 12.8 12.0 1 - 3 Municipal Court 70 9 6 3 61 7.7 6.8 1 - 2 Neighborhood & Community Services 275 56 37 30 219 4.9 3.9 2 - 5 Office of Environmental Management 107 16 0 3 91 6.6 5.7 1 - 3 Parks and Recreation5 315 48 50 12 267 6.5 5.6 1 - 6 Public Works 580 127 116 23 453 4.6 3.6 1 - 6 Water Services 933 210 93 21 723 4.4 3.4 2 - 8 Total 3,868 804 490 235 3,064 Median 4.6 3.6 2 - 4 Sources: City department lists of employees.
There is no single benchmark for “optimal” span of control or number of management layers. Literature indicates that there is no ideal span of control or number of management layers. The appropriate span of control and number of management layers for an organization depend on several factors including mission, complexity of work, and organization size. A single span of control or a set number of management layers cannot usefully be set across all departments. Other Government Agencies Have Reported Wider Spans of Control and Fewer Layers Than Kansas City While there is no single benchmark for what span of control should be, other public organizations that have conducted span of control studies
5 Parks and Recreation data do not include recreation, community centers, golf and tennis divisions, or the zoo.

Performance Audit: Span of Control
10
reported wider spans of control and fewer management layers than Kansas City. These organizations also set goals to widen spans of control and reduce the number of management layers. Portland, Oregon, reported an average span of control of 6.5 in selected functional groups and a maximum of 7 management layers, including their top layer of management (mayor and city commissioners).6 The average span of control (6.5) of their sample groups is calculated using full-time equivalents (FTE’s). Full-time temporary workers were counted as FTE’s. Part-time and seasonal FTE’s were sometimes counted. Our median span of control in departments (4.6) is based instead on total headcount of employees.
Because Portland’s 1994 study showed that surveyed organizations had fewer layers of management and wider spans of control in its middle management, the report recommended Portland’s Office of Finance and Administration establish span of control guidelines that recognize situational differences (department size, task complexity, strategic importance) and review organizational structure as part of the budget process. The report provided a preliminary proposal for the guidelines:
• Departments with fewer than 50 employees should have three or fewer management layers;
• Departments with 50 to 150 employees should not have more
than four layers of management; • Departments with over 150 employees should not have more
than 5 management layers;
• The ratio of middle managers to non-supervisors should be 1:5; and
• The ratio of first line supervisors to non-supervisors in
Operations and Maintenance should not be lower than 1:10 or higher than 1:20, and in Administration the ratio should be between 1:6 and 1:12.
Public safety departments had different suggested guidelines. King County, Washington, reported an average span of control of 5.6 and an average of 5 management layers in their Executive and Judicial
6 City of Portland Span of Control Study, prepared for the City of Portland Audit Services Division by Public Knowledge, Inc. and The Kemp Consulting Group, 1994.

Findings and Recommendations
11
Branches.7 Their calculations included lead workers as supervisors and therefore the 5.6 average span of control would be even wider if lead workers were excluded. The 1994 King County report recommended the County Council consider adopting span of control targets. The report also recommended that the council require conversion of all management positions with fewer than three subordinates to non-management positions if there is no justification for these positions to remain supervisory. Seattle, Washington’s study of ninety percent of their staff reported an average span of control of 5.9 and a maximum of 8 management layers.8 Their 1996 study recommended a review of all management positions to identify functions that would benefit from increasing the span of control ratio. Like our calculations for generating average span of control, Seattle used headcount and did not include lead workers as supervisors. In a 1997 follow-up, which included 9,763 employees, the Seattle city auditor found Seattle’s overall average ratio of staff to managers rose from 5.9 to 6.1 with an estimated payroll savings of $3.1 million.9 The state governments of California, Texas, and Iowa have passed or considered legislation or other measures to increase span of control.10 In 1994, the California legislature requested a reduction in supervisors, however, by June of 1995 the number had increased by 1,421. In 1996, California’s reported average span of control was 6. Texas’ span of control was 1:9 in 1997. At that time the State Comptroller recommended legislation to establish a 1:11 average span of control. In 1992, Iowa legislation called for a reduction in layers of management and an increase of a span of control to 1:14. Management layers decreased between 1991 and 1994 from 3.5 to 2.7. The state’s span of control increased from 1:7 to 1:10 between 1991 and 1996. The Clinton administration’s National Performance Review (NPR) goal was to increase the federal 1993 span of control of 1:7 to 1:15 by 1999. Congress proposed eliminating 272,900 management positions, anticipating a saving of $40 billion over five years. In 1996, the General Accounting Office reviewed NPR’s progress and found that some agencies had decreased management layers. Some agencies renamed
7 Span of Control, Office of the County Auditor, King County, Washington, 1994, downloaded from www.metrokc.gov/auditor/1994/span.htm. 8 Ratio of Staff to Managers in City Government, Office of the City Auditor, Seattle, Washington, 1996. 9 Improvements! City Responds Positively To Recommendations Made In Our 1996 Report: Ratio of Staff to Managers in City Government, Office of the City Auditor, Seattle, Washington, October 1997. 10 California Research Bureau, Flattening Organizations: Practices and Standards by Alicia Bugarin (1997).

Performance Audit: Span of Control
12
positions rather than eliminate them and some agencies did not cooperate saying the reduction was not appropriate for their agency.
Exhibit 2. Span of Control and Management Layers11
Organization
Span of Control
Management Layers
Kansas City, MO (2001) 4.6 (median) 9 maximum Portland, OR (1994) 6.5 7 maximum Seattle, WA (1996) 5.9 8 maximum King County, WA (1994) 5.6 5 (average) California State Government (1996) 6.0 Iowa State Government (1996) 10.0 Texas State Government (1997) 9.0 Federal Government (1993) 7.0
Sources: City of Portland, Span of Control Study; City of Seattle, Ratio of Staff to Managers in City Government Audit; King County, Washington, Span of Control; California Research Bureau, Flattening Organizations: Practices and Standards.
Span of Control for City Supervisors Ranges from 0 to 30 The number of direct reports per supervisor in the city ranges from 0 to 30. In some cases, supervisors had no direct reports because the subordinate employee position was vacant. The City Prosecutor and Municipal Court Administrator, each with 30 direct reports, have the highest span of control. The City Manager has 25 direct reports. The City Attorney has 18 direct reports. Other positions with relatively wide spans of control include aviation custodial supervisors and bus operator supervisors. Seventy-seven percent of supervisors have six or fewer subordinate employees. Seventeen percent have 1 or no subordinates, and 5 percent have more than 12 subordinates. (See Exhibit 3.)
11 Kansas City used headcount, and did not count lead workers as supervisors; Portland used FTE’s instead of headcount; Seattle used headcount and did not include lead workers as supervisors; King County, Washington counts lead workers as supervisors.

Findings and Recommendations
13
Exhibit 3. Frequency Distribution of Direct Reports Per Supervisor, October 2001
Sources: City department lists of employees. Different factors influence span of control. Management literature identifies various factors that cause span of control to differ among supervisors and in different organizations. For example, narrower spans of control are appropriate when the nature of work performed is complex, when organizational objectives are unclear, when tasks are uncertain, or risks are high. (See Exhibit 4.) Other factors may also affect spans of control, such as creating supervisory positions to attract or retain workers; and promoting workers as a way to increase compensation.
0.0%
2.0%
4.0%
6.0%
8.0%
10.0%
12.0%
14.0%
16.0%
18.0%
0 1 2 3 4 5 6 7 8 9 10 11 12 13 14 15 16 17 18 19 20 21 22 23 24 25 26 27 28 29 30
Number of Direct Reports per Supervisor
Perc
ent o
f Sup
ervi
sors

Performance Audit: Span of Control
14
Exhibit 4. Factors Influencing Span of Control
Factor
Narrower Span of Control
Wider Span of Control
Nature of work Complex Not complex Similarity of activities performed Different Similar Clarity of organizational objectives Not clear Clear Degree of task certainty Fuzzy Definite rules Degree of risk in the work for the organization High Low Degree of public scrutiny High Low Supervisor’s qualifications and experience Weak Strong Burden of non-supervisory duties Heavy Light Degree of coordination required High Low Availability of staff assistance None Abundant Qualifications and experience of subordinates Weak Strong Geographic location of subordinates Dispersed Together Source: City of Portland Span of Control Study, prepared for the City of Portland Audit Services Division by
Public Knowledge, Inc. and The Kemp Consulting Group, June 15, 1994, p. II-3. Departments can use span of control charts to evaluate their structure. Based on the information provided by the departments, we prepared organizational charts showing supervisor/subordinate employee relationships within the city. Management can use the charts to identify areas where supervisory positions have been created to address compensation issues, areas where self-directed teams could accomplish departments’ goals, and areas where information technology would assist front line workers in service delivery. The City Manager should direct department heads to review and justify cases where a supervisor has two or fewer direct reports or more than 12 direct reports. In addition, he should direct department heads to review vacant supervisory positions before filling them to determine whether the positions can be replaced with line positions. Also, the City Manager should direct the position review committee to consider span of control when approving new positions. Span of Control and Management Layers Shape Organization Span of control and management layers describe organizational structure. The different organizational configurations include narrow and wide spans of control with few or many layers. A tall, narrow configuration means there are many layers of reporting and few subordinates on each level. This structure is thought to create slower decisions and sometimes hamper an organization’s ability to compete. Narrow spans of control may be most appropriate in highly technical or specialized areas that require close supervision.

Findings and Recommendations
15
A wider, flatter configuration means fewer layers of reporting and more subordinates reporting to a supervisor. Wider and flatter organizations tend to have faster decision-making, and improved communication, motivation and morale. Spans of control that are too wide can also create problems such as inconsistent performance and inadequate supervision. The number of layers in an organization varies, although larger organizations tend to have more layers than smaller organizations. Organizations with many layers are associated with centralized decision-making. Flatter organizations tend to have decentralized decision-making, as authority for making decisions is given to the front line employees. The trend is to widen span of control. In the last decade, the introduction of information technology spurred the trend toward wider spans of control. Wider span of control is often achieved by restructuring and eliminating middle management. Sometimes restructuring can be achieved by reclassifying managerial positions as non-supervisory instead of eliminating those positions. Flattening the organizational structure creates advantages and risks. Reducing management layers and widening span of control provides opportunities for an organization to improve, but not without risks. Communication and decision-making are thought to improve as information passes through fewer layers with increased speed and accuracy. Accountability is clarified as decision-making becomes less diffused. Literature also notes improved employee morale and motivation. As an organization flattens and widens, improved compensation may also result for remaining employees. Personnel cost reductions can be realized if middle management positions are eliminated. Flattening organizations by reducing layers and widening span of control is not without risks. The elimination of layers often happens abruptly, which creates insecurity among remaining personnel. The insecurity as well as insufficient supervision may result in poor morale and performance errors. Widening span of control and de-layering can be hard on remaining managers due to the increased workload. De-layering may also result in a loss of talented and experienced managers. If the span is too wide, communication becomes difficult. Social networks break down. There is also a tendency for flat organizations to re-inflate.

Performance Audit: Span of Control
16
_____________________________________________________________________________________ In Several Instances City Departments Not Compliant with City Policies
We found several instances where city departments were not compliant with city policies and the Memorandum of Understanding (MOU) with Local 500 regarding the assignment of supervisory duties to city employees. We reported these cases to the Human Resources Director. Some employees’ duties are inconsistent with their job description. We identified an employee performing duties of a supervisor whose position description precludes supervisory duties. We also identified several employees in a division who were classified as supervisors but not performing supervisory duties. Employees performing work other than the duties described in their position description can be the source of disputes over appropriate levels of compensation. It can also complicate the imposition of discipline, as well as recognition for performing a job in an exemplary manner, when the “supervisor” is not in a supervisory classification. Labor union employees perform supervisory duties. We found at least three instances where labor employees covered by the MOU with Local 500 performed supervisory duties such as preparing and signing performance evaluations. The MOU and the Code of Ordinances explicitly exclude Local 500 members from performing any supervisory duties. We recommend that the City Manager direct city departments to bring the assignment of supervisory duties to employees into compliance with the applicable city policies.
_____________________________________________________________________________________ Recommendations
1. The City Manager should direct department heads to review and
justify instances where a supervisor has two or fewer direct reports or more than 12 direct reports.
2. The City Manager should direct department heads to review vacant supervisory positions before filling them to determine whether the position can be replaced with a line position.
3. The City Manager should direct the position review committee to consider span of control when approving new positions.
4. The City Manager should direct department heads to bring the assignment of supervisory duties to employees into compliance with applicable city policies.

17
_____________________________________________________________________________________ Appendix A _____________________________________________________________________________________ Bibliography

Performance Audit: Span of Control
18
Appendices
19
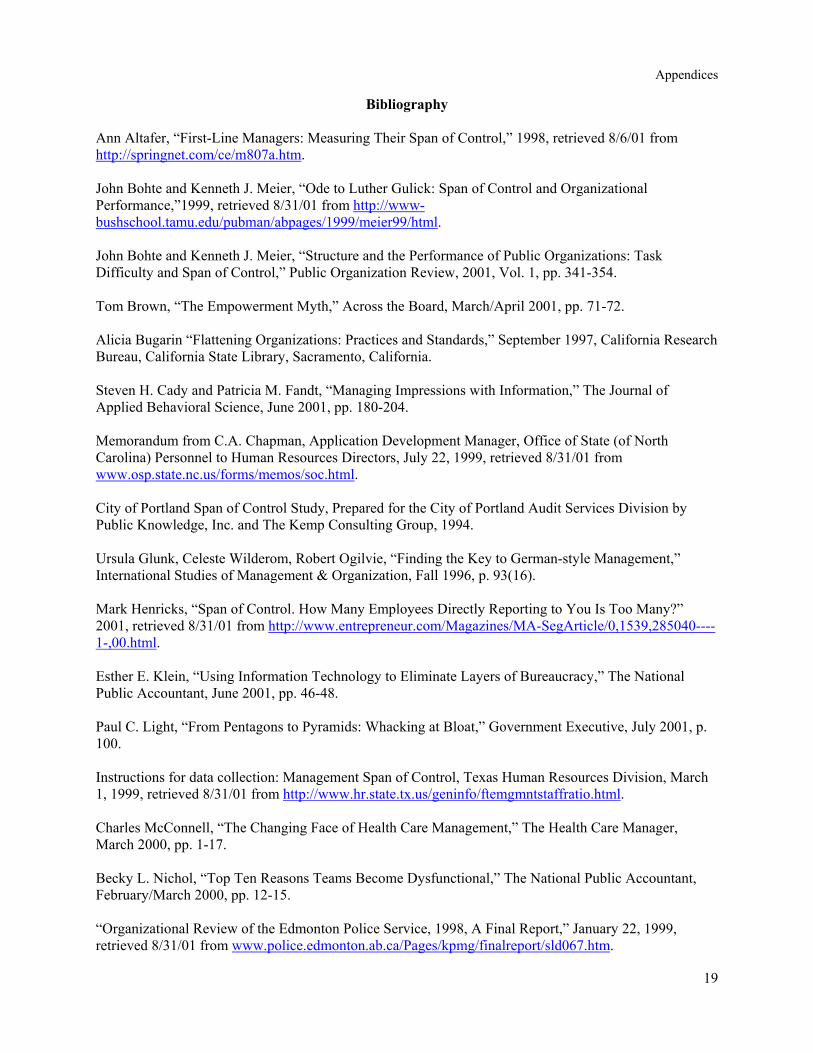
Bibliography Ann Altafer, “First-Line Managers: Measuring Their Span of Control,” 1998, retrieved 8/6/01 from http://springnet.com/ce/m807a.htm. John Bohte and Kenneth J. Meier, “Ode to Luther Gulick: Span of Control and Organizational Performance,”1999, retrieved 8/31/01 from http://www-bushschool.tamu.edu/pubman/abpages/1999/meier99/html. John Bohte and Kenneth J. Meier, “Structure and the Performance of Public Organizations: Task Difficulty and Span of Control,” Public Organization Review, 2001, Vol. 1, pp. 341-354. Tom Brown, “The Empowerment Myth,” Across the Board, March/April 2001, pp. 71-72. Alicia Bugarin “Flattening Organizations: Practices and Standards,” September 1997, California Research Bureau, California State Library, Sacramento, California. Steven H. Cady and Patricia M. Fandt, “Managing Impressions with Information,” The Journal of Applied Behavioral Science, June 2001, pp. 180-204. Memorandum from C.A. Chapman, Application Development Manager, Office of State (of North Carolina) Personnel to Human Resources Directors, July 22, 1999, retrieved 8/31/01 from www.osp.state.nc.us/forms/memos/soc.html. City of Portland Span of Control Study, Prepared for the City of Portland Audit Services Division by Public Knowledge, Inc. and The Kemp Consulting Group, 1994. Ursula Glunk, Celeste Wilderom, Robert Ogilvie, “Finding the Key to German-style Management,” International Studies of Management & Organization, Fall 1996, p. 93(16). Mark Henricks, “Span of Control. How Many Employees Directly Reporting to You Is Too Many?” 2001, retrieved 8/31/01 from http://www.entrepreneur.com/Magazines/MA-SegArticle/0,1539,285040----1-,00.html. Esther E. Klein, “Using Information Technology to Eliminate Layers of Bureaucracy,” The National Public Accountant, June 2001, pp. 46-48. Paul C. Light, “From Pentagons to Pyramids: Whacking at Bloat,” Government Executive, July 2001, p. 100. Instructions for data collection: Management Span of Control, Texas Human Resources Division, March 1, 1999, retrieved 8/31/01 from http://www.hr.state.tx.us/geninfo/ftemgmntstaffratio.html. Charles McConnell, “The Changing Face of Health Care Management,” The Health Care Manager, March 2000, pp. 1-17. Becky L. Nichol, “Top Ten Reasons Teams Become Dysfunctional,” The National Public Accountant, February/March 2000, pp. 12-15. “Organizational Review of the Edmonton Police Service, 1998, A Final Report,” January 22, 1999, retrieved 8/31/01 from www.police.edmonton.ab.ca/Pages/kpmg/finalreport/sld067.htm.

Performance Audit: Span of Control
20
Harriet Richardson, presentation “Span of Control Audit-to-Go,” King County Auditor’s Office. Ratio of Staff to Managers in City Government, Office of City Auditor, Seattle, Washington, January 25, 1996. Michael Schwartz, “Why Ethical Codes Constitute an Unconscionable Regression,” Journal of Business Ethics, Volume 23, Issue 2, Part 2, pp. 173-184. Simple Span of Control Calculator, Quality Research, (1999), retrieved 8/6/01, from http://www.icce.rug.nl/qr/ssocc.html. Span of Control Assessment review instructions, retrieved 8/31/01, from http://my.premierinc.com/frames/index.jsp?pagelocation=/all/informatics/services/assessments/. “The Span of Control and the Formulas of V. A. Gracuinas,” 2000, retrieved 8/6/01 from http://home.att.net/~nickols/gracuinas.htm. “Span of Control vs. Span of Support,” The Journal for Quality and Participation, Fall 2000, p. 15. “Span of Control,” King County Auditor, King County, Washington, 1994, retrieved 8/31/01 from www.metrokc.gov/auditor/1994/span.htm. Gretchen M. Spreitzer, “Social Structural Characteristics of Psychological Empowerment,” Academy of Management Journal, April 1996, p. 483 (22). Lyndall F. Urwick, “The Manager’s Span of Control,” Harvard Business Review, May-June 1956, pp. 39-47.
Shawnee Vickery, Cornelia Droge, and Richard Germain, “The Relationship Between Product Customization and Organizational Structure,” Journal of Operations Management, (1999) pp. 377-391. W. H. Weiss, “The Science & Art of Managing,” Supervision, March 1999, pp. 11-15. Elizabeth Yeldon, “The Shape of Things to Come,” Accountancy, February 2001, p. 122.
21
_____________________________________________________________________________________ Appendix B _____________________________________________________________________________________ City Manager’s Response

Performance Audit: Span of Control
22

Appendices
23