performance-based design for evacuation · performance-based design for evacuation 27 3 evacuation...
TRANSCRIPT
Performance-Based Design for Evacuation
Sofia Costa de Sousa
Thesis to obtain the Master of Science Degree in
Architecture
Supervisor: Prof. António Paulo Teles de Menezes Correia Leitão
Examination Committee
Chairperson: Prof. Teresa Frederica Tojal de Valsassina Heitor
Supervisor: Prof. António Paulo Teles de Menezes Correia Leitão
Member of the Committee: Prof. Francisco Manuel Caldeira Pinto Teixeira Bastos
May 2018


i
DECLARATION
I declare that this document is an original work of my own authorship and that it fulfills all the
requirements of the Code of Conduct and Good Practices of the Universidade de Lisboa.

ii
ABSTRACT
The increasing number of crowd disasters has promoted a greater responsibility in designing
buildings that allow a safe evacuation in case of emergency. Consequently, there has been an
investment in developing tools that can assess the evacuation performance of a building. The
employment of these tools has been essentially restricted to the final stages of the design
process. This application is rather limited, as in final stages the architect is conditioned in the
flexibility to implement relevant changes. Performance-Based Design (PBD) is a design approach
that attempts to solve this problem. Using PBD, the architect integrates quantifiable performance
feedbacks from the early stages of design. Hence, the architect is able to develop an informed
design process, ensuring a final result that is an optimized version of the building, concerning pre-
defined performance criteria.
In the development of a project, the architect continuously considers alternative exploration paths.
However, in the context of PBD, the time and work required to evaluate design alternatives inhibit
the number of variations that the architect is willing to try, thus constraining the exploration
process. Parametric Modeling (PM) presents itself as a potential solution to this problem. In PM
the architect, instead of defining a specific design, develops a model that defines a design
concept. That model allows to automatically generate variations within that design concept.
In this work we explore the combination of PM and evacuation simulation tools, within the context
of PBD. We expect that, in the combination of these emerging technologies, one can make a
more profitable application of evacuation simulation tools in the development of safer architectural
projects.
KEYWORDS
Parametric Design; Performance-Based Design; Evacuation; Simulation

iii
RESUMO
O crescente número de desastres associados a grandes concentrações de pessoas tem vindo a
promover uma maior responsabilidade na concepção de edifícios que permitem uma evacuação
segura em caso de emergência. Consequentemente, tem havido um investimento no
desenvolvimento de ferramentas que avaliam o desempenho de evacuação de um edifício. O
emprego dessas ferramentas tem sido essencialmente limitado a fases finais de projecto. Esta
aplicação é bastante limitada, uma vez que em fases finais o arquiteto está condicionado pela
pouca flexibilidade em implementar mudanças relevantes. Performance-Based Design (PBD) é
uma abordagem de projecto que tenta resolver esse problema. Usando PBD, o arquiteto integra
feedbacks de avaliação de desempenho quantificáveis em fases iniciais do projecto. Deste modo,
o arquiteto é capaz de desenvolver um processo de projecto informado, garantindo um resultado
final que é uma versão optimizada do edifício, em relação aos critérios de desempenho pré-
definidos.
No desenvolvimento de um projeto, o arquitecto considera continuamente caminhos de
exploração alternativos. No entanto, no contexto de PBD, o tempo e o trabalho necessários para
avaliar alternativas inibem o número de variações que o arquitecto está disposto a experimentar,
restringindo assim o processo de exploração. A modelação paramétrica (PM) apresenta-se como
uma potencial solução para este problema. Na PM, o arquitecto, em vez de definir uma solução
específica, desenvolve um modelo que define um conceito de projecto. Esse modelo permite
gerar automaticamente variações dentro desse conceito.
Neste trabalho, exploramos a combinação de PM e de ferramentas de simulação de evacuação,
dentro do contexto de PBD. Espera-se que, na combinação destas tecnologias emergentes, seja
possível fazer uma aplicação mais vantajosa de ferramentas de simulação de evacuação no
desenvolvimento de projetos arquitectónicos mais seguros.
PALAVRAS-CHAVE
Modelação Paramétrica; Performance-Based Design; Evacuação; Simulação

iv
ACKNOWLEDGMENTS
Firstly, I would like to express my gratitude to my Supervisor, Professor António Leitão, for
introducing me to such a stimulating and relevant subject, for all the guidance throughout the
course of this work, and for the availability, dedication and enthusiasm, essential in the
progression and conclusion of this thesis.
To my family, for the unconditional trust and support, and for always pushing me to challenge
myself.
To my friends, for the constant cheering and for making this journey more joyful.
Finally, to the members of ADA, for the fellowship and for the advices, in particular to Renata
Castelo Branco for her help and contribution to the present work.
v
CONTENTS
ListofFigures viiListofTables ixAbbreviations xGlossary xi
I. INTRODUCTION 1
Motivation 2Objectives 3Methodology 3Structure 4
II. LITERATUREREVIEW 7
1 DigitalTools 8 DigitalToolsinArchitecture 9 ComputationalEra 10 DigitalDesign 12 ParametricDesign 14
2 Performance-BasedDesign 19 DesignSynthesis 21 DesignEvaluation 22 Analysis 23 Workflow 26 Performance-BasedDesignforEvacuation 27
3 EvacuationSimulation 28 ModelingPedestrianCrowds 303.1.1 ModelingApproaches 333.1.2 HybridModels 39 PanicBehavior 40
III. PROPOSEDSOLUTION 43
4 Performance-BasedDesignforEvacuation 44
5 CaseStudy 45 PreparationWork 45
vi
5.1.1 ParametricModel 455.1.2 EvaluationTool 48 Performance-BasedDesign 505.2.1 SolutionSpace 505.2.2 Evaluation 515.2.3 Analysis 525.2.4 Conclusion 57 Results 57
IV. DISCUSSION 61
Conclusion 62Advantages 62Disadvantages 63FutureWork 63Contributions 65
REFERENCES 67
ANNEXES A
vii
LIST OF FIGURES
Figure1.1SeedCathedralbyThomasHeatherwick 11
Source:http://www.heatherwick.com/project/uk-pavilion/
Figure1.2Dubaiskyline 12
Source:http://www.firecurtains.co.uk/dubai-architecture-fire-safety/
Figure1.4IvanSutherlandoperatingSketchpad 12
Source:http://history-computer.com/ModernComputer/Software/Sketchpad.html
Figure1.3 InsidetheofficesofMoriyama&Teshimabefore(left)andafter(right)theproliferationof
computers 13
Source:https://www.canadianarchitect.com/features/time-to-go/(left)
http://mtarch.com/(right)
Figure1.5 KunsthausGrazbyPeterCookandColinFournier 14
Source:https://www.arch2o.com/kunsthaus-graz-peter-cook-and-colin-fournier/
Figure1.6 UfaCinemabyCoopHimmelb(L)Au 14
Source:http://www.coop-himmelblau.at/architecture/projects/ufa-cinema-center
Figure1.72DModelofacolumn 14
Source:(Leitão,2016)
Figure1.8Parameterizationofacolumnandpotentialvariations 15
Source:(Leitão,2016)
Figure1.9Restrictionsoftheparametricmodelforadoriccolumn 16
Source:(Leitão,2016)
Figure1.10DigitalProjectinterface(left); GenerativeComponentsinterface(right) 17
Source:https://www.youtube.com/watch?v=ST60ZOdsfhc
Figure1.11Möbiusstrip 18
Source:(Leitão,2016)
Figure1.12VariationsoftheparametricmodeloftheMöbiusstrip 18
Source:(Leitão,2016)
Figure1.13Arrangementofcolumnsaccordingtolistsofpoints 18
Source:(Leitão,2016)
Figure2.1GreaterLondonAuthorityHeadquartersbyFosterAndPartners 20
Source:https://kamonohashikamo.files.wordpress.com/2013/01/city-hall-and-tower-bridge-london-england.jpg
Figure2.2 ZedProjectinLondonByFutureSystems(1995) 20
Source:http://www.ohames.lu/dreamreal/research.html
Figure2.3 Gaudi’sinvertedmodelfortheSagradaFamiliaChurch 21
Source:https://99percentinvisible.org/episode/la-sagrada-familia/
viii
Figure2.4SwissReBuildingbyFosterandPartners 21
Source:https://www.archdaily.com/
Figure2.5ComparisonoftheanalysisgeneratedbyDiva(up)andthecorrectone(down) 22
Source:(Leitão,Branco,&Cardoso,2017)
Figure2.6Multiplelocalmaxima 25
Source:http://www.turingfinance.com/fitness-landscape-analysis-for-computational-finance/
Figure3.1HeyselDisasterEvacuation,1985 28
Source: https://www.theguardian.com/football/2015/may/28/heysel-stadium-tragedy-liverpool-juventus-eamonn-mccabe
Figure3.2ShoppersonaBlackFridayEvent,2015 28
Source:https://www.mirror.co.uk/money/asda-scraps-black-friday-after-6802919
Figure3.3Muslimpilgrimsinthe2015Hajj 30
Source:https://www.wired.com/2015/09/hajj-stampede-fluid-dynamics-problem/
Figure3.4 Sims3Game 31
Source:https://www.newscientist.com/article/mg21829235-800-ai-makes-social-game-characters-all-too-human/
Figure3.5 Experimentonpedestrianbehavior 32
Source:https://www.youtube.com/watch?v=J4J__lOOV2E
Figure3.6Lanesofuniformwalkingdirection 32
Source:(Helbing,Farkas,Molnár,&Vicsek,2002)
Figure3.7Oscillationsatbottlenecks 32
Source:(Helbing,Farkas,Molnár,etal.,2002)
Figure3.8 Long-termphotographofastandingcrowdinfrontofacinema,ByThomasArns. 34
Source:(Helbing,Farkas,Molnár,etal.,2002)
Figure3.9 Rule-BasedModel 36
Source:Moussaïdetal.,(2011)
Figure3.10 SocialForceModel 36
Source:http://futurict.blogspot.pt/2014/12/social-forces-revealing-causes-of.html
Figure3.11ExampleofthespacerepresentationinaCellularAutomataModel 37
Source:(Pelechano&Malkawi,2007)
Figure3.12ExampleoftheevolutionofanevacuationCAModel 38
Source:(Kirchner&Schadschneider,2002)
Figure3.13 ArchingandCloggingEffect 40
Source:(Helbing,Farkas,Molnár,etal.,2002)
Figure3.14 FreezingbyHeatingEffect 40
Source:(Helbing,Farkas,&Vicsek,2000a)
Figure4.1Workflowandtools 44

ix
Figure5.1Exampleofcasestudylayout 46
Figure5.2Potentialvariationsoftheparametricmodel 47
Figure5.3ExampleofPathfindercounterplotsondensity 50
Figure5.4Schematicrepresentationofthe20evaluationsperformedforparameterNumberof
concentricrings 51
Figure5.5Analysisoutputs 54Figure5.6Evacuationsimulationsnapshotsfordifferentcorridorwidths 55Figure5.7Comparisonbetweenchangingthecorridors’widthusingfixedexitdoors’sizeandusingexit
doorswhosesizematchesthesizeofthecorridors 56Figure5.8Evacuationsimulationsnapshotsfordifferentnumberofconcentriccorridors 56
LIST OF TABLES
Table1Numberofevaluationsperformedinthefirstcycle 52Table2Evacuationtimesfordifferentnumberofrings,corridorwidths,andexitdoorsize(for2500
visitors) 57Table3Incompletelistof21stcenturycrowddisasters BTable4Selectionofevacuationsimulationsoftware ETable5Detailsonpotentialevacuationsimulationsoftware F

x
ABBREVIATIONS
2D Two-dimensional
3D Three-dimensional
ABM Agent-Based Modeling
AD Algorithmic Design
AEC Architecture, Engineering, and Construction
BIM Building Information Modeling
CAD Computer-Aided Design
IPC Inter-process Communication
NIST National Institute of Standards and Technology
NURBS Non-Uniform Rational Bezier Splines
PBD Performance-Based Design
PM Parametric Modeling
SA Sensitivity Analysis
SFM Social Force Model
xi
GLOSSARY
Algorithm Sequence of instructions for mechanically solving a problem
Algorithmic design Definition of architectural designs through algorithms
Agent-based modeling Modeling of complex systems as a composition of several
interacting agents
Cellular automaton Discrete dynamical system that consists of a regular grid of finite state
cells that change their states depending on the states of their neighbors according to update rules.
Optimization Procedure of making something as perfect, functional or effective as
possible (Nguyen, Reiter, & Rigo, 2014). In mathematical terms, it corresponds to the process of
finding the best solution to a problem from a set of alternatives.
Parameter Property of a system that when modified produces different results
Parametric design Design process in which geometric elements are defined in relation to
each other. After assigning different values for design parameters, the whole design is adjusted
due to the associative geometry.
Performance-based design Design process that integrates performance evaluations into the
design workflow.
Programming Translation of algorithms into a language that can be understood by the
computer.
Sensitivity analysis Study of causal links between a model’s input and output.
Simulation Imitation of a real-world system that we want to study (Banks, Nelson, Carson, &
Nicol, 1984).
Stampede Sudden and rapid movement of a mass of people in response to a particular
stimulus.


1
I. INTRODUCTION
MOTIVATION
The increasing number of crowd disasters has awakened the need to evaluate
buildings’ evacuation performance. Information available in building design
guidance documents is insufficient to efficiently address safety requirements and
traditional methods of assessing the evacuation performance, namely post-
construction drills, raise practical, ethical, and financial problems, which calls into
question their viability. The effectiveness of an evacuation can literally mean the
difference between life and death for large groups of people. Driven by the
urgency of improving safety in public spaces, and the inadequacy of existing
mechanisms to assess buildings’ evacuation performance, evacuation simulation
has been gaining a lot of attention in recent years.
Evacuation simulation tools are mainly applied in final stages of the design
process, to assess the building’s safety performance. However, general
performance of a building is strongly determined by decisions made in initial
design stages and, in final stages, there is not enough flexibility to implement
relevant changes in the design. Performance-Based Design (PBD) is a design
approach that attempts to solve this problem. Using PBD, the architect integrates
quantifiable performance feedbacks from the early stages of design. Hence, the
architect is able to develop an informed design process, ensuring a final result
that is an optimized version of the building, concerning pre-defined performance
criteria. PBD has an active attitude regarding performance criteria, instead of a
reactive one.
The major difficulty in resorting to simulation tools to drive the design process is
that, on providing evaluation results, they do not inform on how to modify the
building to improve performance. On the other hand, it is in initial design stages
that architects consider the largest number of design possibilities. However, the
time and work required to evaluate design alternatives inhibit the number of
variations that the architect is willing to try, thus constraining the exploration
process. An alternative approach is to try to infer correlations between design
variations and evaluation outcomes, dismissing the need to test each design
alternative. However, this approach also implies evaluating a significant solution
space in order to be able to draw some conclusions. As a result, the cost of
developing different versions of the model for testing purposes constraints the
potential of the PBD approach.
On the other side, there is a modeling paradigm, known as Parametric Modeling
(PM) in which the architect, instead of defining a specific design, develops a
model that defines a design concept. That model allows to automatically generate
variations within that design concept.
3
In this work we explore the combination of PM with evacuation simulation tools,
within the context of PBD. By resorting to PM and evacuation simulation tools,
one is able to test a wider sample of design alternatives and perform an informed
design process regarding evacuation performance.
OBJECTIVES
The aim of this thesis is to explore the combination of PM and evacuation
simulation tools, within the context of PBD. We expect that, in the combination of
these emerging technologies, one can make a more profitable application of
evacuation simulation tools in the development of safer architectural projects.
In this thesis we explore the current practices and we identify the limitations of
the different technologies involved in our study, namely PBD, PM, and evacuation
simulation, and we propose a design approach that combines them. Our proposal
is evaluated in a fictional case study, from which we infer the competence of the
approach, identifying its benefits and limitations.
In the exploration of the integration of PM and evacuation simulation tools we
expect to:
1. By resorting to PBD, propose a more profitable application of evacuation
simulation tools, used to guide the design process instead of being
restricted to final evaluations;
2. By resorting to PM, propose a more sustained design process – by
allowing to rapidly generate design variations, one is able to test a wider
number of design alternatives;
3. By combining PBD, PM, and evacuation simulation tools, propose a
design process that assists, in an efficient way, in the development of
safer design solutions.
METHODOLOGY
In order to achieve our proposed goals, this work is divided into four main phases:
(1) literature review, (2) proposed solution, (3) evaluation, and (4) conclusions.
We begin our work by accessing the state of the art on the main subjects on which
we will be working on. We define as keywords for our research: evacuation
simulation; performance-based design, and parametric modeling. Each of these
topics, independently, is a trending subject within the scientific community. The
available literature is vast and there are several potential exploration paths,
possibly covering other fields besides architecture. To restrict our research, we
filtered the available information according to its relevance for our purposes.
However, we also investigated beyond the scope of architecture. Out of the

4
literature review we provide, for each topic, an historic contextualization, current
practices, and identify its advantages and obstacles, framed in our investigation.
In the second part we present our approach. We identify the different processes
that compose our approach and justify our choices.
In the third part we evaluate our approach through the development of a case
study. We choose to develop a relatively simple case study that is easy to
understand and work with, and that still can provide relevant information that can
be extrapolated to more complex contexts. To fully evaluate the pros and cons of
the approach we perform the different tasks that the architect would have to
perform, meaning that we also execute the preparation work, such as the
selection of the evaluation tool. Once the case study is implemented, we discuss
its success, and present the conclusions drawn from it.
Finally, in the last stage of this thesis we make an overview of our work. We draw
conclusions regarding the study undertaken taking into consideration the state of
the art and the results of our implementation. We conclude our work with
prospects for future work.
STRUCTURE
The methodology undertaken is reflected on the structure of the thesis. We
divided our work into 4 distinct chapters:
I. Introduction
II. Literature review
III. Proposed solution
IV. Discussion
In the Introduction, we identify the subject of our thesis, and we present a
summary of the developed work.
We divide the Literature Review according to the key subjects defined for our
research:
1. Digital tools In this chapter we discuss the integration of digital tools within the
architectonic context. First we present digital tools in a general manner
and then we converge to design tools in which PM is integrated;
2. Performance-based design Here, Performance-Based Design is explained. We start with a
contextualization and definition, and then we present the different
processes that integrate a PBD approach;
5
3. Evacuation simulation This section starts with a contextualization of evacuation simulation. We
then categorize current methodologies for developing evacuation
simulation models and in the end we discuss characteristics of panic
behavior.
In the third part of our thesis, designated Proposed Solution, we present our
proposal and then we evaluate it through the development of the case study. The
case study is divided into 3 subchapters:
1. Preparation work In the preparation work we develop the parametric model and select an
evaluation tool. The development of the parametric model requires a prior
development of a design concept, followed by its parameterization and
finally the formulation of its algorithmic description;
2. Performance-based design In this section we implement the workflow or our PBD approach. We
divide this section according to the cycle of PBD: synthesis, evaluation
and analysis;
3. Results We finish the case study by drawing conclusions.
Finally, in the Discussion chapter we provide a review of our work. We present
a brief summary of the work undertaken, and then we identify the potentials and
current limitations of the proposed approach. Finally, we present expectations for
future work.


7
II. LITERATURE REVIEW
8
1 DIGITAL TOOLS The computer is a machine - the hardware - that manipulates data according to
a set of instructions - the software. In 1936 the mathematician Alan Turing
presented a hypothetical machine, which manipulated symbols on a strip of tape,
according to a table of transition rules. Despite its simplicity, it was one of the first
illustrations of computability, and its inherent logic is closely related to the later
development of computers. Turin’s machine was the conceptualization of
computation principles (Williams, 2006).
Computers are devices that execute computations, they process input
information into outputs according to a sequence of instructions, an algorithm.
Programming is the formulation of those algorithms, written in specific languages
that the computer can understand. The strength of the computer as a machine is
the flexibility of computations. Through the writing of new programs, it is possible
to perform countless distinct operations, in a single device. By the proper
communication of the intended computation, a computer allows one to work more
efficiently (Kotnik, 2006; W. Mitchell & Maccullough, 1999; Peters & Kestelier,
2013; Silver, 2006).
“Without exception, using a computer always means to activate an algorithmic
procedure as a mediator between input and output” (Kotnik, 2006, p. 21).
However, using a computer does not always mean that the user has an
awareness of the computation that is being performed. That consciousness is
translated in two different modes of operating a computer - computerization and
computation.
In computerization, which is the prevailing mode of operating computers, users
resort to computers through already developed software. The computation
behind it is hidden, and often not understood. Users simply digitize information,
according to the software’s pre-defined protocols. “Computerization is about
automation, mechanization, digitization, and conversion” (Terzidis, 2006, p. 57).
Computation, on the other hand, regards the use of computers to process
information according to a conscious and intended logic. The user takes
advantage of computer power, transcending automatic and predictable
applications, without being constraint to any particular software. “It is about
rationalization, reasoning, logic, algorithm, deduction, induction, extrapolation,
exploration, and estimation” (Terzidis, 2006, p. xi). Using a computer through a
computational approach allows great flexibility to develop custom tools that fit
one’s specific needs. It extends the intellect of the user and increases the
capability of solving complex problems (Peters & Kestelier, 2013; Silver, 2006;
Terzidis, 2006).
9
When computers appeared, they consisted of million dollar machines which took
a lot of space and could only be handled by specialized professionals. Only 50
years later, due to an accentuated technological evolution, computers were
integrated in every aspect of our lives, drastically altering the way we live.
Architecture is no exception, five decades after the introduction of computers into
the practice, its effects, both in practice and product, have become notorious
(Kalay, 2008).
DIGITAL TOOLS IN ARCHITECTURE
Throughout history architecture and construction have taken advantage of the
opportunities that technological innovations brought to the fields. For instance,
the invention of the Flying Buttress allowed the replacement of Romanesque’s
massive and heavy walls for the Gothic thin and tall walls with large windows,
while, in the industrial revolution, the invention of the mass produced steel, as
well as the invention of the electric elevator allowed the design and construction
of the first skyscrapers (Kalay, 2008). More recently, digital technology has not
only been redefining the architectural product, often manifested in complex
shapes, but also the design process itself, by providing new intellectual tools.
Through the introduction of digital technologies into the architectonic practice,
new methodologies have emerged, which generated a varied set of digital skills
and a new kind of architectural knowledge (Kotnik, 2010).
Broadly speaking, technology integrates an existing practice in one of two
possible ways: either it is adapted to existing methodologies, or promotes new
ones. The first scenario usually concerns early adoptions of a technology. When
tools are new, they are often understood in contrast to their antecessors, thus
new technologies are often introduced to replace previous ones, not necessarily
fitting into the existing logic. The second scenario implies a more mature
understanding of both the technology and the practice, which is reflected in a
conscious appropriation of the technology for the benefit of the practice (Kalay,
2006; W. Mitchell & Maccullough, 1999). This distinction is the generalization to
all technologies of the distinction made between computerization and
computation. Regarding the introduction of digital technologies to the
architectural practice we are now witnessing a transition of paradigm.
Digital technologies were first introduced in the architectonic context to mimic
traditional design procedures. However, unlike other practices which rely on
discriminated processes, the design process lacks scientific support and
methodologies, it is an open-ended ambiguous and intuitive process (Terzidis,
2008) hence impossible to be replicated. For that reason, in the beginning, the
use of computers was mainly restricted to final stages of the process, through the
10
use of tools for performance evaluations and production of final documents of
communication. In comparison to manual work, these tools increase the precision
and productivity of the design tasks, however its qualitative impact is not
significant since ideas are crafted manually, the same way it has been for the
past 500 years (Kalay, 2004; Kotnik, 2006). Undeniably useful, these tools fall
short of their technological potential, as they are solely used to automate
conventional procedures, while they could be used to create entirely new ones.
Gradually, due to a growing computational awareness, computers are starting to
be integrated sensibly in the architectonic context. First, new tools integrated in
new logics have been developed, and more recently, architects themselves, have
been resorting to algorithms and programming to develop custom tools that assist
the design process (Fernandes, 2013). In this context “technology follows design
demand, rather than design adjusting to available new technology” (Szalapaj,
2004).
COMPUTATIONAL ERA
The shifting to a computational mode of using the computer - the
acknowledgement of the potential of the computer as a high-power computation
device and the ability to control it – has been enabling architects to cope with
increasingly higher levels of complexity. New tools and approaches in modeling,
analysis, optimization and communication open up new opportunities and
promote new methodologies of conceiving design. In fact, architects started to
formalize the design process, as a consequence of code writing (Williams, 2006).
Through the implementation of computers in the actual design process there is a
systematization of knowledge and methods of design (Kotnik, 2010).
However, programming and developing custom tools is not straightforward and
special knowledge is required that, traditionally, is not contemplated in the set of
skills architects possess. As a consequence, the structure of the architectural
firms is changing in order to frame this new specialty into the existing workflow.
Szalapaj stated that “the digital customisation of office practice can be achieved
by configuring digital environments in ways appropriate to the design
philosophies associated with particular offices” (Szalapaj, 2005, p. 757). As a
matter of fact, the digital environment configuration of current architectural offices
is changing, as these digitally-skilled architects are introduced.
According to Peters & Kestelier, (2013) there are four different types of
computationally-driven offices: (1) the internal specialist group, which is
integrated in the design process depending on the needs of the project, that exist
in practices such as Foster and Partners, Herzog & de Meuron and Grimshaw,
(2) the external specialist consultancy, usually specialized in engineering or
11
software development, for example, Buro Happold SMART Solutions, Knippers
Helbig Advanced Engineering, and Gehry Technologies; (3) the computationally-
aware and integrated practice, in which computation is a natural mode of
operating, thus it is not considered as a special skill (examples include MOS and
Facit Homes); and (4) the lone software developer, which consists of architects
who are acquiring software engineering skills and are able to create their own
software, e.g., David Rutten, Daniel Piker, and Giulio Piacentino.
Never before has there been so many tools, techniques and methods of design.
However, digital technologies are not only affecting how we design buildings, but
also how we manufacture and construct them. The alliance of the geometric and
creative potential of digital design processes with the manufacturing advances
already made in automotive, aerospace, and shipbuilding industries give rise to
a new range of possibilities in architectural design (Kolarevic, 2001a). This
synergy led architecture into a new era (Kolarevic, 2001b). An example of this
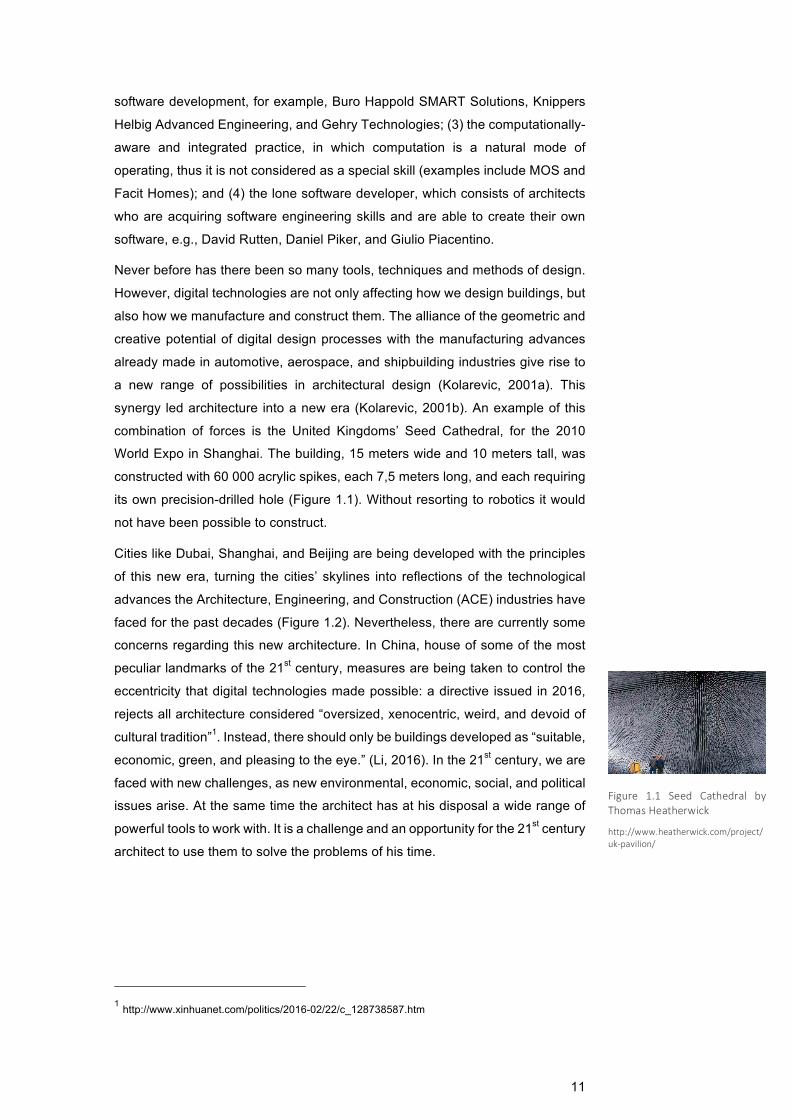
combination of forces is the United Kingdoms’ Seed Cathedral, for the 2010
World Expo in Shanghai. The building, 15 meters wide and 10 meters tall, was
constructed with 60 000 acrylic spikes, each 7,5 meters long, and each requiring
its own precision-drilled hole (Figure 1.1). Without resorting to robotics it would
not have been possible to construct.
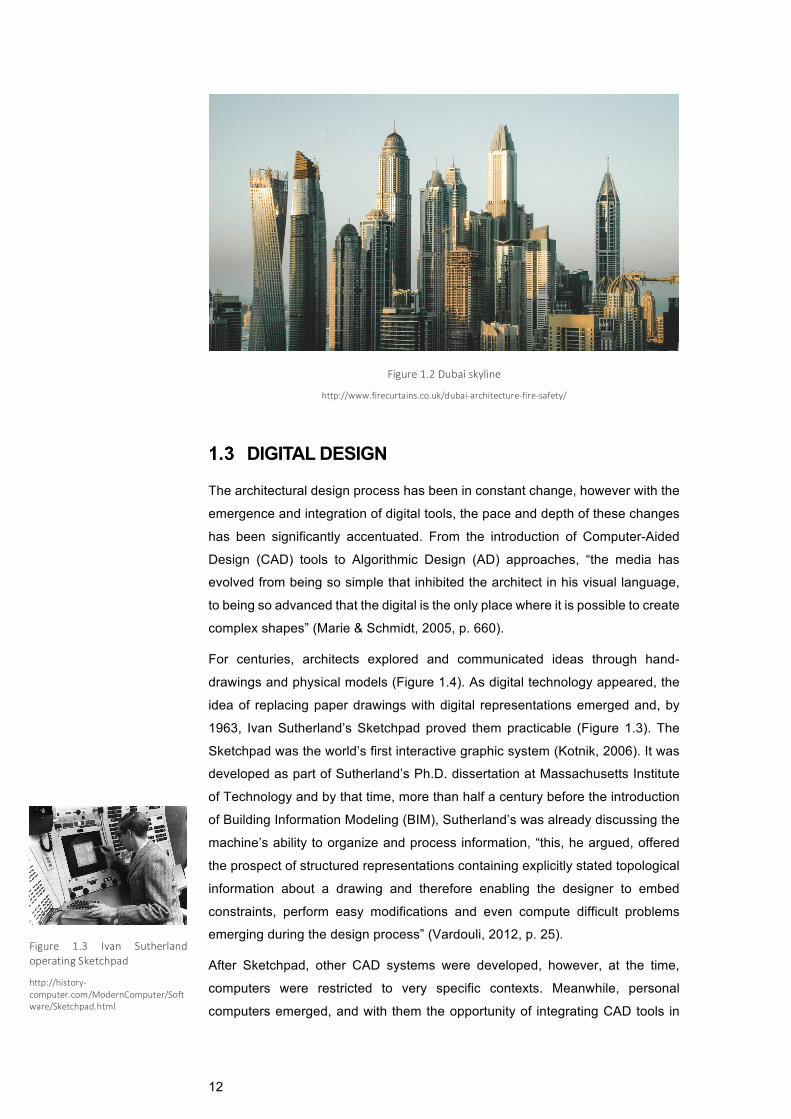
Cities like Dubai, Shanghai, and Beijing are being developed with the principles
of this new era, turning the cities’ skylines into reflections of the technological
advances the Architecture, Engineering, and Construction (ACE) industries have
faced for the past decades (Figure 1.2). Nevertheless, there are currently some
concerns regarding this new architecture. In China, house of some of the most
peculiar landmarks of the 21st century, measures are being taken to control the
eccentricity that digital technologies made possible: a directive issued in 2016,
rejects all architecture considered “oversized, xenocentric, weird, and devoid of
cultural tradition”1. Instead, there should only be buildings developed as “suitable,
economic, green, and pleasing to the eye.” (Li, 2016). In the 21st century, we are
faced with new challenges, as new environmental, economic, social, and political
issues arise. At the same time the architect has at his disposal a wide range of
powerful tools to work with. It is a challenge and an opportunity for the 21st century
architect to use them to solve the problems of his time.
1 http://www.xinhuanet.com/politics/2016-02/22/c_128738587.htm
Figure 1.1 Seed Cathedral byThomasHeatherwick
http://www.heatherwick.com/project/uk-pavilion/
12
DIGITAL DESIGN
The architectural design process has been in constant change, however with the
emergence and integration of digital tools, the pace and depth of these changes
has been significantly accentuated. From the introduction of Computer-Aided
Design (CAD) tools to Algorithmic Design (AD) approaches, “the media has
evolved from being so simple that inhibited the architect in his visual language,
to being so advanced that the digital is the only place where it is possible to create
complex shapes” (Marie & Schmidt, 2005, p. 660).
For centuries, architects explored and communicated ideas through hand-
drawings and physical models (Figure 1.4). As digital technology appeared, the
idea of replacing paper drawings with digital representations emerged and, by
1963, Ivan Sutherland’s Sketchpad proved them practicable (Figure 1.3). The
Sketchpad was the world’s first interactive graphic system (Kotnik, 2006). It was
developed as part of Sutherland’s Ph.D. dissertation at Massachusetts Institute
of Technology and by that time, more than half a century before the introduction
of Building Information Modeling (BIM), Sutherland’s was already discussing the
machine’s ability to organize and process information, “this, he argued, offered
the prospect of structured representations containing explicitly stated topological
information about a drawing and therefore enabling the designer to embed
constraints, perform easy modifications and even compute difficult problems
emerging during the design process” (Vardouli, 2012, p. 25).
After Sketchpad, other CAD systems were developed, however, at the time,
computers were restricted to very specific contexts. Meanwhile, personal
computers emerged, and with them the opportunity of integrating CAD tools in
Figure1.2Dubaiskyline
http://www.firecurtains.co.uk/dubai-architecture-fire-safety/
Figure 1.3 Ivan SutherlandoperatingSketchpad
http://history-computer.com/ModernComputer/Software/Sketchpad.html

13
architecture studios. These personal computers were smaller, cheaper but lower-
power, and companies soon saw the opportunity of developing CAD systems that
could be supported by these computers, leading to the development of simplified
versions, with less functionalities than previous ones (W. J. Mitchell, 1989).
These tools were rapidly diffused and its use became commonplace among both
architects and engineers. AutoCAD in particular was first marketed in 1982, by
1989 more than two hundred thousand copies had been sold, and by the mid-
90s architectural practice without CAD technology had become unimaginable
(Kalay, 2004).
Despite the wide application, CAD tools denote an immature use of the computer,
as they represent the simplest and most obvious application of digital technology
in architectural design, automating traditional practices but without adding
significant value to either the practice or product of design (Kotnik, 2006).
Moreover, these digital versions of drawing boards were restricted to later stages
of the design process, in the construction of final drawings (Shea, Aish, &
Gourtovaia, 2005). These final stages require higher levels of detail and
accuracy, that CAD tools provide. However, integrating these tools in early design
stages, for creative schematic experimentation would be less effective than hand
drawing, since it may impact the designer’s conceptual fluency (Brandon &
McLain-Kark, 2001). In this context, hand-drawing techniques were still in charge
of initial conceptual design activities, the design idea is still developed resorting
only to pencils, markers, and designer’s subjectivity, and in later stages of the
process, as the precision increases, detail was handled with the aid of CAD tools.
CAD tools grew to include three-dimensional capabilities, making the analogy to
physical models, but still without bringing significant novelty to architectural
design.
Figure1.4 InsidetheofficesofMoriyama&Teshimabefore(left)andafter(right)theproliferationofcomputers
https://www.canadianarchitect.com/features/time-to-go/(left)
http://mtarch.com/(right)

14
A first step towards overcoming this restricted use of the computer consisted on
its introduction to surpass previous geometric constrains. In this context,
modeling is still achieved through geometrical transformations, but the computer
allows users to explore more complex geometries. For example, the incorporation
of Non-Uniform Rational Bezier Splines (NURBS) into CAD tools allows the
exploration and visualization of geometries whose complexity would be difficult
to handle by other means. In the Kunsthaus Graz by Peter Cook and Colin
Fournier (Figure 1.6), NURBS were used to digitally describe the shape of the
outer skin of the museum. In the UFA Cinema by Coop Himmelb(l)au (Figure
1.5), the shifting and shearing of the box was only manageable through the
introduction of computer modeling capabilities. In this context, computational
power opens up a new field of geometric possibilities in modeling (Fernandes,
2013; Kotnik, 2006).
At this point, by allowing new kinds of geometries, digital tools extend the
capabilities of the architect. However, it still does not bring any revolution to the
design process, computers are used mainly as a means of representation. It lacks
a conscious consideration of the machine in order to apply it conveniently and
creatively in the design process.
Parametric design represents the shift of using a computer solely for drafting and
modeling towards a more computational approach to architectural design.
PARAMETRIC DESIGN
Parametric design is a design paradigm that has gained a lot of attention in
architectural communities (Puusepp, 2011). A parametric model is a
representation of a design built with components that have been parameterized.
Parameterization is the process of defining which components of the model
change and how the variation occurs (Barrios, 2005).
In traditional design tools, the development of an initial model is relatively “easy”
as elements are added by stages. However, making changes to the model can
become challenging, since changing one element requires manually adjusting the
rest of the model to make the model cohesive. For example, in Figure 1.7, if one
wants to change the height of the shaft, the top of the column has to be adjusted
or redesigned. The amount of work increases with the level of development and
complexity of the model. This kind of approach can discourage exploitation, thus
restricting the design process. In Parametric Modeling (PM), instead of creating
one design solution and changing it by direct manipulation, as in conventional
design tools, the designer develops a generic model which accommodates
variations according to a particular design logic (Woodbury, 2010).
Figure1.5 UFACinemabyCoopHimmelb(l)au
http://www.coop-himmelblau.at/architecture/projects/ufa-cinema-center
Figure1.72Dmodelofacolumn
(Leitão,2016)
Figure 1.6 Kunsthaus Graz byPeterCookandColinFournier
https://www.arch2o.com/kunsthaus-graz-peter-cook-and-colin-fournier/
15
The construction of the parametric model is done through associative geometry,
i.e. the object is defined through its constituent elements and the relationships
between them. This associative geometry implies the establishment of a
hierarchy of dependencies, where “some geometric attributes are expressed
through independent parameters, which act like inputs to the model, while other
attributes receive data from them and are dependently variable” (Turrin, Von
Buelow, & Stouffs, 2011, p. 660). The chain of dependencies is responsible for
the propagation of changes in the model: changing the input parameters will
cause a coordinated global update, generating a variation which maintain “the
essential conditions of the topological relationship” (Oxman, 2009, p. 9).
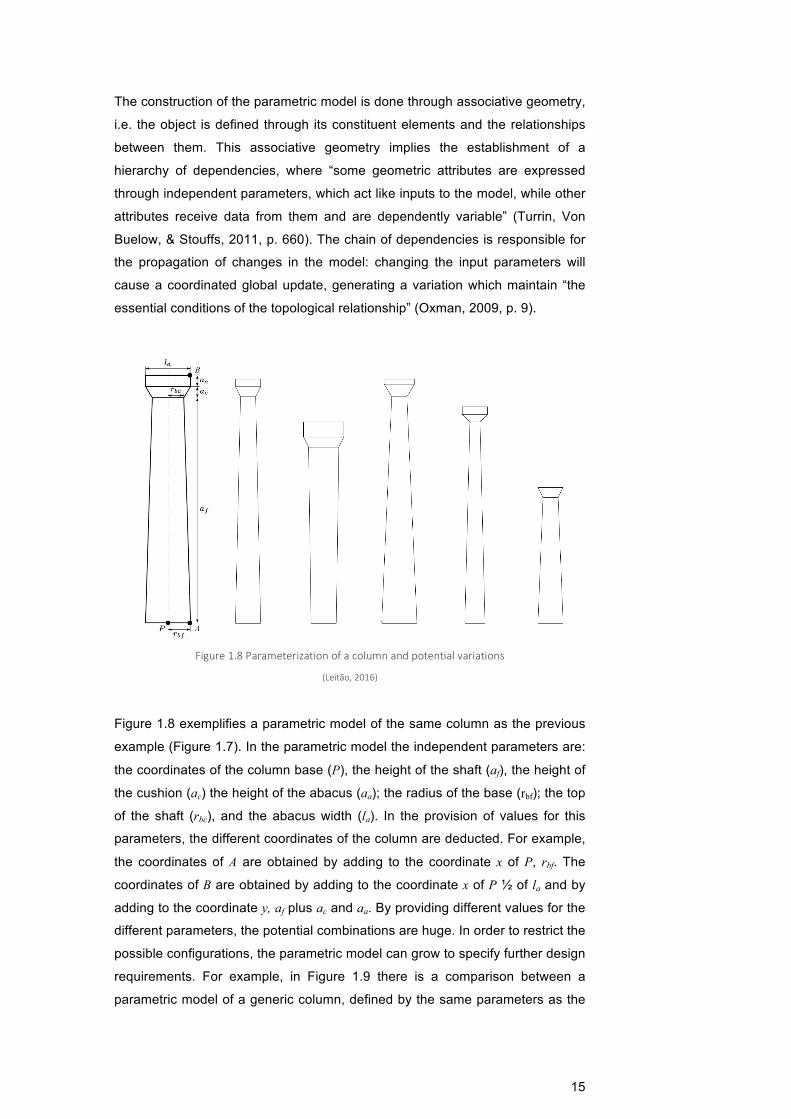
Figure 1.8 exemplifies a parametric model of the same column as the previous
example (Figure 1.7). In the parametric model the independent parameters are:
the coordinates of the column base (P), the height of the shaft (af), the height of
the cushion (ac) the height of the abacus (aa); the radius of the base (rbf); the top
of the shaft (rbc), and the abacus width (la). In the provision of values for this
parameters, the different coordinates of the column are deducted. For example,
the coordinates of A are obtained by adding to the coordinate x of P, rbf. The
coordinates of B are obtained by adding to the coordinate x of P ½ of la and by
adding to the coordinate y, af plus ac and aa. By providing different values for the
different parameters, the potential combinations are huge. In order to restrict the
possible configurations, the parametric model can grow to specify further design
requirements. For example, in Figure 1.9 there is a comparison between a
parametric model of a generic column, defined by the same parameters as the
Figure1.8Parameterizationofacolumnandpotentialvariations
(Leitão,2016)
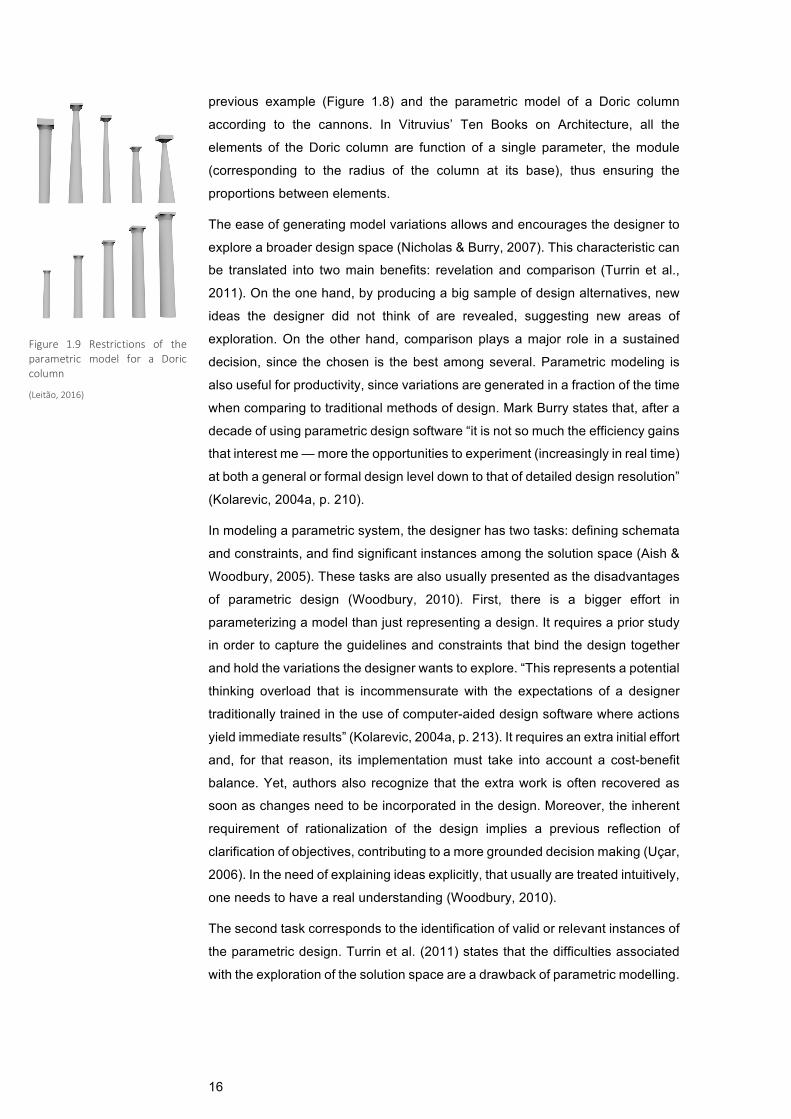
16
previous example (Figure 1.8) and the parametric model of a Doric column
according to the cannons. In Vitruvius’ Ten Books on Architecture, all the
elements of the Doric column are function of a single parameter, the module
(corresponding to the radius of the column at its base), thus ensuring the
proportions between elements.
The ease of generating model variations allows and encourages the designer to
explore a broader design space (Nicholas & Burry, 2007). This characteristic can
be translated into two main benefits: revelation and comparison (Turrin et al.,
2011). On the one hand, by producing a big sample of design alternatives, new
ideas the designer did not think of are revealed, suggesting new areas of
exploration. On the other hand, comparison plays a major role in a sustained
decision, since the chosen is the best among several. Parametric modeling is
also useful for productivity, since variations are generated in a fraction of the time
when comparing to traditional methods of design. Mark Burry states that, after a
decade of using parametric design software “it is not so much the efficiency gains
that interest me — more the opportunities to experiment (increasingly in real time)
at both a general or formal design level down to that of detailed design resolution”
(Kolarevic, 2004a, p. 210).
In modeling a parametric system, the designer has two tasks: defining schemata
and constraints, and find significant instances among the solution space (Aish &
Woodbury, 2005). These tasks are also usually presented as the disadvantages
of parametric design (Woodbury, 2010). First, there is a bigger effort in
parameterizing a model than just representing a design. It requires a prior study
in order to capture the guidelines and constraints that bind the design together
and hold the variations the designer wants to explore. “This represents a potential
thinking overload that is incommensurate with the expectations of a designer
traditionally trained in the use of computer-aided design software where actions
yield immediate results” (Kolarevic, 2004a, p. 213). It requires an extra initial effort
and, for that reason, its implementation must take into account a cost-benefit
balance. Yet, authors also recognize that the extra work is often recovered as
soon as changes need to be incorporated in the design. Moreover, the inherent
requirement of rationalization of the design implies a previous reflection of
clarification of objectives, contributing to a more grounded decision making (Uçar,
2006). In the need of explaining ideas explicitly, that usually are treated intuitively,
one needs to have a real understanding (Woodbury, 2010).
The second task corresponds to the identification of valid or relevant instances of
the parametric design. Turrin et al. (2011) states that the difficulties associated
with the exploration of the solution space are a drawback of parametric modelling.
Figure 1.9 Restrictions of theparametric model for a Doriccolumn
(Leitão,2016)
17
Originally envisioned for the aeronautical industry, parametric systems, because
of its potentialities, have been employed in several other disciplines, however,
given the complexity of the architectural practice, only recently were integrated in
this context (Aish & Woodbury, 2005; Barrios, 2005). In fact, the concept of
parametric geometries had already been introduced in the Sketchpad system.
However, it was abandoned when CAD tools were simplified to fit personal
computers.
These systems represent an important step not only by allowing users to
regenerate designs, instead of editing or redrawing, but also because they
represent a greater awareness and a more useful application of computers in
service of the design process.
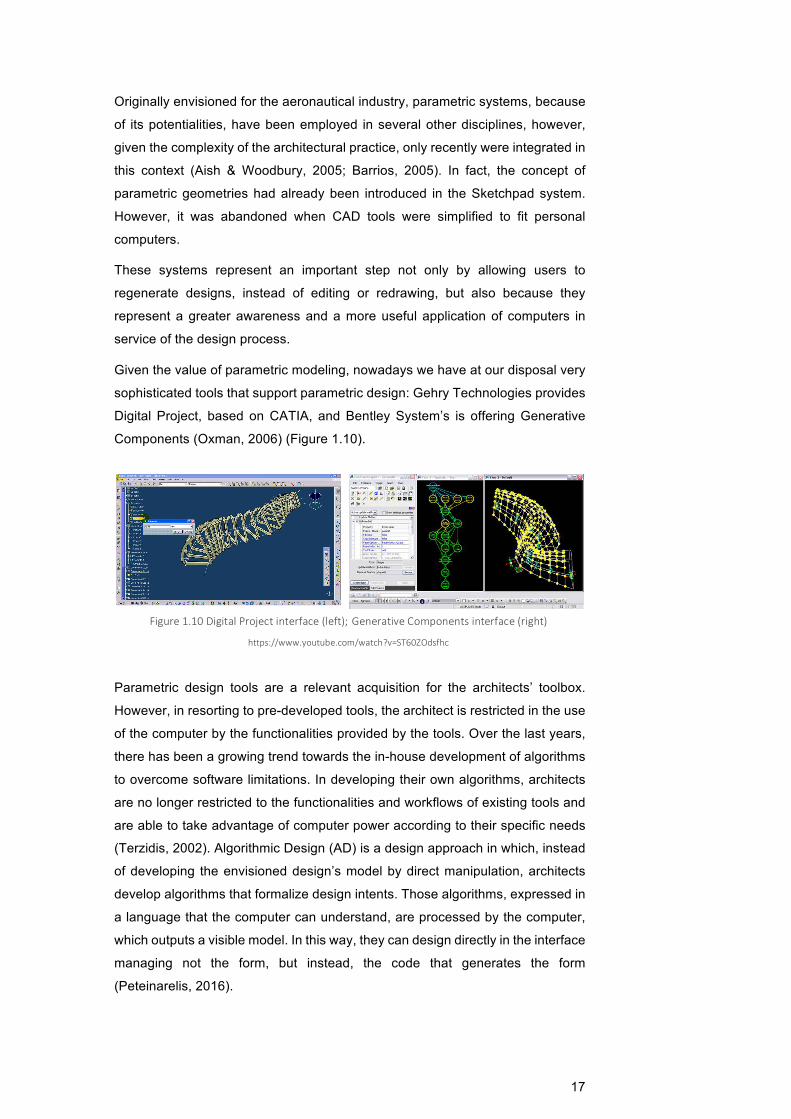
Given the value of parametric modeling, nowadays we have at our disposal very
sophisticated tools that support parametric design: Gehry Technologies provides
Digital Project, based on CATIA, and Bentley System’s is offering Generative
Components (Oxman, 2006) (Figure 1.10).
Parametric design tools are a relevant acquisition for the architects’ toolbox.
However, in resorting to pre-developed tools, the architect is restricted in the use
of the computer by the functionalities provided by the tools. Over the last years,
there has been a growing trend towards the in-house development of algorithms
to overcome software limitations. In developing their own algorithms, architects
are no longer restricted to the functionalities and workflows of existing tools and
are able to take advantage of computer power according to their specific needs
(Terzidis, 2002). Algorithmic Design (AD) is a design approach in which, instead
of developing the envisioned design’s model by direct manipulation, architects
develop algorithms that formalize design intents. Those algorithms, expressed in
a language that the computer can understand, are processed by the computer,
which outputs a visible model. In this way, they can design directly in the interface
managing not the form, but instead, the code that generates the form
(Peteinarelis, 2016).
Figure1.10DigitalProjectinterface(left); GenerativeComponentsinterface(right)
https://www.youtube.com/watch?v=ST60ZOdsfhc
18
In developing a parametric model through AD, besides the rationalization
process implicit in parameterization, one has the job of codification as well
(Kotnik, 2010). The process of formalization and codification may not be a trivial
task, especially for those who are not specifically trained for it.
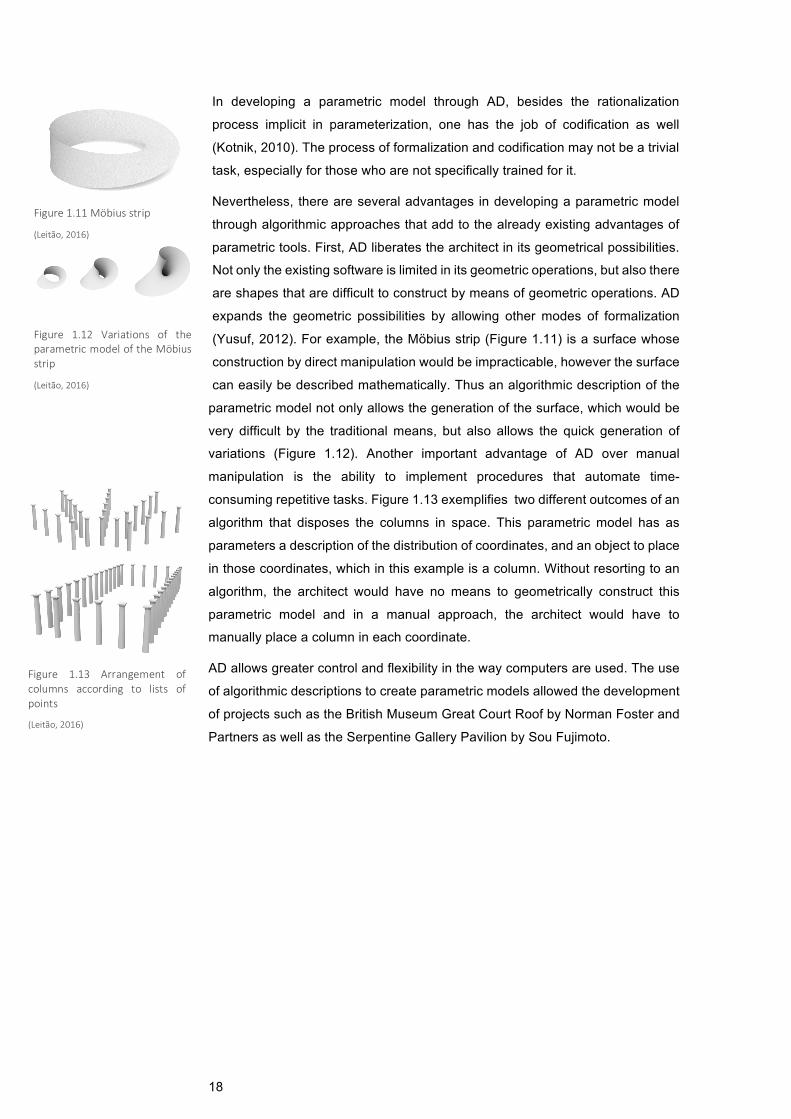
Nevertheless, there are several advantages in developing a parametric model
through algorithmic approaches that add to the already existing advantages of
parametric tools. First, AD liberates the architect in its geometrical possibilities.
Not only the existing software is limited in its geometric operations, but also there
are shapes that are difficult to construct by means of geometric operations. AD
expands the geometric possibilities by allowing other modes of formalization
(Yusuf, 2012). For example, the Möbius strip (Figure 1.11) is a surface whose
construction by direct manipulation would be impracticable, however the surface
can easily be described mathematically. Thus an algorithmic description of the
parametric model not only allows the generation of the surface, which would be
very difficult by the traditional means, but also allows the quick generation of
variations (Figure 1.12). Another important advantage of AD over manual
manipulation is the ability to implement procedures that automate time-
consuming repetitive tasks. Figure 1.13 exemplifies two different outcomes of an
algorithm that disposes the columns in space. This parametric model has as
parameters a description of the distribution of coordinates, and an object to place
in those coordinates, which in this example is a column. Without resorting to an
algorithm, the architect would have no means to geometrically construct this
parametric model and in a manual approach, the architect would have to
manually place a column in each coordinate.
AD allows greater control and flexibility in the way computers are used. The use
of algorithmic descriptions to create parametric models allowed the development
of projects such as the British Museum Great Court Roof by Norman Foster and
Partners as well as the Serpentine Gallery Pavilion by Sou Fujimoto.
Figure 1.12 Variations of theparametricmodeloftheMöbiusstrip
(Leitão,2016)
Figure 1.13 Arrangement ofcolumns according to lists ofpoints
(Leitão,2016)
Figure1.11Möbiusstrip
(Leitão,2016)
19
2 PERFORMANCE-BASED DESIGN The design task is interdisciplinary, as each architectural project must integrate
and satisfy requirements from different fields (Turrin et al., 2011). On safety
matters, one has to satisfy requirements regarding structure and evacuation
performances; related to comfort, there are acoustic and thermal regulations that
must be considered; additionally, there are budgets that should not be exceeded
and environmental constraints that must be respected. The coordination of the
different requirements is what guides the development of the architectural
geometry and where lays a great parcel of the complexity associated with the
design process.
Traditionally, in the conceptual phase, only few of those requirements are
considered, which mainly address aesthetical and functional performances,
postponing other disciplines to later stages of the process (X. Shi, 2010; Turrin et
al., 2011). However, decisions made in the initial phase have a great impact on
the final solution performance (Gerber, Lin, Pan, & Solmaz, 2012; Méndez
Echenagucia, Capozzoli, Cascone, & Sassone, 2015; X. Shi & Yang, 2013; Turrin
et al., 2011). Moreover, in the final stages of design, there is not enough room for
maneuver to efficiently address some of the requirements, thus limiting the
performance of the result. Low performance results are usually compensated with
mechanical devices that guarantee the project’s approval (Anderson, 2014).
Nevertheless, the geometry of a building affects its performance for its entire
lifetime while, in contrast, technological devices that seek to compensate for
performance deficiencies have a much more limited life span.
On the other hand, Performance-Based Design (PBD) is a design approach in
which the designer emphasizes the building’s quantifiable and physical
performances without neglecting functional and aesthetical requirements
(Kolarevic, 2004b; X. Shi & Yang, 2013; Turrin et al., 2011). PBD has an active
attitude regarding performance criteria, instead of a reactive one.
PBD arises from the integration of design synthesis with design evaluation
processes. Design synthesis supports generation and transformation of a
geometrical model, while design evaluation supports analytical evaluation of the
design’s performance, based on simulation of its behavior. In the combination of
these two processes, in the context of PBD, the design process diverges from a
traditional paradigm - where the human subjectivity and rationality guides the
process, and performance evaluations are left for final stages - to one in which
the design generation is oriented by performance evaluations. Through an
informed process, it is possible to develop an optimized version of the building,
regarding pre-defined performance conditions (Oxman, 2008).
20
In a PBD approach, the architect develops a model, which is then evaluated on
the simulation program, the architect then analyzes the results and changes the
model accordingly in order to improve the performance of the building. It is an
iterative process, composed of synthesis-evaluation-analysis cycles, converging
step-wise to a better performing solution (Oxman, 2009).
Unfortunately, there are several constraints to a PBD approach. First, architects
need to resort to different skills and tools, which, in most cases, require expertise
that architects do not possess. Second, most of the commercially available
simulation software require high-level detail models, which are not compatible
with a conceptual design stage (Oxman, 2008). Finally, the transition between
different tools might be time-consuming and inhibit the exploration of design
alternatives, essential for a PBD approach.
On the one hand, switching from design synthesis to design evaluation requires
the development of an analytical model which might not be a trivial task. On the
other hand, transitioning from evaluation to synthesis not only requires expert
translation of the information given by the analytical tools, but also requires
interpretation within the design at hand, i.e., perceive what the analytical results
imply in that specific design as well as understand how to change the model’s
parameters, based on those results (Nicholas & Burry, 2007).
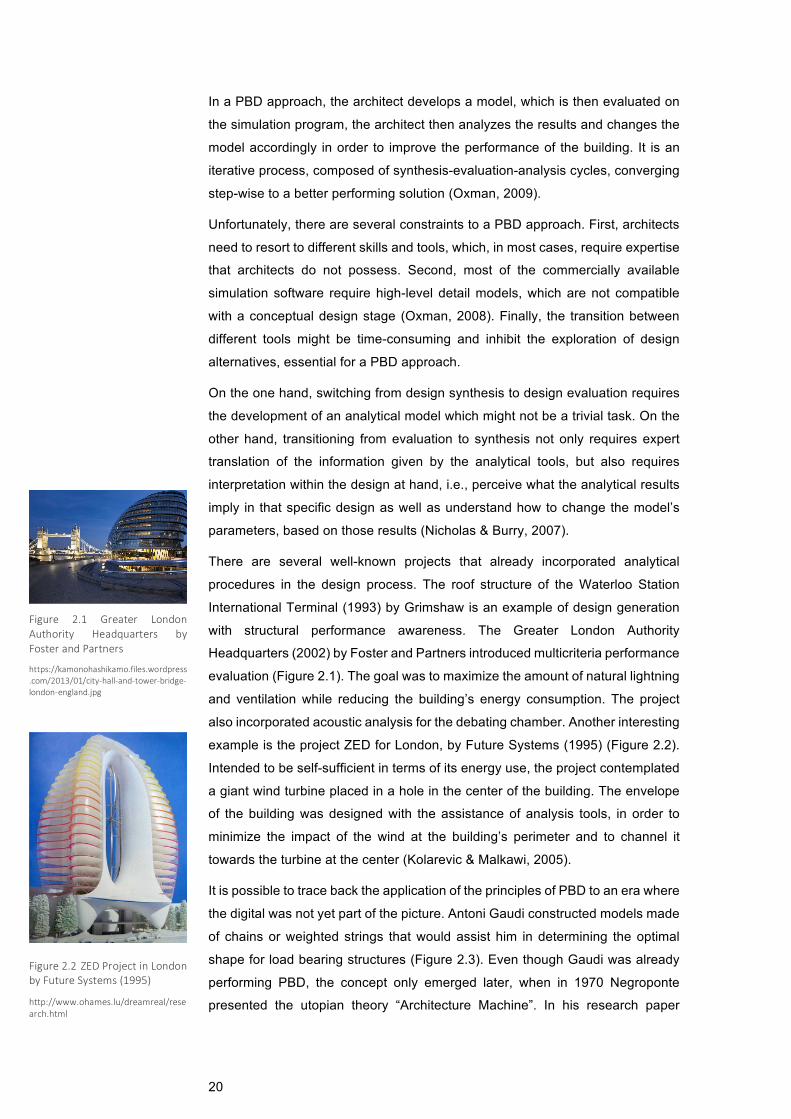
There are several well-known projects that already incorporated analytical
procedures in the design process. The roof structure of the Waterloo Station
International Terminal (1993) by Grimshaw is an example of design generation
with structural performance awareness. The Greater London Authority
Headquarters (2002) by Foster and Partners introduced multicriteria performance
evaluation (Figure 2.1). The goal was to maximize the amount of natural lightning
and ventilation while reducing the building’s energy consumption. The project
also incorporated acoustic analysis for the debating chamber. Another interesting
example is the project ZED for London, by Future Systems (1995) (Figure 2.2).
Intended to be self-sufficient in terms of its energy use, the project contemplated
a giant wind turbine placed in a hole in the center of the building. The envelope
of the building was designed with the assistance of analysis tools, in order to
minimize the impact of the wind at the building’s perimeter and to channel it
towards the turbine at the center (Kolarevic & Malkawi, 2005).
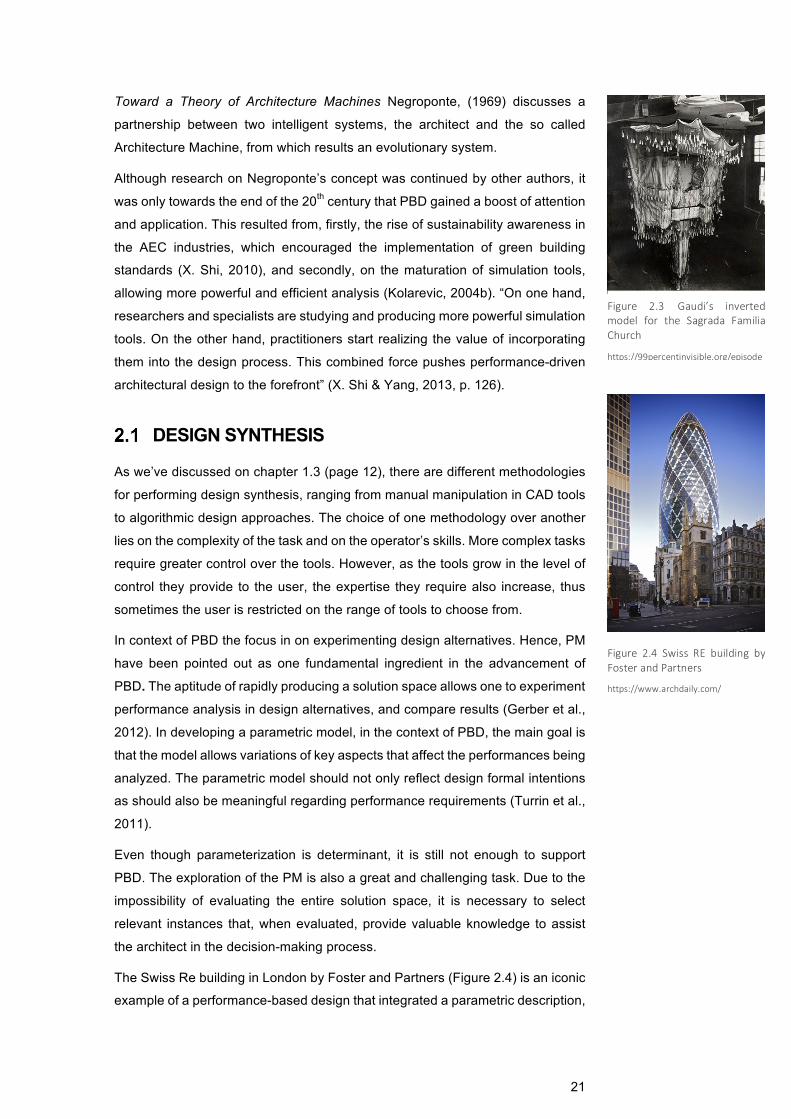
It is possible to trace back the application of the principles of PBD to an era where
the digital was not yet part of the picture. Antoni Gaudi constructed models made
of chains or weighted strings that would assist him in determining the optimal
shape for load bearing structures (Figure 2.3). Even though Gaudi was already
performing PBD, the concept only emerged later, when in 1970 Negroponte
presented the utopian theory “Architecture Machine”. In his research paper
Figure2.2 ZEDProjectinLondonbyFutureSystems(1995)
http://www.ohames.lu/dreamreal/research.html
Figure 2.1 Greater LondonAuthority Headquarters byFosterandPartners
https://kamonohashikamo.files.wordpress.com/2013/01/city-hall-and-tower-bridge-london-england.jpg
21
Toward a Theory of Architecture Machines Negroponte, (1969) discusses a
partnership between two intelligent systems, the architect and the so called
Architecture Machine, from which results an evolutionary system.
Although research on Negroponte’s concept was continued by other authors, it
was only towards the end of the 20th century that PBD gained a boost of attention
and application. This resulted from, firstly, the rise of sustainability awareness in
the AEC industries, which encouraged the implementation of green building
standards (X. Shi, 2010), and secondly, on the maturation of simulation tools,
allowing more powerful and efficient analysis (Kolarevic, 2004b). “On one hand,
researchers and specialists are studying and producing more powerful simulation
tools. On the other hand, practitioners start realizing the value of incorporating
them into the design process. This combined force pushes performance-driven
architectural design to the forefront” (X. Shi & Yang, 2013, p. 126).
DESIGN SYNTHESIS
As we’ve discussed on chapter 1.3 (page 12), there are different methodologies
for performing design synthesis, ranging from manual manipulation in CAD tools
to algorithmic design approaches. The choice of one methodology over another
lies on the complexity of the task and on the operator’s skills. More complex tasks
require greater control over the tools. However, as the tools grow in the level of
control they provide to the user, the expertise they require also increase, thus
sometimes the user is restricted on the range of tools to choose from.
In context of PBD the focus in on experimenting design alternatives. Hence, PM
have been pointed out as one fundamental ingredient in the advancement of
PBD. The aptitude of rapidly producing a solution space allows one to experiment
performance analysis in design alternatives, and compare results (Gerber et al.,
2012). In developing a parametric model, in the context of PBD, the main goal is
that the model allows variations of key aspects that affect the performances being
analyzed. The parametric model should not only reflect design formal intentions
as should also be meaningful regarding performance requirements (Turrin et al.,
2011).
Even though parameterization is determinant, it is still not enough to support
PBD. The exploration of the PM is also a great and challenging task. Due to the
impossibility of evaluating the entire solution space, it is necessary to select
relevant instances that, when evaluated, provide valuable knowledge to assist
the architect in the decision-making process.
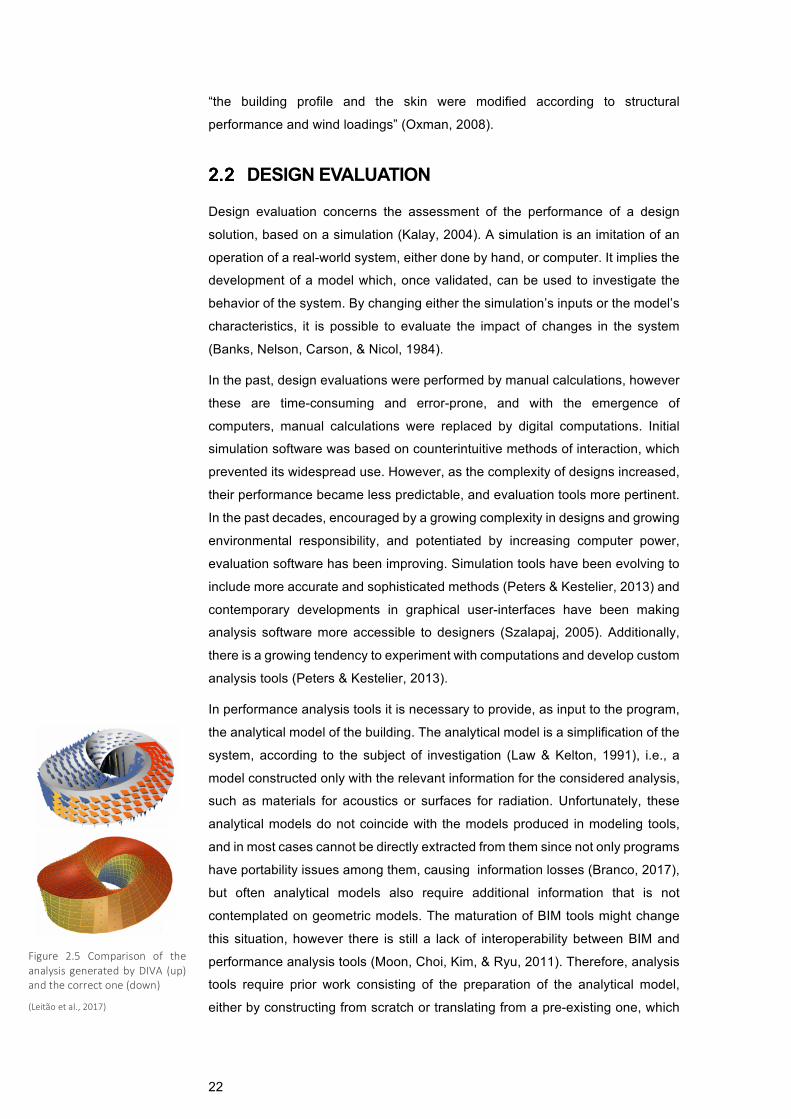
The Swiss Re building in London by Foster and Partners (Figure 2.4) is an iconic
example of a performance-based design that integrated a parametric description,
Figure 2.3 Gaudi’s invertedmodel for the Sagrada FamiliaChurch
https://99percentinvisible.org/episode/la-sagrada-familia/
Figure 2.4 Swiss RE building byFosterandPartners
https://www.archdaily.com/
22
“the building profile and the skin were modified according to structural
performance and wind loadings” (Oxman, 2008).
DESIGN EVALUATION
Design evaluation concerns the assessment of the performance of a design
solution, based on a simulation (Kalay, 2004). A simulation is an imitation of an
operation of a real-world system, either done by hand, or computer. It implies the
development of a model which, once validated, can be used to investigate the
behavior of the system. By changing either the simulation’s inputs or the model’s
characteristics, it is possible to evaluate the impact of changes in the system
(Banks, Nelson, Carson, & Nicol, 1984).
In the past, design evaluations were performed by manual calculations, however
these are time-consuming and error-prone, and with the emergence of
computers, manual calculations were replaced by digital computations. Initial
simulation software was based on counterintuitive methods of interaction, which
prevented its widespread use. However, as the complexity of designs increased,
their performance became less predictable, and evaluation tools more pertinent.
In the past decades, encouraged by a growing complexity in designs and growing
environmental responsibility, and potentiated by increasing computer power,
evaluation software has been improving. Simulation tools have been evolving to
include more accurate and sophisticated methods (Peters & Kestelier, 2013) and
contemporary developments in graphical user-interfaces have been making
analysis software more accessible to designers (Szalapaj, 2005). Additionally,
there is a growing tendency to experiment with computations and develop custom
analysis tools (Peters & Kestelier, 2013).
In performance analysis tools it is necessary to provide, as input to the program,
the analytical model of the building. The analytical model is a simplification of the
system, according to the subject of investigation (Law & Kelton, 1991), i.e., a
model constructed only with the relevant information for the considered analysis,
such as materials for acoustics or surfaces for radiation. Unfortunately, these
analytical models do not coincide with the models produced in modeling tools,
and in most cases cannot be directly extracted from them since not only programs
have portability issues among them, causing information losses (Branco, 2017),
but often analytical models also require additional information that is not
contemplated on geometric models. The maturation of BIM tools might change
this situation, however there is still a lack of interoperability between BIM and
performance analysis tools (Moon, Choi, Kim, & Ryu, 2011). Therefore, analysis
tools require prior work consisting of the preparation of the analytical model,
either by constructing from scratch or translating from a pre-existing one, which
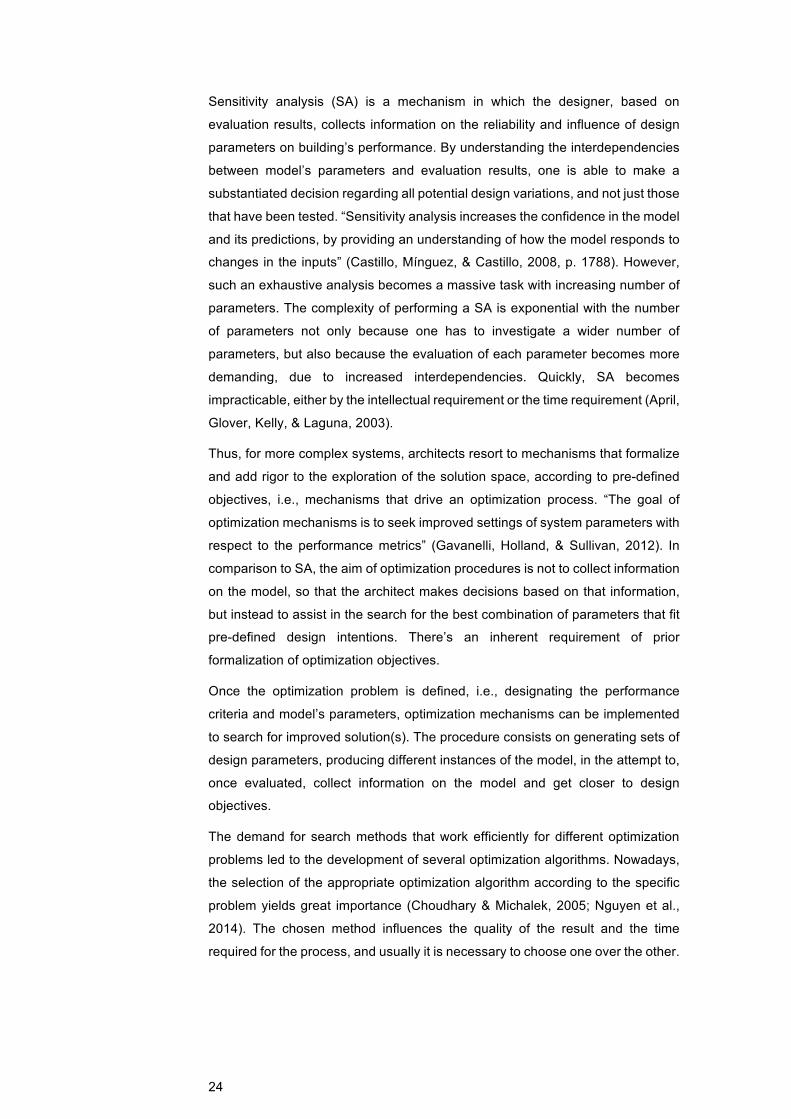
Figure 2.5 Comparison of theanalysisgeneratedbyDIVA (up)andthecorrectone(down)
(Leitãoetal.,2017)

23
may require extensive manual work. This redundant remodeling inhibits not only
the exploration of design alternatives, as well as multi-criteria evaluations, since
different analysis tools require different analytical models. Moreover, in some
circumstances, the analysis tools cannot cope with complex geometry (Aguiar,
Cardoso, & Leitão, 2017; Leitão et al., 2017) (Figure 2.5), which usually forces
the designer to remodel a simplified version of the design for evaluation purposes,
which besides requiring additional manual work, might produce untrustworthy
results.
Another setback of analysis tools is the difficulty of data interpretation. The output
of simulation tools usually requires expert translation, which generates problems
of both time and money, since it not only implies hiring these experts as it also
requires establishing the communication between the parties involved (Malkawi,
2004).
In the context of PBD, in which the designer continuously resorts to analysis tools
in a dynamic way, the amount of work and time required pre- and post-analysis
strongly inhibits the potential of the approach. Moreover, depending on the
complexity of the design, simulations can require a significant amount of time and
computational power, which also works as a constraint to the number of
evaluations.
Finally, the potential to evaluate different scenarios and the success of the PBD
is dependent on the use we make of the collected information from evaluations.
Defining the next iteration inputs, based on previous analysis outputs and
according to pre-defined performance targets, is not a trivial task. In the context
of shifting from a conventional use of simulation tools to a context of PBD it is
useful to resort to decision support and optimization techniques (Malkawi, 2004).
ANALYSIS
In context of PBD, the purpose of resorting to evaluation tools is to provide design
decision-makers with pertinent information, that will assist them in making
conscious decisions regarding performance criteria.
There are different mechanisms through which designers can collect information
from evaluation results. The most direct/intuitive approach is to test scenarios of
interest and make decisions based on the comparison of results. However, in
only testing specific design solutions, one becomes restricted to choose among
the tested ones, taking the risk of missing on better performing alternatives that
were not tested. Additionally, with increasing number of potential variations, the
identification of scenarios of interest becomes a challenging task,
24
Sensitivity analysis (SA) is a mechanism in which the designer, based on
evaluation results, collects information on the reliability and influence of design
parameters on building’s performance. By understanding the interdependencies
between model’s parameters and evaluation results, one is able to make a
substantiated decision regarding all potential design variations, and not just those
that have been tested. “Sensitivity analysis increases the confidence in the model
and its predictions, by providing an understanding of how the model responds to
changes in the inputs” (Castillo, Mínguez, & Castillo, 2008, p. 1788). However,
such an exhaustive analysis becomes a massive task with increasing number of
parameters. The complexity of performing a SA is exponential with the number
of parameters not only because one has to investigate a wider number of
parameters, but also because the evaluation of each parameter becomes more
demanding, due to increased interdependencies. Quickly, SA becomes
impracticable, either by the intellectual requirement or the time requirement (April,
Glover, Kelly, & Laguna, 2003).
Thus, for more complex systems, architects resort to mechanisms that formalize
and add rigor to the exploration of the solution space, according to pre-defined
objectives, i.e., mechanisms that drive an optimization process. “The goal of
optimization mechanisms is to seek improved settings of system parameters with
respect to the performance metrics” (Gavanelli, Holland, & Sullivan, 2012). In
comparison to SA, the aim of optimization procedures is not to collect information
on the model, so that the architect makes decisions based on that information,
but instead to assist in the search for the best combination of parameters that fit
pre-defined design intentions. There’s an inherent requirement of prior
formalization of optimization objectives.
Once the optimization problem is defined, i.e., designating the performance
criteria and model’s parameters, optimization mechanisms can be implemented
to search for improved solution(s). The procedure consists on generating sets of
design parameters, producing different instances of the model, in the attempt to,
once evaluated, collect information on the model and get closer to design
objectives.
The demand for search methods that work efficiently for different optimization
problems led to the development of several optimization algorithms. Nowadays,
the selection of the appropriate optimization algorithm according to the specific
problem yields great importance (Choudhary & Michalek, 2005; Nguyen et al.,
2014). The chosen method influences the quality of the result and the time
required for the process, and usually it is necessary to choose one over the other.
25
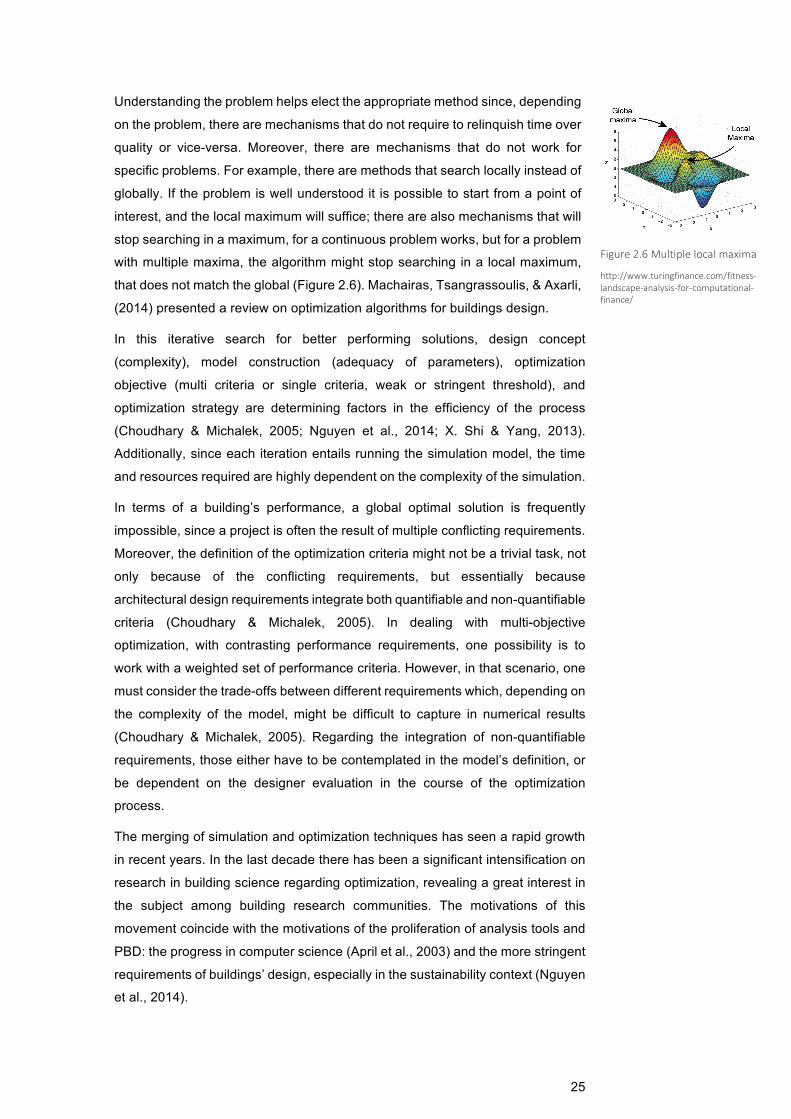
Understanding the problem helps elect the appropriate method since, depending
on the problem, there are mechanisms that do not require to relinquish time over
quality or vice-versa. Moreover, there are mechanisms that do not work for
specific problems. For example, there are methods that search locally instead of
globally. If the problem is well understood it is possible to start from a point of
interest, and the local maximum will suffice; there are also mechanisms that will
stop searching in a maximum, for a continuous problem works, but for a problem
with multiple maxima, the algorithm might stop searching in a local maximum,
that does not match the global (Figure 2.6). Machairas, Tsangrassoulis, & Axarli,
(2014) presented a review on optimization algorithms for buildings design.
In this iterative search for better performing solutions, design concept
(complexity), model construction (adequacy of parameters), optimization
objective (multi criteria or single criteria, weak or stringent threshold), and
optimization strategy are determining factors in the efficiency of the process
(Choudhary & Michalek, 2005; Nguyen et al., 2014; X. Shi & Yang, 2013).
Additionally, since each iteration entails running the simulation model, the time
and resources required are highly dependent on the complexity of the simulation.
In terms of a building’s performance, a global optimal solution is frequently
impossible, since a project is often the result of multiple conflicting requirements.
Moreover, the definition of the optimization criteria might not be a trivial task, not
only because of the conflicting requirements, but essentially because
architectural design requirements integrate both quantifiable and non-quantifiable
criteria (Choudhary & Michalek, 2005). In dealing with multi-objective
optimization, with contrasting performance requirements, one possibility is to
work with a weighted set of performance criteria. However, in that scenario, one
must consider the trade-offs between different requirements which, depending on
the complexity of the model, might be difficult to capture in numerical results
(Choudhary & Michalek, 2005). Regarding the integration of non-quantifiable
requirements, those either have to be contemplated in the model’s definition, or
be dependent on the designer evaluation in the course of the optimization
process.
The merging of simulation and optimization techniques has seen a rapid growth
in recent years. In the last decade there has been a significant intensification on
research in building science regarding optimization, revealing a great interest in
the subject among building research communities. The motivations of this
movement coincide with the motivations of the proliferation of analysis tools and
PBD: the progress in computer science (April et al., 2003) and the more stringent
requirements of buildings’ design, especially in the sustainability context (Nguyen
et al., 2014).
Figure2.6Multiplelocalmaxima
http://www.turingfinance.com/fitness-landscape-analysis-for-computational-finance/
26
Even though optimization has been receiving a lot of attention, applications in
real-world projects are still embryonic (Choudhary & Michalek, 2005; Nguyen et
al., 2014). Difficulties in coupling evaluation tools with optimization “engines”;
trade-offs of optimization methods (e.g. accuracy vs simplicity; capability vs
usability; efficiency vs time cost); and limits of computation speed are some of
the current barriers to the widespread use of optimization techniques
(Andradóttir, 1998; Nguyen et al., 2014).
WORKFLOW
A PBD approach requires the continuous flow of information between the different
parties involved in the process. Because these different parties are usually
assigned to different tools, which require different formats, there is a non-trivial
amount of information that is lost in the translation processes or has to be
manually transferred (Branco, 2017).
To overcome portability issues, some modeling and analysis tools are coupled,
i.e., the analytical model is derived from the modeling tool to which is connected.
However, in these circumstances, the user is restricted to the provided tools,
which may not fit the project requirements. Additionally, even in contexts in which
a software has a coupled analysis engine that suits him, in most scenarios, he
still has to produce a simplified version of the model (Leitão et al., 2017).
As this approach is rather limiting on the tools’ choice, there are mechanisms that
aim to control the exchange of information between different tools. The Industry
Foundation Classes (IFC) was developed with the intent of being a universal
generic model for the AEC industries. Data sharing is achieved by mapping the
relevant information within each program to a mutual data model that comprises
information required by all other programs (Malkawi, 2004). However, IFC is still
not fully effective since sometimes specific analysis information does not have a
corresponding definition (Wan, Chen, & Tiong, 2004). On the other side, the
construction of a model that contains the data required to support sharing of
information between all the software tools used by building professionals would
be an extensive task (Malkawi, 2004).
A different approach to cope with interoperability between tools is the
development of an algorithmic description of the design. Even though
programming tools are not universal, i.e., they can only communicate to specific
software (Ferreira & Leitão, 2004), there are already algorithmic design tools that
allow to generate models in different software applications, thus overcoming
miscommunication between tools. Additionally, there are several plug-ins for
programming tools that increase their range of application, as it happens with
Ladybug for Grasshopper.
27
The inefficient exchange of information between tools is one of the drawbacks of
PBD, as it requires manual intervention in each iteration, thus inhibiting the
number of iterations and, consequently, the success of the approach.
PERFORMANCE-BASED DESIGN FOR EVACUATION
PBD is a design approach that emphasizes building’s performance. The purpose
is to have an informed design process that produces an optimized version of the
design, regarding pre-defined performance criteria. PBD has been growing
framed in the greater environmental awareness currently affecting the AEC
industries. Not only there is a motivation for developing low-energy buildings, but
there is also a growing trend to develop high-performance buildings such as
green buildings, passive houses, zero-carbon buildings, and net zero-energy
buildings (Nguyen et al., 2014). Even though energy-related performances have
been the main focus of PBD, it is now used in several distinct contexts, e.g.,
acoustic performance (Spaeth & Menges, 2011), structural performance
(Ganzerli, Pantelides, & Reaveley, 2000), and aerodynamic performance (Petrini
& Ciampoli, 2012). The scope of the approach is only dependent on the
availability of evaluation tools.
Evacuation simulation is another important performance criterion that has been
gaining a lot of attention in recent years, promoted by the urgency of increasing
safety in public spaces. The main obstacle to the development of evacuation
simulation tools is the fact that one needs to model human behavior, which is not
a trivial task. On the one side, there is great complexity associated and, on the
other side, there is insufficient data to cope with it. Nevertheless, in recent years
several evacuation simulation models were developed, each with distinct
characteristics and specialties.
The application of PBD to evacuation performance purposes is still rather
unexplored, partially because practical evacuation simulation tools emerged only
recently and, partially, because differently from other performance criteria that
affect the everyday use of the building, evacuation performance is only relevant
when a dramatic situation occurs.
In this work, we are interest in exploring the application of PBD with evacuation
performance concerns. In the next section we will discuss the state of the art of
evacuation simulation.
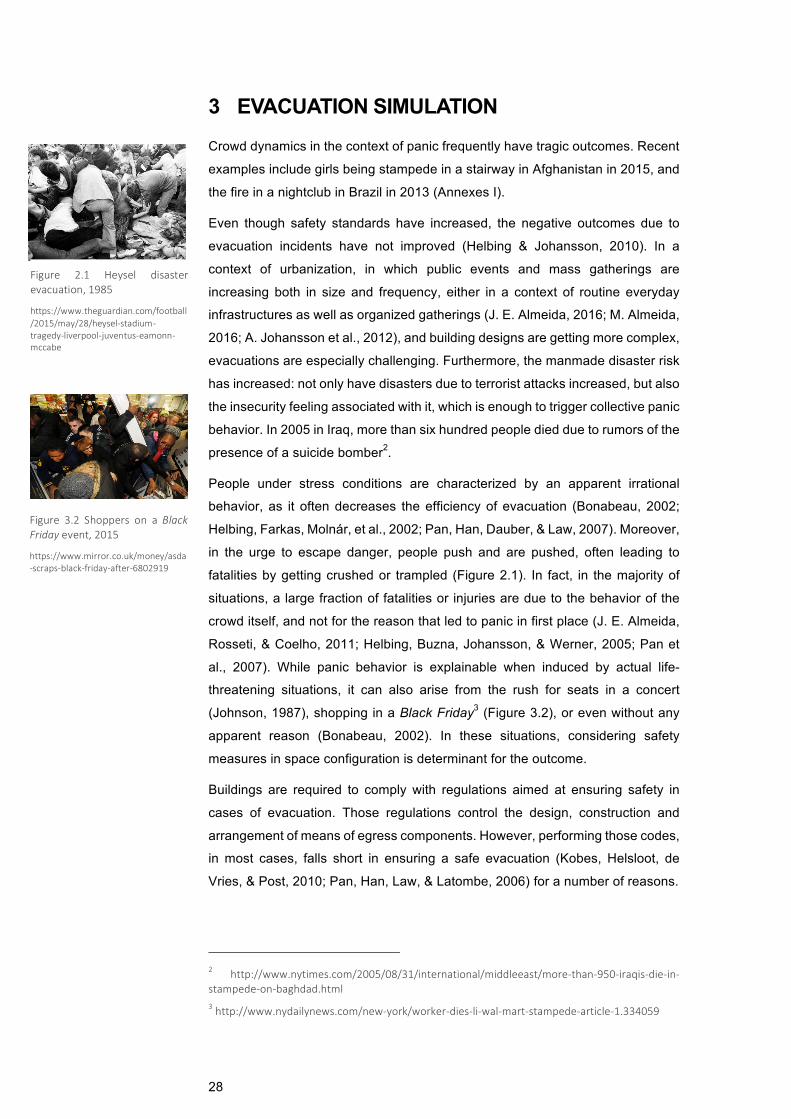
28
3 EVACUATION SIMULATION Crowd dynamics in the context of panic frequently have tragic outcomes. Recent
examples include girls being stampede in a stairway in Afghanistan in 2015, and
the fire in a nightclub in Brazil in 2013 (Annexes I).
Even though safety standards have increased, the negative outcomes due to
evacuation incidents have not improved (Helbing & Johansson, 2010). In a
context of urbanization, in which public events and mass gatherings are
increasing both in size and frequency, either in a context of routine everyday
infrastructures as well as organized gatherings (J. E. Almeida, 2016; M. Almeida,
2016; A. Johansson et al., 2012), and building designs are getting more complex,
evacuations are especially challenging. Furthermore, the manmade disaster risk
has increased: not only have disasters due to terrorist attacks increased, but also
the insecurity feeling associated with it, which is enough to trigger collective panic
behavior. In 2005 in Iraq, more than six hundred people died due to rumors of the
presence of a suicide bomber2.
People under stress conditions are characterized by an apparent irrational
behavior, as it often decreases the efficiency of evacuation (Bonabeau, 2002;
Helbing, Farkas, Molnár, et al., 2002; Pan, Han, Dauber, & Law, 2007). Moreover,
in the urge to escape danger, people push and are pushed, often leading to
fatalities by getting crushed or trampled (Figure 2.1). In fact, in the majority of
situations, a large fraction of fatalities or injuries are due to the behavior of the
crowd itself, and not for the reason that led to panic in first place (J. E. Almeida,
Rosseti, & Coelho, 2011; Helbing, Buzna, Johansson, & Werner, 2005; Pan et
al., 2007). While panic behavior is explainable when induced by actual life-
threatening situations, it can also arise from the rush for seats in a concert
(Johnson, 1987), shopping in a Black Friday3 (Figure 3.2), or even without any
apparent reason (Bonabeau, 2002). In these situations, considering safety
measures in space configuration is determinant for the outcome.
Buildings are required to comply with regulations aimed at ensuring safety in
cases of evacuation. Those regulations control the design, construction and
arrangement of means of egress components. However, performing those codes,
in most cases, falls short in ensuring a safe evacuation (Kobes, Helsloot, de
Vries, & Post, 2010; Pan, Han, Law, & Latombe, 2006) for a number of reasons.
2 http://www.nytimes.com/2005/08/31/international/middleeast/more-than-950-iraqis-die-in-stampede-on-baghdad.html3http://www.nydailynews.com/new-york/worker-dies-li-wal-mart-stampede-article-1.334059
Figure 3.2 Shoppers on a BlackFridayevent,2015
https://www.mirror.co.uk/money/asda-scraps-black-friday-after-6802919
Figure 2.1 Heysel disasterevacuation,1985
https://www.theguardian.com/football/2015/may/28/heysel-stadium-tragedy-liverpool-juventus-eamonn-mccabe

29
First, official measures usually do not take into consideration human behavioral
factors, e.g., in the International Building Code the methods for calculating the
number, width, and distributions of exits are based on the assumption that
occupants would evenly utilize all available exits in case of an emergency, which
does not correspond to reality. Second, existing regulations are based on
outdated data. In the last forty years the proportions of elderly and obese have
changed. Both age and size affect the flow of evacuation, thus existing design
calculations for building safety need revision according to new demographics
(Thompson, Nilsson, Boyce, & McGrath, 2015). Finally, each building is unique
and while some measures are general, such as the number of emergency exits,
others are context-specific, such as the best location for those exits. Moreover,
there are several different scenarios that must be considered. The best solution
for each situation may not be evident, especially for complex designs.
Unfortunately, traditional evaluation methods, namely post-construction drills, are
quite limited. Primarily, the analysis is inadequate in the sense that, for ethical
reasons it is not possible to induce panic and expose real people to dangerous
environments (Pan et al., 2007). Thus, such simulations lack of realism and are
no good to provide useful information on what would happen in the event of real
emergency (Gwynne, Galea, Owen, & Lawrence, 1999). Second, post-
construction performance evaluations restrict the potential of design modification,
since construction is already completed. Third, the costs of holding the
experiments are sometimes prohibitive (J. Shi, Ren, & Chen, 2009). Finally,
when evacuation drills are performed, usually only one trial is undertaken. A
single experiment does not provide much confidence of the validity of the results
and, in accessing the evacuation performance there are often multiple
emergency scenarios that must be considered. Moreover, in a design point of
view, a single trial does not provide enough information to guide optimization. The
generation of trustworthy and useful results requires the execution of multiple
drills (Gwynne et al., 1999). Simulation through computation has the potential to
overcome these problems since it allows the quick evaluation of different
scenarios, at different stages of the design process and with less expenses.
Scientific progress allied to the growth in computational power have led to the
development of new modeling and simulation tools. Evacuation calculations are
increasingly becoming part of building analysis in order to assess and improve
the evacuation performance in case of emergency, especially framed in a new
generation of large and complex buildings (Kuligowski, Peacock, & Hoskins,
2010; Santos & Aguirre, 2004). The first international conference on Pedestrian
and Evacuation Dynamics happened in 2001, in Germany, evidencing a growing
interest in the subject (Bierlaire, Antonini, & Weber, 2003).

30
Nowadays several evacuation simulation models available can assess the
evacuation performance of a specific building. To help users select the one that
best suits the project at hand, there is some work done in reviewing and
comparing those models. However, given the fact that this is currently a hot
research field, existing models soon become outdated. At an accelerated pace,
new models are developed and old ones are discontinued and the state of art
quickly needs to be revised.
The main interest in modeling evacuations lies in the possibility of increasing
safety, both in the stage of designing spaces and egress components, as well as
on the organization of mass events. In the design stage, simulation allows to
identify problematic areas as well as, by means of optimization techniques,
improve the overall safety performance. In matters of active and passive safety
elements, it is possible to determine what is the appropriate number of people
that a space can safely accommodate, it can assist in conceiving evacuation
strategies, and it can also be used to train staff on potential evacuation scenarios
(Jain & McLean, 2008). Simulation can assist in improving safety for the specific
situation at hand (Helbing & Johansson, 2010), reducing the number of injured or
dead people in case of emergency.
For example, the Nothing Hill Carnival is an event held every year, in UK. It
consists of a parade with entertainment associated that aims to celebrate cultural
diversity. Nowadays the event attracts more than one million visitors, thus being
a major event regarding crowd control. A pedestrian model was used to simulate
and assess alternative routes for the parade and, in the end, one of the simulated
routes was chosen as the actual route for the parade (Batty, Desyllas, & Duxbury,
2003). Another example is the Hajj (Figure 3.3), the annual Muslim pilgrimage to
Mecca, which attracts about three million pilgrims during one week, “It is very
crowded, with millions of pilgrims undertaking their religious duties within strict
constraints in terms of space and time” (A. Johansson et al., 2012, p. 150). These
conditions led to large crowd disasters over the years (Annexes I). Simulation
studies were also used in the context of the Hajj and from those, several important
improvements have been implemented (A. Johansson et al., 2012).
MODELING PEDESTRIAN CROWDS
There are different aspects that interfere in the outcome of an evacuation: the
architecture of the place, nature and context of the incident (e.g., fire,
earthquake, rumors of danger), organization and response (active and passive
systems) and finally, human behavior (Santos & Aguirre, 2004; Wagner &
Agrawal, 2014).
Figure3.3Muslimpilgrimsinthe2015Hajj
https://www.wired.com/2015/09/hajj-stampede-fluid-dynamics-problem/
31
Human crowds display a variety of self-organized behaviors, which vary
according to the context. For example, (1) in normal situations there is
spontaneous formation of unidirectional lanes in bidirectional pedestrian flows;
(2) under high densities there are dynamics such as stop-and-go waves and
crowd turbulence; (3) under emergency circumstances, panic is associated with
herding behavior. These collective dynamics have a profound impact on the flow
of people in the space, thus finding a realistic description of collective human
motion is highly relevant in the context of evacuation simulation (Moussaïd et al.,
2011).
Pedestrians’ dynamics have been studied, from an empirical perspective, for
more than five decades. However, over the last couple of decades, the interest
in the subject has increased significantly. The increasing frequency and size of
crowd disasters is one of the main motivations for research (Chen, 2017; Helbing,
Johansson, & Al-Abideen, 2007; Moussaïd et al., 2011), however the potential
applications are numerous, and pedestrian behavior simulation has been
attracting both the scientific community as well as practitioners and the industry,
from a variety of disciplines. Greater interest, combined with the opportunities
that increased computer power allows, have recently made of pedestrian and
crowd simulation a key research area (F. Johansson, Peterson, & Tapani, 2015;
Physik & Kretz, 2007). It is a challenging interdisciplinary research field,
motivated by the relevance of its potential practical applications.
According to Pan et al., (2007) there are three main purposes for the development
of computer simulations for pedestrian dynamics: (1) test scientific theories and
hypothesis, (2) test design strategies, and (3) create phenomena about which to
theorize. From this list the author excluded applications in the entertainment
industry. Indeed, evacuation simulations are the major focus of pedestrian
dynamics research (Bierlaire et al., 2003). Not restricted to buildings, contexts
such as cities, planes, trains, and even ships are nowadays designed with safety
concerns, resorting to especially developed simulators. However, evacuation is
only one example of an application, and modeling pedestrian behavior under
“normal” circumstances has several applications on its own. For example, still
within the context of architecture, modeling artificial crowds is useful by providing
guidelines in the design of a shopping mall to make circulation more convenient
to costumers; it is also useful in the context of urban planning, e.g., by studying
the city layout in line with intermodal stations, as well as traffic. More examples
of contexts include land-use (Parker, Manson, Janssen, Hoffmann, & Deadman,
2004), marketing (Borgers & Timmermans, 1986); or even entertainment
software (Figure 3.4) (Egges, Geraerts, & Overmars, 2006).
Figure3.4 Sims3Game
https://www.newscientist.com/article/mg21829235-800-ai-makes-social-game-characters-all-too-human/
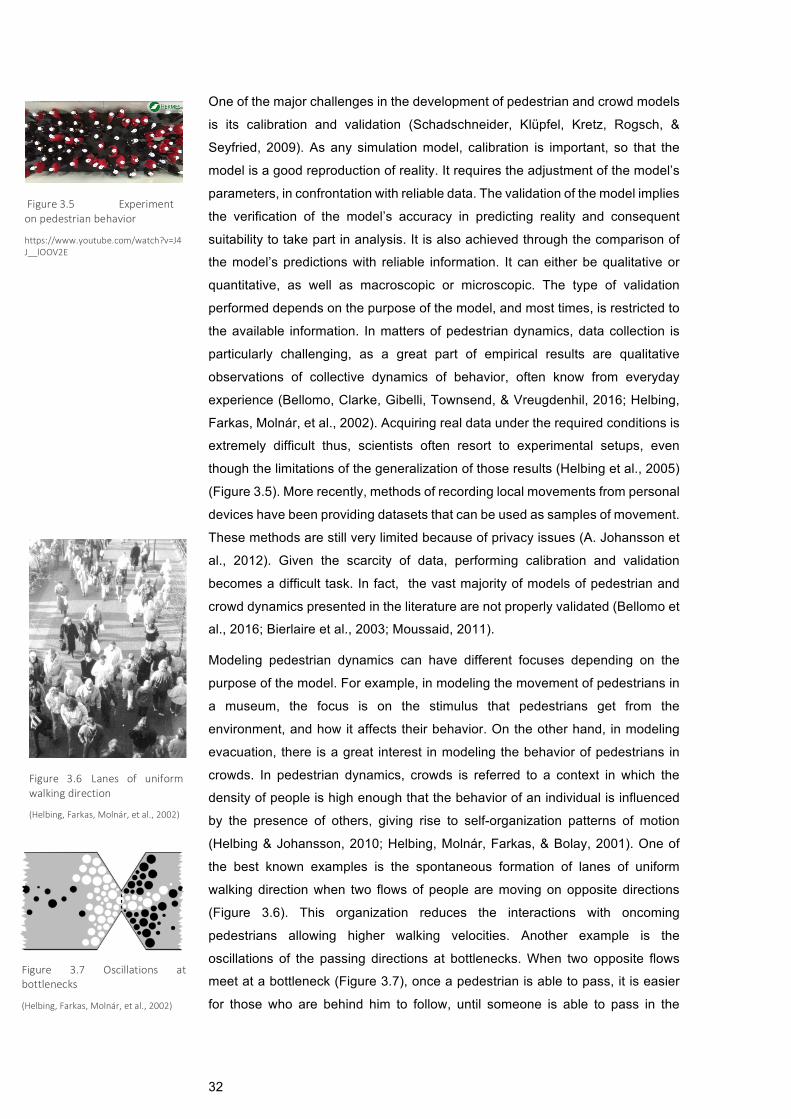
32
One of the major challenges in the development of pedestrian and crowd models
is its calibration and validation (Schadschneider, Klüpfel, Kretz, Rogsch, &
Seyfried, 2009). As any simulation model, calibration is important, so that the
model is a good reproduction of reality. It requires the adjustment of the model’s
parameters, in confrontation with reliable data. The validation of the model implies
the verification of the model’s accuracy in predicting reality and consequent
suitability to take part in analysis. It is also achieved through the comparison of
the model’s predictions with reliable information. It can either be qualitative or
quantitative, as well as macroscopic or microscopic. The type of validation
performed depends on the purpose of the model, and most times, is restricted to
the available information. In matters of pedestrian dynamics, data collection is
particularly challenging, as a great part of empirical results are qualitative
observations of collective dynamics of behavior, often know from everyday
experience (Bellomo, Clarke, Gibelli, Townsend, & Vreugdenhil, 2016; Helbing,
Farkas, Molnár, et al., 2002). Acquiring real data under the required conditions is
extremely difficult thus, scientists often resort to experimental setups, even
though the limitations of the generalization of those results (Helbing et al., 2005)
(Figure 3.5). More recently, methods of recording local movements from personal
devices have been providing datasets that can be used as samples of movement.
These methods are still very limited because of privacy issues (A. Johansson et
al., 2012). Given the scarcity of data, performing calibration and validation
becomes a difficult task. In fact, the vast majority of models of pedestrian and
crowd dynamics presented in the literature are not properly validated (Bellomo et
al., 2016; Bierlaire et al., 2003; Moussaid, 2011).
Modeling pedestrian dynamics can have different focuses depending on the
purpose of the model. For example, in modeling the movement of pedestrians in
a museum, the focus is on the stimulus that pedestrians get from the
environment, and how it affects their behavior. On the other hand, in modeling
evacuation, there is a great interest in modeling the behavior of pedestrians in
crowds. In pedestrian dynamics, crowds is referred to a context in which the
density of people is high enough that the behavior of an individual is influenced
by the presence of others, giving rise to self-organization patterns of motion
(Helbing & Johansson, 2010; Helbing, Molnár, Farkas, & Bolay, 2001). One of
the best known examples is the spontaneous formation of lanes of uniform
walking direction when two flows of people are moving on opposite directions
(Figure 3.6). This organization reduces the interactions with oncoming
pedestrians allowing higher walking velocities. Another example is the
oscillations of the passing directions at bottlenecks. When two opposite flows
meet at a bottleneck (Figure 3.7), once a pedestrian is able to pass, it is easier
for those who are behind him to follow, until someone is able to pass in the
Figure 3.7 Oscillations atbottlenecks
(Helbing,Farkas,Molnár,etal.,2002)
Figure3.5 Experimentonpedestrianbehavior
https://www.youtube.com/watch?v=J4J__lOOV2E
Figure 3.6 Lanes of uniformwalkingdirection
(Helbing,Farkas,Molnár,etal.,2002)
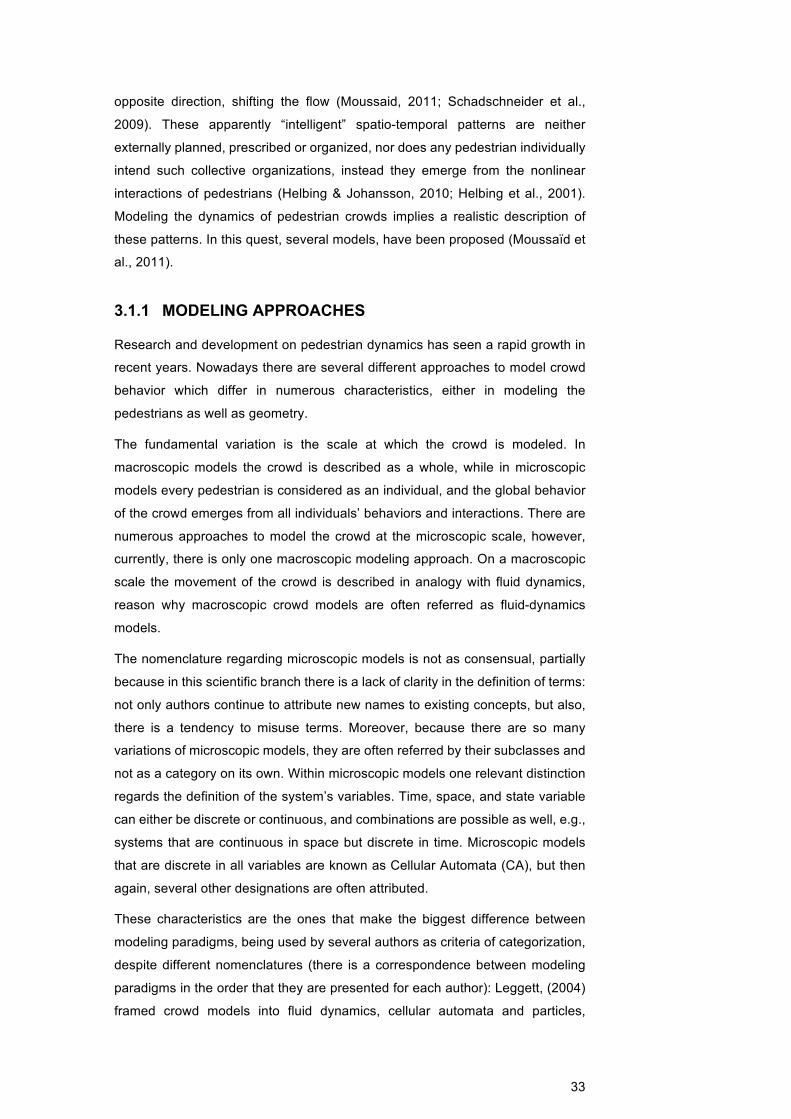
33
opposite direction, shifting the flow (Moussaid, 2011; Schadschneider et al.,
2009). These apparently “intelligent” spatio-temporal patterns are neither
externally planned, prescribed or organized, nor does any pedestrian individually
intend such collective organizations, instead they emerge from the nonlinear
interactions of pedestrians (Helbing & Johansson, 2010; Helbing et al., 2001).
Modeling the dynamics of pedestrian crowds implies a realistic description of
these patterns. In this quest, several models, have been proposed (Moussaïd et
al., 2011).
3.1.1 MODELING APPROACHES
Research and development on pedestrian dynamics has seen a rapid growth in
recent years. Nowadays there are several different approaches to model crowd
behavior which differ in numerous characteristics, either in modeling the
pedestrians as well as geometry.
The fundamental variation is the scale at which the crowd is modeled. In
macroscopic models the crowd is described as a whole, while in microscopic
models every pedestrian is considered as an individual, and the global behavior
of the crowd emerges from all individuals’ behaviors and interactions. There are
numerous approaches to model the crowd at the microscopic scale, however,
currently, there is only one macroscopic modeling approach. On a macroscopic
scale the movement of the crowd is described in analogy with fluid dynamics,
reason why macroscopic crowd models are often referred as fluid-dynamics
models.
The nomenclature regarding microscopic models is not as consensual, partially
because in this scientific branch there is a lack of clarity in the definition of terms:
not only authors continue to attribute new names to existing concepts, but also,
there is a tendency to misuse terms. Moreover, because there are so many
variations of microscopic models, they are often referred by their subclasses and
not as a category on its own. Within microscopic models one relevant distinction
regards the definition of the system’s variables. Time, space, and state variable
can either be discrete or continuous, and combinations are possible as well, e.g.,
systems that are continuous in space but discrete in time. Microscopic models
that are discrete in all variables are known as Cellular Automata (CA), but then
again, several other designations are often attributed.
These characteristics are the ones that make the biggest difference between
modeling paradigms, being used by several authors as criteria of categorization,
despite different nomenclatures (there is a correspondence between modeling
paradigms in the order that they are presented for each author): Leggett, (2004)
framed crowd models into fluid dynamics, cellular automata and particles,
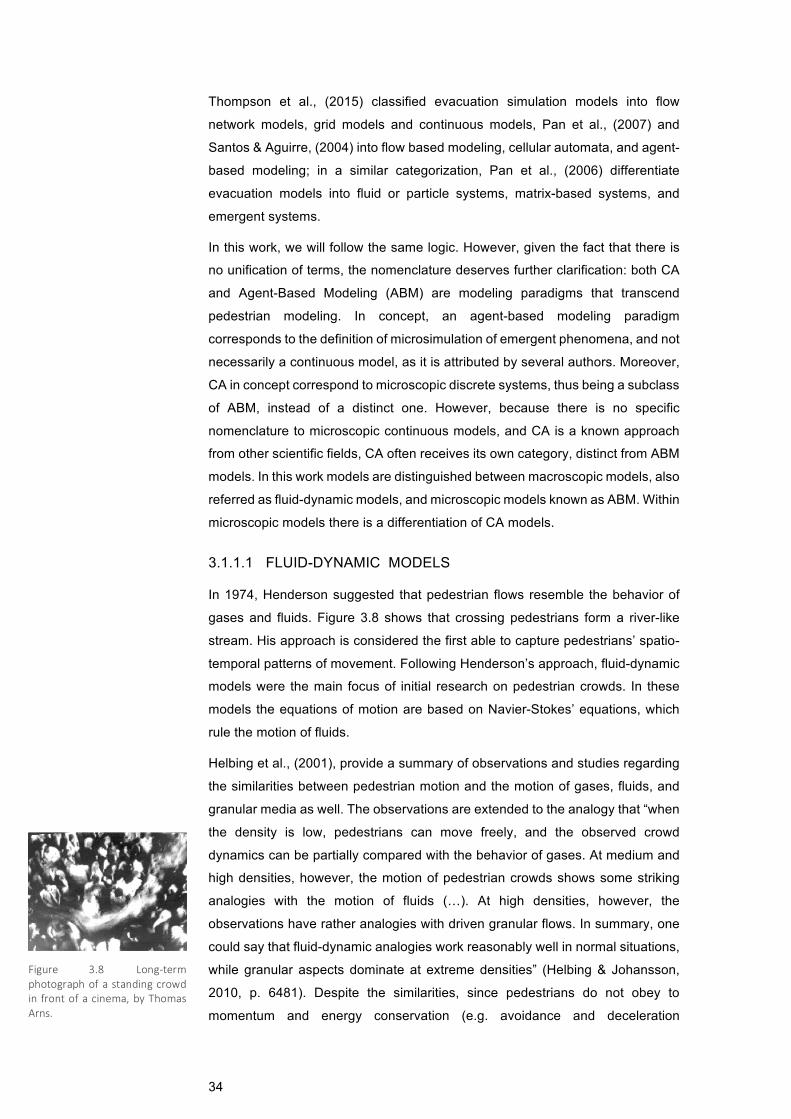
34
Thompson et al., (2015) classified evacuation simulation models into flow
network models, grid models and continuous models, Pan et al., (2007) and
Santos & Aguirre, (2004) into flow based modeling, cellular automata, and agent-
based modeling; in a similar categorization, Pan et al., (2006) differentiate
evacuation models into fluid or particle systems, matrix-based systems, and
emergent systems.
In this work, we will follow the same logic. However, given the fact that there is
no unification of terms, the nomenclature deserves further clarification: both CA
and Agent-Based Modeling (ABM) are modeling paradigms that transcend
pedestrian modeling. In concept, an agent-based modeling paradigm
corresponds to the definition of microsimulation of emergent phenomena, and not
necessarily a continuous model, as it is attributed by several authors. Moreover,
CA in concept correspond to microscopic discrete systems, thus being a subclass
of ABM, instead of a distinct one. However, because there is no specific
nomenclature to microscopic continuous models, and CA is a known approach
from other scientific fields, CA often receives its own category, distinct from ABM
models. In this work models are distinguished between macroscopic models, also
referred as fluid-dynamic models, and microscopic models known as ABM. Within
microscopic models there is a differentiation of CA models.
3.1.1.1 FLUID-DYNAMIC MODELS
In 1974, Henderson suggested that pedestrian flows resemble the behavior of
gases and fluids. Figure 3.8 shows that crossing pedestrians form a river-like
stream. His approach is considered the first able to capture pedestrians’ spatio-
temporal patterns of movement. Following Henderson’s approach, fluid-dynamic
models were the main focus of initial research on pedestrian crowds. In these
models the equations of motion are based on Navier-Stokes’ equations, which
rule the motion of fluids.
Helbing et al., (2001), provide a summary of observations and studies regarding
the similarities between pedestrian motion and the motion of gases, fluids, and
granular media as well. The observations are extended to the analogy that “when
the density is low, pedestrians can move freely, and the observed crowd
dynamics can be partially compared with the behavior of gases. At medium and
high densities, however, the motion of pedestrian crowds shows some striking
analogies with the motion of fluids (…). At high densities, however, the
observations have rather analogies with driven granular flows. In summary, one
could say that fluid-dynamic analogies work reasonably well in normal situations,
while granular aspects dominate at extreme densities” (Helbing & Johansson,
2010, p. 6481). Despite the similarities, since pedestrians do not obey to
momentum and energy conservation (e.g. avoidance and deceleration
Figure 3.8 Long-termphotographofastandingcrowdinfrontofacinema,byThomasArns.
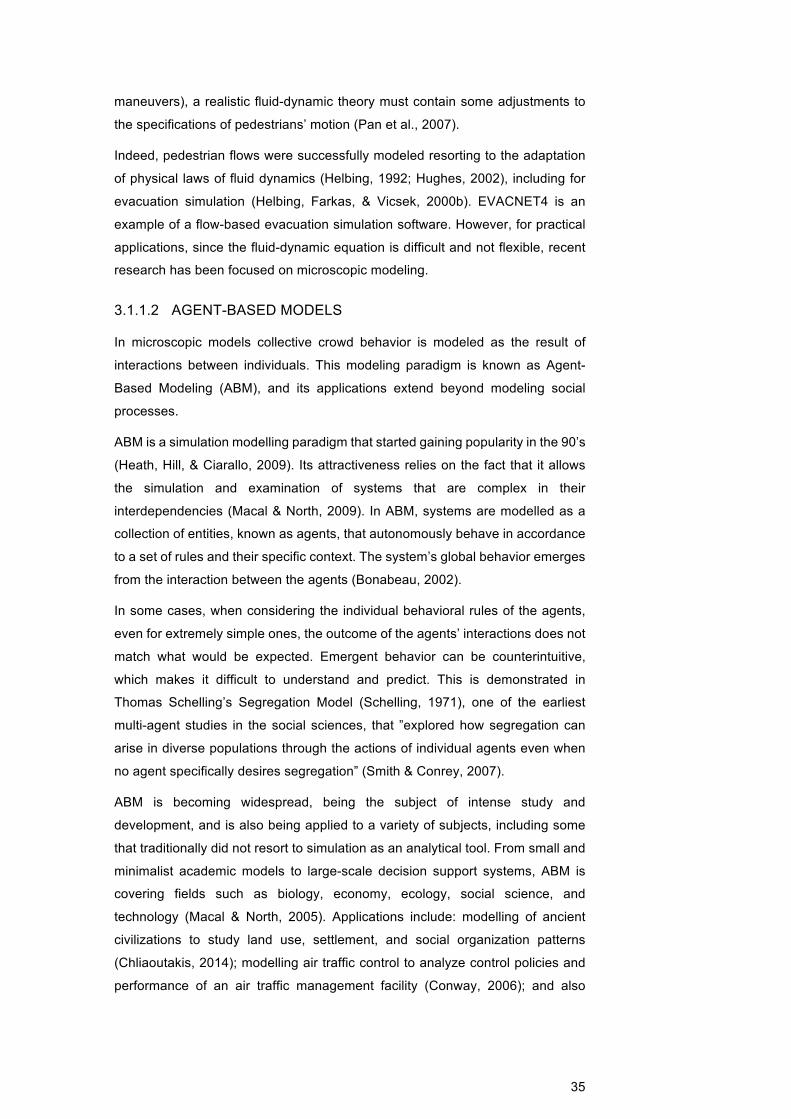
35
maneuvers), a realistic fluid-dynamic theory must contain some adjustments to
the specifications of pedestrians’ motion (Pan et al., 2007).
Indeed, pedestrian flows were successfully modeled resorting to the adaptation
of physical laws of fluid dynamics (Helbing, 1992; Hughes, 2002), including for
evacuation simulation (Helbing, Farkas, & Vicsek, 2000b). EVACNET4 is an
example of a flow-based evacuation simulation software. However, for practical
applications, since the fluid-dynamic equation is difficult and not flexible, recent
research has been focused on microscopic modeling.
3.1.1.2 AGENT-BASED MODELS
In microscopic models collective crowd behavior is modeled as the result of
interactions between individuals. This modeling paradigm is known as Agent-
Based Modeling (ABM), and its applications extend beyond modeling social
processes.
ABM is a simulation modelling paradigm that started gaining popularity in the 90’s
(Heath, Hill, & Ciarallo, 2009). Its attractiveness relies on the fact that it allows
the simulation and examination of systems that are complex in their
interdependencies (Macal & North, 2009). In ABM, systems are modelled as a
collection of entities, known as agents, that autonomously behave in accordance
to a set of rules and their specific context. The system’s global behavior emerges
from the interaction between the agents (Bonabeau, 2002).
In some cases, when considering the individual behavioral rules of the agents,
even for extremely simple ones, the outcome of the agents’ interactions does not
match what would be expected. Emergent behavior can be counterintuitive,
which makes it difficult to understand and predict. This is demonstrated in
Thomas Schelling’s Segregation Model (Schelling, 1971), one of the earliest
multi-agent studies in the social sciences, that ”explored how segregation can
arise in diverse populations through the actions of individual agents even when
no agent specifically desires segregation” (Smith & Conrey, 2007).
ABM is becoming widespread, being the subject of intense study and
development, and is also being applied to a variety of subjects, including some
that traditionally did not resort to simulation as an analytical tool. From small and
minimalist academic models to large-scale decision support systems, ABM is
covering fields such as biology, economy, ecology, social science, and
technology (Macal & North, 2005). Applications include: modelling of ancient
civilizations to study land use, settlement, and social organization patterns
(Chliaoutakis, 2014); modelling air traffic control to analyze control policies and
performance of an air traffic management facility (Conway, 2006); and also

36
modelling land market, which is used to explore the effects of land taxes on the
land use (Filatova, Voinov, & van der Veen, 2011).
Regarding the application of ABM to social processes, agents represent people
or groups of people and agent interactions represent social interactions. “The
fundamental assumption is that people and their social interactions can be
credibly modeled at some reasonable level of abstraction for at least specific and
well-defined purposes, if not in general” (Macal & North, 2005).
One of the greatest advantages of an ABM approach is that it enables great
flexibility, in modeling both the agent as well as the interactions between agents.
This flexibility implies that, on the one hand, it is not compulsory to resort to
generalizations, allowing the simulation to consider heterogeneous samples
(Bierlaire et al., 2003) and, on the other hand, it is possible to progressively adjust
the complexity of the model, at different levels, as it is easy to add more agents
as well as tune and increase the complexity of both the agents and their
interactions. The sophistication of the model depends on its construction, the
agents’ behavior can range from the most primitive to the more complex ones
that already include learning and adaptive algorithms (Bonabeau, 2002; Macal &
North, 2005). The most advanced agent-based models, in the context of social
sciences, integrate models that simulate the reasoning process of humans.
Several authors distinguish these microscopic models according to the level of
“intelligence” of the agents. In the modeling of an agent, its behavior can be
restricted to an operational level in which goals and route are pre-defined and the
agent merely moves reacting to the environment, i.e., avoiding collisions.
Alternatively, the behavior can be dependent on some level of reasoning and
decision making - in other words, operational behavior is dependent on decisions
at the tactical level, concerning destination and route-choice. When agent-based
models integrate some level of intelligence within the modeling of the agent, those
systems are often known as multi-agent systems, however, as usual, other
names are also attributed, such as activity-choice models (Duives, Daamen, &
Hoogendoorn, 2013).
Another important distinction concerns how the interactions of the agent with the
environment are modeled. In this context, models can either be force-based or
rule-based (Schadschneider et al., 2009). In a rule-based approach pedestrians’
behavior is dependent on rules that are a function of their current situation.
Moussaïd et al., (2011) describe the behavior of the pedestrians based on
behavioral heuristics: “guided by visual information, namely the distance of
obstructions in candidate lines of sight, pedestrians apply two simple cognitive
procedures to adapt their walking speeds and directions” (Figure 3.9). Variations
of this approach occur in the mechanisms from which agents assess their
Figure3.10 SocialForceModel
http://futurict.blogspot.pt/2014/12/social-forces-revealing-causes-of.html
Figure3.9 Rule-basedmodel
Moussaïdetal.,(2011)
Illustration of a pedestrian p1facing three other subjects andtrying to reach the destinationpoint O1. The blue areacorrespondstothelineofsight
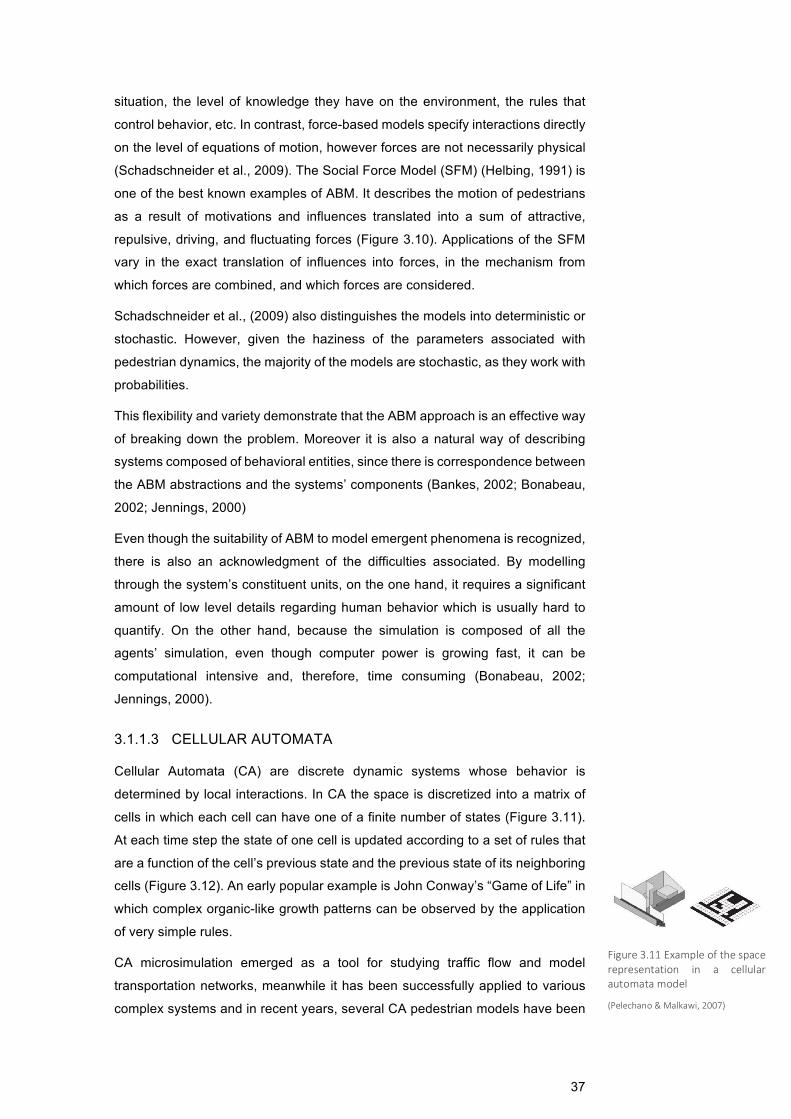
37
situation, the level of knowledge they have on the environment, the rules that
control behavior, etc. In contrast, force-based models specify interactions directly
on the level of equations of motion, however forces are not necessarily physical
(Schadschneider et al., 2009). The Social Force Model (SFM) (Helbing, 1991) is
one of the best known examples of ABM. It describes the motion of pedestrians
as a result of motivations and influences translated into a sum of attractive,
repulsive, driving, and fluctuating forces (Figure 3.10). Applications of the SFM
vary in the exact translation of influences into forces, in the mechanism from
which forces are combined, and which forces are considered.
Schadschneider et al., (2009) also distinguishes the models into deterministic or
stochastic. However, given the haziness of the parameters associated with
pedestrian dynamics, the majority of the models are stochastic, as they work with
probabilities.
This flexibility and variety demonstrate that the ABM approach is an effective way
of breaking down the problem. Moreover it is also a natural way of describing
systems composed of behavioral entities, since there is correspondence between
the ABM abstractions and the systems’ components (Bankes, 2002; Bonabeau,
2002; Jennings, 2000)
Even though the suitability of ABM to model emergent phenomena is recognized,
there is also an acknowledgment of the difficulties associated. By modelling
through the system’s constituent units, on the one hand, it requires a significant
amount of low level details regarding human behavior which is usually hard to
quantify. On the other hand, because the simulation is composed of all the
agents’ simulation, even though computer power is growing fast, it can be
computational intensive and, therefore, time consuming (Bonabeau, 2002;
Jennings, 2000).
3.1.1.3 CELLULAR AUTOMATA
Cellular Automata (CA) are discrete dynamic systems whose behavior is
determined by local interactions. In CA the space is discretized into a matrix of
cells in which each cell can have one of a finite number of states (Figure 3.11).
At each time step the state of one cell is updated according to a set of rules that
are a function of the cell’s previous state and the previous state of its neighboring
cells (Figure 3.12). An early popular example is John Conway’s “Game of Life” in
which complex organic-like growth patterns can be observed by the application
of very simple rules.
CA microsimulation emerged as a tool for studying traffic flow and model
transportation networks, meanwhile it has been successfully applied to various
complex systems and in recent years, several CA pedestrian models have been
Figure3.11Exampleofthespacerepresentation in a cellularautomatamodel
(Pelechano&Malkawi,2007)

38
developed (Blue & Adler, 1999; Dijkstra, Jessurun, & Timmermans, 2001;
Schadschneider, 2001), including evacuation models (Song, Xu, Wang, & Ni,
2005; Varas et al., 2007).
In applying CA to pedestrian modelling, the states of the cells stand for free floor
area, obstacle or pedestrian. In each time step the state of the cells are updated
representing the movement of pedestrians in space. The movement to a
neighboring cell is based on transition probabilities which are function of (1)
desired direction of movement, (2) interactions with other pedestrians, and (3)
interactions with infrastructure, such as walls or doors (Zheng, Zhong, & Liu,
2009) (Figure 3.12).
The major advantages of CA approaches are the ease of implementation and
efficiency (Song, Xu, et al., 2005). However, imposed constraints and
simplifications of the CA paradigm often lead to alternative approaches. There
are two main downsides of a discrete approach: the limitations imposed to
pedestrians’ movement and the difficulties in handling interactions among
pedestrians (Song, Xu, et al., 2005). Regarding pedestrian movement, the
discrete nature of the space implies that first, there is a maximum of eight
potential directions of movement, corresponding to neighbor cells, making
pedestrian movement resemble chess pieces on a checkboard. Second, speed
is limited to discrete values, multiples of the dimension of the cells. Finally, as a
pedestrian moves to a diagonal cell, the corresponding distance is higher than an
orthogonal cell, thus implying adjustments in the velocity. To mitigate these
effects Sarmady, Haron, Mohd Salahudin, & H., (2007) developed a CA with
smaller cell sizes, extending the stepping possibilities during each iteration, thus
allowing a smoother movement, a wider range of potential speeds, and a smaller
difference in the distance travelled. Regarding the properties of the grid,
adaptations include not only the cell’s size, but also the number of stepping
directions (4, 6, or 8) and the location of the grid cells (orthogonally or bee-hive)
(Duives et al., 2013).
Figure3.12ExampleoftheevolutionofanevacuationCAmodel
(Kirchner&Schadschneider,2002)

39
Regarding interactions among pedestrians, the behavior is determined by
neighbor cells thus pedestrians only react to pedestrians in the immediate
neighborhood. Moreover, as pedestrians represent discrete spaces, contact
forces are hard to simulate. Kirchner & Schadschneider, (2002) introduce a
dynamic floor field, inspired on chemotaxis, to model long-ranged interactions
among pedestrians. Regarding contact forces, friction effects have been studied
in different contexts (Kirchner, Klüpfel, Nishinari, Schadschneider, &
Schreckenberg, 2003; Kirchner, Nishinari, & Schadschneider, 2003; Song, Y U,
& F A N, 2005), however real-scale contact forces, especially relevant for
evacuation scenarios, are difficult to consider. Bierlaire et al., (2003), justify the
discharge of the CA approach with ”the fixed regularity of the grid, the
homogeneity of the rules and the limited number of states of each cells”.
Even though several adaptations of CA models were developed to overcome
specific limitations, the additional features that have to be integrated might nullify
its advantages, as the computer power required and the complexity of model
construction increase.
3.1.2 HYBRID MODELS
The choice of one model over another depends on the purpose and context for
which it will be applied, for example, within ABM, CA models are computationally
less intense than continuous models (Kirchner & Schadschneider, 2002) however
they do not contemplate long-ranged forces neither contact forces which are
extremely relevant in evacuation contexts (Parisi & Dorso, 2005). In matters of
scale, microscopic models allow for the setting of individual physical parameters
that are averaged on the macroscopic models. Nevertheless, it might be difficult
to obtain microscale data to support microsimulations (Bellomo et al., 2016).
Within this classification, models are incompatible with each other, i.e., even
though a lot of combinations were developed, it is not possible to combine
macroscopic approaches, in which crowds are treated as fluids, with microscopic
ones that work with individuals. Also within microscopic models, a discrete space
is incompatible with a continuous one, even though some initial approaches to
particles were later adapted to cellular automata (Procházka, Cimler, &
Olševičová, 2015), and vice-versa. Song et al., (2012) and Procházka, Cimler, &
Olševičová, (2015) developed combinations of the CA paradigm with the SFM,
initially developed as a continuous model. This combination captures the high
computational efficiency of a discrete approach with a good description of agents’
interactions.
Within microscopic models, there are several characteristics that can be varied
and combined between models. Because every approach has its pros and cons,
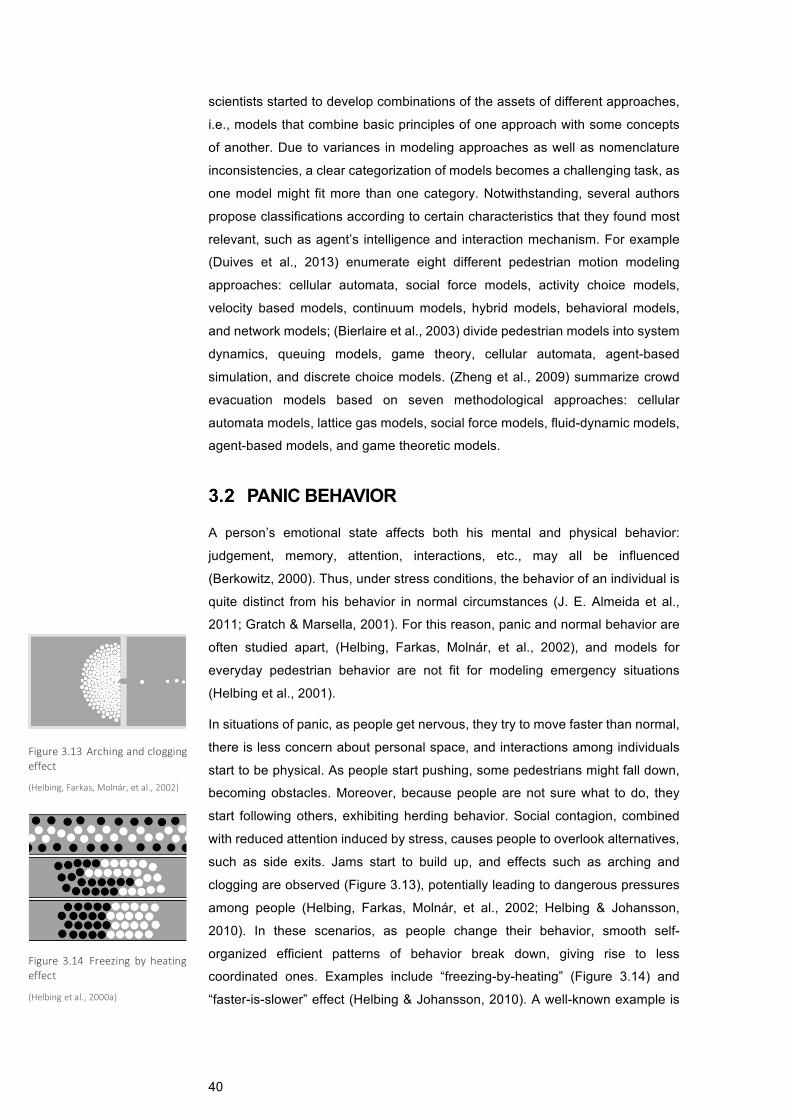
40
scientists started to develop combinations of the assets of different approaches,
i.e., models that combine basic principles of one approach with some concepts
of another. Due to variances in modeling approaches as well as nomenclature
inconsistencies, a clear categorization of models becomes a challenging task, as
one model might fit more than one category. Notwithstanding, several authors
propose classifications according to certain characteristics that they found most
relevant, such as agent’s intelligence and interaction mechanism. For example
(Duives et al., 2013) enumerate eight different pedestrian motion modeling
approaches: cellular automata, social force models, activity choice models,
velocity based models, continuum models, hybrid models, behavioral models,
and network models; (Bierlaire et al., 2003) divide pedestrian models into system
dynamics, queuing models, game theory, cellular automata, agent-based
simulation, and discrete choice models. (Zheng et al., 2009) summarize crowd
evacuation models based on seven methodological approaches: cellular
automata models, lattice gas models, social force models, fluid-dynamic models,
agent-based models, and game theoretic models.
PANIC BEHAVIOR
A person’s emotional state affects both his mental and physical behavior:
judgement, memory, attention, interactions, etc., may all be influenced
(Berkowitz, 2000). Thus, under stress conditions, the behavior of an individual is
quite distinct from his behavior in normal circumstances (J. E. Almeida et al.,
2011; Gratch & Marsella, 2001). For this reason, panic and normal behavior are
often studied apart, (Helbing, Farkas, Molnár, et al., 2002), and models for
everyday pedestrian behavior are not fit for modeling emergency situations
(Helbing et al., 2001).
In situations of panic, as people get nervous, they try to move faster than normal,
there is less concern about personal space, and interactions among individuals
start to be physical. As people start pushing, some pedestrians might fall down,
becoming obstacles. Moreover, because people are not sure what to do, they
start following others, exhibiting herding behavior. Social contagion, combined
with reduced attention induced by stress, causes people to overlook alternatives,
such as side exits. Jams start to build up, and effects such as arching and
clogging are observed (Figure 3.13), potentially leading to dangerous pressures
among people (Helbing, Farkas, Molnár, et al., 2002; Helbing & Johansson,
2010). In these scenarios, as people change their behavior, smooth self-
organized efficient patterns of behavior break down, giving rise to less
coordinated ones. Examples include “freezing-by-heating” (Figure 3.14) and
“faster-is-slower” effect (Helbing & Johansson, 2010). A well-known example is
Figure3.13 Archingandcloggingeffect
(Helbing,Farkas,Molnár,etal.,2002)
Figure3.14 Freezing byheatingeffect
(Helbingetal.,2000a)
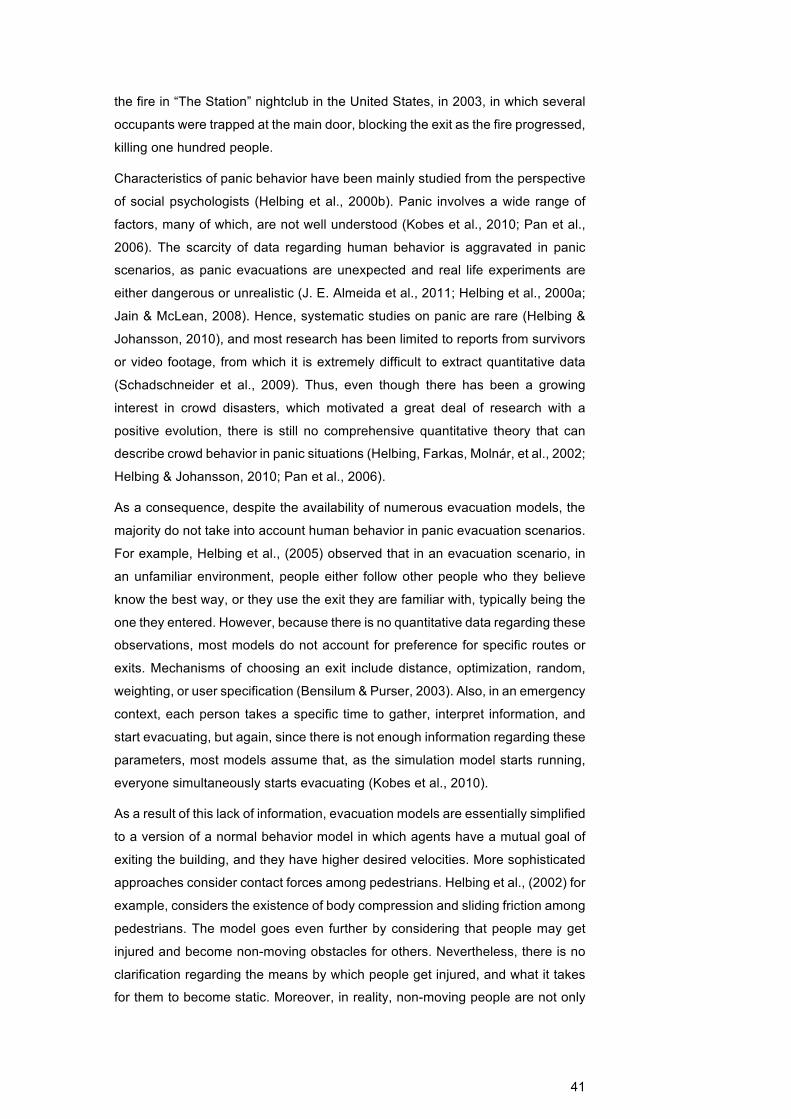
41
the fire in “The Station” nightclub in the United States, in 2003, in which several
occupants were trapped at the main door, blocking the exit as the fire progressed,
killing one hundred people.
Characteristics of panic behavior have been mainly studied from the perspective
of social psychologists (Helbing et al., 2000b). Panic involves a wide range of
factors, many of which, are not well understood (Kobes et al., 2010; Pan et al.,
2006). The scarcity of data regarding human behavior is aggravated in panic
scenarios, as panic evacuations are unexpected and real life experiments are
either dangerous or unrealistic (J. E. Almeida et al., 2011; Helbing et al., 2000a;
Jain & McLean, 2008). Hence, systematic studies on panic are rare (Helbing &
Johansson, 2010), and most research has been limited to reports from survivors
or video footage, from which it is extremely difficult to extract quantitative data
(Schadschneider et al., 2009). Thus, even though there has been a growing
interest in crowd disasters, which motivated a great deal of research with a
positive evolution, there is still no comprehensive quantitative theory that can
describe crowd behavior in panic situations (Helbing, Farkas, Molnár, et al., 2002;
Helbing & Johansson, 2010; Pan et al., 2006).
As a consequence, despite the availability of numerous evacuation models, the
majority do not take into account human behavior in panic evacuation scenarios.
For example, Helbing et al., (2005) observed that in an evacuation scenario, in
an unfamiliar environment, people either follow other people who they believe
know the best way, or they use the exit they are familiar with, typically being the
one they entered. However, because there is no quantitative data regarding these
observations, most models do not account for preference for specific routes or
exits. Mechanisms of choosing an exit include distance, optimization, random,
weighting, or user specification (Bensilum & Purser, 2003). Also, in an emergency
context, each person takes a specific time to gather, interpret information, and
start evacuating, but again, since there is not enough information regarding these
parameters, most models assume that, as the simulation model starts running,
everyone simultaneously starts evacuating (Kobes et al., 2010).
As a result of this lack of information, evacuation models are essentially simplified
to a version of a normal behavior model in which agents have a mutual goal of
exiting the building, and they have higher desired velocities. More sophisticated
approaches consider contact forces among pedestrians. Helbing et al., (2002) for
example, considers the existence of body compression and sliding friction among
pedestrians. The model goes even further by considering that people may get
injured and become non-moving obstacles for others. Nevertheless, there is no
clarification regarding the means by which people get injured, and what it takes
for them to become static. Moreover, in reality, non-moving people are not only
42
obstacles to the progression of others, but they may also cause other people to
fall. Moussaïd et al., (2011) also considers contact forces, but in a rule-based
model.
In fact, existing evacuation models can be seen as simplifications of normal
models, regarding the range of potential actions. In these models, qualitative
behaviors of evacuation are observed but with potentially large quantitative
deviations. As noted by the Society of Fire Protection Engineers “due to the
scarcity of behavioral data, they tend to rely heavily on assumptions and it is not
possible to gauge with confidence their predictive accuracy” (2002, p. 52).
Despite not being suited for predictive purposes, different behaviors are modeled
with the single purpose of studying its influence on the flow of people, and
evacuation outcome. Kirchner & Schadschneider, (2002) study the influence of
both herding behavior and knowledge of environment considering scenarios of
low visibility, and the relation between the two; Braun, Musse, de Oliveira, &
Bodmann, (2003) developed a model in which it is possible to consider
heterogeneous populations - agents can be more altruistic and try to help others,
as well as differ in the level of dependency. The model also considers the
possibility of grouping people.

43
III. PROPOSED SOLUTION
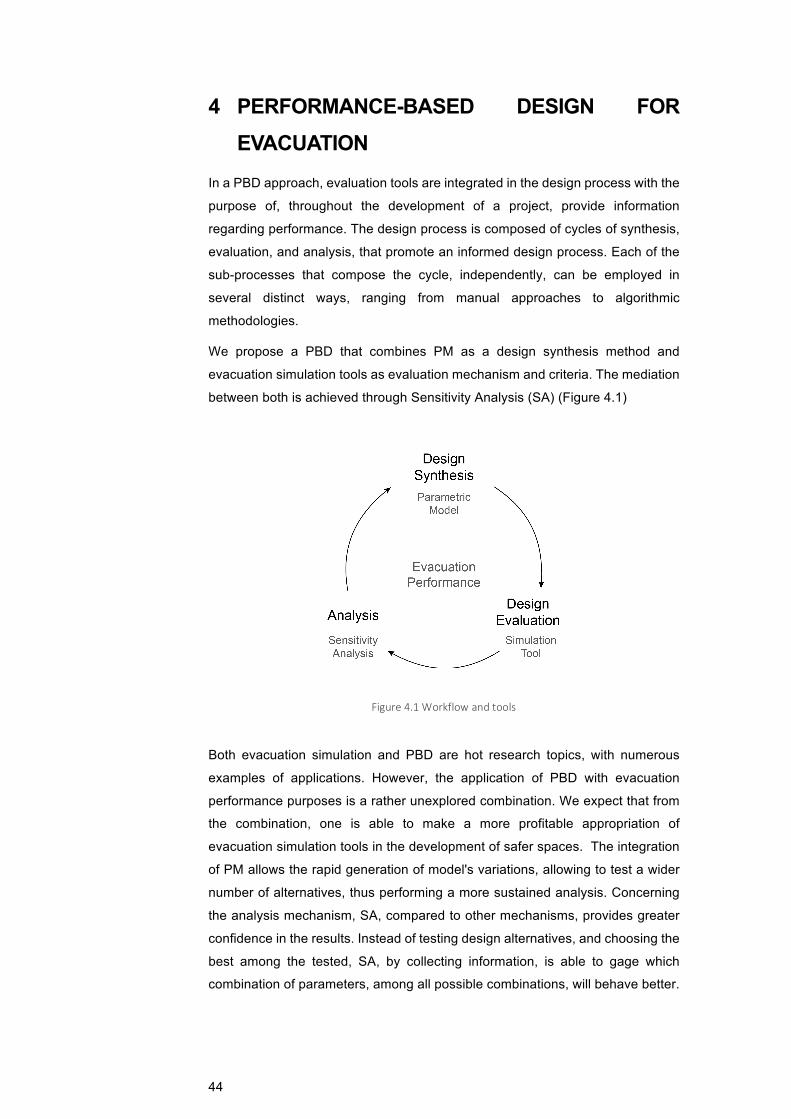
44
4 PERFORMANCE-BASED DESIGN FOR EVACUATION
In a PBD approach, evaluation tools are integrated in the design process with the
purpose of, throughout the development of a project, provide information
regarding performance. The design process is composed of cycles of synthesis,
evaluation, and analysis, that promote an informed design process. Each of the
sub-processes that compose the cycle, independently, can be employed in
several distinct ways, ranging from manual approaches to algorithmic
methodologies.
We propose a PBD that combines PM as a design synthesis method and
evacuation simulation tools as evaluation mechanism and criteria. The mediation
between both is achieved through Sensitivity Analysis (SA) (Figure 4.1)
Both evacuation simulation and PBD are hot research topics, with numerous
examples of applications. However, the application of PBD with evacuation
performance purposes is a rather unexplored combination. We expect that from
the combination, one is able to make a more profitable appropriation of
evacuation simulation tools in the development of safer spaces. The integration
of PM allows the rapid generation of model's variations, allowing to test a wider
number of alternatives, thus performing a more sustained analysis. Concerning
the analysis mechanism, SA, compared to other mechanisms, provides greater
confidence in the results. Instead of testing design alternatives, and choosing the
best among the tested, SA, by collecting information, is able to gage which
combination of parameters, among all possible combinations, will behave better.
Figure4.1Workflowandtools
45
5 CASE STUDY In order to evaluate the validity of our proposed approach, we implement it in a
fictional case study. This process is deployed in three main phases:
. Preparation work
. Performance-based design
. Results
The first part, the preparation work, unfolds in two tasks: (1) development of the
case study and (2) selection of the evaluation tool. The development of the case
study consists in the creation of a design concept, significant in the context of
evacuation and the formulation of its parametric description. Regarding the
selection of the evaluation tool, it is necessary to identify which tools are currently
available, and from those, select one based on the characteristics that are most
relevant for the project in hands.
The second part consists in the PBD cycle, which can be divided into three
phases: (1) synthesis, in which we generate relevant instances of the model; (2)
evaluation, in which we test the performance of each instance of the solution
space in the previously selected tool; and (3) analysis of the evaluation results,
resorting to SA.
Finally, in the last part we evaluate the success of our case study. We identify
problems and advantages and compare with initial expectations and, lastly, we
extrapolate the case study to real life contexts.
PREPARATION WORK
Our approach suggests the combination of PM and evacuation simulation tools,
within the context of PBD. This section concerns the consideration of those
specifications, to further be integrated in the PBD cycle.
For the parametric model, we create a hypothetical design concept, which we
parameterize and describe algorithmically. For the simulation tool, we review
existing software tools, and then filter the list of possible choices according to a
pre-defined hierarchy of criteria.
5.1.1 PARAMETRIC MODEL
This section regards the construction of the parametric model. Once formulated,
it will allow to quickly and effortlessly generate design variations to be tested on
the simulation tool.

46
In order to better understand the workflow, we developed a series of experiments
with a non-realistic but flexible building design. Our aim is to develop the
architectonic equivalent of the Drosophila of genetic experiments, i.e., just like
the fruit fly for genetics, or the chess for artificial intelligence, our architectonic
model should be easy to understand and easy to experiment with, and able to
produce valid knowledge that can be extrapolated to more complex models. For
this to happen the model should be representative of our study, i.e., the model
should be relevant regarding the study of evacuation performance. The benefit of
reducing the model to the essence of the study is that there are no accessory
elements that might introduce noise in the experiments, thus we can have
confidence on our results, i.e., we can have a clear understanding of cause-effect
relationships. To this end, we choose to develop our design concept from scratch,
so that we can exclude all the variability existent in normal buildings, and the
disturbance that it might introduce in the evaluations’ outcomes.
From a context perspective, we first need to define a building typology. Building’s
performance evacuation is critical in spaces that accommodate large numbers of
people – e.g. stadiums, hospitals, schools, or shopping malls. Additionally, the
building’s use affects several factors concerning the egress performance – e.g.
design layout, population, and staff training. Stadiums do not provide much
flexibility on circulation layout and hospitals have very specific population
characteristics. Among the different hypotheses, the concept of shopping center
allows great flexibility on layout design and allows to consider a generic
population, thus being the chosen one.
In order to reduce the concept of a shopping mall to the essence of evacuation
performance, we only work with layout configuration and circulation elements, we
also reduce the building to a single floor, and introduce regularity and symmetry
in its configuration. From the convergence of these characteristics we develop a
building concept which consists on a single story quadrangular shopping mall in
which stores are placed in concentric rings, interleaved by corridors. In the center
there is a central atrium, from which a set of main corridors breaks the rings and
gives access to the building’s exit (Figure 5.1).
Once the concept is defined it is necessary to formulate the algorithmic
description of the parametric model. The algorithmic description implies a prior
process of parameterization, i.e., the identification of which elements of the model
can change, and the definition of how the model is adjusted to those changes.
Figure 5.2 summarizes the developed PM. As independent parameters we
define:
Figure5.1Exampleofcasestudylayout
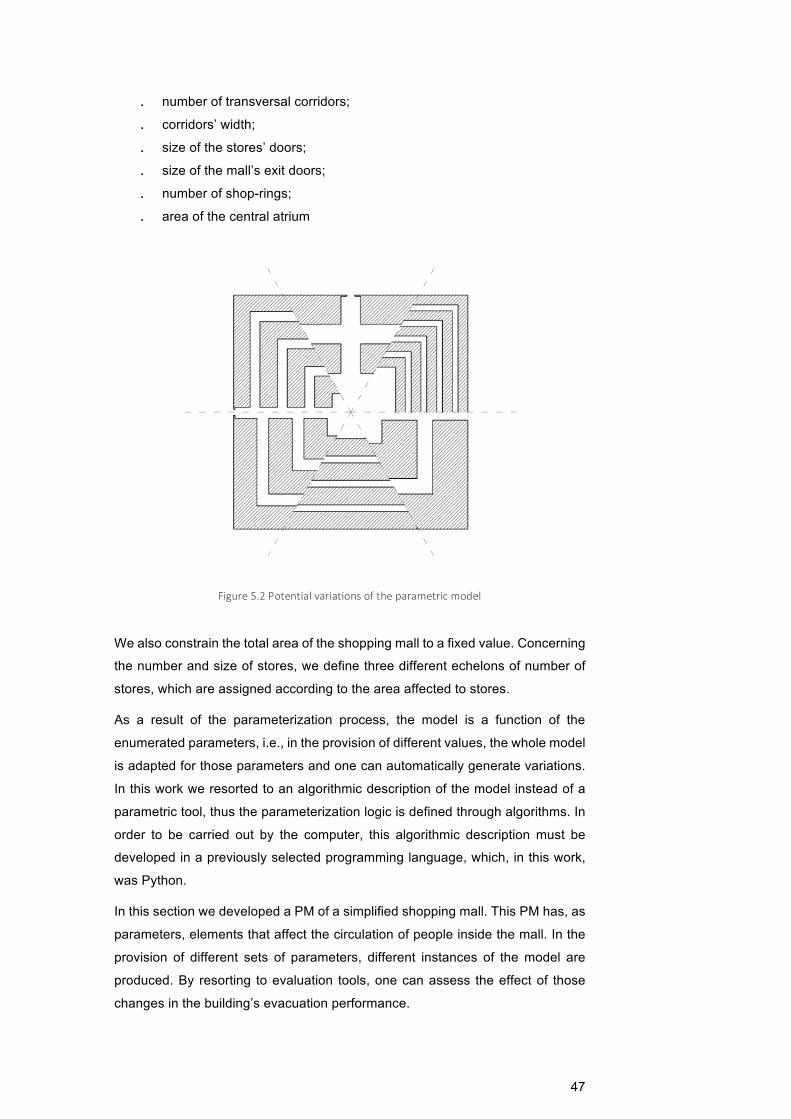
47
. number of transversal corridors;
. corridors’ width;
. size of the stores’ doors;
. size of the mall’s exit doors;
. number of shop-rings;
. area of the central atrium
We also constrain the total area of the shopping mall to a fixed value. Concerning
the number and size of stores, we define three different echelons of number of
stores, which are assigned according to the area affected to stores.
As a result of the parameterization process, the model is a function of the
enumerated parameters, i.e., in the provision of different values, the whole model
is adapted for those parameters and one can automatically generate variations.
In this work we resorted to an algorithmic description of the model instead of a
parametric tool, thus the parameterization logic is defined through algorithms. In
order to be carried out by the computer, this algorithmic description must be
developed in a previously selected programming language, which, in this work,
was Python.
In this section we developed a PM of a simplified shopping mall. This PM has, as
parameters, elements that affect the circulation of people inside the mall. In the
provision of different sets of parameters, different instances of the model are
produced. By resorting to evaluation tools, one can assess the effect of those
changes in the building’s evacuation performance.
Figure5.2Potentialvariationsoftheparametricmodel

48
5.1.2 EVALUATION TOOL
In order to assess the evacuation performance of a model, it is necessary to
resort to an evacuation simulation tool. We started our research by developing
our own ABM. We developed a microsimulation model continuous in space and
discrete in time. In modeling the agents, we included some level of intelligence –
agents had fixed goals but no pre-defined route, and we developed a route-choice
algorithm where we assumed that agents had no knowledge on the environment,
so they would navigate the space layout, according to rule-based algorithms,
searching for the exit. Regarding panic, we only considered herding behavior -
agents route-choice mechanism was affected by the concentration of people in
their field of view.
Even though our model appeared to realistically simulate people searching for an
exit while reacting to other agents, it was grounded on several unfounded
assumptions. For example, we modelled as route-choice mechanism a searching
behavior, however it is highly unlikely that in a public space, no one knows their
way to the exit. In fact, models that do not assign a pre-defined route or a
searching behavior algorithm, usually integrate algorithms that optimize some
measure of cost such as travel time or distance. More sophisticated models
consider fitness functions where agents “ponder” trade-offs between different
measures. Additionally, models can integrate different route-choice behaviors,
thus simulate different kinds of behaviors. However, as the sophistication of the
model increases, the information required to feed the model also increases, which
hinders the calibration and validation. Other unfounded assumptions include the
consideration of herding behavior. Even though it is known that people in panic
tend to follow others, there is little information on the weight it has on the behavior,
or how it affects different people. Additionally, several parameters on our model
were assigned randomly, such as the agents’ desired velocity. Although the
development of our model was important to obtain relevant insight regarding
evacuation processes, given the lack of means to justify, calibrate, and validate
our model, we then choose to resort to a well-established and validated
evacuation simulation tool.
Evacuation simulation is a rapidly evolving field of study. It is therefore difficult to
keep abreast of the breadth of tools that exist. Continuously, new tools are
developed and old ones discontinued. Additionally, among the existing tools,
some are only presented on a consultancy basis, which means that they are not
in fact available for use. Realizing which tools are available at a given moment is
not an immediate task. Moreover, tools differ in a number of characteristics, from
the modelling approach to the features provided. The selection of the appropriate
tool encompasses the comparison of the available tools in the characteristics that
49
are relevant for the project, i.e., the pertinence of a specific tool depends on the
purpose of the simulation.
Arturo Cuesta, Orlando Abreu and Daniel Alvear (2015) presented an overview
of current computer evacuation models with the typically used scenarios. This
list was the starting point for our selection, as it was progressively filtered
(Annexes, Table 4). From the initial list (38), we selected only the models that
were used for simulating buildings (31); then from those models we excluded the
ones that the National Institute of Standards and Technology (NIST) review
(Kuligowski et al., 2010) did not mention (23); from the remaining list we removed
the ones which the website was not found, or was not functioning properly (13).
The NIST’s review provides a table with the main features of the evacuation
models, namely: model availability; modeling method; model purpose; type of
grid/structure of the model; model view of the occupants; occupants’ view of the
building; behavior of the occupants; movement of the occupants; incorporation of
fire effects; use of computer-aided design (CAD) drawings; visualization methods
and also some special features. From those features some were determinant for
our work. Firstly, the model should be available (8), this categorization did not
distinguish if it was available for free or if it was necessary to pay a fee; secondly,
the model should allow the importation of files from a CAD program (7) and,
finally, from that categorization another model was removed because it was
poorly validated in comparison (6). The remaining models were Building Exodus,
Pathfinder, Pedgo, Simulex, Simwalk, and Steps (Annexes, Table 5). Any of the
elements of that list could be used for our experimentation but only Pathfinder
granted us a research license, thus being the tool used in this work.
Pathfinder (Thunderhead Engineering 2011) is an agent-based evacuation
software. The software allows the importation of CAD drawings in both DWG and
DXF formats and it includes extraction tools that assist the construction of the
analytical model from the imported CAD geometry.
In the modeling of the simulation, the tool allows the customization of several
features, such as specific door’s flow rate, or agent’s features (such as speed,
shoulder width, door preference, or comfort distance). This level of model
specification is useful in the modeling of scenarios in which these factors are
determinant – e.g., a hospital – and when seeking results that are as close as
possible to reality. Nevertheless, the construction of such detailed model can
require a lot of work, both in the provision of the details to the model, as well as
in obtaining those values. Moreover, because in this work we are using the
analysis tool to obtain results for comparison, the provision of such details loses
relevance, since the focus is not the final result, but the final result in comparison.
In this context, we worked with the default values provided by the tool.

50
In the end of the evaluation, Pathfinder provides files with detailed results, a
summary output file, and the simulation video. The simulation video allows
different views, 2D or 3D with different camera options. It is also possible to add
data overlays to the floor surfaces of the model regarding density usage (Figure
5.3), level of service, or others. The data overlays allow an easier and faster
visualization of the simulation results.
PERFORMANCE-BASED DESIGN
This section concerns the implementation of the PBD cycle. As we’ve said before,
PBD consists on the early integration of evaluation tools in the design process,
with the purpose of supporting decision-making, with regard to performance
criteria. Yet, there are different modes of obtaining information from the
evaluation tools, which influence the PBD cycle. In testing design alternatives and
comparison of results, the architect continuously performs full cycles with a single
model. On the other side, in a SA, the architect is not interested in testing the
design alternatives he further wants to invest in, but in acquiring information on
the correlations between model’s parameters and performance. For that purpose,
the execution of the cycle changes - instead of testing isolated alternatives and
performing multiple cycles, the architect generates several models, evaluates
them, and performs the analysis based on the set of simulations’ outputs. Thus
the architect performs less cycles, but with more evaluations in each.
Since in this work we decided to perform SA, our PBD process consists on
performing cycles with several evaluations each. Thus for each cycle, we (1)
generate and (2) evaluate a relevant solution space, and then the evaluation
outcomes are (3) analyzed as a group.
5.2.1 SOLUTION SPACE
The first part of the process consists on the development of a significant sample
of design alternatives to be evaluated. Since the number of model’s parameters
is not extensive, we are able to perform an exhaustive analysis for each variable.
Supported on the parametric model capability to easily create a substantial
solution space, we can evaluate variations of one parameter, while maintaining
the others unchanged, and repeat this process for all the parameters. We
constraint each parameter to a range of values and define increments within that
range.
An additional variable is included in all simulations – the number of people inside
the mall. Since higher values of human concentration inside public buildings are
usually related with emergency evacuation disasters, if we increase the number
Figure5.3ExampleofPathfindercounterplotsondensity
https://www.thunderheadeng.com/pathfinder/
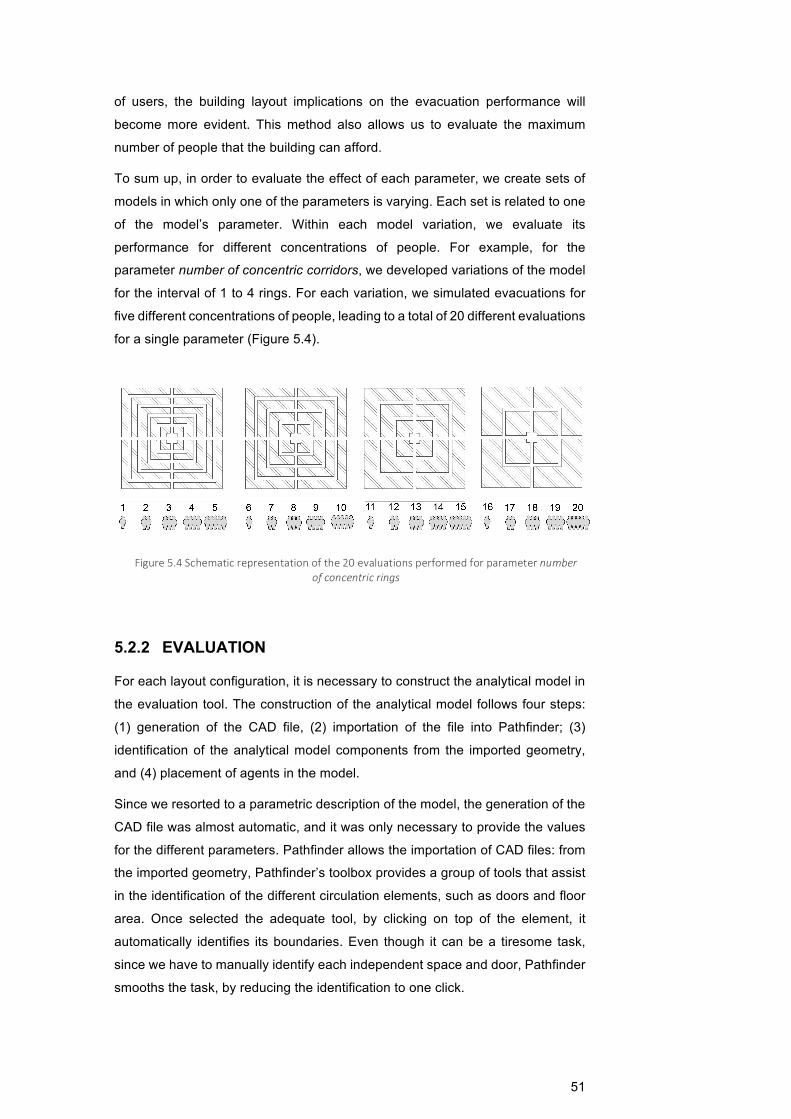
51
of users, the building layout implications on the evacuation performance will
become more evident. This method also allows us to evaluate the maximum
number of people that the building can afford.
To sum up, in order to evaluate the effect of each parameter, we create sets of
models in which only one of the parameters is varying. Each set is related to one
of the model’s parameter. Within each model variation, we evaluate its
performance for different concentrations of people. For example, for the
parameter number of concentric corridors, we developed variations of the model
for the interval of 1 to 4 rings. For each variation, we simulated evacuations for
five different concentrations of people, leading to a total of 20 different evaluations
for a single parameter (Figure 5.4).
5.2.2 EVALUATION
For each layout configuration, it is necessary to construct the analytical model in
the evaluation tool. The construction of the analytical model follows four steps:
(1) generation of the CAD file, (2) importation of the file into Pathfinder; (3)
identification of the analytical model components from the imported geometry,
and (4) placement of agents in the model.
Since we resorted to a parametric description of the model, the generation of the
CAD file was almost automatic, and it was only necessary to provide the values
for the different parameters. Pathfinder allows the importation of CAD files: from
the imported geometry, Pathfinder’s toolbox provides a group of tools that assist
in the identification of the different circulation elements, such as doors and floor
area. Once selected the adequate tool, by clicking on top of the element, it
automatically identifies its boundaries. Even though it can be a tiresome task,
since we have to manually identify each independent space and door, Pathfinder
smooths the task, by reducing the identification to one click.
Figure5.4Schematicrepresentationofthe20evaluationsperformedforparameternumberofconcentricrings
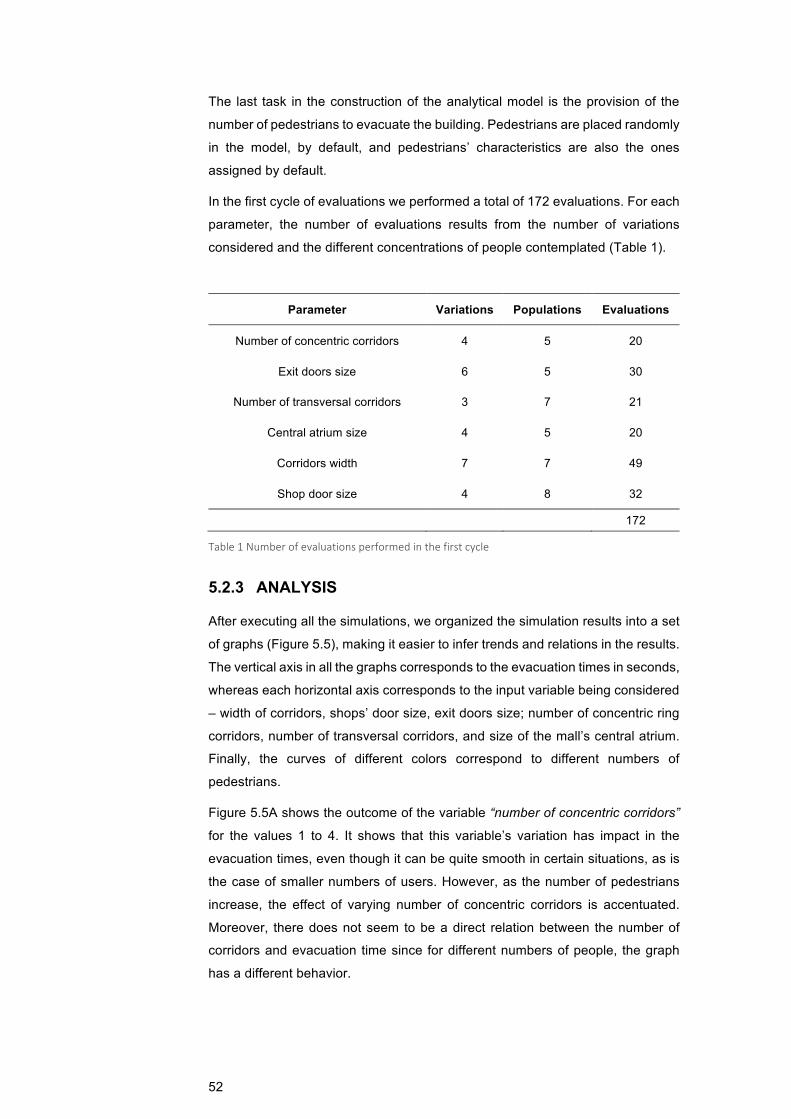
52
The last task in the construction of the analytical model is the provision of the
number of pedestrians to evacuate the building. Pedestrians are placed randomly
in the model, by default, and pedestrians’ characteristics are also the ones
assigned by default.
In the first cycle of evaluations we performed a total of 172 evaluations. For each
parameter, the number of evaluations results from the number of variations
considered and the different concentrations of people contemplated (Table 1).
Parameter Variations Populations Evaluations
Number of concentric corridors 4 5 20
Exit doors size 6 5 30
Number of transversal corridors 3 7 21
Central atrium size 4 5 20
Corridors width 7 7 49
Shop door size 4 8 32
172
Table1Numberofevaluationsperformedinthefirstcycle
5.2.3 ANALYSIS
After executing all the simulations, we organized the simulation results into a set
of graphs (Figure 5.5), making it easier to infer trends and relations in the results.
The vertical axis in all the graphs corresponds to the evacuation times in seconds,
whereas each horizontal axis corresponds to the input variable being considered
– width of corridors, shops’ door size, exit doors size; number of concentric ring
corridors, number of transversal corridors, and size of the mall’s central atrium.
Finally, the curves of different colors correspond to different numbers of
pedestrians.
Figure 5.5A shows the outcome of the variable “number of concentric corridors”
for the values 1 to 4. It shows that this variable’s variation has impact in the
evacuation times, even though it can be quite smooth in certain situations, as is
the case of smaller numbers of users. However, as the number of pedestrians
increase, the effect of varying number of concentric corridors is accentuated.
Moreover, there does not seem to be a direct relation between the number of
corridors and evacuation time since for different numbers of people, the graph
has a different behavior.
53
Regarding the second analysis in Figure 5.5B, which evaluates the variable “exit
doors size”, it is possible to understand that this is a critical variable in this model,
since its variation causes significant changes in the performance results – except
in the case of very few users, where the evacuation times remain almost constant.
We have analyzed this parameter in the range between 1,5 and 4 meters, and
performed evaluations for increments of 0,5 meters.
Figure 5.5C presents the results of the variable “number of transversal corridors”.
This variable received three different values as input: 2, 3, or 4 main corridors.
Since these are the corridors that give access to the mall’s exit doors, it means
that, by decreasing the number of corridors, we are automatically decreasing the
number of exit doors. As it is visible in Figure 5.5C, the evacuation time increases
with the decreasing number of main corridors, and it gets more accentuated with
higher numbers of user densities. Moreover, all evacuation times seem to
converge as the number of corridors increases.
Figure 5.5D presents the evaluation of the “central atrium size” variable. From the
graph it is possible to conclude that it almost does not interfere with evacuation
times for all user density values.
The results regarding the “corridors width” variable are shown in Figure 5.5E. The
width varied between 2.5 and 5.5 meters, with increments of 0.5 meters. Even
though the width variation has almost no impact in evacuation times for smaller
numbers of people, as this number grows, the graph’s behavior becomes
irregular – it does not decrease linearly, instead it grows and decreases in
consecutive values.
Finally, we tested the effect of changing the “stores’ door size” between 1.5 and
3 meters (Figure 5.5F). This simulation occurred in slightly different conditions
comparing to the previous examples, since it measured the time people took to
get out from a single store, instead of the whole shopping mall. To maintain the
user density, we simulated a smaller number of users. Nevertheless, as
previously demonstrated by the evaluation in example B, door widths are key
points on emergency evacuations, especially with higher concentrations of
people.
From this first evaluation cycle we were able to draw some relevant conclusions.
Globally, as the number of people increases, the effects of changing parameters
on evacuation times are accentuated. Moreover, by the slope variation between
different concentrations of people, it is possible to understand the relevance of
each parameter. As an example, Figure 5.5B shows that the exit doors’ size has
a great impact on the evacuation performance, whereas Figure 5.5A reveals that
the variable “number of concentric corridors” only becomes relevant after a
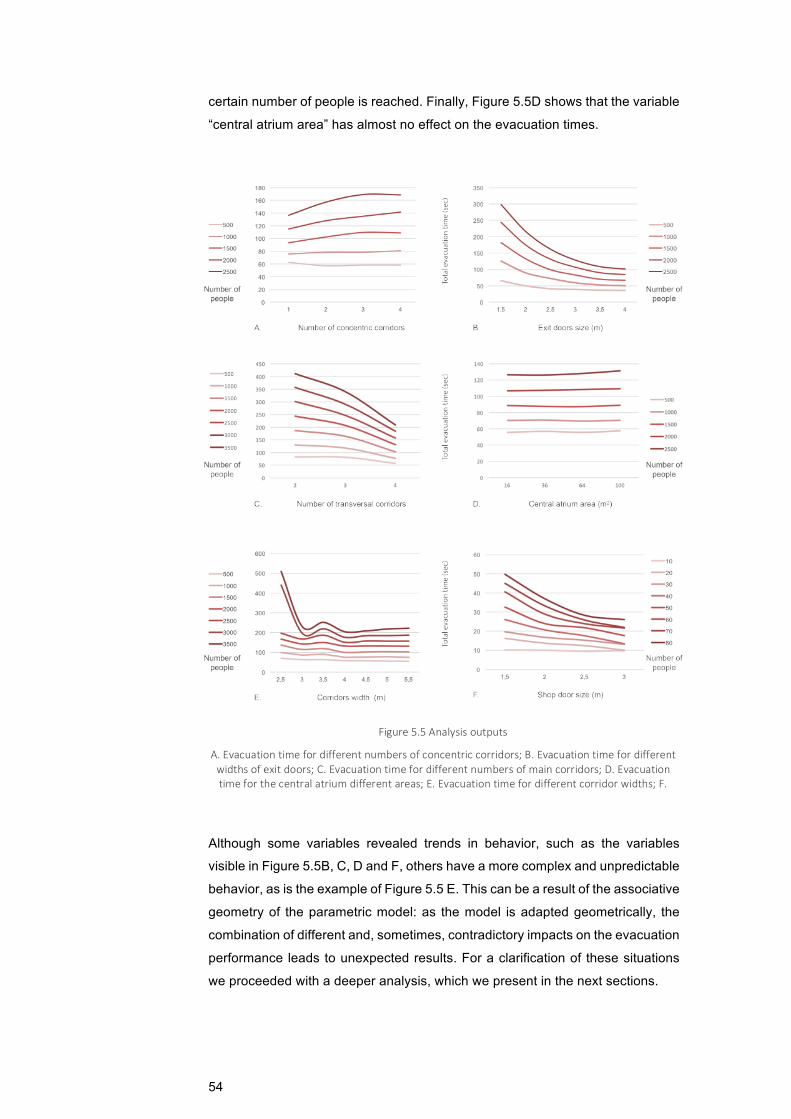
54
certain number of people is reached. Finally, Figure 5.5D shows that the variable
“central atrium area” has almost no effect on the evacuation times.
Although some variables revealed trends in behavior, such as the variables
visible in Figure 5.5B, C, D and F, others have a more complex and unpredictable
behavior, as is the example of Figure 5.5 E. This can be a result of the associative
geometry of the parametric model: as the model is adapted geometrically, the
combination of different and, sometimes, contradictory impacts on the evacuation
performance leads to unexpected results. For a clarification of these situations
we proceeded with a deeper analysis, which we present in the next sections.
Figure5.5Analysisoutputs
A.Evacuationtimefordifferentnumbersofconcentriccorridors;B.Evacuationtimefordifferentwidthsofexitdoors;C.Evacuationtimefordifferentnumbersofmaincorridors;D.Evacuationtimeforthecentralatriumdifferentareas;E.Evacuationtimefordifferentcorridorwidths;F.
Evacuationtimesfromasinglestorewithdifferentdoorwidths(thenumberofpeopleinsidethe
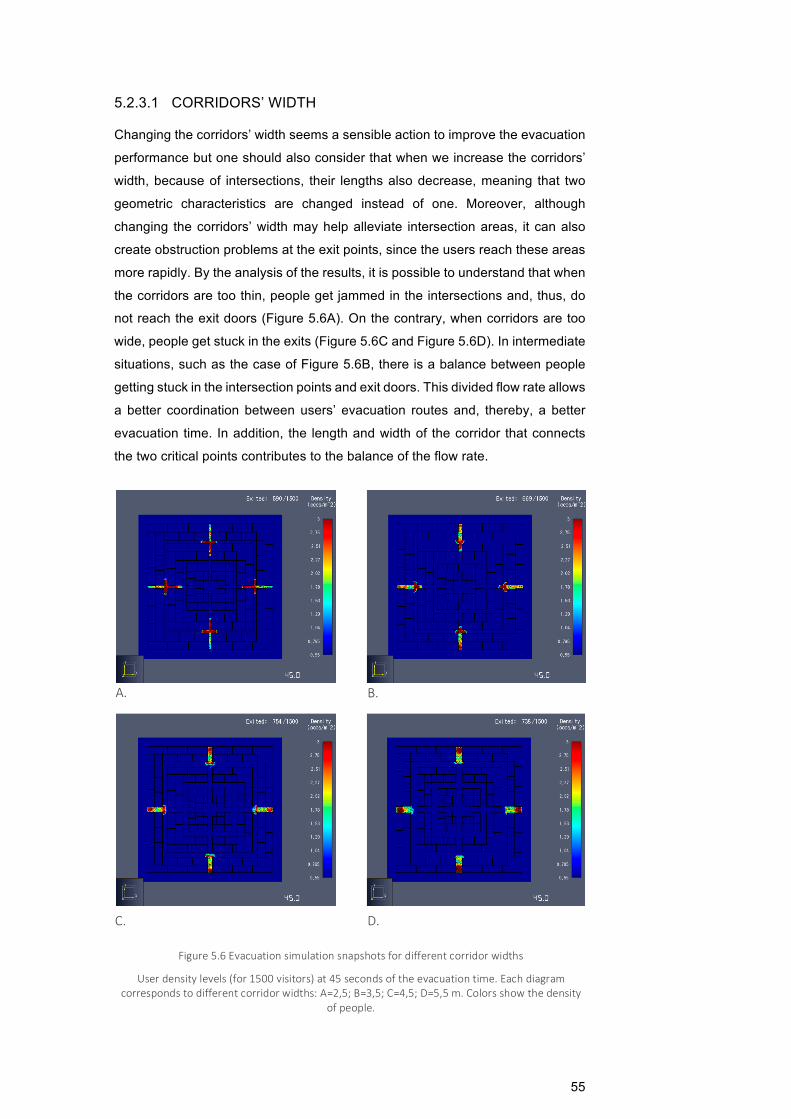
55
5.2.3.1 CORRIDORS’ WIDTH
Changing the corridors’ width seems a sensible action to improve the evacuation
performance but one should also consider that when we increase the corridors’
width, because of intersections, their lengths also decrease, meaning that two
geometric characteristics are changed instead of one. Moreover, although
changing the corridors’ width may help alleviate intersection areas, it can also
create obstruction problems at the exit points, since the users reach these areas
more rapidly. By the analysis of the results, it is possible to understand that when
the corridors are too thin, people get jammed in the intersections and, thus, do
not reach the exit doors (Figure 5.6A). On the contrary, when corridors are too
wide, people get stuck in the exits (Figure 5.6C and Figure 5.6D). In intermediate
situations, such as the case of Figure 5.6B, there is a balance between people
getting stuck in the intersection points and exit doors. This divided flow rate allows
a better coordination between users’ evacuation routes and, thereby, a better
evacuation time. In addition, the length and width of the corridor that connects
the two critical points contributes to the balance of the flow rate.
A. B.
C. D.
Figure5.6Evacuationsimulationsnapshotsfordifferentcorridorwidths
Userdensitylevels(for1500visitors)at45secondsoftheevacuationtime.Eachdiagramcorrespondstodifferentcorridorwidths:A=2,5;B=3,5;C=4,5;D=5,5m.Colorsshowthedensity
ofpeople.
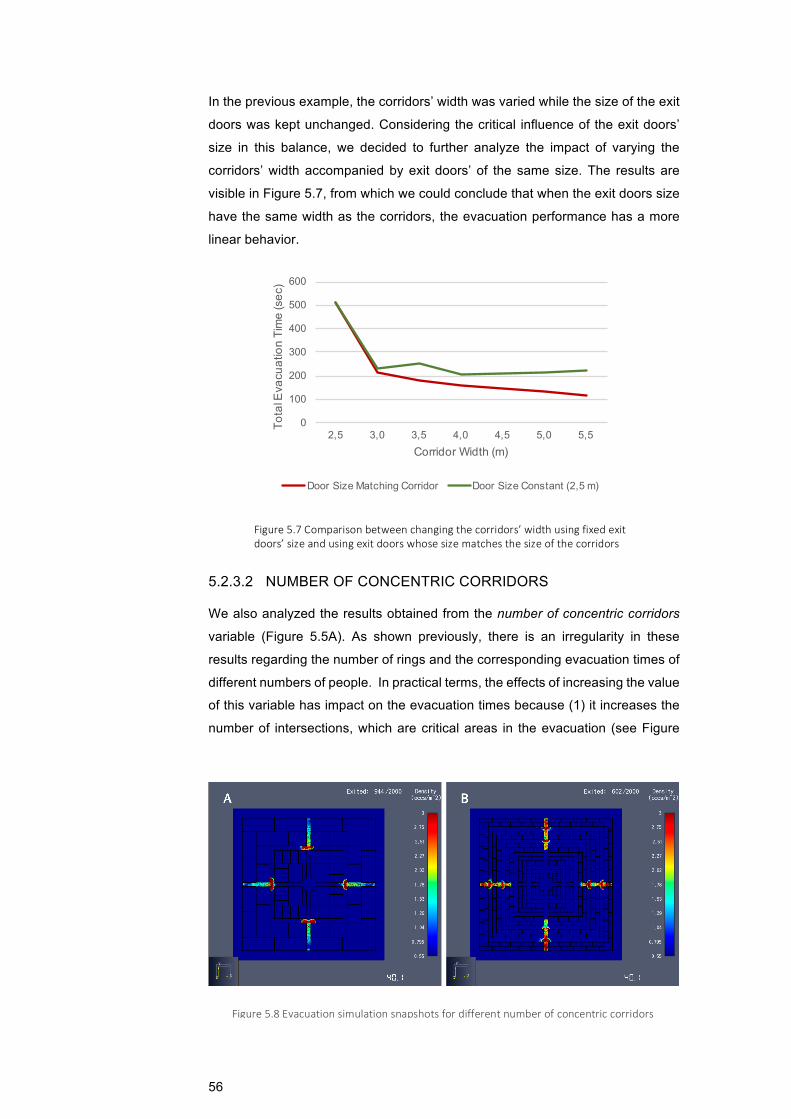
56
In the previous example, the corridors’ width was varied while the size of the exit
doors was kept unchanged. Considering the critical influence of the exit doors’
size in this balance, we decided to further analyze the impact of varying the
corridors’ width accompanied by exit doors’ of the same size. The results are
visible in Figure 5.7, from which we could conclude that when the exit doors size
have the same width as the corridors, the evacuation performance has a more
linear behavior.
5.2.3.2 NUMBER OF CONCENTRIC CORRIDORS
We also analyzed the results obtained from the number of concentric corridors
variable (Figure 5.5A). As shown previously, there is an irregularity in these
results regarding the number of rings and the corresponding evacuation times of
different numbers of people. In practical terms, the effects of increasing the value
of this variable has impact on the evacuation times because (1) it increases the
number of intersections, which are critical areas in the evacuation (see Figure
Figure5.7Comparisonbetweenchangingthecorridors’widthusingfixedexitdoors’sizeandusingexitdoorswhosesizematchesthesizeofthecorridors
Figure5.8Evacuationsimulationsnapshotsfordifferentnumberofconcentriccorridors
0
100
200
300
400
500
600
2,5 3,0 3,5 4,0 4,5 5,0 5,5
Tota
l Eva
cuat
ion
Tim
e (s
ec)
Corridor Width (m)
Door Size Matching Corridor Door Size Constant (2,5 m)
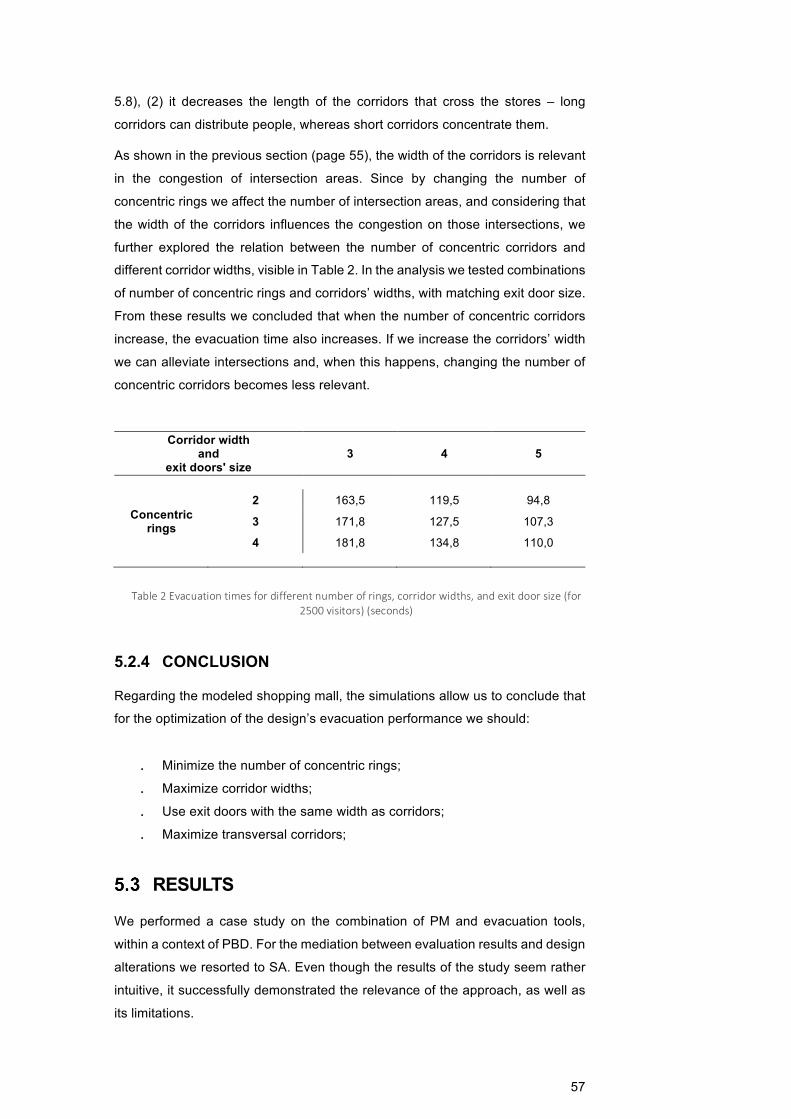
57
5.8), (2) it decreases the length of the corridors that cross the stores – long
corridors can distribute people, whereas short corridors concentrate them.
As shown in the previous section (page 55), the width of the corridors is relevant
in the congestion of intersection areas. Since by changing the number of
concentric rings we affect the number of intersection areas, and considering that
the width of the corridors influences the congestion on those intersections, we
further explored the relation between the number of concentric corridors and
different corridor widths, visible in Table 2. In the analysis we tested combinations
of number of concentric rings and corridors’ widths, with matching exit door size.
From these results we concluded that when the number of concentric corridors
increase, the evacuation time also increases. If we increase the corridors’ width
we can alleviate intersections and, when this happens, changing the number of
concentric corridors becomes less relevant.
Corridor width and
exit doors' size 3 4 5
Concentric rings
2 163,5 119,5 94,8
3 171,8 127,5 107,3
4 181,8 134,8 110,0
5.2.4 CONCLUSION
Regarding the modeled shopping mall, the simulations allow us to conclude that
for the optimization of the design’s evacuation performance we should:
. Minimize the number of concentric rings;
. Maximize corridor widths;
. Use exit doors with the same width as corridors;
. Maximize transversal corridors;
RESULTS
We performed a case study on the combination of PM and evacuation tools,
within a context of PBD. For the mediation between evaluation results and design
alterations we resorted to SA. Even though the results of the study seem rather
intuitive, it successfully demonstrated the relevance of the approach, as well as
its limitations.
Table2Evacuationtimesfordifferentnumberofrings,corridorwidths,andexitdoorsize(for2500visitors)(seconds)
58
Because in an architectonic project all the elements must be in consonance,
when the architect changes one characteristic, the whole design must be
adjusted. In the adaptation of the model to changes, different elements of the
design are affected, which can have contrasting effects on the performance, as
we’ve seen in section 5.2.3.1. Assessing and understanding the outcomes of
design alterations is not straightforward. Hence the relevance of a mechanism
that takes advantage of design evaluations to support the design process.
In order to achieve an efficient analysis of simulation results, one has to perform
multiple evaluations. In that context it was also demonstrated the relevance of
PM in the generation of design variations. By the traditional means, we would not
have been able to test as many design alternatives, and make such an exhaustive
analysis.
On the other side, the construction of the analytical model, even though it is
simplified by the evaluation tool, is a laborious and tedious task, inhibiting the
number of evaluations one is willing to perform. It is also perceptible that the
analysis of results through SA was feasible because we were working with few
parameters.
From the case study we can make assumptions regarding more complex designs.
When the scale of the project increases, changing one parameter, will necessarily
require adjusting a wider number of design elements, thus the outcome of
changing one parameter can have multiple simultaneous sources, which
increases the difficulty on assessing the performance and establishing
correlations. Additionally, for more complex designs, as the number of
parameters increases, the amount of potential outcomes due to combinations of
changing parameters (such as corridors’ width and door size) increases
exponentially. An exhaustive analysis of each parameter individually becomes
impracticable.
Furthermore, with increasing design complexity, the relevance of PM is
significantly accentuated. On the one side, in testing design alternatives, by the
traditional means, it would require a lot of work in generating variations of
complex models, thus, the PM capability to generate design variations increases
in relevance. On the other side, since there are more interdependencies between
models’ parameters, in order to draw relevant conclusions one may have to
perform more evaluations, thus, the capability of PM to automatically generate
variations is accentuated again. However, the relevance that the PM advantages
receive in a complex design context is equivalent to the relevance that the
disadvantages of constructing the analytical model receive. We’ve mentioned
that the work implied in building the analytical model is one drawback of the case
study. In increased complexity not only one has to construct a wide number of

59
analytical models, but also, each analytical model requires more work and time
in the construction.
In summary, the advantages and disadvantages identified for the case study are
accentuated for more complex situations. However, as the complexity of the task
increases the disadvantages may become so substantial that the cost of
performing a fruitful PBD becomes prohibitive. Additional methods that simplify
the construction of the analytical model and that assist the processing of the
evaluation results may take the approach to the next level.


61
IV. DISCUSSION

62
CONCLUSION
Given the increasing number of crowd disasters, over the last years there has
been a greater focus on developing appropriate tools to evaluate buildings’
evacuation performance. The application of these tools has been essentially
restricted to final stages of design, to assess the project’s level of safety.
However, early design decisions hold great importance in final solutions
performance, thus in order to ensure a successful final result, it is necessary for
designers to gather pertinent performance information in this stages.
On the other hand, essentially framed in the context of sustainability, PBD is a
design approach that promotes the integration of evaluation tools since earlier
stages of design. PBD rests on the evaluation of design alternatives in order to
compare evaluation results and support informed decisions in the course of the
project evolution. The construction of different models for comparison can require
a significant amount of work and time. PBD benefits of the integration of PM, a
modeling paradigm that allows the designer to automatically generate several
variations from a single conceptual model.
In this work we propose the combination of PM, with evacuation simulation tools,
within the context of PBD. The aim is to promote an informed design process,
regarding evacuation performance. The integration of PM allows to test and
compare a greater number of model variations, thus have a more sustained PBD
process, and potentially, ensure a safer design solution, decreasing the number
of casualties in case of accident.
To evaluate our proposal, we resorted to a hypothetical shopping mall as case
study. We first developed a parametric model that promoted variations on key
aspects regarding evacuation, such as doors’ size, and number of corridors. We
then performed several evaluations for the different parameters contemplated in
the parametric model, and accounted for an extra variable - number of people
inside the mall. Finally, by means of sensitivity analysis, we established
correlations regarding design variations and performance results, which
ultimately allowed us to identify the best combination of parameters for our design
solution, concerning evacuation performance optimization.
ADVANTAGES
Despite the simplicity of our case study, it was demonstrated that the influence of
changing parameters in the building’s evacuation performance is not trivial to
predict.
Our study revealed the relevance of evaluation tools feedback during the design
process, to support decision-making. It was also demonstrated that it is required
63
a certain amount of evaluations to provide sufficient information for an efficient
PBD process, thus proving the relevance of PM in context of PBD. These
conclusions were drawn from a hypothetical case study, characterized by its
simplicity. The considerations regarding the relevance of our approach should be
scaled to the complexity of the design.
As the size and complexity of public buildings increase, evacuation performances
become more relevant and less predictable. A design approach that
contemplates pertinent information on evacuation performance, from the early
stages allows the development of safer design spaces. The integration of PM in
this context, increases the efficiency of the process, and by allowing a wider
number of evaluations, the effectiveness as well.
DISADVANTAGES
Indisputably relevant, the approach is still costly regarding time and tools. The
implementation of the workflow implies a great initial investment either in the
construction of the parametric model, in the choice of the tools, and in learning
how to operate the different tools. To finish, the computational burden of
performing multiple evacuations also contributes to the amount of time required
for performing the workflow. Nevertheless, digital tools are quickly evolving and
architects are becoming more familiarized with them. We believe that in the not
so distant future, applications will become more practical, and the knowledge
required for its handling will no longer be considered an expertise, but instead a
normal skill among architects. Szalapaj, (2004) discusses an emerging
generation of architects, “children of the digital age”, who deal with digital
technology with natural ease.
Finally, evacuation simulation tools are specially challenging to work with.
Because of the potential scenarios of evacuations, especially regarding the
nature of the incident and population involved, the construction of the analytical
model implies a great deal of specification, which the user probably is not ready
to provide.
FUTURE WORK
In the future we will expand our research and further explore the potential of the
combination of PM with evacuation simulation tools, within the context of PBD.
Below we present some topics we plan to work on:
1. Application in real life context
We explored the potential of the approach in a hypothetical case study. As next
step we will explore its application in a real life context. In order to cope with the
64
inherent complexity of a real project design, we will have to adjust the workflow
to include more sophisticated mechanisms:
a. Explore optimization mechanisms
In this thesis we discussed the relevance of optimization processes to
guide the design process, based on evaluation results. Our case study
resorted to sensitivity analysis as a mechanism of optimization, however
as the complexity of the design increases, sensitivity analysis may be
limited. In applying the approach in real life projects, we will resort to
optimization algorithms to drive the design exploration process, based
on the pre-defined performance criteria. Additionally, when designing a
building, the architect has to deal with multidisciplinary and conflicting
objectives, thus we also want to test multi-objective optimization;
b. Improve the workflow regarding tools communication
Our workflow required the user intervention in the mediation between
different tools. Not only in the interpretation of data, but also in the data
conversion. While human intervention is important in the reasoning
process, the construction of models and exchange of information could
be improved. Additionally, as the complexity of the task increases, the
time required for each iteration also increases. As a first step, we want
for the data conversion between tools that do not require intellectual
mediation to be automated, meaning that the construction of the
analytical model is automated. On a second stage, in the context of
integrating an optimization algorithm in the process, we want to test
closing the cycle, i.e., having evaluation tools communicate with the
optimization algorithm which in turn communicates with the PM to
generate new variations. In this version, the process does not include
human reasoning in the optimization, it is implicit that the subjective
requirements are explicit either within the description of the PM or
integrated in the optimization algorithm;
c. Explore continuous processes
The scope of this thesis only focused on a specific stage of the design
process. In a real life context, design is continuously evolving and the
flow of people in space is affected by decisions made at different stages.
We want to evaluate the effect of the symbioses between PM and
evaluation tools throughout the project evolution, potentially integrating
furniture layout as well. In spaces such as classrooms, auditoriums,
65
restaurants and several others, the influence of furniture layout in space
has a strong impact on the flow of people;
2. Transcend building design
In this thesis, our focus was the exploration of the combination of PM and
evaluation tools in the assistance of a building’s design process. We want to
explore the scope of the approach, by applying it to different contexts such as
conceiving event venues or even applying it in more restricted contexts such as
buildings’ restoration.
CONTRIBUTIONS
This thesis demonstrates the pertinence and relevance of a PBD approach that
integrates PM and evacuation simulation tools. A design process that accounts
for evacuation performance is extremely relevant since it can in fact reduce the
number of injured or dead people in circumstances of accident. Despite
incontestably relevant, the amount of time and work required for an efficient PBD
regarding evacuation performance is very inhibitory. In this thesis it was
demonstrated the importance of PM to an efficient PBD. Thus, the combination
of PBD evacuation simulation tool and PM is extremely relevant for a successful
evacuation PBD approach, thus to increase buildings’ safety.
Some of the results produced by this thesis were published in a paper entitled
Saving Lives with Generative Design and Agent-based Modeling (Sousa,
Caetano, & Leitão, 2017), presented at the eCAADe 2017 conference, the 35th
international conference on education and research in Computer-Aided
Architectural Design in Europe.

67
REFERENCES Aguiar, R., Cardoso, C., & Leitão, A. (2017). Algorithmic Design and Analysis Fusing Disciplines. In
Disciplines & Disruption (pp. 28–37).
Aish, R., & Woodbury, R. (2005). Multi-level Interaction in Parametric Design. In Smart Graphics (pp. 151–
162).
Almeida, J. E. (2016). Serious Games as a Behaviour Elicitation Tool : Applications to Evacuation Scenarios.
Almeida, J. E., Rosseti, R. J. F., & Coelho, A. L. (2011). Crowd Simulation Modeling Applied to Emergency
and Evacuation Simulations using Multi-Agent Systems.
Almeida, M. (2016). Human Stampedes : A Scoping Review.
Anderson, K. (2014). Design energy simulation for architects.
Andradóttir, S. (1998). A review of simulation optimization techniques. In Proceedings of the 1998 Winter
Simulation Conference (pp. 151–158).
April, J., Glover, F., Kelly, J. P., & Laguna, M. (2003). Simulation-based optimization: Practical introduction
to simulation optimization. In Proceedings of the 2003 Winter Simulation Conference (pp. 71–78).
Bankes, S. C. (2002). Tools and techniques for developing policies for complex and uncertain systems.
Banks, J., Nelson, B. L., Carson, J. S., & Nicol, D. M. (1984). Discrete-Event System Simulation.
Barrios, C. (2005). Transformations on Parametric Design Models. Proceedings of the 11th International
CAAD Futures Conference, 393–400.
Batty, M., Desyllas, J., & Duxbury, E. (2003). Safety in Numbers ? Modelling Crowds and Designing Control
for the Notting Hill Carnival. Urban Studies, 1573–1590.
Bellomo, N., Clarke, D., Gibelli, L., Townsend, P., & Vreugdenhil, B. J. (2016). Human behaviours in
evacuation crowd dynamics: From modelling to “big data” toward crisis management. Physics of Life
Reviews, 1–21.
Bensilum, M., & Purser, D. (2003). GridFlow: An object-oriented building evacuation model combining pre-
movement and movement behaviours for performance-based design. Fire Safety Science, 941–953.
Berkowitz, L. (2000). Causes and consequences of feelings.
Bierlaire, M., Antonini, G., & Weber, M. (2003). Behavioral Dynamics for Pedestrians. In International
Conference on Travel Behavior Research.
Blue, V. J., & Adler, J. L. (1999). Cellular automata microsimulation of bidirectional pedestrian flows.
Transportation Research Record, 135–141.
Bonabeau, E. (2002). Agent-based modeling: methods and techniques for simulating human systems.
Proceedings of the National Academy of Sciences, 7280–7287.
Borgers, A., & Timmermans, H. (1986). A Model of Pedestrian Route Choice and Demand for Retail Facilities
within Inner-City Shopping Areas. Geographical Analysis, 115–128.
Branco, R. (2017). Integrated Algorithmic Design.
Brandon, L., & McLain-Kark, J. (2001). Effects of hand-drawing and CAD techniques on design
development: A comparison of design merit ratings. Journal of Interior Design, 26–34.
Braun, A., Musse, S. R., de Oliveira, L. P. L., & Bodmann, B. E. J. (2003). Modeling Individual Behaviours
in Crowd Simulation. Computer Animation and Social Agents, 143–148.
Castillo, E., Mínguez, R., & Castillo, C. (2008). Sensitivity analysis in optimization and reliability problems.
Reliability Engineering and System Safety, 1788–1800.
Chen, Y. (2017). Agent-based research on crowd interaction in emergency evacuation. Cluster Computing,
1–14.
Chliaoutakis, A. (2014). Utilizing Agent-Based Modeling to Gain New Insights into the Ancient Minoan
68
Civilization. International Foundation for Autonomous Agents and Multiagent Systems, 1371–1372.
Choudhary, R., & Michalek, J. (2005). Design optimization in computer-aided architectural design. In
Proceedings of the 10th International Conference on Computer Aided Architectural Design Research
in Asia (pp. 149–159).
Conway, S. R. (2006). An Agent-Based Model for Analyzing Control Policies and the Dynamic Service-Time
Performance of a Capacity-Constrained Air Traffic Management Facility. In Proceedings of the 25th
Congress of the International Council of the Aeronautical Sciences.
Crowds, W. with. (2015). Crowd Disasters by Year. Retrieved from
http://www.workingwithcrowds.com/crowd-disasters-year/
Dijkstra, J., Jessurun, J., & Timmermans, H. (2001). A multi-agent cellular automata model of pedestrian
movement. Pedestrian and Evacuation Dynamics, 173–179.
Duives, D. C., Daamen, W., & Hoogendoorn, S. P. (2013). State-of-the-art crowd motion simulation models.
Transportation Research Part C, 193–209.
Egges, A., Geraerts, R., & Overmars, M. (2006). Motion in games. Lecture Notes in Computer Science.
Engineers, S. of F. P. (2002). Engineering guide to human behavior in fire.
Fernandes, R. (2013). Generative Design : a new stage in the design process.
Ferreira, B., & Leitão, A. (2004). Generative Design for Building Information Modeling. In Fusion - Data
Integration at its best: Proceedings of the 32nd International Conference on Education and research
in Computer aided Architectural Design in Europe (pp. 635–644).
Filatova, T., Voinov, A., & van der Veen, A. (2011). Land market mechanisms for preservation of space for
coastal ecosystems: An agent-based analysis. Environmental Modelling and Software, 179–190.
Ganzerli, S., Pantelides, C. P., & Reaveley, L. D. (2000). Performance-based design using structural
optimization. Earthquake Engineering & Structural Dynamics, 1677–1690.
Gavanelli, M., Holland, A., & Sullivan, B. O. (2012). What-if analysis through simulation-optimization hybrids.
In European Conference on Modeling and Simulation - Track on Policy Modeling (pp. 1–7).
Gerber, D. J., Lin, S.--Hsin E., Pan, B. P., & Solmaz, A. S. (2012). Design Optioneering: Multi-disciplinary
Design Optimization through Parameterization, Domain Integration and Automation of a Genetic
Algorithm. Symposium on Simulation for Architecture and Urban Design, 23–30.
Gratch, J., & Marsella, S. (2001). Tears and fears: Modeling Emotions and Emotional Behaviors in Synthetic
Agents. Proceedings of the 5th International Conference on Autonomous Agents, 278–285.
Gwynne, S., Galea, E. R., Owen, M., & Lawrence, P. J. (1999). A review of the methodologies used in the
computer simulation of evacuation from the built environment. Building and Environment, 741–749.
Heath, B., Hill, R., & Ciarallo, F. (2009). A Survey of Agent-Based Modeling Practices. Journal of Artificial
Societies and Social Simulation, 1–46.
Helbing, D. (1991). A Mathematical Model for the Behavior of Pedestrians. Behavioral Science, 298–310.
Helbing, D. (1992). A Fluid-Dynamic Model for the Movement of Pedestrians. Complex Systems, 391–415.
Helbing, D., Buzna, L., Johansson, A., & Werner, T. (2005). Self-organized pedestrian crowd dynamics:
Experiments, simulations, and design solutions. Transportation Science, 1–24.
Helbing, D., Farkas, I. J., & Vicsek, T. (2000a). Freezing by heating in a driven mesoscopic system. Physical
Review Letters, 84, 1240–1243.
Helbing, D., Farkas, I. J., & Vicsek, T. (2000b). Simulating dynamical features of escape panic. Nature, 487–
490.
Helbing, D., Farkas, I. J., & Vicsek, T. (2002). Crowd Disasters and Simulation of Panic Situations. The
Science of Disasters, 330–350.
Helbing, D., Farkas, I., Molnár, P., & Vicsek, T. (2002). Simulation of pedestrian crowds in normal and

69
evacuation situations. Pedestrian and Evacuation Dynamics, 21–58.
Helbing, D., & Johansson, A. (2010). Pedestrian, Crowd, and Evacuation Dynamics. Encyclopedia of
Complexity and Systems Science, (4), 6476–6495.
Helbing, D., Johansson, A., & Al-Abideen, H. Z. (2007). Dynamics of crowd disasters: An empirical study.
Physical Review E - Statistical, Nonlinear, and Soft Matter Physics, 1–7.
Helbing, D., Molnár, P., Farkas, I. J., & Bolay, K. (2001). Self-organizing pedestrian movement. Environment
and Planning B: Planning and Design, 361–383.
Henderson, L. F. (1974). On the fluid mechanics of human crowd motion. Transportation Research, 509–
515.
Hughes, R. L. (2002). A continuum theory for the flow of pedestrians. Transportation Research Part B:
Methodological, 507–535.
Jain, S., & McLean, C. R. (2008). Components of an Incident Management Simulation and Gaming
Framework and Related Developments. Simulation, 3–25.
Jennings, N. R. (2000). On agent-based software engineering 6. Arrtificial Intelligence, 277–296.
Johansson, A., Batty, M., Hayashi, K., Bar, O. Al, Marcozzi, D., & Memish, Z. A. (2012). Crowd and
envirionmental management during mass gatherings. The Lancet Infectious Diseases, 150–156.
Johansson, F., Peterson, A., & Tapani, A. (2015). Waiting pedestrians in the social force model. Physica A,
95–107.
Johnson, N. R. (1987). Panic at the “Who Concert Stampede”: An Empirical Assessment. In Social Problems
(pp. 362–373).
Kalay, Y. E. (2004). Architecture’s New Media. London.
Kalay, Y. E. (2006). The impact of information technology on design methods, products and practices.
Design Studies, 357–380.
Kalay, Y. E. (2008). The Impact of Information Technology on Architectural Education in the 21st Century.
In First International Conference on Critical Digital: What Matter(s)? (pp. 3–6).
Kirchner, A., Klüpfel, H., Nishinari, K., Schadschneider, A., & Schreckenberg, M. (2003). Simulation of
competitive egress behavior: Comparison with aircraft evacuation data. Physica A: Statistical
Mechanics and Its Applications, 689–697.
Kirchner, A., Nishinari, K., & Schadschneider, A. (2003). Friction effects and clogging in a cellular automaton
model for pedestrian dynamics. Physical Review E, 1–12.
Kirchner, A., & Schadschneider, A. (2002). Simulation of evacuation processes using a bionics-inspired
cellular automaton model for pedestrian dynamics. Physica A, 260–276.
Kobes, M., Helsloot, I., de Vries, B., & Post, J. G. (2010). Building safety and human behaviour in fire: A
literature review. Fire Safety Journal, 1–11.
Kolarevic, B. (2001a). Designing and Manufacturing Architecture in the Digital Age. Architectural Information
Management, 117–123.
Kolarevic, B. (2001b). Digital Fabrication : Manufacturing Architecture in the Information Age. In Reinventing
the Discourse: How Digital Tools Help Bridge and Transform Research, Education and Practice in
Architecture (pp. 268–277).
Kolarevic, B. (2004a). Architecture in the Digital Age: Design and Manufacturing.
Kolarevic, B. (2004b). Back to the Future: Performative Architecture. International Journal of Architectural
Computing, 2(1), 43–50. http://doi.org/10.1260/
Kolarevic, B., & Malkawi, A. (2005). Performative Architecture.
Kotnik, T. (2006). Algorithmic Extension of Architecture.
Kotnik, T. (2010). Digital Architectural Design as Exploration of Computable Functions. International Journal

70
of Architectural Computing, 8(1), 1–16.
Kuligowski, E., Peacock, R., & Hoskins, B. L. (2010). A Review of Building Evacuation Models , 2nd Edition.
Law, A. M., & Kelton, W. D. (1991). Simulation Modeling and Analysis (Vol. 2).
Leggett, R. (2004). Real Time Crowd Simulation: A Review, 1–12.
Leitão, A. (2016). Programação para Arquitectura. http://doi.org/10.2312/UDMV/UDMV13/031-032
Leitão, A., Branco, R., & Cardoso, C. (2017). Algorithmic-based analysis. In Protocols Flows and Glitches
(pp. 137–146).
Li, C. (2016). China Moves to Halt ‘ Weird ’ Architecture. New York Times.
Macal, C. M., & North, M. J. (2005). Tutorial on Agent-Based Modeling and Simulation. In 37th conference
on Winter simulation (pp. 2–15).
Macal, C. M., & North, M. J. (2009). Agent-based Modeling and Simulation. In 2009 Winter Simulation
Conference (pp. 86–98).
Machairas, V., Tsangrassoulis, A., & Axarli, K. (2014). Algorithms for optimization of building design: A
review. Renewable and Sustainable Energy Reviews, 31(1364), 101–112.
Malkawi, A. M. (2004). Developments in environmental performance simulation. Automation in Construction,
13(4), 437–445.
Marie, A., & Schmidt, D. (2005). Digital Tectonic Tools. In Digital Design: the Quest for New Paradigms (pp.
657–664).
Méndez Echenagucia, T., Capozzoli, A., Cascone, Y., & Sassone, M. (2015). The early design stage of a
building envelope: Multi-objective search through heating, cooling and lighting energy performance
analysis. Applied Energy, 154, 577–591. Retrieved from
http://dx.doi.org/10.1016/j.apenergy.2015.04.090
Mitchell, W. J. (1989). Afterword : The Design Studio of The Future. In Afterword: the Design Studio of the
Future (pp. 479–494).
Mitchell, W., & Maccullough, M. (1999). Digital Design Media.
Moon, H. J., Choi, M. S., Kim, S. K., & Ryu, S. H. (2011). Case studies for the evaluation of interoperability
between a BIM based architectural model and building performance analysis programs. In
Proceedings of Building Simulation: 12th Conference of International Building Performance Simulation
Association (pp. 1511–1526).
Moussaid, M. (2011). The collective dynamics of human crowd motion: Where physics meets cognitive
science.
Moussaïd, M., Helbing, D., & Theraulaz, G. (2011). How Simple Rules Determine Pedestrian Behavior and
Crowd Disasters. Proceedings of the National Academy of Sciences of the United States of America,
108(17), 6884–8.
Negroponte, N. (1969). Toward a Theory of Architecture Machines. Journal of Architectural Education, 23(2),
9–12.
Nguyen, A.-T., Reiter, S., & Rigo, P. (2014). A review on simulation-based optimization methods applied to
building performance analysis. Applied Energy, 113, 1043–1058.
Nicholas, P., & Burry, M. (2007). Import as: interpretation and precision tools. In Digitization and
Globalization: Proceedings of the 12th International Conference on Computer Aided Architectural
Design Research in Asia (pp. 239–246).
Oxman, R. (2006). Theory and design in the first digital age. Design Studies, 27(3), 229–265.
Oxman, R. (2008). Performance-based design : Current practices and research issues. International Journal
of Architectural Computing, 6(1), 1–17.
Oxman, R. (2009). Performative design: A performance-based model of digital architectural design.
71
Environment and Planning B: Planning and Design, 36(6), 1026–1037.
Pan, X., Han, C., Law, K. H., & Latombe, J.-C. (2006). A computational framework to simulate human and
social behaviors for egress analysis, 1–10.
Pan, X., Han, C. S., Dauber, K., & Law, K. H. (2007). A multi-agent based framework for the simulation of
human and social behaviors during emergency evacuations. In AI and Society (Vol. 22, pp. 113–132).
Parisi, D. R., & Dorso, C. O. (2005). Microscopic dynamics of pedestrian evacuation. Physica A: Statistical
Mechanics and Its Applications, 354(1–4), 606–618.
Parker, D. C., Manson, S. M., Janssen, M. a., Hoffmann, M. J., & Deadman, P. (2004). Multi-Agent Systems
for the Simulation of Land-Use and Land-Cover Change : A Review. Annals of the Association of
American Geographers Abstract, 93(2), 314–337.
Pelechano, N., & Malkawi, A. (2007). Comparison of crowd simulation for building evacuation and an
alternative approach. In Building Simulation (Vol. 13, pp. 1514–1521).
Peteinarelis, A. (2016). Algorithmic thinking in design and construction: Working with parametric models. In
Parametricism vs. Materialism: Evolutions of Digital Technologies for Development (pp. 19–27).
Peters, B., & Kestelier, X. (2013). Computation Works. Architectural Design, 83(2), 8–15.
Petrini, F., & Ciampoli, M. (2012). Performance-based wind design of tall buildings. Structure and
Infrastructure Engineering, 8(10), 954–966.
Physik, V. F., & Kretz, T. (2007). Pedestrian Traffic.
Procházka, J., Cimler, R., & Olševičová, K. (2015). Pedestrian modelling in NetLogo. Advances in Intelligent
Systems and Computing, 316, 303–312.
Puusepp, R. (2011). Generating Circulation Diagrams for Architecture and Urban Design Using Multi-Agent
Systems.
Rothschild, M. (2015). The worst human stampedes. Retrieved from https://listverse.com/2010/11/26/10-
tragic-human-panics-and-stampedes/%0D
Santos, G., & Aguirre, B. E. (2004). A critical review of emergency evacuation simulation models.
Sarmady, S., Haron, F., Mohd Salahudin, M. M., & H., T. a. Z. (2007). Evaluation of existing software for
simulating of crowd at Masjid Al-Haram. Jurnal Pengurusan JWZH, 1, 83--95.
Schadschneider, A. (2001). Cellular Automaton Approach to Pedestrian Dynamics. Pedestrian and
Evacuation Dynamics.
Schadschneider, A., Klüpfel, H., Kretz, T., Rogsch, C., & Seyfried, A. (2009). Fundamentals of pedestrian
and evacuation dynamics. In Multi-Agent Systems for Traffic and Transportation Engineering (p.
Chapter: 6).
Schelling, T. C. (1971). Dynamic Models of Segregation. Journal of Mathematical Sociology, 1, 143–186.
Shea, K., Aish, R., & Gourtovaia, M. (2005). Towards integrated performance-driven generative design tools.
Automation in Construction, 14, 253–264. http://doi.org/10.1016/j.autcon.2004.07.002
Shi, J., Ren, A., & Chen, C. (2009). Agent-based evacuation model of large public buildings under fire
conditions. Automation in Construction, 18(3), 338–347. http://doi.org/10.1016/j.autcon.2008.09.009
Shi, X. (2010). Performance-based and performance-driven architectural design and optimization. Frontiers
of Architecture and Civil Engineering in China, 4(4), 512–518.
Shi, X., & Yang, W. (2013). Performance-driven architectural design and optimization technique from a
perspective of architects. Automation in Construction, 32, 125–135.
Silver, M. (2006). Towards a programming culture in the design arts. Architectural Design, 5–11.
Smith, E. R., & Conrey, F. R. (2007). Agent-based modeling: A new approach for theory building in social
psychology. Personality & Social Psychology Review, 11(1), 87–104.
Song, W., Xu, X., Wang, B.-H., & Ni, S. (2005). Simulation of evacuation processes using a multi-grid model.
72
Physica A: Statistical Mechanics and Its Applications, 317–324.
Song, W., Y U, Y., & F A N, W. (2005). A cellular automata evacuation model considering friction and
repulsion. Science in China Series E Technological Sciences, 403–413.
Sousa, S. C. D. E., Caetano, I., & Leitão, A. (2017). Agent-based modeling for architecture. In Proceedings
of the 35th Education and research in Computer Aided Architectural Design in Europe Conference
(pp. 93–102).
Spaeth, A. B., & Menges, A. (2011). Performative Design for Spatial Acoustics: Concept for an evolutionary
design algorithm based on acoustics as design driver. In Pro (pp. 461–468).
Still, G. K. (2016). Crowd safety and risk analysis. Retrieved from
http://www.gkstill.com/CV/PhD/Chapter3.html
Szalapaj, P. (2004). Contemporary architecture and the digital design process.
Szalapaj, P. (2005). The Digital Design Process in Contemporary Architectural Practice. In Digital Design:
the Quest for New Paradigms: 23rd eCAADe (pp. 751–759).
Terzidis, K. (2002). Algorithmic Design : A Paradigm Shift in Architecture ? In Architecture in the Network
Society: 22nd eCAADe Conference Proceedings, (pp. 201–207).
Terzidis, K. (2006). Algorithmic Architecture (First).
Terzidis, K. (2008). Algorithmic Complexity: Out of Nowhere. Complexity: Design Strategy and World View,
2(Comlexity: Design Strategy and World View), 75–86.
Thompson, P., Nilsson, D., Boyce, K., & McGrath, D. (2015). Evacuation models are running out of time.
Fire Safety Journal, 78, 251–261. http://doi.org/10.1016/j.firesaf.2015.09.004
Turrin, M., Von Buelow, P., & Stouffs, R. (2011). Design explorations of performance driven geometry in
architectural design using parametric modeling and genetic algorithms. Advanced Engineering
Informatics, 25(4), 656–675.
Uçar, B. (2006). An assessment of the architectural representation process within the computational design
environment.
Varas, A., Cornejo, M. D., Mainemer, D., Toledo, B., Rogan, J., Muñoz, V., & Valdivia, J. A. (2007). Cellular
automaton model for evacuation process with obstacles. Physica A: Statistical Mechanics and Its
Applications, 382(2), 631–642.
Vardouli, T. (2012). Computer of a thousand faces: Anthropomorphizations of the computer in design (1965-
1975). Doysa 29: Computational Design, 24–31.
Wagner, N., & Agrawal, V. (2014). An agent-based simulation system for concert venue crowd evacuation
modeling in the presence of a fire disaster. Expert Systems with Applications, 41(6), 2807–2815.
Wan, C., Chen, P., & Tiong, R. L. K. (2004). Assessment of IFCs for structural analysis domain. Journal of
Information Technology in Construction, 9(February), 75–95.
Weidinger, P. (2010). 10 Tragic human panics and stampedes. Retrieved from
https://listverse.com/2010/11/26/10-tragic-human-panics-and-stampedes/%0D
Williams, B. (2006). When code matters. Architectural Design, 16–25.
Woodbury, R. (2010). Elements of Parametric Design.
Yusuf, H. (2012). The impact of digital-computational design on the architectural design process.
Zheng, X., Zhong, T., & Liu, M. (2009). Modeling crowd evacuation of a building based on seven
methodological approaches. Building and Environment, 44(3), 437–445.
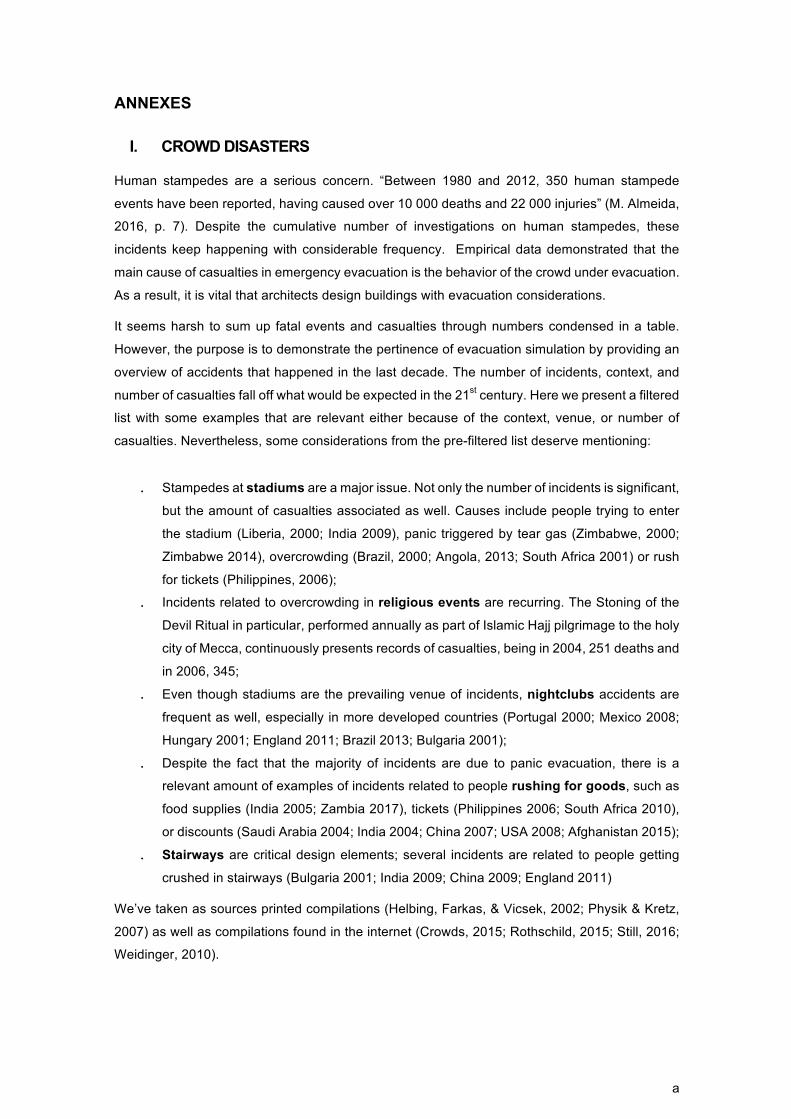
a
ANNEXES
I. CROWD DISASTERS
Human stampedes are a serious concern. “Between 1980 and 2012, 350 human stampede
events have been reported, having caused over 10 000 deaths and 22 000 injuries” (M. Almeida,
2016, p. 7). Despite the cumulative number of investigations on human stampedes, these
incidents keep happening with considerable frequency. Empirical data demonstrated that the
main cause of casualties in emergency evacuation is the behavior of the crowd under evacuation.
As a result, it is vital that architects design buildings with evacuation considerations.
It seems harsh to sum up fatal events and casualties through numbers condensed in a table.
However, the purpose is to demonstrate the pertinence of evacuation simulation by providing an
overview of accidents that happened in the last decade. The number of incidents, context, and
number of casualties fall off what would be expected in the 21st century. Here we present a filtered
list with some examples that are relevant either because of the context, venue, or number of
casualties. Nevertheless, some considerations from the pre-filtered list deserve mentioning:
. Stampedes at stadiums are a major issue. Not only the number of incidents is significant,
but the amount of casualties associated as well. Causes include people trying to enter
the stadium (Liberia, 2000; India 2009), panic triggered by tear gas (Zimbabwe, 2000;
Zimbabwe 2014), overcrowding (Brazil, 2000; Angola, 2013; South Africa 2001) or rush
for tickets (Philippines, 2006);
. Incidents related to overcrowding in religious events are recurring. The Stoning of the
Devil Ritual in particular, performed annually as part of Islamic Hajj pilgrimage to the holy
city of Mecca, continuously presents records of casualties, being in 2004, 251 deaths and
in 2006, 345;
. Even though stadiums are the prevailing venue of incidents, nightclubs accidents are
frequent as well, especially in more developed countries (Portugal 2000; Mexico 2008;
Hungary 2001; England 2011; Brazil 2013; Bulgaria 2001);
. Despite the fact that the majority of incidents are due to panic evacuation, there is a
relevant amount of examples of incidents related to people rushing for goods, such as
food supplies (India 2005; Zambia 2017), tickets (Philippines 2006; South Africa 2010),
or discounts (Saudi Arabia 2004; India 2004; China 2007; USA 2008; Afghanistan 2015);
. Stairways are critical design elements; several incidents are related to people getting
crushed in stairways (Bulgaria 2001; India 2009; China 2009; England 2011)
We’ve taken as sources printed compilations (Helbing, Farkas, & Vicsek, 2002; Physik & Kretz,
2007) as well as compilations found in the internet (Crowds, 2015; Rothschild, 2015; Still, 2016;
Weidinger, 2010).

b
Year Country Venue Injured Dead Context
2000 Portugal Nightclub 65 7 Gas bomb triggered panic evacuation and people converged to
only one of the available doors
2000 Brazil Stadium 200 0 Oversold stadium
2001 Ghana Stadium - 127 Panic triggered by tear gas caused stampede
2001 Japan Outside
ceremony 247 11 Stampede after a fireworks show
2003 USA Nightclub > 50 21 Panic erupted from pepper spray, code violation on egress
components caused poor evacuation
2003 USA Nightclub - 100 Fire triggered evacuation and people were trapped in the door
blocking the exit
2004 Saudi Arabia Religious ceremony
- 251 Overcrowding at the Stoning of the Devil Ritual
2005 India Religious ceremony
- 291 Pilgrims stampeded due to fire
2005 Iraq Bridge - > 640 Bridge stampede after rumors regarding suicide bomber
2006 Saudi Arabia Religious ceremony
- 345 Overcrowding at the Stoning of the Devil Ritual
2006 Philippines Stadium - 78 Rush for game show tickets
2006 Yemen Stadium > 200 51 Rally stampede
2007 China Shop > 30 3 20% discounts on cooking oil
2008 India Outside
ceremony 47 162
Stampede at temple after a rain shelter collapsed, which worshipers mistakenly took to be a landslide
2008 India Temple 425 224 Bomb rumor triggered stampede
2008 USA Shop - 1 Black Friday stampede
2009 India School 33 5 Rumor that rainwater had become electrically charged led to
panic, provoking a freezing-by-heating effect on stairway
2009 China School 26 8 Crush of students in a stairwell due to the simultaneous dismiss
of 52 classes
2010 India Temple < 200 71 Stampede after the gates of the temple collapsed
2010 Netherlands Outside
ceremony 63 0
Panic-driven stampede broke out during the Remembrance of the Dead ceremony on Dam Square
2010 Germany Outside
ceremony < 500 21 Crowd turbulences at the Love Parade
2010 Cambodia Outside
ceremony 0 347
Counter flow on overcrowded bridge during the Water Festival, freezing-by-heating effect
2010 India Religious ceremony
> 200 71 Stampede after the gates of the temple collapsed
2011 England Nightclub - 2 Sudden rush to the exit, in an overcrowded context led to crush
on the stairs
2012 Spain Stadium - 5 Panic-driven stampede during Halloween party
2013 Ivory Coast Stadium > 200 60 Stampede during a New Year’s fireworks celebration
2013 Brazil Nightclub 168 242 Nightclub fire, contributing the lack of emergency exits and
overcrowding
2013 India Train
Station 39 36
Stampede broke out, during the Hindu festival Kumbh Mela at a train station
2015 Saudi Arabia Religious ceremony
934 2262 Overcrowding
2015 Afghanistan School 42 12 Crush on a stairway while trying to escape building during an
earthquake
2017 Italy Outside
ceremony > 1500 1
Panic erupted after a robbery attempt during the screening the UEFA Champions League Final
Table3Incompletelistof21stcenturycrowddisasters
c
II. EVACUATION SIMULATION TOOLS
In this section we present Table 4, which reflects our process of filtering the evaluation tools, and
Table 5 which summarizes main characteristics of the 6 evacuation simulation tools previously
selected.
In Table 4, each of the columns corresponds to a layer of our filtering process. As models were
being excluded, the research on their characteristics was not pursued. The number of remaining
tools from each filter is presented in the last line of the table.
The table departs from a list of models provided by Arturo Cuesta, Orlando Abreu and Daniel
Alvear (2015). We filtered the models by: (1) Models that were used for simulating buildings; (2)
Models reviewed by the NIST; (3) The website was available; (4) The model was available for our
application; (5) The tool allowed the importation of CAD files; (6) The model was properly
validated.
From the filtering process the remaining models were Building Exodus, Pathfinder, Pedgo,
Simulex, Simwalk and Steps, whose main characteristics are presented in Table 5, according to
Kuligowski, Peacock, & Hoskins, (2010) categorization. We provide a brief explanation of the
mentioned features:
Main features . Modeling method regards the level of construction of the agent. Models can be
behavioral, movement, and partial behavioral. In movement models agents go from
A to B reacting to the environment. In behavioral models agents have decision-
making capabilities. Partial behavioral models are an intermediate between the
previous ones.
. Structure distinguishes discrete (fine network) from continuous models.
. Perspective of the model on occupant concerns the distinction between macro
simulation (global) and micro simulation (individual).
. Perspective of occupant on building distinguishes between models in which
agents have no knowledge on building’s paths, thus have route-decision mechanisms
(individual); and models in which agents automatically know the best route (global).
. Agent behavior categorization is related to the previous “modeling method”: agents
can have no behavior, implicit behavior, conditional behavior, artificial intelligence,
and probabilistic behavior. No behavior means that only the movement of the agent
is simulated (matching the modeling method movement); implicit behavior concerns
models that attempt to model behavior implicitly by assigning specific characteristics
that affect agents’ movement. In conditional models, agents’ actions are function of
local conditions (if-then rules). Artificial intelligence simulate human reasoning

d
processes. Probabilistic models are like conditional models, but conditional rules are
stochastic.
. Agent movement regards the definition of the modeling approach of occupants’
movement. This category is relevant for high density contexts. Pedestrians’
movement (speed and flow) can be dependent on: density of people (density
correlation), user’s choice, distance from surrounding elements (inter-person
distance), conditions on the environment (conditional), knowledge acquired during
evacuation (acquiring knowledge). There are also three categories specific for
discrete models: potential, in which agents move according to a potential floor field,
emptiness of next grid cell, where agents wait to move until the desired cell is free
and cellular automata, in which movement between neighbor cells is defined by of a
weighted die.
. Fire effects regards the possibility of incorporating fire data in the model
. Visualization concerns the options of visualization of the simulation
Main features
. Counter flow simulate counter flow.
. Pre-evacuation time incorporate the time delay corresponding to the time before
pedestrians start evacuation.
. Slow occupants define different populations according to movement capacity.
. Exit block specify blocked exits, either before or during the evacuation.
. Fire conditions behavior alteration of agents’ behavior according to fire conditions,
such as smoke and flames.
. Groups define agent group behavior.
. Elevator use evacuation through the use of elevators.
. Route choice mechanism for choosing the exit route. Include: fastest route (optimal),
shortest route, defined by the user of the model (user-def), and route based upon the
conditions in the building (conditional).
. Toxicity simulate incapacity of occupants as a result of toxic environment.
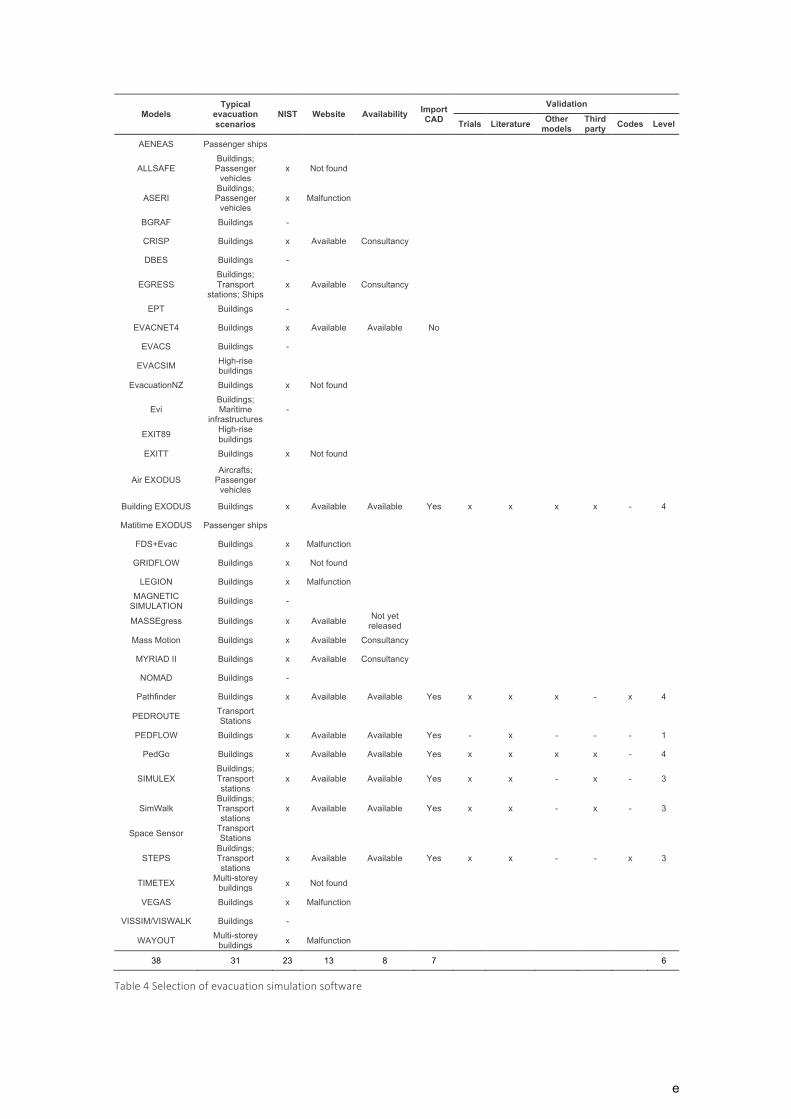
e
Models Typical
evacuation scenarios
NIST Website Availability Import CAD
Validation
Trials Literature Other models
Third party Codes Level
AENEAS Passenger ships
ALLSAFE Buildings; Passenger
vehicles x Not found
ASERI Buildings; Passenger
vehicles x Malfunction
BGRAF Buildings -
CRISP Buildings x Available Consultancy
DBES Buildings -
EGRESS Buildings; Transport
stations; Ships x Available Consultancy
EPT Buildings -
EVACNET4 Buildings x Available Available No
EVACS Buildings -
EVACSIM High-rise buildings
EvacuationNZ Buildings x Not found
Evi Buildings; Maritime
infrastructures -
EXIT89 High-rise buildings
EXITT Buildings x Not found
Air EXODUS Aircrafts;
Passenger vehicles
Building EXODUS Buildings x Available Available Yes x x x x - 4
Matitime EXODUS Passenger ships
FDS+Evac Buildings x Malfunction
GRIDFLOW Buildings x Not found
LEGION Buildings x Malfunction
MAGNETIC SIMULATION
Buildings -
MASSEgress Buildings x Available Not yet
released
Mass Motion Buildings x Available Consultancy
MYRIAD II Buildings x Available Consultancy
NOMAD Buildings -
Pathfinder Buildings x Available Available Yes x x x - x 4
PEDROUTE Transport Stations
PEDFLOW Buildings x Available Available Yes - x - - - 1
PedGo Buildings x Available Available Yes x x x x - 4
SIMULEX Buildings; Transport stations
x Available Available Yes x x - x - 3
SimWalk Buildings; Transport stations
x Available Available Yes x x - x - 3
Space Sensor Transport Stations
STEPS Buildings; Transport stations
x Available Available Yes x x - - x 3
TIMETEX Multi-storey
buildings x Not found
VEGAS Buildings x Malfunction
VISSIM/VISWALK Buildings -
WAYOUT Multi-storey
buildings x Malfunction
38 31 23 13 8 7 6
Table4Selectionofevacuationsimulationsoftware
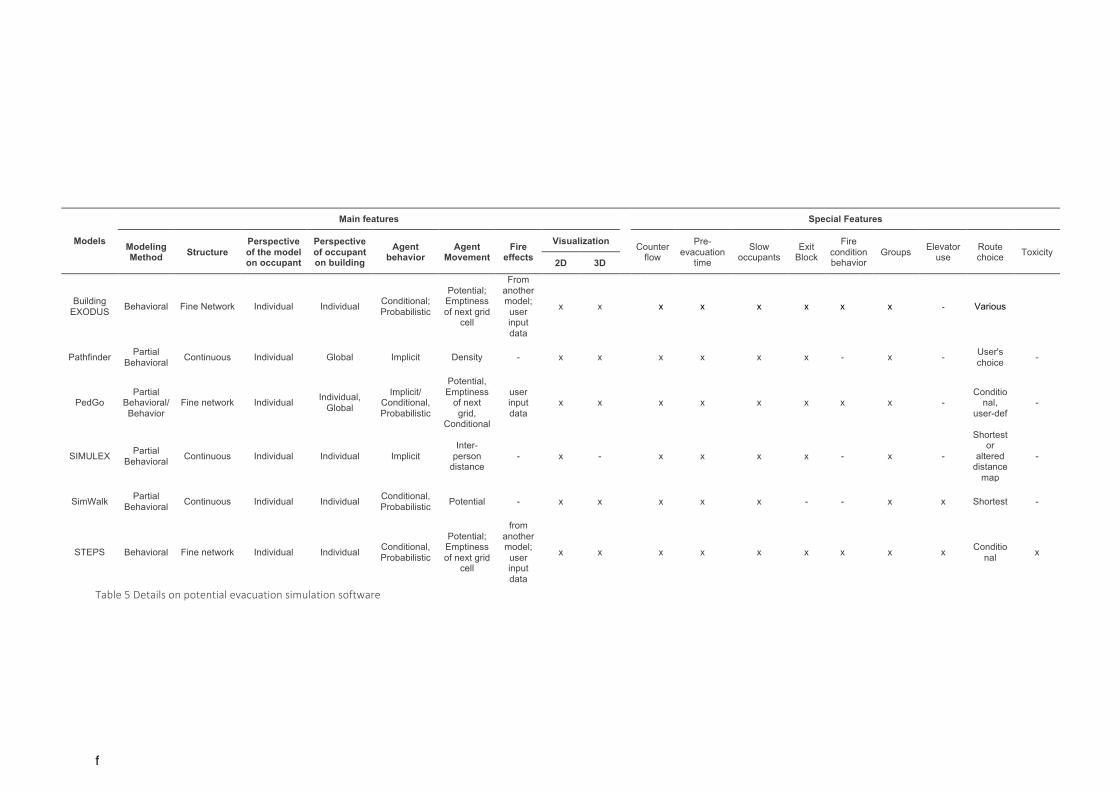
f
Table5Detailsonpotentialevacuationsimulationsoftware
Models
Main features Special Features
Modeling Method Structure
Perspective of the model on occupant
Perspective of occupant on building
Agent behavior
Agent Movement
Fire effects
Visualization Counter flow
Pre-evacuation
time
Slow occupants
Exit Block
Fire condition behavior
Groups Elevator use
Route choice Toxicity
2D 3D
Building EXODUS Behavioral Fine Network Individual Individual Conditional;
Probabilistic
Potential; Emptiness of next grid
cell
From another model; user input data
x x x x x x x x - Various
Pathfinder Partial Behavioral Continuous Individual Global Implicit Density - x x x x x x - x - User's
choice -
PedGo Partial
Behavioral/Behavior
Fine network Individual Individual, Global
Implicit/ Conditional, Probabilistic
Potential, Emptiness
of next grid,
Conditional
user input data
x x x x x x x x - Conditio
nal, user-def
-
SIMULEX Partial Behavioral Continuous Individual Individual Implicit
Inter-person
distance - x - x x x x - x -
Shortest or
altered distance
map
-
SimWalk Partial Behavioral Continuous Individual Individual Conditional,
Probabilistic Potential - x x x x x - - x x Shortest -
STEPS Behavioral Fine network Individual Individual Conditional, Probabilistic
Potential; Emptiness of next grid
cell
from another model; user input data
x x x x x x x x x Conditional x