performance-based management of traffic signals
TRANSCRIPT

TRANSPORTATION RESEARCH BOARD
@NASEMTRB#TRBwebinar
Performance-Based Management of Traffic
SignalsMay 28, 2020
2:00-3:30 PM Eastern

The Transportation Research Board
has met the standards and
requirements of the Registered
Continuing Education Providers
Program. Credit earned on completion
of this program will be reported to
RCEP. A certificate of completion will
be issued to participants that have
registered and attended the entire
session. As such, it does not include
content that may be deemed or
construed to be an approval or
endorsement by RCEP.
PDH Certification Information:
•1.5 Professional Development Hours (PDH) – see follow-up email for instructions•You must attend the entire webinar to be eligible to receive PDH credits•Questions? Contact Reggie Gillum at [email protected]
#TRBwebinar

Learning Objectives
#TRBwebinar
1. Identify intersections and systems that could benefit from performance-based operation
2. Identify traits of locations that have successfully installed performance-based systems

Anyone can measure signal performance.
And most do.


Why Automate?
1. Attract funding


Why Automate?
1. Attract funding2. Avoid costly assumptions


Why Automate?
1. Attract funding2. Avoid costly assumptions3. Buy time

Why Automate?
1. Attract funding2. Avoid costly assumptions3. Buy time4. Bonus: Look for trouble

Happy sleuthing!


NCHRP 03-122PERFORMANCE-BASED
MANAGEMENT OF TRAFFIC SIGNALS
TRB WEBINARALISON TANAKA, PE
ITS Section
Portland Bureau of Transportation
MAY 28, 2020

DECEMBER 2018
Signal performance measures profoundly change all aspects of traffic signal operations from planning to design and implementation through better-informed, data-driven decisions. This guidebook provides information to help agencies invest in signal performance measures as part of a comprehensive approach to performance-based management.
NCHRP PROJECT 03-122 2
FOCUS FOR THE GUIDEBOOK

DECEMBER 2018
CHAPTER 1. ROADMAP TO PERFORMANCE MEASURESIntroduction to signal performance measures, benefits, required investments, and the guidebook chapters.
NCHRP PROJECT 03-122 3

DECEMBER 2018NCHRP PROJECT 03-122
FLOW OF INFORMATION
4

SOLVE PROBLEMS
FASTER
AUTOMATE ALERTS FOR PROACTIVE
MANAGEMENT
REDUCE MODELING NEEDS FOR EXISTING
CONDITIONS
IDENTIFY HIGH-PRIORITY
LOCATIONS
TRACK PROGRESS TOWARDS AGENCYGOALS
PRODUCE SHARABLE
REPORTS THAT SUMMARIZE
IMPACTS
DECEMBER 2018NCHRP PROJECT 03-122
SIGNAL PERFORMANCE MEASURE BENEFITS
5

Chapter
6
Chapter
5
Chapter
4
Chapters
2+3
DECEMBER 2018NCHRP PROJECT 03-122
IMPLEMENTING SIGNAL PERFORMANCE MEASURES
6
Select Performance
Measures
Procure Resources
Conduct System Needs
Gap Assessment
Determine
Implementation Scale
Integrate into Agency
Practice
Apply Performance
Measures
Verify System
Configure System5
8
7
6
1
4
3
2
DECEMBER 2018
CHAPTER 2. PERFORMANCE MEASURE SELECTIONAlign performance measures with agency goals, objectives, and methods of signal system management using the outcome-based process.
NCHRP PROJECT 03-122 7

DECEMBER 2018
Results in signal timing that is based on the operating environment, users, user priorities by movement, and local operational objectives.
NCHRP PROJECT 03-122 8
OUTCOME-BASED PROCESS

Communication Equipment Health
Detection Equipment Health
Vehicle Delay
Pedestrians
Bicycles
Safety
Vehicle Progression
Rail
Emergency Vehicles
Transit
TrucksOBJECTIVES
DECEMBER 2018NCHRP PROJECT 03-122 9

• Percent of movements with queues that exceed storage
• Percent of vehicles entering on red
• Number of conflicting movements
DECEMBER 2018NCHRP PROJECT 03-122
SAFETY
10
3INTERSECTION /
UNCOORDINATED TIMING
• 3.10 Estimated Queue Length
• 3.11 Oversaturation Severity Index
• 3.15 Estimated Pedestrian Conflicts
• 3.16 Yellow/Red Actuations
• 3.17 Red-Light-Running (RLR) Occurrences
AGGREGATED STATUS REPORT(S) INDIVIDUAL PERFORMANCE MEASURE(S)
45
SYSTEM / COORDINATED
TIMING
ADVANCED SYSTEMS AND APPLICATIONS
2DETECTION
1COMMUNICATION
EXAMPLE

DECEMBER 2018NCHRP PROJECT 03-122
ADDITIONAL RESOURCES
11
Pooled Fund Study Reports and Workshop
Performance Measures for
Traffic Signal Systems: An
Outcome-Oriented
Approach
Integrating Traffic Signal
Performance Measures into
Agency Business Processes
January 2016 ATSPM
Workshop Presentations
Indiana Traffic Signal Hi
Resolution Data Logger
Enumerations
High-Resolution Data Enumerations
Utah DOT Open Source Software
Utah Department of
Transportation ATSPM Website
FHWA Open Source
Application Development
Portal (OSADP) ATSPM Source
Code
Utah Department of
Transportation ATSPM GitHub
Development Website
NCHRP 3-90: Operation of Traffic Signals in
Oversaturated Conditions
Operation of Traffic Signal
Systems in Oversaturated
Conditions, Volume 1:
Practitioner Guidance
Operation of Traffic Signal
Systems in Oversaturated
Conditions, Volume 2: Final
Report
ATSPM Webinars FHWA EDC-4 ATSPM Website
AASHTO Innovation Initiative FHWA Every Day Counts
DECEMBER 2018NCHRP PROJECT 03-122
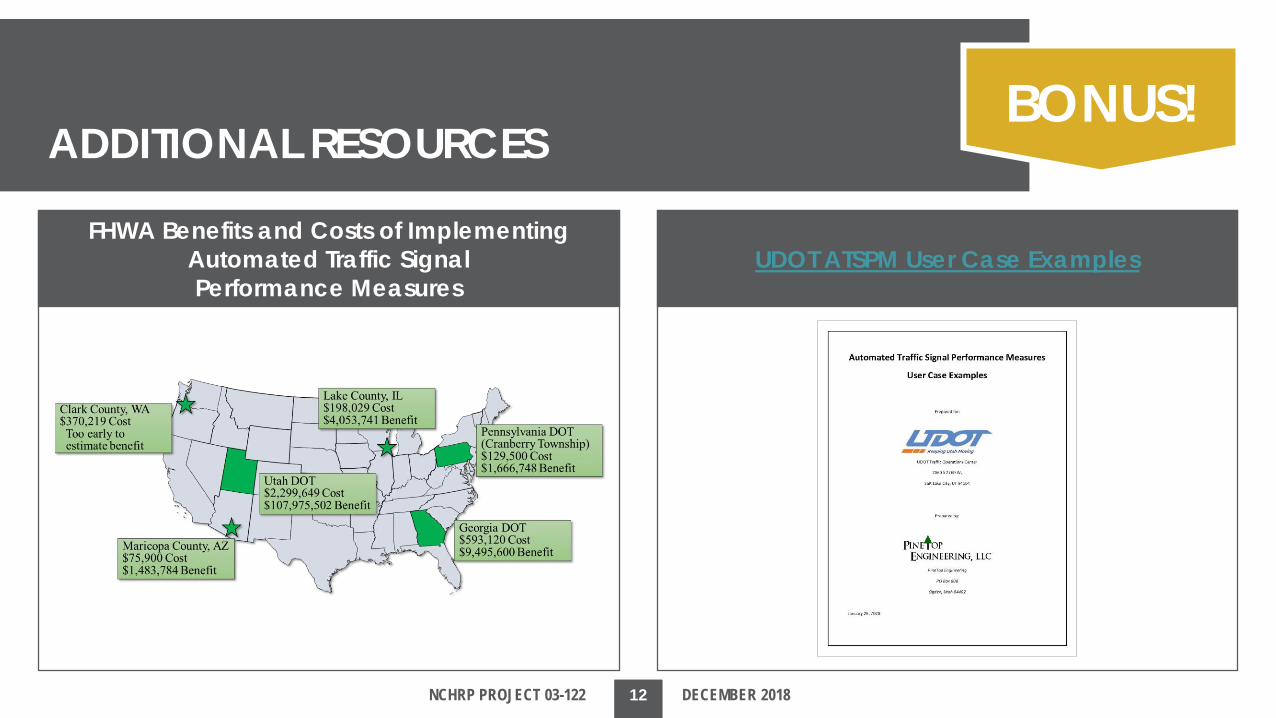
ADDITIONAL RESOURCES
12
FHWA Benefits and Costs of Implementing
Automated Traffic Signal
Performance MeasuresUDOT ATSPM User Case Examples
BONUS!

DECEMBER 2018
CHAPTER 3. PERFORMANCE MEASURE DETAILSLearn about 26 signal performance measures – required inputs, resulting outputs, example applications, and additional references.
NCHRP PROJECT 03-122 13

DECEMBER 2018
3.11 Oversaturation Severity Index
3.12 Pedestrian Volumes
3.13 Pedestrian Phase Actuation and Service
3.14 Estimated Pedestrian Delay
3.15 Estimated Pedestrian Conflicts
3.16 Yellow/Red Actuations
3.17 Red-Light-Running (RLR) Occurrences
3.18 Effective Cycle Length
3.19 Progression Quality
3.20 Purdue Coordination Diagram
3.21 Cyclic Flow Profile
3.22 Offset Adjustment Diagram
3.23 Travel Time and Average Speed
3.24 Time-Space Diagram
3.25 Preemption Details
3.26 Priority Details
NCHRP PROJECT 03-122 14
PERFORMANCE MEASURES
3.1 Communication Status
3.2 Flash Status
3.3 Power Failures
3.4 Detection System Status
3.5 Vehicle Volumes
3.6 Phase Termination
3.7 Split Monitor
3.8 Split Failures
3.9 Estimated Vehicle Delay
3.10 Estimated Queue Length

ORGANIZATIONAL
OPERATIONS
DESIGN & CONSTRUCTION
PLANNING
MAINTENANCE
STAKEHOLDERS
• Identify when vehicles are arriving during the cycle (i.e. on green or red) for a particular phase or overlap at an intersection.
APPLICATIONS
DECEMBER 2018NCHRP PROJECT 03-122 15
COMMUNICATION
COORDINATED
UNCOORDINATED
DETECTION
ADVANCED
Shows individual vehicle arrival times relative to green intervals.
DESCRIPTION
EQUIPMENT HEALTH
PEDESTRIANS
VEHICLE PROGRESSION
VEHICLE DELAY
BICYCLES
TRANSIT
EMERGENCY VEHICLES
RAIL
TRUCKS
SAFETY
OBJECTIVES
CENTRAL SYSTEM LOW-RESOLUTION
CONTROLLER HIGH-RESOLUTION
VENDOR-SPECIFIC
DATA SOURCES
• Did offset adjustments improve progression for a particular approach at an intersection?
EXAMPLE USES
3.20 PURDUE COORDINATION DIAGRAM
AVI / AVL /SEGMENT SPEED
EXAMPLE

DECEMBER 2018
CHAPTER 4. SYSTEM NEEDS FOR PERFORMANCE MEASURESDetermine if resources need to be procured to achieve selected signal performance measures.
NCHRP PROJECT 03-122 16

DECEMBER 2018
Determine if additional equipment and/or staff are needed to deploy desired signal performance measures, considering agency resources as well as those that may be shared with other agencies.
NCHRP PROJECT 03-122 17
GAP ASSESSMENT

Controller High-Resolution Data
Central System Low-Resolution Data
Vendor-Specific Data
Automated Vehicle Identification (AVI) Data
Probe Vehicle Segment Speed Data
Automated Vehicle Location (AVL) Data
Connected Vehicle (CV) Data
DATASOURCES
DECEMBER 2018NCHRP PROJECT 03-122 18

• Because of the large amount of data, system management may be challenging.
TIMESTAMP EVENT CODE PARAMETER DESCRIPTION
02/15/17 12:01:16.0 8 4 Phase 4 Begin Yellow Clearance
02/15/17 12:01:16.0 8 8 Phase 8 Begin Yellow Clearance
02/15/17 12:01:19.4 81 9 Detector 9 Off
02/15/17 12:01:19.5 10 4 Phase 4 Begin Red Clearance
02/15/17 12:01:19.5 10 8 Phase 8 Begin Red Clearance
02/15/17 12:01:20.0 1 2 Phase 2 Begin Green
02/15/17 12:01:20.0 1 6 Phase 6 Begin Green
02/15/17 12:01:25.5 82 19 Detector 19 On
02/15/17 12:01:28.0 81 19 Detector 19 Off
02/15/17 12:01:29.3 82 9 Detector 9 On
CHALLENGES
EXAMPLE DATA: 1/10-SECOND ENUMERATIONS
DECEMBER 2018NCHRP PROJECT 03-122
CONTROLLER HIGH-RESOLUTION DATA
19
INTERNAL
EXTERNAL
Timestamped “events” (e.g., detector inputs and signal display outputs) recorded by the controller at 1/10-second resolution.
DESCRIPTION
• Highly-detailed records allow a wide variety of signal performance measures to be calculated.
CAPABILITIES
EXAMPLE

DECEMBER 2018NCHRP PROJECT 03-122
ATSPM SYSTEM COMPONENTS
20
COMMUNICATION DETECTION DATA LOGGING DATA STORAGE SOFTWARE
High-Resolution Data
Other Data Source
Hardware
Cloud
Operating System
Software
Database Software
ATSPM System Software
Central System Software

DECEMBER 2018NCHRP PROJECT 03-122
DETECTION
21
Equipment used to detect presence of roadway users required for many measures.
DESCRIPTION• Distance from the stop bar (i.e. advance,
stop bar, past the stop bar)
• Type of wiring (i.e. lane-by-lane, multi-lane)
• Type of detection (i.e. presence, count)
• Filtering options (e.g., speed settings)
• Detector channel mapping
CONSIDERATIONS• Stop bar presence
• Stop bar count
• Advance
• Automated Vehicle Identification (AVI)
• Automated Vehicle Location (AVL)
• Pedestrian
• Speed
OPTIONS
EXAMPLE

DECEMBER 2018
CHAPTER 5. IMPLEMENTATION OF PERFORMANCE MEASURESProgram intersections, verify the ATSPM system is reporting accurate information, and use reports to make signal timing and maintenance adjustments.
NCHRP PROJECT 03-122 22

DECEMBER 2018NCHRP PROJECT 03-122
INTERSECTION CONFIGURATION REQUIREMENTS
23
Signal ID Number (e.g., IP address)
Controller Controller Type
Firmware Version
Approach Northbound
Southbound
Westbound
Eastbound
Phase Number (e.g., Phases 1-8)
Channel Number (e.g., Channels 1-96)
Type
Stop Bar Presence
Stop Bar Count
Advance
AVI/AVL
Pedestrian
Speed
Location
(Advance Only)
Distance from stop bar (e.g., 400 feet)
Speed on approach (e.g., 40 mph)
Lane Number
Left 1, 2, n
Left-Thru 1, 2, n
Thru 1, 2, n
Thru-Right 1, 2, n
Right 1, 2, n
Bicycle 1, 2, n
DATA LOGGING DETECTION

VERIFICATION
DECEMBER 2018
Data Availability
Timestamps
Intersection Configuration
Detector Configuration
Data Verification
NCHRP PROJECT 03-122 24

Before time zone adjustment Plan 1 shown starting at 1:00 AM because data is recorded using UTC
Force-offs (indicative of coordination) shown starting at 1:00 AM
After time zone adjustment Timestamps adjusted to local time zone so Plan 1 shown starting at 6:00 AM
Force-offs (indicative of coordination) shown starting at 6:00 AM
DECEMBER 2018NCHRP PROJECT 03-122
TIMESTAMPS
25
Data is not being reported at the correct times.
POTENTIAL ISSUE• Enumerations timestamped
using Coordinated Universal Time (UTC).
• Daylight savings time is not enabled.
POTENTIAL CAUSE EXAMPLE: DATA REPORTED AT CORRECT TIMES?
Time (Hour of Day)
Ph
ase
Nu
mb
er
Time (Hour of Day)
Ph
ase
Nu
mb
er
EXAMPLE

DECEMBER 2018
5.5.8 Time-of-Day (TOD) Plans
5.6.1 Cycle Length
5.6.2 Splits
5.6.3 Offsets
5.7.1 Advanced Signal Systems
5.7.2 Preferential Treatment
5.8.1 Communication
5.8.2 Signal Cabinet Equipment
5.8.3 Vehicle Detection
5.8.4 Pedestrian Detection
NCHRP PROJECT 03-122 26
VALIDATION
5.5.1 Yellow Change
5.5.2 Red Clearance
5.5.3 Minimum Green
5.5.4 Maximum Green
5.5.5 Passage Time
5.5.6 Pedestrian Intervals
5.5.7 Recalls

Identify high max-outs during low-volume periods
DECEMBER 2018NCHRP PROJECT 03-122
5.8.3 VEHICLE DETECTION
27
• Alarms
• Phase termination
• Outage locations
• Equipment type and age
CONSIDERATIONS EXAMPLE3.1 COMMUNICATION STATUS3.2 FLASH STATUS3.3 POWER FAILURES3.4 DETECTION SYSTEM STATUS3.5 VEHICLE VOLUMES3.6 PHASE TERMINATION3.7 SPLIT MONITOR3.8 SPLIT FAILURES3.9 ESTIMATED VEHICLE DELAY3.10 ESTIMATED QUEUE LENGTH3.11 OVERSATURATION SEVERITY INDEX3.12 PEDESTRIAN VOLUMES3.13 PEDESTRIAN PHASE ACTUATION AND SERVICE3.14 ESTIMATED PEDESTRIAN DELAY3.15 ESTIMATED PEDESTRIAN CONFLICTS3.16 YELLOW/RED ACTUATIONS3.17 RED-LIGHT-RUNNING (RLR) OCCURRENCES3.18 EFFECTIVE CYCLE LENGTH3.19 PROGRESSION QUALITY3.20 PURDUE COORDINATION DIAGRAM3.21 CYCLIC FLOW PROFILE3.22 OFFSET ADJUSTMENT DIAGRAM3.23 TRAVEL TIME AND AVERAGE SPEED3.24 TIME-SPACE DIAGRAM3.25 PREEMPTION DETAILS3.26 PRIORITY DETAILS
PERFORMANCE MEASURES
4.1 Detection
STM2 REFERENCE
High number of max-outs overnightIdentify detectors not reporting volumes
Phase 6 gapping out after bad detector splice fixed
Lane 3 detector not reporting volumes until bad splice fixed
Time (Hour of Day)
Ph
ase
Nu
mb
er
Time (Hour of Day)
Vo
lum
e (
Ve
hic
les
Pe
r H
ou
r)
EXAMPLE

PREDICTIVE TOOLS AUTOMATED ALERTS AGGREGATED REPORTS
Use high-resolution data to develop
predictive models (e.g., Purdue Link
Pivot Analysis)
Automatically flag issues and alert
technicians to issues and
inefficiencies
Identify “hot spots,” compare to
historical data, and produce shareable
reports
Data EntryIntersections with a low number of records in the database
Max-OutPhases with a high number of max-outs during low-volume periods
Pedestrian CallPhases with a high number of pedestrian actuations during low-volume periods
Detector CountAdvance detectors reporting low volumes during high-volume periods
Force-OffPhases with a high number of force-offs during low-volume periods
DECEMBER 2018NCHRP PROJECT 03-122
REPORTING ADVANCEMENTS
28
108-second offset adjustment recommended based on
maximum arrivals on green
NBL Ph5(6) experiencing highest number of split
failures throughout the day

DECEMBER 2018
CHAPTER 6. INTEGRATION INTO AGENCY PRACTICEStrategies to fully integrate signal performance measures into agency management practices, create collaboration opportunities between groups, share resources, and communicate benefits.
NCHRP PROJECT 03-122 29

DECEMBER 2018
Defines “basic service” as it relates to the traffic signal system, demonstrates needs, identifies how well expectations are being met, and prioritizes investments.
NCHRP PROJECT 03-122 30
TRAFFIC SIGNAL MANAGEMENT
PLAN (TSMP)

DECEMBER 2018
Organizational framework used to describe the level of management formality and optimization, ranging from ad-hoc actions to managed, optimized procedures.
NCHRP PROJECT 03-122 31
CAPABILITY MATURITY
MODEL (CMM)

ORGANIZATIONALTRANSPORTATION
PLANNING
DESIGN AND
CONSTRUCTION
TRAFFIC
OPERATIONSMAINTENANCE
Performance-
based prioritization
Shareable reports
Quantitative
tracking
Agency policies
and standards
Inter-agency
collaboration
IT staff
Model validation
Evaluate benefit /
cost for programs
and grants
Compare
equipment types
Evaluate
maintenance of
traffic (MOT)
Continuously-
available data for
less modeling
Automated alerts
for operational
issues
Prioritize signal
retiming
Confirm public
service requests
Continuously-
available data to
support
preventative
maintenance
Automated alerts
for maintenance
issues
Prioritize
improvements
DECEMBER 2018NCHRP PROJECT 03-122
IMPACT TO AGENCY ACTIVITIES
32

Performance-Based Management of Traffic Signals
Mark Taylor, P.E., PTOE
UDOT Traffic Signal Operations Engineer
Experiences from Agencies that Have Deployed Practices
Photo Courtesy: Utah DOT

Evolution of Traffic Signal Performance MeasuresElectromechanical
Firmware – Data Loggers - ATSPMs
Photo Courtesy: INDOT & PURDUE University
Photo Courtesy: Econolite & New York City
Serial Inputs Test Location – Purdue
Image Courtesy: Wavetronix

Automated Traffic Signal Performance Measures Basic Concept
- 1/10th sec. data - Signal controller - Intersection, Corridor, City, System
Automated Data Collection
Useful Information about Performance
Why model or estimate what you can now measure and automate?
TimestampEvent Code
Event Parameter
5/19/2020 3:08:44.8 9 25/19/2020 3:08:44.8 9 65/19/2020 3:08:46.6 1 35/19/2020 3:08:46.6 1 85/19/2020 3:08:46.6 11 25/19/2020 3:08:46.6 11 65/19/2020 3:08:51.4 82 595/19/2020 3:08:51.6 81 59
End of Yellow Ø2 & Ø6
Begin of Green Ø3 & Ø8
End of Red Clearance Ø 2 & Ø6
Detector On Ch. 59
Detector Off Ch. 59

Automated Traffic Signal Performance Measures
Image Courtesy: Utah DOT - https://udottraffic.utah.gov/atspm

Purdue Coordination Diagram
Turning Movement Counts
Purdue Split Failure
Purdue Phase Termination
Image Courtesy: Utah DOT
Various Performance Measures from ATSPMs
Timing and Actuation
Pedestrian Delay

Percent of Signals Communicating Example: Utah(That Should be Communicating)
Image Courtesy: Utah DOT

Power Failures Example: Indiana(Logged over six months for nine corridors)
Image Courtesy: NCHRP Project 03-122 & Purdue University

0
1300
100
400
800
500600700
1100
9001000
300
1200
200
Throughput Volume Example: Pennsylvania
Volume Peak~1200 VPH
12PM
Flow
Rat
e(V
PH)
Free Plan 2Plan 1
7AM 7PM 12PM 7PM
Volume Peak~1250 VPH
Plan 1 Free Plan 2
Flow
Rat
e(V
PH)
7AMImage Courtesy: Pennsylvania DOT
BEFORE RETIMING AFTER RETIMING

Purdue Coordination Diagram Example: VirginiaBefore Offset Adjustment
After Offset Adjustment
Image Courtesy: NCHRP Project 03-122 & Virginia DOT

Time-of-Day vs Peer-to-Peer & Custom Logic Example: Utah (Purdue Coordination Diagram)
Time-of-Day
Peer-to-Peer & Custom Logic
85% Arrival on GreenCycle Length 90 s or 120 s
Cycle Length varies 45 s to 120 s88% Arrival on Green
Mountain View & 12600 South WB – Wed. September 2, 2015
Mountain View & 12600 South WB – Tues. October 20, 2015
Image Courtesy: Utah DOT

Initial Percent Arrival on Green
Increase in Percent Arrival on Green
Decrease in Percent Arrival on Green
Corridor Midday Arrival on Green
74%
7%
Progression Quality Example: Utah(Offset Adjustment Impact on Percent on Green -POG)
Image Courtesy: NCHRP Project 03-122 & Utah DOT

Image Courtesy: Georgia DOT
Purdue Split Failure Example 9:00 AM to 7:00 PM: Georgia
Before Condition§ 97 split failures
After Condition (green time increased 5-7 s)§ 55 split failures§ 43% reduction

Photo Courtesy: Google Maps; Image Courtesy: Utah DOT
Consideration for Pedestrian Delay: Example: Utah
8:
BEFORE: Uncoordinated
020
80100120
6040
Delay (sec) AFTER: Coordinated
7:15 am7:30 am 7:45 am 8:00 am7:15 am 7:30 am 7:45 am
Ave. Delay: 38 sec.Ave. Delay: 48 sec.
87 7

ATSPM Daily System Health Alerts – Utah (Year 2019)No ATSPM Data: identifies signals with < 500 records in the database between midnight and midnight the previous day.
1Too Many Max Outs: identifies phases with > 90% max outs in at least 50 activations between 1 a.m. and 5 a.m.
2Too Many Force Offs: identifies phases with > 90% force offs in at least 50 activations between 1 a.m. and 5 a.m.
3Too Many Ped Calls: identifies phases with > 200 pedestrian activations between 1 a.m. and 5 a.m.
4Low PCD Detector Count: identifies phases with PCD detectors with < 100 vehicles between 5 p.m. and 6 p.m. the previous day.
5
No ATSPM Data, 83, 11%
Too Many Force Offs, 17, 2%
Too Many Max Outs, 337, 45%
Low PCD Count, 163, 22%
Too Many Ped Calls, 148, 20%
ATSPM DETECTOR ISSUES - AUTOMATED
748 Detector Issues Identified and Corrected during Year 2019
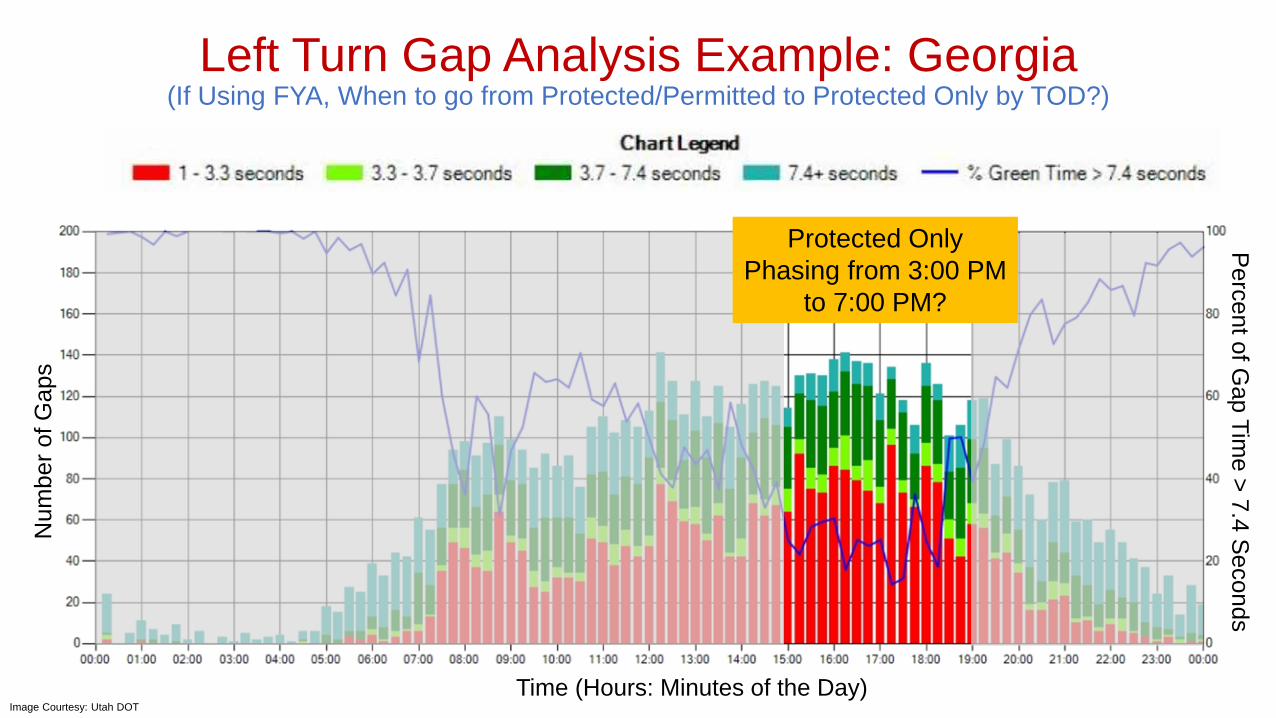
Left Turn Gap Analysis Example: Georgia(If Using FYA, When to go from Protected/Permitted to Protected Only by TOD?)
Percent of Gap Tim
e > 7.4 SecondsN
umbe
r of G
aps
Time (Hours: Minutes of the Day)
Protected Only Phasing from 3:00 PM
to 7:00 PM?
Image Courtesy: Utah DOT

Image Courtesy: Georgia GOT
System Wide Dashboards: Example: Georgia (April 2020)

Utah
Electronic Logbook for Traffic Signals & ITS - Utah
Why Use an Electronic Logbook?• Easier to retrieve, read, sort and analyze• Need a system to manage remote changes• Provide access to all agency programs • Improved management, security and accountability
Photo Courtesy: Utah DOT
Electronic Locks
Central Traffic Signal Management System

Optimizing Progression at Traffic Signals - Utah
ØTraditional Retiming: 3 to 5 Years
ØArtificial Intelligence / Machine Learning Retiming: Every Other Month
Photo Courtesy: Image purchased from istockphoto.com Image Courtesy: Utah DOT - Created by Avenue Consultants

Today’s Presenters#TRBwebinar
Darcy Bullock, PurdueUniversity
Alison Tanaka, Mark Taylor, Utah DOT Portland, OR DOT
Phil Rust, City of San Diego

Get Involved with TRB• Getting involved is free!
• Join a Standing Committee (http://bit.ly/TRBstandingcommittee)
• Become a Friend of a Committee (http://bit.ly/TRBcommittees)– Networking opportunities– May provide a path to become a
Standing Committee member
• For more information: www.mytrb.org– Create your account– Update your profile
@NASEMTRB
@NASEMTRB
Transportation Research Board
#TRBwebinar

#TRB100