performance co-pilot™ user's and administrator's guide - pcp.io · about this guide •...
TRANSCRIPT

Performance Co-Pilot™ User's and Administrator's Guide

Performance Co-Pilot™ User's and Administrator's GuideMaintained by:The Performance Co-Pilot Development Team
<[email protected]> https://pcp.io
PERFORMANCECO-PILOT
Copyright © 2000, 2013 Silicon Graphics, Inc.Copyright © 2013, 2015, 2016, 2018 Red Hat, Inc.
LICENSE
Permission is granted to copy, distribute, and/or modify this document under the terms of the Creative CommonsAttribution-Share Alike, Version 3.0 or any later version published by the Creative Commons Corp. A copy of thelicense is available at http://creativecommons.org/licenses/by-sa/3.0/us/
TRADEMARKS AND ATTRIBUTIONS
Silicon Graphics, SGI and the SGI logo are registered trademarks and Performance Co-Pilot is a trademark of SiliconGraphics, Inc.
Red Hat and the Shadowman logo are trademarks of Red Hat, Inc., registered in the United States and other countries.
Cisco is a trademark of Cisco Systems, Inc. Linux is a registered trademark of Linus Torvalds, used with permission.UNIX is a registered trademark of The Open Group.

Table of ContentsAbout This Guide .............................................................................................................. ix
What This Guide Contains .......................................................................................... ixAudience for This Guide .............................................................................................. xRelated Resources ....................................................................................................... xMan Pages ................................................................................................................. xWeb Site ................................................................................................................... xConventions .............................................................................................................. xiReader Comments ...................................................................................................... xi
1. Introduction to PCP ......................................................................................................... 1Objectives .................................................................................................................. 1
PCP Target Usage ............................................................................................... 2Empowering the PCP User ................................................................................... 2Unification of Performance Metric Domains ............................................................ 2Uniform Naming and Access to Performance Metrics ................................................ 2PCP Distributed Operation ................................................................................... 2Dynamic Adaptation to Change ............................................................................. 3Logging and Retrospective Analysis ...................................................................... 3Automated Operational Support ............................................................................. 3PCP Extensibility ................................................................................................ 3Metric Coverage ................................................................................................. 4
Conceptual Foundations ............................................................................................... 4Performance Metrics ........................................................................................... 4Performance Metric Instances ............................................................................... 4Current Metric Context ........................................................................................ 5Sources of Performance Metrics and Their Domains ................................................. 5Distributed Collection .......................................................................................... 6Performance Metrics Name Space ......................................................................... 7Descriptions for Performance Metrics ..................................................................... 7Values for Performance Metrics ............................................................................ 8Collector and Monitor Roles ................................................................................. 9Retrospective Sources of Performance Metrics ......................................................... 9Product Extensibility .......................................................................................... 10
Overview of Component Software ............................................................................... 10Performance Monitoring and Visualization ............................................................ 10Collecting, Transporting, and Archiving Performance Information ............................. 11Operational and Infrastructure Support .................................................................. 14Application and Agent Development .................................................................... 14
2. Installing and Configuring Performance Co-Pilot ................................................................ 16Product Structure ...................................................................................................... 16Performance Metrics Collection Daemon (PMCD) .......................................................... 17
Starting and Stopping the PMCD ......................................................................... 17Restarting an Unresponsive PMCD ...................................................................... 17PMCD Diagnostics and Error Messages ................................................................ 17PMCD Options and Configuration Files ................................................................ 18
Managing Optional PMDAs ........................................................................................ 22PMDA Installation on a PCP Collector Host .......................................................... 23PMDA Removal on a PCP Collector Host ............................................................. 24
Troubleshooting ........................................................................................................ 25Performance Metrics Name Space ........................................................................ 25Missing and Incomplete Values for Performance Metrics ......................................... 25Kernel Metrics and the PMCD ............................................................................ 25
iii

Performance Co-Pilot™ User'sand Administrator's Guide
3. Common Conventions and Arguments .............................................................................. 28Alternate Metrics Source Options ................................................................................ 29
Fetching Metrics from Another Host .................................................................... 29Fetching Metrics from an Archive Log ................................................................. 29
General PCP Tool Options ......................................................................................... 29Common Directories and File Locations ................................................................ 30Alternate Performance Metric Name Spaces .......................................................... 31
Time Duration and Control ......................................................................................... 31Performance Monitor Reporting Frequency and Duration ......................................... 31Time Window Options ....................................................................................... 31Timezone Options ............................................................................................. 33
PCP Environment Variables ........................................................................................ 33Running PCP Tools through a Firewall ......................................................................... 35
The pmproxy service ........................................................................................ 36Transient Problems with Performance Metric Values ....................................................... 36
Performance Metric Wraparound ......................................................................... 36Time Dilation and Time Skew ............................................................................ 36
4. Monitoring System Performance ...................................................................................... 37The pmstat Command ............................................................................................... 37The pmrep Command ............................................................................................... 39The pmval Command ................................................................................................ 39The pminfo Command ............................................................................................... 40The pmstore Command ............................................................................................. 44
5. Performance Metrics Inference Engine .............................................................................. 46Introduction to pmie .................................................................................................. 47Basic pmie Usage ..................................................................................................... 48
pmie use of PCP services ................................................................................... 49Simple pmie Usage ........................................................................................... 50Complex pmie Examples ................................................................................... 50
Specification Language for pmie ................................................................................. 52Basic pmie Syntax ............................................................................................ 52Setting Evaluation Frequency .............................................................................. 54pmie Metric Expressions .................................................................................... 54pmie Rate Conversion ....................................................................................... 56pmie Arithmetic Expressions .............................................................................. 57pmie Logical Expressions ................................................................................... 57pmie Rule Expressions ...................................................................................... 60pmie Intrinsic Operators ..................................................................................... 62
pmie Examples ......................................................................................................... 63Developing and Debugging pmie Rules ........................................................................ 65Caveats and Notes on pmie ........................................................................................ 65
Performance Metrics Wraparound ........................................................................ 65pmie Sample Intervals ....................................................................................... 65pmie Instance Names ........................................................................................ 65pmie Error Detection ......................................................................................... 66
Creating pmie Rules with pmieconf ............................................................................. 66Management of pmie Processes ................................................................................... 68
Add a pmie crontab Entry ................................................................................. 70Global Files and Directories ................................................................................ 70pmie Instances and Their Progress ....................................................................... 71
6. Archive Logging ........................................................................................................... 72Introduction to Archive Logging .................................................................................. 73
Archive Logs and the PMAPI ............................................................................. 73Retrospective Analysis Using Archive Logs ........................................................... 73
iv

Performance Co-Pilot™ User'sand Administrator's Guide
Using Archive Logs for Capacity Planning ............................................................ 74Using Archive Logs with Performance Tools ................................................................. 74
Coordination between pmlogger and PCP tools ...................................................... 74Administering PCP Archive Logs Using cron Scripts .............................................. 74Archive Log File Management ............................................................................ 75
Cookbook for Archive Logging ................................................................................... 78Primary Logger ................................................................................................. 78Other Logger Configurations ............................................................................... 79Archive Log Administration ................................................................................ 81
Other Archive Logging Features and Services ................................................................ 81PCP Archive Folios ........................................................................................... 81Manipulating Archive Logs with pmlogextract ...................................................... 82Summarizing Archive Logs with pmlogsummary .................................................. 82Primary Logger ................................................................................................. 82Using pmlc ...................................................................................................... 83
Archive Logging Troubleshooting ................................................................................ 84pmlogger Cannot Write Log ............................................................................... 84Cannot Find Log ............................................................................................... 84Primary pmlogger Cannot Start ........................................................................... 85Identifying an Active pmlogger Process ............................................................... 86Illegal Label Record .......................................................................................... 86Empty Archive Log Files or pmlogger Exits Immediately ........................................ 86
7. Performance Co-Pilot Deployment Strategies ..................................................................... 88Basic Deployment ..................................................................................................... 89PCP Collector Deployment ......................................................................................... 90
Principal Server Deployment ............................................................................... 90Quality of Service Measurement .......................................................................... 91
PCP Archive Logger Deployment ................................................................................ 92Deployment Options .......................................................................................... 92Resource Demands for the Deployment Options ..................................................... 93Operational Management .................................................................................... 93Exporting PCP Archive Logs .............................................................................. 93
PCP Inference Engine Deployment .............................................................................. 93Deployment Options .......................................................................................... 94Resource Demands for the Deployment Options ..................................................... 95Operational Management .................................................................................... 95
8. Customizing and Extending PCP Services .......................................................................... 96PMDA Customization ................................................................................................ 96
Customizing the Summary PMDA ....................................................................... 96PCP Tool Customization ............................................................................................ 99
Archive Logging Customization .......................................................................... 99Inference Engine Customization ......................................................................... 100
PMNS Management ................................................................................................. 101PMNS Processing Framework ........................................................................... 102PMNS Syntax ................................................................................................. 102
PMDA Development ................................................................................................ 104PCP Tool Development ............................................................................................ 104
A. Acronyms .................................................................................................................. 105Index ............................................................................................................................. 106
v

List of Figures1.1. Performance Metric Domains as Autonomous Collections of Data ......................................... 51.2. Process Structure for Distributed Operation ....................................................................... 61.3. Small Performance Metrics Name Space (PMNS) .............................................................. 71.4. Architecture for Retrospective Analysis ............................................................................ 95.1. Sampling Time Line .................................................................................................... 555.2. Three-Dimensional Parameter Space ............................................................................... 556.1. Archive Log Directory Structure .................................................................................... 777.1. PCP Deployment for a Single System ............................................................................. 897.2. Basic PCP Deployment for Two Systems ........................................................................ 897.3. General PCP Deployment for Multiple Systems ................................................................ 907.4. PCP Deployment to Measure Client-Server Quality of Service ............................................ 917.5. Designated PCP Archive Site ........................................................................................ 927.6. PCP Management Site Deployment ................................................................................ 948.1. Small Performance Metrics Name Space (PMNS) ........................................................... 103
vi

List of Tables1.1. Sample Instance Identifiers for Disk Statistics .................................................................... 83.1. Physical Filenames for Components of a PCP Archive Log ................................................ 296.1. Filenames for PCP Archive Log Components (archive.*) ............................................... 75A.1. Performance Co-Pilot Acronyms and Their Meanings ..................................................... 105
vii

List of Examples2.1. PMNS Installation Output ............................................................................................ 235.1. pmie with the -f Option ............................................................................................. 495.2. pmie with the -d and -h Options ................................................................................. 495.3. pmie with the -v Option ............................................................................................. 505.4. Printed pmie Output .................................................................................................... 515.5. Labelled pmie Output .................................................................................................. 515.6. Relational Expressions ................................................................................................. 575.7. Rule Expression Options .............................................................................................. 615.8. System Log Text ........................................................................................................ 615.9. Standard Output .......................................................................................................... 615.10. Monitoring CPU Utilization ........................................................................................ 635.11. Monitoring Disk Activity ............................................................................................ 646.1. Using pminfo to Obtain Archive Information ................................................................. 786.2. Using pmlogsummary to Summarize Archive Information ............................................... 826.3. Listing Available Commands ........................................................................................ 838.1. PMNS Specification ................................................................................................... 103
viii
About This Guide
Table of ContentsWhat This Guide Contains .................................................................................................. ixAudience for This Guide ...................................................................................................... xRelated Resources ............................................................................................................... xMan Pages ......................................................................................................................... xWeb Site ........................................................................................................................... xConventions ...................................................................................................................... xiReader Comments .............................................................................................................. xi
This guide describes the Performance Co-Pilot (PCP) performance analysis toolkit. PCP provides asystems-level suite of tools that cooperate to deliver distributed performance monitoring and performancemanagement services spanning hardware platforms, operating systems, service layers, database internals,user applications and distributed architectures.
PCP is a cross-platform, open source software package - customizations, extensions, source codeinspection, and tinkering in general is actively encouraged.
“About This Guide” includes short descriptions of the chapters in this book, directs you to additionalsources of information, and explains typographical conventions.
What This Guide ContainsThis guide contains the following chapters:
• Chapter 1, Introduction to PCP, provides an introduction, a brief overview of the software components,and conceptual foundations of the PCP software.
• Chapter 2, Installing and Configuring Performance Co-Pilot, describes the basic installation andconfiguration steps necessary to get PCP running on your systems.
• Chapter 3, Common Conventions and Arguments, describes the user interface components that arecommon to most of the text-based utilities that make up the monitor portion of PCP.
• Chapter 4, Monitoring System Performance, describes the performance monitoring tools available inPerformance Co-Pilot (PCP).
• Chapter 5, Performance Metrics Inference Engine, describes the Performance Metrics Inference Engine(pmie) tool that provides automated monitoring of, and reasoning about, system performance withinthe PCP framework.
• Chapter 6, Archive Logging, covers the PCP services and utilities that support archive logging forcapturing accurate historical performance records.
• Chapter 7, Performance Co-Pilot Deployment Strategies, presents the various options for deployingPCP functionality across cooperating systems.
• Chapter 8, Customizing and Extending PCP Services, describes the procedures necessary to ensure thatthe PCP configuration is customized in ways that maximize the coverage and quality of performancemonitoring and management services.
ix

About This Guide
• Appendix A, Acronyms, provides a comprehensive list of the acronyms used in this guide and in theman pages for Performance Co-Pilot.
Audience for This GuideThis guide is written for the system administrator or performance analyst who is directly using andadministering PCP applications.
Related ResourcesThe Performance Co-Pilot Programmer's Guide, a companion document to the Performance Co-PilotUser's and Administrator's Guide, is intended for developers who want to use the PCP framework andservices for exporting additional collections of performance metrics, or for delivering new or customizedapplications to enhance performance management.
The Performance Co-Pilot Tutorials and Case Studies provides a series of real-world examples of usingvarious PCP tools, and lessons learned from deploying the toolkit in production environments. It servesto provide reinforcement of the general concepts discussed in the other two books with additional casestudies, and in some cases very detailed discussion of specifics of individual tools.
Additional resources include man pages and the project web site.
Man PagesThe operating system man pages provide concise reference information on the use of commands,subroutines, and system resources. There is usually a man page for each PCP command or subroutine. Tosee a list of all the PCP man pages, start from the following command:
man PCPIntro
Each man page usually has a "SEE ALSO" section, linking to other, related entries.
To see a particular man page, supply its name to the man command, for example:
man pcp
The man pages are arranged in different sections - user commands, programming interfaces, and so on.For a complete list of manual sections on a platform enter the command:
man man
When referring to man pages, this guide follows a standard convention: the section number in parenthesesfollows the item. For example, pminfo(1) refers to the man page in section 1 for the pminfo command.
Web SiteThe following web site is accessible to everyone:
URL Description
https://pcp.io PCP is open source software released under the GNU General PublicLicense (GPL) and GNU Lesser General Public License (LGPL)
x

About This Guide
ConventionsThe following conventions are used throughout this document:
Convention Meaning
${PCP_VARIABLE} A brace-enclosed all-capital-letters syntax indicates a variable thathas been sourced from the global ${PCP_DIR}/etc/pcp.conffile. These special variables indicate parameters that affect all PCPcommands, and are likely to be different between platforms.
command This fixed-space font denotes literal items such as commands, files,routines, path names, signals, messages, and programming languagestructures.
variable Italic typeface denotes variable entries and words or concepts beingdefined.
user input This bold, fixed-space font denotes literal items that the user enters ininteractive sessions. (Output is shown in nonbold, fixed-space font.)
[ ] Brackets enclose optional portions of a command or directive line.
... Ellipses indicate that a preceding element can be repeated.
ALL CAPS All capital letters denote environment variables, operator names,directives, defined constants, and macros in C programs.
() Parentheses that follow function names surround function argumentsor are empty if the function has no arguments; parentheses thatfollow commands surround man page section numbers.
Reader CommentsIf you have comments about the technical accuracy, content, or organization of this document, contact thePCP maintainers using either the email address or the web site listed earlier.
We value your comments and will respond to them promptly.
xi

Chapter 1. Introduction to PCP
Table of ContentsObjectives .......................................................................................................................... 1
PCP Target Usage ....................................................................................................... 2Empowering the PCP User ........................................................................................... 2Unification of Performance Metric Domains .................................................................... 2Uniform Naming and Access to Performance Metrics ....................................................... 2PCP Distributed Operation ........................................................................................... 2Dynamic Adaptation to Change ..................................................................................... 3Logging and Retrospective Analysis .............................................................................. 3Automated Operational Support .................................................................................... 3PCP Extensibility ........................................................................................................ 3Metric Coverage ......................................................................................................... 4
Conceptual Foundations ....................................................................................................... 4Performance Metrics ................................................................................................... 4Performance Metric Instances ....................................................................................... 4Current Metric Context ................................................................................................ 5Sources of Performance Metrics and Their Domains ......................................................... 5Distributed Collection .................................................................................................. 6Performance Metrics Name Space ................................................................................. 7Descriptions for Performance Metrics ............................................................................. 7Values for Performance Metrics .................................................................................... 8Collector and Monitor Roles ......................................................................................... 9Retrospective Sources of Performance Metrics ................................................................. 9Product Extensibility .................................................................................................. 10
Overview of Component Software ....................................................................................... 10Performance Monitoring and Visualization .................................................................... 10Collecting, Transporting, and Archiving Performance Information ..................................... 11Operational and Infrastructure Support .......................................................................... 14Application and Agent Development ............................................................................ 14
This chapter provides an introduction to Performance Co-Pilot (PCP), an overview of its individualcomponents, and conceptual information to help you use this software.
The following sections are included:
• the section called “Objectives” covers the intended purposes of PCP.
• the section called “Overview of Component Software”, describes PCP tools and agents.
• the section called “Conceptual Foundations”, discusses the design theories behind PCP.
Objectives
Performance Co-Pilot (PCP) provides a range of services that may be used to monitor and managesystem performance. These services are distributed and scalable to accommodate the most complex systemconfigurations and performance problems.
1

Introduction to PCP
PCP Target UsagePCP is targeted at the performance analyst, benchmarker, capacity planner, developer, databaseadministrator, or system administrator with an interest in overall system performance and a need toquickly isolate and understand performance behavior, resource utilization, activity levels, and bottlenecksin complex systems. Platforms that can benefit from this level of performance analysis include largeservers, server clusters, or multiserver sites delivering Database Management Systems (DBMS), compute,Web, file, or video services.
Empowering the PCP UserTo deal efficiently with the dynamic behavior of complex systems, performance analysts need to filterout noise from the overwhelming stream of performance data, and focus on exceptional scenarios.Visualization of current and historical performance data, and automated reasoning about performance data,effectively provide this filtering.
From the PCP end user's perspective, PCP presents an integrated suite of tools, user interfaces, and servicesthat support real-time and retrospective performance analysis, with a bias towards eliminating mundaneinformation and focusing attention on the exceptional and extraordinary performance behaviors. When thisis done, the user can concentrate on in-depth analysis or target management procedures for those criticalsystem performance problems.
Unification of Performance Metric DomainsAt the lowest level, performance metrics are collected and managed in autonomous performance domainssuch as the operating system kernel, a DBMS, a layered service, or an end-user application. These domainsfeature a multitude of access control policies, access methods, data semantics, and multiversion support.All this detail is irrelevant to the developer or user of a performance monitoring tool, and is hidden bythe PCP infrastructure.
Performance Metrics Domain Agents (PMDAs) within PCP encapsulate the knowledge about, and exportperformance information from, autonomous performance domains.
Uniform Naming and Access to Performance MetricsUsability and extensibility of performance management tools mandate a single scheme for namingperformance metrics. The set of defined names constitutes a Performance Metrics Name Space (PMNS).Within PCP, the PMNS is adaptive so it can be extended, reshaped, and pruned to meet the needs ofparticular applications and users.
PCP provides a single interface to name and retrieve values for all performance metrics, independentlyof their source or location.
PCP Distributed OperationFrom a purely pragmatic viewpoint, a single workstation must be able to monitor the concurrentperformance of multiple remote hosts. At the same time, a single host may be subject to monitoring frommultiple remote workstations.
These requirements suggest a classic client-server architecture, which is exactly what PCP uses to provideconcurrent and multiconnected access to performance metrics, independent of their host location.
2

Introduction to PCP
Dynamic Adaptation to ChangeComplex systems are subject to continual changes as network connections fail and are reestablished; nodesare taken out of service and rebooted; hardware is added and removed; and software is upgraded, installed,or removed. Often these changes are asynchronous and remote (perhaps in another geographic region ordomain of administrative control).
The distributed nature of the PCP (and the modular fashion in which performance metrics domains can beinstalled, upgraded, and configured on different hosts) enables PCP to adapt concurrently to changes in themonitored system(s). Variations in the available performance metrics as a consequence of configurationchanges are handled automatically and become visible to all clients as soon as the reconfigured host isrebooted or the responsible agent is restarted.
PCP also detects loss of client-server connections, and most clients support subsequent automatedreconnection.
Logging and Retrospective AnalysisA range of tools is provided to support flexible, adaptive logging of performance metrics for archive,playback, remote diagnosis, and capacity planning. PCP archive logs may be accumulated either at thehost being monitored, at a monitoring workstation, or both.
A universal replay mechanism, modeled on media controls [http://en.wikipedia.org/wiki/Media_controls],supports play, step, rewind, fast forward and variable speed processing of archived performance data.Replay for multiple archives, from multiple hosts, is facilitated by an archive aggregation concept.
Most PCP applications are able to process archive logs and real-time performance data with equal facility.Unification of real-time access and access to the archive logs, in conjunction with the media controls,provides powerful mechanisms for building performance tools and to review both current and historicalperformance data.
Automated Operational SupportFor operational and production environments, PCP provides a framework with scripts to customize inorder to automate the execution of ongoing tasks such as these:
• Centralized archive logging for multiple remote hosts
• Archive log rotation, consolidation, and culling
• Web-based publishing of charts showing snapshots of performance activity levels in the recent past
• Flexible alarm monitoring: parameterized rules to address common critical performance scenarios andfacilities to customize and refine this monitoring
• Retrospective performance audits covering the recent past; for example, daily or weekly checks forperformance regressions or quality of service problems
PCP ExtensibilityPCP permits the integration of new performance metrics into the PMNS, the collection infrastructure, andthe logging framework. The guiding principle is, “if it is important for monitoring system performance,and you can measure it, you can easily integrate it into the PCP framework.”
3

Introduction to PCP
For many PCP users, the most important performance metrics are not those already supported, but newperformance metrics that characterize the essence of good or bad performance at their site, or within theirparticular application environment.
One example is an application that measures the round-trip time for a benign “probe” transaction againstsome mission-critical application.
For application developers, a library is provided to support easy-to-use insertion of trace and monitoringpoints within an application, and the automatic export of resultant performance data into the PCPframework. Other libraries and tools aid the development of customized and fully featured PerformanceMetrics Domain Agents (PMDAs).
Extensive source code examples are provided in the distribution, and by using the PCP toolkit andinterfaces, these customized measures of performance or quality of service can be easily and seamlesslyintegrated into the PCP framework.
Metric Coverage
The core PCP modules support export of performance metrics that include kernel instrumentation,hardware instrumentation, process-level resource utilization, database and other system servicesinstrumentation, and activity in the PCP collection infrastructure.
The supplied agents support thousands of distinct performance metrics, many of which can have multiplevalues, for example, per disk, per CPU, or per process.
Conceptual FoundationsThe following sections provide a detailed overview of concepts that underpin Performance Co-Pilot (PCP).
Performance Metrics
Across all of the supported performance metric domains, there are a large number of performance metrics.Each metric has its own structure and semantics. PCP presents a uniform interface to these metrics,independent of the underlying metric data source.
The Performance Metrics Name Space (PMNS) provides a hierarchical classification of human-readablemetric names, and a mapping from these external names to internal metric identifiers. See the sectioncalled “Performance Metrics Name Space”, for a description of the PMNS.
Performance Metric Instances
When performance metric values are returned to a requesting application, there may be more than onevalue instance for a particular metric; for example, independent counts for each CPU, process, disk, or localfilesystem. Internal instance identifiers correspond one to one with external (human-readable) descriptionsof the members of an instance domain.
Transient performance metrics (such as per-process information) cause repeated requests for the samemetric to return different numbers of values, or changes in the particular instance identifiers returned.These changes are expected and fully supported by the PCP infrastructure; however, metric instantiationis guaranteed to be valid only at the time of collection.
4

Introduction to PCP
Current Metric ContextWhen performance metrics are retrieved, they are delivered in the context of a particular source of metrics,a point in time, and a profile of desired instances. This means that the application making the request hasalready negotiated to establish the context in which the request should be executed.
A metric source may be the current performance data from a particular host (a live or real-time source),or a set of archive logs of performance data collected by pmlogger at some distant host or at an earliertime (a retrospective or archive source).
By default, the collection time for a performance metric is the current time of day for real-time sources, orcurrent point within an archive source. For archives, the collection time may be reset to an arbitrary timewithin the bounds of the set of archive logs.
Sources of Performance Metrics and Their Domains Instrumentation for the purpose of performance monitoring typically consists of counts of activityor events, attribution of resource consumption, and service-time or response-time measures. Thisinstrumentation may exist in one or more of the functional domains as shown in Figure 1.1, “PerformanceMetric Domains as Autonomous Collections of Data”.
Figure 1.1. Performance Metric Domains as Autonomous Collections of Data
Access method Access method Access method Access method
Performancemetricdomains
KernelDBMS Layered
serviceXYZ
End-userapplication
ABC
Each domain has an associated access method:
• The operating system kernel, including sub-system data structures - per-process resource consumption,network statistics, disk activity, or memory management instrumentation.
• A layered software service such as activity logs for a World Wide Web server or an email delivery server.
• An application program such as measured response time for a production application running a periodicand benign probe transaction (as often required in service level agreements), or rate of computation andthroughput in jobs per minute for a batch stream.
• External equipment such as network routers and bridges.
For each domain, the set of performance metrics may be viewed as an abstract data type, with an associatedset of methods that may be used to perform the following tasks:
• Interrogate the metadata that describes the syntax and semantics of the performance metrics
• Control (enable or disable) the collection of some or all of the metrics
• Extract instantiations (current values) for some or all of the metrics
5

Introduction to PCP
We refer to each functional domain as a performance metrics domain and assume that domains arefunctionally, architecturally, and administratively independent and autonomous. Obviously the set ofperformance metrics domains available on any host is variable, and changes with time as software andhardware are installed and removed.
The number of performance metrics domains may be further enlarged in cluster-based or network-basedconfigurations, where there is potentially an instance of each performance metrics domain on each node.Hence, the management of performance metrics domains must be both extensible at a particular host anddistributed across a number of hosts.
Each performance metrics domain on a particular host must be assigned a unique Performance MetricIdentifier (PMID). In practice, this means unique identifiers are assigned globally for each performancemetrics domain type. For example, the same identifier would be used for the Apache Web Serverperformance metrics domain on all hosts.
Distributed CollectionThe performance metrics collection architecture is distributed, in the sense that any performance tool maybe executing remotely. However, a PMDA usually runs on the system for which it is collecting performancemeasurements. In most cases, connecting these tools together on the collector host is the responsibility ofthe PMCD process, as shown in Figure 1.2, “Process Structure for Distributed Operation”.
Figure 1.2. Process Structure for Distributed Operation
PMDA PMDA PMDAPMDA
pmcd
PMDA
Monitor Monitor Monitor
pmcd
Remote Host Local Host
The host running the monitoring tools does not require any collection tools, including pmcd, because allrequests for metrics are sent to the pmcd process on the collector host. These requests are then forwardedto the appropriate PMDAs, which respond with metric descriptions, help text, and most importantly, metricvalues.
The connections between monitor clients and pmcd processes are managed in libpcp, below the PMAPIlevel; see the pmapi(3) man page. Connections between PMDAs and pmcd are managed by the PMDAroutines; see the pmda(3) man page. There can be multiple monitor clients and multiple PMDAs on theone host, but normally there would be only one pmcd process.
6

Introduction to PCP
Performance Metrics Name Space Internally, each unique performance metric is identified by a Performance Metric Identifier (PMID) drawnfrom a universal set of identifiers, including some that are reserved for site-specific, application-specific,and customer-specific use.
An external name space - the Performance Metrics Name Space (PMNS) - maps from a hierarchy (or tree)of human-readable names to PMIDs.
Performance Metrics Name Space DiagramEach node in the PMNS tree is assigned a label that must begin with an alphabet character, and be followedby zero or more alphanumeric characters or the underscore (_) character. The root node of the tree hasthe special label of root.
A metric name is formed by traversing the tree from the root to a leaf node with each node label on thepath separated by a period. The common prefix root. is omitted from all names. For example, Figure 1.3,“Small Performance Metrics Name Space (PMNS) ” shows the nodes in a small subsection of a PMNS.
Figure 1.3. Small Performance Metrics Name Space (PMNS)
root
hw
...
network routerkernel
... ... ... ... ...
all percpu udp tcp recv
total_utilrcvpacksyscall
In this subsection, the following are valid names for performance metrics:
kernel.percpu.syscallnetwork.tcp.rcvpackhw.router.recv.total_util
Descriptions for Performance Metrics Through the various performance metric domains, the PCP must support a wide range of formatsand semantics for performance metrics. This metadata describing the performance metrics includes thefollowing:
• The internal identifier, Performance Metric Identifier (PMID), for the metric
• The format and encoding for the values of the metric, for example, an unsigned 32-bit integer or a stringor a 64-bit IEEE format floating point number
7

Introduction to PCP
• The semantics of the metric, particularly the interpretation of the values as free-running counters orinstantaneous values
• The dimensionality of the values, in the dimensions of events, space, and time
• The scale of values; for example, bytes, kilobytes (KB), or megabytes (MB) for the space dimension
• An indication if the metric may have one or many associated values
• Short (and extended) help text describing the metric
For each metric, this metadata is defined within the associated PMDA, and PCP arranges for theinformation to be exported to performance tools that use the metadata when interpreting the values foreach metric.
Values for Performance MetricsThe following sections describe two types of performance metrics, single-valued and set-valued.
Single-Valued Performance Metrics
Some performance metrics have a singular value within their performance metric domains. For example,available memory (or the total number of context switches) has only one value per performance metricdomain, that is, one value per host. The metadata describing the metric makes this fact known toapplications that process values for these metrics.
Set-Valued Performance Metrics
Some performance metrics have a set of values or instances in each implementing performance metricdomain. For example, one value for each disk, one value for each process, one value for each CPU, or onevalue for each activation of a given application.
When a metric has multiple instances, the PCP framework does not pollute the Name Space with additionalmetric names; rather, a single metric may have an associated set of values. These multiple values areassociated with the members of an instance domain, such that each instance has a unique instance identifierwithin the associated instance domain. For example, the “per CPU” instance domain may use the instanceidentifiers 0, 1, 2, 3, and so on to identify the configured processors in the system.
Internally, instance identifiers are encoded as binary values, but each performance metric domain alsosupports corresponding strings as external names for the instance identifiers, and these names are used atthe user interface to the PCP utilities.
For example, the performance metric disk.dev.total counts I/O operations for each disk spindle,and the associated instance domain contains one member for each disk spindle. On a system with fivespecific disks, one value would be associated with each of the external and internal instance identifier pairsshown in Table 1.1, “Sample Instance Identifiers for Disk Statistics ”.
Table 1.1. Sample Instance Identifiers for Disk Statistics
External Instance Identifier Internal Instance Identifier
disk0 131329
disk1 131330
disk2 131331
disk3 131841
disk4 131842
8

Introduction to PCP
Multiple performance metrics may be associated with a single instance domain.
Each performance metric domain may dynamically establish the instances within an instance domain.For example, there may be one instance for the metric kernel.percpu.idle on a workstation,but multiple instances on a multiprocessor server. Even more dynamic is filesys.free, where thevalues report the amount of free space per file system, and the number of values tracks the mounting andunmounting of local filesystems.
PCP arranges for information describing instance domains to be exported from the performance metricdomains to the applications that require this information. Applications may also choose to retrieve valuesfor all instances of a performance metric, or some arbitrary subset of the available instances.
Collector and Monitor RolesHosts supporting PCP services are broadly classified into two categories:
Collector Hosts that have pmcd and one or more performance metric domain agents (PMDAs)running to collect and export performance metrics
Monitor Hosts that import performance metrics from one or more collector hosts to beconsumed by tools to monitor, manage, or record the performance of the collectorhosts
Each PCP enabled host can operate as a collector, a monitor, or both.
Retrospective Sources of Performance MetricsThe PMAPI also supports delivery of performance metrics from a historical source in the form of a PCParchive log. Archive logs are created using the pmlogger utility, and are replayed in an architecture asshown in Figure 1.4, “Architecture for Retrospective Analysis”.
Figure 1.4. Architecture for Retrospective Analysis
PCP Archive Log
Monitor
PMAPI
PCP Archive Log
9

Introduction to PCP
The PMAPI has been designed to minimize the differences required for an application to processperformance data from an archive or from a real-time source. As a result, most PCP tools support live andretrospective monitoring with equal facility.
Product ExtensibilityMuch of the PCP software's potential for attacking difficult performance problems in productionenvironments comes from the design philosophy that considers extensibility to be critically important.
The performance analyst can take advantage of the PCP infrastructure to deploy value-added performancemonitoring tools and services. Here are some examples:
• Easy extension of the PCP collector to accommodate new performance metrics and new sources ofperformance metrics, in particular using the interfaces of a special-purpose library to develop newPMDAs (see the pmda(3) man page)
• Use of libraries (libpcp_pmda and libpcp_mmv) to aid in the development of new capabilities toexport performance metrics from local applications
• Operation on any performance metric using generalized toolkits
• Distribution of PCP components such as collectors across the network, placing the service where it cando the most good
• Dynamic adjustment to changes in system configuration
• Flexible customization built into the design of all PCP tools
• Creation of new monitor applications, using the routines described in the pmapi(3) man page
Overview of Component SoftwarePerformance Co-Pilot (PCP) is composed of both text-based and graphical tools. Each tool is fullydocumented by a man page. These man pages are named after the tools or commands they describe, andare accessible through the man command. For example, to see the pminfo(1) man page for the pminfocommand, enter this command:
man pminfo
A representative list of PCP tools and commands, grouped by functionality, is provided in the followingfour sections.
Performance Monitoring and VisualizationThe following tools provide the principal services for the PCP end-user with an interest in monitoring,visualizing, or processing performance information collected either in real time or from PCP archive logs:
pcp-atop Full-screen monitor of the load on a system from a kernel, hardware andprocesses point of view. It is modeled on the Linux atop(1) tool (home page[http://www.atoptool.nl/]) and provides a showcase for the variety of dataavailable using PCP services and the Python scripting interfaces.
pmchart Strip chart tool for arbitrary performance metrics. Interactive graphicalutility that can display multiple charts simultaneously, from multiple hostsor set of archives, aligned on a unified time axis (X-axis), or on multiple tabs.
10

Introduction to PCP
pcp-collectl Statistics collection tool with good coverage of a number of Linuxkernel subsystems, with the everything-in-one-tool approach pioneered bysar(1). It is modeled on the Linux collectl(1) utility (home page [http://collectl.sourceforge.net/]) and provides another example of use of thePython scripting interfaces to build more complex functionality with relativeease, with PCP as a foundation.
pmrep Outputs the values of arbitrary performance metrics collected live or froma single PCP archive, in textual format.
pmevent Reports on event metrics, decoding the timestamp and event parameters fortext-based reporting.
pmie Evaluates predicate-action rules over performance metrics for alarms,automated system management tasks, dynamic configuration tuning, and soon. It is an inference engine.
pmieconf Creates parameterized rules to be used with the PCP inference engine(pmie). It can be run either interactively or from scripts for automating thesetup of inference (the PCP start scripts do this, for example, to generate adefault configuration).
pminfo Displays information about arbitrary performance metrics available fromPCP, including help text with -T.
pmlogsummary Calculates and reports various statistical summaries of the performancemetric values from a set of PCP archives.
pmprobe Probes for performance metric availability, values, and instances.
pmstat Provides a text-based display of metrics that summarize the performance ofone or more systems at a high level.
pmval Provides a text-based display of the values for arbitrary instances of aselected performance metric, suitable for ASCII logs or inquiry over a slowlink.
Collecting, Transporting, and Archiving PerformanceInformation
PCP provides the following tools to support real-time data collection, network transport, and archive logcreation services for performance data:
mkaf Aggregates an arbitrary collection of PCP archive logs into a folioto be used with pmafm.
pmafm Interrogates, manages, and replays an archive folio as createdby mkaf, or the periodic archive log management scripts, or therecord mode of other PCP tools.
pmcd Is the Performance Metrics Collection Daemon (PMCD). Thisdaemon must run on each system being monitored, to collectand export the performance information necessary to monitor thesystem.
11

Introduction to PCP
pmcd_wait Waits for pmcd to be ready to accept client connections.
pmdaapache Exports performance metrics from the Apache Web Server. It isa Performance Metrics Domain Agent (PMDA).
pmdacisco Extracts performance metrics from one or more Cisco routers.
pmdaelasticseach Extracts performance metrics from an elasticsearch cluster.
pmdagfs2 Exports performance metrics from the GFS2 clustered filesystem.
pmdagluster Extracts performance metrics from the Gluster filesystem.
pmdainfiniband Exports performance metrics from the Infiniband kernel driver.
pmdakvm Extracts performance metrics from the Linux Kernel VirtualMachine (KVM) infrastructure.
pmdalustrecomm Exports performance metrics from the Lustre clustered filesystem.
pmdamailq Exports performance metrics describing the current state of itemsin the sendmail queue.
pmdamemcache Extracts performance metrics from memcached, a distributedmemory caching daemon commonly used to improve web servingperformance.
pmdammvExports metrics from instrumented applications linked with thepcp_mmv shared library or the Parfait [http://code.google.com/p/parfait/] framework for Java instrumentation. These metrics arecustom developed per application, and in the case of Parfait,automatically include numerous JVM, Tomcat and other server orcontainer statistics.
pmdamysql Extracts performance metrics from the MySQL relationaldatabase.
pmdanamed Exports performance metrics from the Internet domain nameserver, named.
pmdanginx Extracts performance metrics from the nginx HTTP and reverseproxy server.
pmdapostfix Export performance metrics from the Postfix mail transfer agent.
pmdapostgres Extracts performance metrics from the PostgreSQL relationaldatabase.
pmdaproc Exports performance metrics for running processes.
pmdarsyslog Extracts performance metrics from the Reliable System Logdaemon.
pmdasamba Extracts performance metrics from Samba, a Windows SMB/CIFS server.
pmdasendmail Exports mail activity statistics from sendmail.
12

Introduction to PCP
pmdashping Exports performance metrics for the availability and quality ofservice (response-time) for arbitrary shell commands.
pmdasnmp Extracts SNMP performance metrics from local or remote SNMP-enabled devices.
pmdasummary Derives performance metrics values from values made availableby other PMDAs. It is a PMDA itself.
pmdasystemd Extracts performance metrics from the systemd and journaldservices.
pmdatrace Exports transaction performance metrics from applicationprocesses that use the pcp_trace library.
pmdavmware Extracts performance metrics from a VMWare virtualization host.
pmdaweblogScans Web-server logs to extract metrics characterizing.
pmdaxfs Extracts performance metrics from the Linux kernel XFSfilesystem implementation.
pmdumplog Displays selected state information, control data, and metricvalues from a set of PCP archive logs created by pmlogger.
pmlc Exercises control over an instance of the PCP archive loggerpmlogger, to modify the profile of which metrics are logged and/or how frequently their values are logged.
pmlogcheck Performs integrity check for individual PCP archives.
pmlogconf Creates or modifies pmlogger configuration files for manycommon logging scenarios, optionally probing for availablemetrics and enabled functionality. It can be run either interactivelyor from scripts for automating the setup of data logging (thePCP start scripts do this, for example, to generate a defaultconfiguration).
pmlogextract Reads one or more PCP archive logs and creates a temporallymerged and reduced PCP archive log as output.
pmlogger Creates PCP archive logs of performance metrics over time. Manytools accept these PCP archive logs as alternative sources ofmetrics for retrospective analysis.
pmproxy Allows the execution of PCP tools through a network firewallsystem.
pmtrace Provides a simple command line interface to the trace PMDA andits associated pcp_trace library.
pmwebd Is the Performance Metrics Web Daemon, a front-end to bothpmcd and PCP archives, providing a JSON interface suitable foruse by web-based tools wishing to access performance data overHTTP.
13

Introduction to PCP
Operational and Infrastructure SupportPCP provides the following tools to support the PCP infrastructure and assist operational procedures forPCP deployment in a production environment:
pcp Summarizes that state of a PCP installation.
pmdbg Describes the available facilities and associated control flags. PCP tools includeinternal diagnostic and debugging facilities that may be activated by run-timeflags.
pmerr Translates PCP error codes into human-readable error messages.
pmhostname Reports hostname as returned by gethostbyname. Used in assorted PCPmanagement scripts.
pmie_check Administration of the Performance Co-Pilot inference engine (pmie).
pmlock Attempts to acquire an exclusive lock by creating a file with a mode of 0.
pmlogger_* Allows you to create a customized regime of administration and managementfor PCP archive log files. The pmlogger_check, pmlogger_daily, andpmlogger_merge scripts are intended for periodic execution via the croncommand.
pmnewlog Performs archive log rotation by stopping and restarting an instance of pmlogger.
pmnsadd Adds a subtree of new names into a PMNS, as used by the components of PCP.
pmnsdel Removes a subtree of names from a PMNS, as used by the components of thePCP.
pmnsmerge Merges multiple PMNS files together, as used by the components of PCP.
pmstore Reinitializes counters or assigns new values to metrics that act as controlvariables. The command changes the current values for the specified instancesof a single performance metric.
Application and Agent DevelopmentThe following PCP tools aid the development of new programs to consume performance data, and newagents to export performance data within the PCP framework:
chkhelp Checks the consistency of performance metrics help database files.
dbpmda Allows PMDA behavior to be exercised and tested. It is an interactive debugger forPMDAs.
newhelp Generates the database files for one or more source files of PCP help text.
pmapi Defines a procedural interface for developing PCP client applications. It is thePerformance Metrics Application Programming Interface (PMAPI).
pmclient Is a simple client that uses the PMAPI to report some high-level system performancemetrics.
14

Introduction to PCP
pmda Is a library used by many shipped PMDAs to communicate with a pmcd process. Itcan expedite the development of new and custom PMDAs.
pmgenmap Generates C declarations and cpp(1) macros to aid the development of customizedprograms that use the facilities of PCP. It is a PMDA development tool.
15

Chapter 2. Installing and ConfiguringPerformance Co-Pilot
Table of ContentsProduct Structure .............................................................................................................. 16Performance Metrics Collection Daemon (PMCD) .................................................................. 17
Starting and Stopping the PMCD ................................................................................. 17Restarting an Unresponsive PMCD .............................................................................. 17PMCD Diagnostics and Error Messages ........................................................................ 17PMCD Options and Configuration Files ........................................................................ 18
Managing Optional PMDAs ................................................................................................ 22PMDA Installation on a PCP Collector Host .................................................................. 23PMDA Removal on a PCP Collector Host ..................................................................... 24
Troubleshooting ................................................................................................................ 25Performance Metrics Name Space ................................................................................ 25Missing and Incomplete Values for Performance Metrics ................................................. 25Kernel Metrics and the PMCD .................................................................................... 25
The sections in this chapter describe the basic installation and configuration steps necessary to runPerformance Co-Pilot (PCP) on your systems. The following major sections are included:
• the section called “Product Structure” describes the main packages of PCP software and how they mustbe installed on each system.
• the section called “Performance Metrics Collection Daemon (PMCD)”, describes the fundamentals ofmaintaining the performance data collector.
• the section called “Managing Optional PMDAs”, describes the basics of installing a new PerformanceMetrics Domain Agent (PMDA) to collect metric data and pass it to the PMCD.
• the section called “Troubleshooting”, offers advice on problems involving the PMCD.
Product StructureIn a typical deployment, Performance Co-Pilot (PCP) would be installed in a collector configuration onone or more hosts, from which the performance information could then be collected, and in a monitorconfiguration on one or more workstations, from which the performance of the server systems could thenbe monitored.
On some platforms Performance Co-Pilot is presented as multiple packages; typically separating the servercomponents from graphical user interfaces and documentation.
pcp-X.Y.Z-rev package for core PCP
pcp-gui-X.Y.Z-rev package for graphical PCP client tools
pcp-doc-X.Y.Z-rev package for online PCP documentation
16

Installing and ConfiguringPerformance Co-Pilot
Performance Metrics Collection Daemon(PMCD)
On each Performance Co-Pilot (PCP) collection system, you must be certain that the pmcd daemon isrunning. This daemon coordinates the gathering and exporting of performance statistics in response torequests from the PCP monitoring tools.
Starting and Stopping the PMCDTo start the daemon, enter the following commands as root on each PCP collection system:
chkconfig pmcd on ${PCP_RC_DIR}/pmcd start
These commands instruct the system to start the daemon immediately, and again whenever the systemis booted. It is not necessary to start the daemon on the monitoring system unless you wish to collectperformance information from it as well.
To stop pmcd immediately on a PCP collection system, enter the following command:
${PCP_RC_DIR}/pmcd stop
Restarting an Unresponsive PMCDSometimes, if a daemon is not responding on a PCP collection system, the problem can be resolved bystopping and then immediately restarting a fresh instance of the daemon. If you need to stop and thenimmediately restart PMCD on a PCP collection system, use the start argument provided with the scriptin ${PCP_RC_DIR}. The command syntax is, as follows:
${PCP_RC_DIR}/pmcd start
On startup, pmcd looks for a configuration file at ${PCP_PMCDCONF_PATH}. This file specifies whichagents cover which performance metrics domains and how PMCD should make contact with the agents.A comprehensive description of the configuration file syntax and semantics can be found in the pmcd(1)man page.
If the configuration is changed, pmcd reconfigures itself when it receives the SIGHUP signal. Use thefollowing command to send the SIGHUP signal to the daemon:
${PCP_BINADM_DIR}/pmsignal -a -s HUP pmcd
This is also useful when one of the PMDAs managed by pmcd has failed or has been terminated bypmcd. Upon receipt of the SIGHUP signal, pmcd restarts any PMDA that is configured but inactive. Theexception to this rule is the case of a PMDA which must run with superuser privileges (where possible,this is avoided) - for these PMDAs, a full pmcd restart must be performed, using the process describedearlier (not SIGHUP).
PMCD Diagnostics and Error MessagesIf there is a problem with pmcd, the first place to investigate should be the pmcd.log file. By default,this file is in the ${PCP_LOG_DIR}/pmcd directory.
17

Installing and ConfiguringPerformance Co-Pilot
PMCD Options and Configuration FilesThere are two files that control PMCD operation. These are the ${PCP_PMCDCONF_PATH} and${PCP_PMCDOPTIONS_PATH} files. The pmcd.options file contains the command line optionsused with PMCD; it is read when the daemon is invoked by ${PCP_RC_DIR}/pmcd. The pmcd.conffile contains configuration information regarding domain agents and the metrics that they monitor. Theseconfiguration files are described in the following sections.
The pmcd.options File
Command line options for the PMCD are stored in the ${PCP_PMCDOPTIONS_PATH} file. The PMCDcan be invoked directly from a shell prompt, or it can be invoked by ${PCP_RC_DIR}/pmcd as partof the boot process. It is usual and normal to invoke it using ${PCP_RC_DIR}/pmcd, reserving shellinvocation for debugging purposes.
The PMCD accepts certain command line options to control its execution, and these options are placedin the pmcd.options file when ${PCP_RC_DIR}/pmcd is being used to start the daemon. Thefollowing options (amongst others) are available:
-i address For hosts with more than one network interface, this option specifies theinterface on which this instance of the PMCD accepts connections. Multiple -i options may be specified. The default in the absence of any -i option is forPMCD to accept connections on all interfaces.
-l file Specifies a log file. If no -l option is specified, the log file name is pmcd.logand it is created in the directory ${PCP_LOG_DIR}/pmcd/.
-s file Specifies the path to a local unix domain socket (for platforms supportingthis socket family only). The default value is ${PCP_RUN_DIR}/pmcd.socket.
-t seconds Specifies the amount of time, in seconds, before PMCD times out on protocoldata unit (PDU) exchanges with PMDAs. If no time out is specified, the defaultis five seconds. Setting time out to zero disables time outs (not recommended,PMDAs should always respond quickly).
The time out may be dynamically modified by storing the number of secondsinto the metric pmcd.control.timeout using pmstore.
-T mask Specifies whether connection and PDU tracing are turned on for debuggingpurposes.
See the pmcd(1) man page for complete information on these options.
The default pmcd.options file shipped with PCP is similar to the following:
# command-line options to pmcd, uncomment/edit lines as required
# longer timeout delay for slow agents# -t 10
# suppress timeouts# -t 0
18

Installing and ConfiguringPerformance Co-Pilot
# make log go someplace else# -l /some/place/else
# debugging knobs, see pmdbg(1)# -D N# -f
# Restricting (further) incoming PDU size to prevent DOS attacks# -L 16384
# enable event tracing bit fields# 1 trace connections# 2 trace PDUs# 256 unbuffered tracing# -T 3
# setting of environment variables for pmcd and# the PCP rc scripts. See pmcd(1) and PMAPI(3).# PMCD_WAIT_TIMEOUT=120
The most commonly used options have been placed in this file for your convenience. To uncomment anduse an option, simply remove the pound sign (#) at the beginning of the line with the option you wish touse. Restart pmcd for the change to take effect; that is, as superuser, enter the command:
${PCP_RC_DIR}/pmcd start
The pmcd.conf File
When the PMCD is invoked, it reads its configuration file, which is ${PCP_PMCDCONF_PATH}. Thisfile contains entries that specify the PMDAs used by this instance of the PMCD and which metrics arecovered by these PMDAs. Also, you may specify access control rules in this file for the various hosts,users and groups on your network. This file is described completely in the pmcd(1) man page.
With standard PCP operation (even if you have not created and added your own PMDAs), you might needto edit this file in order to add any additional access control you wish to impose. If you do not add accesscontrol rules, all access for all operations is granted to the local host, and read-only access is granted toremote hosts. The pmcd.conf file is automatically generated during the software build process and onLinux, for example, is similar to the following:
Performance Metrics Domain Specifications# # This file is automatically generated during the build# Name Id IPC IPC Params File/Cmdroot 1 pipe binary /var/lib/pcp/pmdas/root/pmdarootpmcd 2 dso pmcd_init ${PCP_PMDAS_DIR}/pmcd/pmda_pmcd.soproc 3 pipe binary ${PCP_PMDAS_DIR}/proc/pmdaproc -d 3xfs 11 pipe binary ${PCP_PMDAS_DIR}/xfs/pmdaxfs -d 11linux 60 dso linux_init ${PCP_PMDAS_DIR}/linux/pmda_linux.sommv 70 dso mmv_init /var/lib/pcp/pmdas/mmv/pmda_mmv.so
[access]disallow ".*" : store;disallow ":*" : store;allow "local:*" : all;
19

Installing and ConfiguringPerformance Co-Pilot
Note
Even though PMCD does not run with root privileges, you must be very careful not to configurePMDAs in this file if you are not sure of their action. This is because all PMDAs are initiallystarted as root (allowing them to assume alternate identities, such as postgres for example),after which pmcd drops its privileges. Pay close attention that permissions on this file are notinadvertently downgraded to allow public write access.
Each entry in this configuration file contains rules that specify how to connect the PMCD to a particularPMDA and which metrics the PMDA monitors. A PMDA may be attached as a Dynamic Shared Object(DSO) or by using a socket or a pair of pipes. The distinction between these attachment methods isdescribed below.
An entry in the pmcd.conf file looks like this:
label_name domain_number type path
The label_name field specifies a name for the PMDA. The domain_number is an integer value thatspecifies a domain of metrics for the PMDA. The type field indicates the type of entry (DSO, socket, orpipe). The path field is for additional information, and varies according to the type of entry.
The following rules are common to DSO, socket, and pipe syntax:
label_name An alphanumeric string identifying the agent.
domain_number An unsigned integer specifying the agent's domain.
DSO entries follow this syntax:
label_name domain_number dso entry-point path
The following rules apply to the DSO syntax:
dso The entry type.
entry-point The name of an initialization function called when the DSO is loaded.
path Designates the location of the DSO. An absolute path must be used. On mostplatforms this will be a so suffixed file, on Windows it is a dll, and on MacOS X it is a dylib file.
Socket entries in the pmcd.conf file follow this syntax:
label_name domain_number socket addr_family address command [args]
The following rules apply to the socket syntax:
socket The entry type.
addr_family Specifies if the socket is AF_INET, AF_IPV6 or AF_UNIX. If the socket isINET, the word inet appears in this place. If the socket is IPV6, the wordipv6 appears in this place. If the socket is UNIX, the word unix appears inthis place.
address Specifies the address of the socket. For INET or IPv6 sockets, this is a portnumber or port name. For UNIX sockets, this is the name of the PMDA's socketon the local host.
20

Installing and ConfiguringPerformance Co-Pilot
command Specifies a command to start the PMDA when the PMCD is invoked and readsthe configuration file.
args Optional arguments for command.
Pipe entries in the pmcd.conf file follow this syntax:
label_name domain_number pipe protocol command [args]
The following rules apply to the pipe syntax:
pipe The entry type.
protocol Specifies whether a text-based or a binary PCP protocol should be used over the pipes.Historically, this parameter was able to be “text” or “binary.” The text-based protocolhas long since been deprecated and removed, however, so nowadays “binary” is theonly valid value here.
command Specifies a command to start the PMDA when the PMCD is invoked and reads theconfiguration file.
args Optional arguments for command.
Controlling Access to PMCD with pmcd.conf
You can place this option extension in the pmcd.conf file to control access to performance metric databased on hosts, users and groups. To add an access control section, begin by placing the following lineat the end of your pmcd.conf file:
[access]
Below this line, you can add entries of the following forms:
allow hosts hostlist : operations ; disallow hosts hostlist : operations ;allow users userlist : operations ; disallow users userlist : operations ;allow groups grouplist : operations ; disallow groups grouplist : operations ;
The keywords users, groups and hosts can be used in either plural or singular form.
The userlist and grouplist fields are comma-separated lists of authenticated users and groupsfrom the local /etc/passwd and /etc/groups files, NIS (network information service) or LDAP(lightweight directory access protocol) service.
The hostlist is a comma-separated list of host identifiers; the following rules apply:
• Host names must be in the local system's /etc/hosts file or known to the local DNS (domain nameservice).
• IP and IPv6 addresses may be given in the usual numeric notations.
• A wildcarded IP or IPv6 address may be used to specify groups of hosts, with the single wildcardcharacter * as the last-given component of the address. The wildcard .* refers to all IP (IPv4) addresses.The wildcard :* refers to all IPv6 addresses. If an IPv6 wildcard contains a :: component, then the final* refers to the final 16 bits of the address only, otherwise it refers to the remaining unspecified bits ofthe address.
The wildcard ``*'' refers to all users, groups or host addresses. Names of users, groups or hosts may notbe wildcarded.
21

Installing and ConfiguringPerformance Co-Pilot
For example, the following hostlist entries are all valid:
babylonbabylon.acme.com123.101.27.44localhost155.116.24.*192.*.*fe80::223:14ff:feaf:b62cfe80::223:14ff:feaf:*fe80:*:**
The operations field can be any of the following:
• A comma-separated list of the operation types described below.
• The word all to allow or disallow all operations as specified in the first field.
• The words all except and a list of operations. This entry allows or disallows all operations as specifiedin the first field except those listed.
• The phrase maximum N connections to set an upper bound (N) on the number of connections anindividual host, user or group of users may make. This can only be added to the operations list ofan allow statement.
The operations that can be allowed or disallowed are as follows:
fetch Allows retrieval of information from the PMCD. This may be information about a metric(such as a description, instance domain, or help text) or an actual value for a metric.
store Allows the PMCD to store metric values in PMDAs that permit store operations. Be cautiousin allowing this operation, because it may be a security opening in large networks, although thePMDAs shipped with the PCP package typically reject store operations, except for selectedperformance metrics where the effect is benign.
For example, here is a sample access control portion of a ${PCP_PMCDCONF_PATH} file:
allow hosts babylon, moomba : all ; disallow user sam : all ;allow group dev : fetch ; allow hosts 192.127.4.* : fetch ; disallow host gate-inet : store ;
Complete information on access control syntax rules in the pmcd.conf file can be found in the pmcd(1)man page.
Managing Optional PMDAsSome Performance Metrics Domain Agents (PMDAs) shipped with Performance Co-Pilot (PCP) aredesigned to be installed and activated on every collector host, for example, linux, windows, darwin,pmcd, and process PMDAs.
Other PMDAs are designed for optional activation and require some user action to make them operational.In some cases these PMDAs expect local site customization to reflect the operational environment, the
22

Installing and ConfiguringPerformance Co-Pilot
system configuration, or the production workload. This customization is typically supported by interactiveinstallation scripts for each PMDA.
Each PMDA has its own directory located below ${PCP_PMDAS_DIR}. Each directory contains aRemove script to unconfigure the PMDA, remove the associated metrics from the PMNS, and restart thepmcd daemon; and an Install script to install the PMDA, update the PMNS, and restart the PMCDdaemon.
As a shortcut mechanism to support automated PMDA installation, a file named .NeedInstall can becreated in a PMDA directory below ${PCP_PMDAS_DIR}. The next restart of PCP services will invokethat PMDAs installation automatically, with default options taken.
PMDA Installation on a PCP Collector HostTo install a PMDA you must perform a collector installation for each host on which the PMDA is requiredto export performance metrics. PCP provides a distributed metric namespace (PMNS) and metadata, so itis not necessary to install PMDAs (with their associated PMNS) on PCP monitor hosts.
You need to update the PMNS, configure the PMDA, and notify PMCD. The Install script for eachPMDA automates these operations, as follows:
1. Log in as root (the superuser).
2. Change to the PMDA's directory as shown in the following example:
cd ${PCP_PMDAS_DIR}/cisco
3. In the unlikely event that you wish to use a non-default Performance Metrics Domain (PMD)assignment, determine the current PMD assignment:
cat domain.h
Check that there is no conflict in the PMDs as defined in ${PCP_VAR_DIR}/pmns/stdpmidand the other PMDAs currently in use (listed in ${PCP_PMCDCONF_PATH}). Edit domain.h toassign the new domain number if there is a conflict (this is highly unlikely to occur in a regular PCPinstallation).
4. Enter the following command:
./Install
You may be prompted to enter some local parameters or configuration options. The script applies allrequired changes to the control files and to the PMNS, and then notifies PMCD. Example 2.1, “PMNSInstallation Output ” is illustrative of the interactions:
Example 2.1. PMNS Installation Output
Cisco hostname or IP address? [return to quit] wanmelb
A user-level password may be required for Cisco “show int” command. If you are unsure, try the command $ telnet wanmelb and if the prompt “Password:” appears, a user-level password is required; otherwise answer the next question with an empty line.
User-level Cisco password? ********
23

Installing and ConfiguringPerformance Co-Pilot
Probing Cisco for list of interfaces ...
Enter interfaces to monitor, one per line in the formattX where “t” is a type and one of “e” (Ethernet), or “f” (Fddi), or“s” (Serial), or “a” (ATM), and “X” is an interface identifierwhich is either an integer (e.g. 4000 Series routers) or twointegers separated by a slash (e.g. 7000 Series routers).
The currently unselected interfaces for the Cisco “wanmelb” are: e0 s0 s1Enter “quit” to terminate the interface selection process.Interface? [e0] s0
The currently unselected interfaces for the Cisco “wanmelb” are: e0 s1Enter “quit” to terminate the interface selection process.Interface? [e0] s1
The currently unselected interfaces for the Cisco “wanmelb” are: e0Enter “quit” to terminate the interface selection process.Interface? [e0] quit
Cisco hostname or IP address? [return to quit]Updating the Performance Metrics Name Space (PMNS) ...Installing pmchart view(s) ...Terminate PMDA if already installed ...Installing files ...Updating the PMCD control file, and notifying PMCD ...Check cisco metrics have appeared ... 5 metrics and 10 values
PMDA Removal on a PCP Collector HostTo remove a PMDA, you must perform a collector removal for each host on which the PMDA is currentlyinstalled.
The PMNS needs to be updated, the PMDA unconfigured, and PMCD notified. The Remove script foreach PMDA automates these operations, as follows:
1. Log in as root (the superuser).
2. Change to the PMDA's directory as shown in the following example:
cd ${PCP_PMDAS_DIR}/elasticsearch
3. Enter the following command:
./Remove
The following output illustrates the result:
Culling the Performance Metrics Name Space ...elasticsearch ... doneUpdating the PMCD control file, and notifying PMCD ...Removing files ...
24

Installing and ConfiguringPerformance Co-Pilot
Check elasticsearch metrics have gone away ... OK
TroubleshootingThe following sections offer troubleshooting advice on the Performance Metrics Name Space (PMNS),missing and incomplete values for performance metrics, kernel metrics and the PMCD.
Advice for troubleshooting the archive logging system is provided in Chapter 6, Archive Logging.
Performance Metrics Name SpaceTo display the active PMNS, use the pminfo command; see the pminfo(1) man page.
The PMNS at the collector host is updated whenever a PMDA is installed or removed, and may also beupdated when new versions of PCP are installed. During these operations, the PMNS is typically updatedby merging the (plaintext) namespace components from each installed PMDA. These separate PMNScomponents reside in the ${PCP_VAR_DIR}/pmns directory and are merged into the root file there.
Missing and Incomplete Values for Performance MetricsMissing or incomplete performance metric values are the result of their unavailability.
Metric Values Not Available
The following symptom has a known cause and resolution:
Symptom: Values for some or all of the instances of a performance metric are notavailable.
Cause: This can occur as a consequence of changes in the installation of modules (forexample, a DBMS or an application package) that provide the performanceinstrumentation underpinning the PMDAs. Changes in the selection ofmodules that are installed or operational, along with changes in the version ofthese modules, may make metrics appear and disappear over time.
In simple terms, the PMNS contains a metric name, but when that metric isrequested, no PMDA at the collector host supports the metric.
For archive logs, the collection of metrics to be logged is a subset of the metricsavailable, so utilities replaying from a PCP archive log may not have access toall of the metrics available from a live (PMCD) source.
Resolution: Make sure the underlying instrumentation is available and the module is active.Ensure that the PMDA is running on the host to be monitored. If necessary,create a new archive log with a wider range of metrics to be logged.
Kernel Metrics and the PMCDThe following issues involve the kernel metrics and the PMCD:
• Cannot connect to remote PMCD
• PMCD not reconfiguring after hang-up
• PMCD does not start
25

Installing and ConfiguringPerformance Co-Pilot
Cannot Connect to Remote PMCD
The following symptom has a known cause and resolution:
Symptom: A PCP client tool (such as pmchart, pmie, or pmlogger) complains thatit is unable to connect to a remote PMCD (or establish a PMAPI context), butyou are sure that PMCD is active on the remote host.
Cause: To avoid hanging applications for the duration of TCP/IP time outs, the PMAPIlibrary implements its own time out when trying to establish a connection toa PMCD. If the connection to the host is over a slow network, then successfulestablishment of the connection may not be possible before the time out, andthe attempt is abandoned.
Alternatively, there may be a firewall in-between the client tool and PMCDwhich is blocking the connection attempt.
Finally, PMCD may be running in a mode where it does not acept remoteconnections, or only listening on certain interface.
Resolution: Establish that the PMCD on far-away-host is really alive, by connectingto its control port (TCP port number 44321 by default):
telnet far-away-host 44321
This response indicates the PMCD is not running and needs restarting:
Unable to connect to remote host: Connection refused
To restart the PMCD on that host, enter the following command:
${PCP_RC_DIR}/pmcd start
This response indicates the PMCD is running:
Connected to far-away-host
Interrupt the telnet session, increase the PMAPI time out by settingthe PMCD_CONNECT_TIMEOUT environment variable to some number ofseconds (60 for instance), and try the PCP client tool again.
Verify that PMCD is not running in local-only mode, by looking for an enabledvalue (one) from:
pminfo -f pmcd.feature.local
This setting is controlled from the PMCD_LOCAL environment variable usuallyset via ${PCP_SYSCONFIG_PATH}/pmcd.
If these techniques are ineffective, it is likely an intermediary firewall isblocking the client from accessing the PMCD port - resolving such issues isfirewall-host platform-specific and cannot practically be covered here.
PMCD Not Reconfiguring after SIGHUP
The following symptom has a known cause and resolution:
26

Installing and ConfiguringPerformance Co-Pilot
Symptom PMCD does not reconfigure itself after receiving the SIGHUP signal.
Cause: If there is a syntax error in ${PCP_PMCDCONF_PATH}, PMCD does not usethe contents of the file. This can lead to situations in which the configurationfile and PMCD's internal state do not agree.
Resolution: Always monitor PMCD's log. For example, use the following command inanother window when reconfiguring PMCD, to watch errors occur:
tail -f ${PCP_LOG_DIR}/pmcd/pmcd.log
PMCD Does Not Start
The following symptom has a known cause and resolution:
Symptom:If the following messages appear in the PMCD log (${PCP_LOG_DIR}/pmcd/pmcd.log), consider the cause and resolution:
pcp[27020] Error: OpenRequestSocket(44321) bind: Address already inusepcp[27020] Error: pmcd is already runningpcp[27020] Error: pmcd not started due to errors!
Cause: PMCD is already running or was terminated before it could clean up properly.The error occurs because the socket it advertises for client connections isalready being used or has not been cleared by the kernel.
Resolution: Start PMCD as root (superuser) by typing:
${PCP_RC_DIR}/pmcd start
Any existing PMCD is shut down, and a new one is started in such a way thatthe symptomatic message should not appear.
If you are starting PMCD this way and the symptomatic message appears,a problem has occurred with the connection to one of the deceased PMCD'sclients.
This could happen when the network connection to a remote client is lost andPMCD is subsequently terminated. The system may attempt to keep the socketopen for a time to allow the remote client a chance to reestablish the connectionand read any outstanding data.
The only solution in these circumstances is to wait until the socket times outand the kernel deletes it. This netstat command displays the status of the socketand any connections:
netstat -ant | grep 44321
If the socket is in the FIN_WAIT or TIME_WAIT state, then you must waitfor it to be deleted. Once the command above produces no output, PMCD maybe restarted. Less commonly, you may have another program running on yoursystem that uses the same Internet port number (44321) that PMCD uses.
Refer to the PCPIntro(1) man page for a description of how to override thedefault PMCD port assignment using the PMCD_PORT environment variable.
27

Chapter 3. Common Conventions andArguments
Table of ContentsAlternate Metrics Source Options ........................................................................................ 29
Fetching Metrics from Another Host ............................................................................ 29Fetching Metrics from an Archive Log ......................................................................... 29
General PCP Tool Options ................................................................................................. 29Common Directories and File Locations ....................................................................... 30Alternate Performance Metric Name Spaces .................................................................. 31
Time Duration and Control ................................................................................................. 31Performance Monitor Reporting Frequency and Duration ................................................. 31Time Window Options ............................................................................................... 31Timezone Options ..................................................................................................... 33
PCP Environment Variables ................................................................................................ 33Running PCP Tools through a Firewall ................................................................................. 35
The pmproxy service ................................................................................................ 36Transient Problems with Performance Metric Values ............................................................... 36
Performance Metric Wraparound ................................................................................. 36Time Dilation and Time Skew .................................................................................... 36
This chapter deals with the user interface components that are common to most text-based utilities thatmake up the monitor portion of Performance Co-Pilot (PCP). These are the major sections in this chapter:
• the section called “Alternate Metrics Source Options”, details some basic standards used in thedevelopment of PCP tools.
• the section called “General PCP Tool Options”, details other options to use with PCP tools.
• the section called “Time Duration and Control”, describes the time control dialog and time-relatedcommand line options available for use with PCP tools.
• the section called “PCP Environment Variables”, describes the environment variables supported by PCPtools.
• the section called “Running PCP Tools through a Firewall”, describes how to execute PCP tools thatmust retrieve performance data from the Performance Metrics Collection Daemon (PMCD) on the otherside of a TCP/IP security firewall.
• the section called “Transient Problems with Performance Metric Values ”, covers some uncommonscenarios that may compromise performance metric integrity over the short term.
Many of the utilities provided with PCP conform to a common set of naming and syntactic conventionsfor command line arguments and options. This section outlines these conventions and their meaning. Theoptions may be generally assumed to be honored for all utilities supporting the corresponding functionality.
In all cases, the man pages for each utility fully describe the supported command arguments and options.
Command line options are also relevant when starting PCP applications from the desktop using the Altdouble-click method. This technique launches the pmrun program to collect additional arguments to passalong when starting a PCP application.
28
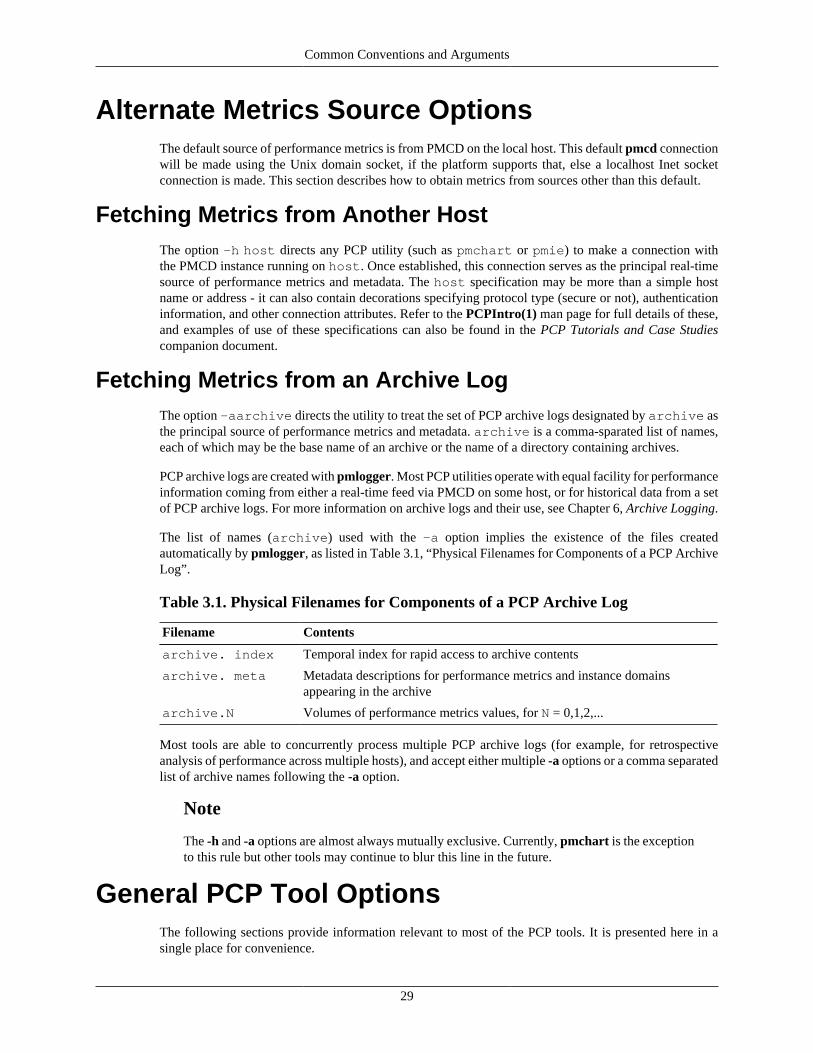
Common Conventions and Arguments
Alternate Metrics Source OptionsThe default source of performance metrics is from PMCD on the local host. This default pmcd connectionwill be made using the Unix domain socket, if the platform supports that, else a localhost Inet socketconnection is made. This section describes how to obtain metrics from sources other than this default.
Fetching Metrics from Another HostThe option -h host directs any PCP utility (such as pmchart or pmie) to make a connection withthe PMCD instance running on host. Once established, this connection serves as the principal real-timesource of performance metrics and metadata. The host specification may be more than a simple hostname or address - it can also contain decorations specifying protocol type (secure or not), authenticationinformation, and other connection attributes. Refer to the PCPIntro(1) man page for full details of these,and examples of use of these specifications can also be found in the PCP Tutorials and Case Studiescompanion document.
Fetching Metrics from an Archive LogThe option -aarchive directs the utility to treat the set of PCP archive logs designated by archive asthe principal source of performance metrics and metadata. archive is a comma-sparated list of names,each of which may be the base name of an archive or the name of a directory containing archives.
PCP archive logs are created with pmlogger. Most PCP utilities operate with equal facility for performanceinformation coming from either a real-time feed via PMCD on some host, or for historical data from a setof PCP archive logs. For more information on archive logs and their use, see Chapter 6, Archive Logging.
The list of names (archive) used with the -a option implies the existence of the files createdautomatically by pmlogger, as listed in Table 3.1, “Physical Filenames for Components of a PCP ArchiveLog”.
Table 3.1. Physical Filenames for Components of a PCP Archive Log
Filename Contents
archive. index Temporal index for rapid access to archive contents
archive. meta Metadata descriptions for performance metrics and instance domainsappearing in the archive
archive.N Volumes of performance metrics values, for N = 0,1,2,...
Most tools are able to concurrently process multiple PCP archive logs (for example, for retrospectiveanalysis of performance across multiple hosts), and accept either multiple -a options or a comma separatedlist of archive names following the -a option.
Note
The -h and -a options are almost always mutually exclusive. Currently, pmchart is the exceptionto this rule but other tools may continue to blur this line in the future.
General PCP Tool OptionsThe following sections provide information relevant to most of the PCP tools. It is presented here in asingle place for convenience.
29

Common Conventions and Arguments
Common Directories and File Locations
The following files and directories are used by the PCP tools as repositories for option and configurationfiles and for binaries:
${PCP_DIR}/etc/pcp.env Script to set PCP run-time environmentvariables.
${PCP_DIR}/etc/pcp.conf PCP configuration and environment file.
${PCP_PMCDCONF_PATH} Configuration file for PerformanceMetrics Collection Daemon (PMCD). Setsenvironment variables, including PATH.
${PCP_BINADM_DIR}/pmcd The PMCD binary.
${PCP_PMCDOPTIONS_PATH} Command line options for PMCD.
${PCP_RC_DIR}/pmcd The PMCD startup script.
${PCP_BIN_DIR}/pcptool Directory containing PCP tools suchas pmstat , pminfo, pmlogger,pmlogsummary, pmchart, pmie, and so on.
${PCP_SHARE_DIR} Directory containing shareable PCP-specificfiles and repository directories such as bin,demos, examples and lib.
${PCP_VAR_DIR} Directory containing non-shareable (that is,per-host) PCP specific files and repositorydirectories.
${PCP_BINADM_DIR}/pcptool PCP tools that are typically not executeddirectly by the end user such as pmcd_wait.
${PCP_SHARE_DIR}/lib/pcplib Miscellaneous PCP libraries and executables.
${PCP_PMDAS_DIR} Performance Metric Domain Agents(PMDAs), one directory per PMDA.
${PCP_VAR_DIR}/config Configuration files for PCP tools, typicallywith one directory per tool.
${PCP_DEMOS_DIR} Demonstration data files and exampleprograms.
${PCP_LOG_DIR} By default, diagnostic and trace log filesgenerated by PMCD and PMDAs. Also,the PCP archive logs are managed in onedirectory per logged host below here.
${PCP_VAR_DIR}/pmns Files and scripts for the Performance MetricsName Space (PMNS).
30

Common Conventions and Arguments
Alternate Performance Metric Name SpacesThe Performance Metrics Name Space (PMNS) defines a mapping from a collection of human-readablenames for performance metrics (convenient to the user) into corresponding internal identifiers (convenientfor the underlying implementation).
The distributed PMNS used in PCP avoids most requirements for an alternate PMNS, because clients'PMNS operations are supported at the Performance Metrics Collection Daemon (PMCD) or by means ofPMNS data in a PCP archive log. The distributed PMNS is the default, but alternates may be specifiedusing the -n namespace argument to the PCP tools. When a PMNS is maintained on a host, it is likelyto reside in the ${PCP_VAR_DIR}/pmns directory.
Time Duration and ControlThe periodic nature of sampling performance metrics and refreshing the displays of the PCP tools makesspecification and control of the temporal domain a common operation. In the following sections, theservices and conventions for specifying time positions and intervals are described.
Performance Monitor Reporting Frequency and DurationMany of the performance monitoring utilities have periodic reporting patterns. The -t intervaland -s samples options are used to control the sampling (reporting) interval, usually expressed as areal number of seconds (interval), and the number of samples to be reported, respectively. In theabsence of the -s flag, the default behavior is for the performance monitoring utilities to run until theyare explicitly stopped.
The interval argument may also be expressed in terms of minutes, hours, or days, as described inthe PCPIntro(1) man page.
Time Window OptionsThe following options may be used with most PCP tools (typically when the source of the performancemetrics is a PCP archive log) to tailor the beginning and end points of a display, the sample origin, andthe sample time alignment to your convenience.
The -S, -T, -O and -A command line options are used by PCP applications to define a time windowof interest.
-S duration The start option may be used to request that the display start at thenominated time. By default, the first sample of performance data isretrieved immediately in real-time mode, or coincides with the firstsample of data of the first archive in a set of PCP archive logs in archivemode. For archive mode, the -S option may be used to specify a latertime for the start of sampling. By default, if duration is an integer, theunits are assumed to be seconds.
To specify an offset from the beginning of a set of PCP archives (inarchive mode) simply specify the offset as the duration. For example,the following entry retrieves the first sample of data at exactly 30 minutesfrom the beginning of a set of PCP archives.
-S 30min
31

Common Conventions and Arguments
To specify an offset from the end of a set of PCP archives, prefix theduration with a minus sign. In this case, the first sample time precedesthe end of archived data by the given duration. For example, thefollowing entry retrieves the first sample exactly one hour preceding thelast sample in a set of PCP archives.
-S -1hour
To specify the calendar date and time (local time in the reportingtimezone) for the first sample, use the ctime(3) syntax preceded byan “at” sign (@). For example, the following entry specifies the date andtime to be used.
-S '@ Mon Mar 4 13:07:47 2017'
Note that this format corresponds to the output format of the datecommand for easy “cut and paste.” However, be sure to enclose the stringin quotes so it is preserved as a single argument for the PCP tool.
For more complete information on the date and time syntax, see thePCPIntro(1) man page.
-T duration The terminate option may be used to request that the display stop at thetime designated by duration. By default, the PCP tools keep samplingperformance data indefinitely (in real-time mode) or until the end of a setof PCP archives (in archive mode). The -T option may be used to specifyan earlier time to terminate sampling.
The interpretation for the duration argument in a -T option is thesame as for the -S option, except for an unsigned time interval that isinterpreted as being an offset from the start of the time window as definedby the default (now for real time, else start of archive set) or by a -Soption. For example, these options define a time window that spans 45minutes, after an initial offset (or delay) of 1 hour:
-S 1hour -T 45mins
-O duration By default, samples are fetched from the start time (see the descriptionof the -S option) to the terminate time (see the description of the -Toption). The offset -O option allows the specification of a time betweenthe start time and the terminate time where the tool should position itsinitial sample time. This option is useful when initial attention is focusedat some point within a larger time window of interest, or when one PCPtool wishes to launch another PCP tool with a common current point oftime within a shared time window.
The duration argument accepted by -O conforms to the same syntaxand semantics as the duration argument for -T. For example, theseoptions specify that the initial position should be the end of the timewindow:
-O -0
This is most useful with the pmchart command to display the tail-end ofthe history up to the end of the time window.
32

Common Conventions and Arguments
-A alignment By default, performance data samples do not necessarily happen at anynatural unit of measured time. The -A switch may be used to force theinitial sample to be on the specified alignment. For example, thesethree options specify alignment on seconds, half hours, and whole hours:
-A 1sec -A 30min -A 1hour
The -A option advances the time to achieve the desired alignment as soonas possible after the start of the time window, whether this is the defaultwindow, or one specified with some combination of -A and -O commandline options.
Obviously the time window may be overspecified by using multiple options from the set -t, -s, -S, -T,-A, and -O. Similarly, the time window may shrink to nothing by injudicious choice of options.
In all cases, the parsing of these options applies heuristics guided by the principal of “least surprise”; thetime window is always well-defined (with the end never earlier than the start), but may shrink to nothingin the extreme.
Timezone OptionsAll utilities that report time of day use the local timezone by default. The following timezone options areavailable:
-z Forces times to be reported in the timezone of the host that provided themetric values (the PCP collector host). When used in conjunction with -a and multiple archives, the convention is to use the timezone from thefirst named archive.
-Z timezone Sets the TZ variable to a timezone string, as defined in environ(7), forexample, -Z UTC for universal time.
PCP Environment VariablesWhen you are using PCP tools and utilities and are calling PCP library functions, a standard set ofdefined environment variables are available in the ${PCP_DIR}/etc/pcp.conf file. These variablesare generally used to specify the location of various PCP pieces in the file system and may be loadedinto shell scripts by sourcing the ${PCP_DIR}/etc/pcp.env shell script. They may also be queriedby C, C++, perl and python programs using the pmGetConfig library function. If a variable is alreadydefined in the environment, the values in the pcp.conf file do not override those values; that is, thevalues in pcp.conf serve only as installation defaults. For additional information, see the pcp.conf(5),pcp.env(5), and pmGetConfig(3) man pages.
The following environment variables are recognized by PCP (these definitions are also available on thePCPIntro(1) man page):
PCP_COUNTER_WRAP Many of the performance metrics exportedfrom PCP agents expect that counters increasemonotonically. Under some circumstances, onevalue of a metric may be smaller than thepreviously fetched value. This can happen whena counter of finite precision overflows, when thePCP agent has been reset or restarted, or when
33

Common Conventions and Arguments
the PCP agent exports values from an underlyinginstrumentation that is subject to asynchronousdiscontinuity.
If set, the PCP_COUNTER_WRAP environmentvariable indicates that all such cases of adecreasing counter should be treated as a counteroverflow; and hence the values are assumedto have wrapped once in the interval betweenconsecutive samples. Counter wrapping was thedefault in versions before the PCP release 1.3.
PCP_STDERR Specifies whether pmprintf() error messages aresent to standard error, an pmconfirm dialog box,or to a named file; see the pmprintf(3) man page.Messages go to standard error if PCP_STDERR isunset or set without a value. If this variable is set toDISPLAY, then messages go to an pmconfirmdialog box; see the pmconfirm(1) man page.Otherwise, the value of PCP_STDERR is assumedto be the name of an output file.
PMCD_CONNECT_TIMEOUT When attempting to connect to a remote PMCDon a system that is booting or at the other end ofa slow network link, some PMAPI routines couldpotentially block for a long time until the remotesystem responds. These routines abort and returnan error if the connection has not been establishedafter some specified interval has elapsed. Thedefault interval is 5 seconds. This may be modifiedby setting this variable in the environment to alarger number of seconds for the desired time out.This is most useful in cases where the remote hostis at the end of a slow network, requiring longerlatencies to establish the connection correctly.
PMCD_PORT This TCP/IP port is used by PMCD to create thesocket for incoming connections and requests. Thedefault is port number 44321, which you mayoverride by setting this variable to a differentport number. If a non-default port is in effectwhen PMCD is started, then every monitoringapplication connecting to that PMCD must alsohave this variable set in its environment beforeattempting a connection.
PMCD_LOCAL This setting indicates that PMCD must only bindto the loopback interface for incoming connectionsand requests. In this mode, connections fromremote hosts are not possible.
PMCD_RECONNECT_TIMEOUT When a monitor or client applicationloses its connection to a PMCD, theconnection may be reestablished by callingthe pmReconnectContext(3) PMAPI function.
34

Common Conventions and Arguments
However, attempts to reconnect are controlled bya back-off strategy to avoid flooding the networkwith reconnection requests. By default, the back-off delays are 5, 10, 20, 40, and 80 seconds forconsecutive reconnection requests from a client(the last delay is repeated for any further attemptsafter the last delay in the list). Setting thisenvironment variable to a comma-separated list ofpositive integers redefines the back-off delays. Forexample, setting the delays to 1,2 will back off for1 second, then back off every 2 seconds thereafter.
PMCD_REQUEST_TIMEOUT For monitor or client applications connected toPMCD, there is a possibility of the applicationhanging on a request for performance metrics ormetadata or help text. These delays may becomesevere if the system running PMCD crashes or thenetwork connection is lost or the network link isvery slow. By setting this environment variableto a real number of seconds, requests to PMCDtimeout after the specified number of seconds.The default behavior is to wait 10 seconds for aresponse from every PMCD for all applications.
PMLOGGER_PORT This environment variable may be used to changethe base TCP/IP port number used by pmloggerto create the socket to which pmlc instancestry to connect. The default base port numberis 4330. If used, this variable should be set inthe environment before pmlogger is executed. Ifpmlc and pmlogger are on different hosts, thenobviously PMLOGGER_PORT must be set to thesame value in both places.
PMLOGGER_LOCAL This environment variable indicates that pmloggermust only bind to the loopback interface for pmlcconnections and requests. In this mode, pmlcconnections from remote hosts are not possible. Ifused, this variable should be set in the environmentbefore pmlogger is executed.
PMPROXY_PORT This environment variable may be used to changethe base TCP/IP port number used by pmproxy tocreate the socket to which proxied clients connect,on their way to a distant pmcd.
PMPROXY_LOCAL This setting indicates that pmproxy mustonly bind to the loopback interface forincoming connections and requests. In this mode,connections from remote hosts are not possible.
Running PCP Tools through a FirewallIn some production environments, the Performance Co-Pilot (PCP) monitoring hosts are on one side of aTCP/IP firewall, and the PCP collector hosts may be on the other side.
35

Common Conventions and Arguments
If the firewall service sits between the monitor and collector tools, the pmproxy service may be used toperform both packet forwarding and DNS proxying through the firewall; see the pmproxy(1) man page.Otherwise, it is necessary to arrange for packet forwarding to be enabled for those TCP/IP ports used byPCP, namely 44321 (or the value of the PMCD_PORT environment variable) for connections to PMCD.
The pmproxy serviceThe pmproxy service allows PCP clients running on hosts located on one side of a firewall to monitorremote hosts on the other side. The basic connection syntax is as follows, where tool is an arbitrary PCPapplication, typically a monitoring tool:
pmprobe -h remotehost@proxyhost
This extended host specification syntax is part of a larger set of available extensions to the basic hostnaming syntax - refer to the PCPIntro(1) man page for further details.
Transient Problems with Performance MetricValues
Sometimes the values for a performance metric as reported by a PCP tool appear to be incorrect. Thisis typically caused by transient conditions such as metric wraparound or time skew, described below.These conditions result from design decisions that are biased in favor of lightweight protocols and minimalresource demands for PCP components.
In all cases, these events are expected to occur infrequently, and should not persist beyond a few samples.
Performance Metric WraparoundPerformance metrics are usually expressed as numbers with finite precision. For metrics that arecumulative counters of events or resource consumption, the value of the metric may occasionally overflowthe specified range and wraparound to zero.
Because the value of these counter metrics is computed from the rate of change with respect to theprevious sample, this may result in a transient condition where the rate of change is an unknown value.If the PCP_COUNTER_WRAP environment variable is set, this condition is treated as an overflow, andspeculative rate calculations are made. In either case, the correct rate calculation for the metric returnswith the next sample.
Time Dilation and Time SkewIf a PMDA is tardy in returning results, or the PCP monitoring tool is connected to PMCD via a slow orcongested network, an error might be introduced in rate calculations due to a difference between the timethe metric was sampled and the time PMCD sends the result to the monitoring tool.
In practice, these errors are usually so small as to be insignificant, and the errors are self-correcting (notcumulative) over consecutive samples.
A related problem may occur when the system time is not synchronized between multiple hosts, and thetime stamps for the results returned from PMCD reflect the skew in the system times. In this case, it isrecommended that NTP (network time protocol) be used to keep the system clocks on the collector systemssynchronized; for information on NTP refer to the ntpd(1) man page.
36
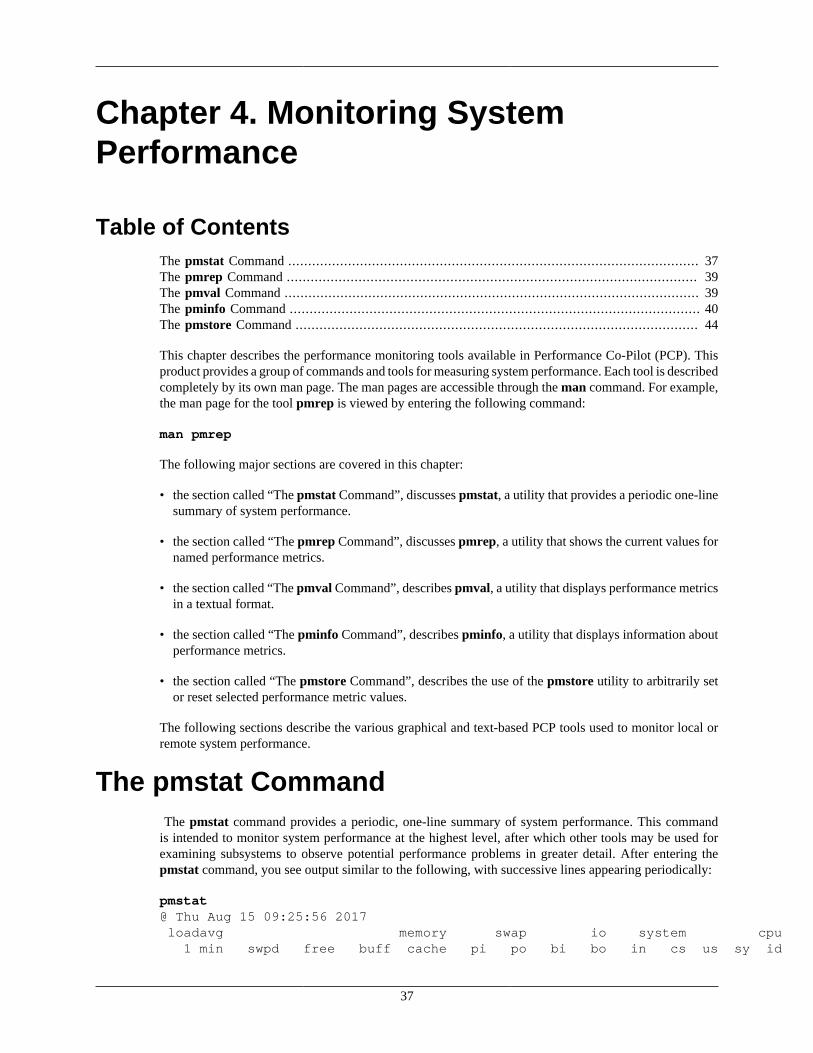
Chapter 4. Monitoring SystemPerformance
Table of ContentsThe pmstat Command ....................................................................................................... 37The pmrep Command ....................................................................................................... 39The pmval Command ........................................................................................................ 39The pminfo Command ....................................................................................................... 40The pmstore Command ..................................................................................................... 44
This chapter describes the performance monitoring tools available in Performance Co-Pilot (PCP). Thisproduct provides a group of commands and tools for measuring system performance. Each tool is describedcompletely by its own man page. The man pages are accessible through the man command. For example,the man page for the tool pmrep is viewed by entering the following command:
man pmrep
The following major sections are covered in this chapter:
• the section called “The pmstat Command”, discusses pmstat, a utility that provides a periodic one-linesummary of system performance.
• the section called “The pmrep Command”, discusses pmrep, a utility that shows the current values fornamed performance metrics.
• the section called “The pmval Command”, describes pmval, a utility that displays performance metricsin a textual format.
• the section called “The pminfo Command”, describes pminfo, a utility that displays information aboutperformance metrics.
• the section called “The pmstore Command”, describes the use of the pmstore utility to arbitrarily setor reset selected performance metric values.
The following sections describe the various graphical and text-based PCP tools used to monitor local orremote system performance.
The pmstat Command The pmstat command provides a periodic, one-line summary of system performance. This commandis intended to monitor system performance at the highest level, after which other tools may be used forexamining subsystems to observe potential performance problems in greater detail. After entering thepmstat command, you see output similar to the following, with successive lines appearing periodically:
pmstat@ Thu Aug 15 09:25:56 2017 loadavg memory swap io system cpu 1 min swpd free buff cache pi po bi bo in cs us sy id
37

Monitoring System Performance
1.29 833960 5614m 144744 265824 0 0 0 1664 13K 23K 6 7 81 1.51 833956 5607m 144744 265712 0 0 0 1664 13K 24K 5 7 83 1.55 833956 5595m 145196 271908 0 0 14K 1056 13K 24K 7 7 74
An additional line of output is added every five seconds. The -t interval option may be used to varythe update interval (i.e. the sampling interval).
The output from pmstat is directed to standard output, and the columns in the report are interpreted asfollows:
loadavg The 1-minute load average (runnable processes).
memory The swpd column indicates average swap space used during the interval (all columnsreported in Kbytes unless otherwise indicated). The free column indicates average freememory during the interval. The buff column indicates average buffer memory in useduring the interval. The cache column indicates average cached memory in use duringthe interval.
swap Reports the average number of pages that are paged-in (pi) and paged-out (po) persecond during the interval. It is normal for the paged-in values to be non-zero, but thesystem is suffering memory stress if the paged-out values are non-zero over an extendedperiod.
io The bi and bo columns indicate the average rate per second of block input and blockoutput operations respectfully, during the interval. These rates are independent of the I/O block size. If the values become large, they are reported as thousands of operationsper second (K suffix) or millions of operations per second (M suffix).
system Context switch rate (cs) and interrupt rate (in). Rates are expressed as averageoperations per second during the interval. Note that the interrupt rate is normally at leastHZ (the clock interrupt rate, and kernel.all.hz metric) interrupts per second.
cpu Percentage of CPU time spent executing user code (us), system and interrupt code (sy),idle loop (id).
As with most PCP utilities, real-time metric, and archive logs are interchangeable.
For example, the following command uses a local system PCP archive log 20170731 and the timezoneof the host (smash) from which performance metrics in the archive were collected:
pmstat -a ${PCP_LOG_DIR}/pmlogger/smash/20170731 -t 2hour -A 1hour -zNote: timezone set to local timezone of host "smash"@ Wed Jul 31 10:00:00 2017 loadavg memory swap io system cpu 1 min swpd free buff cache pi po bi bo in cs us sy id 3.90 24648 6234m 239176 2913m ? ? ? ? ? ? ? ? ? 1.72 24648 5273m 239320 2921m 0 0 4 86 11K 19K 5 5 84 3.12 24648 5194m 241428 2969m 0 0 0 84 10K 19K 5 5 85 1.97 24644 4945m 244004 3146m 0 0 0 84 10K 19K 5 5 84 3.82 24640 4908m 244116 3147m 0 0 0 83 10K 18K 5 5 85 3.38 24620 4860m 244116 3148m 0 0 0 83 10K 18K 5 4 85 2.89 24600 4804m 244120 3149m 0 0 0 83 10K 18K 5 4 85pmFetch: End of PCP archive log
For complete information on pmstat usage and command line options, see the pmstat(1) man page.
38

Monitoring System Performance
The pmrep CommandThe pmrep command displays performance metrics in ASCII tables, suitable for export into databasesor report generators. It is a flexible command. For example, the following command provides continuousmemory statistics on a host named surf:
pmrep -p -h surf kernel.all.load kernel.all.pswitch k.a.load k.a.load k.a.load k.a.pswitch 1 minute 5 minute 15 minut count/s10:41:37 0.160 0.170 0.180 N/A10:41:38 0.160 0.170 0.180 1427.01610:41:39 0.160 0.170 0.180 2129.04010:41:40 0.160 0.170 0.180 5335.16310:41:41 0.160 0.170 0.180 723.12510:41:42 0.140 0.160 0.180 591.859
See the pmrep(1) man page for more information.
The pmval Command The pmval command dumps the current values for the named performance metrics. For example, thefollowing command reports the value of performance metric proc.nprocs once per second (by default),and produces output similar to this:
pmval proc.nprocsmetric: proc.nprocshost: localhostsemantics: instantaneous valueunits: nonesamples: allinterval: 1.00 sec 81 81 82 81
In this example, the number of running processes was reported once per second.
Where the semantics of the underlying performance metrics indicate that it would be sensible, pmvalreports the rate of change or resource utilization.
For example, the following command reports idle processor utilization for each of four CPUs on the remotehost dove, each five seconds apart, producing output of this form:
pmval -h dove -t 5sec -s 4 kernel.percpu.cpu.idlemetric: kernel.percpu.cpu.idlehost: dovesemantics: cumulative counter (converting to rate)units: millisec (converting to time utilization)samples: 4interval: 5.00 sec
cpu:1.1.0.a cpu:1.1.0.c cpu:1.1.1.a cpu:1.1.1.c
39

Monitoring System Performance
1.000 0.9998 0.9998 1.000 1.000 0.9998 0.9998 1.000 0.8989 0.9987 0.9997 0.9995 0.9568 0.9998 0.9996 1.000
Similarly, the following command reports disk I/O read rate every minute for just the disk /dev/disk1,and produces output similar to the following:
pmval -t 1min -i disk1 disk.dev.readmetric: disk.dev.readhost: localhostsemantics: cumulative counter (converting to rate)units: count (converting to count / sec)samples: indefiniteinterval: 60.00 sec disk1 33.67 48.71 52.33 11.33 2.333
The -r flag may be used to suppress the rate calculation (for metrics with counter semantics) and displaythe raw values of the metrics.
In the example below, manipulation of the time within the archive is achieved by the exchange of timecontrol messages between pmval and pmtime.
pmval -g -a ${PCP_LOG_DIR}/pmlogger/myserver/20170731 kernel.all.load
The pmval command is documented by the pmval(1) man page, and annotated examples of the use ofpmval can be found in the PCP Tutorials and Case Studies companion document.
The pminfo CommandThe pminfo command displays various types of information about performance metrics available throughthe Performance Co-Pilot (PCP) facilities.
The -T option is extremely useful; it provides help text about performance metrics:
pminfo -T mem.util.cachedmem.util.cachedHelp:Memory used by the page cache, including buffered file data.This is in-memory cache for files read from the disk (the pagecache)but doesn't include SwapCached.
The -t option displays the one-line help text associated with the selected metrics. The -T option printsmore verbose help text.
Without any options, pminfo verifies that the specified metrics exist in the namespace, and echoes thosenames. Metrics may be specified as arguments to pminfo using their full metric names. For example, thiscommand returns the following response:
pminfo hinv.ncpu network.interface.total.bytes
40

Monitoring System Performance
hinv.ncpu network.interface.total.bytes
A group of related metrics in the namespace may also be specified. For example, to list all of the hinvmetrics you would use this command:
pminfo hinvhinv.physmemhinv.pagesizehinv.ncpuhinv.ndiskhinv.nfilesyshinv.ninterfacehinv.nnodehinv.machinehinv.map.scsihinv.map.cpu_numhinv.map.cpu_nodehinv.map.lvnamehinv.cpu.clockhinv.cpu.vendorhinv.cpu.modelhinv.cpu.steppinghinv.cpu.cachehinv.cpu.bogomips
If no metrics are specified, pminfo displays the entire collection of metrics. This can be useful for searchingfor metrics, when only part of the full name is known. For example, this command returns the followingresponse:
pminfo | grep nfsnfs.client.callsnfs.client.reqsnfs.server.callsnfs.server.reqsnfs3.client.callsnfs3.client.reqsnfs3.server.callsnfs3.server.reqsnfs4.client.callsnfs4.client.reqsnfs4.server.callsnfs4.server.reqs
The -d option causes pminfo to display descriptive information about metrics (refer to thepmLookupDesc(3) man page for an explanation of this metadata information). The following commandand response show use of the -d option:
pminfo -d proc.nprocs disk.dev.read filesys.freeproc.nprocs Data Type: 32-bit unsigned int InDom: PM_INDOM_NULL 0xffffffff Semantics: instant Units: none
disk.dev.read Data Type: 32-bit unsigned int InDom: 60.1 0xf000001
41
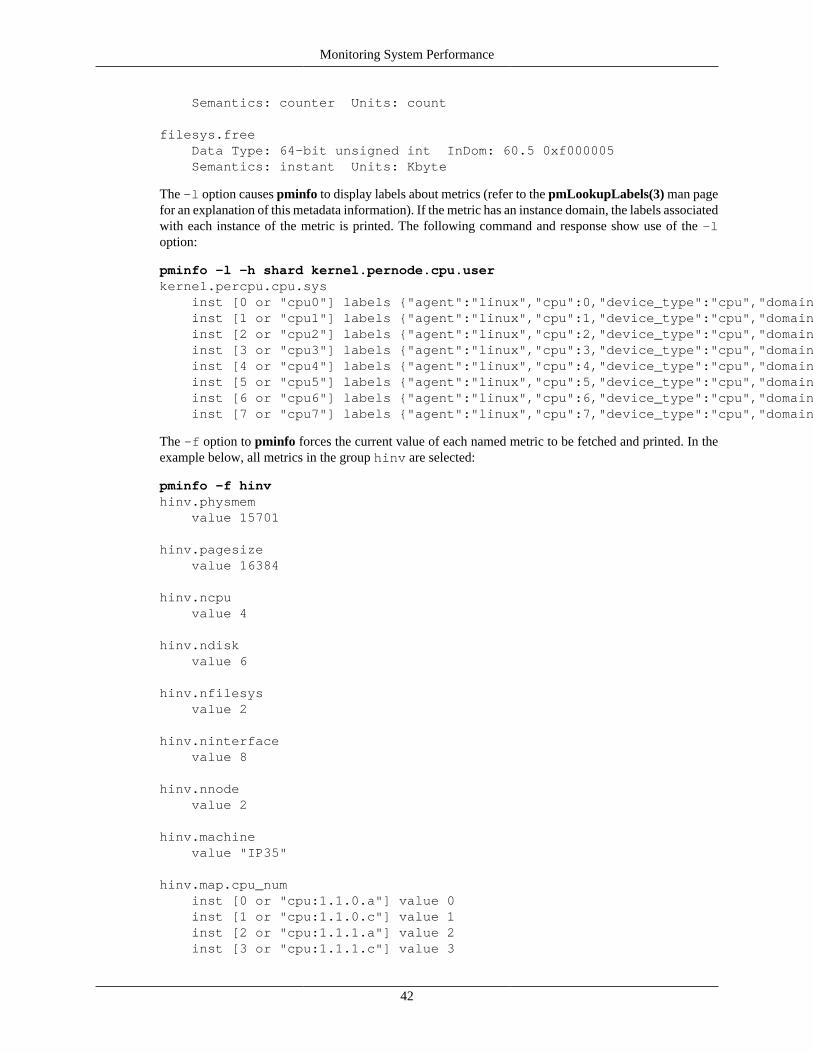
Monitoring System Performance
Semantics: counter Units: count
filesys.free Data Type: 64-bit unsigned int InDom: 60.5 0xf000005 Semantics: instant Units: Kbyte
The -l option causes pminfo to display labels about metrics (refer to the pmLookupLabels(3) man pagefor an explanation of this metadata information). If the metric has an instance domain, the labels associatedwith each instance of the metric is printed. The following command and response show use of the -loption:
pminfo -l -h shard kernel.pernode.cpu.userkernel.percpu.cpu.sys inst [0 or "cpu0"] labels {"agent":"linux","cpu":0,"device_type":"cpu","domainname":"acme.com","groupid":1000,"hostname":"shard","indom_name":"per cpu","userid":1000} inst [1 or "cpu1"] labels {"agent":"linux","cpu":1,"device_type":"cpu","domainname":"acme.com","groupid":1000,"hostname":"shard","indom_name":"per cpu","userid":1000} inst [2 or "cpu2"] labels {"agent":"linux","cpu":2,"device_type":"cpu","domainname":"acme.com","groupid":1000,"hostname":"shard","indom_name":"per cpu","userid":1000} inst [3 or "cpu3"] labels {"agent":"linux","cpu":3,"device_type":"cpu","domainname":"acme.com","groupid":1000,"hostname":"shard","indom_name":"per cpu","userid":1000} inst [4 or "cpu4"] labels {"agent":"linux","cpu":4,"device_type":"cpu","domainname":"acme.com","groupid":1000,"hostname":"shard","indom_name":"per cpu","userid":1000} inst [5 or "cpu5"] labels {"agent":"linux","cpu":5,"device_type":"cpu","domainname":"acme.com","groupid":1000,"hostname":"shard","indom_name":"per cpu","userid":1000} inst [6 or "cpu6"] labels {"agent":"linux","cpu":6,"device_type":"cpu","domainname":"acme.com","groupid":1000,"hostname":"shard","indom_name":"per cpu","userid":1000} inst [7 or "cpu7"] labels {"agent":"linux","cpu":7,"device_type":"cpu","domainname":"acme.com","groupid":1000,"hostname":"shard","indom_name":"per cpu","userid":1000}
The -f option to pminfo forces the current value of each named metric to be fetched and printed. In theexample below, all metrics in the group hinv are selected:
pminfo -f hinvhinv.physmem value 15701
hinv.pagesize value 16384
hinv.ncpu value 4
hinv.ndisk value 6
hinv.nfilesys value 2
hinv.ninterface value 8
hinv.nnode value 2
hinv.machine value "IP35"
hinv.map.cpu_num inst [0 or "cpu:1.1.0.a"] value 0 inst [1 or "cpu:1.1.0.c"] value 1 inst [2 or "cpu:1.1.1.a"] value 2 inst [3 or "cpu:1.1.1.c"] value 3
42
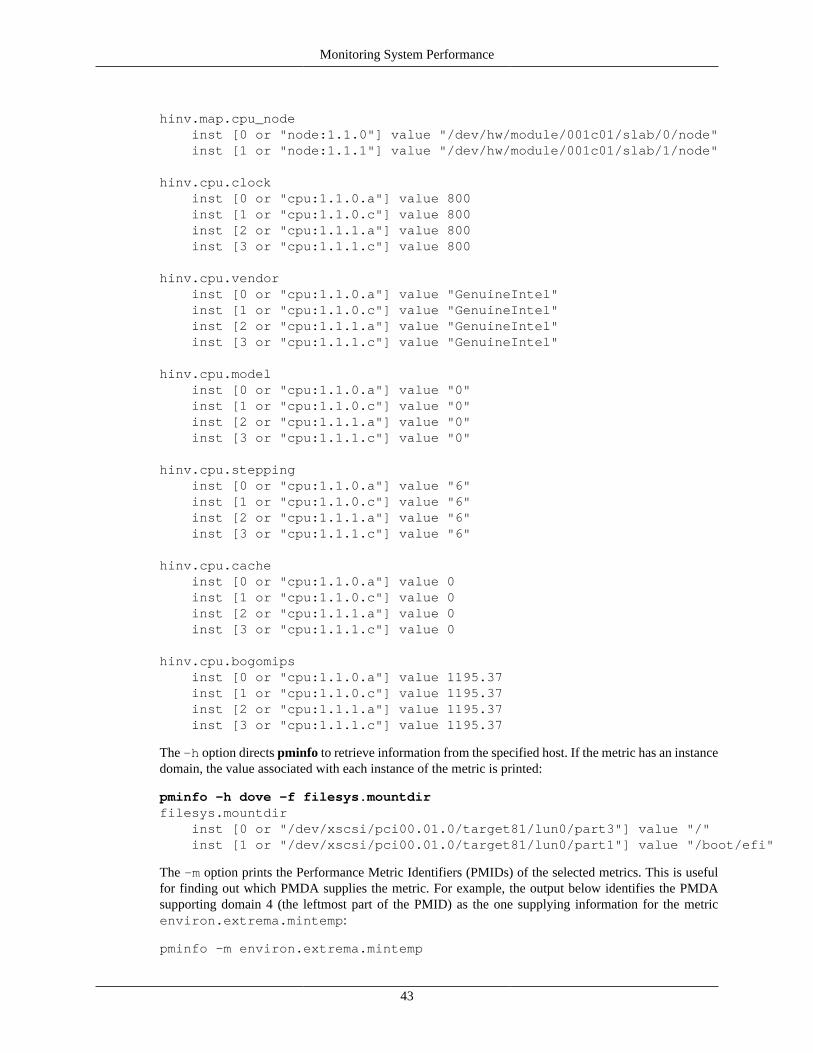
Monitoring System Performance
hinv.map.cpu_node inst [0 or "node:1.1.0"] value "/dev/hw/module/001c01/slab/0/node" inst [1 or "node:1.1.1"] value "/dev/hw/module/001c01/slab/1/node"
hinv.cpu.clock inst [0 or "cpu:1.1.0.a"] value 800 inst [1 or "cpu:1.1.0.c"] value 800 inst [2 or "cpu:1.1.1.a"] value 800 inst [3 or "cpu:1.1.1.c"] value 800
hinv.cpu.vendor inst [0 or "cpu:1.1.0.a"] value "GenuineIntel" inst [1 or "cpu:1.1.0.c"] value "GenuineIntel" inst [2 or "cpu:1.1.1.a"] value "GenuineIntel" inst [3 or "cpu:1.1.1.c"] value "GenuineIntel"
hinv.cpu.model inst [0 or "cpu:1.1.0.a"] value "0" inst [1 or "cpu:1.1.0.c"] value "0" inst [2 or "cpu:1.1.1.a"] value "0" inst [3 or "cpu:1.1.1.c"] value "0"
hinv.cpu.stepping inst [0 or "cpu:1.1.0.a"] value "6" inst [1 or "cpu:1.1.0.c"] value "6" inst [2 or "cpu:1.1.1.a"] value "6" inst [3 or "cpu:1.1.1.c"] value "6"
hinv.cpu.cache inst [0 or "cpu:1.1.0.a"] value 0 inst [1 or "cpu:1.1.0.c"] value 0 inst [2 or "cpu:1.1.1.a"] value 0 inst [3 or "cpu:1.1.1.c"] value 0
hinv.cpu.bogomips inst [0 or "cpu:1.1.0.a"] value 1195.37 inst [1 or "cpu:1.1.0.c"] value 1195.37 inst [2 or "cpu:1.1.1.a"] value 1195.37 inst [3 or "cpu:1.1.1.c"] value 1195.37
The -h option directs pminfo to retrieve information from the specified host. If the metric has an instancedomain, the value associated with each instance of the metric is printed:
pminfo -h dove -f filesys.mountdirfilesys.mountdir inst [0 or "/dev/xscsi/pci00.01.0/target81/lun0/part3"] value "/" inst [1 or "/dev/xscsi/pci00.01.0/target81/lun0/part1"] value "/boot/efi"
The -m option prints the Performance Metric Identifiers (PMIDs) of the selected metrics. This is usefulfor finding out which PMDA supplies the metric. For example, the output below identifies the PMDAsupporting domain 4 (the leftmost part of the PMID) as the one supplying information for the metricenviron.extrema.mintemp:
pminfo -m environ.extrema.mintemp
43

Monitoring System Performance
environ.extrema.mintemp PMID: 4.0.3
The -v option verifies that metric definitions in the PMNS correspond with supported metrics, and checksthat a value is available for the metric. Descriptions and values are fetched, but not printed. Only errorsare reported.
Complete information on the pminfo command is found in the pminfo(1) man page. There are furtherexamples of the use of pminfo in the PCP Tutorials and Case Studies.
The pmstore CommandFrom time to time you may wish to change the value of a particular metric. Some metrics are counters thatmay need to be reset, and some are simply control variables for agents that collect performance metrics.When you need to change the value of a metric for any reason, the command to use is pmstore.
Note
For obvious reasons, the ability to arbitrarily change the value of a performance metric is notsupported. Rather, PCP collectors selectively allow some metrics to be modified in a verycontrolled fashion.
The basic syntax of the command is as follows:
pmstore metricname value
There are also command line flags to further specify the action. For example, the -i option restricts thechange to one or more instances of the performance metric.
The value may be in one of several forms, according to the following rules:
1. If the metric has an integer type, then value should consist of an optional leading hyphen, followedeither by decimal digits or “0x” and some hexadecimal digits; “0X” is also acceptable instead of “0x.”
2. If the metric has a floating point type, then value should be in the form of an integer (described above),a fixed point number, or a number in scientific notation.
3. If the metric has a string type, then value is interpreted as a literal string of ASCII characters.
4. If the metric has an aggregate type, then an attempt is made to interpret value as an integer, a floatingpoint number, or a string. In the first two cases, the minimal word length encoding is used; for example,“123” would be interpreted as a four-byte aggregate, and “0x100000000” would be interpreted as aneight-byte aggregate.
The following example illustrates the use of pmstore to enable performance metrics collection in thetxmon PMDA (see ${PCP_PMDAS_DIR}/txmon for the source code of the txmon PMDA). When themetric txmon.control.level has the value 0, no performance metrics are collected. Values greaterthan 0 enable progressively more verbose instrumentation.
pminfo -f txmon.counttxmon.countNo value(s) available!pmstore txmon.control.level 1txmon.control.level old value=0 new value=1pminfo -f txmon.counttxmon.count
44

Monitoring System Performance
inst [0 or "ord-entry"] value 23 inst [1 or "ord-enq"] value 11 inst [2 or "ord-ship"] value 10 inst [3 or "part-recv"] value 3 inst [4 or "part-enq"] value 2 inst [5 or "part-used"] value 1 inst [6 or "b-o-m"] value 0
For complete information on pmstore usage and syntax, see the pmstore(1) man page.
45

Chapter 5. Performance MetricsInference Engine
Table of ContentsIntroduction to pmie .......................................................................................................... 47Basic pmie Usage ............................................................................................................. 48
pmie use of PCP services ........................................................................................... 49Simple pmie Usage ................................................................................................... 50Complex pmie Examples ........................................................................................... 50
Specification Language for pmie ......................................................................................... 52Basic pmie Syntax .................................................................................................... 52Setting Evaluation Frequency ...................................................................................... 54pmie Metric Expressions ............................................................................................ 54pmie Rate Conversion ............................................................................................... 56pmie Arithmetic Expressions ...................................................................................... 57pmie Logical Expressions ........................................................................................... 57pmie Rule Expressions .............................................................................................. 60pmie Intrinsic Operators ............................................................................................. 62
pmie Examples ................................................................................................................. 63Developing and Debugging pmie Rules ................................................................................ 65Caveats and Notes on pmie ................................................................................................ 65
Performance Metrics Wraparound ................................................................................ 65pmie Sample Intervals ............................................................................................... 65pmie Instance Names ................................................................................................ 65pmie Error Detection ................................................................................................. 66
Creating pmie Rules with pmieconf ..................................................................................... 66Management of pmie Processes ........................................................................................... 68
Add a pmie crontab Entry ......................................................................................... 70Global Files and Directories ........................................................................................ 70pmie Instances and Their Progress ............................................................................... 71
The Performance Metrics Inference Engine (pmie) is a tool that provides automated monitoring of, andreasoning about, system performance within the Performance Co-Pilot (PCP) framework.
The major sections in this chapter are as follows:
• the section called “Introduction to pmie”, provides an introduction to the concepts and design of pmie.
• the section called “Basic pmie Usage”, describes the basic syntax and usage of pmie.
• the section called “Specification Language for pmie”, discusses the complete pmie rule specificationlanguage.
• the section called “pmie Examples”, provides an example, covering several common performancescenarios.
• the section called “Developing and Debugging pmie Rules”, presents some tips and techniques for pmierule development.
• the section called “Caveats and Notes on pmie”, presents some important information on using pmie.
46
Performance Metrics Inference Engine
• the section called “Creating pmie Rules with pmieconf”, describes how to use the pmieconf commandto generate pmie rules.
• the section called “Management of pmie Processes”, provides support for running pmie as a daemon.
Introduction to pmieAutomated reasoning within Performance Co-Pilot (PCP) is provided by the Performance MetricsInference Engine, (pmie), which is an applied artificial intelligence application.
The pmie tool accepts expressions describing adverse performance scenarios, and periodically evaluatesthese against streams of performance metric values from one or more sources. When an expression isfound to be true, pmie is able to execute arbitrary actions to alert or notify the system administrator ofthe occurrence of an adverse performance scenario. These facilities are very general, and are designed toaccommodate the automated execution of a mixture of generic and site-specific performance monitoringand control functions.
The stream of performance metrics to be evaluated may be from one or more hosts, or from one or morePCP archive logs. In the latter case, pmie may be used to retrospectively identify adverse performanceconditions.
Using pmie, you can filter, interpret, and reason about the large volume of performance data made availablefrom PCP collector systems or PCP archives.
Typical pmie uses include the following:
• Automated real-time monitoring of a host, a set of hosts, or client-server pairs of hosts to raiseoperational alarms when poor performance is detected in a production environment
• Nightly processing of archive logs to detect and report performance regressions, or quantify quality ofservice for service level agreements or management reports, or produce advance warning of pendingperformance problems
• Strategic performance management, for example, detection of slightly abnormal to chronic systembehavior, trend analysis, and capacity planning
The pmie expressions are described in a language with expressive power and operational flexibility. Itincludes the following operators and functions:
• Generalized predicate-action pairs, where a predicate is a logical expression over the availableperformance metrics, and the action is arbitrary. Predefined actions include the following:
• Launch a visible alarm with pmconfirm; see the pmconfirm(1) man page.
• Post an entry to the system log file; see the syslog(3) man page.
• Post an entry to the PCP noticeboard file ${PCP_LOG_DIR}/NOTICES; see the pmpost(1) manpage.
• Execute a shell command or script, for example, to send e-mail, initiate a pager call, warn the helpdesk, and so on.
• Echo a message on standard output; useful for scripts that generate reports from retrospectiveprocessing of PCP archive logs.
• Arithmetic and logical expressions in a C-like syntax.
47

Performance Metrics Inference Engine
• Expression groups may have an independent evaluation frequency, to support both short-term and long-term monitoring.
• Canonical scale and rate conversion of performance metric values to provide sensible expressionevaluation.
• Aggregation functions of sum, avg, min, and max, that may be applied to collections of performancemetrics values clustered over multiple hosts, or multiple instances, or multiple consecutive samples intime.
• Universal and existential quantification, to handle expressions of the form “for every....” and “at leastone...”.
• Percentile aggregation to handle statistical outliers, such as “for at least 80% of the last 20 samples, ...”.
• Macro processing to expedite repeated use of common subexpressions or specification components.
• Transparent operation against either live-feeds of performance metric values from PMCD on one ormore hosts, or against PCP archive logs of previously accumulated performance metric values.
The power of pmie may be harnessed to automate the most common of the deterministic systemmanagement functions that are responses to changes in system performance. For example, disable a batchstream if the DBMS transaction commit response time at the ninetieth percentile goes over two seconds,or stop accepting uploads and send e-mail to the sysadmin alias if free space in a storage system fallsbelow five percent.
Moreover, the power of pmie can be directed towards the exceptional and sporadic performance problems.For example, if a network packet storm is expected, enable IP header tracing for ten seconds, and sende-mail to advise that data has been collected and is awaiting analysis. Or, if production batch throughputfalls below 50 jobs per minute, activate a pager to the systems administrator on duty.
Obviously, pmie customization is required to produce meaningful filtering and actions in each productionenvironment. The pmieconf tool provides a convenient customization method, allowing the user togenerate parameterized pmie rules for some of the more common performance scenarios.
Basic pmie UsageThis section presents and explains some basic examples of pmie usage. The pmie tool accepts the commonPCP command line arguments, as described in Chapter 3, Common Conventions and Arguments. Inaddition, pmie accepts the following command line arguments:
-d
Enables interactive debug mode.
-v
Verbose mode: expression values are displayed.
-V
Verbose mode: annotated expression values are displayed.
-W
When-verbose mode: when a condition is true, the satisfying expression bindings are displayed.
One of the most basic invocations of this tool is this form:
pmie filename
48
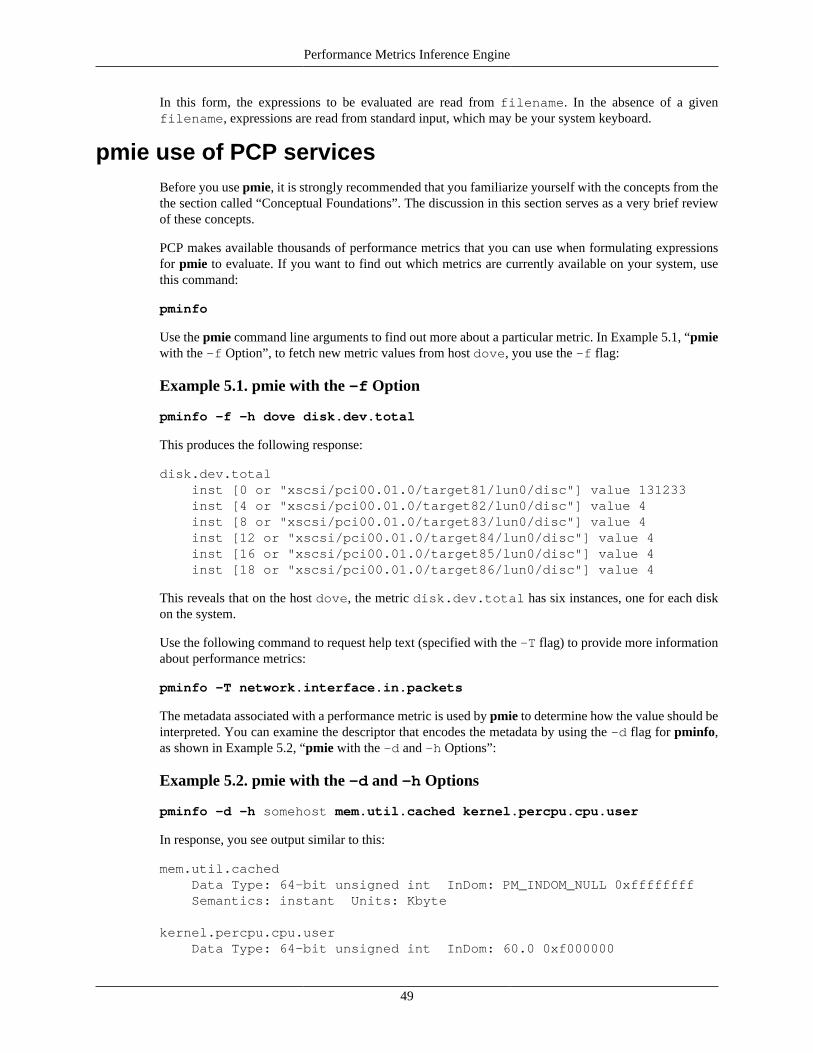
Performance Metrics Inference Engine
In this form, the expressions to be evaluated are read from filename. In the absence of a givenfilename, expressions are read from standard input, which may be your system keyboard.
pmie use of PCP servicesBefore you use pmie, it is strongly recommended that you familiarize yourself with the concepts from thethe section called “Conceptual Foundations”. The discussion in this section serves as a very brief reviewof these concepts.
PCP makes available thousands of performance metrics that you can use when formulating expressionsfor pmie to evaluate. If you want to find out which metrics are currently available on your system, usethis command:
pminfo
Use the pmie command line arguments to find out more about a particular metric. In Example 5.1, “pmiewith the -f Option”, to fetch new metric values from host dove, you use the -f flag:
Example 5.1. pmie with the -f Option
pminfo -f -h dove disk.dev.total
This produces the following response:
disk.dev.total inst [0 or "xscsi/pci00.01.0/target81/lun0/disc"] value 131233 inst [4 or "xscsi/pci00.01.0/target82/lun0/disc"] value 4 inst [8 or "xscsi/pci00.01.0/target83/lun0/disc"] value 4 inst [12 or "xscsi/pci00.01.0/target84/lun0/disc"] value 4 inst [16 or "xscsi/pci00.01.0/target85/lun0/disc"] value 4 inst [18 or "xscsi/pci00.01.0/target86/lun0/disc"] value 4
This reveals that on the host dove, the metric disk.dev.total has six instances, one for each diskon the system.
Use the following command to request help text (specified with the -T flag) to provide more informationabout performance metrics:
pminfo -T network.interface.in.packets
The metadata associated with a performance metric is used by pmie to determine how the value should beinterpreted. You can examine the descriptor that encodes the metadata by using the -d flag for pminfo,as shown in Example 5.2, “pmie with the -d and -h Options”:
Example 5.2. pmie with the -d and -h Options
pminfo -d -h somehost mem.util.cached kernel.percpu.cpu.user
In response, you see output similar to this:
mem.util.cached Data Type: 64-bit unsigned int InDom: PM_INDOM_NULL 0xffffffff Semantics: instant Units: Kbyte
kernel.percpu.cpu.user Data Type: 64-bit unsigned int InDom: 60.0 0xf000000
49

Performance Metrics Inference Engine
Semantics: counter Units: millisec
Note
A cumulative counter such as kernel.percpu.cpu.user is automatically converted bypmie into a rate (measured in events per second, or count/second), while instantaneous valuessuch as mem.util.cached are not subjected to rate conversion. Metrics with an instancedomain (InDom in the pminfo output) of PM_INDOM_NULL are singular and always produceone value per source. However, a metric like kernel.percpu.cpu.user has an instancedomain, and may produce multiple values per source (in this case, it is one value for eachconfigured CPU).
Simple pmie UsageExample 5.3, “pmie with the -v Option” directs the inference engine to evaluate and print values(specified with the -v flag) for a single performance metric (the simplest possible expression), in this casedisk.dev.total, collected from the local PMCD:
Example 5.3. pmie with the -v Option
pmie -viops = disk.dev.total;Ctrl+Diops: ? ?iops: 14.4 0iops: 25.9 0.112iops: 12.2 0iops: 12.3 64.1iops: 8.594 52.17iops: 2.001 71.64
On this system, there are two disk spindles, hence two values of the expression iops per sample. Noticethat the values for the first sample are unknown (represented by the question marks [?] in the first lineof output), because rates can be computed only when at least two samples are available. The subsequentsamples are produced every ten seconds by default. The second sample reports that during the precedingten seconds there was an average of 14.4 transfers per second on one disk and no transfers on the other disk.
Rates are computed using time stamps delivered by PMCD. Due to unavoidable inaccuracy in the actualsampling time (the sample interval is not exactly 10 seconds), you may see more decimal places in valuesthan you expect. Notice, however, that these errors do not accumulate but cancel each other out oversubsequent samples.
In Example 5.3, “pmie with the -v Option”, the expression to be evaluated was entered using the keyboard,followed by the end-of-file character [Ctrl+D]. Usually, it is more convenient to enter expressions into afile (for example, myrules) and ask pmie to read the file. Use this command syntax:
pmie -v myrules
Please refer to the pmie(1) man page for a complete description of pmie command line options.
Complex pmie ExamplesThis section illustrates more complex pmie expressions of the specification language. the section called“Specification Language for pmie”, provides a complete description of the pmie specification language.
50

Performance Metrics Inference Engine
The following arithmetic expression computes the percentage of write operations over the total numberof disk transfers.
(disk.all.write / disk.all.total) * 100;
The disk.all metrics are singular, so this expression produces exactly one value per sample,independent of the number of disk devices.
Note
If there is no disk activity, disk.all.total will be zero and pmie evaluates this expressionto be not a number. When -v is used, any such values are displayed as question marks.
The following logical expression has the value true or false for each disk:
disk.dev.total > 10 && disk.dev.write > disk.dev.read;
The value is true if the number of writes exceeds the number of reads, and if there is significant disk activity(more than 10 transfers per second). Example 5.4, “Printed pmie Output” demonstrates a simple action:
Example 5.4. Printed pmie Output
some_inst disk.dev.total > 60 -> print "[%i] high disk i/o";
This prints a message to the standard output whenever the total number of transfers for some disk(some_inst) exceeds 60 transfers per second. The %i (instance) in the message is replaced with thename(s) of the disk(s) that caused the logical expression to be true.
Using pmie to evaluate the above expressions every 3 seconds, you see output similar to Example 5.5,“Labelled pmie Output”. Notice the introduction of labels for each pmie expression.
Example 5.5. Labelled pmie Output
pmie -v -t 3secpct_wrt = (disk.all.write / disk.all.total) * 100;busy_wrt = disk.dev.total > 10 && disk.dev.write > disk.dev.read;busy = some_inst disk.dev.total > 60 -> print "[%i] high disk i/o ";Ctrl+Dpct_wrt: ? busy_wrt: ? ?busy: ?
pct_wrt: 18.43busy_wrt: false falsebusy: false
Mon Aug 5 14:56:08 2012: [disk2] high disk i/opct_wrt: 10.83busy_wrt: false falsebusy: true
51

Performance Metrics Inference Engine
pct_wrt: 19.85busy_wrt: true falsebusy: false
pct_wrt: ?busy_wrt: false falsebusy: false
Mon Aug 5 14:56:17 2012: [disk1] high disk i/o [disk2] high disk i/opct_wrt: 14.8busy_wrt: false falsebusy: true
The first sample contains unknowns, since all expressions depend on computing rates. Also notice that theexpression pct_wrt may have an undefined value whenever all disks are idle, as the denominator of theexpression is zero. If one or more disks is busy, the expression busy is true, and the message from theprint in the action part of the rule appears (before the -v values).
Specification Language for pmieThis section describes the complete syntax of the pmie specification language, as well as macro facilitiesand the issue of sampling and evaluation frequency. The reader with a preference for learning by examplemay choose to skip this section and go straight to the examples in the section called “pmie Examples”.
Complex expressions are built up recursively from simple elements:
1. Performance metric values are obtained from PMCD for real-time sources, otherwise from PCP archivelogs.
2. Metrics values may be combined using arithmetic operators to produce arithmetic expressions.
3. Arithmetic expressions may be compared using relational operators to produce logical expressions.
4. Logical expressions may be combined using Boolean operators, including powerful quantifiers.
5. Aggregation operators may be used to compute summary expressions, for either arithmetic or logicaloperands.
6. The final logical expression may be used to initiate a sequence of actions.
Basic pmie SyntaxThe pmie rule specification language supports a number of basic syntactic elements.
Lexical Elements
All pmie expressions are composed of the following lexical elements:
Identifier Begins with an alphabetic character (either upper or lowercase),followed by zero or more letters, the numeric digits, and thespecial characters period (.) and underscore (_), as shown in thefollowing example:
x, disk.dev.total and my_stuff
52

Performance Metrics Inference Engine
As a special case, an arbitrary sequence of letters enclosed byapostrophes (') is also interpreted as an identifier; forexample:
'vms$slow_response'
Keyword The aggregate operators, units, and predefined actions arerepresented by keywords; for example, some_inst, print,and hour.
Numeric constant Any likely representation of a decimal integer or floating pointnumber; for example, 124, 0.05, and -45.67
String constant An arbitrary sequence of characters, enclosed by double quotationmarks ("x").
Within quotes of any sort, the backslash (\) may be used as an escape character as shown in the followingexample:
"A \"gentle\" reminder"
Comments
Comments may be embedded anywhere in the source, in either of these forms:
/* text */ Comment, optionally spanning multiple lines, with no nesting of comments.
// text Comment from here to the end of the line.
Macros
When they are fully specified, expressions in pmie tend to be verbose and repetitive. The use of macros canreduce repetition and improve readability and modularity. Any statement of the following form associatesthe macro name identifier with the given string constant.
identifier = "string";
Any subsequent occurrence of the macro name identifier is replaced by the string most recentlyassociated with a macro definition for identifier.
$identifier
For example, start with the following macro definition:
disk = "disk.all";
You can then use the following syntax:
pct_wrt = ($disk.write / $disk.total) * 100;
Note
Macro expansion is performed before syntactic parsing; so macros may only be assigned constantstring values.
53

Performance Metrics Inference Engine
Units
The inference engine converts all numeric values to canonical units (seconds for time, bytes for space, andevents for count). To avoid surprises, you are encouraged to specify the units for numeric constants. Ifunits are specified, they are checked for dimension compatibility against the metadata for the associatedperformance metrics.
The syntax for a units specification is a sequence of one or more of the following keywords separatedby either a space or a slash (/), to denote per: byte, KByte, MByte, GByte, TByte, nsec,nanosecond, usec, microsecond, msec, millisecond, sec, second, min, minute, hour,count, Kcount, Mcount, Gcount, or Tcount. Plural forms are also accepted.
The following are examples of units usage:
disk.dev.blktotal > 1 Mbyte / second; mem.util.cached < 500 Kbyte;
Note
If you do not specify the units for numeric constants, it is assumed that the constant is in thecanonical units of seconds for time, bytes for space, and events for count, and the dimensionalityof the constant is assumed to be correct. Thus, in the following expression, the 500 is interpretedas 500 bytes.
mem.util.cached < 500
Setting Evaluation FrequencyThe identifier name delta is reserved to denote the interval of time between consecutive evaluations ofone or more expressions. Set delta as follows:
delta = number [units];
If present, units must be one of the time units described in the preceding section. If absent, unitsare assumed to be seconds. For example, the following expression has the effect that any subsequentexpressions (up to the next expression that assigns a value to delta) are scheduled for evaluation at afixed frequency, once every five minutes.
delta = 5 min;
The default value for delta may be specified using the -t command line option; otherwise delta isinitially set to be 10 seconds.
pmie Metric ExpressionsThe performance metrics namespace (PMNS) provides a means of naming performance metrics, forexample, disk.dev.read. PCP allows an application to retrieve one or more values for a performancemetric from a designated source (a collector host running PMCD, or a set of PCP archive logs). To specifya single value for some performance metric requires the metric name to be associated with all three ofthe following:
• A particular host (or source of metrics values)
• A particular instance (for metrics with multiple values)
54

Performance Metrics Inference Engine
• A sample time
The permissible values for hosts are the range of valid hostnames as provided by Internet namingconventions.
The names for instances are provided by the Performance Metrics Domain Agents (PMDA) for the instancedomain associated with the chosen performance metric.
The sample time specification is defined as the set of natural numbers 0, 1, 2, and so on. A number refersto one of a sequence of sampling events, from the current sample 0 to its predecessor 1, whose predecessorwas 2, and so on. This scheme is illustrated by the time line shown in Figure 5.1, “Sampling Time Line”.
Figure 5.1. Sampling Time Line
past futurenow
4 3 2 1 0
Each sample point is assumed to be separated from its predecessor by a constant amount of real time, thedelta. The most recent sample point is always zero. The value of delta may vary from one expressionto the next, but is fixed for each expression; for more information on the sampling interval, see the sectioncalled “Setting Evaluation Frequency”.
For pmie, a metrics expression is the name of a metric, optionally qualified by a host, instance and sampletime specification. Special characters introduce the qualifiers: colon (:) for hosts, hash or pound sign (#)for instances, and at (@) for sample times. The following expression refers to the previous value (@1) ofthe counter for the disk read operations associated with the disk instance #disk1 on the host moomba.
disk.dev.read :moomba #disk1 @1
In fact, this expression defines a point in the three-dimensional (3D) parameter space of {host} x{instance} x {sample time} as shown in Figure 5.2, “Three-Dimensional Parameter Space”.
Figure 5.2. Three-Dimensional Parameter Space
host
instance
sampletime
A metric expression may also identify sets of values corresponding to one-, two-, or three-dimensionalslices of this space, according to the following rules:
55
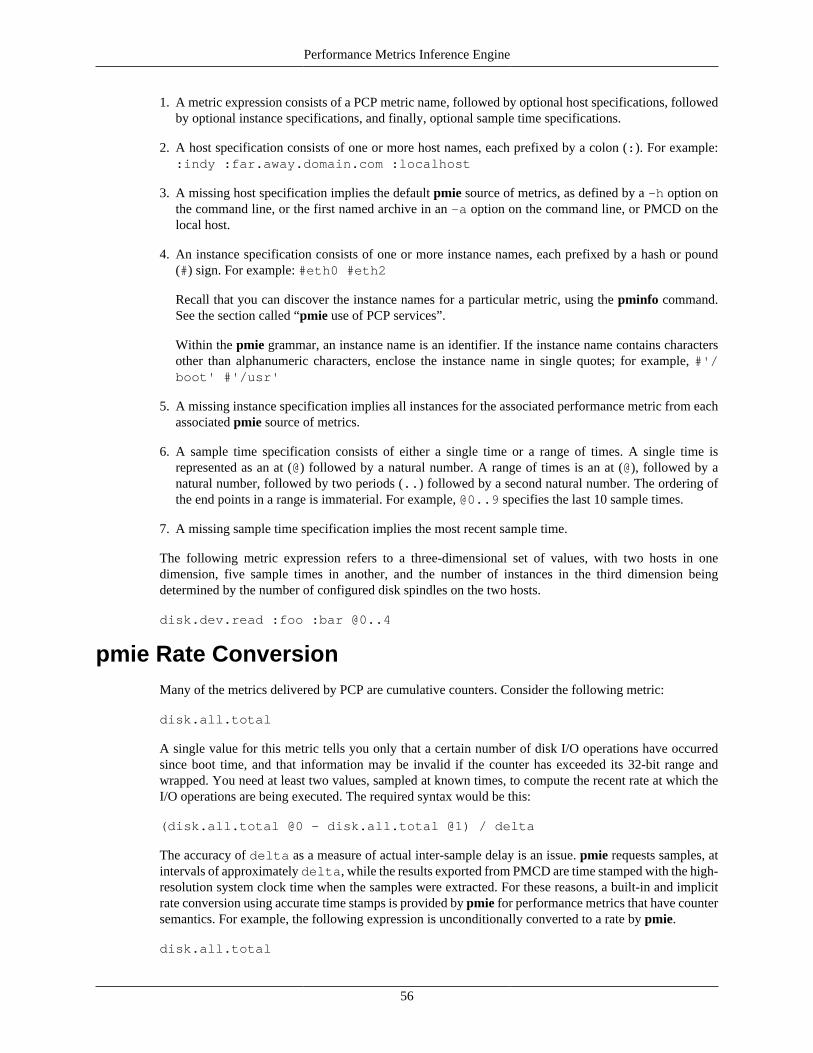
Performance Metrics Inference Engine
1. A metric expression consists of a PCP metric name, followed by optional host specifications, followedby optional instance specifications, and finally, optional sample time specifications.
2. A host specification consists of one or more host names, each prefixed by a colon (:). For example::indy :far.away.domain.com :localhost
3. A missing host specification implies the default pmie source of metrics, as defined by a -h option onthe command line, or the first named archive in an -a option on the command line, or PMCD on thelocal host.
4. An instance specification consists of one or more instance names, each prefixed by a hash or pound(#) sign. For example: #eth0 #eth2
Recall that you can discover the instance names for a particular metric, using the pminfo command.See the section called “pmie use of PCP services”.
Within the pmie grammar, an instance name is an identifier. If the instance name contains charactersother than alphanumeric characters, enclose the instance name in single quotes; for example, #'/boot' #'/usr'
5. A missing instance specification implies all instances for the associated performance metric from eachassociated pmie source of metrics.
6. A sample time specification consists of either a single time or a range of times. A single time isrepresented as an at (@) followed by a natural number. A range of times is an at (@), followed by anatural number, followed by two periods (..) followed by a second natural number. The ordering ofthe end points in a range is immaterial. For example, @0..9 specifies the last 10 sample times.
7. A missing sample time specification implies the most recent sample time.
The following metric expression refers to a three-dimensional set of values, with two hosts in onedimension, five sample times in another, and the number of instances in the third dimension beingdetermined by the number of configured disk spindles on the two hosts.
disk.dev.read :foo :bar @0..4
pmie Rate ConversionMany of the metrics delivered by PCP are cumulative counters. Consider the following metric:
disk.all.total
A single value for this metric tells you only that a certain number of disk I/O operations have occurredsince boot time, and that information may be invalid if the counter has exceeded its 32-bit range andwrapped. You need at least two values, sampled at known times, to compute the recent rate at which theI/O operations are being executed. The required syntax would be this:
(disk.all.total @0 - disk.all.total @1) / delta
The accuracy of delta as a measure of actual inter-sample delay is an issue. pmie requests samples, atintervals of approximately delta, while the results exported from PMCD are time stamped with the high-resolution system clock time when the samples were extracted. For these reasons, a built-in and implicitrate conversion using accurate time stamps is provided by pmie for performance metrics that have countersemantics. For example, the following expression is unconditionally converted to a rate by pmie.
disk.all.total
56
Performance Metrics Inference Engine
pmie Arithmetic ExpressionsWithin pmie, simple arithmetic expressions are constructed from metrics expressions (see the sectioncalled “pmie Metric Expressions”) and numeric constants, using all of the arithmetic operators andprecedence rules of the C programming language.
All pmie arithmetic is performed in double precision.
the section called “pmie Intrinsic Operators”, describes additional operators that may be used for aggregateoperations to reduce the dimensionality of an arithmetic expression.
pmie Logical ExpressionsA number of logical expression types are supported:
• Logical constants
• Relational expressions
• Boolean expressions
• Quantification operators
Logical Constants
Like in the C programming language, pmie interprets an arithmetic value of zero to be false, and all otherarithmetic values are considered true.
Relational Expressions
Relational expressions are the simplest form of logical expression, in which values may be derivedfrom arithmetic expressions using pmie relational operators. For example, the following is a relationalexpression that is true or false, depending on the aggregate total of disk read operations per second beinggreater than 50.
disk.all.read > 50 count/sec
All of the relational logical operators and precedence rules of the C programming language are supportedin pmie.
As described in the section called “pmie Metric Expressions”, arithmetic expressions in pmie may assumeset values. The relational operators are also required to take constant, singleton, and set-valued expressionsas arguments. The result has the same dimensionality as the operands. Suppose the rule in Example 5.6,“Relational Expressions ” is given:
Example 5.6. Relational Expressions
hosts = ":gonzo";intfs = "#eth0 #eth2";all_intf = network.interface.in.packets $hosts $intfs @0..2 > 300 count/sec;
Then the execution of pmie may proceed as follows:
pmie -V uag.11
57

Performance Metrics Inference Engine
all_intf: gonzo: [eth0] ? ? ? gonzo: [eth2] ? ? ?all_intf: gonzo: [eth0] false ? ? gonzo: [eth2] false ? ?all_intf: gonzo: [eth0] true false ? gonzo: [eth2] false false ?all_intf: gonzo: [eth0] true true false gonzo: [eth2] false false false
At each sample, the relational operator greater than (>) produces six truth values for the cross-product ofthe instance and sample time dimensions.
the section called “Quantification Operators”, describes additional logical operators that may be used toreduce the dimensionality of a relational expression.
Boolean Expressions
The regular Boolean operators from the C programming language are supported: conjunction (&&),disjunction (||) and negation (!).
As with the relational operators, the Boolean operators accommodate set-valued operands, and set-valuedresults.
Quantification Operators
Boolean and relational operators may accept set-valued operands and produce set-valued results. In manycases, rules that are appropriate for performance management require a set of truth values to be reducedalong one or more of the dimensions of hosts, instances, and sample times described in the section called“pmie Metric Expressions”. The pmie quantification operators perform this function.
Each quantification operator takes a one-, two-, or three-dimension set of truth values as an operand, andreduces it to a set of smaller dimension, by quantification along a single dimension. For example, supposethe expression in the previous example is simplified and prefixed by some_sample, to produce thefollowing expression:
intfs = "#eth0 #eth2"; all_intf = some_sample network.interface.in.packets $intfs @0..2 > 300 count/sec;
Then the expression result is reduced from six values to two (one per interface instance), such that theresult for a particular instance will be false unless the relational expression for the same interface instanceis true for at least one of the preceding three sample times.
There are existential, universal, and percentile quantification operators in each of the host, instance,and sample time dimensions to produce the nine operators as follows:
some_host True if the expression is true for at least one host for the sameinstance and sample time.
all_host True if the expression is true for every host for the sameinstance and sample time.
58

Performance Metrics Inference Engine
N%_host True if the expression is true for at least N% of the hosts for thesame instance and sample time.
some_inst True if the expression is true for at least one instance for thesame host and sample time.
all_instance True if the expression is true for every instance for the samehost and sample time.
N%_instance True if the expression is true for at least N% of the instancesfor the same host and sample time.
some_sample time True if the expression is true for at least one sample time forthe same host and instance.
all_sample time True if the expression is true for every sample time for thesame host and instance.
N%_sample time True if the expression is true for at least N% of the sampletimes for the same host and instance.
These operators may be nested. For example, the following expression answers the question: “Are all hostsexperiencing at least 20% of their disks busy either reading or writing?”
Servers = ":moomba :babylon";all_host ( 20%_inst disk.dev.read $Servers > 40 || 20%_inst disk.dev.write $Servers > 40);
The following expression uses different syntax to encode the same semantics:
all_host ( 20%_inst ( disk.dev.read $Servers > 40 || disk.dev.write $Servers > 40 ));
Note
To avoid confusion over precedence and scope for the quantification operators, use explicitparentheses.
Two additional quantification operators are available for the instance dimension only, namelymatch_inst and nomatch_inst, that take a regular expression and a boolean expression. The resultis the boolean AND of the expression and the result of matching (or not matching) the associated instancename against the regular expression.
For example, this rule evaluates error rates on various 10BaseT Ethernet network interfaces (such as ecN,ethN, or efN):
some_inst match_inst "^(ec|eth|ef)" network.interface.total.errors > 10 count/sec-> syslog "Ethernet errors:" " %i"
59

Performance Metrics Inference Engine
pmie Rule ExpressionsRule expressions for pmie have the following syntax:
lexpr -> actions ;
The semantics are as follows:
• If the logical expression lexpr evaluates true, then perform the actions that follow. Otherwise,do not perform the actions.
• It is required that lexpr has a singular truth value. Aggregation and quantification operators must havebeen applied to reduce multiple truth values to a single value.
• When executed, an action completes with a success/failure status.
• One or more actions may appear; consecutive actions are separated by operators that control theexecution of subsequent actions, as follows:
action-1 & Always execute subsequent actions (serial execution).
action-1 | If action-1 fails, execute subsequent actions, otherwise skip thesubsequent actions (alternation).
An action is composed of a keyword to identify the action method, an optional time specification,and one or more arguments.
A time specification uses the same syntax as a valid time interval that may be assigned to delta, asdescribed in the section called “Setting Evaluation Frequency”. If the action is executed and the timespecification is present, pmie will suppress any subsequent execution of this action until the wall clocktime has advanced by time.
The arguments are passed directly to the action method.
The following action methods are provided:
shell The single argument is passed to the shell for execution. This action is implementedusing system in the background. The action does not wait for the system call to return,and succeeds unless the fork fails.
alarm A notifier containing a time stamp, a single argument as a message, and a Cancel button isposted on the current display screen (as identified by the DISPLAY environment variable).Each alarm action first checks if its notifier is already active. If there is an identical activenotifier, a duplicate notifier is not posted. The action succeeds unless the fork fails.
syslog A message is written into the system log. If the first word of the first argument is -p, thesecond word is interpreted as the priority (see the syslog(3) man page); the message tag ispcp-pmie. The remaining argument is the message to be written to the system log. Thisaction always succeeds.
print A message containing a time stamp in ctime(3) format and the argument is displayed outto standard output (stdout). This action always succeeds.
Within the argument passed to an action method, the following expansions are supported to allow someof the context from the logical expression on the left to appear to be embedded in the argument:
%h The value of a host that makes the expression true.
60

Performance Metrics Inference Engine
%i The value of an instance that makes the expression true.
%v The value of a performance metric from the logical expression.
Some ambiguity may occur in respect to which host, instance, or performance metric is bound to a %-token. In most cases, the leftmost binding in the top-level subexpression is used. You may need to usepmie in the interactive debugging mode (specify the -d command line option) in conjunction with the -W command line option to discover which subexpressions contributes to the %-token bindings.
Example 5.7, “Rule Expression Options ” illustrates some of the options when constructing ruleexpressions:
Example 5.7. Rule Expression Options
some_inst ( disk.dev.total > 60 ) -> syslog 10 mins "[%i] busy, %v IOPS " & shell 1 hour "echo \ 'Disk %i is REALLY busy. Running at %v I/Os per second' \ | Mail -s 'pmie alarm' sysadm";
In this case, %v and %i are both associated with the instances for the metric disk.dev.total thatmake the expression true. If more than one instance makes the expression true (more than one disk is busy),then the argument is formed by concatenating the result from each %-token binding. The text added to thesystem log file might be as shown in Example 5.8, “System Log Text”:
Example 5.8. System Log Text
Aug 6 08:12:44 5B:gonzo pcp-pmie[3371]: [disk1] busy, 3.7 IOPS [disk2] busy, 0.3 IOPS
Note
When pmie is processing performance metrics from a set of PCP archive logs, the actionswill be processed in the expected manner; however, the action methods are modified to report atextual facsimile of the action on the standard output.
Consider the rule in Example 5.9, “Standard Output”:
Example 5.9. Standard Output
delta = 2 sec; // more often for demonstration purposes percpu = "kernel.percpu"; // Unusual usr-sys split when some CPU is more than 20% in usr mode // and sys mode is at least 1.5 times usr mode // cpu_usr_sys = some_inst ( $percpu.cpu.sys > $percpu.cpu.user * 1.5 && $percpu.cpu.user > 0.2 ) -> alarm "Unusual sys time: " "%i ";
When evaluated against an archive, the following output is generated (the alarm action produces a messageon standard output):
pmafm ${HOME}/f4 pmie cpu.head cpu.00
61

Performance Metrics Inference Engine
alarm Wed Aug 7 14:54:48 2012: Unusual sys time: cpu0 alarm Wed Aug 7 14:54:50 2012: Unusual sys time: cpu0 alarm Wed Aug 7 14:54:52 2012: Unusual sys time: cpu0 alarm Wed Aug 7 14:55:02 2012: Unusual sys time: cpu0 alarm Wed Aug 7 14:55:06 2012: Unusual sys time: cpu0
pmie Intrinsic OperatorsThe following sections describe some other useful intrinsic operators for pmie. These operators are dividedinto three groups:
• Arithmetic aggregation
• The rate operator
• Transitional operators
Arithmetic Aggregation
For set-valued arithmetic expressions, the following operators reduce the dimensionality of the result byarithmetic aggregation along one of the host, instance, or sample time dimensions. For example,to aggregate in the host dimension, the following operators are provided:
avg_host Computes the average value across all instances for the same host andsample time
sum_host Computes the total value across all instances for the same host andsample time
count_host Computes the number of values across all instances for the same host andsample time
min_host Computes the minimum value across all instances for the same host andsample time
max_host Computes the maximum value across all instances for the same host andsample time
Ten additional operators correspond to the forms *_inst and *_sample.
The following example illustrates the use of an aggregate operator in combination with an existentialoperator to answer the question “Does some host currently have two or more busy processors?”
// note '' to escape - in host name poke = ":moomba :'mac-larry' :bitbucket"; some_host ( count_inst ( kernel.percpu.cpu.user $poke + kernel.percpu.cpu.sys $poke > 0.7 ) >= 2 ) -> alarm "2 or more busy CPUs";
The rate Operator
The rate operator computes the rate of change of an arithmetic expression as shown in the followingexample:
62

Performance Metrics Inference Engine
rate mem.util.cached
It returns the rate of change for the mem.util.cached performance metric; that is, the rate at whichpage cache memory is being allocated and released.
The rate intrinsic operator is most useful for metrics with instantaneous value semantics. For metricswith counter semantics, pmie already performs an implicit rate calculation (see the the section called“pmie Rate Conversion”) and the rate operator would produce the second derivative with respect totime, which is less likely to be useful.
Transitional Operators
In some cases, an action needs to be triggered when an expression changes from true to false or vice versa.The following operators take a logical expression as an operand, and return a logical expression:
rising Has the value true when the operand transitions from false to true in consecutivesamples.
falling Has the value false when the operand transitions from true to false in consecutivesamples.
pmie ExamplesThe examples presented in this section are task-oriented and use the full power of the pmie specificationlanguage as described in the section called “Specification Language for pmie”.
Source code for the pmie examples in this chapter, and many more examples, is provided within the PCPTutorials and Case Studies. Example 5.10, “Monitoring CPU Utilization” and Example 5.11, “MonitoringDisk Activity ” illustrate monitoring CPU utilization and disk activity.
Example 5.10. Monitoring CPU Utilization
// Some Common Performance Monitoring Scenarios//// The CPU Group//delta = 2 sec; // more often for demonstration purposes// common prefixes//percpu = "kernel.percpu";all = "kernel.all";// Unusual usr-sys split when some CPU is more than 20% in usr mode// and sys mode is at least 1.5 times usr mode//cpu_usr_sys = some_inst ( $percpu.cpu.sys > $percpu.cpu.user * 1.5 && $percpu.cpu.user > 0.2 ) -> alarm "Unusual sys time: " "%i ";// Over all CPUs, syscall_rate > 1000 * no_of_cpus//cpu_syscall = $all.syscall > 1000 count/sec * hinv.ncpu
63

Performance Metrics Inference Engine
-> print "high aggregate syscalls: %v";// Sustained high syscall rate on a single CPU//delta = 30 sec;percpu_syscall = some_inst ( $percpu.syscall > 2000 count/sec ) -> syslog "Sustained syscalls per second? " "[%i] %v ";// the 1 minute load average exceeds 5 * number of CPUs on any hosthosts = ":gonzo :moomba"; // change as requireddelta = 1 minute; // no need to evaluate more often than thishigh_load = some_host ( $all.load $hosts #'1 minute' > 5 * hinv.ncpu ) -> alarm "High Load Average? " "%h: %v ";
Example 5.11. Monitoring Disk Activity
// Some Common Performance Monitoring Scenarios//// The Disk Group//delta = 15 sec; // often enough for disks?// common prefixes//disk = "disk";// Any disk performing more than 40 I/Os per second, sustained over// at least 30 seconds is probably busy//delta = 30 seconds;disk_busy = some_inst ( $disk.dev.total > 40 count/sec )] -> shell "Mail -s 'Heavy systained disk traffic' sysadm";// Try and catch bursts of activity ... more than 60 I/Os per second// for at least 25% of 8 consecutive 3 second samples//delta = 3 sec;disk_burst = some_inst ( 25%_sample ( $disk.dev.total @0..7 > 60 count/sec ) ) -> alarm "Disk Burst? " "%i ";// any SCSI disk controller performing more than 3 Mbytes per// second is busy// Note: the obscure 512 is to convert blocks/sec to byte/sec,// and pmie handles the rest of the scale conversion//some_inst $disk.ctl.blktotal * 512 > 3 Mbyte/sec
64

Performance Metrics Inference Engine
-> alarm "Busy Disk Controller: " "%i ";
Developing and Debugging pmie RulesGiven the -d command line option, pmie executes in interactive mode, and the user is presented with amenu of options:
pmie debugger commands f [file-name] - load expressions from given file or stdin l [expr-name] - list named expression or all expressions r [interval] - run for given or default interval S time-spec - set start time for run T time-spec - set default interval for run command v [expr-name] - print subexpression for %h, %i and %v bindings h or ? - print this menu of commands q - quitpmie>
If both the -d option and a filename are present, the expressions in the given file are loaded before enteringinteractive mode. Interactive mode is useful for debugging new rules.
Caveats and Notes on pmieThe following sections provide important information for users of pmie.
Performance Metrics WraparoundPerformance metrics that are cumulative counters may occasionally overflow their range and wraparoundto 0. When this happens, an unknown value (printed as ?) is returned as the value of the metric for onesample (recall that the value returned is normally a rate). You can have PCP interpolate a value based onexpected rate of change by setting the PCP_COUNTER_WRAP environment variable.
pmie Sample IntervalsThe sample interval (delta) should always be long enough, particularly in the case of rates, to ensure thata meaningful value is computed. Interval may vary according to the metric and your needs. A reasonableminimum is in the range of ten seconds or several minutes. Although PCP supports sampling rates up tohundreds of times per second, using small sample intervals creates unnecessary load on the monitoredsystem.
pmie Instance NamesWhen you specify a metric instance name (#identifier) in a pmie expression, it is compared againstthe instance name looked up from either a live collector system or an archive as follows:
• If the given instance name and the looked up name are the same, they are considered to match.
• Otherwise, the first two space separated tokens are extracted from the looked up name. If the giveninstance name is the same as either of these tokens, they are considered a match.
For some metrics, notably the per process (proc.xxx.xxx) metrics, the first token in the looked upinstance name is impossible to determine at the time you are writing pmie expressions. The above policycircumvents this problem.
65
Performance Metrics Inference Engine
pmie Error DetectionThe parser used in pmie is not particularly robust in handling syntax errors. It is suggested that you checkany problematic expressions individually in interactive mode:
pmie -v -dpmie> fexpressionCtrl+D
If the expression was parsed, its internal representation is shown:
pmie> l
The expression is evaluated twice and its value printed:
pmie> r 10sec
Then quit:
pmie> q
It is not always possible to detect semantic errors at parse time. This happens when a performance metricdescriptor is not available from the named host at this time. A warning is issued, and the expression is puton a wait list. The wait list is checked periodically (about every five minutes) to see if the metric descriptorhas become available. If an error is detected at this time, a message is printed to the standard error stream(stderr) and the offending expression is set aside.
Creating pmie Rules with pmieconfThe pmieconf tool is a command line utility that is designed to aid the specification of pmie rules fromparameterized versions of the rules. pmieconf is used to display and modify variables or parameterscontrolling the details of the generated pmie rules.
pmieconf reads two different forms of supplied input files and produces a localized pmie configurationfile as its output.
The first input form is a generalized pmie rule file such as those found below ${PCP_VAR_DIR}/config/pmieconf. These files contain the generalized rules which pmieconf is able to manipulate.Each of the rules can be enabled or disabled, or the individual variables associated with each rule can beedited.
The second form is an actual pmie configuration file (that is, a file which can be interpreted by pmie,conforming to the pmie syntax described in the section called “Specification Language for pmie”). Thisfile is both input to and output from pmieconf.
The input version of the file contains any changed variables or rule states from previous invocationsof pmieconf, and the output version contains both the changes in state (for any subsequent pmieconfsessions) and the generated pmie syntax. The pmieconf state is embedded within a pmie comment blockat the head of the output file and is not interpreted by pmie itself.
pmieconf is an integral part of the pmie daemon management process described in the section called“Management of pmie Processes”. Procedure 5.1, “Display pmieconf Rules” and Procedure 5.2, “Modify
66

Performance Metrics Inference Engine
pmieconf Rules and Generate a pmie File” introduce the pmieconf tool through a series of typicaloperations.
Procedure 5.1. Display pmieconf Rules
1. Start pmieconf interactively (as the superuser).
pmieconf -f ${PCP_SYSCONF_DIR}/pmie/config.demoUpdates will be made to ${PCP_SYSCONF_DIR}/pmie/config.demo
pmieconf>
2. List the set of available pmieconf rules by using the rules command.
3. List the set of rule groups using the groups command.
4. List only the enabled rules, using the rules enabled command.
5. List a single rule:
pmieconf> list memory.swap_low rule: memory.swap_low [Low free swap space] help: There is only threshold percent swap space remaining - the system may soon run out of virtual memory. Reduce the number and size of the running programs or add more swap(1) space before itcompletely runs out. predicate = some_host ( ( 100 * ( swap.free $hosts$ / swap.length $hosts$ ) ) < $threshold$ && swap.length $hosts$ > 0 // ensure swap in use ) vars: enabled = no threshold = 10%
pmieconf>
6. List one rule variable:
pmieconf> list memory.swap_low threshold rule: memory.swap_low [Low free swap space] threshold = 10%
pmieconf>
Procedure 5.2. Modify pmieconf Rules and Generate a pmie File
1. Lower the threshold for the memory.swap_low rule, and also change the pmie sample intervalaffecting just this rule. The delta variable is special in that it is not associated with any particularrule; it has been defined as a global pmieconf variable. Global variables can be displayed using thelist global command to pmieconf, and can be modified either globally or local to a specific rule.
pmieconf> modify memory.swap_low threshold 5
pmieconf> modify memory.swap_low delta "1 sec"
67

Performance Metrics Inference Engine
pmieconf>
2. Disable all of the rules except for the memory.swap_low rule so that you can see the effects ofyour change in isolation.
This produces a relatively simple pmie configuration file:
pmieconf> disable all
pmieconf> enable memory.swap_low
pmieconf> status verbose: off enabled rules: 1 of 35 pmie configuration file: ${PCP_SYSCONF_DIR}/pmie/config.demo pmie processes (PIDs) using this file: (none found)
pmieconf> quit
You can also use the status command to verify that only one rule is enabled at the end of this step.
3. Run pmie with the new configuration file. Use a text editor to view the newly generated pmieconfiguration file (${PCP_SYSCONF_DIR}/pmie/config.demo), and then run the command:
pmie -T "1.5 sec" -v -l ${HOME}/demo.log ${PCP_SYSCONF_DIR}/pmie/config.demomemory.swap_low: false
memory.swap_low: false
cat ${HOME}/demo.logLog for pmie on venus started Mon Jun 21 16:26:06 2012
pmie: PID = 21847, default host = venus
[Mon Jun 21 16:26:07] pmie(21847) Info: evaluator exiting
Log finished Mon Jun 21 16:26:07 2012
4. Notice that both of the pmieconf files used in the previous step are simple text files, as described inthe pmieconf(5) man page:
file ${PCP_SYSCONF_DIR}/pmie/config.demo${PCP_SYSCONF_DIR}/pmie/config.demo: PCP pmie config (V.1)file ${PCP_VAR_DIR}/config/pmieconf/memory/swap_low${PCP_VAR_DIR}/config/pmieconf/memory/swap_low: PCP pmieconf rules (V.1)
Management of pmie ProcessesThe pmie process can be run as a daemon as part of the system startup sequence, and can thus be usedto perform automated, live performance monitoring of a running system. To do this, run these commands(as superuser):
chkconfig pmie on
68
Performance Metrics Inference Engine
${PCP_RC_DIR}/pmie start
By default, these enable a single pmie process monitoring the local host, with the default set of pmieconfrules enabled (for more information about pmieconf, see the section called “Creating pmie Rules withpmieconf”). Procedure 5.3, “Add a New pmie Instance to the pmie Daemon Management Framework”illustrates how you can use these commands to start any number of pmie processes to monitor local orremote machines.
Procedure 5.3. Add a New pmie Instance to the pmie Daemon ManagementFramework
1. Use a text editor (as superuser) to edit the pmie${PCP_PMIECONTROL_PATH} and${PCP_PMIECONTROL_PATH}.d control files. Notice the default entry, which looks like this:
#Host P? S? Log File ArgumentsLOCALHOSTNAME y n PCP_LOG_DIR/pmie/LOCALHOSTNAME/pmie.log -c config.default
This entry is used to enable a local pmie process. Add a new entry for a remote host on yourlocal network (for example, venus), by using your pmie configuration file (see the section called“Creating pmie Rules with pmieconf”):
#Host P? S? Log File Argumentsvenus n n PCP_LOG_DIR/pmie/venus/pmie.log -c config.demo
Note
Without an absolute path, the configuration file (-c above) will be resolved using${PCP_SYSCONF_DIR}/pmie - if config.demo was created in Procedure 5.2,“Modify pmieconf Rules and Generate a pmie File” it would be used here for hostvenus, otherwise a new configuration file will be generated using the default rules (at${PCP_SYSCONF_DIR}/pmie/config.demo).
2. Enable pmie daemon management:
chkconfig pmie on
This simple step allows pmie to be started as part of your machine's boot process.
3. Start the two pmie daemons. At the end of this step, you should see two new pmie processesmonitoring the local and remote hosts:
${PCP_RC_DIR}/pmie startPerformance Co-Pilot starting inference engine(s) ...
Wait a few moments while the startup scripts run. The pmie start script uses the pmie_check scriptto do most of its work.
Verify that the pmie processes have started:
pcpPerformance Co-Pilot configuration on pluto:
platform: Linux pluto 3.10.0-0.rc7.64.el7.x86_64 #1 SMP hardware: 8 cpus, 2 disks, 23960MB RAM timezone: EST-10
69
Performance Metrics Inference Engine
pmcd: Version 3.11.3-1, 8 agents pmda: pmcd proc xfs linux mmv infiniband gluster elasticsearch pmie: pluto: ${PCP_LOG_DIR}/pmie/pluto/pmie.log venus: ${PCP_LOG_DIR}/pmie/venus/pmie.log
If a remote host is not up at the time when pmie is started, the pmie process may exit. pmie processesmay also exit if the local machine is starved of memory resources. To counter these adverse cases, it canbe useful to have a crontab entry running. Adding an entry as shown in the section called “Add a pmiecrontab Entry” ensures that if one of the configured pmie processes exits, it is automatically restarted.
Note
Depending on your platform, the crontab entry discussed here may already have been installedfor you, as part of the package installation process. In this case, the file /etc/cron.d/pcp-pmie will exist, and the rest of this section can be skipped.
Add a pmie crontab EntryTo activate the maintenance and housekeeping scripts for a collection of inference engines, execute thefollowing tasks while logged into the local host as the superuser (root):
1. Augment the crontab file for the pcp user. For example:
crontab -l -u pcp > ${HOME}/crontab.txt
2. Edit ${HOME}/crontab.txt, adding lines similar to those from the sample ${PCP_VAR_DIR}/config/pmie/crontab file for pmie_daily and pmie_check; for example:
# daily processing of pmie logs10 0 * * * ${PCP_BINADM_DIR}/pmie_daily# every 30 minutes, check pmie instances are running25,55 * * * * ${PCP_BINADM_DIR}/pmie_check
3. Make these changes permanent with this command:
crontab -u pcp < ${HOME}/crontab.txt
Global Files and DirectoriesThe following global files and directories influence the behavior of pmie and the pmie management scripts:
${PCP_DEMOS_DIR}/pmie/* Contains sample pmie rules that may be usedas a basis for developing local rules.
${PCP_SYSCONF_DIR}/pmie/config.default Is the default pmie configuration file thatis used when the pmie daemon facilityis enabled. Generated by pmieconf if notmanually setup beforehand.
${PCP_VAR_DIR}/config/pmieconf/*/* Contains the pmieconf rule definitions(templates) in its subdirectories.
${PCP_PMIECONTROL_PATH} and${PCP_PMIECONTROL_PATH}.d files
Defines which PCP collector hosts requirea daemon pmie to be launched on the localhost, where the configuration file comes
70

Performance Metrics Inference Engine
from, where the pmie log file should becreated, and pmie startup options.
${PCP_VAR_DIR}/config/pmlogger/crontab Contains default crontab entries that maybe merged with the crontab entries for rootto schedule the periodic execution of thepmie_check script, for verifying that pmieinstances are running. Only for platformswhere a default crontab is not automaticallyinstalled during the initial PCP packageinstallation.
${PCP_LOG_DIR}/pmie/* Contains the pmie log files for the host. Thesefiles are created by the default behavior of the${PCP_RC_DIR}/pmie startup scripts.
pmie Instances and Their ProgressThe PMCD PMDA exports information about executing pmie instances and their progress in terms of ruleevaluations and action execution rates.
pmie_check This command is similar to the pmlogger support script,pmlogger_check.
${PCP_RC_DIR}/pmie This start script supports the starting and stopping ofmultiple pmie instances that are monitoring one or morehosts.
${PCP_TMP_DIR}/pmie The statistics that pmie gathers are maintained in binarydata structure files. These files are located in this directory.
pmcd.pmie metrics If pmie is running on a system with a PCP collectordeployment, the PMCD PMDA exports these metrics viathe pmcd.pmie group of metrics.
71
Chapter 6. Archive Logging
Table of ContentsIntroduction to Archive Logging .......................................................................................... 73
Archive Logs and the PMAPI ..................................................................................... 73Retrospective Analysis Using Archive Logs ................................................................... 73Using Archive Logs for Capacity Planning .................................................................... 74
Using Archive Logs with Performance Tools ......................................................................... 74Coordination between pmlogger and PCP tools .............................................................. 74Administering PCP Archive Logs Using cron Scripts ...................................................... 74Archive Log File Management .................................................................................... 75
Cookbook for Archive Logging ........................................................................................... 78Primary Logger ......................................................................................................... 78Other Logger Configurations ....................................................................................... 79Archive Log Administration ........................................................................................ 81
Other Archive Logging Features and Services ........................................................................ 81PCP Archive Folios ................................................................................................... 81Manipulating Archive Logs with pmlogextract .............................................................. 82Summarizing Archive Logs with pmlogsummary .......................................................... 82Primary Logger ......................................................................................................... 82Using pmlc .............................................................................................................. 83
Archive Logging Troubleshooting ........................................................................................ 84pmlogger Cannot Write Log ....................................................................................... 84Cannot Find Log ....................................................................................................... 84Primary pmlogger Cannot Start ................................................................................... 85Identifying an Active pmlogger Process ....................................................................... 86Illegal Label Record .................................................................................................. 86Empty Archive Log Files or pmlogger Exits Immediately ................................................ 86
Performance monitoring and management in complex systems demands the ability to accurately captureperformance characteristics for subsequent review, analysis, and comparison. Performance Co-Pilot (PCP)provides extensive support for the creation and management of archive logs that capture a user-specifiedprofile of performance information to support retrospective performance analysis.
The following major sections are included in this chapter:
• the section called “Introduction to Archive Logging”, presents the concepts and issues involved withcreating and using archive logs.
• the section called “Using Archive Logs with Performance Tools”, describes the interaction of the PCPtools with archive logs.
• the section called “Cookbook for Archive Logging”, shows some shortcuts for setting up useful PCParchive logs.
• the section called “Other Archive Logging Features and Services”, provides information about otherarchive logging features and sevices.
• the section called “Archive Logging Troubleshooting”, presents helpful directions if your archivelogging implementation is not functioning correctly.
72
Archive Logging
Introduction to Archive LoggingWithin the PCP, the pmlogger utility may be configured to collect archives of performance metrics. Thearchive creation process is simple and very flexible, incorporating the following features:
• Archive log creation at either a PCP collector (typically a server) or a PCP monitor system (typically aworkstation), or at some designated PCP archive logger host.
• Concurrent independent logging, both local and remote. The performance analyst can activate a privatepmlogger instance to collect only the metrics of interest for the problem at hand, independent of otherlogging on the workstation or remote host.
• Independent determination of logging frequency for individual metrics or metric instances. For example,you could log the “5 minute” load average every half hour, the write I/O rate on the DBMS log spindleevery 10 seconds, and aggregate I/O rates on the other disks every minute.
• Dynamic adjustment of what is to be logged, and how frequently, via pmlc. This feature may be used todisable logging or to increase the sample interval during periods of low activity or chronic high activity.A local pmlc may interrogate and control a remote pmlogger, subject to the access control restrictionsimplemented by pmlogger.
• Self-contained logs that include all system configuration and metadata required to interpret the valuesin the log. These logs can be kept for analysis at a much later time, potentially after the hardware orsoftware has been reconfigured and the logs have been stored as discrete, autonomous files for remoteanalysis. The logs are endian-neutral and platform independent - there is no requirement that the monitorhost machine used for analysis be similar to the collector machine in any way, nor do they have to havethe same versions of PCP. PCP archives created over 15 years ago can still be replayed with the currentversions of PCP!
• cron-based scripts to expedite the operational management, for example, log rotation, consolidation,and culling. Another helper tool, pmlogconf can be used to generate suitable logging configurationsfor a variety of situations.
• Archive folios as a convenient aggregation of multiple archive logs. Archive folios may be created withthe mkaf utility and processed with the pmafm tool.
Archive Logs and the PMAPI
Critical to the success of the PCP archive logging scheme is the fact that the library routines providingaccess to real-time feeds of performance metrics also provide access to the archive logs.
Live feeds (or real-time) sources of performance metrics and archives are literally interchangeable, witha single Performance Metrics Application Programming Interface (PMAPI) that preserves the samesemantics for both styles of metric source. In this way, applications and tools developed against the PMAPIcan automatically process either live or historical performance data.
Retrospective Analysis Using Archive Logs
One of the most important applications of archive logging services provided by PCP is in the area ofretrospective analysis. In many cases, understanding today's performance problems can be assisted by side-by-side comparisons with yesterday's performance. With routine creation of performance archive logs,you can concurrently replay pictures of system performance for two or more periods in the past.
73
Archive Logging
Archive logs are also an invaluable source of intelligence when trying to diagnose what went wrong, asin a performance post-mortem. Because the PCP archive logs are entirely self-contained, this analysis canbe performed off-site if necessary.
Each archive log contains metric values from only one host. However, many PCP tools can simultaneouslyvisualize values from multiple archives collected from different hosts.
The archives can be replayed using the inference engine (pmie is an application that uses the PMAPI).This allows you to automate the regular, first-level analysis of system performance.
Such analysis can be performed by constructing suitable expressions to capture the essence of commonresource saturation problems, then periodically creating an archive and playing it against the expressions.For example, you may wish to create a daily performance audit (perhaps run by the cron command) todetect performance regressions.
For more about pmie, see Chapter 5, Performance Metrics Inference Engine.
Using Archive Logs for Capacity PlanningBy collecting performance archives with relatively long sampling periods, or by reducing the daily archivesto produce summary logs, the capacity planner can collect the base data required for forward projections,and can estimate resource demands and explore “what if” scenarios by replaying data using visualizationtools and the inference engine.
Using Archive Logs with Performance ToolsMost PCP tools default to real-time display of current values for performance metrics from PCP collectorhost(s). However, most PCP tools also have the capability to display values for performance metricsretrieved from PCP archive log(s). The following sections describe plans, steps, and general issuesinvolving archive logs and the PCP tools.
Coordination between pmlogger and PCP toolsMost commonly, a PCP tool would be invoked with the -a option to process sets of archive logs sometime after pmlogger had finished creating the archive. However, a tool such as pmchart that uses a TimeControl dialog (see the section called “Time Duration and Control”) stops when the end of a set of archivesis reached, but could resume if more data is written to the PCP archive log.
Note
pmlogger uses buffered I/O to write the archive log so that the end of the archive may be alignedwith an I/O buffer boundary, rather than with a logical archive log record. If such an archive wasread by a PCP tool, it would appear truncated and might confuse the tool. These problems maybe avoided by sending pmlogger a SIGUSR1 signal, or by using the flush command of pmlc toforce pmlogger to flush its output buffers.
Administering PCP Archive Logs Using cron ScriptsMany operating systems support the cron process scheduling system.
PCP supplies shell scripts to use the cron functionality to help manage your archive logs. The followingscripts are supplied:
74
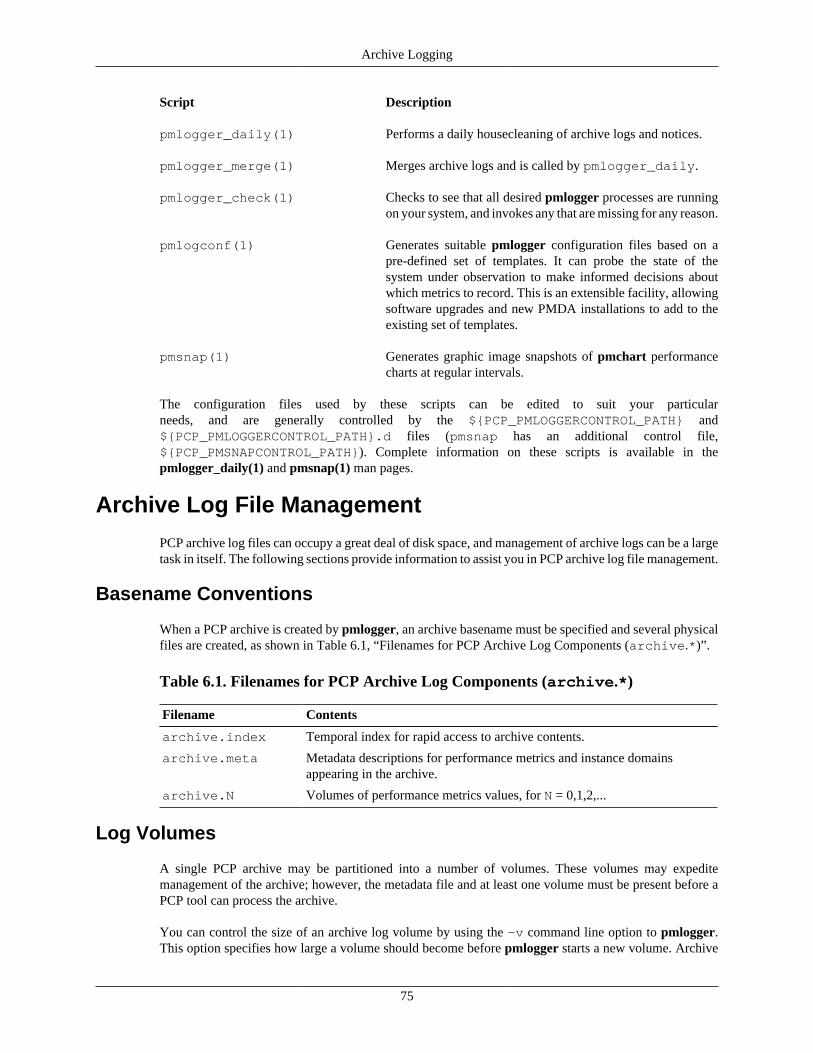
Archive Logging
Script Description
pmlogger_daily(1) Performs a daily housecleaning of archive logs and notices.
pmlogger_merge(1) Merges archive logs and is called by pmlogger_daily.
pmlogger_check(1) Checks to see that all desired pmlogger processes are runningon your system, and invokes any that are missing for any reason.
pmlogconf(1) Generates suitable pmlogger configuration files based on apre-defined set of templates. It can probe the state of thesystem under observation to make informed decisions aboutwhich metrics to record. This is an extensible facility, allowingsoftware upgrades and new PMDA installations to add to theexisting set of templates.
pmsnap(1) Generates graphic image snapshots of pmchart performancecharts at regular intervals.
The configuration files used by these scripts can be edited to suit your particularneeds, and are generally controlled by the ${PCP_PMLOGGERCONTROL_PATH} and${PCP_PMLOGGERCONTROL_PATH}.d files (pmsnap has an additional control file,${PCP_PMSNAPCONTROL_PATH}). Complete information on these scripts is available in thepmlogger_daily(1) and pmsnap(1) man pages.
Archive Log File Management
PCP archive log files can occupy a great deal of disk space, and management of archive logs can be a largetask in itself. The following sections provide information to assist you in PCP archive log file management.
Basename Conventions
When a PCP archive is created by pmlogger, an archive basename must be specified and several physicalfiles are created, as shown in Table 6.1, “Filenames for PCP Archive Log Components (archive.*)”.
Table 6.1. Filenames for PCP Archive Log Components (archive.*)
Filename Contents
archive.index Temporal index for rapid access to archive contents.
archive.meta Metadata descriptions for performance metrics and instance domainsappearing in the archive.
archive.N Volumes of performance metrics values, for N = 0,1,2,...
Log Volumes
A single PCP archive may be partitioned into a number of volumes. These volumes may expeditemanagement of the archive; however, the metadata file and at least one volume must be present before aPCP tool can process the archive.
You can control the size of an archive log volume by using the -v command line option to pmlogger.This option specifies how large a volume should become before pmlogger starts a new volume. Archive
75

Archive Logging
log volumes retain the same base filename as other files in the archive log, and are differentiated by anumeric suffix that is incremented with each volume change. For example, you might have a log volumesequence that looks like this:
netserver-log.0netserver-log.1netserver-log.2
You can also cause an existing log to be closed and a new one to be opened by sending a SIGHUP signalto pmlogger, or by using the pmlc command to change the pmlogger instructions dynamically, withoutinterrupting pmlogger operation. Complete information on log volumes is found in the pmlogger(1) manpage.
Basenames for Managed Archive Log Files
The PCP archive management tools support a consistent scheme for selecting the basenames for the filesin a collection of archives and for mapping these files to a suitable directory hierarchy.
Once configured, the PCP tools that manage archive logs employ a consistent scheme for selectingthe basename for an archive each time pmlogger is launched, namely the current date and time in theformat YYYYMMDD.HH.MM. Typically, at the end of each day, all archives for a particular hoston that day would be merged to produce a single archive with a basename constructed from the date,namely YYYYMMDD. The pmlogger_daily script performs this action and a number of other routinehousekeeping chores.
Directory Organization for Archive Log Files
If you are using a deployment of PCP tools and daemons to collect metrics from a variety of hosts andstoring them all at a central location, you should develop an organized strategy for storing and namingyour log files.
Note
There are many possible configurations of pmlogger, as described in the section called“PCP Archive Logger Deployment”. The directory organization described in this section isrecommended for any system on which pmlogger is configured for permanent execution (asopposed to short-term executions, for example, as launched from pmchart to record someperformance data of current interest).
Typically, the filesystem structure can be used to reflect the number of hosts for which a pmlogger instanceis expected to be running locally, obviating the need for lengthy and cumbersome filenames. It makesconsiderable sense to place all logs for a particular host in a separate directory named after that host.Because each instance of pmlogger can only log metrics fetched from a single host, this also simplifiessome of the archive log management and administration tasks.
For example, consider the filesystem and naming structure shown in Figure 6.1, “Archive Log DirectoryStructure”.
76

Archive Logging
Figure 6.1. Archive Log Directory Structure
Basename:20130803
PCP Archives from host one
${PCP_LOG_DIR}/pmlogger/one
Basename:20130804 Basename:
20130805
Basename:20130804
PCP Archives from host two
${PCP_LOG_DIR}/pmlogger/two
Basename:20130805
Root Directory for PCP Archives
default: ${PCP_LOG_DIR}/pmlogger
The specification of where to place the archive log files for particular pmlogger instances is encoded in the${PCP_PMLOGGERCONTROL_PATH} and ${PCP_PMLOGGERCONTROL_PATH}.d configurationfiles, and these files should be customized on each host running an instance of pmlogger.
If many archives are being created, and the associated PCP collector systems form peer classes based uponservice type (Web servers, DBMS servers, NFS servers, and so on), then it may be appropriate to introduceanother layer into the directory structure, or use symbolic links to group together hosts providing similarservice types.
Configuration of pmlogger
The configuration files used by pmlogger describe which metrics are to be logged. Groups of metrics maybe logged at different intervals to other groups of metrics. Two states, mandatory and advisory, also applyto each group of metrics, defining whether metrics definitely should be logged or not logged, or whethera later advisory definition may change that state.
The mandatory state takes precedence if it is on or off, causing any subsequent request for a change inadvisory state to have no effect. If the mandatory state is maybe, then the advisory state determines iflogging is enabled or not.
The mandatory states are on, off, and maybe. The advisory states, which only affect metrics that aremandatory maybe, are on and off. Therefore, a metric that is mandatory maybe in one definition andadvisory on in another definition would be logged at the advisory interval. Metrics that are not specifiedin the pmlogger configuration file are mandatory maybe and advisory off by default and are not logged.
A complete description of the pmlogger configuration format can be found on the pmlogger(1) man page.
PCP Archive Contents
Once a PCP archive log has been created, the pmdumplog utility may be used to display variousinformation about the contents of the archive. For example, start with the following command:
77

Archive Logging
pmdumplog -l ${PCP_LOG_DIR}/pmlogger/www.sgi.com/19960731
It might produce the following output:
Log Label (Log Format Version 1)Performance metrics from host www.sgi.com commencing Wed Jul 31 00:16:34.941 1996 ending Thu Aug 1 00:18:01.468 1996
The simplest way to discover what performance metrics are contained within a set of archives is to usepminfo as shown in Example 6.1, “Using pminfo to Obtain Archive Information”:
Example 6.1. Using pminfo to Obtain Archive Information
pminfo -a ${PCP_LOG_DIR}/pmlogger/www.sgi.com/19960731 network.mbufnetwork.mbuf.alloc network.mbuf.typeallocnetwork.mbuf.clustallocnetwork.mbuf.clustfreenetwork.mbuf.failednetwork.mbuf.waitednetwork.mbuf.drained
Cookbook for Archive LoggingThe following sections present a checklist of tasks that may be performed to enable PCP archive loggingwith minimal effort. For a complete explanation, refer to the other sections in this chapter and the manpages for pmlogger and related tools.
Primary LoggerAssume you wish to activate primary archive logging on the PCP collector host pluto. Execute thefollowing while logged into pluto as the superuser (root).
1. Start pmcd and pmlogger:
chkconfig pmcd onchkconfig pmlogger on${PCP_RC_DIR}/pmcd startStarting pmcd ...${PCP_RC_DIR}/pmlogger startStarting pmlogger ...
2. Verify that the primary pmlogger instance is running:
pcpPerformance Co-Pilot configuration on pluto:
platform: Linux pluto 3.10.0-0.rc7.64.el7.x86_64 #1 SMP hardware: 8 cpus, 2 disks, 23960MB RAM timezone: EST-10 pmcd: Version 4.0.0-1, 8 agents pmda: pmcd proc xfs linux mmv infiniband gluster elasticsearch
78

Archive Logging
pmlogger: primary logger: pluto/20170815.10.00 pmie: pluto: ${PCP_LOG_DIR}/pmie/pluto/pmie.log venus: ${PCP_LOG_DIR}/pmie/venus/pmie.log
3. Verify that the archive files are being created in the expected place:
ls ${PCP_LOG_DIR}/pmlogger/pluto20170815.10.00.020170815.10.00.index20170815.10.00.metaLatestpmlogger.log
4. Verify that no errors are being logged, and the rate of expected growth of the archives:
cat ${PCP_LOG_DIR}/pmlogger/pluto/pmlogger.logLog for pmlogger on pluto started Thu Aug 15 10:00:11 2017
Config parsedStarting primary logger for host "pluto"Archive basename: 20170815.00.10
Group [26 metrics] { hinv.map.lvname ... hinv.ncpu} logged once: 1912 bytes
Group [11 metrics] { kernel.all.cpu.user ... kernel.all.load} logged every 60 sec: 372 bytes or 0.51 Mbytes/day
...
Other Logger ConfigurationsAssume you wish to create archive logs on the local host for performance metrics collected from the remotehost venus. Execute all of the following tasks while logged into the local host as the superuser (root).
Procedure 6.1. Creating Archive Logs
1. Create a suitable pmlogger configuration file. There are several options:
• Run the pmlogconf(1) utility to generate a configuration file, and (optionally) interactivelycustomize it further to suit local needs.
${PCP_BINADM_DIR}/pmlogconf ${PCP_SYSCONF_DIR}/pmlogger/config.venusCreating config file "${PCP_SYSCONF_DIR}/pmlogger/config.venus" using default settings
${PCP_BINADM_DIR}/pmlogconf ${PCP_SYSCONF_DIR}/pmlogger/config.venus
Group: utilization per CPU
79

Archive Logging
Log this group? [n] yLogging interval? [default]
Group: utilization (usr, sys, idle, ...) over all CPUsLog this group? [y] yLogging interval? [default]
Group: per spindle disk activityLog this group? [n] y
...
• Do nothing - a default configuration will be created in the following step, using pmlogconf(1)probing and automatic file generation based on the metrics available at the remote host. The${PCP_RC_DIR}/pmlogger start script handles this.
• Manually - create a configuration file with a text editor, or arrange to have one put inplace by configuration management tools like Puppet [https://puppetlabs.com/] or Chef [http://www.opscode.com/chef/].
2. Edit ${PCP_PMLOGGERCONTROL_PATH}, or one of the${PCP_PMLOGGERCONTROL_PATH}.d files. Using the line for remote as a template, add thefollowing line:
venus n n PCP_LOG_DIR/pmlogger/venus -r -T24h10m -c config.venus
3. Start pmlogger:
${PCP_BINADM_DIR}/pmlogger_checkRestarting pmlogger for host "venus" ..... done
4. Verify that the pmlogger instance is running:
pcpPerformance Co-Pilot configuration on pluto:
platform: Linux pluto 3.10.0-0.rc7.64.el7.x86_64 #1 SMP hardware: 8 cpus, 2 disks, 23960MB RAM timezone: EST-10 pmcd: Version 3.8.3-1, 8 agents pmda: pmcd proc linux xfs mmv infiniband gluster elasticsearch pmlogger: primary logger: pluto/20170815.10.00 venus.redhat.com: venus/20170815.11.15pmlcpmlc> show loggersThe following pmloggers are running on pluto: primary (19144) 5141pmlc> connect 5141pmlc> statuspmlogger [5141] on host pluto is logging metrics from host venuslog started Thu Aug 15 11:15:39 2017 (times in local time)last log entry Thu Aug 15 11:47:39 2017current time Thu Aug 15 11:48:13 2017log volume 0log size 146160
80

Archive Logging
To create archive logs on the local host for performance metrics collected from multiple remote hosts,repeat the steps in Procedure 6.1, “Creating Archive Logs” for each remote host (each with a newcontrol file entry).
Archive Log AdministrationAssume the local host has been set up to create archive logs of performance metrics collected from one ormore hosts (which may be either the local host or a remote host).
Note
Depending on your platform, the crontab entry discussed here may already have been installedfor you, as part of the package installation process. In this case, the file /etc/cron.d/pcp-pmlogger will exist, and the rest of this section can be skipped.
To activate the maintenance and housekeeping scripts for a collection of archive logs, execute the followingtasks while logged into the local host as the superuser (root):
1. Augment the crontab file for the pcp user. For example:
crontab -l -u pcp > ${HOME}/crontab.txt
2. Edit ${HOME}/crontab.txt, adding lines similar to those from the sample ${PCP_VAR_DIR}/config/pmlogger/crontab file for pmlogger_daily and pmlogger_check; forexample:
# daily processing of archive logs10 0 * * * ${PCP_BINADM_DIR}/pmlogger_daily# every 30 minutes, check pmlogger instances are running25,55 * * * * ${PCP_BINADM_DIR}/pmlogger_check
3. Make these changes permanent with this command:
crontab -u pcp < ${HOME}/crontab.txt
Other Archive Logging Features and ServicesOther archive logging features and services include PCP archive folios, manipulating archive logs, primarylogger, and using pmlc.
PCP Archive FoliosA collection of one or more sets of PCP archive logs may be combined with a control file to produce aPCP archive folio. Archive folios are created using either mkaf or the interactive record mode servicesof various PCP monitor tools (e.g. pmchart and pmrep).
The automated archive log management services also create an archive folio named Latest foreach managed pmlogger instance, to provide a symbolic name to the most recent archive log. Withreference to Figure 6.1, “Archive Log Directory Structure”, this would mean the creation of thefolios ${PCP_LOG_DIR}/pmlogger/one/Latest and ${PCP_LOG_DIR}/pmlogger/two/Latest.
The pmafm utility is completely described in the pmafm(1) man page, and provides the interactivecommands (single commands may also be executed from the command line) for the following services:
81

Archive Logging
• Checking the integrity of the archives in the folio.
• Displaying information about the component archives.
• Executing PCP tools with their source of performance metrics assigned concurrently to all of thecomponent archives (where the tool supports this), or serially executing the PCP tool once percomponent archive.
• If the folio was created by a single PCP monitoring tool, replaying all of the archives in the folio withthat monitoring tool.
• Restricting the processing to particular archives, or the archives associated with particular hosts.
Manipulating Archive Logs with pmlogextract The pmlogextract tool takes a number of PCP archive logs from a single host and performs thefollowing tasks:
• Merges the archives into a single log, while maintaining the correct time stamps for all values.
• Extracts all metric values within a temporal window that could encompass several archive logs.
• Extracts only a configurable subset of metrics from the archive logs.
See the pmlogextract(1) man page for full information on this command.
Summarizing Archive Logs with pmlogsummary The pmlogsummary tool provides statistical summaries of archives, or specific metrics within archives,or specific time windows of interest in a set of archives. These summaries include various averages,minima, maxima, sample counts, histogram bins, and so on.
As an example, for Linux host pluto, report on its use of anonymous huge pages - average use, maximum,time at which maximum occured, total number of samples in the set of archives, and the units used for thevalues - as shown in Example 6.2, “Using pmlogsummary to Summarize Archive Information”:
Example 6.2. Using pmlogsummary to Summarize Archive Information
pmlogsummary -MIly ${PCP_LOG_DIR}/pmlogger/pluto/20170815 mem.util.anonhugepagesPerformance metrics from host pluto commencing Thu Aug 15 00:10:12.318 2017 ending Fri Aug 16 00:10:12.299 2017
mem.util.anonhugepages 7987742.326 8116224.000 15:02:12.300 1437 Kbyte
pminfo -t mem.util.anonhugepagesmem.util.anonhugepages [amount of memory in anonymous huge pages]
See the pmlogsummary(1) man page for detailed information about this commands many options.
Primary LoggerOn each system for which PMCD is active (each PCP collector system), there is an option to have adistinguished instance of the archive logger pmlogger (the “primary” logger) launched each time PMCDis started. This may be used to ensure the creation of minimalist archive logs required for ongoing system
82

Archive Logging
management and capacity planning in the event of failure of a system where a remote pmlogger may berunning, or because the preferred archive logger deployment is to activate pmlogger on each PCP collectorsystem.
Run the following command as superuser on each PCP collector system where you want to activate theprimary pmlogger:
chkconfig pmlogger on
The primary logger launches the next time the ${PCP_RC_DIR}/pmlogger start script runs. If you wishthis to happen immediately, follow up with this command:
${PCP_BINADM_DIR}/pmlogger_check -V
When it is started in this fashion, the ${PCP_PMLOGGERCONTROL_PATH} file (or one of the${PCP_PMLOGGERCONTROL_PATH}.d files) must use the second field of one configurationline to designate the primary logger, and usually will also use the pmlogger configuration file${PCP_SYSCONF_DIR}/pmlogger/config.default (although the latter is not mandatory).
Using pmlcYou may tailor pmlogger dynamically with the pmlc command (if it is configured to allow access tothis functionality). Normally, the pmlogger configuration is read at startup. If you choose to modify theconfig file to change the parameters under which pmlogger operates, you must stop and restart theprogram for your changes to have effect. Alternatively, you may change parameters whenever requiredby using the pmlc interface.
To run the pmlc tool, enter:
pmlc
By default, pmlc acts on the primary instance of pmlogger on the current host. See the pmlc(1) man pagefor a description of command line options. When it is invoked, pmlc presents you with a prompt:
pmlc>
You may obtain a listing of the available commands by entering a question mark (?) and pressing Enter.You see output similar to that in Example 6.3, “Listing Available Commands ”:
Example 6.3. Listing Available Commands
show loggers [@<host>] display <pid>s of running pmloggers connect _logger_id [@<host>] connect to designated pmlogger status information about connected pmlogger query metric-list show logging state of metrics new volume start a new log volume flush flush the log buffers to disk log { mandatory | advisory } on <interval> _metric-list log { mandatory | advisory } off _metric-list log mandatory maybe _metric-list timezone local|logger|'<timezone>' change reporting timezone help print this help message quit exit from pmlc _logger_id is primary | <pid> | port <n> _metric-list is _metric-spec | { _metric-spec ... }
83

Archive Logging
_metric-spec is <metric-name> | <metric-name> [ <instance> ... ]
Here is an example:
pmlcpmlc> show loggers @babylonThe following pmloggers are running on babylon: primary (1892)pmlc> connect 1892 @babylonpmlc> log advisory on 2 secs disk.dev.readpmlc> query disk.devdisk.dev.read adv on nl 5 min [131073 or “disk1”] adv on nl 5 min [131074 or “disk2”]pmlc> quit
Note
Any changes to the set of logged metrics made via pmlc are not saved, and are lost the next timepmlogger is started with the same configuration file. Permanent changes are made by modifyingthe pmlogger configuration file(s).
Refer to the pmlc(1) and pmlogger(1) man pages for complete details.
Archive Logging TroubleshootingThe following issues concern the creation and use of logs using pmlogger.
pmlogger Cannot Write LogSymptom: The pmlogger utility does not start, and you see this message:
__pmLogNewFile: “foo.index” already exists, not over-written
Cause: Archive logs are considered sufficiently precious that pmlogger does notempty or overwrite an existing set of archive log files. The log named fooactually consists of the physical file foo.index, foo.meta, and at leastone file foo.N, where N is in the range 0, 1, 2, 3, and so on.
A message similar to the one above is produced when a new pmlogger instanceencounters one of these files already in existence.
Resolution: Move the existing archive aside, or if you are sure, remove all of the parts ofthe archive log. For example, use the following command:
rm -f foo.*
Then rerun pmlogger.
Cannot Find LogSymptom: The pmdumplog utility, or any tool that can read an archive log, displays this
message:
Cannot open archive mylog: No such file or directory
84

Archive Logging
Cause: An archive consists of at least three physical files. If the base name for thearchive is mylog, then the archive actually consists of the physical filesmylog.index, mylog.meta, and at least one file mylog.N, where N isin the range 0, 1, 2, 3, and so on.
The above message is produced if one or more of the files is missing.
Resolution: Use this command to check which files the utility is trying to open:
ls mylog.*
Turn on the internal debug flag DBG_TRACE_LOG (-D 128) to see which filesare being inspected by the pmOpenLog routine as shown in the followingexample:
pmdumplog -D 128 -l mylog
Locate the missing files and move them all to the same directory, or removeall of the files that are part of the archive, and recreate the archive log.
Primary pmlogger Cannot StartSymptom: The primary pmlogger cannot be started. A message like the following
appears:
pmlogger: there is already a primary pmlogger running
Cause: There is either a primary pmlogger already running, or the previous primarypmlogger was terminated unexpectedly before it could perform its cleanupoperations.
Resolution: If there is already a primary pmlogger running and you wish to replace it witha new pmlogger, use the show command in pmlc to determine the process IDof the primary pmlogger. The process ID of the primary pmlogger appears inparentheses after the word “primary.” Send a SIGINT signal to the processto shut it down (use either the kill command if the platform supports it, orthe pmsignal command). If the process does not exist, proceed to the manualcleanup described in the paragraph below. If the process did exist, it shouldnow be possible to start the new pmlogger.
If pmlc's show command displays a process ID for a process that does notexist, a pmlogger process was terminated before it could clean up. If it wasthe primary pmlogger, the corresponding control files must be removed beforeone can start a new primary pmlogger. It is a good idea to clean up any spuriouscontrol files even if they are not for the primary pmlogger.
The control files are kept in ${PCP_TMP_DIR}/pmlogger. A control filewith the process ID of the pmlogger as its name is created when the pmloggeris started. In addition, the primary pmlogger creates a symbolic link namedprimary to its control file.
For the primary pmlogger, remove both the symbolic link and the file(corresponding to its process ID) to which the link points. For other pmloggers,remove just the process ID file. Do not remove any other files in the directory.If the control file for an active pmlogger is removed, pmlc is not able to contactit.
85

Archive Logging
Identifying an Active pmlogger ProcessSymptom: You have a PCP archive log that is demonstrably growing, but do not know
the identify of the associated pmlogger process.
Cause: The PID is not obvious from the log, or the archive name may not be obviousfrom the output of the ps command.
Resolution: If the archive basename is foo, run the following commands:
pmdumplog -l fooLog Label (Log Format Version 1)Performance metrics from host gonzo commencing Wed Aug 7 00:10:09.214 1996 ending Wed Aug 7 16:10:09.155 1996
pminfo -a foo -f pmcd.pmlogger pmcd.pmlogger.host inst [10728 or "10728"] value "gonzo"pmcd.pmlogger.port inst [10728 or "10728"] value 4331pmcd.pmlogger.archive inst [10728 or "10728"] value "/usr/var/adm/pcplog/gonzo/foo"
All of the information describing the creator of the archive is revealed and, inparticular, the instance identifier for the PMCD metrics (10728 in the exampleabove) is the PID of the pmlogger instance, which may be used to control theprocess via pmlc.
Illegal Label RecordSymptom: PCP tools report:
Illegal label record at start of PCP archive log file.
Cause: The label record at the start of each of the physical archive log files has becomeeither corrupted or one is out of sync with the others.
Resolution: If you believe the log may have been corrupted, this can be verified usingpmlogcheck. If corruption is limited to just the label record at the start, thepmloglabel can be used to force the labels back in sync with each other, withknown-good values that you supply.
Refer to the pmlogcheck(1) and pmloglabel(1) man pages.
Empty Archive Log Files or pmlogger Exits ImmediatelySymptom: Archive log files are zero size, requested metrics are not being logged, or
pmlogger exits immediately with no error messages.
Cause: Either pmlogger encountered errors in the configuration file, has not flushedits output buffers yet, or some (or all) metrics specified in the pmloggerconfiguration file have had their state changed to advisory off or mandatoryoff via pmlc. It is also possible that the logging interval specified in the
86

Archive Logging
pmlogger configuration file for some or all of the metrics is longer than theperiod of time you have been waiting since pmlogger started.
Resolution: If pmlogger exits immediately with no error messages, check thepmlogger.log file in the directory pmlogger was started in for any errormessages. If pmlogger has not yet flushed its buffers, enter one of thefollowing commands (depending on platform support):
killall -SIGUSR1 pmlogger${PCP_BINADM_DIR}/pmsignal -a -s USR1 pmlogger
Otherwise, use the status command for pmlc to interrogate the internalpmlogger state of specific metrics.
87

Chapter 7. Performance Co-PilotDeployment Strategies
Table of ContentsBasic Deployment ............................................................................................................. 89PCP Collector Deployment ................................................................................................. 90
Principal Server Deployment ....................................................................................... 90Quality of Service Measurement .................................................................................. 91
PCP Archive Logger Deployment ........................................................................................ 92Deployment Options .................................................................................................. 92Resource Demands for the Deployment Options ............................................................. 93Operational Management ............................................................................................ 93Exporting PCP Archive Logs ...................................................................................... 93
PCP Inference Engine Deployment ...................................................................................... 93Deployment Options .................................................................................................. 94Resource Demands for the Deployment Options ............................................................. 95Operational Management ............................................................................................ 95
Performance Co-Pilot (PCP) is a coordinated suite of tools and utilities allowing you to monitorperformance and make automated judgments and initiate actions based on those judgments. PCP isdesigned to be fully configurable for custom implementation and deployed to meet specific needs in avariety of operational environments.
Because each enterprise and site is different and PCP represents a new way of managing performanceinformation, some discussion of deployment strategies is useful.
The most common use of performance monitoring utilities is a scenario where the PCP tools are executedon a workstation (the PCP monitoring system), while the interesting performance data is collected onremote systems (PCP collector systems) by a number of processes, specifically the Performance MetricsCollection Daemon (PMCD) and the associated Performance Metrics Domain Agents (PMDAs). Theseprocesses can execute on both the monitoring system and one or more collector systems, or only oncollector systems. However, collector systems are the real objects of performance investigations.
The material in this chapter covers the following areas:
• the section called “Basic Deployment”, presents the spectrum of deployment architectures at the highestlevel.
• the section called “PCP Collector Deployment”, describes alternative deployments for PMCD and thePMDAs.
• the section called “PCP Archive Logger Deployment”, covers alternative deployments for the pmloggertool.
• the section called “PCP Inference Engine Deployment”, presents the options that are available fordeploying the pmie tool.
The options shown in this chapter are merely suggestions. They are not comprehensive, and are intended todemonstrate some possible ways of deploying the PCP tools for specific network topologies and purposes.You are encouraged to use them as the basis for planning your own deployment, consistent with your needs.
88

Performance Co-PilotDeployment Strategies
Basic DeploymentIn the simplest PCP deployment, one system is configured as both a collector and a monitor, as shownin Figure 7.1, “PCP Deployment for a Single System”. Because some of the PCP monitor tools makeextensive use of visualization, this suggests the monitor system should be configured with a graphicaldisplay.
Figure 7.1. PCP Deployment for a Single System
Monitor Tool
PMCD
Monitor and Collector System
PMDAs
Monitor Tool
However, most PCP deployments involve at least two systems. For example, the setup shown in Figure 7.2,“Basic PCP Deployment for Two Systems” would be representative of many common scenarios.
Figure 7.2. Basic PCP Deployment for Two Systems
PMCD
Collector System
PMDAs
Monitor Tool
Monitor System
Monitor Tool
But the most common site configuration would include a mixture of systems configured as PCP collectors,as PCP monitors, and as both PCP monitors and collectors, as shown in Figure 7.3, “General PCPDeployment for Multiple Systems ”.
89

Performance Co-PilotDeployment Strategies
With one or more PCP collector systems and one or more PCP monitor systems, there are a numberof decisions that need to be made regarding the deployment of PCP services across multiple hosts. Forexample, in Figure 7.3, “General PCP Deployment for Multiple Systems ” there are several ways in whichboth the inference engine (pmie) and the PCP archive logger (pmlogger) could be deployed. These optionsare discussed in the following sections of this chapter.
Figure 7.3. General PCP Deployment for Multiple Systems
PMCD
Collector System
PMDAs
Monitor Tool
Monitor System
Monitor Tool
Monitor Tool
Monitor System
Monitor Tool
PMCD
Collector System
PMDAs
PMCD
Collector System
PMDAs
PCP Collector DeploymentEach PCP collector system must have an active pmcd and, typically, a number of PMDAs installed.
Principal Server DeploymentThe first hosts selected as PCP collector systems are likely to provide some class of service deemed to becritical to the information processing activities of the enterprise. These hosts include:
• Database servers
• Web servers for an Internet or Intranet presence
• NFS or other central storage server
• A video server
• A supercomputer
• An infrastructure service provider, for example, print, DNS, LDAP, gateway, firewall, router, or mailservices
• Any system running a mission-critical application
90

Performance Co-PilotDeployment Strategies
Your objective may be to improve quality of service on a system functioning as a server for many clients.You wish to identify and repair critical performance bottlenecks and deficiencies in order to maintainmaximum performance for clients of the server.
For some of these services, the PCP base product or the PCP add-on packages provide the necessarycollector components. Others would require customized PMDA development, as described in thecompanion Performance Co-Pilot Programmer's Guide.
Quality of Service MeasurementApplications and services with a client-server architecture need to monitor performance at both the serverside and the client side.
The arrangement in Figure 7.4, “PCP Deployment to Measure Client-Server Quality of Service” illustratesone way of measuring quality of service for client-server applications.
Figure 7.4. PCP Deployment to Measure Client-Server Quality of Service
PMCD
Application Client System
PMDA
PCP Monitor System
Monitor Tool
Application Server System
PMCD
PMDAs
ApplicationServer
ClientApplication
The configuration of the PCP collector components on the Application Server System is standard. Thenew facility is the deployment of some PCP collector components on the Application Client System; thisuses a customized PMDA and a generalization of the ICMP “ping” tool as follows:
• The Client App is specially developed to periodically make typical requests of the App Server,and to measure the response time for these requests (this is an application-specific “ping”).
• The PMDA on the Application Client System captures the response time measurements from theClient App and exports these into the PCP framework.
At the PCP monitor system, the performance of the system running the App Server and the end-userquality of service measurements from the system where the Client App is running can be monitoredconcurrently.
91

Performance Co-PilotDeployment Strategies
PCP contains a number of examples of this architecture, including the shping PMDA for IP-basedservices (including HTTP), and the dbping PMDA for database servers.
The source code for each of these PMDAs is readily available; users and administrators are encouraged toadapt these agents to the needs of the local application environment.
It is possible to exploit this arrangement even further, with these methods:
• Creating new instances of the Client App and PMDA to measure service quality for your ownmission-critical services.
• Deploying the Client App and associated PCP collector components in a number of strategic hostsallows the quality of service over the enterprise's network to be monitored. For example, service canbe monitored on the Application Server System, on the same LAN segment as the Application ServerSystem, on the other side of a firewall system, or out in the WAN.
PCP Archive Logger DeploymentPCP archive logs are created by the pmlogger utility, as discussed in Chapter 6, Archive Logging.They provide a critical capability to perform retrospective performance analysis, for example, to detectperformance regressions, for problem analysis, or to support capacity planning. The following sectionsdiscuss the options and trade-offs for pmlogger deployment.
Deployment OptionsThe issue is relatively simple and reduces to “On which host(s) should pmlogger be running?” The optionsare these:
• Run pmlogger on each PCP collector system to capture local performance data.
• Run pmlogger on some of the PCP monitor systems to capture performance data from remote PCPcollector systems.
• As an extension of the previous option, designate one system to act as the PCP archive site to run allpmlogger instances. This arrangement is shown in Figure 7.5, “Designated PCP Archive Site”.
Figure 7.5. Designated PCP Archive Site
pmlogger
Monitor and Collector System
pmlogger
PMCD
Collector System
PMDAs
PMCD
Collector System
PMDAs
PCP Archive Log
PCP Archive Log
92
Performance Co-PilotDeployment Strategies
Resource Demands for the Deployment OptionsThe pmlogger process is very lightweight in terms of computational demand; most of the (very small)CPU cost is associated with extracting performance metrics at the PCP collector system (PMCD and thePMDAs), which are independent of the host on which pmlogger is running.
A local pmlogger consumes disk bandwidth and disk space on the PCP collector system. A remotepmlogger consumes disk space on the site where it is running and network bandwidth between that hostand the PCP collector host.
The archive logs typically grow at a rate of anywhere between a few kilobytes (KB) to tens of megabytes(MB) per day, depending on how many performance metrics are logged and the choice of samplingfrequencies. There are some advantages in minimizing the number of hosts over which the disk resourcesfor PCP archive logs must be allocated; however, the aggregate requirement is independent of where thepmlogger processes are running.
Operational ManagementThere is an initial administrative cost associated with configuring each pmlogger instance, and an ongoingadministrative investment to monitor these configurations, perform regular housekeeping (such as rotation,compression, and culling of PCP archive log files), and execute periodic tasks to process the archives (suchas nightly performance regression checking with pmie).
Many of these tasks are handled by the supplied pmlogger administrative tools and scripts, as describedin the section called “Archive Log File Management”. However, the necessity and importance of thesetasks favor a centralized pmlogger deployment, as shown in Figure 7.5, “Designated PCP Archive Site”.
Exporting PCP Archive LogsCollecting PCP archive logs is of little value unless the logs are processed as part of the ongoingperformance monitoring and management functions. This processing typically involves the use of the toolson a PCP monitor system, and hence the archive logs may need to be read on a host different from theone they were created on.
NFS mounting is obviously an option, but the PCP tools support random access and both forward andbackward temporal motion within an archive log. If an archive is to be subjected to intensive and interactiveprocessing, it may be more efficient to copy the files of the archive log to the PCP monitor system first.
Note
Each PCP archive log consists of at least three separate files (see the section called “Archive LogFile Management” for details). You must have concurrent access to all of these files before a PCPtool is able to process an archive log correctly.
PCP Inference Engine DeploymentThe pmie utility supports automated reasoning about system performance, as discussed in Chapter 5,Performance Metrics Inference Engine, and plays a key role in monitoring system performance for bothreal-time and retrospective analysis, with the performance data being retrieved respectively from a PCPcollector system and a PCP archive log.
The following sections discuss the options and trade-offs for pmie deployment.
93

Performance Co-PilotDeployment Strategies
Deployment Options
The issue is relatively simple and reduces to “On which host(s) should pmie be running?” You mustconsider both real-time and retrospective uses, and the options are as follows:
• For real-time analysis, run pmie on each PCP collector system to monitor local system performance.
• For real-time analysis, run pmie on some of the PCP monitor systems to monitor the performance ofremote PCP collector systems.
• For retrospective analysis, run pmie on the systems where the PCP archive logs reside. The problem thenreduces to pmlogger deployment as discussed in the section called “PCP Archive Logger Deployment”.
• As an example of the “distributed management with centralized control” philosophy, designate somesystem to act as the PCP Management Site to run all pmlogger and pmie instances. This arrangementis shown in Figure 7.6, “PCP Management Site Deployment”.
One pmie instance is capable of monitoring multiple PCP collector systems; for example, to evaluatesome universal rules that apply to all hosts. At the same time a single PCP collector system may bemonitored by multiple pmie instances; for example, for site-specific and universal rule evaluation, orto support both tactical performance management (operations) and strategic performance management(capacity planning). Both situations are depicted in Figure 7.6, “PCP Management Site Deployment”.
Figure 7.6. PCP Management Site Deployment
pmlogger
PCP Management Site
pmlogger
PMCD
Collector System A
PMDAs
PMCD
Collector System B
PMDAs
PCP Archive Log
PCP Archive Log
pmie
pmie
pmie Rules
pmie Rules
94

Performance Co-PilotDeployment Strategies
Resource Demands for the Deployment OptionsDepending on the complexity of the rule sets, the number of hosts being monitored, and the evaluationfrequency, pmie may consume CPU cycles significantly above the resources required to simply fetch thevalues of the performance metrics. If this becomes significant, then real-time deployment of pmie awayfrom the PCP collector systems should be considered in order to avoid the “you're part of the problem, notthe solution” scenario in terms of CPU utilization on a heavily loaded server.
Operational ManagementAn initial administrative cost is associated with configuring each pmie instance, particularly in thedevelopment of the rule sets that accurately capture and classify “good” versus “bad” performance inyour environment. These rule sets almost always involve some site-specific knowledge, particularlyin respect to the “normal” levels of activity and resource consumption. The pmieconf tool (see thesection called “Creating pmie Rules with pmieconf”) may be used to help develop localized rules basedupon parameterized templates covering many common performance scenarios. In complex environments,customizing these rules may occur over an extended period and require considerable performance analysisinsight.
One of the functions of pmie provides for continual detection of adverse performance and the automaticgeneration of alarms (visible, audible, e-mail, pager, and so on). Uncontrolled deployment of this alarminitiating capability throughout the enterprise may cause havoc.
These considerations favor a centralized pmie deployment at a small number of PCP monitor sites, or ina PCP Management Site as shown in Figure 7.6, “PCP Management Site Deployment”.
However, it is most likely that knowledgeable users with specific needs may find a local deployment ofpmie most useful to track some particular class of service difficulty or resource utilization. In these cases,the alarm propagation is unlikely to be required or is confined to the system on which pmie is running.
Configuration and management of a number of pmie instances is made much easier with the scripts andcontrol files described in the section called “Management of pmie Processes”.
95

Chapter 8. Customizing and ExtendingPCP Services
Table of ContentsPMDA Customization ........................................................................................................ 96
Customizing the Summary PMDA ............................................................................... 96PCP Tool Customization .................................................................................................... 99
Archive Logging Customization .................................................................................. 99Inference Engine Customization ................................................................................. 100
PMNS Management ......................................................................................................... 101PMNS Processing Framework ................................................................................... 102PMNS Syntax ......................................................................................................... 102
PMDA Development ........................................................................................................ 104PCP Tool Development .................................................................................................... 104
Performance Co-Pilot (PCP) has been developed to be fully extensible. The following sections summarizethe various facilities provided to allow you to extend and customize PCP for your site:
• the section called “PMDA Customization”, describes the procedure for customizing the summaryPMDA to export derived metrics formed by aggregation of base PCP metrics from one or more collectorhosts.
• the section called “PCP Tool Customization”, describes the various options available for customizingand extending the basic PCP tools.
• the section called “PMNS Management”, covers the concepts and tools provided for updating the PMNS(Performance Metrics Name Space).
• the section called “PMDA Development”, details where to find further information to assist in thedevelopment of new PMDAs to extend the range of performance metrics available through the PCPinfrastructure.
• the section called “PCP Tool Development”, outlines how new tools may be developed to processperformance data from the PCP infrastructure.
PMDA CustomizationThe generic procedures for installing and activating the optional PMDAs have been described in the sectioncalled “Managing Optional PMDAs”. In some cases, these procedures prompt the user for informationbased upon the local system or network configuration, application deployment, or processing profile tocustomize the PMDA and hence the performance metrics it exports.
The summary PMDA is a special case that warrants further discussion.
Customizing the Summary PMDAThe summary PMDA exports performance metrics derived from performance metrics made available byother PMDAs. It is described completely in the pmdasummary(1) man page.
96

Customizing andExtending PCP Services
The summary PMDA consists of two processes:
pmie process Periodically samples the base metrics and compute values for the derivedmetrics. This dedicated instance of the PCP pmie inference engine islaunched with special command line arguments by the main process. Seethe section called “Introduction to pmie”, for a complete discussion of thepmie feature set.
main process Reads and buffers the values computed by the pmie process and makes themavailable to the Performance Metrics Collection Daemon (PMCD).
All of the metrics exported by the summary PMDA have a singular instance and the values areinstantaneous; the exported value is the correct value as of the last time the corresponding expression wasevaluated by the pmie process.
The summary PMDA resides in the ${PCP_PMDAS_DIR}/summary directory and may be installedwith a default configuration by following the steps described in the section called “PMDA Installation ona PCP Collector Host”.
Alternatively, you may customize the summary PMDA to export your own derived performance metricsby following the steps in Procedure 8.1, “Customizing the Summary PMDA”:
Procedure 8.1. Customizing the Summary PMDA
1. Check that the symbolic constant SYSSUMMARY is defined in the ${PCP_VAR_DIR}/pmns/stdpmid file. If it is not, perform the postinstall update of this file, as superuser:
cd ${PCP_VAR_DIR}/pmns ./Make.stdpmid
2. Choose Performance Metric Name Space (PMNS) names for the new metrics. These must begin withsummary and follow the rules described in the pmns(5) man page. For example, you might usesummary.fs.cache_write and summary.fs.cache_hit.
3. Edit the pmns file in the ${PCP_PMDAS_DIR}/summary directory to add the new metric namesin the format described in the pmns(5) man page. You must choose a unique performance metricidentifier (PMID) for each metric. In the pmns file, these appear as SYSSUMMARY:0:x. The valueof x is arbitrary in the range 0 to 1023 and unique in this file. Refer to the section called “PMNSManagement”, for a further explanation of the rules governing PMNS updates.
For example:
summary { cpu disk netif fs /*new*/}summary.fs { cache_write SYSSUMMARY:0:10 cache_hit SYSSUMMARY:0:11}
4. Use the local test PMNS root and validate that the PMNS changes are correct.
For example, enter this command:
97

Customizing andExtending PCP Services
pminfo -n root -m summary.fs
You see output similar to the following:
summary.fs.cache_write PMID: 27.0.10summary.fs.cache_hit PMID: 27.0.11
5. Edit the ${PCP_PMDAS_DIR}/summary/expr.pmie file to add new pmie expressions. If thename to the left of the assignment operator (=) is one of the PMNS names, then the pmie expressionto the right will be evaluated and returned by the summary PMDA. The expression must return anumeric value. Additional description of the pmie expression syntax may be found in the sectioncalled “Specification Language for pmie”.
For example, consider this expression:
// filesystem buffer cache hit percentagesprefix = "kernel.all.io"; // macro, not exportedsummary.fs.cache_write = 100 - 100 * $prefix.bwrite / $prefix.lwrite;summary.fs.cache_hit = 100 - 100 * $prefix.bread / $prefix.lread;
6. Run pmie in debug mode to verify that the expressions are being evaluated correctly, and the valuesmake sense.
For example, enter this command:
pmie -t 2sec -v expr.pmie
You see output similar to the following:
summary.fs.cache_write: ?summary.fs.cache_hit: ?summary.fs.cache_write: 45.83summary.fs.cache_hit: 83.2summary.fs.cache_write: 39.22summary.fs.cache_hit: 84.51
7. Install the new PMDA.
From the ${PCP_PMDAS_DIR}/summary directory, use this command:
./Install
You see the following output:
Interval between summary expression evaluation (seconds)? [10] 10Updating the Performance Metrics Name Space...Installing pmchart view(s) ...Terminate PMDA if already installed ...Installing files ..Updating the PMCD control file, and notifying PMCD ...Wait 15 seconds for the agent to initialize ...Check summary metrics have appeared ... 8 metrics and 8 values
8. Check the metrics.
98

Customizing andExtending PCP Services
For example, enter this command:
pmval -t 5sec -s 8 summary.fs.cache_write
You see a response similar to the following:
metric: summary.fs.cache_writehost: localhostsemantics: instantaneous valueunits: nonesamples: 8interval: 5.00 sec63.6013215859030862.7187864644107362.7187864644107358.7396849212303158.7396849212303165.3382275825904665.3382275825904672.6099706744868
Note that the values are being sampled here by pmval every 5 seconds, but pmie is passing only newvalues to the summary PMDA every 10 seconds. Both rates could be changed to suit the dynamicsof your new metrics.
9. You may now create pmchart views, pmie rules, and pmlogger configurations to monitor andarchive your new performance metrics.
PCP Tool CustomizationPerformance Co-Pilot (PCP) has been designed and implemented with a philosophy that embraces thenotion of toolkits and encourages extensibility.
In most cases, the PCP tools provide orthogonal services, based on external configuration files. It is thecreation of new and modified configuration files that enables PCP users to customize tools quickly andmeet the needs of the local environment, in many cases allowing personal preferences to be establishedfor individual users on the same PCP monitor system.
The material in this section is intended to act as a checklist of pointers to detailed documentation foundelsewhere in this guide, in the man pages, and in the files that are made available as part of the PCPinstallation.
Archive Logging CustomizationThe PCP archive logger is presented in Chapter 6, Archive Logging, and documented in the pmlogger(1)man page.
The following global files and directories influence the behavior of pmlogger:
${PCP_SYSCONF_DIR}/pmlogger Enable/disable state for the primary loggerfacility using this command:
chkconfig pmlogger on
99

Customizing andExtending PCP Services
${PCP_SYSCONF_DIR}/pmlogger/config.default
The default pmlogger configuration file thatis used for the primary logger when thisfacility is enabled.
${PCP_VAR_DIR}/config/pmlogconf/tools Every PCP tool with a fixed groupof performance metrics contributesa pmlogconf configuration file thatincludes each of the performancemetrics used in the tool, forexample, ${PCP_VAR_DIR}/config/pmlogconf/pmstat for pmstat.
${PCP_PMLOGGERCONTROL_PATH} or${PCP_PMLOGGERCONTROL_PATH}.d files
Defines which PCP collector hosts requirepmlogger to be launched on the local host,where the configuration file comes from,where the archive log files should be created,and pmlogger startup options.
These control files support the starting andstopping of multiple pmlogger instances thatmonitor local or remote hosts.
/etc/cron.d/pcp-pmlogger or${PCP_VAR_DIR}/config/pmlogger/crontab
Default crontab entries that may bemerged with the crontab entries for thepcp user to schedule the periodic executionof the archive log management scripts, forexample, pmlogger_daily.
${PCP_LOG_DIR}/pmlogger/somehost The default behavior of the archive logmanagement scripts create archive log filesfor the host somehost in this directory.
${PCP_LOG_DIR}/pmlogger/somehost/Latest
A PCP archive folio for the most recentarchive for the host somehost. This folio iscreated and maintained by the cron-drivenperiodic archive log management scripts,for example, pmlogger_check. Archivefolios may be processed with the pmafm tool.
Inference Engine Customization
The PCP inference engine is presented in Chapter 5, Performance Metrics Inference Engine, anddocumented in the pmie(1) man page.
The following global files and directories influence the behavior of pmie:
${PCP_SYSCONF_DIR}/pmie Controls the pmie daemon facility. Enableusing this command:
chkconfig pmie on
${PCP_SYSCONF_DIR}/pmie/config.default The pmie configuration file that is used formonitoring the local host when the pmiedaemon facility is enabled in the default
100

Customizing andExtending PCP Services
configuration. This file is created usingpmieconf the first time the daemon facility isactivated.
${PCP_PMIECONTROL_PATH} and${PCP_PMIECONTROL_PATH}.d files
Defines which PCP collector hosts require adaemon pmie to be monitoring from the localhost, where the configuration files comesfrom, where the pmie log file should becreated, and pmie startup options.
These control files support the starting andstopping of multiple pmie instances that areeach monitoring one or more hosts.
${PCP_VAR_DIR}/config/pmieconf/*/* Each pmieconf rule definition can be foundbelow one of these subdirectories.
/etc/cron.d/pcp-pmie or ${PCP_VAR_DIR}/config/pmie/crontab
Default crontab entries that may bemerged with the crontab entries for thepcp user to schedule the periodic executionof the pmie_check and pmie_daily scripts,for verifying that pmie instances are runningand logs rotated.
${PCP_LOG_DIR}/pmie/somehost The default behavior of the${PCP_RC_DIR}/pmie startup scriptscreate pmie log files for the host somehostin this directory.
pmie_check and pmie_daily These commands are similar to thepmlogger support scripts, pmlogger_checkand pmlogger_daily.
${PCP_TMP_DIR}/pmie The statistics that pmie gathers aremaintained in binary data structure files.These files can be found in the${PCP_TMP_DIR}/pmie directory.
pmcd.pmie metrics The PMCD PMDA exports information aboutexecuting pmie processes and their progressin terms of rule evaluations and actionexecution rates.
If pmie is running on a system with aPCP collector deployment, the pmcd PMDAexports these metrics via the pmcd.pmiegroup of metrics.
PMNS ManagementThis section describes the syntax, semantics, and processing framework for the external specificationof a Performance Metrics Name Space (PMNS) as it might be loaded by the PMAPI routinepmLoadNameSpace; see the pmLoadNameSpace(3) man page. This is usually done only by pmcd,except in rare circumstances such as the section called “Customizing the Summary PMDA”.
101

Customizing andExtending PCP Services
The PMNS specification is a simple text source file that can be edited easily. For reasons of efficiency,a binary format is also supported; the utility pmnscomp translates the ASCII source format into binaryformat; see the pmnscomp(1) man page.
PMNS Processing Framework
The PMNS specification is initially passed through pmcpp(1). This means the following facilities maybe used in the specification:
• C-style comments
• #include directives
• #define directives and macro substitution
• Conditional processing with #ifdef, #ifndef, #endif, and #undef
When pmcpp(1) is executed, the standard include directories are the current directory and${PCP_VAR_DIR}/pmns, where some standard macros and default specifications may be found.
PMNS Syntax
Every PMNS is tree structured. The paths to the leaf nodes are the performance metric names. The generalsyntax for a non-leaf node in PMNS is as follows:
pathname { name [pmid] ...}
Here pathname is the full pathname from the root of the PMNS to this non-leaf node, with eachcomponent in the path separated by a period. The root node for the PMNS has the special name root, butthe prefix string root. must be omitted from all other pathnames.
For example, refer to the PMNS shown in Figure 8.1, “Small Performance Metrics Name Space(PMNS)”. The correct pathname for the rightmost non-leaf node is cpu.utilization, notroot.cpu.utilization.
102

Customizing andExtending PCP Services
Figure 8.1. Small Performance Metrics Name Space (PMNS)
root
cpunetwork
utilization
in out idleuser sys
packetsinterrupts syscalls
Each component in the pathname must begin with an alphabetic character and be followed by zero ormore alphanumeric characters or the underscore (_) character. For alphabetic characters in a component,uppercase and lowercase are significant.
Non-leaf nodes in the PMNS may be defined in any order desired. The descendent nodes are defined bythe set of names, relative to the pathname of their parent non-leaf node. For descendent nodes, leaf nodeshave a pmid specification, but non-leaf nodes do not.
The syntax for the pmid specification was chosen to help manage the allocation of Performance MetricIDs (PMIDs) across disjoint and autonomous domains of administration and implementation. Each pmidconsists of three integers separated by colons, for example, 14:27:11. This is intended to mirror theimplementation hierarchy of performance metrics. The first integer identifies the domain in which theperformance metric lies. Within a domain, related metrics are often grouped into clusters. The secondinteger identifies the cluster, and the third integer, the metric within the cluster.
The PMNS specification for Figure 8.1, “Small Performance Metrics Name Space (PMNS)” is shown inExample 8.1, “PMNS Specification”:
Example 8.1. PMNS Specification
/** PMNS Specification*/#define KERNEL 1root { network cpu}#define NETWORK 26network { interrupts KERNEL:NETWORK:1 packets}network.packets {
103

Customizing andExtending PCP Services
in KERNEL:NETWORK:35 out KERNEL:NETWORK:36}#define CPU 10cpu { syscalls KERNEL:CPU:10 utilization}#define USER 20#define SYSTEM 21#define IDLE 22cpu.utilization { user KERNEL:CPU:USER sys KERNEL:CPU:SYSTEM idle KERNEL:CPU:IDLE}
For complete documentation of the PMNS and associated utilities, see the pmns(5), pmnsadd(1),pmnsdel(1) and pmnsmerge(1) man pages.
PMDA DevelopmentPerformance Co-Pilot (PCP) is designed to be extensible at the collector site.
Application developers are encouraged to create new PMDAs to export performance metrics from theapplications and service layers that are particularly relevant to a specific site, application suite, orprocessing environment.
These PMDAs use the routines of the libpcp_pmda library, which is discussed in detail in thePerformance Co-Pilot Programmer's Guide.
PCP Tool DevelopmentPerformance Co-Pilot (PCP) is designed to be extensible at the monitor site.
Application developers are encouraged to create new PCP client applications to monitor or displayperformance metrics in a manner that is particularly relevant to a specific site, application suite, orprocessing environment.
Client applications use the routines of the PMAPI (performance metrics application programminginterface) described in the Performance Co-Pilot Programmer's Guide. At the time of writing, nativePMAPI interfaces are available for the C, C++ and Python languages.
104

Appendix A. AcronymsTable A.1, “Performance Co-Pilot Acronyms and Their Meanings ” provides a list of the acronyms usedin the Performance Co-Pilot (PCP) documentation, help cards, man pages, and user interface.
Table A.1. Performance Co-Pilot Acronyms and Their Meanings
Acronym Meaning
API Application Programming Interface
DBMS Database Management System
DNS Domain Name Service
DSO Dynamic Shared Object
I/O Input/Output
IPC Interprocess Communication
PCP Performance Co-Pilot
PDU Protocol data unit
PMAPI Performance Metrics Application Programming Interface
PMCD Performance Metrics Collection Daemon
PMD Performance Metrics Domain
PMDA Performance Metrics Domain Agent
PMID Performance Metric Identifier
PMNS Performance Metrics Name Space
TCP/IP Transmission Control Protocol/Internet Protocol
105

Index*_inst operator Arithmetic Aggregation*_sample operator Arithmetic Aggregation2D tools Monitoring System Performance64-bit IEEE format Descriptions for Performance MetricspmGetConfig function PCP Environment Variablesacronyms Acronymsactive pmlogger process Identifying an Active pmloggerProcessadaptation Dynamic Adaptation to Changeapplication programs Application and AgentDevelopment Sources of Performance Metrics and TheirDomainsarchive logs
administration Archive Log Administrationanalysis Logging and Retrospective Analysiscapacity planning Using Archive Logs for CapacityPlanningcollection time Current Metric Contextcontents PCP Archive Contentscreation Collecting, Transporting, and ArchivingPerformance Informationcustomization Automated Operational SupportArchive Logging Customizationexport Exporting PCP Archive Logsfetching metrics Fetching Metrics from an ArchiveLogfile management Archive Log File Managementfolios PCP Archive Foliosphysical filenames Fetching Metrics from an ArchiveLogPMAPI Archive Logs and the PMAPIretrospective analysis Retrospective Analysis UsingArchive Logstroubleshooting Archive Logging Troubleshootingusage Archive Logging
arithmetic aggregation Arithmetic Aggregationarithmetic expressions pmie Arithmetic Expressionsaudience Empowering the PCP Useraudits Automated Operational Supportautomated operational support Automated OperationalSupportavg_host operator Arithmetic Aggregationbasename conventions Basename ConventionsBoolean expressions Boolean Expressionscapacity planning Using Archive Logs for CapacityPlanningcaveats Caveats and Notes on pmiecentralized archive logging Automated OperationalSupportcoverage Metric Coveragechkhelp tool Application and Agent Development
client-server architecture PCP Distributed Operationcollection time Current Metric Contextcollector hosts Distributed Collection Collector andMonitor Roles PMDA Installation on a PCP CollectorHostcomments Commentscommon directories Common Directories and FileLocationscomponent software Overview of Component Softwareconceptual foundations Conceptual Foundationsconfiguring PCP Installing and Configuring PerformanceCo-Pilotconventions Common Conventions and Argumentscookbook Cookbook for Archive Loggingcount_host operator Arithmetic Aggregationcron scripts Introduction to Archive LoggingAdministering PCP Archive Logs Using cron Scriptscustomization
archive logs Archive Logging Customizationinference engine Inference Engine CustomizationPCP services Customizing and Extending PCPServices
data collection tools Collecting, Transporting, andArchiving Performance Informationdbpmda tool Application and Agent Developmentdebugging tools Operational and Infrastructure Supportdeployment strategies Performance Co-Pilot DeploymentStrategiesdiagnostic tools Operational and Infrastructure SupportDISPLAY variable pmie Rule Expressionsdistributed collection Distributed Collectiondomains Unification of Performance Metric DomainsDSO Acronymsduration Performance Monitor Reporting Frequency andDurationdynamic adaptation Dynamic Adaptation to Changeenviron man page Timezone Optionsenvironment variables PCP Environment Variableserror detection pmie Error Detection${PCP_PMLOGGERCONTROL_PATH} file PrimaryLogger${PCP_DIR}/etc/pcp.conf file Common Directories andFile Locations PCP Environment Variables${PCP_DIR}/etc/pcp.env file Common Directories andFile Locations PCP Environment Variables${PCP_RC_DIR}/pmcd file Common Directories andFile Locationsevaluation frequency Setting Evaluation Frequencyextensibility PCP Extensibility Customizing andExtending PCP Servicesexternal equipment Sources of Performance Metrics andTheir Domainsfetching metrics Fetching Metrics from Another HostFetching Metrics from an Archive Log
106

Index
file locations Common Directories and File Locationsfirewalls Running PCP Tools through a Firewallflush command Coordination between pmlogger andPCP toolsfolios PCP Archive Foliosfunctional domains Sources of Performance Metrics andTheir Domainsglossary Acronymsillegal label record Illegal Label Recordinference engine Inference Engine Customizationinfrastructure support tools Operational and InfrastructureSupportinstalling PCP Installing and Configuring PerformanceCo-Pilotintrinsic operators pmie Intrinsic OperatorsI/O AcronymsIPC Acronymskill command Primary pmlogger Cannot Startlayered software services Sources of Performance Metricsand Their Domainslexical elements Lexical Elementslibpcp_mmv library Product Extensibilitylibpcp_pmda library Product Extensibilitylog volumes Log Volumeslogging (see archive logs)logical constants Logical Constantslogical expressions pmie Logical Expressionsmacros Macrosman command
usage Monitoring System Performancemax_host operator Arithmetic Aggregationmetadata Descriptions for Performance Metricsmetric domains Unification of Performance MetricDomainsmetric wraparound Performance Metrics Wraparoundmin_host operator Arithmetic Aggregationmkaf tool Collecting, Transporting, and ArchivingPerformance Information Introduction to ArchiveLoggingmonitor configuration Product Structuremonitor hosts Collector and Monitor Rolesmonitoring system performance Monitoring SystemPerformancenaming scheme Uniform Naming and Access toPerformance Metricsnetstat command PMCD Does Not Startnetwork routers and bridges Sources of PerformanceMetrics and Their Domainsnetwork transportation tools Collecting, Transporting,and Archiving Performance Informationnewhelp tool Application and Agent DevelopmentMail servers Sources of Performance Metrics and TheirDomainsobjectives Objectives
operational support tools Operational and InfrastructureSupportoperators Quantification Operatorsoverview Introduction to Performance Co-Pilotpcp-atop tool
brief description Performance Monitoring andVisualization
pmcd.options file The pmcd.options FilePCP
acronym Acronymsarchive logger deployment PCP Archive LoggerDeploymentcollector deployment PCP Collector Deploymentconfiguring and installing Installing and ConfiguringPerformance Co-Pilotconventions Common Conventions and Argumentsdistributed operation PCP Distributed Operationenvironment variables PCP Environment Variablesextensibility PCP Extensibility Product Extensibilityfeatures Introduction to Performance Co-Pilotlog file option Fetching Metrics from an Archive Lognaming conventions Common Conventions andArgumentspmie capabilities Introduction to pmiepmie tool pmie use of PCP servicestool customization PCP Tool Customizationtool development PCP Tool Developmenttool summaries Performance Monitoring andVisualization Collecting, Transporting, and ArchivingPerformance Information Operational andInfrastructure Support Application and AgentDevelopment
pcp tool Operational and Infrastructure SupportOperational and Infrastructure SupportPCP Tutorials and Case Studies
pminfo command The pminfo Commandpmval command The pmval Command
PCP_COUNTER_WRAP variable PCP EnvironmentVariables Performance Metric Wraparound PerformanceMetrics WraparoundPCP_STDERR variable PCP Environment VariablesPCPIntro command PMCD Does Not Start PerformanceMonitor Reporting Frequency and DurationPDU The pmcd.options File AcronymsPerformance Co-Pilot (see PCP)Performance Metric Identifier (see PMID)performance metric wraparound Performance MetricWraparound Performance Metrics Wraparoundperformance metrics
concept Performance Metricsdescriptions Descriptions for Performance Metricsmethods Sources of Performance Metrics and TheirDomains
107

Index
missing and incomplete values Missing andIncomplete Values for Performance MetricsPMNS Performance Metrics Name Spaceretrospective sources Retrospective Sources ofPerformance Metricssources Sources of Performance Metrics and TheirDomains
Performance Metrics Application Programming Interface(see PMAPI)Performance Metrics Collection Daemon (see PMCD)Performance Metrics Domain (see PMD)Performance Metrics Domain Agent (see PMDA)Performance Metrics Inference Engine (see pmie tool)Performance Metrics Name Space (see PMNS)performance monitoring Performance Monitoring andVisualization Monitoring System Performanceperformance visualization tools Using Archive Logs withPerformance ToolsPM_INDOM_NULL pmie and the Performance MetricsCollection Systempmafm tool
archive folios Introduction to Archive Loggingbrief description Collecting, Transporting, andArchiving Performance Informationinteractive commands PCP Archive Folios
PMAPIacronym Acronymsarchive logs Archive Logs and the PMAPIbrief description Application and Agent Developmentnaming metrics Performance Metricspmie capabilities Introduction to pmie
PMCDacronym Acronymsbrief description Collecting, Transporting, andArchiving Performance Informationcollector host pmie Metric Expressionsconfiguration files PMCD Options and ConfigurationFilesdiagnostics and error messages PMCD Diagnosticsand Error Messagesdistributed collection Distributed CollectionDistributed Collectionmaintenance Performance Metrics Collection Daemon(PMCD)monitoring utilities Performance Co-Pilot DeploymentStrategiesnot starting PMCD Does Not StartPMCD_CONNECT_TIMEOUT variable PCPEnvironment VariablesPMCD_PORT variable PCP Environment VariablesPMCD_LOCAL variable PCP Environment VariablesPMCD_RECONNECT_TIMEOUT variable PCPEnvironment Variables
PMCD_REQUEST_TIMEOUT variable PCPEnvironment Variablesremote connection Cannot Connect to Remote PMCDstarting and stopping Starting and Stopping the PMCDTCP/IP firewall Running PCP Tools through aFirewall${PCP_PMCDCONF_PATH} file CommonDirectories and File Locations
pmcd tool (see PMCD)PMCD_CONNECT_TIMEOUT variable CannotConnect to Remote PMCD PCP Environment VariablesPMCD_PORT variable Running PCP Tools througha Firewall PMCD Does Not Start PCP EnvironmentVariablesPMCD_LOCAL variable Cannot Connect to RemotePMCD PCP Environment VariablesPMCD_RECONNECT_TIMEOUT variable PCPEnvironment VariablesPMCD_REQUEST_TIMEOUT variable PCPEnvironment Variablespmcd_wait tool Collecting, Transporting, and ArchivingPerformance Informationpmcd.conf file The pmcd.conf File Controlling Accessto PMCD with pmcd.confpmchart tool
brief description Performance Monitoring andVisualizationfetching metrics Fetching Metrics from Another Hostman example Monitoring System Performancerecord mode PCP Archive Foliosremote PMCD Cannot Connect to Remote PMCDshort-term executions Directory Organization forArchive Log Files
pmclient tool Application and Agent DevelopmentApplication and Agent Developmentpcp-collectl tool
brief description Performance Monitoring andVisualizationrecord mode PCP Archive Folios
pmconfirm commanderror messages PCP Environment Variablesvisible alarm Introduction to pmie
PMD PMDA Installation on a PCP Collector HostAcronymsPMDA
acronym Acronymscollectors Collector and Monitor Rolescustomizing Customizing the Summary PMDAdevelopment PMDA Developmentinstallation PMDA Installation on a PCP CollectorHostinstance names pmie Metric Expressionslibraries PCP Extensibilitymanaging optional agents Managing Optional PMDAs
108

Index
monitoring utilities Performance Co-Pilot DeploymentStrategiesremoval PMDA Removal on a PCP Collector Hostunification Unification of Performance MetricDomains
pmdaapache tool Collecting, Transporting, and ArchivingPerformance Informationpmdacisco tool Collecting, Transporting, and ArchivingPerformance Informationpmdaelasticsearch tool Collecting, Transporting, andArchiving Performance Informationpmdagfs2 tool Collecting, Transporting, and ArchivingPerformance Informationpmdagluster tool Collecting, Transporting, and ArchivingPerformance Informationpmdainfiniband tool Collecting, Transporting, andArchiving Performance Informationpmdakvm tool Collecting, Transporting, and ArchivingPerformance Informationpmdalustrecomm tool Collecting, Transporting, andArchiving Performance Informationpmdamailq tool Collecting, Transporting, and ArchivingPerformance Informationpmdamemcache tool Collecting, Transporting, andArchiving Performance Informationpmdammv tool Collecting, Transporting, and ArchivingPerformance Informationpmdamysql tool Collecting, Transporting, and ArchivingPerformance Informationpmdanamed tool Collecting, Transporting, and ArchivingPerformance Informationpmdanginx tool Collecting, Transporting, and ArchivingPerformance Informationpmdapostfix tool Collecting, Transporting, and ArchivingPerformance Informationpmdapostgresql tool Collecting, Transporting, andArchiving Performance Informationpmdaproc tool Collecting, Transporting, and ArchivingPerformance Informationpmdarsyslog tool Collecting, Transporting, andArchiving Performance Informationpmdasamba tool Collecting, Transporting, and ArchivingPerformance Informationpmdasendmail tool Collecting, Transporting, andArchiving Performance Informationpmdasnmp tool Collecting, Transporting, and ArchivingPerformance Informationpmdasummary tool Collecting, Transporting, andArchiving Performance Informationpmdasystemd tool Collecting, Transporting, andArchiving Performance Informationpmdavmware tool Collecting, Transporting, andArchiving Performance Information
pmdaweblog tool Collecting, Transporting, andArchiving Performance Informationpmdaxfs tool Collecting, Transporting, and ArchivingPerformance Informationpmdbg facility Operational and Infrastructure Supportpmdumplog tool
archive log contents PCP Archive Contentsbrief description Collecting, Transporting, andArchiving Performance Informationtroubleshooting Cannot Find Log
pmrep toolbrief description Performance Monitoring andVisualizationdescription The pmrep Command
pmerr tool Operational and Infrastructure Supportpmgenmap tool Application and Agent Developmentpmhostname tool Operational and Infrastructure SupportPMID
acronym Acronymsdescription Sources of Performance Metrics and TheirDomains Performance Metrics Name SpacePMNS names Customizing the Summary PMDAprinting The pminfo Command
pmie tool%-token pmie Rule Expressionsarithmetic aggregation Arithmetic Aggregationarithmetic expressions pmie Arithmetic Expressionsautomated reasoning Introduction to pmiebasic examples Basic pmie Usagebrief description Performance Monitoring andVisualization Operational and Infrastructure Supportcustomization Introduction to pmiedeveloping rules Developing and Debugging pmieRuleserror detection pmie Error Detectionexamples Simple pmie Usage Complex pmieExamplesfetching metrics Fetching Metrics from Another Hostglobal files and directories Global Files andDirectoriesinstance names pmie Instance Namesintrinsic operators pmie Intrinsic Operatorslanguage Introduction to pmie Specification Languagefor pmielogical expressions pmie Logical Expressionsmetric expressions pmie Metric Expressionsperformance metrics inference engine PerformanceMetrics Inference Enginepmieconf rules Performance Monitoring andVisualization Creating pmie Rules with pmieconfprocedures Creating pmie Rules with pmieconfManagement of pmie Processesrate conversion pmie Rate Conversionrate operator The rate Operator
109

Index
real examples pmie Examplesremote PMCD Cannot Connect to Remote PMCDsample intervals pmie Sample Intervalssetting evaluation frequency Setting EvaluationFrequencysyntax Basic pmie Syntaxtransitional operators Transitional Operators
pmevent toolbrief description Performance Monitoring andVisualization
pmieconf toolbrief description Performance Monitoring andVisualizationcustomization Introduction to pmierules Creating pmie Rules with pmieconf
pminfo toolbrief description Performance Monitoring andVisualizationdescription The pminfo Commanddisplaying the PMNS Performance Metrics NameSpacePCP Tutorials and Case Studies The pminfoCommandpmie arguments pmie and the Performance MetricsCollection System
pmstat toolbrief description Performance Monitoring andVisualizationdescription The pmstat Command
pmlc toolbrief description Collecting, Transporting, andArchiving Performance Informationdescription Using pmlcdynamic adjustment Introduction to Archive Loggingflush command Coordination between pmlogger andPCP toolsPMLOGGER_PORT variable PCP EnvironmentVariablesPMLOGGER_LOCAL variable PCP EnvironmentVariablesshow command Primary pmlogger Cannot StartSIGHUP signal Log VolumesTCP/IP firewall Running PCP Tools through aFirewall
pmlock tool Operational and Infrastructure Supportpmlogcheck tool Collecting, Transporting, and ArchivingPerformance Informationpmlogconf tool Collecting, Transporting, and ArchivingPerformance Informationpmlogextract tool Collecting, Transporting, andArchiving Performance Information ManipulatingArchive Logs with pmlogextractpmlogger tool PCP Environment Variables pmie RuleExpressions
archive logs Fetching Metrics from an Archive LogIntroduction to Archive Loggingbrief description Collecting, Transporting, andArchiving Performance Informationconfiguration Configuration of pmlogger Using pmlccookbook tasks Cookbook for Archive Loggingcurrent metric context Current Metric Contextfolios PCP Archive FoliosPCP tool coordination Coordination betweenpmlogger and PCP toolspmlc control Introduction to Archive Loggingprimary instance Primary Loggerremote PMCD Cannot Connect to Remote PMCDTCP/IP firewall Running PCP Tools through aFirewalltroubleshooting Archive Logging Troubleshooting
pmlogger_check script Operational and InfrastructureSupport Administering PCP Archive Logs Using cronScriptspmlogger_daily script Operational and InfrastructureSupport Administering PCP Archive Logs Using cronScriptspmlogger_merge script Operational and InfrastructureSupport Administering PCP Archive Logs Using cronScriptsPMLOGGER_PORT variable Running PCP Toolsthrough a Firewall PCP Environment VariablesPMLOGGER_LOCAL variable PCP EnvironmentVariablespmlogsummary tool Performance Monitoring andVisualization Summarizing Archive Logs withpmlogsummarypmnewlog tool Operational and Infrastructure SupportPMNS
acronym Acronymsbrief description Performance Metricsdefined names Uniform Naming and Access toPerformance Metricsdescription Performance Metrics Name Spacemanagement PMNS Managementmetric expressions pmie Metric Expressionsnames Customizing the Summary PMDAPMNS Alternate Performance Metric Name Spacessyntax PMNS Syntaxtroubleshooting Performance Metrics Name Space
PMPROXY_PORT variable PCP Environment VariablesPMPROXY_LOCAL variable PCP EnvironmentVariablespmnsadd tool Operational and Infrastructure Supportpmnsdel tool Operational and Infrastructure Supportpmprintf tool PCP Environment Variablespmprobe tool Performance Monitoring and Visualizationpmrun tool Common Conventions and Argumentspmsnap tool
110

Index
brief description Operational and InfrastructureSupportscript usage Administering PCP Archive Logs Usingcron Scripts
pmproxy toolbrief description Performance Monitoring andVisualizationpmproxy port PCP Environment Variablespmproxy local PCP Environment VariablesTCP/IP firewall Running PCP Tools through aFirewall
pmstore toolbrief description Operational and InfrastructureSupportdescription The pmstore Commandsetting metric values Monitoring System Performance
pmtrace tool Collecting, Transporting, and ArchivingPerformance Informationpmval tool
brief description Performance Monitoring andVisualizationdescription The pmval Command
pmwebd tool Collecting, Transporting, and ArchivingPerformance Informationprimary archive Primary Loggerprimary logger Primary Loggerprotocol data units (see PDU)quantification operators Quantification Operatorsrate conversion pmie Rate Conversionrate operator The rate Operatorrelational expressions Relational Expressionsreporting frequency Performance Monitor ReportingFrequency and Durationretrospective analysis Retrospective Analysis UsingArchive Logsroles
collector Collector and Monitor Roles ProductStructuremonitor Collector and Monitor Roles ProductStructure
rule expressions pmie Rule Expressionssample intervals pmie Sample Intervalskernel data structures Sources of Performance Metricsand Their Domainsscripts Operational and Infrastructure SupportAdministering PCP Archive Logs Using cron Scriptsservice management Quality of Service Measurementset-valued performance metrics Set-Valued PerformanceMetricsshow command Primary pmlogger Cannot StartSIGHUP signal PMCD Not Reconfiguring after SIGHUPLog VolumesSIGINT signal Primary pmlogger Cannot Start
SIGUSR1 signal Coordination between pmlogger andPCP toolssingle-valued performance metrics Single-ValuedPerformance MetricsPROXY protocol Running PCP Tools through a Firewallsoftware Overview of Component Softwaresubsystems Product Structuresum_host operator Arithmetic Aggregationsyntax PMNS Syntaxsyslog function Introduction to pmie pmie RuleExpressionssystem log file Introduction to pmie pmie RuleExpressionstarget usage PCP Target UsageTCP/IP
acronym Acronymscollector and monitor hosts Running PCP Toolsthrough a Firewallremote PMCD Cannot Connect to Remote PMCDsockets PCP Environment Variables
text-based tools Monitoring System Performancetime dilation Time Dilation and Time Skewtime duration Time Duration and Controltime window options Time Window Optionstime-stamped message pmie Rule Expressionstimezone options Timezone Optionstool customization PCP Tool Customizationtool development PCP Tool Developmenttool options General PCP Tool Options PerformanceMetrics Inference Enginetransient problems Transient Problems with PerformanceMetric Valuestransitional operators Transitional Operatorstroubleshooting
archive logging Archive Logging Troubleshootinggeneral utilities Cannot Connect to Remote PMCDkernel metrics Kernel Metrics and the PMCDPMCD Troubleshooting Kernel Metrics and thePMCD
uniform naming Uniform Naming and Access toPerformance Metricsunits Unitsuser interface components Common Conventions andArguments${PCP_BINADM_DIR}/pmcd file Common Directoriesand File Locations${PCP_LOG_DIR}/NOTICES file Introduction to pmie${PCP_LOGDIR}/pmcd/pmcd.log file PMCD Does NotStart${PCP_PMCDOPTIONS_PATH} file CommonDirectories and File Locations${PCP_PMCDCONF_PATH} filePMDA Installation ona PCP Collector Host PMCD Not Reconfiguring afterSIGHUP Common Directories and File Locations
111

Index
${PCP_SYSCONF_DIR}/pmlogger/config.default filePrimary Logger${PCP_PMLOGGERCONTROL_PATH} fileAdministering PCP Archive Logs Using cron ScriptsDirectory Organization for Archive Log Files${PCP_DEMOS_DIR} pmie Examples${PCP_VAR_DIR}/pmns/stdpmid file PMDAInstallation on a PCP Collector Host${PCP_TMP_DIR}/pmlogger files Primary pmloggerCannot Startwindow options Time Window Options
112