performance evaluation and benchmarking of dbmss · performance evaluation and benchmarking of...
TRANSCRIPT
Performance evaluation and benchmarking of DBMSsbenchmarking of DBMSsINF5100 Autumn 2007Jarle Søberg
Overview
• What is performance evaluation and benchmarking?
• Theory• Examples
• Domain-specific benchmarks and benchmarking DBMSs
INF5100 © 2007 Jarle Søberg 2
DBMSs• We focus on the most popular one: TPC
What is benchmarking?
1. Evaluation techniques and metrics2. Workload3. Workload characterization4. Monitors5. Running the tasks6. Analysis
INF5100 © 2007 Jarle Søberg 3
6. Analysis7. Representation
Evaluation techniques and metrics
• Examining systems with respect to one or more metrics• Speed• Accuracy• Availability• Response time• Throughput• Etc.
• An example: Early processor benchmarking based on the
Criteria to comparethe performance
INF5100 © 2007 Jarle Søberg 4
• An example: Early processor benchmarking based on the speed of the addition instruction
• Metric selection is based on evaluation technique
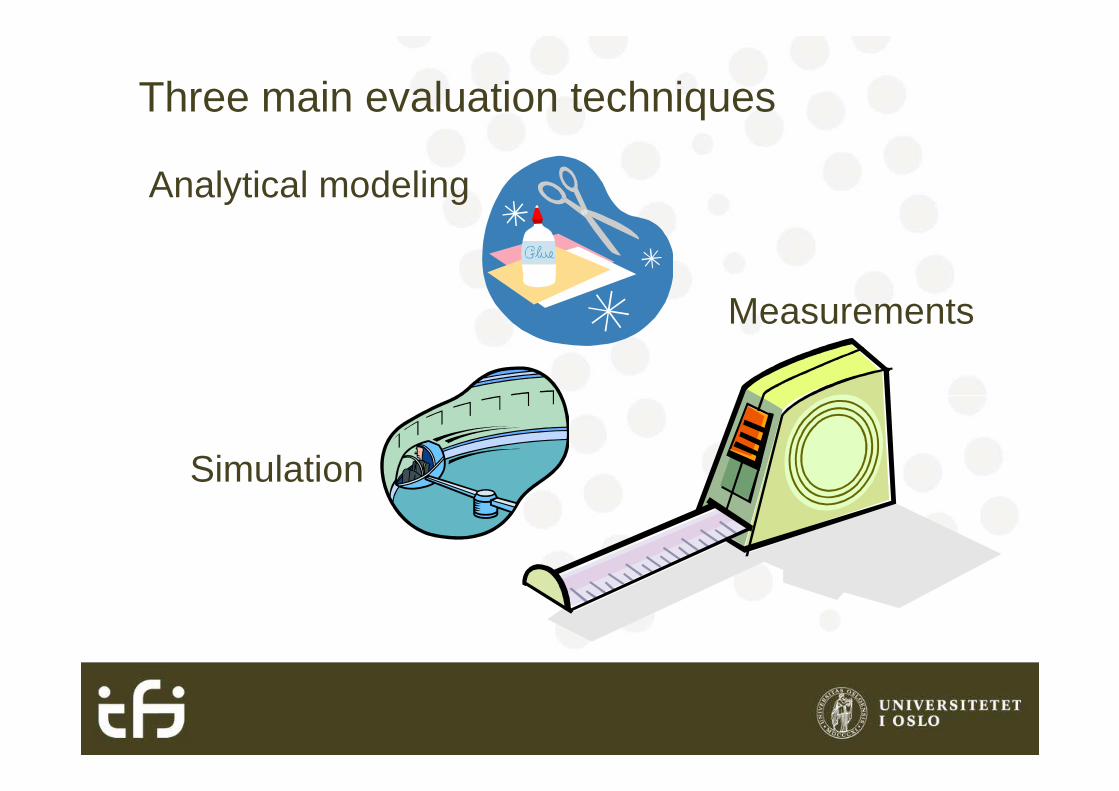
Three main evaluation techniques
Analytical modeling
Measurements
Simulation
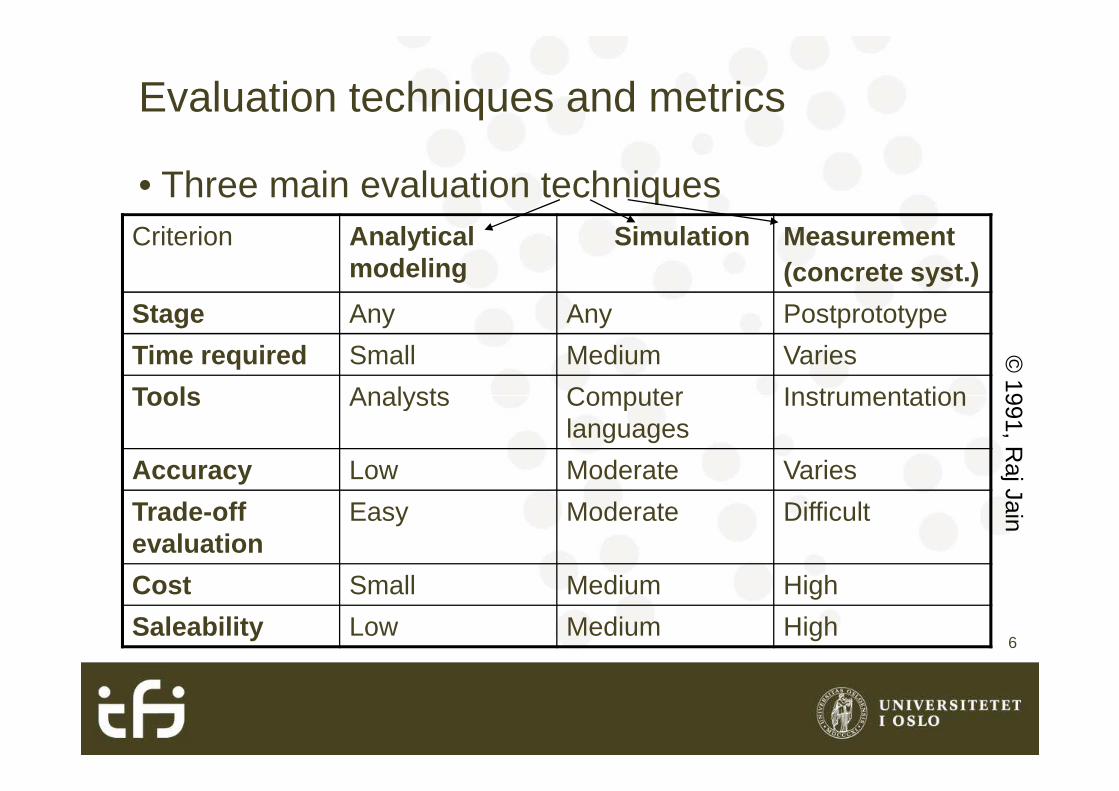
Evaluation techniques and metrics
• Three main evaluation techniquesCriterion Analytical
modelingSimulation Measurement
(concrete syst.)
Stage Any Any Postprototype
Time required Small Medium Varies
Tools Analysts Computer Instrumentation
© 1991, R
aj Jain
6
Tools Analysts Computer languages
Instrumentation
Accuracy Low Moderate Varies
Trade-off evaluation
Easy Moderate Difficult
Cost Small Medium High
Saleability Low Medium High
© 1991, R
aj Jain
What is benchmarking?
• “benchmark v. trans. To subject (a system) to a series of tests in order to obtain prearranged results not available on competitive systems”
• S. Kelly-Bootle
INF5100 © 2007 Jarle Søberg 7
The Devil’s DP Dictionary
In other words: Benchmarks are measurements used to differ two or more systems
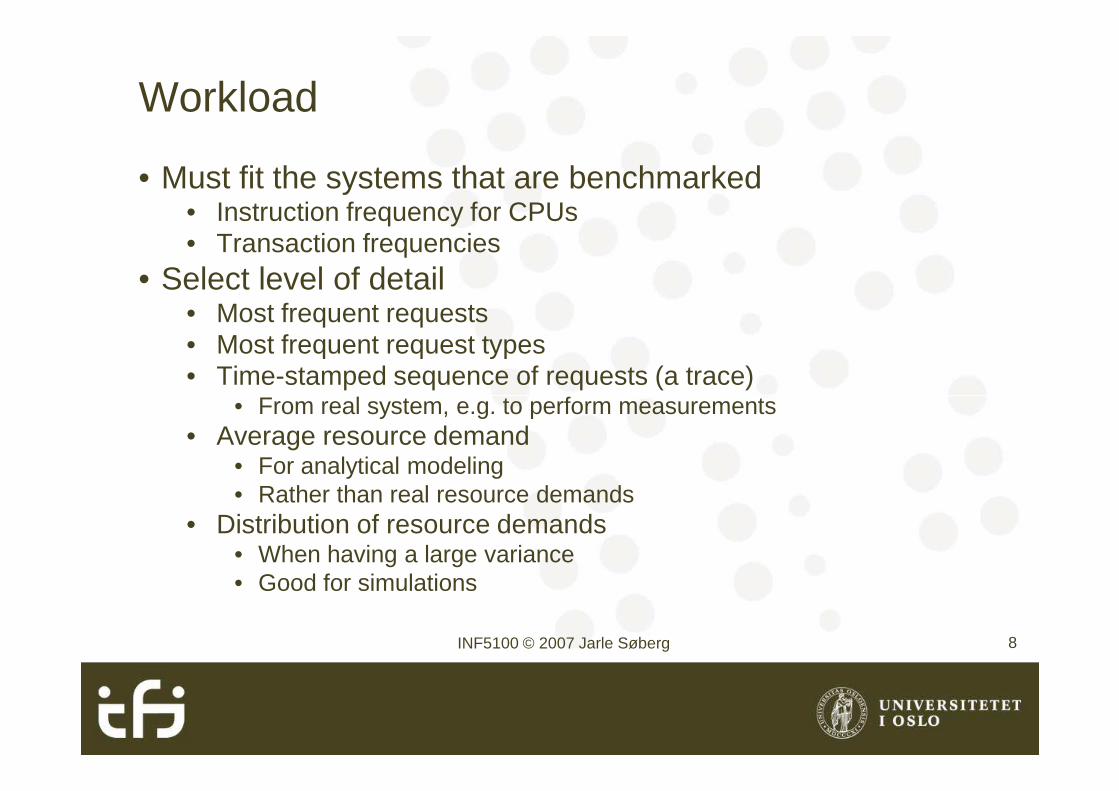
Workload
• Must fit the systems that are benchmarked• Instruction frequency for CPUs• Transaction frequencies
• Select level of detail• Most frequent requests• Most frequent request types• Time-stamped sequence of requests (a trace)
• From real system, e.g. to perform measurements
INF5100 © 2007 Jarle Søberg 8
• From real system, e.g. to perform measurements• Average resource demand
• For analytical modeling• Rather than real resource demands
• Distribution of resource demands• When having a large variance• Good for simulations
Workload
• Representativeness• Arrival rate• Resource demands• Resource usage profile
• Timeliness• Workload should represent usage patterns
INF5100 © 2007 Jarle Søberg 9
• Workload should represent usage patterns
Workload characterization
• Repeatability is important• Observe real-user behavior and create a
repeatable workload based on that• One should only need to change workload
parameters
INF5100 © 2007 Jarle Søberg 10
• Transaction types• Instructions• Packet sizes• Source/destinations of packets• Page reference patterns
Monitors
• Observe the activities on a system• Performance• Collect statistics• Analyze data• Display results• Either monitor all activities or sample
INF5100 © 2007 Jarle Søberg 11
• Either monitor all activities or sample• E.g. top monitor update in Linux
• On-line• Continuously display system state
• Batch• Collect data and analyze later
Benchmarking: Represented by common mistakes• Only average behavior represented in test
workload• Variance is ignored
• Skewness of device demands ignored• Evenly distribution of I/O or network requests during
test, which might not be the case in real environments
INF5100 © 2007 Jarle Søberg 12
• Loading level controlled inappropriately• Think time and number of users increased/decreased
inappropriately• Caching effects ignored
• Order of arrival for requests
Common mistakes in benchmarking
• Buffering sizes not appropriate• Should represent the values used in production
systems
• Inaccuracies due to sampling ignored• Make sure to use accurate sampled data
• Ignoring monitoring overhead
INF5100 © 2007 Jarle Søberg 13
• Ignoring monitoring overhead• Not validating measurements
• Is the measured data correct?
• Not ensuring same initial conditions• Disk space, starting time of monitors, etc.
Common mistakes in benchmarking
• Not measuring transient performance• Depending on the system, but if the system is more in
transitions than steady states, this has to be considered: Know your system!
• Collecting too much data but doing very little analysis
INF5100 © 2007 Jarle Søberg 14
analysis• In measurements, often all time is used to obtain the
data, but less time is available to analyze it• It is more fun to experiment that analyze the data• It is hard to use statistical techniques to get significant
results; let’s just show the average
The art of data presentation
It is not what you say, but how you say it.- A. Putt
• Results from performance evaluations aim to help in decision making
• Decision makers do not have time to dig into • Decision makers do not have time to dig into complex result sets
• Requires prudent use of words, pictures, and graphs to explain the results and the analysis
INF5100 © 2007 Jarle Søberg 15
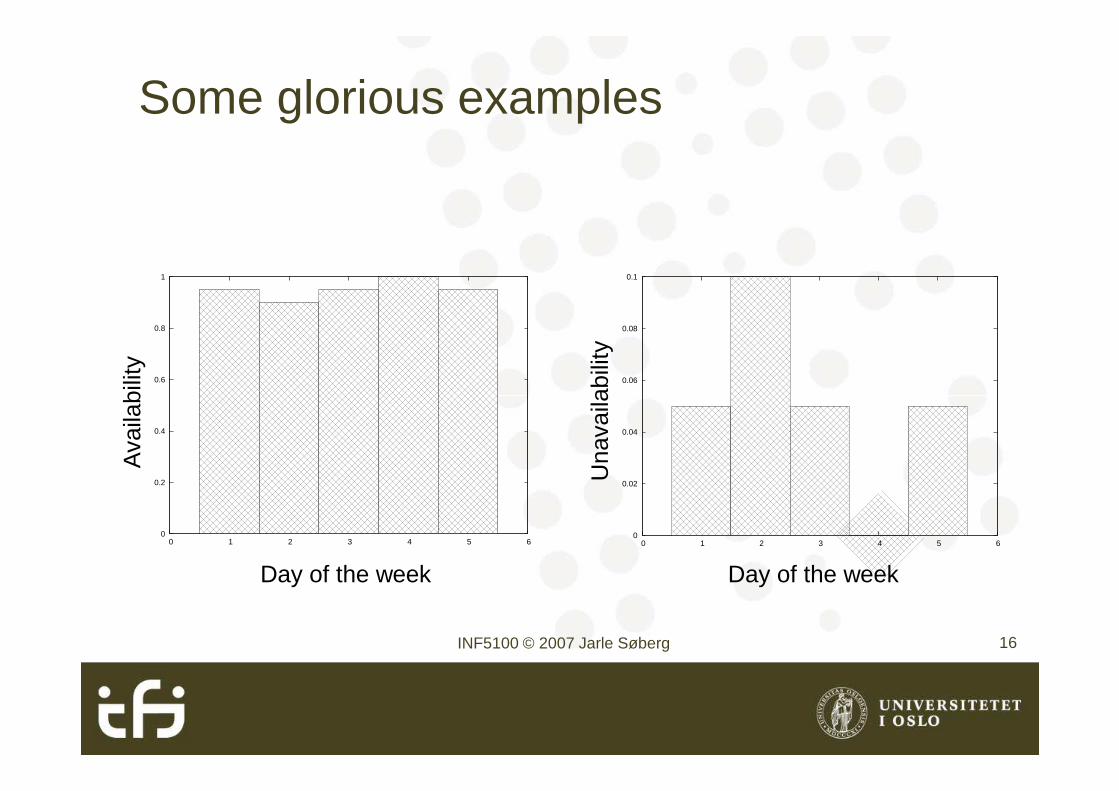
Some glorious examples
0.6
0.8
1
0.06
0.08
0.1
Ava
ilabi
lity
Una
vaila
bilit
y
INF5100 © 2007 Jarle Søberg 16
0
0.2
0.4
0 1 2 3 4 5 6 0
0.02
0.04
0 1 2 3 4 5 6
Ava
ilabi
lity
Una
vaila
bilit
yDay of the week Day of the week
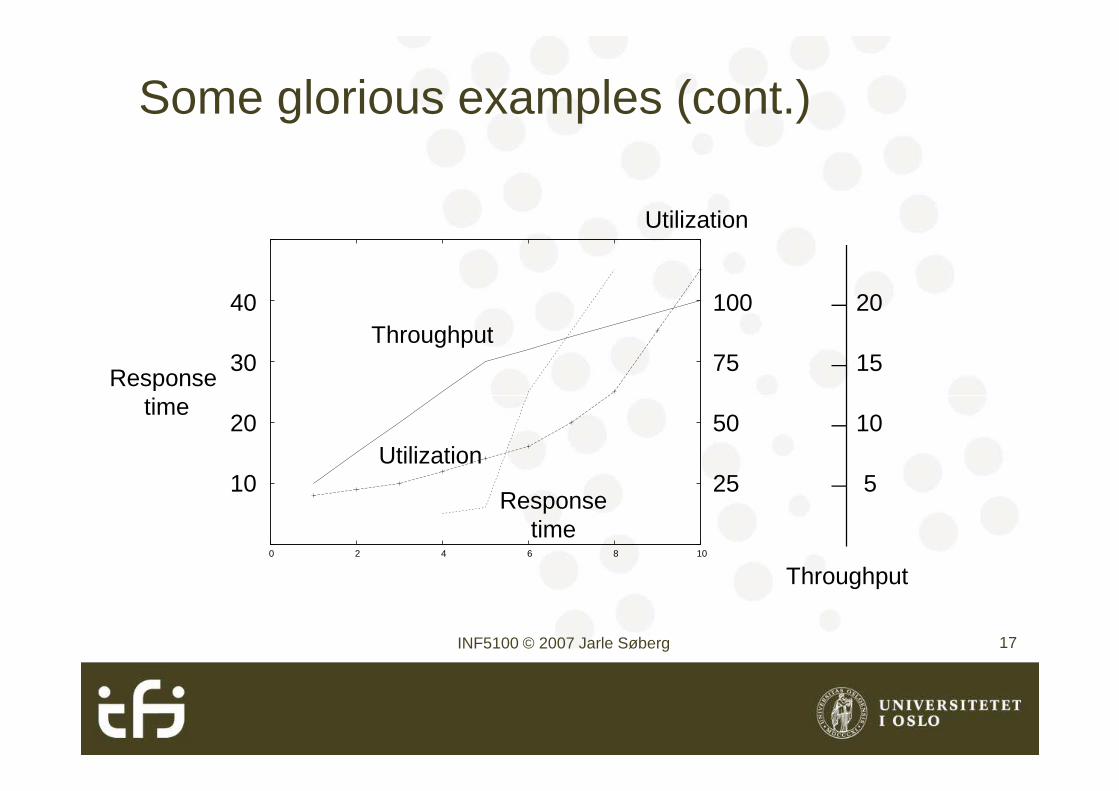
Some glorious examples (cont.)
30
40
50
40
30Response
time
100
75
Utilization
20
15Throughput
INF5100 © 2007 Jarle Søberg 17
0
10
20
0 2 4 6 8 10
20
10
time50
25
Throughput
10
5Utilization
Responsetime
Domain-specific benchmarks
• No single metric can measure the performance of computer systems on all applications
• Simple update-intensive transactions for online databases
vs.• Speed in decision-support queries
INF5100 © 2007 Jarle Søberg 18
• Speed in decision-support queries
The key criteria for a domain-specific benchmark• Relevant
• Perform typical operations within the problem domain
• Portable• The benchmark should be easy to implement and run
on many different systems and architectures
• Scaleable
INF5100 © 2007 Jarle Søberg 19
• Scaleable• To larger systems or parallel systems as they evolve
• Simple• It should be understandable in order to maintain
credibility
TPC: Transaction Processing Performance Council• Background
• IBM released an early benchmark, TP1, in early 80’s• ATM transactions in batch-mode
• No user interaction• No network interaction
• Originally internally used at IBM, and thus poorly defined• Exploited by many commercial vendors
• Anon (i.e. Gray) et al. released a more well thought of benchmark, DebitCredit, in 1985benchmark, DebitCredit, in 1985
• Total system cost published with the performance rating• Test specified in terms of high-level functional requirements• The benchmark workload scale-up rules• The overall transaction rate would be constrained by a response
time requirement
• Vendors often deleted key requirements in DebitCredit to improve their performance results
TPC: Transaction Processing Performance Council• A need for a more standardized benchmark • In 1988, eight companies came together and
formed TPC
• Started making benchmarks based on the • Started making benchmarks based on the domains used in DebitCredit.
Early (and obsolete) TPCs
• TPC-A• 90 percent of transactions must complete in less than 2
seconds• 10 ATM terminals per system and the cost of the terminals was
included in the system price• Could be run in a local or wide-area network configuration
• DebitCredit has specified only WANs• The ACID requirements were bolstered and specific tests added
to ensure ACID viabilityto ensure ACID viability• TPC-A specified that all benchmark testing data should be
publicly disclosed in a Full Disclosure Report• TPC-B
• Vendors complained about all the extra in TPC-A• Vendors of servers were not interested in adding terminals and
networks• TPC-B was a standardization of TP1
TPC-C
• On-line transaction processing (OLTP)• More complex than TPC-A• Handles orders in warehouses
• 10 sales districts• 3000 costumers
• Each warehouse must cooperate with the other • Each warehouse must cooperate with the other warehouses to complete orders
• TPC-C measures how many complete business operations can be processed per minute
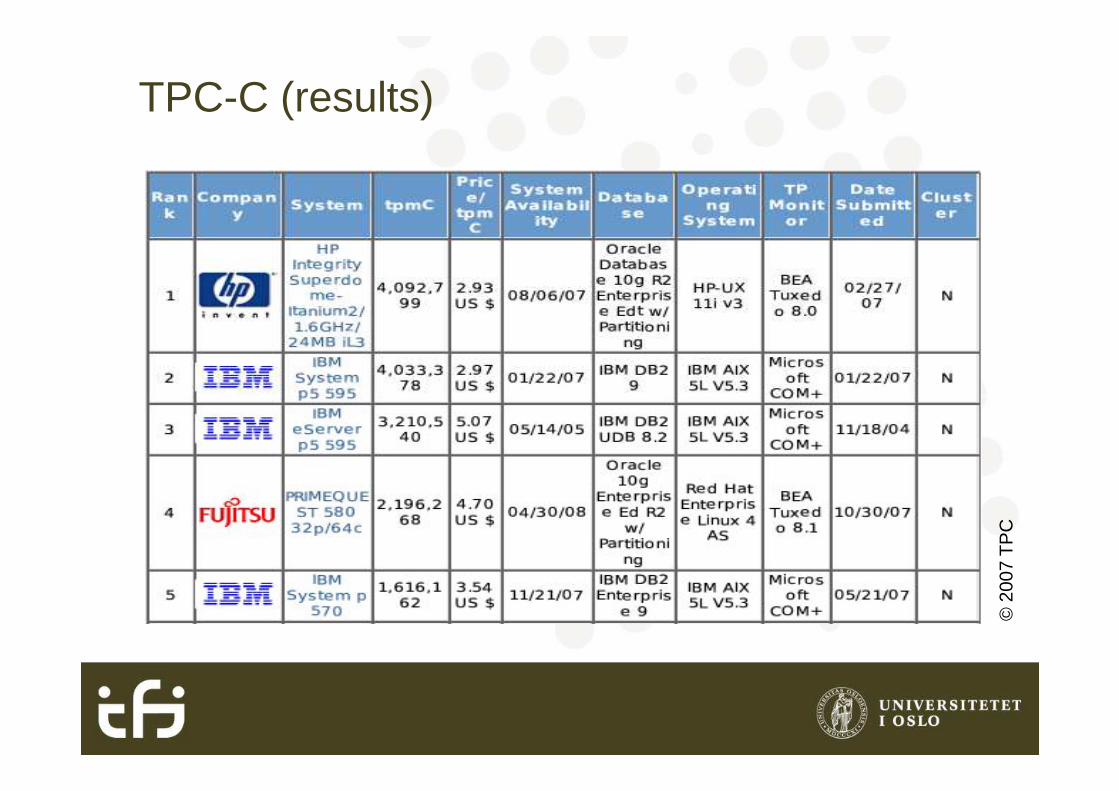
TPC-C (results)
© 2
007
TP
C
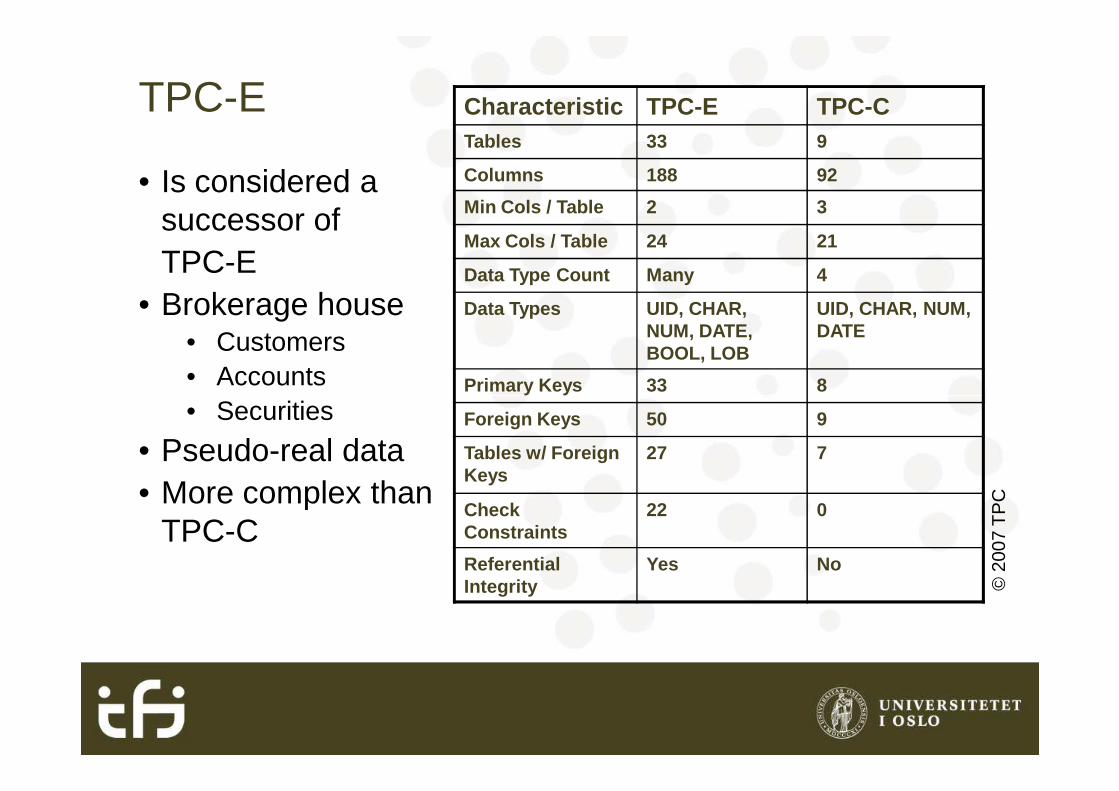
TPC-E
• Is considered a successor of TPC-E
• Brokerage house• Customers• Accounts
Characteristic TPC-E TPC-CTables 33 9
Columns 188 92
Min Cols / Table 2 3
Max Cols / Table 24 21
Data Type Count Many 4
Data Types UID, CHAR, NUM, DATE, BOOL, LOB
UID, CHAR, NUM, DATE
Primary Keys 33 8
• Securities
• Pseudo-real data• More complex than
TPC-C
Foreign Keys 50 9
Tables w/ Foreign Keys
27 7
Check Constraints
22 0
Referential Integrity
Yes No
© 2
007
TP
C
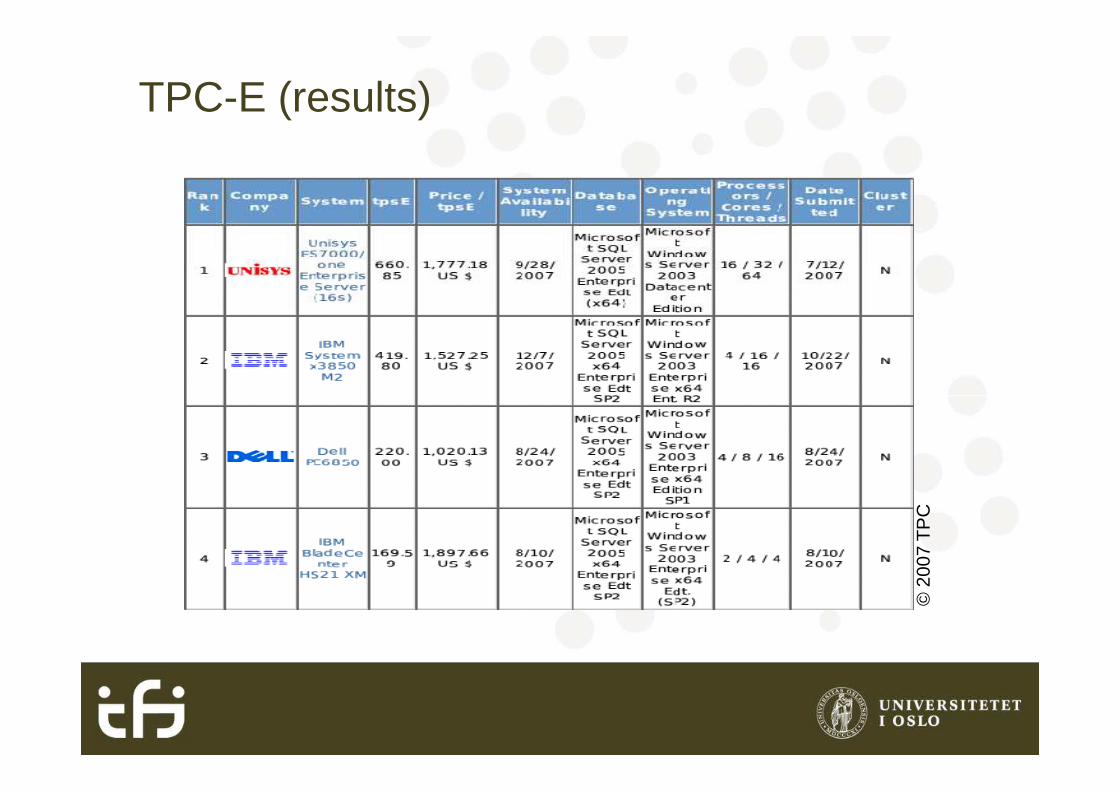
TPC-E (results)
© 2
007
TP
C
TPC-H
• Decision support• Simulates an environment in which users connected to
the database system send individual queries that are not known in advance
• Metric• Metric• Composite Query-per-Hour Performance Metric (QphH@Size)
• Selected database size against which the queries are executed• The query processing power when queries are submitted by a
single stream• The query throughput when queries are submitted by multiple
concurrent users
Reference
• The Art of Computer Systems Performance Analysis
• Raj Jain, 1991• The Benchmark Handbook for Database and
Transaction Processing Systems• Jim Gray, 1991
INF5100 © 2007 Jarle Søberg 28
• Jim Gray, 1991• The TPC homepage: www.tpc.org• Poess, M. and Floyd, C. 2000. New TPC
benchmarks for decision support and web commerce. SIGMOD Rec. 29, 4 (Dec. 2000), 64-71