performance evaluation in ation and compression - cmu · pdf fileperformance evaluation in...
TRANSCRIPT
Performance Evaluation Inflation and Compression
Russell Golman and Sudeep Bhatia ∗
August 29, 2012
∗Department of Social and Decision Sciences, Carnegie Mellon University, 5000 Forbes Ave,
Pittsburgh, PA 15213, USA. E-mail: [email protected]; [email protected]
1
Abstract
We provide a behavioral account of subjective performance evaluation inflation
(i.e., leniency bias) and compression (i.e., centrality bias). When a manager observes
noisy signals of employee performance and the manager strives to produce accurate
ratings but feels worse about unfavorable errors than about favorable errors, the man-
ager’s selfishly optimal ratings will be biased upwards. Both the uncertainty about
performance and the asymmetry in the manager’s utility are necessary conditions for
performance evaluation inflation. Moreover, the extent of the bias is increasing in
the variance of the performance signal and in the asymmetry in aversion to unfair
ratings. Uncertainty about performance also leads to compressed ratings. These re-
sults suggest that performance appraisals based on well-defined unambiguous criteria
will have less bias. Additionally, we demonstrate that employer and employee can
account for biased performance evaluations when they agree to a contract, and thus,
to the extent leniency bias and centrality bias persist, these biases hurt employee
performance and lower firm productivity.
Keywords: centrality bias, leniency bias, noisy signals, performance appraisal,
subjective performance evaluation
JEL classification codes: D82, D86, J30, M52
2
1 Introduction
Subjective performance evaluation is a powerful informational tool for an organi-
zation. It allows employers to determine compensation and job assignments, and
to provide feedback when objective measures are costly, inaccurate or unavailable
(Baker, Gibbons, & Murphy, 1994; Murphy, 1999; Prendergast, 1999). More than
70% of firms utilize a formal employee performance appraisal mechanism (Murphy
& Cleveland, 1991). Subjective evaluations also play an important role in worker
recruitment, with roughly half of all workers finding jobs through external references
(Montgomery, 1991).
Despite its importance for human resource accounting and management, subjec-
tive performance evaluation has a number of problems. Researchers in psychology,
accounting and organizational behavior have found that subjective evaluations suffer
from severe leniency effects. Performance appraisal ratings display an upward bias
(Bol, 2011; Saal & Landy, 1977), with 60 to 70% of those being assessed rated in the
top two categories of five-point rating scales (Bretz, Milkovich, & Read, 1992). This
effect is more pronounced in settings where subjective performance ratings are used
to determine worker compensation (Jawahar & Williams, 1997), in settings where in-
formation about the employee’s true competence is scarce (Bol, 2011), and in settings
where the manager and employee have a particularly strong relationship (Bol, 2011;
Lawler, 1990; Murphy & Cleveland 1991). Performance evaluations also are shown
to display a centrality bias with supervisors compressing ratings so that they differ
3
little from the norm (Moers, 2005; Prendergast, 1999).
These biases1 have been documented through surveys of organizations and prac-
titioners (Murphy & Cleveland, 1995), laboratory studies (Bernardin, Cooke, & Vil-
lanova, 2000; Kane, Bernardin, Villanova, & Payrefitte, 1995) and archival data sets
of firms (Bol, 2011; Moers, 2005). In general, they can generate a Lake Wobegon
Effect with almost everyone rated above average (Moran & Morgan, 2003). Besides
reducing the informational value of performance evaluations, such biases also distort
wages and can impact worker effort and firm productivity.
Given the prevalence of leniency and centrality biases, it has been suggested that
managers willfully alter ratings in order to help workers, improve training or avoid
conflict (Levy & Williams, 2004; Longenecker, Sims, & Gioia, 1987; Prendergast &
Topel, 1996; Prendergast, 2002). It is not the case, however, that managers neces-
sarily have explicit preferences for inflated evaluations. In this paper, we provide an
alternative model of performance evaluation, which assumes that managers prefer to
issue accurate ratings, but also have an asymmetry in their aversion to undeservedly
high and undeservedly low evaluations. This asymmetry can stem from a number of
different causes: the manager may be sympathetic towards the employee, as assumed
in recent work (Giebe & Gurtler, 2012; Grund & Przemeck, 2012), or the manager
may be indifferent towards the employee’s wellbeing, but may not want to discour-
1In this paper ‘bias’ refers to the aforementioned leniency and centrality biases rather than to the
more pernicious demographic biases that also plague performance evaluation (Castilla & Benard,
2010).
4
age the employee with unfairly low ratings. In either case, managers prefer accurate
ratings, and biases arise only in the face of uncertainty.
Uncertainty about worker evaluation plays a crucial role in our model. Job perfor-
mance measures suffer from some imprecision or measurement error (Landy & Farr,
1980; Murphy, 2008), and in order to make a subjective evaluation, managers must
aggregate noisy signals of job performance with prior information about employee
competence (Banker & Datar, 1989). If the manager feels worse about unfavorable
errors than about favorable errors, then despite a desire to get it right, the manager’s
selfishly optimal evaluation will be higher than the best estimate given the employee’s
signal and the manager’s prior beliefs. Consequently, more than half the population
will be rated as above the actual average competence. Moreover, leniency bias, mea-
sured as the difference between the average rating in the population and the actual
average competence, will increase with the noisiness of the performance signal and the
asymmetry in the manager’s fairness preferences, as documented in empirical work
on subjective performance evaluation (Bol, 2011; Lawler, 1990; Murphy & Cleveland,
1991)2. In addition to this leniency bias, the manager’s evaluations will also display a
centrality bias. The distribution of the assigned ratings will have lower variance than
the underlying distribution of actual competence. This compression is also due to the
inherent noise in the signal. To make the best estimate of employee competence, the
2While our model accounts for the common finding that ratings are biased upwards, a natural
generalization could also describe raters who would prefer under-reporting performance to over-
reporting performance (Cheatham, Davis, & Cheatham, 1996).
5
manager discounts the magnitude of the signal to account for this noise. Leniency
and centrality biases both arise from the same assumptions in our model, and the
combined effect is that the least competent employees get the most inflated ratings.
After proposing our account for the leniency and centrality effects in subjective
performance evaluations, we consider incentive contracts involving sophisticated prin-
cipals and agents. We assume that the firm derives organizational capital from more
accurate (more informative) subjective evaluations, as well as, of course, profits from
the employee’s effort. We consider managers with intrinsic motivation to provide
an accurate evaluation, but also some degree of altruism towards the employee. In
equilibrium the manager thus exhibits the aforementioned asymmetric aversion to
undeservedly high and undeservedly low ratings.
In anticipation of performance evaluation bias, employers adjust the compensa-
tion package they offer their employees. We show that the leniency and centrality
biases are detrimental to employee performance and thus costly to the firm in equi-
librium. Additionally, employees’ total wages decrease due to the manager’s leniency
as well as to the manger’s rating compression. Moreover, consistent with empirical
research (Jawahar & Williams, 1997), we show that leniency bias exists when the
manager’s evaluation is used to determine the employee’s pay and is increasing with
the manager’s altruism towards the employee.
The rest of the paper is organized as follows. Section 2 discusses subjective per-
formance evaluation and its associated biases in more detail. It also outlines recent
research on these biases, and highlights the ways that this paper expands on and
6
complements previous work. Section 3 provides a general mathematical model of
performance evaluation. Section 4 identifies leniency and centrality biases in the
manager’s ratings. Section 5 embeds this model within an incentive contract frame-
work and derives implications for employee performance and compensation. Section
6 concludes.
2 Subjective Performance Evaluation
Management researchers and economists have long been concerned with the role of
performance evaluation in incentive design and optimal contracting (Dutta, 2008;
Gibbons, 2005; Giebe & Gurtler, 2012; Holmstrom, 1979). Traditionally it was as-
sumed that contracts specify compensation as a function of a single, verifiable (possi-
bly noisy) performance measure. This performance measures is generally required to
be objective, as auditors consider objective measures to be reliable and verifiable. Ob-
jective performance measures alone may distort incentives, however, leading agents to
choose selfishly optimal behavior that is harmful to the employer (Baker, 1992; Holm-
strom, 1979; Holmstrom & Milgrom, 1991). Firms should use performance measures
that capture the full value of the employee’s actions, including measures that are
based on opinions and other subjective judgments. For this reason, subjective eval-
uation is often incorporated as part of an optimal contract (Baiman & Rajan, 1995;
Baker et al., 1994). Indeed, a firm’s future performance can be predicted by previous
discretionary compensation, suggesting that agents are rewarded for good work even
7
in settings where the objective returns are delayed into the future (Hayes & Shaefer,
2000).
Subjective performance evaluation, however, suffers from two important limita-
tions. In the absence of well-defined, objective criteria, raters are vulnerable to be-
havioral biases. Their evaluations are liable to both inflation and compression. The
former generates a leniency bias, according to which too many employees are rated
above average, whereas the latter generates a centrality bias, i.e., there is too little
variation in employee ratings. A stark example of these biases can be seen in Merck
& Co, Inc’s performance rating system during the 1980s. Murphy (1992) finds that
the vast majority of subjects at Merck received a rating in the top five categories of
a thirteen category rating scale. Furthermore, over 70% of these employees occupied
just three of the thirteen performance categories (see also Prendergast, 1999).
There have been two recent attempts to explain these performance evaluation
biases in the economics literature. Grund and Przemeck (2012) capture the leniency
and centrality effects by assuming that managers are altruistic, that workers are
inequality averse, and that managers trade off the benefits of helping their workers
against the costs of distorting their evaluations. Giebe and Gurtler (2012) similarly
assume that managers are altruistic towards the employees, and explore settings in
which optimal contracts can generate the leniency bias. More broadly, models of social
preference, such as inequality aversion (Fehr & Schmidt, 1999; Bolton & Ockenfels,
2000) have also been shown to account for a range of other anomalies in worker
and employer behavior, including increased worker effort in trust and gift-exchange
8
settings (Fehr, Kirchler, Weichbold, & Gachter, 1998), the use of unenforceable bonus
or trust contracts, or incomplete contracts, instead of standard incentive contracts
(Fehr & Schmidt, 2007), and the popularity of team-based incentives (Bartling, 2011;
Englmaier & Wambach, 2010).
In line with these models, as well as with empirical work demonstrating that social
factors influence a manager’s perceptions of employee performance (Johnson, Erez,
Kiker, & Motowidlo, 2002; Judge & Ferris, 1993; Levy & Williams, 2004), we too
assume an altruistic manager, but (unlike earlier theory papers) we still consider the
manager to be intrinsically motivated to produce accurate (fair) evaluations. More-
over, while we focus in Section 5 on altruism as the source of an asymmetry in the
manager’s aversion to unfair evaluations, we acknowledge that other motives, such
as a desire not to discourage the employee or a desire to avoid conflict, could play a
similar role and thus could also be responsible for leniency bias. In Sections 3 and 4
we analyze leniency and centrality bias due to noise in the performance signal, taking
the asymmetry in the manager’s utility as a primitive rather than assuming a par-
ticular source for it. Our premise is that managers may want to be fair (Maas, van
Rinsum, & Towry, 2009), but are still affected by considerations of workplace har-
mony or employee sympathy (Harris, 1994; Murphy, Cleveland, Skattebo, & Kinney,
2004). Recognizing that uncertainty about employee performance might be necessary
for both leniency and centrality bias helps us understand why these biases are of-
ten observed together. Additionally, by analyzing leniency and centrality bias within
an incentive contract framework, our model makes predictions about the impact of
9
these biases on compensation contracts, as well as on worker effort and firm pro-
ductivity. We derive comparative statics describing how the extent of these biases
and their adverse effects on employee effort, performance, and compensation depend
on contextual factors such as the strength of manager-employee relationships or the
amount of uncertainty in the performance measure. Our primary contribution in this
light is bringing together a behavioral economic theory of prosocial preferences with
a standard bayesian learning model and standard contract theory to explain robust
empirical findings on subjective evaluations.
3 A Mathematical Model of Performance Evalua-
tion
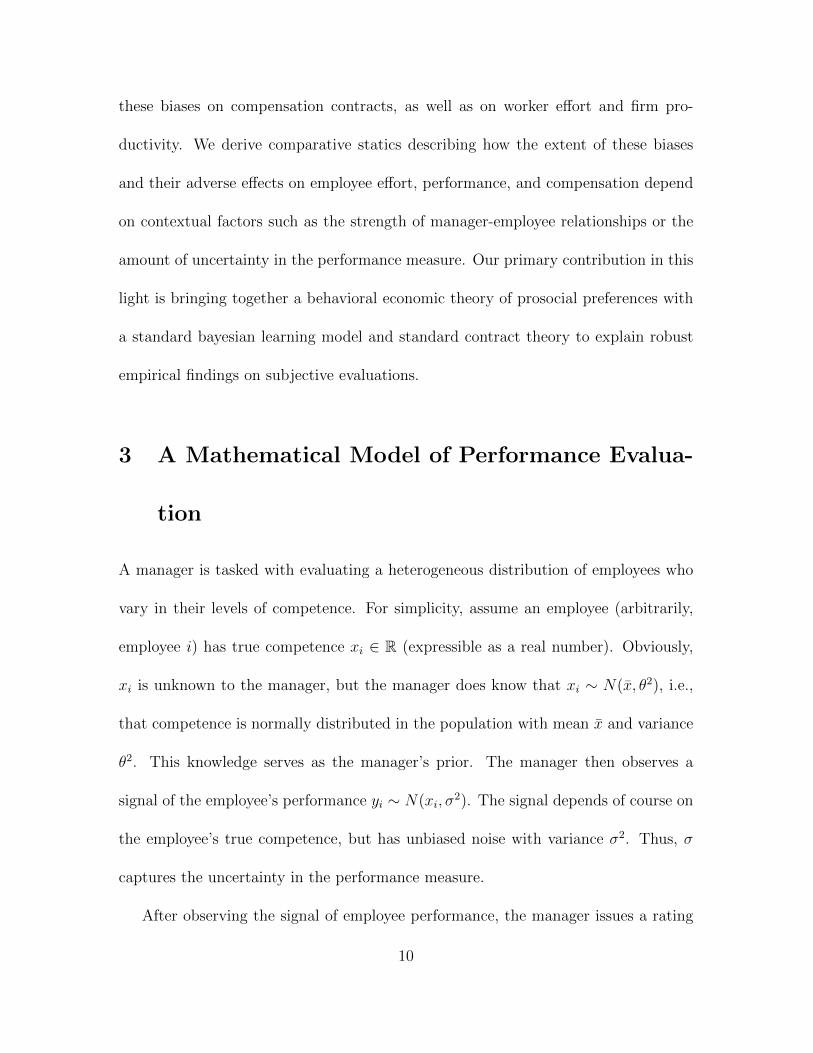
A manager is tasked with evaluating a heterogeneous distribution of employees who
vary in their levels of competence. For simplicity, assume an employee (arbitrarily,
employee i) has true competence xi ∈ R (expressible as a real number). Obviously,
xi is unknown to the manager, but the manager does know that xi ∼ N(x, θ2), i.e.,
that competence is normally distributed in the population with mean x and variance
θ2. This knowledge serves as the manager’s prior. The manager then observes a
signal of the employee’s performance yi ∼ N(xi, σ2). The signal depends of course on
the employee’s true competence, but has unbiased noise with variance σ2. Thus, σ
captures the uncertainty in the performance measure.
After observing the signal of employee performance, the manager issues a rating
10
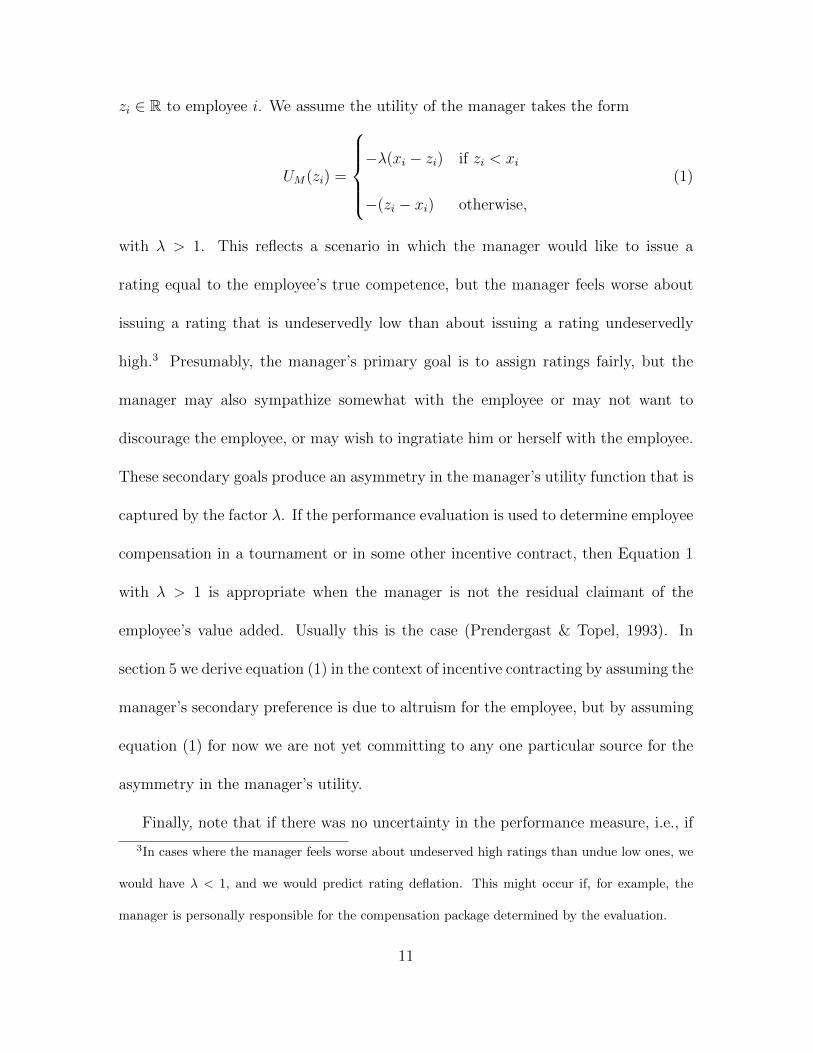
zi ∈ R to employee i. We assume the utility of the manager takes the form
UM(zi) =
−λ(xi − zi) if zi < xi
−(zi − xi) otherwise,
(1)
with λ > 1. This reflects a scenario in which the manager would like to issue a
rating equal to the employee’s true competence, but the manager feels worse about
issuing a rating that is undeservedly low than about issuing a rating undeservedly
high.3 Presumably, the manager’s primary goal is to assign ratings fairly, but the
manager may also sympathize somewhat with the employee or may not want to
discourage the employee, or may wish to ingratiate him or herself with the employee.
These secondary goals produce an asymmetry in the manager’s utility function that is
captured by the factor λ. If the performance evaluation is used to determine employee
compensation in a tournament or in some other incentive contract, then Equation 1
with λ > 1 is appropriate when the manager is not the residual claimant of the
employee’s value added. Usually this is the case (Prendergast & Topel, 1993). In
section 5 we derive equation (1) in the context of incentive contracting by assuming the
manager’s secondary preference is due to altruism for the employee, but by assuming
equation (1) for now we are not yet committing to any one particular source for the
asymmetry in the manager’s utility.
Finally, note that if there was no uncertainty in the performance measure, i.e., if
3In cases where the manager feels worse about undeserved high ratings than undue low ones, we
would have λ < 1, and we would predict rating deflation. This might occur if, for example, the
manager is personally responsible for the compensation package determined by the evaluation.
11
σ = 0, the manager would know the employee’s true competence xi and would issue
a perfectly accurate and unbiased rating zi = yi = xi.
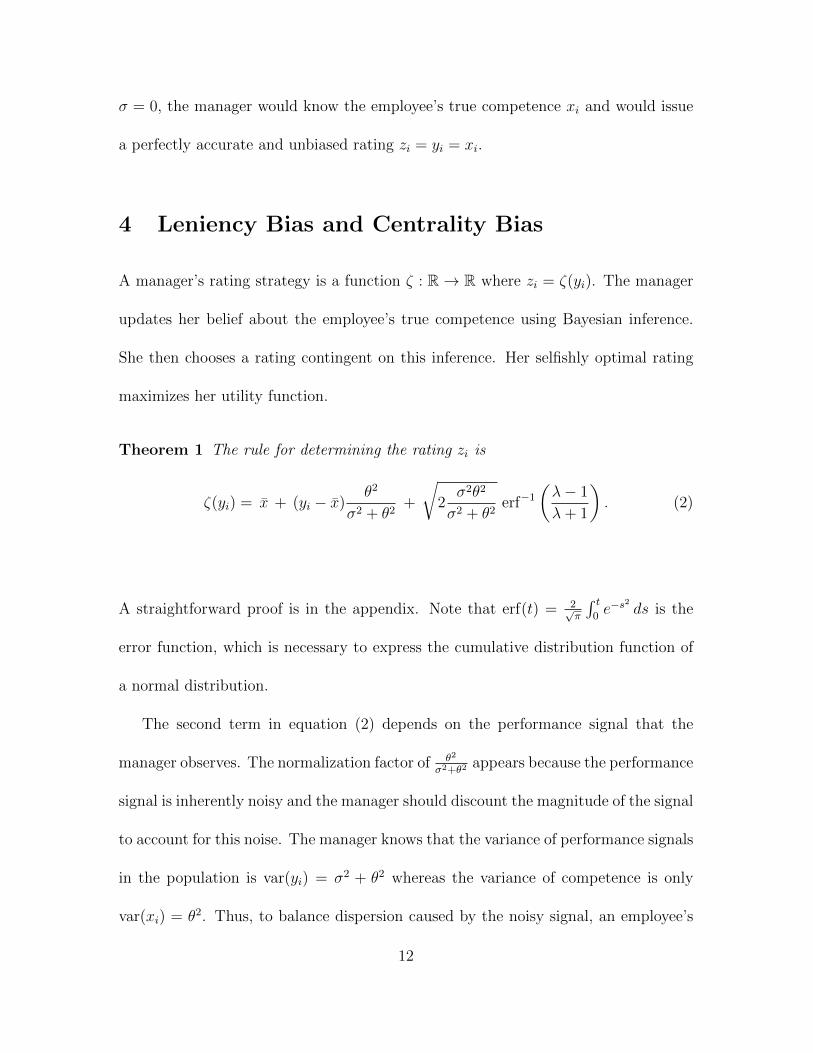
4 Leniency Bias and Centrality Bias
A manager’s rating strategy is a function ζ : R→ R where zi = ζ(yi). The manager
updates her belief about the employee’s true competence using Bayesian inference.
She then chooses a rating contingent on this inference. Her selfishly optimal rating
maximizes her utility function.
Theorem 1 The rule for determining the rating zi is
ζ(yi) = x + (yi − x)θ2
σ2 + θ2+
√2σ2θ2
σ2 + θ2erf−1
(λ− 1
λ+ 1
). (2)
A straightforward proof is in the appendix. Note that erf(t) = 2√π
∫ t0e−s
2ds is the
error function, which is necessary to express the cumulative distribution function of
a normal distribution.
The second term in equation (2) depends on the performance signal that the
manager observes. The normalization factor of θ2
σ2+θ2appears because the performance
signal is inherently noisy and the manager should discount the magnitude of the signal
to account for this noise. The manager knows that the variance of performance signals
in the population is var(yi) = σ2 + θ2 whereas the variance of competence is only
var(xi) = θ2. Thus, to balance dispersion caused by the noisy signal, an employee’s
12
expected rating conditional on his true competence is compressed towards the mean.
While this compression is in accordance with Bayes rule, it nevertheless generates
centrality bias. The manager’s ratings, as we will see, end up with less variance than
the actual employee competence.
The last term in equation (2) is the source of the leniency bias. The manager’s
best estimate of the employee’s true competence after seeing the performance signal
is x + (yi − x) θ2
σ2+θ2, but the manager adds into the rating this additional term that
is positive for λ > 1. The amount of inflation is increasing in σ, in θ, and in λ.
Intuitively, the greater the aversion to underrating the employee (relative to overrating
him), the more the manager will inflate the rating. Similarly, the more uncertain the
manager is about employee competence, the more she will inflate the rating to reduce
the chance of an underrating.
We thus obtain the following predictions (for λ > 1):
Corollary 1 An employee’s expected rating, conditional on his true competence xi,
is increasing linearly in his competence, with compression towards the mean x and
inflation (addition of a positive constant).
Corollary 2 Leniency Bias: The average rating in the population exceeds average
competence and is increasing in signal noisiness σ, in employee heterogeneity θ, and
in preference asymmetry λ.
Corollary 3 The Lake Wobegon Effect: The fraction of the population rated above
average competence is greater than one half and is increasing in signal noisiness σ
13
and in preference asymmetry λ, but decreasing4 in employee heterogeneity θ.
Corollary 4 Centrality Bias: The distribution of assigned ratings has lower variance
than the underlying distribution of competence. The variance in ratings is actually
decreasing with the signal noisiness σ.
Theorem 1 and Corollaries 1-4 capture the leniency and centrality biases, as doc-
umented by Bretz et al. (1992), Bol (2011), Jawahar and Williams (1997), Moers
(2005) and Prendergast (1999). These results also accord with additional empirical
findings characterizing these effects. For example, Corollary 2 indicates that leniency
biases depends on the noise in the performance signal provided by the employee, as
documented by Bol (2011). Likewise, the dependence of leniency bias on λ matches
the empirical finding that leniency bias increases with the strength of the manager-
employee relationship (Bol, 2011; Jawahar & Williams, 1997; Lawler, 1990; Murphy
& Cleveland, 1991).
Note that leniency bias is not simply a trivial implication of this preference
asymmetry. We could construct a bimodal distribution of competence, with low-
competence types more common than high-competence types, such that for a suffi-
ciently noisy signal the average rating would be below average competence, despite the
aversion to unfairly low ratings. Of course, such a peculiar distribution of competence
would have no empirical basis.
4While leniency bias is increasing in employee heterogeneity, so is the distance of a below-average
employee from average competence ratings. Intuitively, with greater variance in competence, less of
the population should be able to make the jump to above average.
14
Example To illustrate how ratings become compressed and inflated despite the man-
ager’s preference for an accurate evaluation, we provide a numerical example with con-
venient parameter values. We take the average competence in the population to be
x = 50 and the distribution to have standard deviation θ = 8. We consider the man-
ager, Alice, to be using a noisy performance measure with standard deviation σ = 6
and to have an aversion to undeservedly low ratings (relative to undeservedly high
ones) captured by λ = 6. Alice would prefer her ratings of her employees to match
their competence levels, but she does not know their actual competences, and she
considers it six times worse to underrate than to overrate. Suppose she observes one
employee, Barry, and his performance appears to reflect a competence of yBarry = 60.
Barry appears to be a good worker – Alice finds his performance signal to be one
standard deviation above the average. Suppose another employee, Bob, appears to
be a poor worker, with yBob = 40. Clearly, Alice judges Barry to be better than Bob.
But how much of Barry’s strong performance (and Bob’s weak one) can she attribute
to his competence as opposed to good (or, in Bob’s case, bad) luck? And, moreover,
what if she is wrong?
As a Bayesian, Alice knows the best estimate (given the standard deviations
above) is to attribute 36% of the variation in signals to noise, leaving 64% to be
explained by differences in competence. Maybe she caught Barry on a good day and
Bob on a bad day. Her best estimate of Barry’s competence would be 56.4 and Bob’s
would be 43.6. Both of these estimates are compressed towards the mean, 50. But
Alice does not use only her best estimate in order to determine a rating. It is possible
15
her best estimate is too high or too low. If it is too high, that is bad, but if it is too
low, that is much worse. She would like to decrease the chance that she underrates
her employees even though that means increasing the chance that she overrates them.
To maximize her expected utility, she inflates each estimate by 5.1, rating Barry at
zBarry ≈ 61.5 and Bob at zBob ≈ 48.7. That is, even though it’s more likely that noise
helped Barry rather than hurt him, Alice considers both scenarios possible and is
concerned enough about the latter scenario that she issues a rating even better than
the signal that she observed. But Bob’s rating is boosted even higher, relative to his
performance signal, because it is probable that his signal did not do him justice.
For symmetry, we chose Barry to generate a performance signal one standard
deviation above the average and Bob one standard deviation below. We can now
observe leniency bias in their ratings. While their (expected) average competence is
50, the average of their ratings is 55.1. We can also observe centrality bias in their
ratings. Their ratings differ from the average rating by 6.4 in each direction. This
is less than one standard deviation in the distribution of competence, which we took
to be 8. If Alice could somehow introduce a better accounting system and reduce
the noise in her performance measure, she would be able to reduce the leniency bias
and the centrality bias distorting her evaluations. As we will see in the subsequent
section, this would improve employee performance and firm productivity.
16
5 Incentive Contracts
When offering an incentive contract with compensation based on a manager’s subjec-
tive evaluation, a sophisticated employer accounts for the manager’s biased ratings.
The employer (the principal) utilizes an incentive contract to align the incentives of
an employee (the agent) facing moral hazard in deciding how much effort to exert
on the job. When effort is not observable objectively, it is not directly contractible,
and an additional agent (the manager) may be tasked with evaluating the employee’s
performance. The employment contract may specify that pay depends on this sub-
jective evaluation,5 and this evaluation may also inform the employer about ongoing
training and development and hiring needs, thereby directly contributing to organi-
zational capital.6 Employees may vary in their ability, and it may be impossible to
distinguish ability from effort generally.
Now, suppose employee (i’s) competence xi ∈ R is the (weighted) sum of ability
and effort, xi = ai+ρei. Ability is normally distributed in the population with mean a
and variance θ2, i.e., ai ∼ N(a, θ2). Effort ei ∈ R is a choice variable for the employee.
As in Section 3, the manager observes a noisy signal of the employee’s performance
yi ∼ N(xi, σ2) and issues a rating zi ∈ R to maximize her own utility.
The rating zi is contractible performance measure, whereas neither competence
5Details about the implementation of an optimal contract, i.e., whether it may be incomplete or
implicit, are beyond our scope.6See Prescott & Visscher (1980) and Jovanovic (1979), seminal works modeling organizational
capital derived from employee job fit.
17

nor effort is contractible, and their effect on total firm value is too diffuse to be a
useful measure.7 A contract between the employer and the employee will specify the
wage as a function of the manager’s rating, wi = f(zi). For illustration, we suppose
the value to the firm of the employee’s contributions is V (xi) = ekxi . We adopt this
exponential functional form because it seems reasonable that value created is convex
in competence, as the marginal productivity of effort should be increasing in ability,
and because it guarantees that the employee’s value is positive. We also suppose there
is loss in organizational capital from an inaccurate performance evaluation. This loss
is increasing in the magnitude of the error, captured as L(|zi − xi|) for some “well-
behaved”8 increasing function L. The employer’s profit is then Π = V (xi)− L(|zi −
xi|)− wi.
Employee utility is assumed to be an additively separable function of wealth and
effort exertion. We consider risk averse employees with Bernoulli utility for wealth
ln(wi) satisfying constant relative risk aversion. The cost of effort c(e) is increasing
and convex, with lime→eminc′(e) = 0, lime→emaxc
′(e) = ∞, and c′′(e) > 0 for all e.9
7See Section 2 for a discussion of the limitations of objective measures of performance in employee
appraisal. Additionally, for analysis demonstrating the inefficiency of constructing incentives based
on total firm value, see Feltham and Xie (1994).8For tractability we impose the technical condition that L increases without bound, but the
convolution of L(| · |) with a normal distribution always exists. We could allow L to asymptote, but
then we would need to restrict some other parameters (e.g., taking η (introduced later) to be small
enough or the cost function c to be growing quickly enough) in order to guarantee that employer’s
profit has a well-defined maximum.9We can think of the cost of effort as net of intrinsic motivation, but by assuming utility is
18
Thus, UE = ln(wi)− c(ei).
We suppose the manager is intrinsically motivated to do a good job (Likert, 1961),
i.e., to report an accurate evaluation, but is also altruistic towards the employee. (As
discussed earlier, there could be many reasons for the asymmetry in aversion to unfair
ratings, from the desire to boost employee morale to the desire to avoid conflict, but
for the sake of parsimony we focus on the manager’s sympathy for the employee.) We
have UM = −|zi − xi| + ηUE, where η > 0 indicates the degree of altruism (relative
to the degree of intrinsic motivation).
We assume the employee (and obviously the employer as well) does not know his
own ability when agreeing to a contract (as in Tsoulouhas & Marinakis, 2007). The
employee then discovers his type after agreeing to a contract, but before deciding how
much effort to exert on the job. If agents knew their type before agreeing to a contract,
there would be adverse selection in choosing from a menu of contracts, with low-ability
types trying to imitate high-ability types and high-ability types trying to distinguish
themselves (Bhattacharaya & Guasch, 1988; Levy & Vukina, 2002; O’Keeffe, Viscusi,
& Zeckhauser, 1984; Riis, 2010). It would be efficient for employees to sort themselves
and avoid exposure to the uncertainty surrounding their true ability, and we expect
employees would obtain credentials to signal their ability (Lazear & Rosen, 1981).
As we are interested in retaining heterogeneity in employee performance, we consider
additively separable in wealth and effort, we would then be disregarding the possibility that monetary
incentives might crowd out intrinsic motivation, as suggested by Deci (1972), Benabou & Tirole
(2006), Gneezy, Meier, & Rey-Biel. (2011), Heyman & Ariely (2004), to name a few.
19
the case in which sorting contracts by ability is impossible. While we would generally
assume that agents know their own type when one’s type determines one’s preferences,
in models in which one’s type refers to one’s quality, it is quite reasonable to assume
a lack of self-knowledge (Kruger & Dunning 1999).
We consider contracts of the form wi = αeβzi with α ≥ 0 and β ≥ 0. An expo-
nential contract of this form would be optimal if the manager was observing perfect
noiseless signals of employee performance (Edmans & Gabaix, 2011). When employ-
ees cannot predict their eventual compensation precisely due to noisy performance
signals, some such functional form assumption is necessary for tractability. The com-
mon linear contract is only appropriate given rigid assumptions about the employee’s
utility from money (Holmstrom & Milgrom, 1987), which we find less reasonable for
many reasons. Structuring compensation through a promotion tournament or with
stock options leads to convex, not linear, incentives. Murphy (1999) argues that a
log-linear relationship between compensation and performance (i.e., an exponential
contract) is empirically more relevant (Edmans & Gabaix, 2011), as it is a percent-
age change in pay, not an absolute change, that is best correlated with a percentage
change in firm value. Also, in our setting a linear contract would allow for unbounded
negative wages.10 Given this exponential contract form, the manager’s utility UM can,
after a positive linear transformation, be expressed as in Equation (1) with λ = 1+ηβ1−ηβ .
Of course, it remains for us to show that in equilibrium ηβ < 1.
10Additionally, an exponential contract generates a lognormal distribution of wages in our model.
This too has empirical support (Lydall, 1968).
20
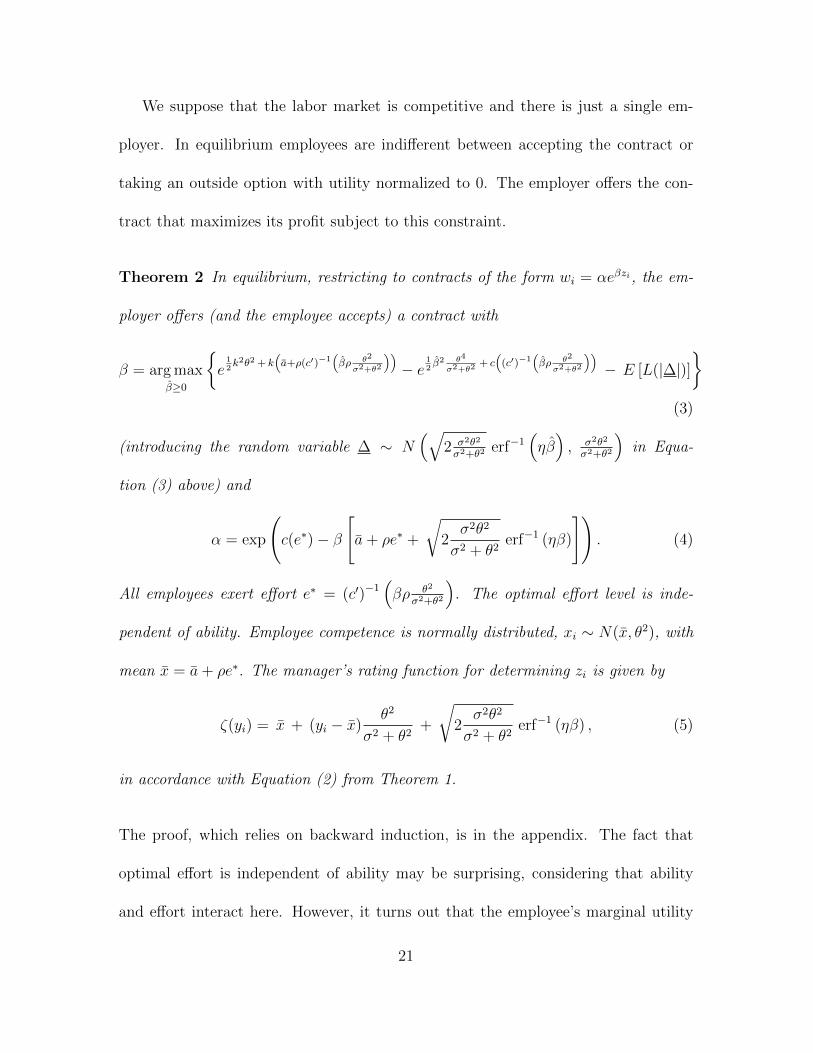
We suppose that the labor market is competitive and there is just a single em-
ployer. In equilibrium employees are indifferent between accepting the contract or
taking an outside option with utility normalized to 0. The employer offers the con-
tract that maximizes its profit subject to this constraint.
Theorem 2 In equilibrium, restricting to contracts of the form wi = αeβzi, the em-
ployer offers (and the employee accepts) a contract with
β = arg maxβ≥0
{e
12k2θ2 + k
(a+ρ(c′)−1
(βρ θ2
σ2+θ2
))− e
12β2 θ4
σ2+θ2+ c(
(c′)−1(βρ θ2
σ2+θ2
))− E [L(|∆|)]
}(3)
(introducing the random variable ∆ ∼ N(√
2 σ2θ2
σ2+θ2erf−1
(ηβ), σ2θ2
σ2+θ2
)in Equa-
tion (3) above) and
α = exp
(c(e∗)− β
[a+ ρe∗ +
√2σ2θ2
σ2 + θ2erf−1 (ηβ)
]). (4)
All employees exert effort e∗ = (c′)−1(βρ θ2
σ2+θ2
). The optimal effort level is inde-
pendent of ability. Employee competence is normally distributed, xi ∼ N(x, θ2), with
mean x = a+ ρe∗. The manager’s rating function for determining zi is given by
ζ(yi) = x + (yi − x)θ2
σ2 + θ2+
√2σ2θ2
σ2 + θ2erf−1 (ηβ) , (5)
in accordance with Equation (2) from Theorem 1.
The proof, which relies on backward induction, is in the appendix. The fact that
optimal effort is independent of ability may be surprising, considering that ability
and effort interact here. However, it turns out that the employee’s marginal utility
21
of increased wages from increased effort is constant, so the optimal effort level is the
same for all employees, depending only on the marginal disutility of effort.
Theorem 2 has many implications that accord with substantial empirical evidence.
For example, it is well known that managers are more likely to distort their evaluations
when money is on the line (Jawahar & Williams, 1997; Landy & Farr, 1980; Murphy &
Cleveland, 1991). Indeed, the assumptions of Theorem 2 do not pin down whether in
fact pay will depend on performance (β > 0) or not (β = 0) – it depends on parameter
values – but the theorem does imply that subjective evaluations will be inflated
when they affect wages whereas leniency bias will vanish when pay is independent of
performance.
The leniency bias and centrality bias in the manager’s performance rating af-
fect the contract that the employer and employee agree upon. Centrality bias has
a straightforward consequence. Knowing that the eventual evaluation will be com-
pressed toward mean competence, the employee has less incentive to put in effort. The
employer may mitigate this problem by offering a contract with stronger or weaker
performance incentives (a new value of β), but the net result is lower effort, lower per-
formance, and a lower expected wage. In addition to the decline in wage from poorer
job performance, there is also a decline because compression of ratings decreases the
variance in the wage, and the employee then requires less compensation for exposure
to risk.
Leniency bias has a somewhat more complicated effect. The direct impact is to
increase the expected wage, but recognizing that there will be leniency bias, the em-
22
ployer and employee agree to a contract that pays the employee proportionately less,
i.e., α decreases with leniency bias. These two effects precisely balance out. Addi-
tionally, though, leniency bias makes performance evaluation less useful for research
and employee development purposes, causing a decline in organizational capital. The
employer, to the extent it cares about the employee development objective, miti-
gates the loss in organizational capital by decreasing the performance incentives in
the employee’s contract (lower β), thereby reducing the altruistic manager’s desire to
be lenient. The weaker performance incentives naturally lead to lower effort, worse
employee performance, and a lower expected wage.
We thus obtain the following comparative statics.
Corollary 5 While β > 0:
1. The greater the manager’s altruism, the more leniency bias we should observe,
and in turn, weaker performance incentives, poorer employee performance, and
lower overall wages. (As η increases, E[zi − xi] increases, but β, xi, and wi
decrease.11)
2. The more the employer cares about the organizational capital accruing from
performance evaluation, the weaker the employee performance incentives, and
in turn there is less leniency bias, poorer employee performance, and lower
11When we say that xi or wi increases (decreases), we mean that the distribution (of xi or wi
respectively) shifts so that the new distribution first-order stochastically dominates (is dominated
by) the old one.
23
overall wages. (As we magnify the function L (i.e., L→ γL for γ > 1), we find
that β, E[zi − xi], xi, and wi all decrease.)
3. The more valuable the employee’s work, the stronger the performance incentives,
and in turn there is more leniency bias, better employee performance, and higher
overall wages. (As k increases, β, E[zi − xi], xi, and wi all increase.)
4. Uncertainty in the performance measure exacerbates both centrality bias and
leniency bias. (As σ increases, E[zi − xi] increases and var(zi) decreases.)
Depending on parameter values, the employer may respond to a noisier per-
formance signal by specifying stronger or weaker performance incentives in the
contract. In either case, the actual incentive to exert effort is weaker (because
even if the contract ramps up incentives, it does not completely counterbalance
the manager’s compression of ratings), so employee performance becomes worse
with noisier performance measures. (As σ increases, xi decreases.) In the case
that performance incentives become weaker in more uncertain environments,
then of course the expected wage decreases as well. (If σ increases and β de-
creases, then E[wi] decreases.)
We should emphasize that we find an ambiguous relationship between uncertainty
about performance and the degree of pay-for-performance in employee compensation.
Whereas the traditional model identifies a negative relationship due to the trade-
off between incentivizing the employee and exposing him to risk, we might obtain
such a negative relationship for the same reason or because of the tradeoff between
24
incentivizing the employee and distorting performance evaluation (by exacerbating
leniency bias), but we might also obtain a positive relationship due to centrality bias
– in more uncertain environments it takes stronger incentives to get the employee
to put in even close to the same level of effort. Indeed, various empirical studies
have found a positive relationship, a negative relationship, or the absence of any
clear relationship between uncertainty and incentives, depending on the domain (see
Prendergast, 2002).
Some of the comparative statics that we obtain are straightforward. It is not sur-
prising that more valuable employees would be offered stronger incentives and that
these incentives would improve performance. We also identify a tradeoff for the em-
ployer between using the evaluation to incentivize the employee to perform or getting
more accurate evaluations to inform human resources management. This tradeoff has
natural consequences, although we suspect that if we made explicit how this orga-
nizational capital contributed to firm value (instead of treating the mechanism as a
black box), we might well have found that employee performance actually improves
the more the employer values organizational capital.
Our finding that altruism on the manager’s part has the perverse effects of hurt-
ing employee performance and decreasing wages is counterintuitive. It should be
acknowledged that the manager’s altruism does not make the employee worse off in
utility terms. Market forces drive employees’ expected utility to that of their outside
options, regardless of altruism. We would chalk up to the law of unintended conse-
quences that the manager’s desire to help the employee turns out, in equilibrium, to
25
make the employee no better off and to actually harm the employer.
Of all the comparative statics described in Corollary 5, the pernicious effects of
performance measure uncertainty are especially worth recognizing. By exacerbating
the biases that plague subjective performance evaluation, noise in the performance
signal not only costs the employer a direct loss in organizational capital from lost
information, but also demotivates employees leading to poorer performance and a
loss in productivity. Coming up with better subjective performance measures would
thus directly, and indirectly, benefit the firm.
6 Conclusion
Noise in the performance signal and a stronger aversion to unfairly low ratings than to
overly high ones together bring a manager to inflate performance evaluation ratings.
We need not assume the manager desires an inflated profile of ratings. The manager
may well wish to have accurate, unbiased ratings, but if noisy signals are inevitable,
the manager may still introduce an upward bias to counteract the inherent impre-
cision of the performance signal. Experimental evidence that asymmetric fairness
considerations boost performance evaluations provides some degree of corroboration
for our proposed model (Bol & Smith, 2011). Further support comes from a field study
finding that higher information gathering costs in conjunction with strong employee-
manager relationships increase performance evaluation bias (Bol, 2011). In our model
both the amount of noise in measuring performance and the degree of asymmetry in
26
preferences over ratings error contribute to the size of the bias in the manager’s self-
ishly optimal rating. This suggests that extreme leniency in performance evaluation
can be mitigated by defining more concrete, unambiguous evaluation criteria.12
While an objectively measurable performance signal may occasionally determine
compensation directly, often a subjective judgment of employee performance must be
made (Baker et al., 1994). In such cases, a manager’s incentives will influence the
rating given to the employee (Prendergast & Topel, 1993). An incentive compatible
mechanism for the manager to report unbiased performance signals must go beyond
simply creating a preference for accurate ratings. A manager with other-regarding
preferences will still introduce bias into the performance evaluation to the extent that
the performance signal is imprecise and noisy and the extent that the evaluation will
affect compensation. The biases introduced into a subjective performance evaluation
can be accounted for by a sophisticated employer and employee and thus affect the
contract determining compensation. In turn, leniency bias and centrality bias end up
demotivating the employee, leading to poorer performance and lower profit.
The framework we present highlights the relevance of two non-standard variables
in subjective performance evaluation. Ratings are sensitive to both the relationship
between rater and the employee, and purpose of the evaluation itself. Higher altru-
ism for the employee generates increased inflation. Likewise, ratings that affect the
employee’s welfare (such as those that determine wages) will be more inflated than
12Indeed, a due-process performance appraisal system can reduce the ambiguity in performance
measures and thereby decrease leniency bias (Taylor, Tracy, Renard, Harrison, & Carroll, 1995).
27
ratings that serve some other informational purpose for the firm (such as those for
research or employee development). While these variables are largely ignored in most
theoretical work on performance evaluation and contracting, they do impact actual
evaluations.
Our framework also emphasizes the role of noise in the performance signal, as a
determinant of performance evaluation distortion. Instead of merely adding variance
to the manager’s estimates of the employee’s competence, dispersion in the signal gen-
erates both systematic inflation and compression. One effective way to combat these
distortions is thus simply to reduce the noise in the performance signals. Raters who
are certain of the true value of the employee’s competence will not inflate or compress
their ratings and will provide the firm with accurate performance evaluations.
Our first comparative static in Corollary 5 raises the possibility that firms might
try to hire managers who specifically are less altruistic in order to reduce leniency bias.
We caution that this comparative static relies on managers having a fixed intrinsic
motivation to do a good job, but we have no reason to believe that altruism and
workplace conscientiousness are uncorrelated traits. We might perhaps recommend
firms look for conscientious managers, but we expect they already do so. In the
other direction, of course, malicious managers with utility decreasing in employee
compensation would also produce biased evaluations (deflation of ratings rather than
inflation), so these types should indeed be avoided. We are most comfortable in
recommending the development of more precise subjective performance evaluation
systems, acknowledging altruism as inevitable. Setting clear guidelines for managers
28
and carefully specified criteria for employees could reduce noise in evaluations and
thus mitigate performance evaluation biases.
Although we have focused on the simple case where managers provide a single
subjective rating of the employee’s competence, the evaluation biases we study apply
to more complex domains as well. For example, settings in which managers are
able to specify the performance measures that will objectively determine employee
evaluation and compensation are also susceptible to leniency and centrality biases.
Managers would systematically bias not the rating itself, but the weights placed on
the measures that determine the rating. Indeed, Ittner, Larcker, & Meyer (2003)
document leniency bias for subjectively weighted balanced scorecard measures.
The formal model we develop could also be applied outside the context of employee
performance evaluations. In a laboratory study of motivated communication, there
is more inflation of reported evaluations when there is greater uncertainty about the
true value of a noisy variable (Schweitzer & Hsee, 2002). Moving outside of the lab,
financial analysts exhibit leniency bias when rating securities (Michaely & Womack,
1999), and this bias is known to be increasing in the uncertainty of earnings forecasts
(Ackert & Athanassakos, 1997; Das, Levine, & Sivaramakrishnan, 1998). Our model
is consistent with these findings, though certainly not conclusive as we have less in-
tuition supporting fairness as the primary motive of financial analysts (Fischer &
Verrecchia, 2000). Jurors also exhibit a leniency bias when reaching unanimous ver-
dicts, as compared with solitary decisions, with a reasonable-doubt standard of proof,
but not with a preponderance-of-evidence standard (MacCoun & Kerr, 1988). Ex-
29
posure to contrasting opinions during group deliberation might increase uncertainty
about the correct verdict, and if we associate a reasonable-doubt standard with a
stronger aversion to convicting an innocent person than to acquitting a guilty one
and a preponderance-of-evidence standard to symmetric fairness preferences, then
our model predicts leniency bias here as well.
Appendix
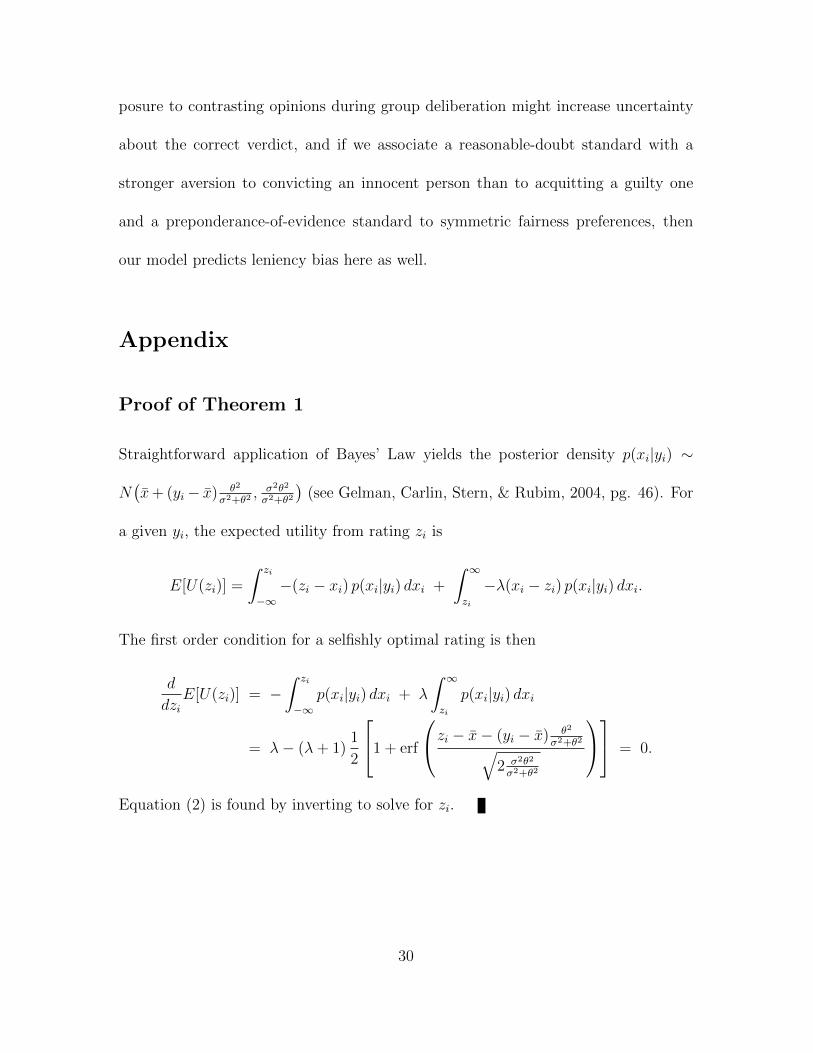
Proof of Theorem 1
Straightforward application of Bayes’ Law yields the posterior density p(xi|yi) ∼
N(x+ (yi− x) θ2
σ2+θ2, σ2θ2
σ2+θ2
)(see Gelman, Carlin, Stern, & Rubim, 2004, pg. 46). For
a given yi, the expected utility from rating zi is
E[U(zi)] =
∫ zi
−∞−(zi − xi) p(xi|yi) dxi +
∫ ∞zi
−λ(xi − zi) p(xi|yi) dxi.
The first order condition for a selfishly optimal rating is then
d
dziE[U(zi)] = −
∫ zi
−∞p(xi|yi) dxi + λ
∫ ∞zi
p(xi|yi) dxi
= λ− (λ+ 1)1
2
1 + erf
zi − x− (yi − x) θ2
σ2+θ2√2 σ2θ2
σ2+θ2
= 0.
Equation (2) is found by inverting to solve for zi.
30
Proof of Corollaries 1-4
1. Integrate over the performance signal to find that an employee’s expected rating
conditional on his true competence xi is
E [ζ(yi) |xi] = x+ (xi − x)θ2
σ2 + θ2+
√2σ2θ2
σ2 + θ2erf−1
(λ− 1
λ+ 1
).
2. Integrating over the performance signal and the competence level reveals that
the average rating in the population is x+√
2 σ2θ2
σ2+θ2erf−1
(λ−1λ+1
).
3. As there is a normal distribution of performance signals across the population,
the fraction of employees rated above average competence is
Pr(zi > x) = Φ
(√2σ
θerf−1
(λ− 1
λ+ 1
))=
1
2
[1 + erf
(σ
θerf−1
(λ− 1
λ+ 1
))].
4. The variance in ratings is var(zi) = θ4
σ2+θ2< θ2.
Proof of Theorem 2
Given that xi ∼ N(x, θ2) and β < 1η, we obtain the manager’s rating funtion in
Theorem 1 with λ = 1+ηβ1−ηβ , which is explicitly given by Equation (5). (If β ≥ 1
η, then
the manager would give every employee the maximal (infinite) rating. This obviously
does not take place.)
Given the contract parameters and the manager’s rating function, an employee
with ability ai chooses effort ei (and thus competence xi = ai + ρei) to maximize
E[ln(αeβζ(yi)
)]− c(ei) where yi is of course a stochastic function with mean xi.
31
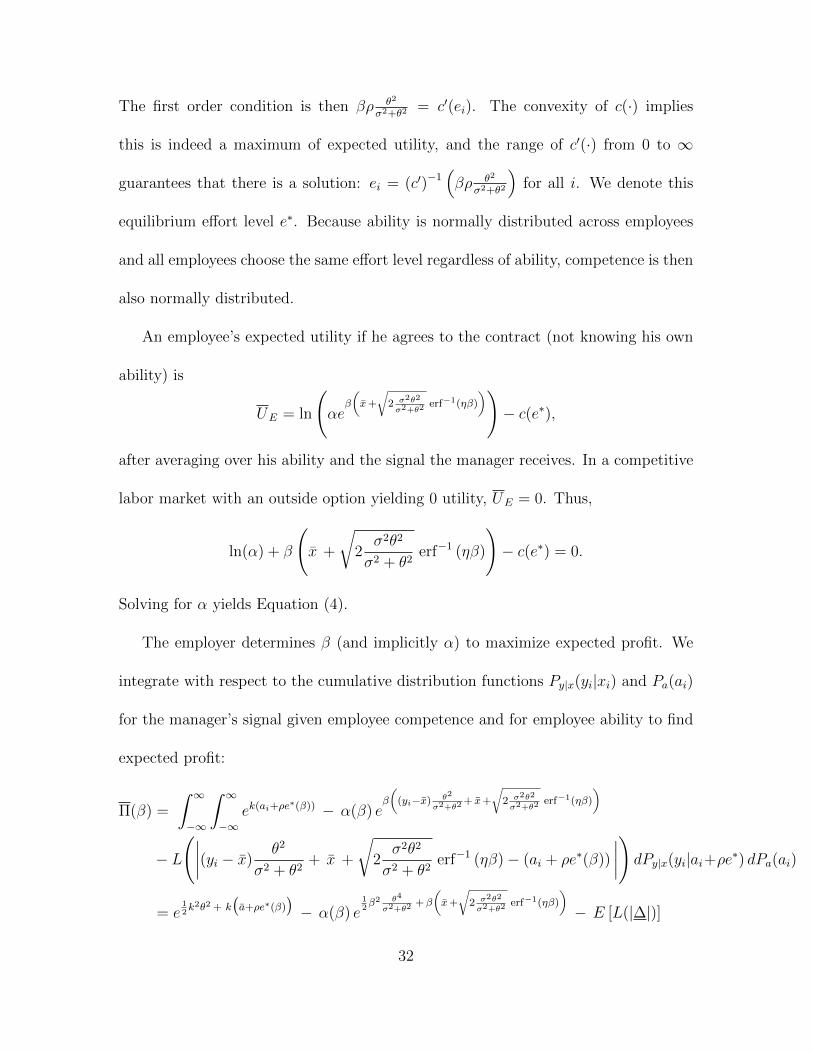
The first order condition is then βρ θ2
σ2+θ2= c′(ei). The convexity of c(·) implies
this is indeed a maximum of expected utility, and the range of c′(·) from 0 to ∞
guarantees that there is a solution: ei = (c′)−1(βρ θ2
σ2+θ2
)for all i. We denote this
equilibrium effort level e∗. Because ability is normally distributed across employees
and all employees choose the same effort level regardless of ability, competence is then
also normally distributed.
An employee’s expected utility if he agrees to the contract (not knowing his own
ability) is
UE = ln
(αe
β
(x+
√2 σ2θ2
σ2+θ2erf−1(ηβ)
))− c(e∗),
after averaging over his ability and the signal the manager receives. In a competitive
labor market with an outside option yielding 0 utility, UE = 0. Thus,
ln(α) + β
(x +
√2σ2θ2
σ2 + θ2erf−1 (ηβ)
)− c(e∗) = 0.
Solving for α yields Equation (4).
The employer determines β (and implicitly α) to maximize expected profit. We
integrate with respect to the cumulative distribution functions Py|x(yi|xi) and Pa(ai)
for the manager’s signal given employee competence and for employee ability to find
expected profit:
Π(β) =
∫ ∞−∞
∫ ∞−∞
ek(ai+ρe∗(β)) − α(β) e
β
((yi−x) θ2
σ2+θ2+ x+
√2 σ2θ2
σ2+θ2erf−1(ηβ)
)
− L
(∣∣∣∣(yi − x)θ2
σ2 + θ2+ x +
√2σ2θ2
σ2 + θ2erf−1 (ηβ)− (ai + ρe∗(β))
∣∣∣∣)dPy|x(yi|ai+ρe∗) dPa(ai)
= e12k2θ2 + k
(a+ρe∗(β)
)− α(β) e
12β2 θ4
σ2+θ2+β
(x+
√2 σ2θ2
σ2+θ2erf−1(ηβ)
)− E [L(|∆|)]
32
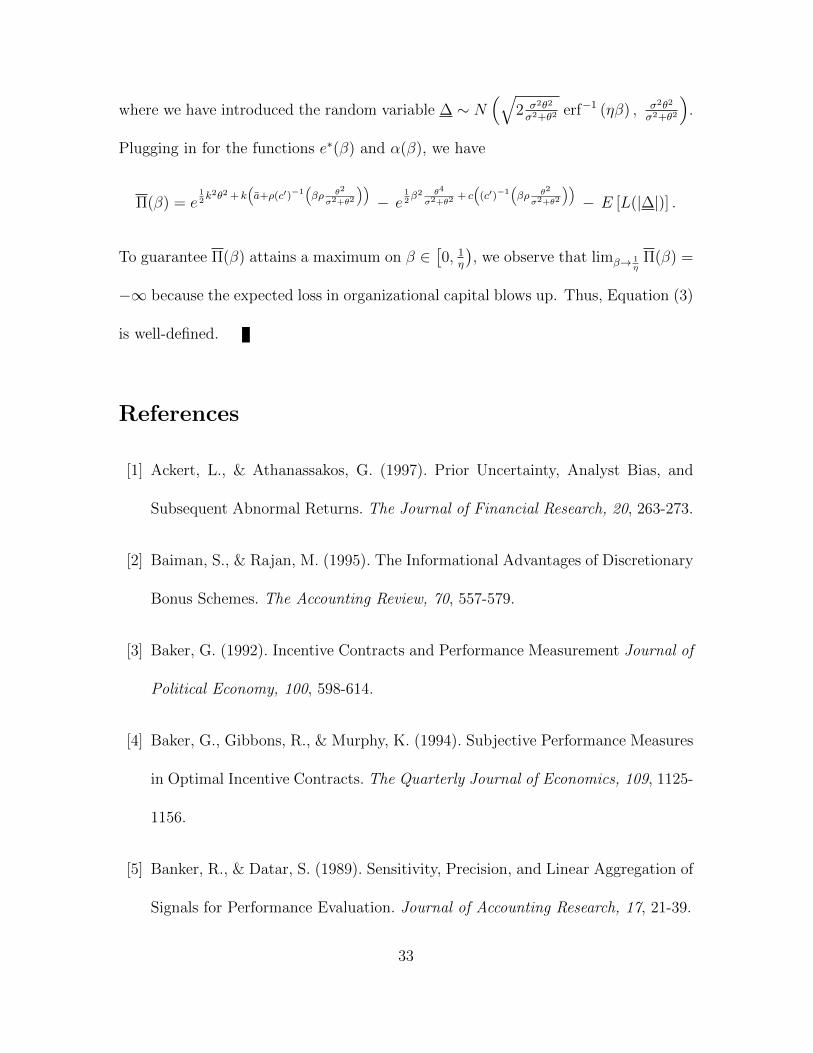
where we have introduced the random variable ∆ ∼ N(√
2 σ2θ2
σ2+θ2erf−1 (ηβ) , σ2θ2
σ2+θ2
).
Plugging in for the functions e∗(β) and α(β), we have
Π(β) = e12k2θ2 + k
(a+ρ(c′)−1
(βρ θ2
σ2+θ2
))− e
12β2 θ4
σ2+θ2+ c(
(c′)−1(βρ θ2
σ2+θ2
))− E [L(|∆|)] .
To guarantee Π(β) attains a maximum on β ∈[0, 1
η
), we observe that limβ→ 1
ηΠ(β) =
−∞ because the expected loss in organizational capital blows up. Thus, Equation (3)
is well-defined.
References
[1] Ackert, L., & Athanassakos, G. (1997). Prior Uncertainty, Analyst Bias, and
Subsequent Abnormal Returns. The Journal of Financial Research, 20, 263-273.
[2] Baiman, S., & Rajan, M. (1995). The Informational Advantages of Discretionary
Bonus Schemes. The Accounting Review, 70, 557-579.
[3] Baker, G. (1992). Incentive Contracts and Performance Measurement Journal of
Political Economy, 100, 598-614.
[4] Baker, G., Gibbons, R., & Murphy, K. (1994). Subjective Performance Measures
in Optimal Incentive Contracts. The Quarterly Journal of Economics, 109, 1125-
1156.
[5] Banker, R., & Datar, S. (1989). Sensitivity, Precision, and Linear Aggregation of
Signals for Performance Evaluation. Journal of Accounting Research, 17, 21-39.
33
[6] Bartling, B. (2011). Relative Performance or Team Evaluation? Optimal Con-
tracts for Other-regarding Agents. Journal of Economic Behavior and Organiza-
tion, 79, 183-193.
[7] Benabou, R., & Tirole, J. (2006). Incentives and Prosocial Behavior. American
Economic Review, 96, 1652-1678.
[8] Bernardin, H., Cooke, D., & Villanova, P. (2000). Conscientiousness and Agree-
ableness as Predictors of Rating Leniency. Journal of Applied Psychology, 85,
232-236.
[9] Bhattacharaya, S., & Guasch, J. (1988). Heterogeneity, Tournaments, and Hier-
archies. Journal of Political Economy, 96, 867-881.
[10] Bol, J. (2011). The Determinants and Performance Effects of Managers’ Perfor-
mance Evaluation Biases. The Accounting Review, 86, 1549-1575.
[11] Bol, J., & Smith, S. (2011). Spillover Effects in Subjective Performance Evalua-
tion: Bias, Fairness, and Controllability. The Accounting Review, 86, 1213-1230.
[12] Bolton, G., & Ockenfels, A. (2000). ERC: A Theory of Equity, Reciprocity, and
Competition. American Economic Review, 90, 166-193.
[13] Bretz, R., & Milkovich, G., & Read, W. (1992). The Current State of Perfor-
mance Appraisal Research and Practice: Concerns, Directions, and Implications.
Journal of Management, 18, 321-352.
34
[14] Castilla, E., & Benard, S. (2010). The Paradox of Meritocracy in Organizations.
Administrative Science Quarterly, 55, 543-576.
[15] Cheatham, C., Davis, D., & Cheatham, L. (1996). Hollywood Profits: Gone with
the Wind? The CPA Journal, 66, 32-35.
[16] Das, S., Levine, C., & Sivaramakrishnan, K. (1998). Earnings Predictability and
Bias in Analysts’ Earnings Forecasts. The Accounting Review, 73, 277-294.
[17] Deci, E. & (1972). The Effects of Contingent and Noncontingent Rewards and
Controls on Intrinsic Motivation. Organizational Behavior and Human Perfor-
mance, 8, 217-229.
[18] Dutta, S. (2008). Managerial Expertise, Private Information, and Pay-
Performance Sensitivity. Management Science, 54, 429-442.
[19] Edmans, A., & Gabaix, X. (2011). Tractability in Incentive Contracting. Working
Paper.
[20] Englmaier, F., & Wambach, A. (2010). Optimal Incentive Contracts under In-
equality Aversion. Games and Economic Behavior, 69, 312-328.
[21] Fehr, E., Kirchler, E., Weichbold, A., & Gachter, S. (1998). When Social Norms
Overpower Competition: Gift Exchange in Experimental Labor Markets. Journal
of Labor Economics, 16, 324-351.
35
[22] Fehr, E., & Schmidt, K. (1999). A Theory of Fairness, Competition and Coop-
eration. The Quarterly Journal of Economics, 114, 817-868.
[23] Fehr, E., & Schmidt, K. (2007). Adding a Stick to the Carrot? The Interaction
of Bonuses and Fines. American Economic Review, 97, 177-181.
[24] Feltham, G., & Xie, J. (1994). Performance Measure Congruity and Diversity in
Multi-Task Principal/Agent Relations. The Accounting Review, 69, 429-453.
[25] Fischer, P., & Verrecchia, R. (2000). Reporting Bias. The Accounting Review,
75, 229-245.
[26] Gelman, A., Carlin, J., Stern, H., & Rubin, D. (2004). Bayesian Data Analysis.
Second Edition. Boca Raton, FL: Chapman and Hall / CRC Press.
[27] Gibbons, R. (2005). Incentives Between Firms (and Within). Management Sci-
ence, 51, 2-17.
[28] Giebe, T., & Gurtler, O. (2012). Optimal Contracts for Lenient Supervisors.
Journal of Economic Behavior and Organization, 81, 403-420.
[29] Gneezy, U., Meier, S., & Rey-Biel, P. (2011). When and Why Incentives (Dont)
Work to Modify Behavior. Journal of Economic Perspectives, 25, 1-21.
[30] Grund, C., & Przemeck, J. (2012). Subjective Performance Appraisal and In-
equality Aversion. Applied Economics, 44, 2149-2155.
36
[31] Harris, M. (1994). Rater Motivation in the Performance Appraisal Context: A
Theoretical Framework. Journal of Management, 20, 737-756.
[32] Hayes, R., & Schaefer, S. (2000). Implicit Contracts and the Explanatory Power
of Top Executive Compensation for Future Performance. RAND Journal of Eco-
nomics, 31, 273-293.
[33] Herold, F. (2010). Contractual incompleteness as a signal of trust. Games and
Economic Behavior, 68, 180-191.
[34] Heyman, J., & Ariely, D. (2004). Effort for Payment. Psychological Science, 15,
787-793.
[35] Holmstrom, B. (1979). Moral Hazard and Observability. Bell Journal of Eco-
nomics, 10, 74-91.
[36] Holmstrom, B., & Milgrom, P. (1987). Aggregation and Linearity in the Provision
of Intertemporal Incentives. Econometrica, 55, 308-328.
[37] Holmstrom, B., & Milgrom, P. (1991). Multitask Principal-Agent Analyses: In-
centive Contracts, Asset Ownership, and Job Design. Journal of Law, Economics,
and Organization, 7, 24-52.
[38] Ittner, C., Larcker, D., & Meyer, M. (2003). Subjectivity and the Weighting of
Performance Measures: Evidence from a Balanced Scorecard. The Accounting
Review, 78, 725-758.
37
[39] Jawahar, I., & Williams, C. (1997). Where All the Children Are Above Average:
The Performance Appraisal Purpose Effect. Personnel Psychology, 50, 905-925.
[40] Johnson, D., Erez, A., Kiker, D., & Motowidlo, S. (2002). Liking and Attributions
of Motives as Mediators of the Relationships Between Individuals’ Reputations,
Helpful Behaviors and Raters’ Reward Decisions. Journal of Applied Psychology,
87, 808-815.
[41] Jovanovic, B. (1979). Firm-specific Capital and Turnover. Journal of Political
Economy, 87, 1246-1260.
[42] Judge, T., & Ferris, G. (1993). Social Context of Performance Evaluation Deci-
sions. Academy of Management Journal, 36, 80-105.
[43] Kane, J., Bernardin, J., Villanova, P., & Peyrefitte, J. (1995). Stability of Rater
Leniency: Three Studies. The Academy of Management Journal, 38 , 1036-1051.
[44] Kruger, J., & Dunning, D. (1999). Unskilled and Unaware of It: How Difficul-
ties in Recognizing One’s Own Incompetence Lead to Inflated Self-Assessments.
Journal of Personality and Social Psychology, 77, 1121-1134.
[45] Landy, F., & Farr, J. (1980). Performance Rating. Psychological Bulletin, 87,
72-107.
[46] Lawler, E.E. (1990). Strategic pay: Aligning organizational strategies and pay
systems. San Francisco: Jossey-Bass.
38
[47] Lazear, E., & Rosen, S. (1981). Rank-Order Tournaments as Optimum Labor
Contracts. The Journal of Political Economy, 89, 841-864.
[48] Levy, A., & Vukina, T. (2002). Optimal Linear Contracts with Heterogeneous
Agents. European Review of Agricultural Economics, 29, 205-217.
[49] Levy, P., & Williams, J. (2004). The Social Context of Performance Appraisal:
A Review and Framework for the Future. Journal of Management, 30, 881-905.
[50] Likert, R. (1961). New Patterns of Management. New York: McGraw-Hill.
[51] Longenecker, C., Sims, H., & Gioia, D. (1987). Behind the Mask: The Politics
of Employee Appraisal. Academy of Management Executive, 1, 183-193.
[52] Lydall, H. (1968). The Structure of Earnings. London: Oxford University Press.
[53] Maas, V., van Rinsum, M., & Towry, K. (2009). In Search of Informed Discretion:
An Experimental Investigation of Fairness and Trust Reciprocity. Working Paper.
[54] MacCoun, R., & Kerr, N. (1988). Asymmetric Influence in Mock Jury Deliber-
ation: Jurors’ Bias for Leniency. Journal of Personality and Social Psychology,
54, 21-33.
[55] Michaely, R., & Womack, K. (1999). Conflict of Interest and the Credibility of
Underwriter Analyst Recommendations. Review of Financial Studies, 12, 653-
686.
39
[56] Moers, F. (2005). Discretion and Bias in Performance Evaluation: The Impact
of Diversity and Subjectivity. Accounting, Organizations and Society, 30, 67-80.
[57] Montgomery, J.D. (1991). Social Networks and Labor Market Outcomes. Amer-
ican Economic Review, 81, 1407-1418.
[58] Moran, J., & Morgan, J. (2003). Employee Recruiting and the Lake Wobegon
Effect. Journal of Economic Behavior & Organization, 50, 165-182.
[59] Murphy, K. (1992). Performance Measurement and Appraisal: Motivating Man-
agers to Identify and Reward Performance. in W. Bruns (ed.), Performance Mea-
surement, Evaluation, and Incentives, Harvard Business School, 37-62.
[60] Murphy, K. (1999). Executive Compensation. Handbook of Labor Economics, 3,
2485-2563.
[61] Murphy, K. (2008). Explaining the Weak Relationship Between Job Performance
and Ratings of Job Performance. Industrial and Organizational Psychology, 1,
148-160.
[62] Murphy, K., & Cleveland, J. (1991). Performance Appraisal: An Organizational
Perspective. Needham Heights, MA: Allyn & Bacon.
[63] Murphy, K., & Cleveland, J. (1995). Understanding Performance Appraisal.
Thousand Oaks, CA: Sage Publications.
40
[64] Murphy, K., Cleveland, J., Skattebo, A., & Kinney, T. (2004). Raters Who
Pursue Different Goals Give Different Ratings. Journal of Applied Psychology,
89, 158-164.
[65] O’Keeffe, M., Viscusi, W., & Zeckhauser, R. (1984). Economic Contests: Com-
parative Rewards Scheme. Journal of Labor Economics, 2, 27-56.
[66] Prendergast, C. (1999). The Provision of Incentives in Firms. Journal of Eco-
nomic Literature, 37, 7-63.
[67] Prendergast, C. (2002). Uncertainty and Incentives. Journal of Labor Economics,
20, 115-137.
[68] Prendergast, C., & Topel, R. (1993). Discretion and Bias in Performance Eval-
uation. European Economic Review, 37, 355-365.
[69] Prendergast, C., & Topel, R. (1996). Favoritism in Organizations. Journal of
Political Economy, 104, 958-978.
[70] Prescott, E., & Visscher, M. (1980). Organization Capital. Journal of Political
Economy, 88, 446-461.
[71] Riis, C. (2010). Efficient Contests. Journal of Economics and Management Strat-
egy, 19, 643-665.
[72] Saal, F.E., & Landy, F. J. (1977). The Mixed Standard Rating Scale: An Eval-
uation. Organizational Behavior and Human Performance, 18, 19-35.
41
[73] Schweitzer, M., & Hsee, C. (2002). Stretching the Truth: Elastic Justification
and Motivated Communication of Uncertain Information. Journal of Risk and
Uncertainty, 25, 185-201.
[74] Taylor, M.S., Tracy, K., Renard, M., Harrison, J.K., & Carroll, S. (1995). Due
Process in Performance Appraisal: A Quasi-Experiment in Procedural Justice.
Administrative Science Quarterly, 40, 495-523.
[75] Tsoulouhas, T., & Marinakis, K. (2007). Tournaments with Ex Post Heteroge-
neous Agents. Economics Bulletin, 4, 1-9.
42