performance evaluation of city bus services...
TRANSCRIPT

“PERFORMANCE EVALUATION OF CITY BUS
SERVICES FOR TIER-II CITIES”
‘A case study for Tumkur city’
5th Urban Mobility India Conference-2012
Manekshaw Centre, Near Dhaula Kuan, New Delhi
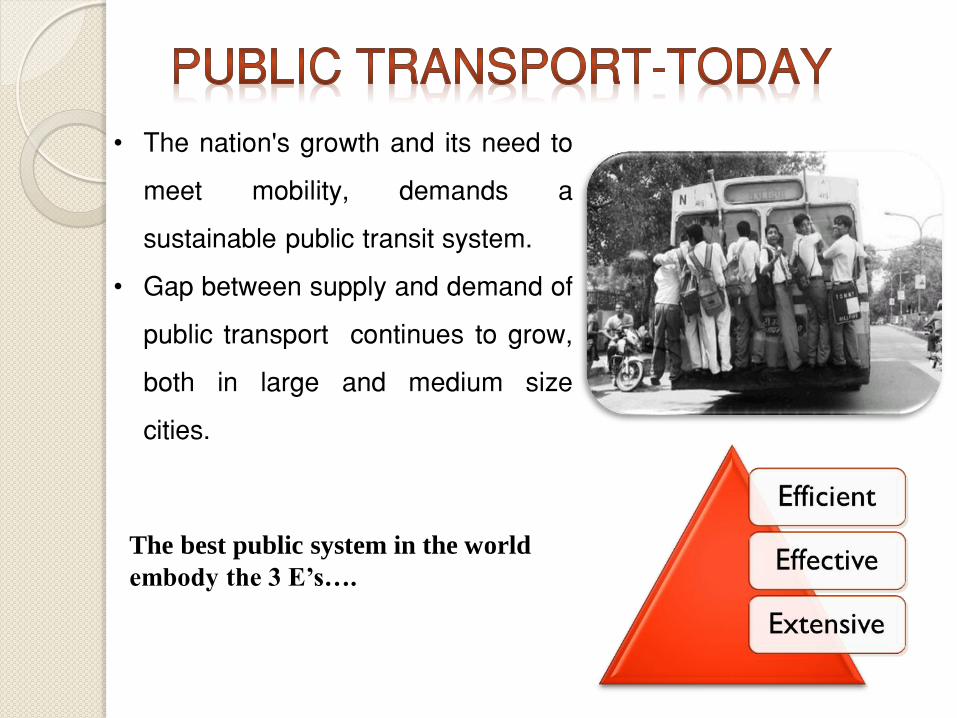
• The nation's growth and its need to
meet mobility, demands a
sustainable public transit system.
• Gap between supply and demand of
public transport continues to grow,
both in large and medium size
cities.
The best public system in the world
embody the 3 E’s….
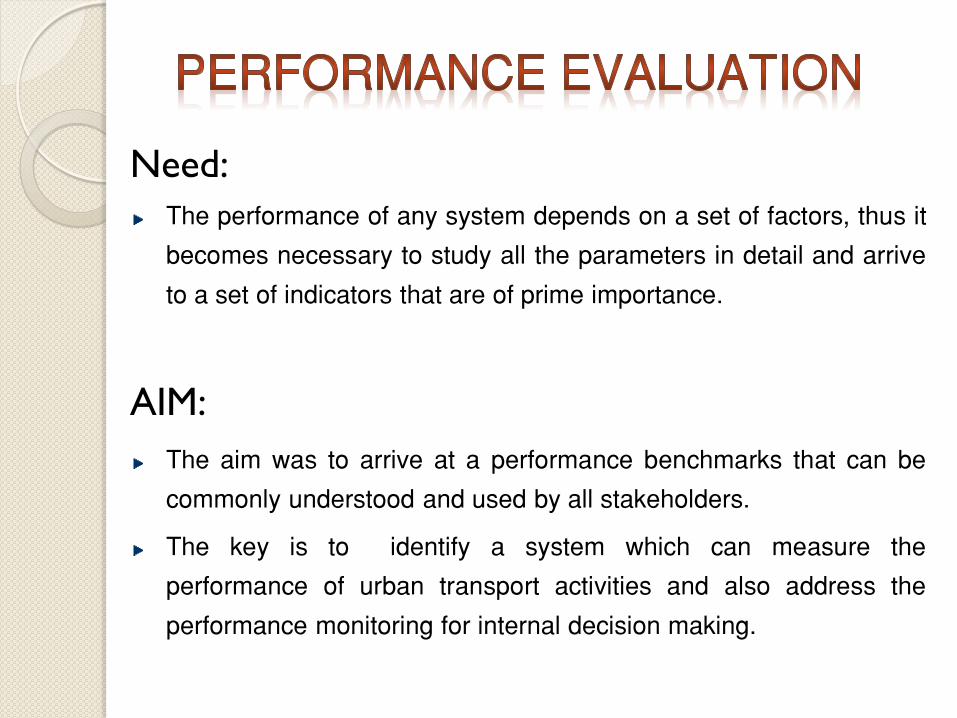
Need:
The performance of any system depends on a set of factors, thus it
becomes necessary to study all the parameters in detail and arrive
to a set of indicators that are of prime importance.
AIM:
The aim was to arrive at a performance benchmarks that can be
commonly understood and used by all stakeholders.
The key is to identify a system which can measure the
performance of urban transport activities and also address the
performance monitoring for internal decision making.
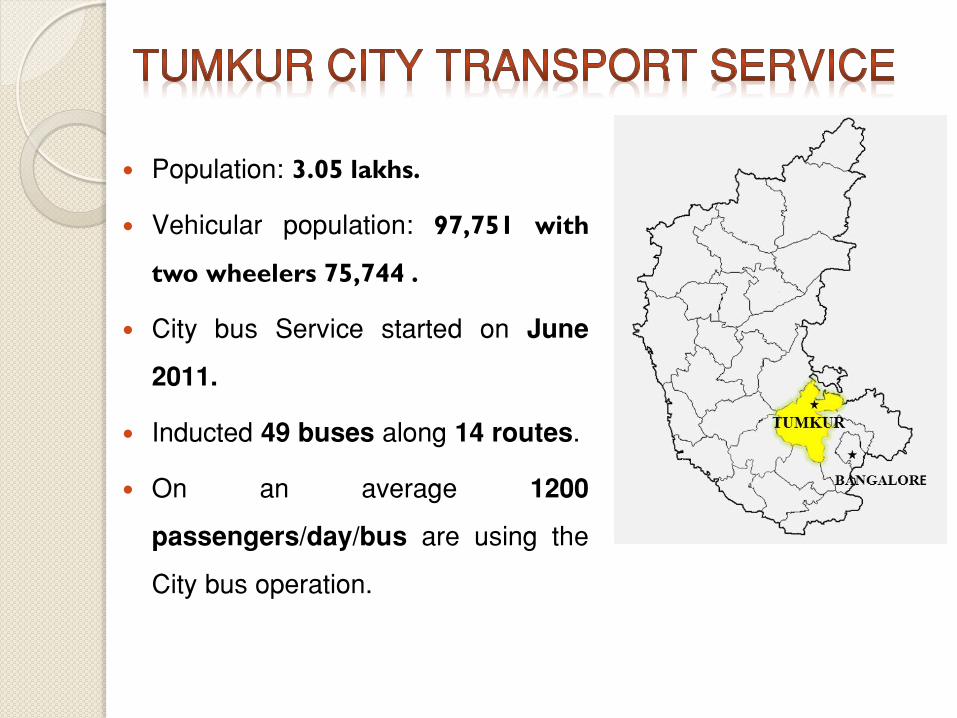
Population: 3.05 lakhs.
Vehicular population: 97,751 with
two wheelers 75,744 .
City bus Service started on June
2011.
Inducted 49 buses along 14 routes.
On an average 1200
passengers/day/bus are using the
City bus operation.

Number of passengers
Monthly Revenue
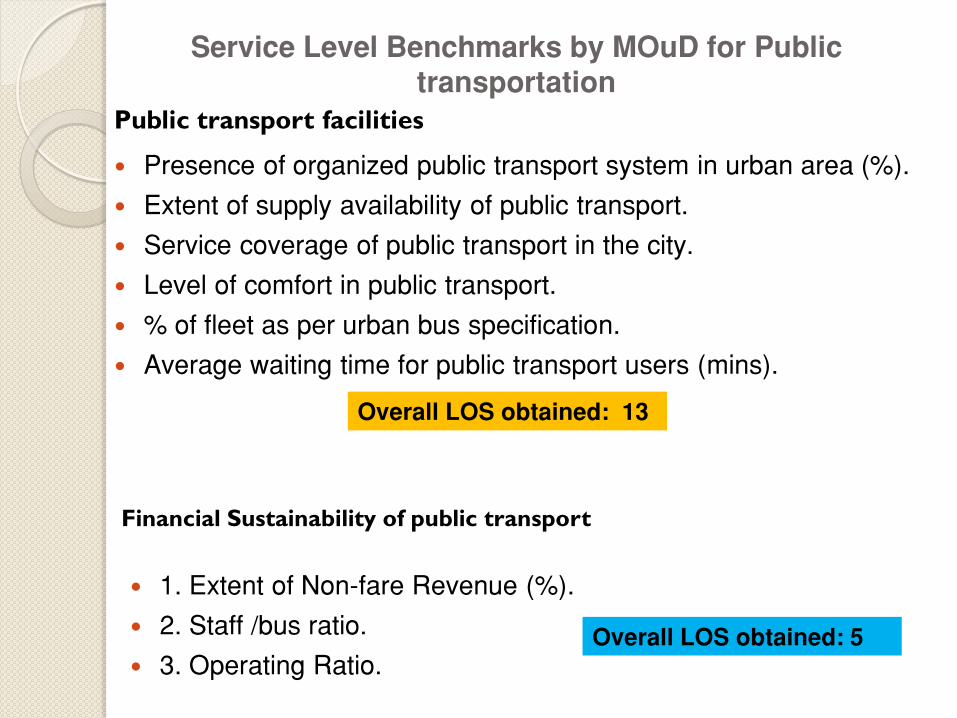
Service Level Benchmarks by MOuD for Public transportation
Public transport facilities
Presence of organized public transport system in urban area (%).
Extent of supply availability of public transport.
Service coverage of public transport in the city.
Level of comfort in public transport.
% of fleet as per urban bus specification.
Average waiting time for public transport users (mins).
Overall LOS obtained: 13
Financial Sustainability of public transport
1. Extent of Non-fare Revenue (%).
2. Staff /bus ratio.
3. Operating Ratio.
Overall LOS obtained: 5

Performance evaluation criteria
Data source
• Primary survey-An opinion survey of bus passengers were collected
using a questionnaire having details like mode of travel, daily trip summary,
travel expenses, travel comfort, reasons for shifting to PT, behavior of bus
crew, Bus arrival & departure time at bus stops, etc.
• Secondary data collection- A detailed secondary data collection of
operational characteristic of city buses from KSRTC divisional office in
Tumkur in a prescribed format prepared.
Tumkur Bus Evaluation
City perspective User perspective Operators perspective
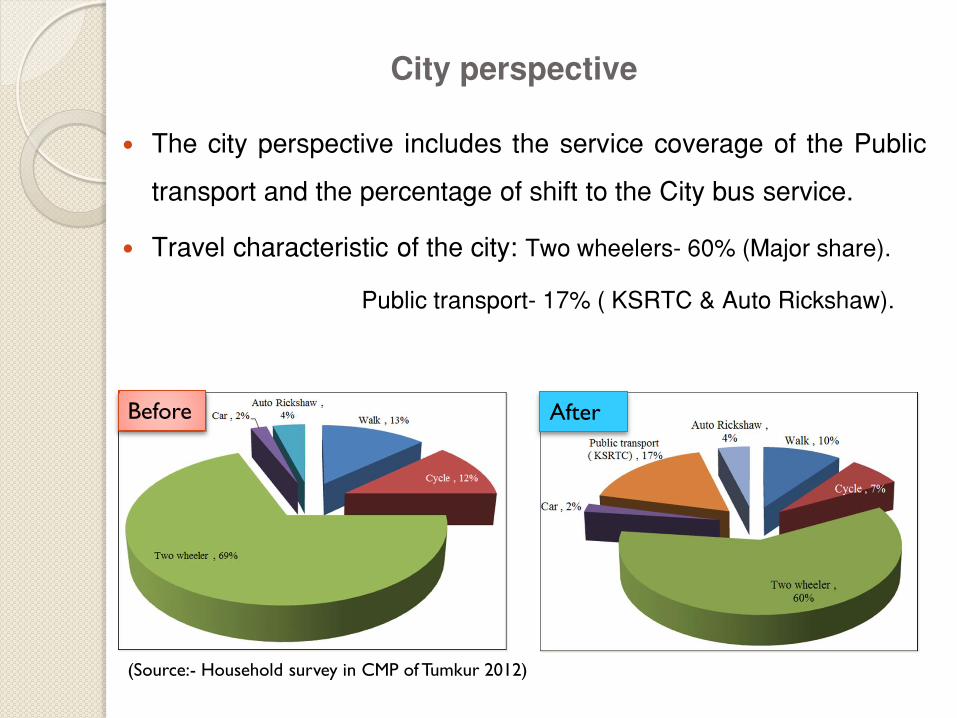
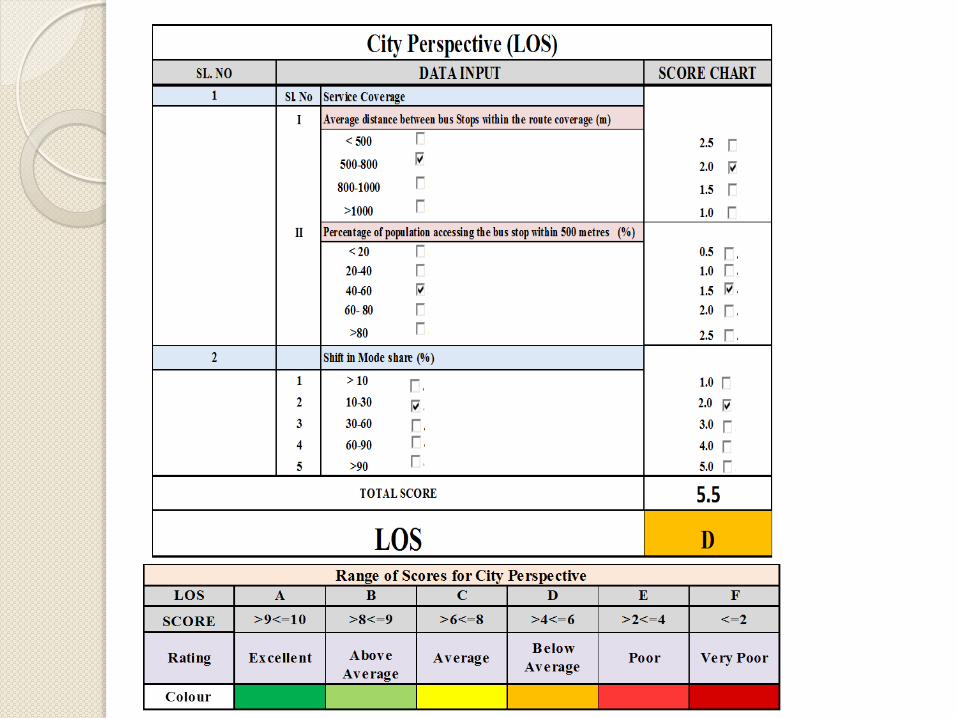
City perspective
The city perspective includes the service coverage of the Public
transport and the percentage of shift to the City bus service.
Travel characteristic of the city: Two wheelers- 60% (Major share).
Public transport- 17% ( KSRTC & Auto Rickshaw).
Before After
(Source:- Household survey in CMP of Tumkur 2012)
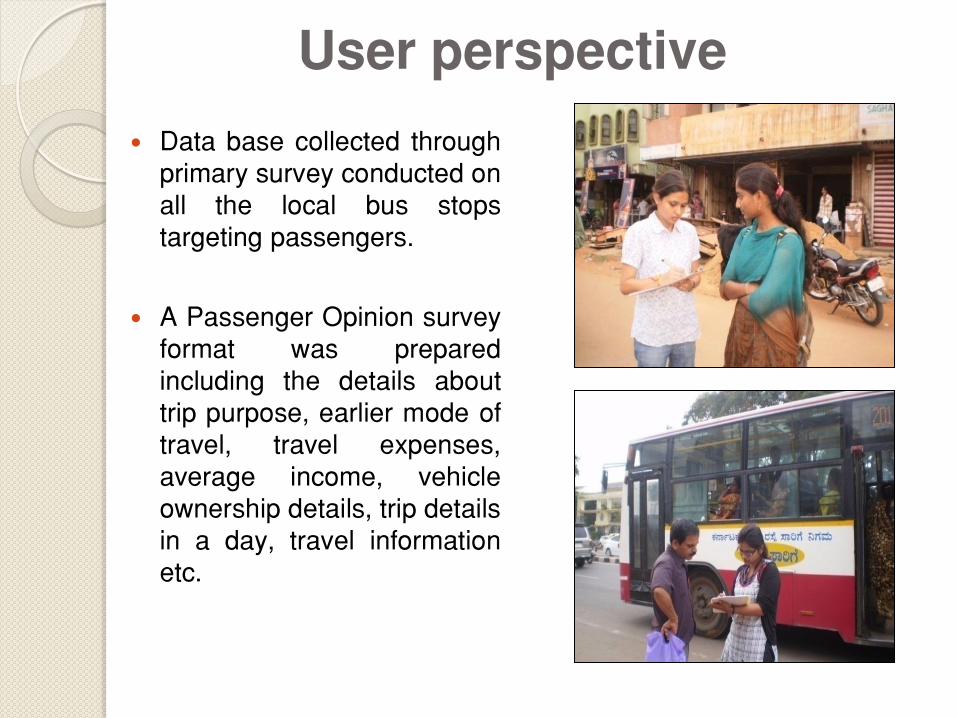
User perspective
Data base collected through primary survey conducted on all the local bus stops targeting passengers.
A Passenger Opinion survey format was prepared including the details about trip purpose, earlier mode of travel, travel expenses, average income, vehicle ownership details, trip details in a day, travel information etc.
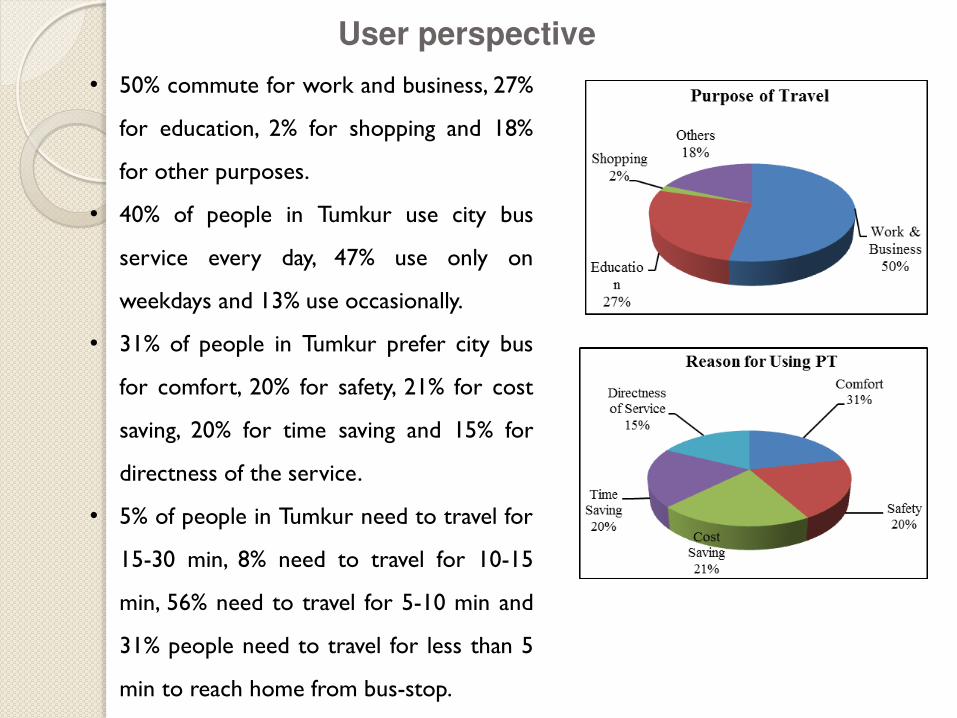
User perspective
• 50% commute for work and business, 27%
for education, 2% for shopping and 18%
for other purposes.
• 40% of people in Tumkur use city bus
service every day, 47% use only on
weekdays and 13% use occasionally.
• 31% of people in Tumkur prefer city bus
for comfort, 20% for safety, 21% for cost
saving, 20% for time saving and 15% for
directness of the service.
• 5% of people in Tumkur need to travel for
15-30 min, 8% need to travel for 10-15
min, 56% need to travel for 5-10 min and
31% people need to travel for less than 5
min to reach home from bus-stop.
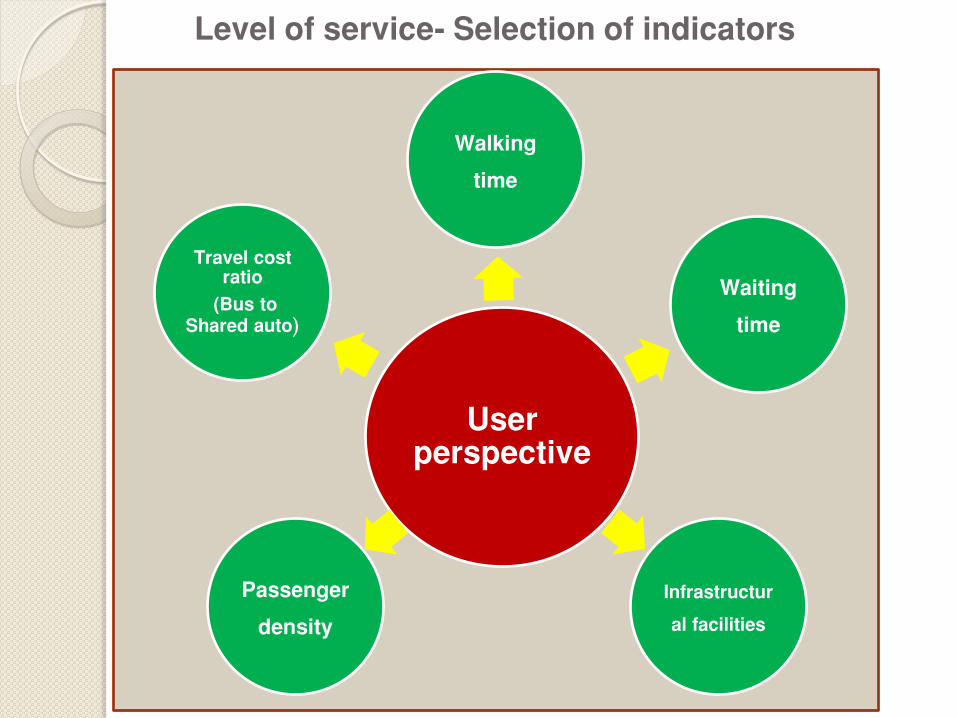
Level of service- Selection of indicators
User perspective
Walking
time
Waiting
time
Infrastructur
al facilities
Passenger
density
Travel cost ratio
(Bus to Shared auto)

1 Sl. No
1 < 5 2.0
2 5 - 10 1.0
3 10-15 0.5
4 >15 0.25
2
1 <5 2.0
2 5-15 1.0
3 15-20 0.5
4 >20 0.25
3
1 0-20 2.00
2 20-40 1.5
3 40-60 1.0
4 60-80 0.5
5 80-100 0.25
4
1 > 0.2 2.0
2 0.2-0.4 1.5
3 0.4-0.6 1.0
4 0.6-0.8 0.5
5 >1 0.25
5
1 Bus shelters, seating facility YES 0.5
NO 0
2 Lighting YES 0.5
NO 0
3 Footpath connectivity to the bus stop YES 0.5
NO 0
4 Route information (Bus timings, numbers) YES 0.5
NO 0
Infrastructural facilities
Travel Cost ratio (Bus to Shared Auto)
2.8TOTAL SCORE
LOS E
Load factor or Passenger density (%)
Average Waiting time (Min)
Commuter Perspective (LOS)
SL.NO DATA INPUT SCORE CHART
Walking time to Transit stop (Min)
C
CC
C
C
CC
CC
C
CC
CCC
C
C
C
C
C
C
C
C
C
C
C
CC
CCCCC
C
CCCC
C
C
C
C
CC
C
CC
C
C
CCCC
LOS A B C D E F
SCORE >9<=10 >8<=9 >6<=8 >4<=6 >2<=4 <=2
Colour
Range of Scores for User Perspective
Rating Excellent Above
AverageAverage
Below
AveragePoor Very Poor

Operators perspective
• A detailed secondary data
collection of operational
characteristics of city bus was
obtained in a prescribed format
from KSRTC as data base.
• The major aspects involved in are
physical requirement, daily bus
utilization, staff position of the
operator, fuel performance,
accidents and financial revenue
returns.
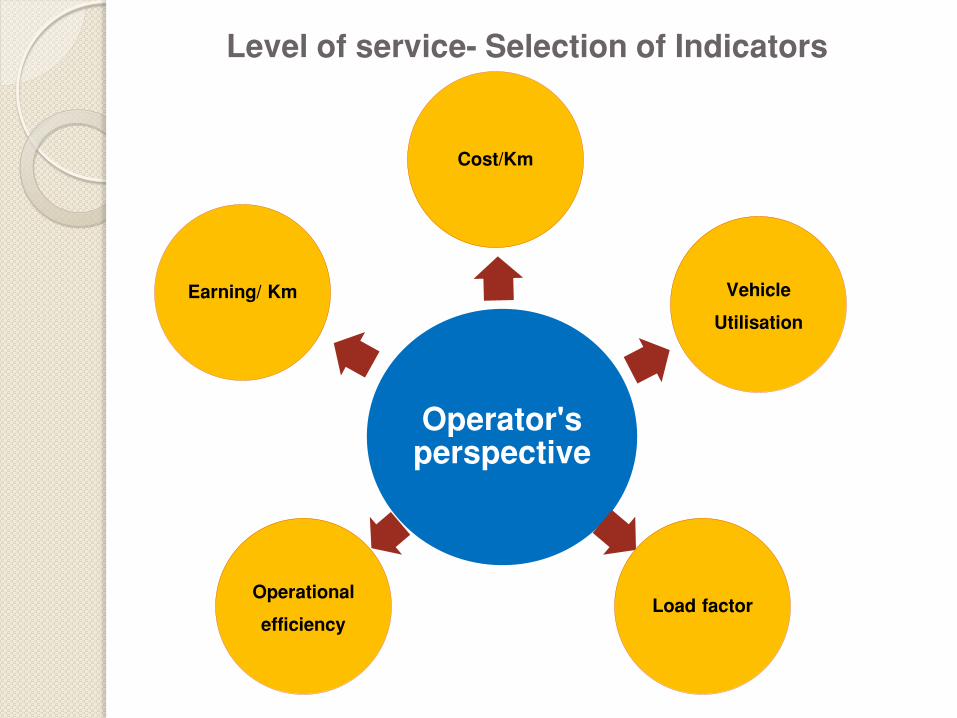
Level of service- Selection of Indicators
Operator's perspective
Cost/Km
Vehicle
Utilisation
Load factor Operational
efficiency
Earning/ Km
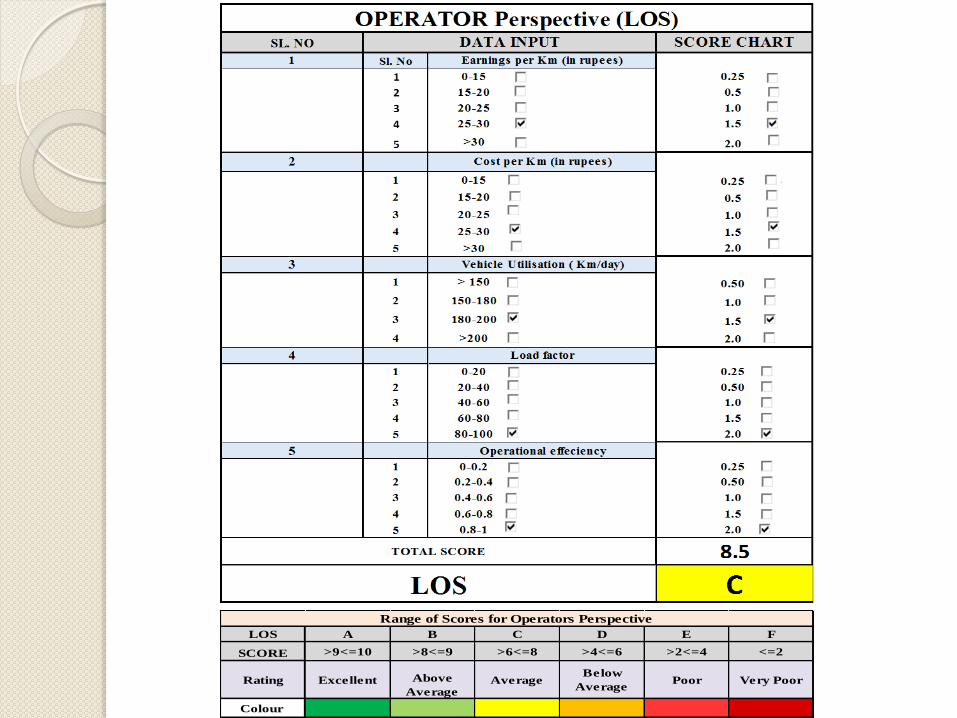
LOS A B C D E F
SCORE >9<=10 >8<=9 >6<=8 >4<=6 >2<=4 <=2
Colour
Range of Scores for Operators Perspective
Rating Excellent Above
AverageAverage
Below
AveragePoor Very Poor
