performance evaluation of open graded friction …
TRANSCRIPT

PERFORMANCE EVALU
FRICTION COURSE AND STONE MATRIX ASPHALT MIXES
MALAVIYA NATIONAL INSTITUTE OF TECHNOLOGY JAIPUR
ORMANCE EVALUATION OF OPEN GRADED
FRICTION COURSE AND STONE MATRIX ASPHALT MIXES
Ph. D. THESIS
by
NEHA SHARMA
I.D. 2012RCE9028
MALAVIYA NATIONAL INSTITUTE OF TECHNOLOGY JAIPUR
JAIPUR
August, 2017
TION OF OPEN GRADED
FRICTION COURSE AND STONE MATRIX ASPHALT MIXES
MALAVIYA NATIONAL INSTITUTE OF TECHNOLOGY JAIPUR

PERFORMANCE EVALUTION OF
COURSE AND STONE MATRIX ASPHALT MIXES
Professor, Department of Civil Engineering
in partial
MALAVIYA NATIONAL INSTITUTE OF TECHNOLOGY, JAIPUR
ORMANCE EVALUTION OF OPEN GRADED FRICTION
COURSE AND STONE MATRIX ASPHALT MIXES
by
NEHA SHARMA
(I.D. - 2012RCE9028)
Supervisor
Dr. B. L. Swami,
epartment of Civil Engineering & Dean Academic, MNIT Jaipur
Submitted
partial fulfillment of the requirements of the degree of
DOCTOR OF PHILOSOPHY
to the
Department of Civil Engineering
MALAVIYA NATIONAL INSTITUTE OF TECHNOLOGY, JAIPUR
August, 2017
OPEN GRADED FRICTION
COURSE AND STONE MATRIX ASPHALT MIXES
MNIT Jaipur
MALAVIYA NATIONAL INSTITUTE OF TECHNOLOGY, JAIPUR

© Malaviya National Institute of Technology Jaipur -2017
All rights reserved
i
ACKNOWLE DGEMENT
All admirations and gratitude are due to God, for his kindness and clemency
throughout this work.
With utmost sincerity and pleasure, I express my profound gratitude to Dr. B. L.
Swami, Professor, Department of Civil Engineering, MNIT Jaipur, supervisor of my
Ph.D. for their active guidance, motivation and consistent encouragement throughout
this research work. Dr. Gunwant Sharma, HOD, Department of Civil Engineering,
MNIT Jaipur, Dr. A. K. Vyas, Professor, Dr. J.K. Jain, Professor, Dr. Pawan Kalla,
Assistant Professor, Dr. Arun Gaur, Assistant Professor and Dr. A. B. Gupta,
Professor, Department of Civil Engineering, MNIT Jaipur, they will always remain a
source of inspiration for me.
I am highly grateful to Dr. S. Gangopadhaya, Director CRRI and Dr. P. K. Jain,
Head-Flexible Pavement Division, CRRI for giving permission to work at CRRI,
New-Delhi for advance experimental work.
Er. Kundan Kumar, Sr. Manager at GR Infraprojects Limited (GRIL) for providing
facilities, at Material Testing Lab of GRIL at Jaipur Airport site for experimental
work.
Special thank to Goverdhan Sonwal, Prabhu Solanki, Prachi Khushwaha, Sanchit
Anand, M.Tech Students, MNIT Jaipur and Chandrakant Mani, Project Assistant at

ii
FPD, CRRI New Delhi for their support
I am also thankful to Mr. Rajesh Saxena, Mr. Anil and Mr. Ramjilal of Civil
Engineering Department, MNIT for their kind support and help.
It is my proud privilege to acknowledge the blessings of my parents Mr. R.C.
Sharma & Mrs. Saroj Sharma and in-laws Mr. Ashok Sharma and Anjana Sharma.
Guidance and unconditional support from brother Kulvaibhav Sharma and Sisters
Nidhi Sharma and Kirty Sharma, in achieving this life time goal. It would not have
been possible to carry out this research work without the active support of my husband
Divas Sharma, who has boosted my moral during most difficult phases and lit the
hope of success throughout the tenure of the research. The words can hardly match
his contribution. But still with my utmost sincerity I would like to acknowledge his
contribution in the completion of this thesis.

iii
ABSTRACT
Hot Mix Asphalt (HMA) is a bituminous mixture of coarse aggregate, fine
aggregate, filler and binder, where all constituents are mixed, placed and compacted
at high temperature. HMA can be dense graded mixes known as Bituminous
Concrete (BC) and Dense Graded Bituminous Macadam (DBM), gap graded mix
known as Stone Matrix Asphalt (SMA) or open graded mix known as Porous or
Open Graded Friction course (OGFC).
The research work is laboratory evaluation of Stone Matrix Asphalt (SMA) and
Open Graded Friction course (OGFC) mixes using modified binders and Warm Mix
Asphalt (WMA), in comparison to convention asphalt for use as a surface course in
India. SMA and OGFC mixes are new generation of asphalt pavement being
designed for special purpose, used for surface courses only. SMA mix is for rut
resistance and durable pavement. OGFC or Porous mixes are for storm or rain water
management technique, which provide better surface friction quality, especially in
wet weather. SMA and OGFC mixes have qualities of reducing splash & spray,
noise reduction and provide high speed road network especially used at high traffic
volume. Both the pavement mixtures may be beneficial for economic development
of country by providing better road transportation.
In many countries SMA and OGFC mixes are successfully being constructed and
performing very well. But in India, both type of mixtures are not in use and also not

iv
having proper specifications for design and construction. In India, only trial
stretches of SMA pavement were laid in some places whereas, rutting or permanent
deformation is common distress on Indian roads. Porous pavement is very important
when concern water scarcity or rain water runoff and evaporation problem in
INDIA. But there is not any guideline, standards or specifications for
implementation of these type of mixtures for Indian pavements.
This study is an effort to evaluate pavement performance of Stone Matrix Asphalt
(SMA) and Open Graded Friction Course (OGFC) using nearby available
construction materials to ensure satisfactory performance of these pavements in
India. Engineering properties of OGFC and SMA mixtures with different asphalt
binders were tested, through laboratory test developed for dense graded mixtures
and standards and specifications of National Center of Asphalt Technology (NCAT),
updates of the design procedure found in Federal Highway Administration Report
(FHWA), National Asphalt Pavement Association (NAPA). During the research
work Ministry of Road Transport and Highway (MoRTH, 2013) has also publish
specifications for construction of SMA mixes, which were also incorporated.
For this research work five mix designs were done with five different binder types;
one conventional bitumen (VG-30), two modified bitumen (PMB-40 and CRMB-
55), two warm mix asphalt (produce by using dose of Evotherm and Zycotherm
chemical additive in PMB-40 as a base binder). Which will assist in characterizing
and understanding effect of using polymer modifier binder and warm mix asphalt

v
technology in comparison to Plain bitumen of Viscosity Grade 30/ penetration grade
60/70 (VG-30). Selection of binder type was done as per climate condition
(temperature condition) of Rajasthan.
Use of Crumb Rubber Modified Binder (CRMB), will help in solving the disposal
problem of Low density Polythene (LDPE) and will also improve quality of mix.
Warm Mix Asphalt (WMA) is an energy-efficient and environmentally friendly
product that significantly lowers mixing, production, placing and compaction
temperatures of asphalt mixes up to 35 to 45°C. Such drastic reduction in
temperature requirement of HMA, have the benefit of less fuel consumption and so,
decreases production of greenhouse gases, CO2 emissions and overall decrease in
site temperature, also provide better working condition for labor and better
compaction of mixes and increased paving season etc.
Pavement performance in terms of pavement stiffness, moisture susceptibility,
elasticity property, permanent deformation and rut depth of mixtures is measured by
the Indirect Tensile Strength(ITS), Tensile Strength Ratio (TSR), Resilient modulus
of Elasticity (Mr), Dynamic Creep and Wheel Rut Depth tests.
Results showed that using polymer modified binders and WMA (even at lower
mixing and compaction temperature) instead of unmodified asphalt/ plain bitumen
improved the performance of the Stone Matrix Asphalt and Open-Graded Friction
Course Mixture.

vi
A final comparative study of both the type of mixtures is also done, which will help
in selecting a design mix on the basis of purpose of road construction or particular
demand of the area where road have to be planned.
KEY WORDS: open-graded friction course, stone matrix asphalt, mix design,
polymer modified binder, warm mix asphalt, fiber, draindown, abrasion, moisture
susceptibility, deformation and rutting.

vii
CONTENTS
ACKNOWLEDGEMENT i
ABSTRACT iii
LIST OF FIGURES ix
LIST OF TABLES xv
LIST OF ABBREVIATIONS xviii
CHAPTER 1 INTRODUCTION
1.1 General 1
1.2 Open Graded Friction Course 3
1.3 Stone Matrix Asphalt 5
1.4 Warm Mix Asphalt 6
1.5 Modified Binder 8
1.6 Need of The Study 9
1.7 Objectives of The Study 11
1.8 Scope of The Research 12
1.9 Structure of Thesis 14
CHAPTER 2 REVIEW OF LITERATURE
2.1 General 15
2.2 Difference Between BC/ DBM, SMA and OGFC Mixes 16
2.3 Current Scenario of Flexible Pavement 19
2.4 Open Graded Friction Course 21

viii
2.5 Stone Matrix Asphalt 24
2.6 Modified Binder 32
2.7 Warm Mix Asphalt 35
2.7.1 ZycoTherm 37
2.7.2 Evotherm 38
CHAPTER 3 CHARACTERIZATION OF MATERIAL AND
METHODS
3.1 Introduction 40
3.2 Methodology 41
3.3 OGFC Mix Design 44
3.3.1 Material Selection 44
3.3.1.1 Aggregate 45
3.3.1.2 Fiber 46
3.3.1.3 Filler 49
3.3.1.4 Binder 50
3.3.2 Selection of Design Gradation 53
3.3.3 Determination of Optimum Binder Content (OBC) 57
3.4 SMA Mix Design 61
3.4.1 Material Selection 62
3.4.2 Selection of Design Gradation 63
3.4.3 Determination of Optimum Binder Content (OBC) 66
3.5 Marshall Mix Design of The OGFC/ SMA Mixes 71
3.5.1 Marshall Stability and Flow Value 75

ix
3.5.2 Retained Stability Test 76
3.5.3 Voids In Coarse Aggregate (Dry Rodded Method) 77
3.5.4 Abrasion Test 78
3.5.5 Aging Test 79
3.5.6 Draindown 80
3.6 Performance Test on Bituminous Mixes 82
3.6.1 Indirect Tensile Strength Test (ITS) 82
3.6.2 Tensile Strength Ratio (TSR) 84
3.6.3 Resilient Modulus (Mr) Test 85
3.6.4 Dynamic Creep Test 89
3.6.5 Wheel Tracking Test 93
CHAPTER 4 ANALYSIS OF TEST RESULTS AND DISCUSSION
4.1 Introduction 98
4.2 Test Result of OGFC Mix Design 99
4.2.1 Void in Coarse Aggregate 99
4.2.2 Determination of Optimum Binder Content (OBC) 100
4.2.3 Marshall Stability of Various Mixes 114
4.2.4 Test Properties of The Mixes at Optimum Binder Content
(OBC)
115
4.3 Investigating The Performance and Durability of OGFC
Mixes
117
4.3.1 Indirect tensile strength test result 118
4.3.2 Tensile Strength Ratio (TSR) Test Results 120

x
4.3.3 Resilient Modulus (Mr) Test 122
4.3.4 Dynamic Creep Test Results 124
4.3.5 Wheel Tracking Test 127
4.4 Test Result of SMA Mix Design 129
4.4.1 Volumetric and Marshall Properties of SMA design mixes 129
4.4.2 Determination of Optimum Binder Content 129
4.4.3 Test Properties of The Mixes at Optimum Binder Content
(OBC)
138
4.5 Investigating The Performance and Durability of SMA
Mixes
140
4.5.1 Indirect tensile strength test result 141
4.5.2 Tensile Strength Ratio (TSR) Test Results 143
4.5.3 Resilient Modulus (Mr) 145
4.5.4 Dynamic Creep Test Results 147
4.5.5 Wheel Tracking Test 149
4.6 Comparison of OGFC ads SMA test performance 150
CHAPTER 5 CONCLUSIONS AND RECOMMENDATIONS
5.1 Conclusions 153
5.2 Recommendations 156
REFERENCES 157
LIST OF PUBLICATIONS 176
VITAE OF THE AUTHOR 178

xi
LIST OF FIGURES
Figure No. Title Page No.
Fig. 2.1 Comparison of dense, gap and open gradation structure
of HMA
16
Fig. 2.1 Comparison graph of BC, DBM, SMA and OGFC
gradation
16
Fig. 3.1 Flow diagram structure of Chapter3 43
Fig. 3.2 (a) Cellulose Fiber Close View
(b) Grounded Cellulose Fiber
49
Fig. 3.3 Evotherm and Zycotherm additive used in this study 51
Fig. 3.4 Various tests performed on Bitumen
(a) Ductility Test
(b) brookfield viscosity meter
(c) Stripping test
(d) Softening point test
52
Fig. 3.5 Typical S-curve for OGFC Gradation 57
Fig.3.6 Typical S-curve for SMA Gradation 66
Fig. 3.7 Marshall Stability testing machine 73

xii
Fig. 3.8 Vacuum pump set up 74
Fig. 3.9 Prepared Marshall Specimen at OBC 76
Fig. 3.10 Drainage Basket 81
Fig. 3.11 Indirect Tensile Strength Test Set-up 84
Fig. 3.12 Universal Testing machine (UTM) 88
Fig. 3.13 Resilient Modulus test apparatus 88
Fig. 3.14 Dynamic creep test set up 92
Fig. 3.15 Dynamic creep test specimen 92
Fig. 3.16 Slab Compaction machine 95
Fig. 3.17 Compacted SMA and OGFC Slab 95
Fig. 3.18 Wheel Tracking Test in progress 96
Fig. 3.19 Wheel Tracking Device Set-up 96
Fig. 4.1 Determination of Optimum Binder Content using VG-
30 for OGFC Mix
105
Fig. 4.2 Determination of Optimum Binder Content using
PMB-40 for OGFC Mix
107
Fig. 4.3 Determination of Optimum Binder Content using
CRMB-55 for OGFC Mix
109

xiii
Fig. 4.4 Determination of Optimum Binder Content using
WMA-E for OGFC Mix
111
Fig. 4.5 Determination of Optimum Binder Content using
WMA-Z for OGFC Mix
113
Fig. 4.6 Marshall Stability of OGFC mixes versus binder
content with various binder
114
Fig. 4.7 Test results of Indirect tensile Strength Test of OGFC
mixes
119
Fig. 4.8 Test results of Tensile Strength Ratio of various OGFC
mixes
121
Fig. 4.9 Resilient modulus Test Results of OGFC mixes with
various binder type
123
Fig. 4.10 Typical results of Resilient Modulus test in UTM
(Sample-SMA mix design with VG-30 binder @35°C)
123
Fig. 4.11 Cumulative Strain Vs No. of load Cycle Curve of creep
test for various OGFC mixes.
125
Fig. 4.12 Typical results of Dynamic Creep test in UTM
(Sample-OGFC mix design with CRMB-55 binder)
126
Fig. 4.13 Rut depth of OGFC mixes by wheel tracking device 127
Fig. 4.14 Typical results of rutting test in HWTD (Sample-
SMA mix design with CRMB-55 binder)
128
Fig. 4.15 Test results of Indirect Tensile Strength Test of SMA 142

xiv
Fig. 4.16 Test results of Tensile Strength Ratio of various SMA
mixes
144
Fig. 4.17 Tensile Failure of Conditioned Specimen during ITS
test
144
Fig. 4.18 Resilient modulus Test Results of SMA mixes with
various binder type
146
Fig. 4.19 Cumulative Strain Vs No. of load Cycle Curve of creep
test for various SMA mixes.
148
Fig. 4.20 Rut depth of SMA mixes by wheel tracking device 149
Fig. 4.21 Comparison of TSR values of SMA and OGFC mixes. 151
Fig. 4.22 Comparison of cumulative strain in SMA and OGF C
mixes.
152
Fig. 4.23 Comparison of Rut Depth test results of SMA and OGF
mixes.
152

xv
LIST OF TABLES
Figure No. Title Page No.
Table 2.1: SMA Gradations Developed in Various Countries 31
Table 3.1 OGFC mix design requirement 45
Table 3.2 Physical properties of aggregates used 47
Table 3.3 Properties of Cellulose Fiber used 48
Table 3.4 Properties of Hydrated Lime (Filler) used 49
Table 3.5 Binder type used in this study 50
Table 3.6 Physical properties of binders 52
Table 3.7 Adopted OGFC mix GRADATION as defined by
NCAT
55
Table 3.8 Sieve analysis of aggregate and Combined Gradation
of OGFC mix
56
Table 3.9 Mix Design Requirement of OGFC mix 60
Table 3.10 SMA mix design requirement 63
Table 3.11 Sieve analysis of aggregate and Combined Gradation
of SMA mixes
65
Table 3.12 Design Parameter of SMA Mixes 70

xvi
Table 3.13 Temperature during Marshall mix design process 73
Table 3.14 Percentage of Material in Marshall Specimen (in case
of 6.0 % binder)
74
Table 3.15 Dynamic Creep Test Parameters 91
Table 4.1 Void in Coarse Aggregate test results 100
Table 4.2 Test results of trial mixes for determination of
Optimum Binder Content (OBC) for OGFC mix design
with VG-30 binder
102
Table 4.3 Test result of determination of Optimum Binder
Content (VG-30) for OGFC mix with 0.4 % cellulose
fiber
104
Table 4.4 Test results of trial mixes for determination of
Optimum Binder Content (OBC) for OGFC mix design
with PMB-40 binder
106
Table 4.5 Test results of trial mixes for determination of
Optimum Binder Content (OBC) for OGFC mix design
with CRMB-55 binder
108
Table 4.6 Test results of trial mixes for determination of
Optimum Binder Content (OBC) for OGFC mix design
with WMA-E binder
110
Table 4.7 Test results of trial mixes for determination of
Optimum Binder Content (OBC) for OGFC mix design
with WMA-E binder
112
Table 4.8 Various test properties of Mixes at OBC 116
Table 4.9 ITS test result of OGFC mixes with various binders 118

xvii
Table 4.10 TSR value of OFC mixes with various binders 120
Table 4.11 Resilient Modulus value of OGFC mixes with different
binder types.
122
Table 4.12 Cumulative Strain of OGFC mixes with all binder
types
124
Table 4.13 Determination of Optimum Binder Content (OBC) for
SMA mix with VG-30 binder
133
Table 4.14 Determination of Optimum Binder Content (OBC) for
SMA mix with PMB-40 binder
134
Table 4.15 Determination of Optimum Binder Content (OBC) for
SMA mix with CRMB-55 binder
135
Table 4.16 Determination of Optimum Binder Content (OBC) for
SMA mix with WMA-E binder
136
Table 4.17 Determination of Optimum Binder Content (OBC) for
SMA mix with WMA-Z binder
137
Table 4.18 SMA mix properties at optimum binder content with
various binder type
140
Table 4.19 ITS test result of SMA mixes with various binders 141
Table 4.20 TSR value of SMA mixes with various binders 143
Table 4.21 Resilient Modulus value of SMA mixes with different
binder types
145
Table 4.22 Cumulative Strain of SMA mixes with all binder types
147

xviii
LIST OF ABBREVIATIONS
AASHTO American Association of State Highway and Transport Officials
ASTM American Society for Testing and Materials
BC Bituminous Concrete
CRMB-55 Crumb Rubber Modifier binder of penetration grade-55
DBM Dense Bituminous Macadam
FHWA Federal Highway Administration
Gmb Bulk Specific Gravity of the Mix
Gsb Bulk Specific Gravity of the Aggregate
Gmm Specific Gravity of the Mix
HMA Compacted Hot-Mix Asphalt
HWTD Hamburg Wheel-Track Device
IRC Indian Road Congress
IS Indian Standards
ITS Indirect Tensile Strength
MR Resilient Modulus
NAPA National Asphalt Pavement Association
xix
Note: The other symbols used in the text are explained as and when they are introduced
NCAT National Center for Asphalt Technology
OBC Optimum Binder Content
OGFC Open-graded Friction Course
PMB-40 Polymer Modifier Binder of penetration grade-40
SMA Stone Matrix Asphalt
TSR Tensile Strength Ratio
VCADRC Voids in coarse aggregate fraction only in dry-rodded condition
VCAMIX Voids in coarse aggregate skeleton
VFB Voids Filled with Bitumen
VG-30 Plain bitumen of Viscosity Grade-30
VMA Voids in Mineral Aggregates
VTM Voids in Total Mix
WTD Wheel Tracking Device
WMA Warm Mix Asphalt

1
CHAPTER 1
INTRODUCTION
========================================================================
1.1 General
The earliest traced modern roads were as far as 1500 B.C. in Rome. Between 300
B.C. and A.D.300, Romans built over 50,000 miles of well planned road network,
some of which remains today. In 1599 classification of asphalt was done and efforts
were started to find connection between asphalt and petroleum. In 1777, P.C. Lesage
explain the theory of origin of asphalt. In 1802, first time rock asphalt was used for
surfacing of bridge deck and sidewalk. John L. Mc. Adam started improvement of
roadways by interlock and compaction of stone surface, in 1815. This "macadam "
innovation lead to development of modern roads in Paris in 1858 and compacted
asphalt pavement in London in 1869. This bitumen bound aggregates were started to
use all over the word. In the late 1800’s, development of the automobile, arose the
need to provide safer and smoother road network for heavier vehicle.
Normally the performance of well, uniform, dense and close graded aggregates with
plain bitumen and proper design and execution, under normal traffic and
environmental condition is satisfactory. But due to the issue related to safety and
comfort of road users being adversely affected by "Rutting" and permanent

2
deformation with Dense Graded Mixture, a new more durable and stable gap, graded
mixture i.e. Stone Matrix Asphalt (SMA) have to designed. And the matter of
weather problems of higher incidences of skid related accidents crash during wet
weather, raises need of development of open graded friction course i.e. porous
pavement for providing users a roadway that is “reasonably” safe.
Both Open Graded Friction Course (OGFC) and Stone matrix Asphalt (SMA) are the
New generation of Hot Mix Asphalt (HMA) mixes, used as surface mixtures only.
Porous pavement surface has been started to apply in United States in mid 1940s, as
simple concrete "turfblocks" to address storm water flooding in the larger cities of
the United States. (Mathew 2014). The concept of porous asphalt was proposed in
1960, so as to reduce storm water, raise water table and replenish aquifer. A design
guide published at the Franklin Institute in Philadelphia, provided great initial
reference for many porous pavement constructed since today (NAPA 2008). With
proper design and construction material, no failure were shown. In porous pavement,
maintenance is main warning, clogging of surface must be prevented.
Stone Mastic Asphalt (SMA) has been developed during 1960s in Germany to resist
permanent deformation and shown better result in the United States as a stable and
durable surface mixture. Gap graded structure of the mix with maximum coarse
aggregate content, provide the mix stone-to-stone skeleton.

3
1.2 OPEN GRADED FRICTION COURSE
Open Graded Friction Course is a porous Hot Mix Asphalt (HMA) mix, used as
surface course in permeable pavement. This mix is a new improve way to protect the
environment by controlling wastage of precious "rain-water". OGFC pavement
surface allow water to drain through permeable surfaces into a stone recharge bed
and infiltrate into the soils below the pavement. For temporary storage of rain water,
an aggregate sub base reservoir provides underneath the porous asphalt.
A porous asphalt pavement is a storm water management technique which differs
from other asphalt pavement designs, as open gradation and structure of porous
pavement make fluid to quickly pass through it thus reducing the amount of run-off
from the adjacent area.
Open Gradation of the mix is because of coarse texture surface and high and
interconnected air void content throughout the mix. Uniformly graded aggregates
with very little fines is used. 50-60 % of coarse aggregate is taken as of same particle
size with less fines. Aggregate passing 2.36 mm sieve is kept less than 20% in the
mix, which is very less fines in comparison to dense graded mixture.
Effective service life of porous pavement is 7 to 10 years, with the proper design
and installation and maintenance practice these pavements provide attractive and
cost effective pavement with a more than twenty years life span. OGFC surface
course provide aesthetically attractive and safer pavement with storm water
4
management systems that promote infiltration, improve water quality, and many
times eliminate the need for detention basin. Environmental benefit and safety
performance of these mixes makes them better than traditional HMA pavement.
Economic benefit of these pavement are to reduce the need for traditional storm
water infrastructure, reduces soil erosion, controls the amount of run-off from the
surrounding area by allowing precipitation and run-off to flow through the structure.
Strength of a open gradation mixes depends on underlying structure. In case of low
traffic pavement, parking lots, shoulders, sidewalks, pathways, drains, noise barriers
area, tennis courts, patios, zoo areas, green house floors and swimming pool decks
porous asphalt pavement solely can be used for pavements. For high traffic and
heavy wheel loads porous asphalt pavement are constructed with underline sub-base
and base structure.
They reduce splash and spray from tires in wet weather and typically result in a
smoother surface than dense-graded HMA. OGFC mixtures should only be used on
high speed and high traffic volume. Higher speed traffic reduced the clogging of
pores due to debris.
Although, porous pavement are being used worldwide successfully due to its
environmental benefit and better performance, these type of pavement are still not so
much in practice in INDIA.

5
1.3 STONE MATRIX ASPHALT
Stone Matrix Asphalt (SMA) is a special type of mix, characterized by high quality
coarse aggregates with rich proportion of binder and fiber additives. SMA is a gap
graded hot mix asphalt mixture containing 70-80% coarse aggregate of total
aggregate mass, 6-7% of binder, 8-12% of filler and about 0.3-0.5% of fiber or
modifier. It consist of higher proportion of coarse aggregate & mineral filler and
lower proportion of middle size aggregate as compared to dense graded mixtures.
High concentration of coarse aggregate provides stone-to-stone contact to the
mixture. This stone-on-stone skeleton provides strength to the mix and wear from
studded tires, increased pavement performance with outstanding rutting resistance
under heavy loads. Higher asphalt content makes the pavement more durable. Also
reduce tire splash and tire noise. Higher binder content causes draindown during
production, transportation and laying. Fiber or modifiers/ stabilizers are also added to
mixture to prevent draindown.
The success in Europe has encouraged the other countries to adopt the use of SMA
mixtures particularly on high volume roads such as interstates and urban
intersections. However, this new methodology has to be evaluated using Indian
materials to ensure satisfactory performance in India.
SMA is often considered a premium mix because of higher initial costs due to
increased asphalt contents and the use of more durable aggregates. However, this
higher initial cost may be offset by the improved performance of pavement for

6
medium and high traffic loading situations. In addition to improved durability and
rutting resistance, coarser surface texture of SMA pavement is also beneficial in tire
noise reduction, fatigue resistance, improved wet weather friction. Reflecting cracks
in SMA pavement are less than dense-graded mixtures.
1.4 WARM MIX ASPHALT
Warm mix Asphalt (WMA) is a relatively new technology of pavement construction,
developed in 1990s. Construction of WMA pavements started in Europe in 1997. An
additive is added to base binder which emulsify the binder. Emulsification of binder
causes much less energy consumption and also results into less emissions during,
construction. This condition provided better work condition and better paving
condition.
WMA technology can reduce fuel consumption significantly and so, emissions
during pavement construction process. The benefit of WMA is related to reduced
handling temperature of mixing, placing and compaction. WMA technology provide
longer possible haul distance, longer paving season and early opening the road to
traffic as compared to traditional mixes. These benefit associates with less CO2
emissions and other harmful byproducts. These attributes are beneficial for health of
workers and environment. (Vaitkus et al. 2009).
Use of WMA with OGFC and SMA mixes will increase the market for each, as
mitigation of problems associated with OGFC and SMA mixes and improvement in

7
performance of mixes by taking in consideration of warm mix asphalt. Like SMA
and OGFC requires higher binder content. High binder contents resulting in thick
binder films.
In OGFC and SMA mixtures average binder film thickness requires is 8-11 micron,
which is much higher than average film thickness of 4-6 micron in typical dense
graded mixes. Film thickness is calculated based on effective asphalt content.. This
thicker film of binder is essential for longevity. The heavy binder film on aggregate
surface helps to resist stripping and oxidation of the asphalt cement (FHWA 1990).
This higher binder content causes drain down which can be corrected by lowering
the mixing temperature. Higher temperature during mixing and compaction also
cause the asphalt binder film to flow off from the aggregate surface. Which may
results in some are having not enough asphalt and excessive binder in other part.
WMA technology helps in lowering mixing and handling temperature.
Government of India, had also expressed serious concern over the environmental
pollution being caused due to manufacturing and application of hot mixes. In order
to find suitable solutions, WMA may be a better solution as producing less emissions
and also improve performance of bituminous mixes and can be laid mechanically
and at a faster rate in critical intersections.

8
In this research, Evotherm and Zycotherm two additives were used with PMB-40 as
base binder to produce WMA. Both the additives work on one principal of
improving binder properties at lower temperatures than hot mix asphalt binder.
Additives improve the quality of binder by improving chemical bonding between
aggregate and asphalt. Also provide complete waterproofing to the mixture due to
penetration and chemical bonding of asphaltic layer. And thus eliminates moisture
induce damage of asphaltic layer. Also ensure uniform load transfer and provide dust
control. Zycotherm/ Evotherm additives provide all this qualities to binders even at
lower residual bitumen.
1.5 MODIFIED BINDER
Modified binder improve the performance of bituminous mixed used in the surfacing
course of roads. The threat of disposal of rubber and plastic waste was also solved by
this initial step. Modified binder also increases the life of bituminous mixes. In this
research work two types of modified binders have been used i.e. Polymer Modified
Binder (PMB) and Crumb Rubber Modified Binder (CRMB).
PMB - In this research work, Polymer modified bitumen which is thermoplastic in
nature is used for improving the performance of the mixes. Polymer is a long chain
or clusters of small molecules formed by chemically reacting many (poly) smaller
molecules (monomers) to one another. Polymer used for this study is thermoplastic
9
in nature. When heated, thermoplastic materials become soften like plastic but return
to their hardened state upon cooling.
CRMB - Crumb Rubber Modified Bitumen is prepared by improving the quality of
binder by the addition of crumb rubber and special types of additives like
hydrocarbon materials, resins etc. These additions alter the physical properties of
bitumen by making it more durable, resistant to temperature variations, and high
traffic loads, weather and provide better adhesion between aggregate and binder
which ensures longer life, strength and stability of the mix, reduced maintenance
costs and excellent driving comfort.
1.6 NEED OF THE STUDY
India is a faster developing country, doing well in many field like, industrialization,
education and fashion but there are still certain fields where country is lagging
behind. Condition of the roads are still bad, not even in villages but also in
metropolitans and cities. Hot mix asphalt pavements are facing serious distress
problems everywhere. So much have to be done through research and innovations to
improve quality of asphalt pavement. Tensile cracking and rutting along wheel path
of vehicles are predominate on Indian roads, in comparison to other forms of
distress.
Tropical countries like India (Rajasthan) with predominantly warm/hot climates,
faces major problems of water scarcity (runoff and evaporation of rain water) and

10
excessive rutting in flexible pavements with bituminous wearing courses. In order to
provide skid resistance to pavement with lower run off, OGFC mix can be suggested.
And further, Stone Matrix Asphalt (SMA) mixes, which are primarily gap graded
mix, characterized by high coarse aggregates, high asphalt contents, less fines and
fiber additives as stabilizers, may be a good solution as rut resistant wearing courses.
High concentration of coarse aggregate maximizes stone–on–stone contact and
interlocking in the mix which provides strength, and the rich binder provides
durability
For economic growth of the country these new generation pavements should be
constructed, but with any new technology drawback of unfamiliarity of industry and
workers is associated. This research work mainly focused on to provide a basis
through comparative study for implementation of new generation pavements in
India.
SMA mixes can provide more durable pavement having great rutting resistance
potential. Smooth and fast movement of vehicles due to better pavement condition
with SMA mixes will also increase passenger comfort and will reduce traffic
congestion and vehicle fuel consumption to some extent.
OGFC pavement can solve the wet weather difficulties and can also provide good
friction characteristics for Indian pavement surfaces and can also solve water
problem of most of Indian states to some extent by infiltration of rainwater thus
reducing the amount of run-off from the adjacent area.

11
In many countries OGFC have been proposed to deal the serious safety problem
during rainy season due to hydroplaning and loss of visibility resulting from
excessive water splash from heavy traffic.
Open Grade Friction Course mix is used for safety purpose by immediate removal of
water from pavement surface, but large void structure of the mix allows much more
exposure of air and water and poor durability than traditional dense graded mixes.
This additional exposure of the mix, increases moisture susceptibility of pavement.
As a solution of these problems, performance of modified binder and warm mix
asphalt were evaluated in this research.
1.7 OBJECTIVES OF THE STUDY
This research is a laboratory evaluation of OGFC and SMA mixes. The objectives of
the research are as under :-
To study the performance of OGFC and SMA mixes with the use of modified
binders and warm mix binders in comparison to conventional asphat.
Performance test on OGFC and SMA mixes and compares the result of
OGFC and SMA mixes.

12
1.8 SCOPE OF THE RESEARCH
The primary objective of this research work is to evaluate effectiveness of various
binders in producing high quality OGFC and SMA mixes. Specifically, this study is
focused on improving performance of the mixes using modified binder over
conventional asphalt. Also improving environmental condition and pavement quality
using warm mix asphalt. In this study five different binders i.e. Plain bitumen of
Viscosity Grade 30 (VG-30), PMB-40 (Polymer Modifier Binder of penetration
grade-40), CRMB-55 (Crumb Rubber Modifier Binder of penetration grade-55),
WMA-E and WMA-Z (Warm Mix Asphalt produce by adding Evotherm and
Zycotherm additive in PMB-40 as a base binder) and one aggregate source, cellulose
fiber (as stabilizer) and hydrated lime (as filler and anti-stripping agent) were used
for OGFC and SMA mix designs. This will assist in characterizing and
understanding the effect of using polymer modifier binder and warm mix asphalt
technology in comparison to Plain bitumen. Mix designs for 19-mm nominal
aggregate size OGFC mix were done according to the design procedure proposed by
the National Center of Asphalt Technology (NCAT) for a range of 5.0–7.0 % asphalt
binder. Mix designs for 13mm maximum aggregate size SMA (wearing course) were
performed according to the specification and design procedure proposed by the
Ministry of Road Transport and Highway, Highway Manual Specifications for Road
and Bridge Works (MORTH, 2013) for a range of 5.0–7.0 % asphalt. The optimum

13
binder content was determined as per design requirement of the mixes. The scope of
the study is limited to following-
1. Conducted a detail review of the literature related to OGFC, SMA,
Modified binder and WMA.
2. Prepare mix designs using one aggregate source, five different binders,
one cellulose fiber, one filler for 19-mm nominal aggregate size OGFC
mix and same for 13-mm nominal aggregate size (Wearing Course,
Morth,2013) SMA mix.
3. Volumetric and mechanical properties of Marshall mixes were
determined
4. Prepare specimen for 10 selected mix designs (5 OGFC+ 5 SMA) and
evaluate Indirect Tensile strength (ITS), Tensile Strength Ratio (TSR),
Resilient Modulus(Mr), Dynamic Creep, Rutting (Wheel Rut Depth) of
each mix design.
5. Comparative study of both the mixes is also done.
6. Provide recommendations for use of modified binders and WMA
technology in OGFC and SMA mixtures and future research.

14
1.9 STRUCTURE OF THESIS
The thesis has been divided into five chapters. Chapter 1 deals with introduction
and some background information about the topic as well as objectives and need of
study. In the chapter 2, a comprehensive literature review is presented about the
OGFC mixes, SMA mixes, modified binders and WMA technology including
history, performance, use, benefits and drawbacks of OGFC and SMA pavements,
and some of the latest research conducted using both technologies has been
presented. In the chapter 3, certain experimental plan has been finalized on the basis
of literature review. Within this chapter, characterization of all materials, the Design
parameters and experimental methods for SMA and OGFC mixes have been
presented and testing procedures used to realize the research objectives. Chapter 4
deals with the analysis and discussion of results for the entire study. The conclusions
from the study and recommendations for implementation and future research work
have been presented in the final Chapter 5.
15
CHAPTER 2
REVIEW OF LITERATURE
========================================================================
2.1 GENERAL
A detail review of literature has been made on the work related to OGFC and SMA
mixes, Modified binder and Warm Mix Asphalt (WMA) technology is described in
the following paragraphs. Not only in India, but all over the word majority of the
roads are flexible type. Flexible pavement consists of a bituminous layer as surface
course, granular layer as base and sub base course, over the subgrade.
Hot Mix Asphalt (HMA) is a most common type of bound layer of flexible pavement
structure as the surface or wearing course. HMA is mixture of coarse aggregate, fine
aggregate, filler and binder where, all the constituents are mixed, placed and
compacted at higher temperature. HMA can be dense graded mixture known as
Bituminous Concrete (BC) and Dense Graded Bituminous Macadam (DBM), gap
graded mixture like Stone Matrix Asphalt (SMA) or open graded mix known as
Porous or Open Graded Friction course (OGFC). The major difference between
three type of mixes is in their structural skeleton as shown in Fig. 2.1

16
2.2 DIFFERENCE BETWEEN BC/ DBM, SMA AND OGFC MIXES
Fig. 2.1 Comparison of dense, gap and open gradation structure of HMA
Fig. 2.2 Comparison graph of BC, DBM, SMA and OGFC gradation.
Conventional mixes like BC, DBM consist of 40-60 % coarse aggregates, SMA
consists of 70-80 % of high quality coarse aggregates in the mix, where as OGFC
consist of 50-60 % high quality coarse aggregates. Comparison graph of different
HMA mixes gradation is shown in Fig. 2.2 .
0
20
40
60
80
100
0.01 0.10 1.00 10.00 100.00 Per
centa
ge
Fin
er b
y W
eight
(%)
Sieve Size (mm)
OGFC, 19mm SMA 13mm BC 13.2 mm DBM 26.5mm BC 19 mm

17
BC mixes consist of 40 to 50 % fines aggregates, SMA consist of 20-25 % fine
aggregates and OGFC mixes have less than 20% fine particles of total aggregate
weight (Coarse aggregate, Fine Aggregate and Filler).
BC mixes consist of 6 to 4 % mass of filler where as SMA mix consist much more as
8 to 12 % mass of filler and OGFC mixes consist of much less as 2 to 4 % filler
content of total aggregate weight. (Bose et. al., 2006)
In dense graded mixes, pavement gain its strength from well-close-uniform designed
gradation of mixture, in which fine aggregate, filler and binder matrix plays main
role. In case of gap graded mixture, stone-to-stone contact of coarse aggregate
provide strength. Gap-graded mix is more durable and rut resistant than dense graded
mixtures because of its stone-on-stone skeleton. In case of open graded friction
course, strength of mixture depend on underlying structure.
Designed BC mix at optimum binder content should consist of 3 to 6 % air void (as
to maintain balance between elastic and stiffness property of mixes), while SMA
mixes should have 2 to 4 % design air void (much less as to maintain stone-to-stone
contact) and in case of OGFC mixes, it is much more as 17-25 %.(as to continue its
open gradation)
The second main difference lies in binder content. Conventional mix consist of 5 to 6
% binder. Below this quantity, mix becomes unstable and above this quantity, mix
lead to sudden drop of stability, because of filling all the voids and extra binder

18
makes the aggregate to float in binder matrix. In the SMA and OGFC mixes, there is
higher percentage (> 6.0 %) of binder, which accredited to filling more amount of
voids present in it, due to high coarse aggregate skeleton. This high amount of binder
contributes to the longevity of the pavement.
The third difference, use of stabilizing additives (fiber or polymer) in OGFC and
SMA mixes, which attributed to reduce drain down due to higher bitumen content by
filling up of large no of voids. On the contrary, there is no stabilizing agent in
convention dense or uniformly graded mix, Since the binder content is moderate,
which serve purpose of filling the moderate amount of voids and binding the
aggregate.
In general, nominal layer thickness of BC layer in pavement surfacing is 30-65 mm,
in case of SMA mixes, it is 25 to 75 mm while in case of OGFC mix it is much
thinner as 19mm for normal or thin layer OGFC surfacing and maximum 38 mm for
thick layer OGFC mix.
A primary difference between SMA and OGFC mixture is the air voids content as
SMA mixtures content approximately 3 percent air void in the mix, whereas OGFC
may have more than 20 percent air voids.
Too high air voids in HMA mixes increased rutting under traffic and binder aging.
Besides increased permeability, higher air void causes aging, cracking, raveling,
moisture damage to the mix and densification of pavement surface under traffic.
19
There has been reported a reduction of about 10% in pavement service life for each
1% increased in air voids over 7%. Low air voids may cause plastic flow of surface
and shoving under traffic.
2.3 CURRENT SCEANARIO OF FLEXIBLE PAVEMENT
As per performance report of dense and well graded mixtures in recent year,
premature rutting has been increasing in heavy duty pavement. High axle load and
truck tires pressure causes premature deformation in pavement. Modification of
pavement mixes by change in the gradation of binder and base course with the use of
large size stone will minimize or control the rutting to a great extent ( Kandhal et al.
1990)
The highway traffic in India is rising more rapidly rate with the increasing
population and the road network has also expanded in different regions of India. This
has led to an enhance in the number of heavy vehicles, as the travel time and vehicle
operating costs have increased vastly. Apart from the increase in truck traffic, there
is also a huge difference in the maximum and minimum temperatures of the country.
The maximum air temperature can reach even 50°C in some parts of the country and
the resulting pavement temperature can reach up to 60°C (Raghuram and Chowdary
2013).
With the increase in loading and temperatures, the pavements are subjected to
various types of distresses. Rutting has been observed to be a major distress in
flexible pavements and several studies were carried out across the globe to quantify

20
the mechanisms of rutting and to reduce the effective rut depth along the wheel path.
SMA mixes may prove a good solution of these pavement distresses problems, since
they resists permanent deformation and has the potential for long term performance
and durability.
Another major issue of road network is related to environmental. As most of the
states of our country and also all over the world, there is serious issue of "water
deficiency". Highways covers a major portion of the land. A number of studied are
also being done to store valuable rain water which evaporates or runoff from large
surface of highways. Furthermore, stagnate water on road surface also causes splash
and spray, hydroplaning, potholes and stripping of bituminous mixes. Immediate
removal of this rain water through drain will also reduce accidents/ problems related
to skidding and slippery action of wet roads and reduce visibility especially during
nights. Porous pavement or pavement with open graded friction course mixes are
being constructed in many developed countries, as a solution of above mentioned
issues along with a good surface quality road pavement.
One more important issue is related to environmental pollution during construction
of road network. As per report of Government of India, increasing environmental
pollution with increasing climatic temperature is a major concern. High temperature
during construction process and Plastic/rubber scraps which takes billions of years to
decompose are also some of the major reason of environmental pollution, these days.
Using of binders which are modified with plastic and rubber waste will solve the
21
problem of disposal of these waste, to a major extent. Further the implementation of
warm mix asphalt technology will dropdown the temperature during construction
processes and also reduce consumption of fuel and emission of harmful gases.
Detail literature on SMA, OGFC, modified binder and WMA are given in next
sessions of this chapter.
2.4 OPEN GRADED FRICTION COURSE
Porous Asphalt friction course also known as a popcorn mix. Due to its safety and
environmental benefit, this mix is popular in the United States, European countries
and South Africa. These special-purpose porous friction-course mixtures suggested
for new or old high-speed, high-volume roads and expressways to minimize
hydroplaning, improve night visibility and surface frictional resistance, reduce splash
and spray, and lower pavement noise levels (Watson et al. 2004; Decoene 1990)
These all qualities and benefit of porous mix is primarily due to immediate removing
of water from pavement surface. In permeable mix, pavement surface are designed
and constructed in such a way to have a minimum 20 % air-voids, through which
water can be drain in to underlying structure. (Jimenez and Perez 1990; Shuler and
Hanson 1990).
Desired higher percentage of air voids in a porous asphalt mixtures is obtain by using
a uniform grading in aggregates mix design. (Huddleston et al.1993; Colwill 1993).

22
Higher binder content in porous mix also increase durability of the mixture (Kandhal
and Mallick 1998; Decoene 1990; Jimenez and Perez 1990).
Uniform grading of the mix is designed by using mainly single aggregate i.e. 50-60%
aggregate of same particle size with little amount of fines and fillers. Aggregate
passing 2.36 mm sieve i.e. No. 8 sieve should be less than 20 % and filler should in
between 2 to 5 % (Nicholls 1997; Clifford et al. 1996).
Porous mix generally contains higher binder content as compare to traditional dense
graded mixture. Higher binder content with the combination of low filler and
uniform gradation causes draining of binder due to gravity during mixing, hauling
and placement procedures (Watson et al. 2004). This phenomena of drainage of
binder is called "Draindown".
Different stabilizers have different capacity to reduce draindown and hence provided
different optimum binder contents in a same aggregate gradation mix at equal design
air voids (Cooley et al. 2000).
Polymers and Cellulose fibers had a significant effect on the performance of the
OGFC mixes. Polymer increases more resistance to raveling in the short term of the
pavement life than cellulose fibers. Cellulose fibers had more significant effect on
draindown properties of the OGFC mixes than the polymer. Lime has not shown any
effect on the OGFC mix quality where as improves Tensile Strength Ration (TSR)
value up to 82 % for the dense graded mix. (Hossam et al. 2005)
23
Mansour and Talat (2011) have done research on effect of aggregate gradation on
open graded friction course mixtures. Ten different coarser to finer gradation of
OGFC mixes were tested. All mixes showed good abrasion characteristics.
Stabilizers in OGFC mix, improve the durability of mix by reducing the drain down
of binder. When dry rodded unit weight of all mixes increases, strength of mixes
increased and porosity and permeability of the OGFC mixture decreased. When dry
rodded unit weight decreases, strength of mix decreased and so air void of the mixes
increases and permeability of the mix increased. Dry rodded unit weight did not
have significant effect on rutting. Therefore, an Open gradation of the mix can be
modified according to required performance whether more permeability or more
strength, by varying design air void ratio.
The National Asphalt Pavement Association [NAPA] recommends that the optimum
asphalt content for porous asphalt be determined by asphalt content that meets the
following requirements: air voids greater than 18 % and drain down less than 0.3 %
(NAPA, 1994, 2003).
However the National Centre for Asphalt Technology (NCAT) recommends the
optimum asphalt content for OGFC as air voids greater than 18 %, drain down less
than 0.3% and in addition to these two, it introduces two more requirements to be
met, namely: Cantabro Abrasion loss of un-aged specimens should be less than 20 %
and Cantabro Abrasion loss of aged specimens should be less than 30 %. (Kandhal
and Mallick 1999).

24
For design of open graded friction course, California Department of Transportation
(2003), were using California Test 368 (CT 368), A Standard Method for
Determining Optimum Bitumen Content (OBC) for Open Graded Asphalt Concrete.
This method gives Optimum Binder content (OBC) on the basis of three criteria i.e.
draindown, cantrabro test on aged and un aged specimen and air void, which provide
an durable asphalt film thickness to aggregate mix and avoid excessive asphalt
drainage. CT 368 method also have some limitation. As there is no verification of
stone-on-stone contact, volumetric and mechanistic properties of compacted
specimens also not determined and no performance testing for aging and moisture
damage for the state’s different climate regions .
Recently, staff members of the National Center of Asphalt Technology (NCAT)
developed an improved design procedure for OGFC mixes. The methodology
includes-materials selection, trial gradations, selection of an optimum design
gradation, selection of an optimum binder content, and moisture susceptibility
determination using the modified Lottman method in accordance with AASHTO T
283 with one freeze-thaw cycle. (UCPRC, 2012).
2.5 STONE MATRIX ASPHALT
SMA is a gap graded aggregate-asphalt hot mixture of maximizes binder content and
coarse aggregate fraction. SMA mix contains 70-80 per cent coarse aggregate of the
total stone content, 6-7 per cent of bituminous binder, 8-12 per cent of filer
(cement/lime) and about 0.3 to 0.5 per cent of stabilizing additive (fiber) or other

25
modifier. This enrich mixture provides a stable stone-on- stone skeleton that is held
together by a rich mixture of asphalt cement, filler, and stabilizing additive. (Brown
and Hemant 1993, MORTH 2013).
Increased traffic volume especially with heavy truck traffic, increased axle weight,
and gross weight, increased tyre pressure and decreasing tyre- pavement contact
area, have adversely affect the pavement performance. The amount of rutting or
permanent deformation has also increased with dense graded asphalt pavement.
(Scherocman, 1992).
By considering the factor contributing to rutting and type of bituminous mixes, in
1990 European Asphalt Researcher have research on old German asphalt mix
technology, known as “splittmastixasphalt”. splittmastixasphalt is a premium
mixture, have performed as long-lasting, rut-resistant asphalt surface mix. The
English translation of “splittmastixasphalt” is “stone mastic asphalt”. The
Americanized version of this mix technology is known as “stone matrix asphalt”
(Prowell et al., 2002).
SMA was developed in Germany during the mid-1960s (Brown and Hemant, 1993).
Since then, it is successfully being applied in Europe for its better performance.
Earlier in the 1990s, become popular worldwide with increased rutting potential and
resistance to wear due to studded tyre (Scherocman, 1991).
As per National Asphalt Paving Association (NAPA) and Washington state
department of transportation (WSDOT, 2000) report, SMA is a more durable, tough,

26
stable and rutting-resistant mixture. Gap graded structure of the mixture provide it
aggregate to aggregate contact which provide it strength. Rich mortar binder
provides it durability. SMA mixture consist of mineral aggregates, mineral filler,
asphalt binder and stabilizing additives. SMA is designed to maximize rutting
resistance and durability of the bituminous mixes. Mineral filler plays an significant
role in air voids, voids in mineral aggregate and optimum binder content properties
of SMA mixture.
Mogawer and Stuart (1996) suggested (i) minimum Tensile Strength Ratio (TSR) of
80 per cent and (ii) maximum allowable rut depths (by Hamburg wheel tracking
device) of 4 mm at 10,000 passes and 10 mm at 20,000 passes for design of SMA
mixture with desire rutting resistance and durability potential.
Brown and Mallick (1995) recommended use of dry-rodded unit weight apparatus
(AASHTO T19) to conclude the extent of stone-on-stone contact existing in SMA
mixture.
The gap-graded structure with higher amount of coarse aggregate provides, SMA
mix a stone-on-stone contact of coarse aggregate’s particles. This stone-to-stone
skeleton provide strength to the mix. SMA mix also content higher binder content in
mortar, which improves durability of mix (Brown et.al. 95,97).

27
Scherocman (1991) suggested 30-20-10 rule of SMA gradation design that the
gradation should have 30 per cent aggregate passing 4.75 mm sieve, 20 per cent
passing 2.36 mm sieve and 10 per cent passing 0.075 mm sieve.
The percent passing the 4.75 mm sieve is a critical factor in the formation of stone-
on-stone contact in SMA (Brown and Mallick, 1994). As the percent passing 4.75
mm sieve decreases, the VMA remains nearly constant, and then begins to increase
once the percent passing the 4.75 mm sieve reaches 30 to 40 percent. The point at
which the VMA begins to increase defines the condition at which stone-on-stone
contact begins to develop. Below 30 percent, a lowering of percent passing the 4.75
mm sieve tends to increase the VMA by opening up more space in the coarse
aggregate structure. Hence, the percent passing the 4.75 mm sieve must be lowered
below approximately 30 percent to ensure the formation of stone-on-stone contact
(Brown et al., 1997).
Staurt et al 1992. stated that gap gradation and coarse aggregate content is control by
the aggregates passing of sieve size 4.75 mm and 2.36 mm, while optimum binder
content in the SMA mix is control by the, material which passing 0.075 mm sieve .
Higher binder content and gap-graded structure of mixture caused draining of binder
during the high temperature of production and placement. This phenomena of
draining of binder from mixture is called "Draindown". (Brown et al.1997a, Brown
et al.1997b). The stabilizing additive holds bituminous binder in the mixture during
placement, production and compaction of mixes, at the high temperature. These

28
stabilizer act as a drain down reducer of binder. (Mogawer and Stuart, 1996).
Cellulose fiber, polyester fiber, polymer modifier and mineral fiber stabilizer have
been widely used in SMA. (Mallick et al. 2000; Putman and Amirkhanian 2004;
Tayfur et al. 2007; Sharma V. and Goyal S., 2006). Commercial polymer is not
economical in terms of usage (Mahrez, 2008) consequently using waste materials
such as Crumb Rubber Modifier (CFM), in the asphalt mixture has been found to be
more cost-effective and environment-friendly (Mashaan NS, 2013).
Vivek and Sowmya (2015) conducted a study on "Utilization of Fiber as a Strength
Modifier in Stone Matrix Asphalt". Cellulose fiber used in SMA mixes are costly
and not readily available. The researcher used low cost fiber i.e. plastic waste and
coconut fiber. Use of low cost fiber i.e. plastic waste up to 8% by weight of total
aggregate and coconut fiber up to 0.3% by weight of total aggregate, improved
Marshall property of mixture. These fiber can also solve the problem of disposal of
plastic waste. Coconut fiber contains some amount of cellulose fiber.
Fibers do not directly affect the strength or properties of mixes, they just act as
absorber for excessive binder and thus increases durability of mixes. As Prowell et
al. (2009) commented that there is no real purpose of fibers after the mix is
compacted in-place. The main role of fibers in SMA mixes is to reduce the
draindown of the binder rather than improving the mechanical properties of the SMA
mixes.
The use of higher binder content enhances the durability of SMA. Because of its

29
higher rut resistance property and higher durability, it is most preferred over the
conventional dense graded asphalt mixes.
In dense graded asphalt mixes, the mortar (fine aggregate and asphalt cement) in the
mix actually carries the traffic load. The coarse aggregate particles in dense asphalt
mixes are not in close contact with each other and there will be considerable amount
of space between the coarse aggregates which is filled with fine aggregate and
asphalt cement. The gradation of the aggregate and optimum asphalt content for
SMA are considerably different from dense graded asphalt mixes. The stone-on-
stone contact is much higher in SMA and the loads are carried by the coarse
aggregate particles instead of the mortar resulting in lower permanent deformation in
SMA (Scherocman 1992).
The stone-on-stone contact in SMA mixture can be establish/ verify by two method.
First method is based on the density of coarse aggregate. If density of the coarse
aggregate only fraction is less than or equal to the density of coarse aggregate
skeleton in the total SMA mixture sample, the SMA mixture has a stone-on-stone
coarse aggregate skeleton (Brown et al., 1995). The second method is based on the
relationship between Voids in Mineral Aggregate (VMA) and the percentage of fine
aggregate (material passing 4.75 mm) in the SMA mixture. If the SMA coarse
aggregate skeleton has VMA less than or equal to the coarse aggregate only fraction
VMA, the SMA mixture is judged to have stone-on-stone contact (Brown et al.,
1994). There are five different compaction methods are to determine VMA of the

30
coarse aggregate only fraction: Marshall hammer, dry rodded method, vibrating
table, Superpave gyratory compactor, and the British vibrating hammer. The
Superpave gyratory compactor and dry rodded methods produced best results
(Brown and Haddock 1997a; Brown and Haddock 1997b). Digital imaging were also
being used to establish stone-on-stone contact. The advantage of digital imaging is
that it can quantify the number of contacts between aggregate particles (Watson et
al., 2004).
Aggregate gradation is a fundamental aspect in the development of stone-on-stone
contact in SMA mixes, the SMA gradations adopted in various countries are
reviewed in Table 2.1. Recently, “Ministry of Road Transport and Highways
Manual for Construction and Supervision of Bituminous Works (MORTH, 2013)”
have publish mix design standard for SMA design suitable for Indian conditions.
Previous to this MORTH, 2013 publication, Indian Roads Congress (IRC)
introduced a tentative specifications for SMA mix design, (IRC:SP:79, 2008) where
the aggregate gradation closely matches with NCHRP specifications. And Previous
to this IRC publication, SMA mixes were designed in India using the MORTH 2001,
where the aggregate gradation closely matches with German specifications. The
percentage material passing the 4.75 mm sieve size is less than 30% for all the
standards reported in Table 2.1 except the German specifications, and MORTH
(2013) specifications. It is worthwhile to highlight here that, according to Brown et
al. (1997a, 1997b), “the percent passing the 4.75 mm sieve must be lowered below

31
Table 2. 1: SMA Gradations Developed in Various Countries
Organization
MORTH -2013
And
IRC:SP:79,2008
NAPA,
Kandal
NCHRP
425
(Brown
& Cooley,
1999)
German
Specification
Country INDIA USA Germany
Nominal
maximum
aggregate size,
mm
13
Wearing
Course
19
Binder
(Intermediate)
course
12.5 19 12.5
Sieve Size,
mm
Cumulative percent by weight of total aggregate passing
26.5 - 100 - - -
25 - - - 100 -
19 100 90-100 100 90-100 100
16 - - - - -
13.2 90-100 45-70 - - -
12.5 - - 85-95 50-74 90-100
9.5 50-75 25-60 75
Max.
25-60 34-75
4.75 20-28 20-28 20-28 20-28 23-41
2.36 16-24 16-24 16-24 16-24 18-30
1.18 13-21 13-21 - 13-21 15-24
0.600 12-18 12-18 12-16 12-18 12-20
0.300 10-20 10-20 12-15 12-15 10-17
0.150 - - - - 9-14
0.075 8-12 8-12 8-10 8-10 8-13
0.020 - - 3 Max. - -

32
approximately 30 percent to ensure the formation of stone-on-stone contact”. Some
of the studies on SMA mixes carried out in India (Punith et al., 2004;Kamaraj et al.,
2006) followed the MORTH (2001) gradation. However, Kamaraj et al. (2006)
ensured stone-on-stone contact using the method developed by Brown and Mallick
(1995).
Stone Matrix Asphalt is superior type of pavement, should be used in heavily
trafficked highways. Choice of SMA can be a good investment in terms of 5 to 10
year increase service life and other additional advantages mentioned above in this
chapter. For gaining maximum benefit, SMA mixture should be well designed with
high standard production and laying method. Improvement in the mix design of the
SMA can be done as per requirement and environment condition. In wet and cold
region of India, mix design should take in to account lower air void and higher
binder content while in most of drier and warmer regions, a stiffer binder with higher
air void and lower binder content should take into consideration.
2.6 MODIFIED BINDER
Performance of dense graded asphalt pavement improve with the modified asphalt
binder. Structural properties and the durability of the mixes increases with the
modification of binder with different type of additive. (Punith and Veeraragavan
2010; Suresha et al. 2009).
With the addition of modifier or fibers, binder content in the mixture can be increase
and thus durability of mixtures increases due to increase film thickness

33
(NCHRP,2000). Consequently, modified binders also can be beneficial in new
generation mixtures like porous or stone matrix asphalt pavement. Structural
properties of the mix dependent on the deformation and fatigue resistance of the
mixture. Durability of these mixes also depend on the higher binder content, which
increases stone retention without draining of binder during construction. (Kandhal
and Mallick 1998).
Modified binder controls running off the binder from aggregate surface and maintain
a thicker binder film and also delay oxidation and thus reduces raveling of the
aggregate particles. (Ruiz et al. 1990; Perez, Jimenez and Gordillo J 1990; Alvarez et
al. 2006, 2008).
A number of effort were made to modify asphalt mixes performance. One of them is
using discarded tires of vehicles i.e. crumb rubber. Using of tire wastes also solved
the problem of disposal, which is a serious environmental issue. (Saiton 1990).
Use of Crumb Rubber Modified Binders (CRMB) in bituminous mixes is increasing
due to its improved properties. Rejected vehicle tires mechanical sheared and grind
off to small particles to make recycle rubber or Crumb (Krutz and Gardiner 1992)
Crumb Rubber Modified Binders (CRMBS) have increased the performance of the
bituminous mixes during various field and laboratory tests. Polythene carry bag is
being used everywhere, now a days for domestic or transport good etc. These
polybags are made from Low-density polyethylene (LDPE). Even only in India,

34
more than 10 million metric tons per year of LDPE are being produced and from
which, less than 20% of are being recycled because of limited recycling option.
Remaining LDPE are send to landfill, which is not a good solution as these
polythene are not readily biodegradable and remains in environment for billions of
years in a more or less unchanged state. Use of these domestic LDPE by recycling is
a very good idea. In asphalt industry, efforts are also being done to use reclaimed
polyethylene (RPE) carry bags in bituminous mixtures. (Punith and Veeraragavan
2007).
Pavement construction requires large quantity of construction materials. Even use of
a small percentage of reclaimed polyethylene, will solve the problem of disposal of
huge quantity polythene material. Utilization of these LDPE, not only solve the
environmental problem to some extent but also modify the properties of asphalt
mixtures.
Mahsaan et. al. (2014) have done comparative study on fatigue life of conventional
SMA and Crumb Rubber Modified (CRM) reinforced SMA. Life of SMA mixture
was significantly increased with the use of Crumb Rubber. Also studied relation of
fatigue stiffness with resilient modulus and life dynamic. Resilient modulus has
shown higher correlation coefficient with fatigue life than permanent strain. Thus
resilient modulus prove to be a more reliable indicator for evaluating the fatigue life
of bituminous mixture. Although fatigue test is considered a destructive test, it
35
correlate better with resilient modulus test which is nondestructive test as compared
to the creep test which is destructive test.
2.7 WARM MIX ASPHALT
Rising energy costs and environmental awareness have encouraged to developed
alternate paving materials which lowers production temperatures but also hold
similar field performance to hot-mix asphalt (HMA).
The Warm Mix Asphalts (WMA) is modified form of Hot Mix Asphalt (HMA)
technology, in which bituminous mixture is produced, laid and compacted in
temperature lower than conventional HMA. HMA is mixed and compacted at
temperatures of approximately165°C, and 135°C, respectively The WMA is
produced by mixing chemical additives to the conventional binder to improve the
pavement performance of bituminous mixture.
Warm-mix asphalt (WMA) have same engineering property, as hot-mix asphalt
(HMA). Major difference between HMA and WMA is that WMA is produced at
lower plant temperatures than conventional HMA. Key benefits of the reduced
temperature have the benefit of reduce fuel consumption and emissions (Hurley and
Prowell 2005, 2006; Prowell 2007, 2008; Proewll et al. 2012, Kristjansdottir et al.
2007).
Warm Mix Asphalt (WMA) is a new innovative technology which work as "
Adhesion Promoter". WMA make it possible to prepare PMB-40 mixes at 120ºC

36
temperature when compared to traditional Hot Mix Asphalt (HMA) mixed at 150 to
160° C. Thus it reduces the fuel consumption and greenhouse gases ( Rohith and
Ranjitha 2013)
Warm-mix asphalt (WMA), which originated in Europe in the mid 1990s, appears to
be a promising paving material that addresses following mentioned issues. WMA is
an asphalt mixture that can be mixed and compacted at temperatures lower than the
required temperatures for conventional HMA. It has been proven that WMA
techniques can provide a number of benefits, including reduction of fuel
consumption and emission, extension of construction seasons, improved compaction.
Warm mix Asphalt has been developed to reduce the mixing and compaction
temperature of hot mix asphalt without sacrificing the quality of the resulting
pavement. With the use of WMA technologies in asphalt paving, the energy
consumption can be cut by 40%, subsequently reducing emissions (Vaitkus et al.
2009).
A considerable amount of energy is needed for preparing HMA mixes. For
energy efficiency and sustainability, it is significant to reduce the energy consumed
by the mixing and compaction processes. Sasobit, Aspha-min, and zeolite additives
have recently developed. Theses chemical or additive reduces viscosity of the binder
and thus ultimately reducing the mixing and compaction temperatures of asphalt
binders and mixtures. (FHWA 2016).

37
In 1968, Csanyi prepared Warm Mix Asphalt by foamed asphalt technology where
steam is injected into hot bitumen to reduce viscosity (Marek 2014). The
environmental friendliness and energy effectiveness of warm asphalt was stated in
the 1990s (Jenkins et al. 1999).
In this study an attempt has been made to compare performance of Warm Mix
Asphalt for OGFC and SMA mixtures produced with the chemical additive (1)
Evotherm and (2) ZycoTherm in comparison to Hot Mix Asphalt for OGFC and SMA
produced with plain and modified bitumen. These Evotherm And Zycotherm additive
were added to PMB-40 binder. PMB-40 was chosen as a base binder, so as to provide
benefit of modified binder also along with warm asphalt.
2.7.1. ZycoTherm
ZycoTherm chemical used in this study, is a WMA additive and is added in PMB-40
binder. This is an odor free, chemical warm mix additive that has been engineered
to provide significantly improved benefits over current WMA technologies by
offering lower production and compaction temperatures, while simultaneously
enhancing the moisture resistance of pavements by serving as an anti-striping
agent. Mixes that have ZycoTherm modified binder, can be produced at 120°C -
135°C and also be compacted at 90°C - 120°C. Overall, ZycoTherm offers
temperature reductions depending on the properties of the mix. ZycoTherm has
built in antistrip mechanism that allows it to dually function as an antistrip as well
as a warm mix additive. The additive is universally compatible with all types of
38
modified as well as unmodified binders. This included Polymer Modified Bitumen
binders. It does not affect binder grading or change any other binder properties.
2.7.2. Evotherm
A reduction in mixing temperatures results in reduced CO2 emissions, increased
sustainability, improved working conditions for construction and maintenance crews,
extended paving season and financial benefits derived through lower production
costs. Hence Warm Mix is the Future of Asphalt Mixtures. Evotherm technology
enables contractors to reduce production temperatures by 35 to 55°C compared to
typical HMA temperatures. This reduction in temperature reduces oxidation of the
binder, which leads to a variety of benefits, particularly crack resistance of mixes.
Several studies conducted with plant prepared mixes were tested for cracking
resistance using different methods, and showed that the Evotherm mixes generally
performed better in comparison than the HMA.
The reduced binder oxidation is a result of lower mixing and compaction
temperatures, and the other is that the binder absorption in the Evotherm mixes is
significantly less compared to the HMA. This reduced absorption leads to a higher
effective binder content in the matrix, especially in absorptive aggregate
A study was carried out by Wurst (2011) for warm mix open graded friction course
mixes. A chemical package (Evotherm TM) and a water -injection method (foaming)
warm mix asphalt technology was used for study. Polymer and fiber stabilizing

39
additives were replaced by the warm mix asphalt technology. As compared to
traditional OGFC mix, warm mix OGFC has shown better result. WMA technology
has improved the mix abrasion resistance and permeability of the mix and reduce the
potential for moisture susceptibility and drain-down. The results indicate that the
Evotherm mixes compacted at 115°C exhibit significantly higher resistance to
cracking than the similarly formulated hot mix samples compacted at 152°C.
Research on Sasobit and Aspha-min gained prominence in June 2005, as WMA had
reduced energy consumption by about 30% and also raised the longevity of the
mixing plant. Sasobit is a synthetic wax and Aspha-min is a synthetic zeolite.
(Cervarich M.B. 2003, Hurley and Prowell 2005a, 2005b,). Comparative research on
Sasobit and Evotherm were has shown that Evotherm is better than Sasobit for
improved stiffness and viscosity reduction of the recycled binder. As well, Sasobit is
better for the normal binder WMA process than for the recycle WMA process (Doh
et al. 2010).
A Warm Mix Asphalt (WMA) containing Evotherm® can be quickly opened to
traffic. Overall, Evotherm® appears to be a viable tool for reducing mixing and
compaction temperatures that can be readily added to hot mix asphalt. Reductions in
mixing and compaction temperatures are expected to reduce fuel costs, reduce
emissions, and widen the winter paving window.

40
CHAPTER 3
CHARACTERIZATION OF MATERIAL AND
METHODS
========================================================================
3.1 INTRODUCTION
In this research work, study have been done regarding performance of OGFC and
SMA mixes. These mixes have been used worldwide, in very large scale especially in
European countries. Research regarding design procedure, gradation, material and
construction technique as per climatic condition of particular state, being done since
many years. But in India, these type of pavements are not so much in practice. In this
report an effort has been made to evaluate the performance of SMA and OGFC mixes,
with the use of modified and warm asphalt binders in comparison to plain bitumen
with nearby available materials (aggregates, filler, fiber and binder). Efforts were also
made to make pavement construction environment friendly by using WMA, SMA and
OGFC techniques. WMA technique reduces fuel consumption, OGFC reduces water
runoff and SMA is a sustainable pavement. CRMB also solves the problem of
disposing rubber waste. This chapter describe the laboratory works carried out in this
investigation.
This chapter is divided into four parts. First part deals with the experiments carried
out on the materials, Second part deals with the OGFC mix design method, third part

41
deals with mix design of SMA Mix and the forth part deals with the various
performance tests carried out on both OGFC and SMA mixes at optimum binder
content.
3.2 METHODOLOGY
In the present study, two type of bituminous mixes i.e. Stone Mastic Asphalt (SMA)
as per MORTH specification and Open Graded Friction Course (OGFC) as per
NCAT specification were investigated. The materials such as coarse aggregates (size
10mm and 6 mm), fine aggregate (stone dust) and bituminous binder (VG-30, PMB-
40 and CRMB-55) were tested as per relevant Indian Standard (IS). Physical
properties of aggregates such as gradation, water absorption, specific gravity, impact
value, crushing strength, Los Angeles abrasion value and flakiness & elongation
index (shape test) were determined. The properties of bitumen binders such as
specific gravity, penetration, softening point, viscosity and ductility were evaluated
in the laboratory. Good design of bituminous mixture should be strong, durable,
resistive to moisture damage and permanent deformation, environment friendly and
economic.
In general, optimum binder content for conventional bituminous mixes is determined
on the three basic factors, that is Maximum Marshall Stability, maximum unit
weight, and 4 % design air voids. But mixes used in this study are different in
structure and function than conventional mixes. As SMA is a gap graded mix,

42
strength of the pavement depends on the stone-on-stone skeleton and OGFC mix are
open graded, strength of this type pavement depends on underlying structure and
function of these pavements also differ. Design requirements for each mix is
discussed separately, in this chapter. Same material were used, so as to make
comparison of both mixes more reliable and simple. A number of mixes were
prepared and tested for each binder type for both the bituminous mixes, to achieve
the all requirements. Drain down, abrasion loss and voids in the mixes were
determined to find out OBC. Performance tests related to stability and strength of the
pavement, stiffness and elastic property, moisture susceptibility, permanent
deformation and rut depth were done on designed mixes at Optimum Binder Content
(OBC).
Bituminous mix designs were done for following :-
1. OGFC Mix Design
2. SMA Mix Design
Flow Chart of the experimental work carried out in this chapter, is given in Fig. : 3.1

43
Experimental Work Details
Fig.3.1: Flow diagram structure of Chapter3
OGFC mix design
parameters
- Material Selection
-design Gradation
-OBC
SMA mix design
parameters
- Material Selection
-design Gradation
-OBC
Marshall Mix Design Procedure
Stability, Flow value
Procedure of various performance test performed on mixes
ITS/ TSR, Mr, Creep, Rutting
Detail procedure of volumetric and mechanical tests performed for mix designs
- VCA, VMA, Draindown, Air- void, Cantabro test

44
3.3 OGFC MIX DESIGN
OGFC is a new generation of pavement, applying successfully worldwide but still in
India, there is not any pavement construction using OGFC surface mixtures. And
further there is not any technical guidance or standards provided by Indian Road
Congress (IRC) or MORTH for OGFC mixture preparation. Therefore, mix design
of OGFC is done as per standards and guideline of National Centre for Asphalt
Technology (NCAT), updates of Federal Highway Administration (FHWA) and
technical reports of University of California Pavement Research Centre (UCPRC).
Mix design of OGFC is less structured than for dense-graded mixtures. The five
basic steps in the mixture design procedure are-
1) Material selection
2) Selection of design gradation
3) Determination of Optimum Binder Content (OBC)
4) Marshall specimen prepared at desired gradation and OBC
3.3.1 MATERIAL SELECTION
OGFC mixes are designed to be permeable, which differentiates them from dense-
graded (BC) and gap graded (SMA) mixes, which are relatively impermeable. Mix
design requirement of OGFC is given in Table:3.1. Crushed granite stone and
crushed gravel with a small percentage of stone dust is used for design of OGFC
mixes.

45
Table 3.1 : OGFC mix design requirement
Material Specification
Nominal Maximum Aggregate Size 19 mm
Coarse Aggregate in the mix 50 -60 % particle of same size
Binder > 6.0 % ( 6.0-7.5)
Filler 3% by dry mass of aggregate
Fiber 0.2 to 0.4% by weight of the total mix
3.3.1.1 AGGREGATE
High quality aggregates with maximum size not exceeding 19 mm were selected for
OGFC mix design. The entire aggregate were procured from a single quarry from
Bassi near Jaipur city. The crushed stone was sieved into various fractions after
washing and drying. Aggregates used in the present study were tested to ensure good
quality aggregates. Physical properties of aggregates used for mix design are shown
in Table. 3.2.
Aggregate hardness as measured by the Los Angeles abrasion test showed good
correlation with aggregate breakdown. An increase in abrasion loss resulted in an
increase in aggregate breakdown for mixtures compacted with Marshall hammer.
Therefore, a limit on abrasion loss is justified to help minimize aggregate
breakdown.

46
3.3.1.2 FIBER
OGFC mixes contains generally 6% binder of total aggregate weight which is much
higher as compared to dense graded mixtures. This excessive binder content causes
draindown of mixes during mixing and compaction. Cellulose fiber was used as
stabilizer to control drain down. Cellulose fibers were added in powder form, at a
dosage rate of 0.2 to 0.4% by weight of the total mix (aggregate and asphalt binder)
and mixed with the aggregate before the asphalt binder was introduced. Test
properties of cellulose fiber used in the mix design, is shown in Table. 3.3 and close
view of fiber is shown in Fig 3.2(a) & (b).
The standards developed in abroad specify the dosage rate of cellulose fibers as
minimum 0.3% by weight of total mix. In this study, the fiber dosage rate is fixed as
0.3% by the weight of total mix. Although, draindown test was performed to ensure
optimum fiber content and accordingly doses were increased, so as to control
draining of binder.

47
Table 3.2: Physical properties of aggregates used
Property Test Performed Test
Result
MORTH, 2013,
IRC:SP:79, 2008
Specification
Test Methods
Cleanliness Grain Size Analysis 0 % < 2% passing
0.075 mm sieve
IS: 2386 (Part-
I)-1963
Particle
Shape
Combined Flakiness Index & Elongation
Index 23% < 30%
IS: 2386 (Part I
)-1963
Strength
Aggregate Impact Value-Toughness 13.56% < 18% IS: 2386 (Part
IV )-1963
Los Angel Abrasion Value- Hardness 21.4% < 25% IS: 2386 (Part
IV )-1963
Aggregate Crushing Value 14.6% < 30% IS: 2386 (Part
IV )-1963
Durability
Soundness with Sodium Sulphate (5cycle) 8.47 <12%
IS: 2386 (Part
V )-1963 Soundness with Magnesium Sulphate
(5cycle) 12.14 <18%
Water
Absorption
Water Absorption of C.A. (10mm) 0.80%
< 2%
IS: 2386 (Part
III )-1963
Water Absorption of C.A. (6mm) 0.93%
Water Absorption of C.A. (Stone Dust ) 1.38%
Stripping Coating and stripping of bitumen aggregate
mixtures 98%
Retained
coating > 95% IS 6241-1971
Liquid
Limit Fine aggregate 21 % 25 % Max AASHTO T 89
Specific
Gravity
Sp. Gr. of C.A. (10mm) 2.83%
2.5 -3.2 IS: 2386 (Part
III )
Sp. Gr. of C.A. (6mm) 2.82%
Sp. Gr. of F.A. (Stone Dust) 2.81%
Sp. Gr. of Lime Filler 2.9%

48
Table 3.3: Properties of Cellulose Fiber used
Mesh Screen Analysis Passing
850 µm (No. 20) Sieve 73 %
425 µm (No. 40) Sieve 52 %
106 µm (No. 140) Sieve 15 %
Test Performed Result
Fiber Length/ thickness/ diameter 5-6 mm
Specific Gravity 1.45
Bulk density 1557gm/ cc
Ash content, 2-3 gm, 595°C, 2hour 20 %
PH value, 100 ml distilled water added,
30 minutes 8.5
Oil Absorption test, 5gm shaken on a wrist
action, 10 minutes 2.8 %
Moisture Content, 10 gm, 121°C, forced air
oven for 2 hours 3.5 %
Temperature Resistant Up to 200 °C
Solubility Insoluble in water and organic
solvents.

49
Fig. 3.2: (a) Cellulose Fiber Close View (b) Grounded Cellulose Fiber
3.3.1.3 FILLER
Hydrated lime (CaCO3), in dry powder form was added in the OGFC mixture at a
rate of 3.0 % by dry mass of aggregate to fill the requirement of filler. Lime also
fulfilled the purpose of an anti-stripping agent. Properties of lime used is given in
Table 3.4.
Table 3.4: Properties of Hydrated Lime (Filler) used
Mesh Screen Analysis Passing
150 μm Sieve No. 100 100.0%
75 μm Sieve (No. 200) 99 %
45 µm Sieve (No. 325) 95%
TEST PERFORMED RESULT
Plasticity Index (PI) 4 Max
Specific Gravity 2.43
Apparent Dry Bulk Density (Loose) 0.35 gm/ cm3
Percent passing 0.02 mm < 20 %
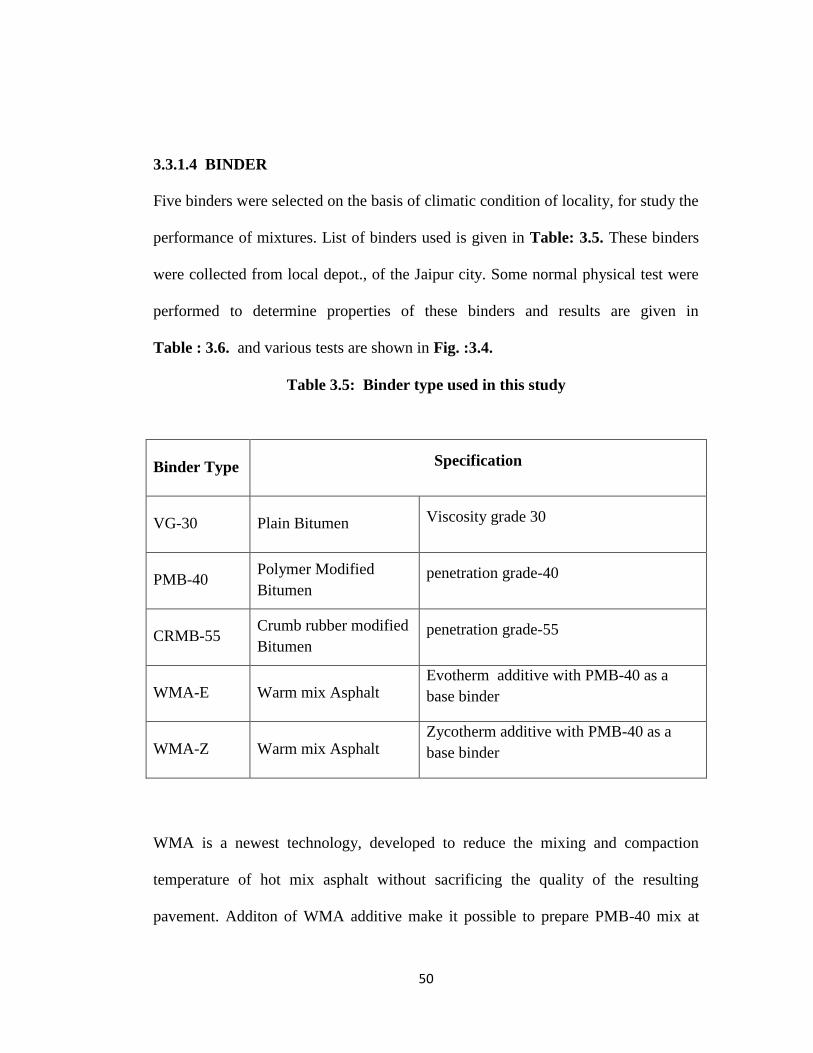
50
3.3.1.4 BINDER
Five binders were selected on the basis of climatic condition of locality, for study the
performance of mixtures. List of binders used is given in Table: 3.5. These binders
were collected from local depot., of the Jaipur city. Some normal physical test were
performed to determine properties of these binders and results are given in
Table : 3.6. and various tests are shown in Fig. :3.4.
Table 3.5: Binder type used in this study
Binder Type Specification
VG-30 Plain Bitumen Viscosity grade 30
PMB-40 Polymer Modified
Bitumen penetration grade-40
CRMB-55 Crumb rubber modified
Bitumen penetration grade-55
WMA-E Warm mix Asphalt Evotherm additive with PMB-40 as a
base binder
WMA-Z Warm mix Asphalt Zycotherm additive with PMB-40 as a
base binder
WMA is a newest technology, developed to reduce the mixing and compaction
temperature of hot mix asphalt without sacrificing the quality of the resulting
pavement. Additon of WMA additive make it possible to prepare PMB-40 mix at

51
120°C. "Evotherm" is a product of Mead Westvaco's Asphalt Division and
"Zycotherm" is produced by Zydex Industries. WMA may lower the optimum
asphalt content, however researchers have practice to determine optimum asphalt
content first with base binder and then additive is added. Than WMA mix is tested
for confirming the volumetric and mechnical test peoperties of the mixture. PMB-40
was used as the base binder to produce Evotherm and Zycotherm emulsion. For
preparing blend, Evotherm and Zycotherm additives were doped at the rate of 0.1%
and 0.4% respectively, (as per guideline of additive production industry) by weight
of base binder and then mixed by stirrer (700 rpm) at 155°C for 30 minutes using
binder blander. (Kheiry et. al. 2014). The additive can also be added volumetrically
as the density of Zycotherm is 1.01 gm/cc. The additive ZycoTherm and Evotherm in
packed condition is shown in Fig.3.3
Fig. 3.3: Evotherm and Zycotherm additive used in this study

52
Table 3.6: Physical properties of binders
Physical properties of
binder Unit
VG-30 PMB-40 CRMB-55
Plain Bitumen
of Viscosity
Grade-30
(Elastomeric
Thermoplastic
Based)
(Modified
Crumb Rubber
Based)
(IS:73, 2006 ) IS 15462 : 2004, IRC: SP:53, 2010
Test
value
Specifica-
tion
Test
value
Specifica-
tion
Test
value
Specifica-
tion
Penetration at 25°C, 100
gm, 5 sec (IS: 1203-1978
First Revision)
0.1
mm 52.5 50-70 40.6 30-50 55 <60
Softening Point (R&B)
(IS: 1205-1978 First
Revision)
°C 52.3 47 min 66.6 60 min 62 Min 55
Flash Point, COC, (IS:
1209-1978) °C 260 220 min 280 220 min 290 220 min
Separation, difference in
softening point (Ring &
Ball Test)
°C - - 2 3 max 3 4 max
Ductility at 27/15°C (IS:
1208-1978 First
Revision)
Centi-
metre
81.4
4 75 min 64 50 min - -
Elastic Recovery of half
thread in ductilometer at
15°C (IS: 1208-1978 First
Revision)
% NA NA 75 Min 70 54 Min 50
Specific Gravity (IS:
1202-1978 First
Revision).
Unit
less 1.03 - - - -
Kinematic Viscosity at
60°C Bitumen (IS: 1206-
1978 First Revision),
Poise 3147 2400
Min - - - -
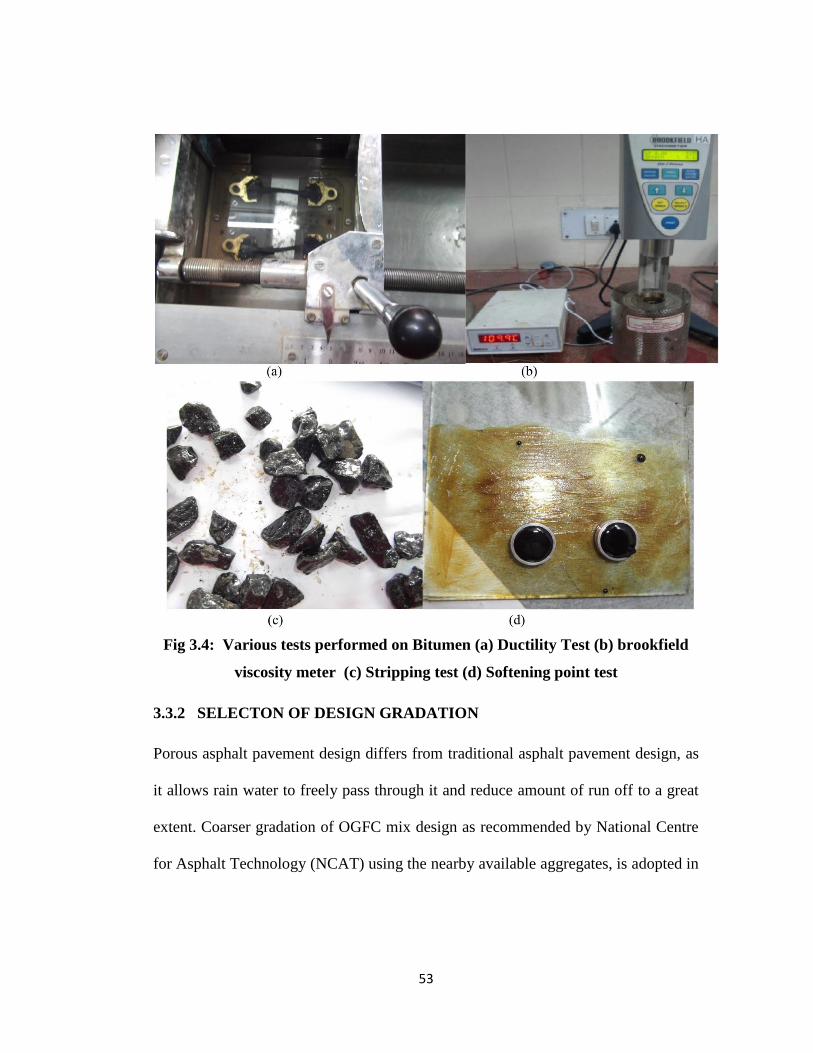
53
Fig 3.4: Various tests performed on Bitumen (a) Ductility Test (b) brookfield
viscosity meter (c) Stripping test (d) Softening point test
3.3.2 SELECTON OF DESIGN GRADATION
Porous asphalt pavement design differs from traditional asphalt pavement design, as
it allows rain water to freely pass through it and reduce amount of run off to a great
extent. Coarser gradation of OGFC mix design as recommended by National Centre
for Asphalt Technology (NCAT) using the nearby available aggregates, is adopted in
54
this research work to maintain high air void of the OGFC mixes. Open gradation of
the mixture is created by considering following facts-
1) For stone-on-stone contact condition of the OGFC mix without disturbing
it's adequate permeability, aggregate passing 4.75 mm sieve should be
less than 25%. In this research work 18.33 % aggregate is passing 4.75
mm sieve in designed gradation as shown in Table 3.8.
2) Open gradation of mix created by keeping 20 to 25 % air void in design
mixes. In order to achieve the high percentage of air voids 50 to 60%
coarse aggregate in mix should be of same particle size in between 9.5
mm to 4.75 mm sieve size with very little fines and fibers. In final
achieved combined design gradation, 53.8 % particles are of same size
that is in between 9.5 mm to 4.75 mm sieve size. (Table 3.8)
3) Open graded design with interconnected air void for proper flow of water
is created by keeping particle passing 2.36 mm sieve (No. 8 sieve) less
than 10% and filler should be between 2 to 4 percent. In the designed
OGFC mix 6.8 % particle passing 2.36 mm sieve size and 3.31 % particle
passing 0.075 mm sieve size and 3.0 % filler is used. (Table 3.8)
4) In adopted gradation 10-25% of aggregate are passing 4.75 mm sieve,
while greater than 15% particle which passes, 4.75 mm sieve in a
gradation are susceptible to significant binder draindown, hence cellulose
fiber is to be added at the rate of 2.0 to 4.0 % by weight of total mix to
reduce draindown.
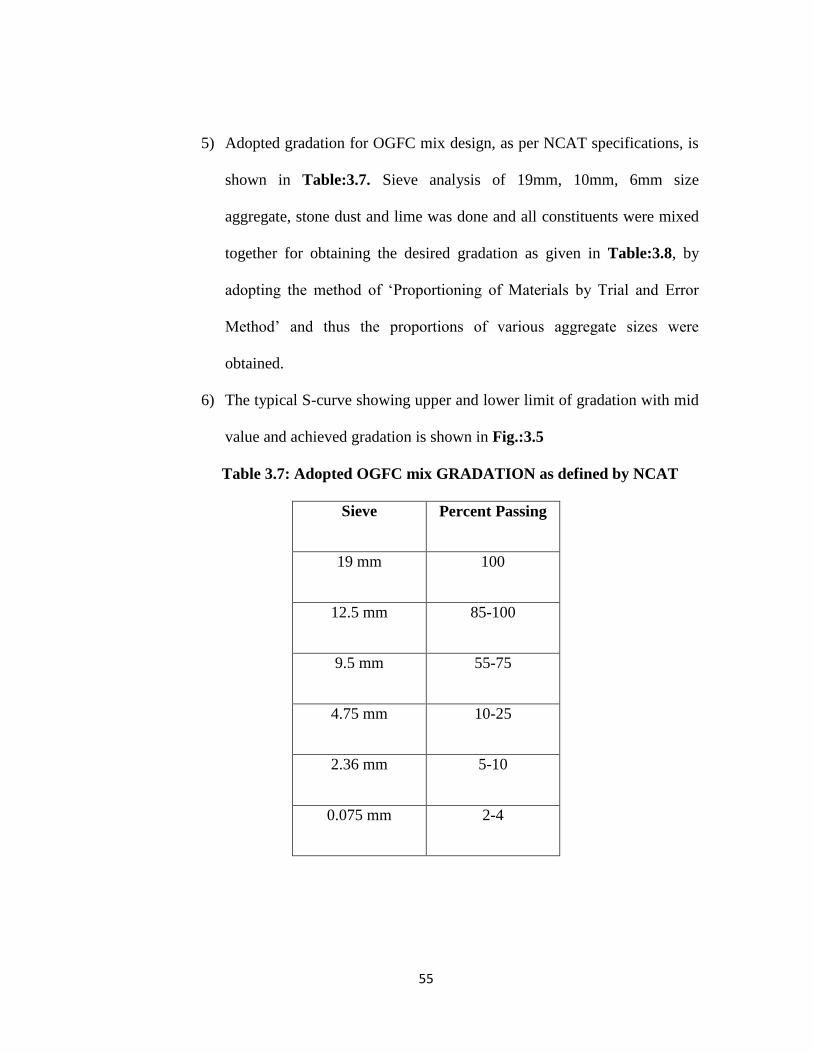
55
5) Adopted gradation for OGFC mix design, as per NCAT specifications, is
shown in Table:3.7. Sieve analysis of 19mm, 10mm, 6mm size
aggregate, stone dust and lime was done and all constituents were mixed
together for obtaining the desired gradation as given in Table:3.8, by
adopting the method of ‘Proportioning of Materials by Trial and Error
Method’ and thus the proportions of various aggregate sizes were
obtained.
6) The typical S-curve showing upper and lower limit of gradation with mid
value and achieved gradation is shown in Fig.:3.5
Table 3.7: Adopted OGFC mix GRADATION as defined by NCAT
Sieve Percent Passing
19 mm 100
12.5 mm 85-100
9.5 mm 55-75
4.75 mm 10-25
2.36 mm 5-10
0.075 mm 2-4
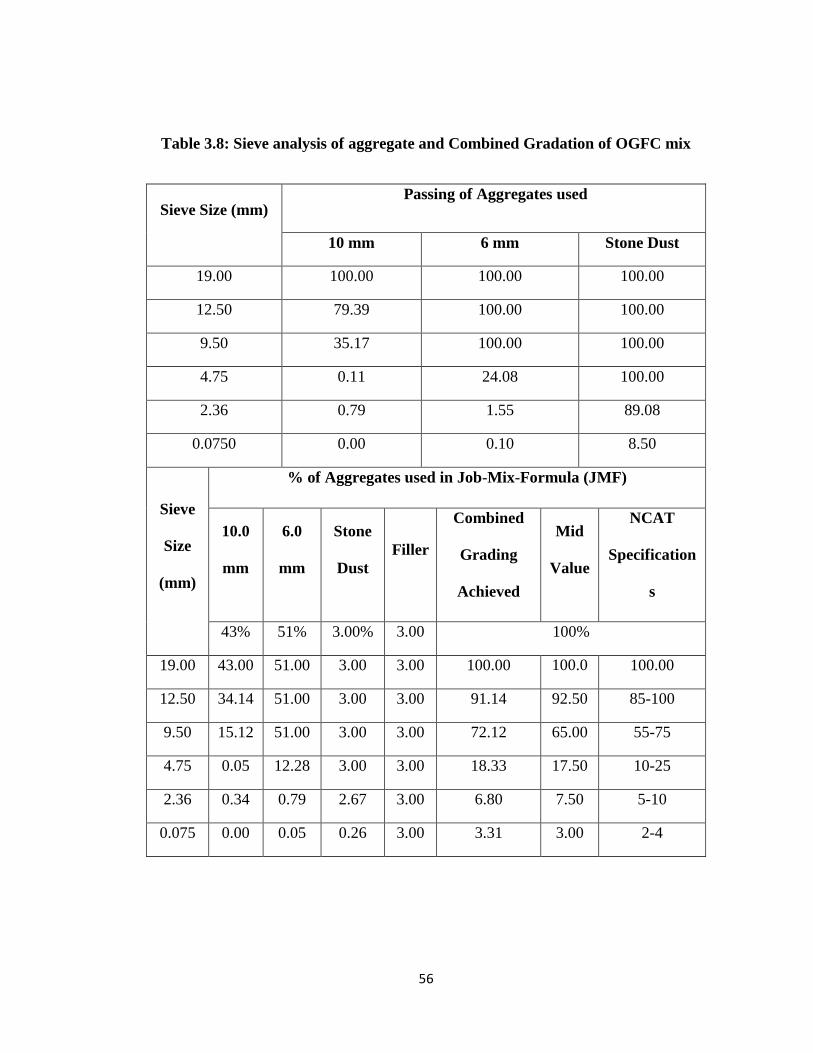
56
Table 3.8: Sieve analysis of aggregate and Combined Gradation of OGFC mix
Sieve Size (mm) Passing of Aggregates used
10 mm 6 mm Stone Dust
19.00 100.00 100.00 100.00
12.50 79.39 100.00 100.00
9.50 35.17 100.00 100.00
4.75 0.11 24.08 100.00
2.36 0.79 1.55 89.08
0.0750 0.00 0.10 8.50
Sieve
Size
(mm)
% of Aggregates used in Job-Mix-Formula (JMF)
10.0
mm
6.0
mm
Stone
Dust
Filler
Combined
Grading
Achieved
Mid
Value
NCAT
Specification
s
43% 51% 3.00% 3.00
%
100%
19.00 43.00 51.00 3.00 3.00 100.00 100.0
0
100.00
12.50 34.14 51.00 3.00 3.00 91.14 92.50 85-100
9.50 15.12 51.00 3.00 3.00 72.12 65.00 55-75
4.75 0.05 12.28 3.00 3.00 18.33 17.50 10-25
2.36 0.34 0.79 2.67 3.00 6.80 7.50 5-10
0.075 0.00 0.05 0.26 3.00 3.31 3.00 2-4

57
Fig.3.5 : Typical S-curve for OGFC Gradation
3.3.3 DETERMINATION OF OPTIMUM BINDER CONTENT (OBC)
Porous asphalt is significantly different from traditional dense graded mixtures in
terms of mix design, behavior and functioning of the mixes. As a wearing course
layer, it functions to expedite surface water removal. Binder Content is main
characteristics of the mix as to ensure proper bonding between aggregate and binder.
Traditional mix design methods which normally incorporates the Marshall test, are
not appropriate to design porous asphalt because of the insensitivity of the Marshall
stability values to variations in binder content. It is therefore appropriate to specify
the design binder content (DBC) for porous asphalt rather than the optimum binder

58
content. The design binder content incorporates an upper and a lower limit. The
lower limit of the DBC can be dictated by requirements to resist disintegration while
the upper limit is specified to limit binder drainage yet maintaining a porous
structure that would promote permeability. Selection of OBC was done on the
following basis-
i. OGFC mix blend were prepared at achieved desired gradation mentioned
above for six binder contents ( 5 to 7.5 %) in increments of 0.5 percent for
each binder type.
ii. The blend were evaluated for volumetric properties- void in coarse
aggregate fraction (VCAMIX) and void in coarse aggregate in dry-rodded
condition (VCADRC) to ensure stone-on-stone in the mix as maintained in
SMA mixture for better durability of mixture.
iii. When compared to conventional hot mix asphalt, OGFC mixtures
generally have a higher asphalt content with little fine aggregates. As a
result, OGFC mixtures must contain, suitable type and amount of some
proper stabilizing additive, in order to control draindown and to retain the
asphalt binder during production and placement. A maximum 0.3 % of
draindown after one hour of test is recommended to minimize draindown.
Draindown test for each design mix was conducted as per AASHTO T305
procedure..
iv. Cantabro abrasion test was performed on aged and unaged specimen to
ensure resistance to disintegration of specimen.

59
v. Each mix specimen was compacted using 50 blows of Marshall Rammer
on both faces and then air void contents were determined.
vi. The optimum asphalt content for OGFC mix should meet the following
criteria:
1) a minimum of 18 percent air voids in compacted mix (higher values
desired),
2) abrasion loss on unaged specimens not exceeding 20 percent,
3) abrasion loss on aged specimens not exceeding 30 percent and
4) a maximum draindown of 0.3 percent by total mixture mass.
vii. The binder content fulfils all the four requirements is selected as OBC. In
case none of binder content meets the all criteria then remedial treatment
( increase the dose of stabilizing agent or modifier) should be adopt.
viii. Marshall Stability and Flow Value of the mixture were determined.
ix. As per NCAT standard, freeze/thaw cycles test should be performed on
compacted specimen for checking durability of OGFC mixture as its
resistance to freeze-thaw damage. It is necessary to confirm the resistance
to moisture-induced damage and effects of saturation and accelerated
water conditioning under freezing and thawing cycles. But as per IRC, it is
not required to perform this test as per Indian climate condition. Also in
Rajasthan, the freezing temperatures is most rarely to prevail.

60
x. Moisture susceptibility of the mixtures were evaluated by conditioning the
specimens in water. The retained tensile strength of the mix should be at
least 80 percent.
Table 3.9: Mix Design Requirement of OGFC mix
S.No. MIX DESIGN PROPERTY PARAMETERS
1. Cellulose fiber by total mixture mass 0.3%
2. Number of Marshall hammer
compaction
50 blow per side of Specimen
3. Air-void in compacted mix > 18 % or (20-24)
4. VCAMIX ≤ VCA DRC
5. Minimum Binder Content > 6.0 %
6. abrasion loss on unaged specimens <20 %
7. abrasion loss on aged specimens <30%
8. TSR > 80 %

61
3.4 SMA MIX DESIGN
SMA is a new generation of pavement, applying successfully worldwide. Mix design
of SMA is done as per standards and guideline of Ministry of Road Transport and
Highway Manual Specifications for Road and Bridge Works (MORTH, 2013).
Combined aggregate gradation (coarse aggregate, fine aggregate and mineral filler)
developed by MORTH, 2013 is adopted for this study. Stone Matrix Asphalt mix is
designed in such a way to create stone-to-stone skeleton, as this structure is main
quality of SMA, which carries traffic load and provide increased rutting resistance.
Aggregate and filler are proportioned and fully compacted in such a way, that the
void in the stone skeleton exceed the volume of binder used by 3 to 5 %. Binder
matrix alone is void less. The SMA mixture volume content over 60% of the coarse
aggregate, approx 35% binder and 3 to 6% air void. The binder matrix contains 37%
stone dust, 26% mineral filler and 37% asphalt binder.
SMA is a typical gap graded mix as illustrated in Table 3.11 and typical S-curve
gradation graph of mix is shown in Fig. 3.6. This study has produced a Marshall mix
design procedure and material evaluation procedure for SMA mixtures. Factors
evaluated were Los Angeles abrasion loss, flat and elongated particle content,
mixture aggregate gradation, percent of filler finer than 0.02 mm, stone-on-stone
contact, Air Void in the mix, VMA, asphalt binder content, compaction effort,
draindown, moisture sensitivity, and rutting resistance.

62
The steps of SMA mix design are as follows:
1) Material selection
2) Selection of design gradation
3) Determination of Optimum Binder Content (OBC)
4) Marshall specimen prepared at desired gradation and OBC
3.4.1 MATERIAL SELECTION
SMA is a premium quality mixture requires high quality materials, as the mixture
gains most of its strength from the stone-on-stone aggregate skeleton. Manufactured
sands, mineral fillers, and fibers additive make a stiff matrix that is important to the
rutting resistance of these mixes. As per MORTH specifications the bitumen for
fiber- stabilized SMA shall be viscosity paving bitumen confirming to Indian
Standard IS:73 or Modified Bitumen complying with IS:15462 and IRC:SP:53 of
appropriate type and grade capable of yielding the design mix requirements.
Physical properties of all binders are summarized in Table 3.5. Same material (C.A.,
F.A., mineral Filler, Asphalt binder and stabilizing Agent) were used, as used for
OGFC mix design and details & physical properties are presented in section (3.4.1 to
3.4.4). SMA mix design parameters are given in Table 3.10.
The main function of SMA mineral filler is basically to stiffen the binder rich SMA.
But a higher percentage of very fine filler in the SMA mixture, may make mix
susceptible to cracking. Hence percent passing 0.02 mm is restricted to use more

63
than 20%. The minimum required asphalt content in SMA mixes as per IRC:SP:79
(2008) is 5.8%.
Table 3.10 : SMA mix design requirement
S.No. Material Specification
1. Nominal Maximum Aggregate Size 13 mm
2. Coarse Aggregate in the mix 70-80 %
3. Bitumen Binder > 5.8 % (5.5-7%)
4. Filler 8-12 % of dry mass of aggregate
5.
Celluloid Fibers
0.2 to 0.4% by weight of the total
mix (aggregate and asphalt binder)
3.4.2 SELECTION OF DESIGN GRADATION
After selection and testing of individual dry coarse aggregates, fine
aggregates, filler and fiber, the aggregates were combined in desired
gradation, as per following steps:
1) A range of 20-28 percent aggregates should pass the 4.75 mm sieve, which
will help to ensure the formation of a proper coarse aggregate skeleton and
stone-to-stone in the SMA mixtures.

64
2) 8-12 % amount of total aggregate should passes the No.200 sieve, to fill this
requirement lime as a filler was added. This percentage is very large as
compared to HMA, hence SMA performs in a very different manner and have
to handle differently.
3) In a SMA mix, the percent passing 4.75 mm sieve must be below 30 percent
to ensure proper stone-on-stone contact
4) Mixes were prepared with 5 to 7.5 % of binder at an increment of 0.5 % with
each type of binder type. All mixes were tested for volumetric and
mechanical properties using Marshall method..
5) Stone-on-stone contact, Void in the Total Mixtures (VTM), Voids in the
Mineral Aggregate (VMA), asphalt binder content, and asphalt binder
draindown, cantrabro abrasion and aging test parameters were evaluated for
SMA mix design.
6) The SMA mixes prepared using this gradation can be used as a wearing
course with nominal layer thickness ranging from 40 to 50 mm.

65
Table 3.11: Sieve analysis of aggregate and Combined Gradation of SMA mixes
Sieve Size (mm) % Passing of Aggregates used
10 mm 6 mm Stone Dust
19.000 100.00 100.00 100.00
13.200 88.33 100.00 100.00
9.500 34.17 100.00 100.00
4.750 0.76 23.20 100.00
2.360 0.71 3.55 93.05
1.180 0.65 2.9 67.06
0.600 0.50 0.90 57.30
0.300 0.45 0.56 37.07
0.075 0.00 0.49 14.08
Sieve
Size
(mm)
% of Aggregates used in Job-Mix- Formula (JMF)
10.0
mm
6.0
mm
Stone
Dust Filler
Combined
Grading
Achieved
Mid
Value
MORTH
Specifications
50 % 33% 7% 10% 100%
19 50.00 33.00 7.00 10.00 100.00 100.00 100
13.2 44.17 33.00 7.00 10.00 94.17 95.00 90-100
9.5 17.09 33.00 7.00 10.00 67.09 62.50 50-75
4.75 0.38 7.66 7.00 10.00 25.04 24.00 20-28
2.36 0.36 1.17 6.51 10.00 18.04 20.00 16-24
1.18 0.33 0.96 4.69 10.00 15.98 17.00 13-21
0.60 0.25 0.30 4.01 10.00 14.56 15.00 12-18
0.30 0.23 0.18 2.59 10.00 13.00 15.00 10-20
0.075 0.00 0.16 0.99 10.00 11.15 10.00 8-12

66
Fig.3.6 : Typical S-curve for SMA Gradation
3.4.3 DETERMINATION OF OPTIMUM BINDER CONTENT (OBC)
The amount or volume of binder is important for the durability of SMA mixtures.
As per NCAT specifications, minimum asphalt binder content of 6 percent should be
used in SMA mixtures. A reasonably high asphalt content for SMA mixture can be
ensured by specifying a minimum asphalt content or a minimum VMA. To specify
minimum VMA is better approach than other, especially when aggregate of higher
specific gravity was used. As VMA is calculated on volume basis, is not affected by
specific gravity of aggregate. The requirement of minimum VMA can be established,
by limiting the gradation, so that 20-28 percent of the aggregate particle passes the
4.75 mm sieve. However, if aggregate are prone to break down excessively during
compaction may not provide a mixture that meets VMA requirements. In general,
0
20
40
60
80
100
0.010 0.100 1.000 10.000 100.000
Per
centa
ge
Fin
er b
y W
eight
(%)
Sieve Size (mm)
upper limit lower limit 13mm SMA mid value

67
when the Los Angeles abrasion loss is lower than 20, VMA can easily met and when
abrasion loss is higher than 40, meeting the VMA requirement is more difficult.
Optimum binder content for proper bonding of aggregates was determined as per
following steps-
1) Six trial mixes were compacted in Marshall mould with binder ranged from
5.0 to 7.5 at the increment of 0.5 %, for each type of binder
2) When they cooled at room temperature, the volumetric properties of each
mix design is determined.
3) Following are volumetric properties calculation-
Va % = 100 x [1- Gmb / Gmm]
VCA % = 100 - [(Gmb/ GCA ) x PCA]
VMA % = 100 - [(Gmb/ Gsb ) x Ps]
Where,
Va - percent air voids in compacted mixture
VCA - voids in coarse aggregate fraction within compacted mixture
VMA - voids in mineral aggregate
Gmb - bulk specific gravity of compacted mixture
Gmm - theoretical maximum specific gravity (AASHTO T209)
GCA - combined bulk specific gravity of the coarse aggregate fraction

68
Gsb - combined bulk specific gravity of the aggregates
PCA - percent of coarse aggregate in the total mixture
Ps - percent of aggregate in the total mixture
4) Voids in the Compacted Mix (Va)- The NCAT guideline recommended a
SMA mixture design air void ranges of 3-4%, based on experience. One
important concern of SMA mixes is the occurrences of fat spots. Fat spots are
caused because of flushing of asphalt binder from SMA mixtures. This
localized flushing of binder from mix surface are result of high asphalt
content, Long haul distance, coarse gradation, inadequate stabilizer or very
high mix temperature. All of these factor have a significant effect on air
voids. A higher air void may cause fat spot while a lower air voids mixture
may experience significant rutting. Setting to minimize air void to 3% is
reasonable in both concern. As in case of warmer climate should be designed
closer to 4.0 %.
5) A minimum asphalt binder content of 6 percent as per NCAT specification
and a minimum 5.8 % binder should be used in SMA mixes, as per MORTH
specification. This requirement can be used as reference but not needed as
long as minimum VMA requirement are met. The minimum asphalt content
can be neglected in favor of the minimum VMA requirement.
6) Mixture should be compacted with 50-blows of Marshall hammer to produce
SMA mix of define density.
69
7) When compared to traditional hot mix asphalt, SMA mixtures generally have
a higher asphalt content and more coarse aggregates. As a result, SMA
mixtures must have suitable type and amount of some proper stabilizing
additive, in order to control draindown and to retain the asphalt binder during
production and placement. A maximum 0.3 % of draindown after one hour
test is recommended to minimize draindown. Draindown test was conducted
for each design mixes.
8) All trial blends were evaluated for mix properties. The optimum asphalt
content meets the following criteria:-
a. Air void limit 3-5%
b. Voids in Mineral Aggregate (VMA) should be greater than 17%
c. Voids in Coarse Aggregate for Mix (VCAMIX), % Less than VCADRC
d. abrasion loss on unaged specimens not exceeding 20 percent,
e. abrasion loss on aged specimens not exceeding 30 percent and
f. a maximum draindown of 0.3 percent by total mixture mass.
The design parameters shown in Table 3.12 were selected for the SMA mix
design
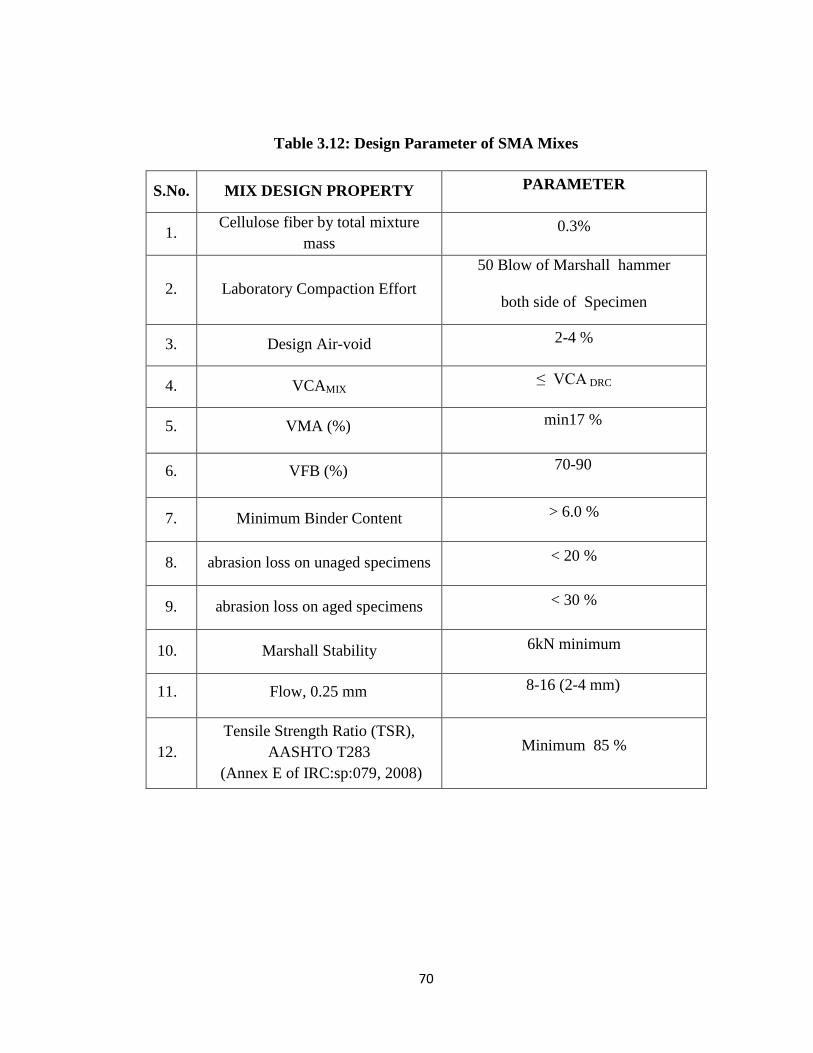
70
Table 3.12: Design Parameter of SMA Mixes
S.No. MIX DESIGN PROPERTY PARAMETER
1. Cellulose fiber by total mixture
mass 0.3%
2. Laboratory Compaction Effort
50 Blow of Marshall hammer
both side of Specimen
3. Design Air-void 2-4 %
4. VCAMIX ≤ VCA DRC
5. VMA (%) min17 %
6. VFB (%) 70-90
7. Minimum Binder Content > 6.0 %
8. abrasion loss on unaged specimens < 20 %
9. abrasion loss on aged specimens < 30 %
10. Marshall Stability 6kN minimum
11. Flow, 0.25 mm 8-16 (2-4 mm)
12.
Tensile Strength Ratio (TSR),
AASHTO T283
(Annex E of IRC:sp:079, 2008)
Minimum 85 %

71
3.5 MARSHALL MIX DESIGN OF THE OGFC/ SMA MIXES
After determination of physical properties of the materials used and deciding
the variables of the mix design, bituminous mix design was done according to the
Marshall procedure specified in ASTM D1559.
The specified gradation of mineral aggregates and bitumen binder should be
used as per NCAT/ MORTH specifications. The procedure for the Marshall method
starts with the preparation of test specimens. The Marshall method uses standard test
specimens of 64mm height and 102mm diameter. These were prepared using a
specified procedure for heating, mixing and compacting the bitumen- aggregate
mixture.
Five types of binders as already stated were used in different proportions in
the mixes starting from 5% to 7.5 % with an increment of 0.5% of the total mix to
obtain the optimum binder requirements and also to determine the effect of binder
content and binder type on the mix properties. After some initial trials for
preparation of OGFC/ SMA samples, a proper procedure could be developed.
Approximately 1200 g of mineral aggregates with fibers and binders were
heated separately to the prescribed mixing temperature, given in Table 3.13 and
3.14. The temperature of the mineral aggregates was maintained at a temperature
10°C higher than the temperature of the binder.

72
Required quantity of binder was added to the pre heated aggregate-fiber
mixture and thorough mixing was done manually till the color and consistency of the
mixture appeared to be uniform. The mixing time was tried to maintained within 3
minutes. Mixing time may be extended ( total 2-5 minutes) as to ensure
homogeneously distribution of fibers throughout the mixture. The mixture was then
poured in to pre-heated Marshall moulds and the samples were prepared using a
compaction effort of 50 blows of Marshall hammer on each side as, 75 blows
compaction is reported to result in significant degradation of aggregates as reported
by Brown (1992). Also will not result in a significant increase in density over that
provided with 50 blows. 50 blows of Marshall hammer is approximately equal to 100
revolutions of the Superpave gyratory compactor in terms of the resultant SMA
density
The specimens were kept overnight for cooling to room temperature. Then
the samples were extracted and tested at 60°C according to the standard testing
procedure. The bulk density of compacted specimens was found out as per ASTM: D
2726. The vacuum pump set up as shown in Fig. 3.8 was used to determine the
theoretical maximum specific gravity of mixture at zero air voids as per ASTM D:
2041. After determining the bulk specific gravity of the test specimens, the stability
and flow test was performed as per ASTM D: 6927.
The Marshall stability-flow value test apparatus is shown in Fig. 3.7

73
Table 3.13: Temperature during Marshall mix design Process
Bitumen Bitumen
Mixing (°C)
Aggregate
Mixing (°C)
Mixed Material (°C)
Pan Mould
VG-30 156 170 145 145
PMB-40 161 175 160 155
CRMB-55 156 170 155 150
WMA-E 120 130 100 100
WMA-Z 120 130 100 100
Fig. 3.7: Marshall Stability testing machine

74
Table 3.14: Percentage of Material in Marshall Specimen (in case of 6.0 %
binder)
Fig. 3.8: Vacuum pump set up
Aggregate
OGFC SMA
Weight of
Sample (gm)
% of
Sample
Weight of
Sample (gm) % of Sample
10 mm 485 43 564 50
6 mm 575 51 373 33
Stone dust 34 3 79 7
Filler 34 3 113 10
Binder (6.0 %) 72 6 72 6

75
3.5.1 MARSHALL STABILITY AND FLOW VALUE
Marshall test was performed to determine stability and flow characteristics of OGFC
and SMA mixes. Marshall Stability of the mix is defined as the maximum load
carrying capacity of the mixture at 60°C standard temperature and deformation that
the specimen undergo during load is defined as flow value.
Marshall Specimen of OGFC mix were kept in water bath maintained at 60° C for a
period of 30 minutes prior to testing at 60°C temperature. The time elapse between
taking sample out of waterbath and testing should not be more than 30 seconds.
Diametrical load at the rate of 50 mm per minute was applied on the compacted
specimen till its failure. Stability and flow value were recorded from the respective
dial gauges. And resistance of specimen to plastic deformation was measured. the
physical property of specimen i.e. height, diameter and weight recorded before the
testing. Following parameters were measured: stability, flow, unit weight, percentage
air voids in total mix, voids in mineral aggregate (VMA) and voids filled by binder
(VFB).
The mix design test results of OGFC and SMA mixes are presented in Chapter 4.
Marshall Specimen prepared at Optimum Binder Content (OBC) is shown in Fig. 3.9

76
Fig. 3.9: Prepared Marshall Specimen at OBC
3.5.2 RETAINED STABILITY TEST
This test was performed as per ASTM D 1075-1979 to find out the retained
stability of bituminous mould. This test measures the stripping resistance of a
bituminous mixture. The standard Marshall specimens of 102 mm diameter and 64
mm height were prepared. The specimens were kept in water bath maintained at
60°C for 24 hours and thereafter tested for stability value as same as Marshall
Stability test. The results are reported as the percentage of Marshall Stability
determined in normal condition of the test.
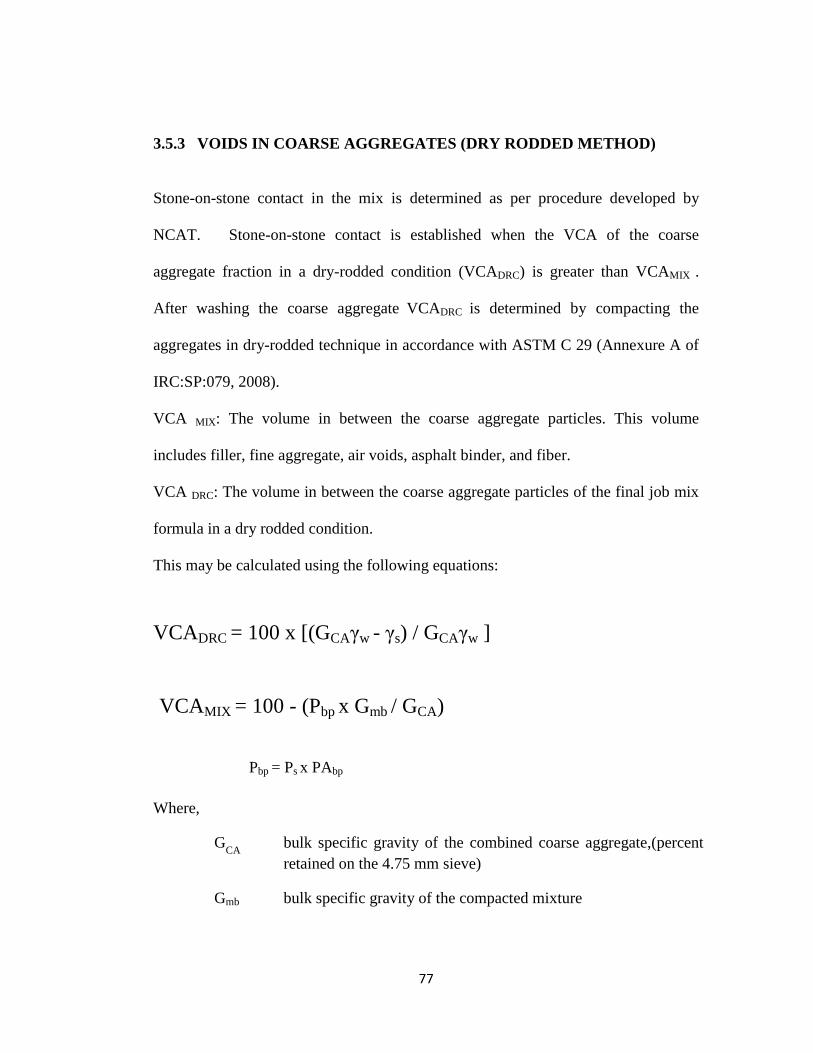
77
3.5.3 VOIDS IN COARSE AGGREGATES (DRY RODDED METHOD)
Stone-on-stone contact in the mix is determined as per procedure developed by
NCAT. Stone-on-stone contact is established when the VCA of the coarse
aggregate fraction in a dry-rodded condition (VCADRC) is greater than VCAMIX .
After washing the coarse aggregate VCADRC is determined by compacting the
aggregates in dry-rodded technique in accordance with ASTM C 29 (Annexure A of
IRC:SP:079, 2008).
VCA MIX: The volume in between the coarse aggregate particles. This volume
includes filler, fine aggregate, air voids, asphalt binder, and fiber.
VCA DRC: The volume in between the coarse aggregate particles of the final job mix
formula in a dry rodded condition.
This may be calculated using the following equations:
VCADRC = 100 x [(GCAγw - γs) / GCAγw ]
VCAMIX = 100 - (Pbp x Gmb / GCA)
Pbp = Ps x PAbp
Where,
GCA
bulk specific gravity of the combined coarse aggregate,(percent
retained on the 4.75 mm sieve)
Gmb bulk specific gravity of the compacted mixture

78
γw unit weight of water (998kg/m
3)
γs unit weight of coarse aggregate, (retaining 2.36 mm sieve), in the
dry-rodded condition (DRC) (kg/m3) (AASHTO T 19),
Pbp
percent aggregate by total mixture weight (mass), (retaining 2.36
mm sieve)
PAbp
percent aggregate by total aggregate weight (mass) (retaining
2.36 mm sieve
3.5.4 ABRASION TEST
Cantabro Abrasion test was conducted to measure, the resistance of compacted
OGFC/ SMA specimens to abrasion loss and to evaluate the cohesion, bonding
property of the mixes. This is an abrasion and impact test carried out on Marshall
specimen (102mm height, 64mm dia), in the Los Angeles abrasion machine. ASTM
C131 method was used to conduct the testing of the materials as per following steps-
1. Initial weight of each sample were taken to 0.1 grams and is recorded as W1
2. Individual samples were placed in a L.A. Abrasion machine, without the steel
ball charge.
3. Test was performed at room temperature.
4. Machine was operated at the speed of 30 to 33 revolutions per minute up to
300 revolutions.
5. The test specimen is then taken out of machine and mass of each determined
to the nearest 0.1 gram (W2)
6. The material loss from each specimen i.e. W2 -W1 is calculated

79
7. Particle loss for each test specimen is determine from following formula-
100)(
1
21
W
WWPL
Where,
PL = Particle loss
W1 = Initial sample weight (in grams)
W2 = Final sample weight (in grams)
The recommended maximum permitted abrasion loss value for freshly compacted
specimens is 20 percent . However, some European countries specify a maximum
value of 25 percent.
3.5.5 AGING TEST
Both unaged and aged compacted OGFC were subjected to Cantabro abrasion test to
evaluate the effect of accelerated laboratory aging on resistance to abrasion. Because
of very high air void contents the asphalt binder in OGFC is prone to hardening at a
faster rate than dense-graded hot mix asphalt (HMA), which may result in reduction
of cohesive and adhesive strength leading to raveling. Therefore, the mix design
should be subjected to an accelerated aging test. Aging was accomplished by placing
five Marshall specimens in a forced draft oven set at 60°C for 168 hours (7 days).
The specimens are then cooled to 25°C and stored for 4 hours prior to Cantabro
abrasion test. The average of the abrasion losses obtained on 5 aged specimens

80
should not exceed 30 percent, while no individual result should exceed 50 percent.
The test was performed with each binder type separately, for both SMA and OFGC
Marshall mixes.
3.5.6 DRAINDOWN
One of the important criteria in OGFC/ SMA mixes is to control the draindown of
the binder. When compare to conventional hot mix asphalt, OGFC and SMA
mixtures generally have a higher asphalt content and more coarse aggregate. In order
to reduce the draindown of the binder, one can either increase the surface area of the
aggregate skeleton or can use high viscosity binders. The surface area can be
increased by using either fillers or stabilizers in SMA..
Draindown test was performed to decide maximum binder content of OGFC/ SMA
mixtures for all five binder type as per Schellenberg's drainage test or ASTM D 6390
brinder drainage test procedure.
Prepared loose mixes at 175 ºC was placed on a plate in a wire basket of mesh size
6.3 mm. Drainage basket used in this study is shown in Fig. 3.10.. The mix on the
plate in basket is placed in oven at approx 175°C ( at mixing temperature or 15° C
higher than mixing temperature). After one hour basket containing sample is taken
out of oven, along with plate. Increase in mass of plate is noted.
A maximum draindown of 0.3 percent by weight of total mix is recommended for
SMA and is also considered applicable to OGFC.

81
In order to achieve proper workability of the mix, the modified binders were heated
to relatively higher temperatures compared to the unmodified binder. However, in
order to avoid using two variables (binder type and test temperature) the draindown
test was conducted at the same temperature for mixes with both unmodified and
modified binders so that the influence of modification could be captured.
Fig. 3.10 Drainage Basket
The draindown of binder from the mixture was calculated using the following
equation-
Draindown = (A/ B) * 100 %
A is the increase in the mass of plate
B is the initial weight of sample

82
3.6 PERFORMANCE TESTS ON BITUMINIOUS MIXES
The performance and durability of bituminous mixes were investigated through
following laboratory tests.
1) Indirect Tensile Strength Test (ITS)
2) Tensile Strength Ratio (TSR)
3) Resilient Modulus (Mr)
4) Dynamic Creep Test
5) Wheel Rut Depth Test
The test method and parameters used in this study are as described below:
3.6.1 INDIRECT TENSILE STRENGTH TEST (ITS)
Property of mixture to distribute traffic stresses on the pavement surface or
stiffness of the pavement can be measured in terms of tensile strength. In laboratory
tensile strength characteristics of the mixture is measured by Indirect tensile strength
test. ITS test result may also be used for estimating the potential for rutting or
cracking to evaluate the relative quality of different OGFC/ SMA mixes. The indirect
tensile tests were carried out as per specifications given in ASTM D 6931-07.
This test was conducted at 25°C, by applying diametric load to the cylindrical
specimens with a deformation of 50 mm/minute (constant stress mode). In this test,
the cylindrical specimens were subjected to compressive load between two loading
strips with a concave surface having a radius of curvature equal to the nominal radius
of specimen. The test set up for ITS is shown in Fig.3.11. The applied load creates
tensile stress, perpendicular to and along the diametric plane causing splitting failure

83
(tensile failure) of specimen. The maximum load at failure was recorded and indirect
tensile strength was calculated by using the equation:
2000P
ITS =
π t D
Where,
ITS = Indirect tensile strength kPa
P = Failure load N
D = Diameter of specimen mm
T = Average thickness of specimen mm
Tensile strength is typically used as SMA performance measure for pavements
because it better simulates the tensile stresses at the bottom of the SMA surface
course when it is subjected to loading. These stresses are typically the controlling
structural design stresses. Tensile strength is difficult to measure directly because of
secondary stresses induced by gripping a specimen so that it may be pulled apart.
Therefore, tensile stresses are typically measured indirectly by a splitting tensile test

84
Fig. 3.11: Indirect Tensile Strength Test Set-up
3.6.2 TENSILE STRENGTH RATIO (TSR)
Moisture susceptibility or Moisture induced damage of OGFC/ SMA mixes was
evaluated in terms of TSR, which is expressed as the percentage of average static
indirect tensile strength of the conditioned specimens to the average static indirect
tensile strength of the non conditioned specimens. Testing was conducted as per
AASHTO T 283 specifications to evaluate the moisture-induced damage for
mixtures. OGFC/ SMA mix specimens are conditioned in water bath maintained at

85
60°C for 24 hours, followed by placing the same specimens in a water bath
maintained at 25° C for 2 hours and then subjecting these specimens to Indirect
Tensile Test; the results of which are compared with the unconditioned specimens.
TSR value more than 80 percent is considered acceptable.
TSR value can be calculate by the following equation:
Tensile Strength Ratio (TSR) = (ITS WET/ ITSDRY) * 100 %
Where ITS WET and ITSDRY are average indirect tensile strength of wet and dry
sample respectively.
3.6.3. RESILIENT MODULUS (Mr) TEST
Elastic property of OGFC/ SMA mixes is a important factor as design of
flexible pavements has been carried out on mechanistic approach. The bituminous
material are not elastic and there is a little or more permanent deformation after each
load application depending on the load nature. Since, very small load is being
applied on the bituminous mixes during the test, the same specimen can be utilized
for testing the resilient modulus value of specimen under different loading and
environmental conditions.
When a wheel load being applied at some point on the pavement surface, at a
considerable distance from that point, the stress remains zero and at the same point ,
the stress becomes the maximum. Therefore, the stress pulse is assume to be a
haversine or triangular loading in the test.
The standard ASTM D 4123- 82 (1995) covers procedure for preparing and
86
testing laboratory-fabricated cores of bituminous mixtures to determine resilient
modulus using the repeated-load indirect tension test..
The indirect tensile resilient modulus test was conducted using the Universal
Testing Machine (UTM according to ASTM D4123). In this test, The resilient
modulus test apparatus and fixtures are shown in Fig 3.12 and 3.13 respectively.
The equipment is computer controlled and uses a pneumatic actuator to apply
the load. A cylindrical specimens of diameter 102 mm and 64 mm height was used
as test specimen. A compressive load in a form of haversine wave was applied in the
vertical diametrical plane of cylindrical specimens through a loading strip and the
resulting horizontal recoverable deformations was measured with the help of two
linear variable displacement transformers (LVDT). The specimen is tested at four
points of loading each perpendicular to one another The test was performed at three
temperature i.e. 25°C, 35°C and 45°C, to simulate field condition. Each cylindrical
specimen was kept in environmental chamber for 6 hours for conditioning before
testing, at respective temperature of testing.
The samples were initially subjected to 5 condition pulses. A 1000 N peak
load was applied along the vertical diameter of the sample. The pulse period and
pulse width were respectively 3000 ms and 100ms while the rise time was 50ms
pulse repetition of 1.0 second. Linear variable differential transducers monitored the
resultant indirect tensile strain along the horizontal diameter. The resilient modulus
of elasticity is calculated with an assumed Poisson’s ratio. Since the test is not
destructive, upon completion of this test, the same specimen was used for Dynamic

87
creep test. The resilient modulus of the mixes is calculated using the following
relationship:
P (µ+ 0.2734)
MR =
============================
==
H t
Where,
MR = Resilient Modulus (MPa)
P = Magnitude of Dynamic Load (Newton)
µ = Poisson’s ratio
H = Recoverable Deformation (Millimeter)
T = Mean thickness of specimen (Millimeter)

88
Fig. 3.12: Universal Testing machine (UTM)
Fig. 3.13: Resilient Modulus test apparatus

89
3.6.4 DYNAMIC CREEP TEST
Permanent deformation is one of the an important factor to be considered in
the design of OGFC/ SMA pavements. Higher traffic load and tire pressure occurs in
the upper layers of pavement is the main cause of permanent deformation in
pavement.
The grading, shape and texture of aggregates have great effect on deformation
resistance. Mixes with angular and rough textured crushed aggregates shows better
resistance to permanent deformation due to better interlocking than smooth and
rounded aggregates. Resistance to permanent deformation is also depend on stiffness
of binder, field temperature and method of compaction.
Permanent deformation of asphaltic mixes can be assessed in laboratory by
static creep test, or dynamic creep test. Permanent deformation in paving materials
develops gradually with increasing number of load applications, and it appears as
longitudinal depression in the wheel paths accompanied by small upheavals at the
sides. The creep test provides sufficient information to determine the instantaneous
elastic (recoverable) and plastic (irrecoverable) component of deformation
In this research, resistance of the OGFC/ SMA mixes against permanent
deformation was measured by dynamic creep test. This test simulates the passage of
moving traffic loads on the pavement to study the permanent deformation
characteristics of bituminous materials and its ability to resist the creep distress
under repeated load.
OGFC pavement is typically suggested for higher and fast moving traffic level
90
due to debris logging and higher construction cost. SMA pavement also
recommended mainly for higher traffic load and higher speed pavement due to its
improved performance and higher construction cost. Permanent deformation also
increases due to increased traffic load and tire pressure in the upper layers of
pavement.
The creep test provide much information about the mixes response
characteristics. Either one cycle load/unload (static creep) or cyclic loading (dynamic
creep) is used to interpret strain/time response of materials. creep test provides
significant parameters, which describe the instantaneous elastic/plastic and
viscoelastic/plastic components of the materials response (Mahrez , 2008).
The creep test was carried out using the Asphalt Universal Testing Machine in
accordance with procedures outlined in ASTM D4123.
Dynamic creep test set up used in this study is shown in Fig. 3.14 and close up
of specimen in 3.15.
In laboratory, accumulated strain was recorded by applying a repeated uniaxial
load. Accumulated strain as a function of load cycles was recorded by LVDT’s along
the same axis. Cylindrical specimens of 101 mm x 64 mm (diameter x height) were
kept in environmental chamber at 40°C for 2 hours. In this test haversine loading
with cyclic stress 69 KPa and seating stress of 11 KPa was applied, which prevented
the lifting of sample during rest period. The load cycle width was 100 ms (0.1 s) and
rest period was kept 900 ms (0.9 s) i.e. Load cycle repeat time was 1000 ms. Preload
stress was 20 kpa and preload time was 600 s. Confining stress was 100 kpa,

91
Termination cycle count was 3600 and termination strain was 5%. The test was
performed at 40°C and continued for 3600 cycles or up to the 10000 micro strains,
whichever occurs first (approx 1 hour testing period for one specimen). The
Dynamic Creep Test Parameters Adopted in this Study is shown below in Table 3.15
Table 3.15 : Dynamic Creep Test Parameters
Parameter Duration
Pulse period (ms) 1000
Pulse width (ms) 200
Test Loading Stress (kPa) 100
Terminal Pulse Count 3600
Test Temperature 40°C

92
Fig. 3.14: Dynamic creep test set up
Fig. 3.15: Dynamic creep test specimen

93
3.6.5 Wheel Tracking Test
Rutting is one of the primary distresses in asphalt pavements, especially in
hotter summer temperatures and/or under heavy loads. Permanent deformation in the
pavement under wheel path of traffic is called Rutting.
Performance of the OGFC and SMA mix regarding susceptibility to rutting is
evaluated by Hamburg Wheel Tracking Device (HWTD). Shown in Fig. 3.19. It
simulates resistance to permanent deformation and correlate well with in-service
pavement rutting. The standard HWTD wheel tracking test setup shown in Fig. 3.18
Due to the repetitive traffic loads on asphaltic pavement surface densification
(volume change) and shear deformation take place, which caused Permanent
deformation. Rate of permanent deformation depends on maximum aggregate size,
proportion of filler and binder, binder type. The rate of permanent deformation
increases with increase in test temperature.
The rate of permanent deformation increases with increase in temperature.
Susceptibility of bituminous mixes to rutting can be measured by wheel tracking
device (WTD).
It was used to measure the permanent deformation of OGFC mixes using a
LVDT. This test was conducted as per BS: 598-1998 on the laboratory prepared
OGFC/ SMA mixes slab specimen of size 300 x 300 x 50 mm. Shown in Fig. 3.17.
The OGFC slabs were prepared using the roller compactor shown in Fig. 3.16 to the
target density. The sample was kept in environmental chamber for 2 hours at the
40°C prior to the testing. The test specimen was placed in a confined mold rigidly

94
restrained on all its four sides. The test was performed at 45°C and 20000 passes
were applied. Test duration is kept 480 minutes for each slab. A solid rubber steel
wheel connected to a cantilever arm, bears on a load of 310 N was applied through
and indent a straight track on the test specimen held on a reciprocating table. The
contact area between the wheel and specimen was about 545.7mm2, which gives a
normal pressure of 566 kPa. The table moves to and fro beneath the wheel in the
fixed horizontal plane with a frequency of 21 cycles per minute (42 passes per
minute) and it travel a distance of 230±5 mm per cycle.
An automatic displacement measuring device which is connected to recording
equipment is attached to the system to measure the vertical position of the wheel.
The depth of the deformation was recorded at the midpoint of its length. A 20 mm
maximum rut depth can be measured by using this system.
.
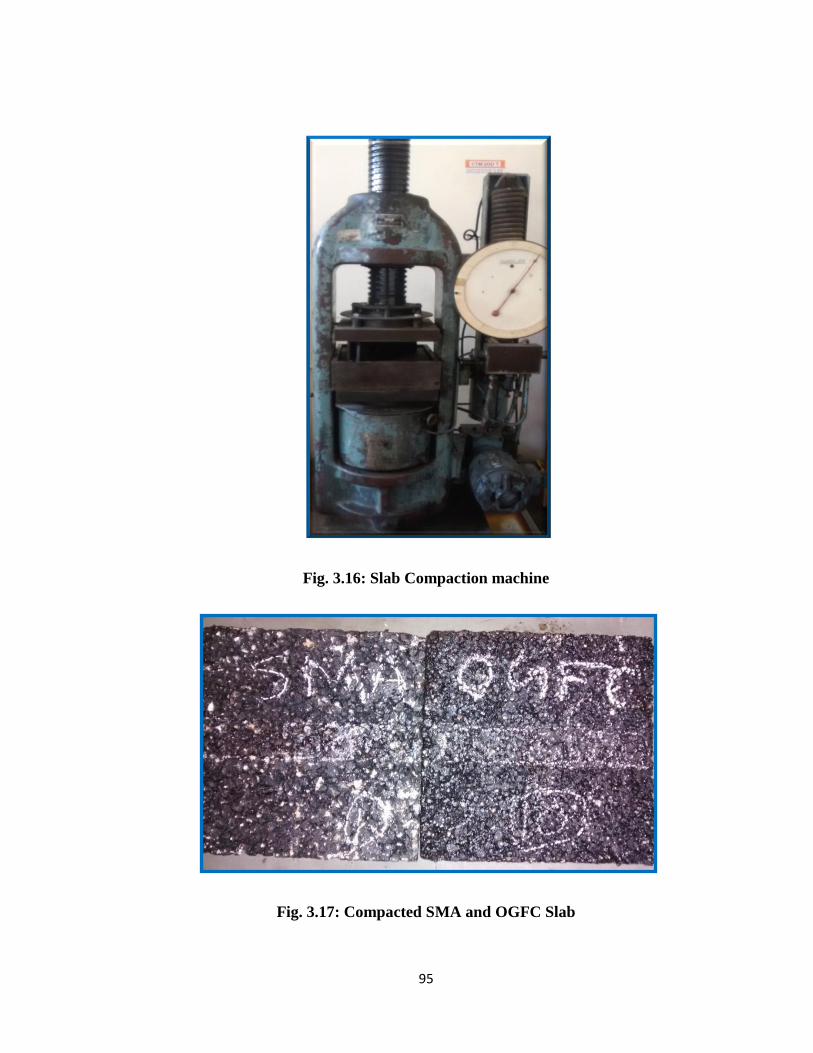
95
Fig. 3.16: Slab Compaction machine
Fig. 3.17: Compacted SMA and OGFC Slab

96
Fig. 3.18: Wheel Tracking Test in progress
Fig. 3.19: Wheel Tracking Device Set-up

97
The performance and durability tests on OGFC and SMA mixes were conducted.
The comparison of mixes with plain bitumen was done with modified and warm
asphalt mixes was carried out. The results and analysis of these tests have been
described in Chapter 4.

98
CHAPTER 4
ANALYSIS OF TEST RESULTS AND DISCUSSION
=======================================================================
4.1 INTRODUCTION
The design of OGFC and SMA mixtures were carried out by Marshal mix design
method, as per guidelines of NCAT and MORTH. It is mentioned earlier that five
type of binders VG-30, PMB-40, CRMB-55, WMA-E and WMA-Z were used in the
OGFC and SMA mix designs. Different volumetric and mechanical properties of the
each type of mixes were found out. The detailed procedure of the experiments
carried out on these OGFC and SMA mixes are given in the previous chapter. In this
chapter the results and observations of the stability, cantrabro, drain-down etc. tests
conducted are analyzed and discussed. Moisture susceptibility of the design mixes at
OBC was examined by Tensile Strength Ratio (TSR) test. Durability of asphaltic
mixes were evaluated through a series of performance tests in laboratory such as
indirect tensile strength, resilient modulus, dynamic creep and rut depth by wheel
tracking device.
This chapter is divided into five sections. In first section, result of various tests
performed for OGFC mix design is presented. In second part, result of the various
performance tests perform on OGFC specimen at OBC is discussed. In the third part,
result of tests performed to prepare design mix of SMA is presented. In the fourth
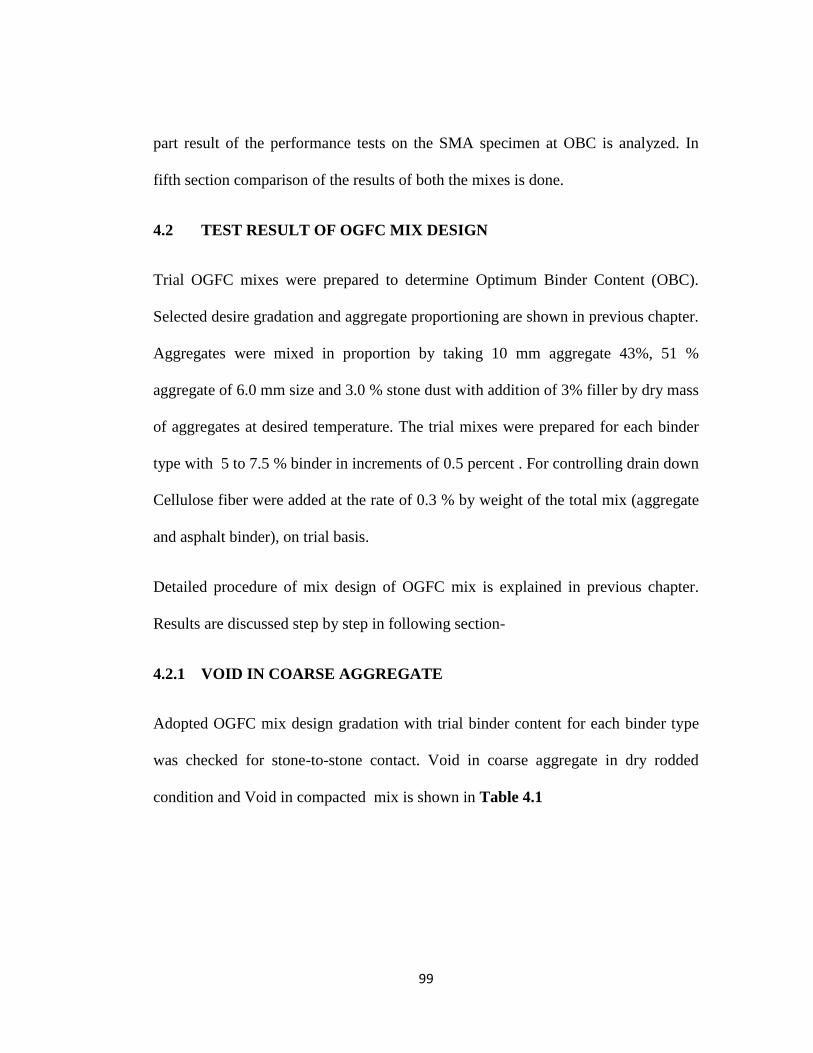
99
part result of the performance tests on the SMA specimen at OBC is analyzed. In
fifth section comparison of the results of both the mixes is done.
4.2 TEST RESULT OF OGFC MIX DESIGN
Trial OGFC mixes were prepared to determine Optimum Binder Content (OBC).
Selected desire gradation and aggregate proportioning are shown in previous chapter.
Aggregates were mixed in proportion by taking 10 mm aggregate 43%, 51 %
aggregate of 6.0 mm size and 3.0 % stone dust with addition of 3% filler by dry mass
of aggregates at desired temperature. The trial mixes were prepared for each binder
type with 5 to 7.5 % binder in increments of 0.5 percent . For controlling drain down
Cellulose fiber were added at the rate of 0.3 % by weight of the total mix (aggregate
and asphalt binder), on trial basis.
Detailed procedure of mix design of OGFC mix is explained in previous chapter.
Results are discussed step by step in following section-
4.2.1 VOID IN COARSE AGGREGATE
Adopted OGFC mix design gradation with trial binder content for each binder type
was checked for stone-to-stone contact. Void in coarse aggregate in dry rodded
condition and Void in compacted mix is shown in Table 4.1

100
Table 4.1: Void in Coarse Aggregate test results
OGFC
design mix
type
VCA(DRC)
VCA MIX
Binder Content %
5.0 5.5 6.0 6.5 7.0 7.5
VG-30 43.6 37.8 37.8 38.5 38.5 39.6 39.8
PMB-40 43.6 37.9 37.9 38.8 38.9 39.8 39.9
CRMB-55 43.6 38.0 38.0 39.4 39.6 41.1 41.2
WMA-E 43.6 37.6 37.9 38.5 38.9 39.1 39.8
WMA-Z 43.6 37.9 38.5 38.9 38.9 40.6 41.1
As per above result, voids in dry rodded condition is higher for all the mixes at all
six percentage of binder. Hence stone to stone contact can be maintained in the mix
at all trial binder percentage for each binder type.
4.2.2 DETERMINATION OF OPTIMUM BINDER CONTENT (OBC)
As per NAPA [National Asphalt Pavement Association] specifications, the Optimum
asphalt content for porous/ OGFC mixes is determined on the basis of two basic
requirements i.e. binder content at which specimen have air void greater than 18%,
and draindown less than 0.3%. However, advance recommendation of NCAT

101
[National Centre for Asphalt Technology], specimen should also check for cohesion
and bonding property of mixes in both normal and conditioned specimen.
NCAT defines OBC for OGFC mixes as a binder content at which specimen met air
voids greater than 18% and drain down less than 0.3% and in addition to these two,
two more requirement should be met i.e. Cantabro Abrasion of un-aged specimens
should be less than 20% and Cantabro Abrasion of aged specimens should be less
than 30%.
In the present research work, advance standards recommended by NCAT for
obtaining optimum binder content were adopted. Desire OGFC mixes were prepared
at design gradation adopted for each binder type. On the compacted trial mixes
following tests were performed to find out Optimum Binder Content (OBC) for each
mix type-
1) Air void in mix
2) Cantrabo Abrasion Loss (Unaged )
3) Cantrabo Abrasion Loss (Aged)
4) Marshall Stability of mixes
5) Drain Down of binder (this test was performed on loose sample of trail
mixes).
The test result of above experiments are shown in tabular and graphical form, for
VG-30, PMB-40, CRMB-55, WMA-E AND WMA-Z. respectively in Table. 4.2 to
4.6 and Fig. 4.1 to 4.5.

102
Table 4.2 : Test results of trial mixes for determination of Optimum Binder Content (OBC) for OGFC mix design
with VG-30 binder
S.NO. Binder
content %
Air Voids Cantabro Abrasion Loss
( Unaged )
Cantabro Abrasion
Loss
( Aged )
Draindown %
Min 18 % Max. 20% Max 30% Max 0.3%
1 5.0 32.06
43.25 55.10 0.223
2 5.5 28.31
35.62 42.36 0.298
3 6.0 25.03
30.35 38.89 0.355
4 6.5 24.09
28.17 . 35.36 0.492
5 7.0 26.11
19.20 28.21 0.589
6 7.5 28.32
13.60 24.21 0.883
( -The yellow colored cell/block in each table of this chapter, shows the value which is inappropriate as per
NCAT standards of OGFC mix design)
103
From Table 4.2, it is clear that mix does not meet, all the requirements for any
binder content. Although at all binder percentage mix have, sufficient air void
content. From binder content percent 5.5 to 6.5% binder does not have proper
bonding and cohesion, i.e. binder fail in cantrabro test both in aged and unaged
condition. From 6.0 to 7.5 % binder content, mixes fail due to excessive draindown
due to higher binder content. At 6.5 % binder content mix have higher abrasion loss
in un-aged condition and at 7.5 % binder content mix design also fail due to less
aging resistance potential.
As a remedial treatment, amount of cellulose fiber was increased for reducing
draindown and it will also improve abrasion loss and aging potential of the mix, to
some extent. In next trial session, amount of cellulose fiber was increased from 0.3
% to 0.4 %. VCA mix of compacted specimen with 0.4 % cellulose fiber is again
calculated for confirming stone-to - stone contact in mix. as, result shows (Table
4.3), as VCAMIX is less than VCADRC , stone-to-stone contact of the mix is
maintained.
From Table 4.3 and Fig. 4.1, at 6.75 to 7.0% range of binder content only VG-30
binder mix fulfills the all above mentioned requirements. Hence, optimum binder
content with VG-30 was found to be 6.8 % for OGFC mix.
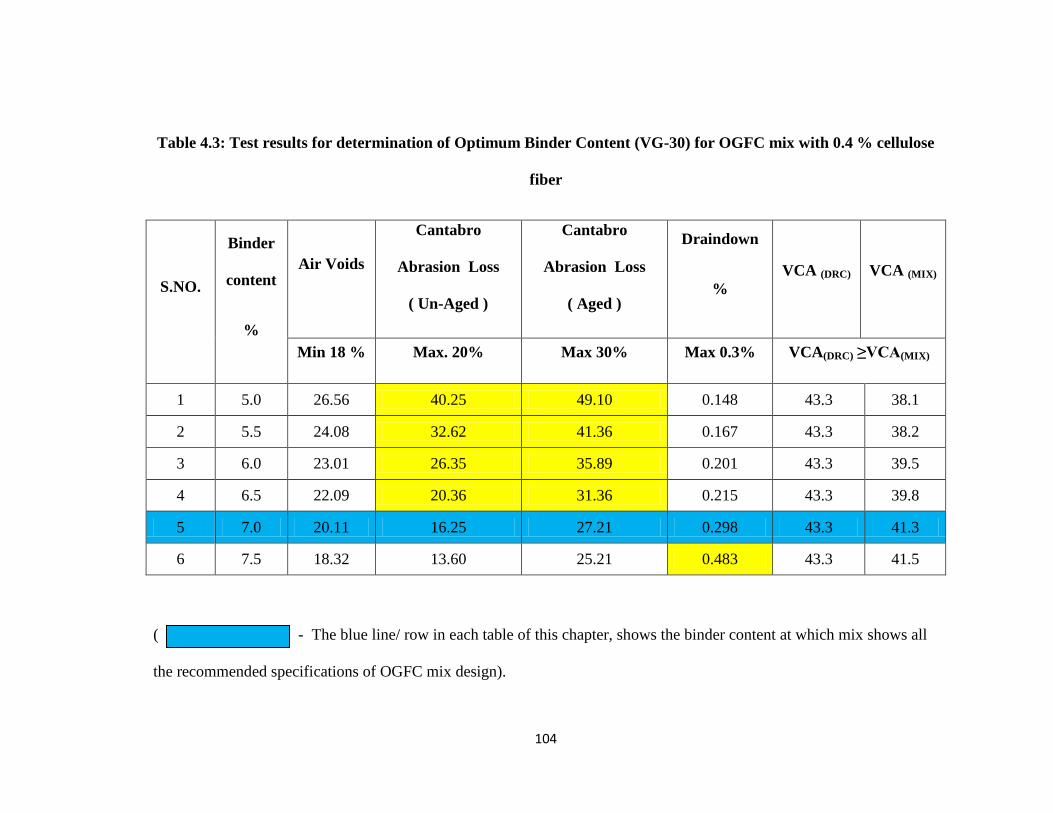
104
Table 4.3: Test results for determination of Optimum Binder Content (VG-30) for OGFC mix with 0.4 % cellulose
fiber
S.NO.
Binder
content
%
Air Voids
Cantabro
Abrasion Loss
( Un-Aged )
Cantabro
Abrasion Loss
( Aged )
Draindown
%
VCA (DRC) VCA (MIX)
Min 18 % Max. 20% Max 30% Max 0.3% VCA(DRC) ≥VCA(MIX)
1 5.0 26.56 40.25 49.10 0.148 43.3 38.1
2 5.5 24.08 32.62 41.36 0.167 43.3 38.2
3 6.0 23.01 26.35 35.89 0.201 43.3 39.5
4 6.5 22.09 20.36 31.36 0.215 43.3 39.8
5 7.0 20.11 16.25 27.21 0.298 43.3 41.3
6 7.5 18.32 13.60 25.21 0.483 43.3 41.5
( - The blue line/ row in each table of this chapter, shows the binder content at which mix shows all
the recommended specifications of OGFC mix design).
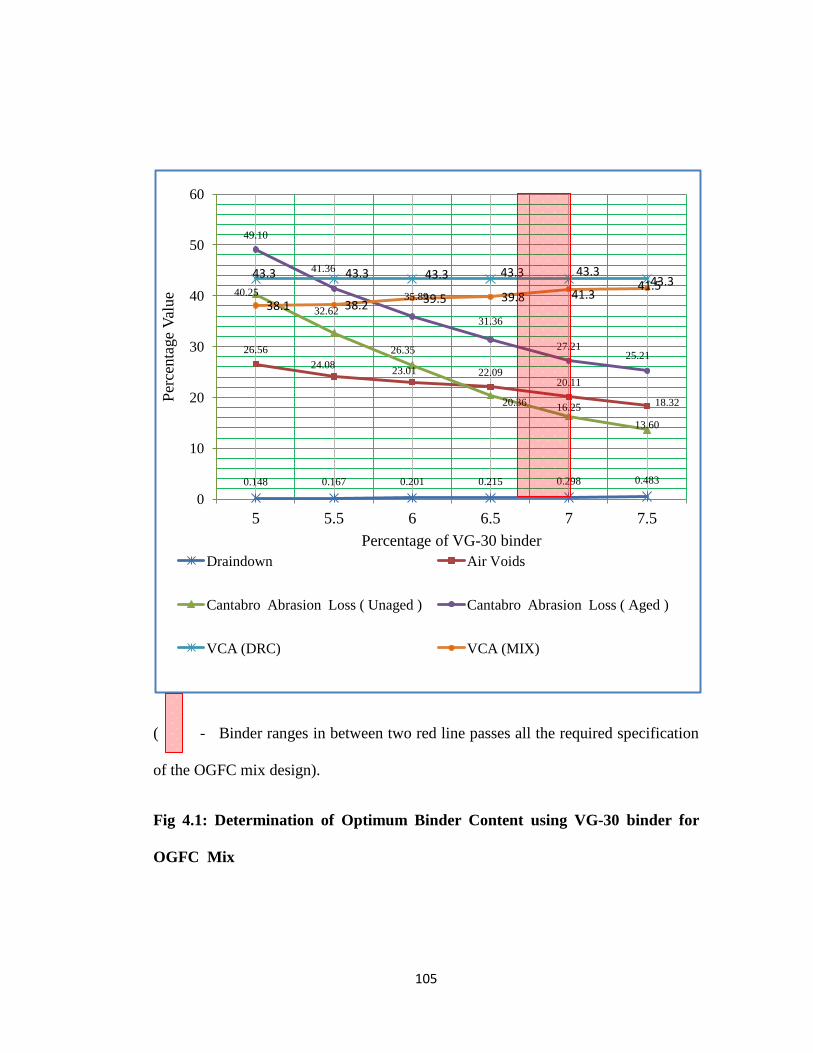
105
( - Binder ranges in between two red line passes all the required specification
of the OGFC mix design).
Fig 4.1: Determination of Optimum Binder Content using VG-30 binder for
OGFC Mix
0.148 0.167 0.201 0.215 0.298 0.483
26.56
24.08 23.01 22.09
20.11
18.32
40.25
32.62
26.35
20.36 16.25
13.60
49.10
41.36
35.89
31.36
27.21 25.21
43.3 43.3 43.3 43.3 43.3 43.3
38.1 38.2 39.5 39.8 41.3 41.5
0
10
20
30
40
50
60
5 5.5 6 6.5 7 7.5
Per
centa
ge
Val
ue
Percentage of VG-30 binder
Draindown Air Voids
Cantabro Abrasion Loss ( Unaged ) Cantabro Abrasion Loss ( Aged )
VCA (DRC)
VCA (MIX)

106
Table 4.4 : Test results of trial mixes for determination of Optimum Binder
Content (OBC) for OGFC mix design with PMB-40 binder
S.NO.
Binder
content
%
Air Voids
Cantabro
Abrasion Loss
( Un-Aged )
Cantabro
Abrasion Loss
( Aged )
Draindown
%
Min 18 % Max. 20% Max 30% Max 0.3%
1 5.0 29.56 38.05 51.23 0.155
2 5.5 26.03 26.09 35.03 0.193
3 6.0 24.13 16.10 24.12 0.248
4 6.5 23.06 9.69 19.32 0.305
5 7.0 20.32 8.23 20.36 0.448
6 7.5 23.46 15.60 35.96 0.691
As shown in Table 4.4 and Fig. 4.2, Range of suitable binder content, at which
binder passes all the requirement are wider than VG-30. Results are also improved.
PMB-40 binder shows better adhesion quality both in normal and aged condition. Air
void also increases, may be due to less amount of binder. Optimum binder content
on the basis of above desired specification and test results, with PMB-40 as a binder
was found to be 6.0%.

107
Fig 4.2: Determination of Optimum Binder Content using PMB-40 binder for
OGFC Mix
0.155 0.193 0.248 0.305 0.448 0.691
29.56
26.03 24.13 23.06
20.32
23.46
38.05
26.09
16.10
9.69 8.23
15.60
51.23
35.03
24.12
19.32
20.36
35.96
43.6 43.6 43.6 43.6 43.6 43.6
37.9 37.9 38.8 38.9 39.8
39.8
0
10
20
30
40
50
60
5 5.5 6 6.5 7 7.5
Per
cen
tag
e V
alu
e
Percentage of PMB-40 binder
Draindown Air Voids
Cantabro Abrasion Loss ( Unaged ) Cantabro Abrasion Loss ( Aged )
VCA (DRC) VCA (MIX)

108
Table 4.5 : Test results for trial mixes for determination of Optimum Binder Content (OBC) for OGFC mix
design with CRMB-55 binder
S.NO.
Binder
content
%
Air Voids Cantabro Abrasion Loss
( Unaged )
Cantabro Abrasion Loss
( Aged ) Draindown %
Min 18 % Max. 20% Max 30% Max 0.3%
1 5.0 27.73 38.31 48.29 0.156
2 5.5 25.17 27.53 35.61 0.185
3 6.0 22.48 19.10 31.30 0.213
4 6.5 20.06 11.65 25.03 0.278
5 7.0 24.85 9.10 20.04 0.481
6 7.5 26.60 14.50 27.94 0.582

109
Fig 4.3: Determination of Optimum Binder Content using CRMB-55 binder for
OGFC Mix
As shown in Table 4.5 and Fig. 4.3, CRMB-55 also improved the mix properties.
Optimum binder content on the basis of above mentioned specification for OGFC
mix and test results, with CRMB-55 as a binder is taken 6.5 %.
0.156 0.185 0.213 0.278 0.481 0.582
27.73
25.17 22.48 20.06
24.85 26.60
38.31
27.53
19.10
11.65
9.10
14.50
48.29
35.61 31.30
25.03
20.04
27.94
43.6 43.6 43.6 43.6 43.6 43.6
38.0 38.0 39.4 39.6
41.1 41.2
0
10
20
30
40
50
60
5 5.5 6 6.5 7 7.5
Per
centa
ge
Val
ue
Percentage of CRMB-55 binder
Draindown Air Voids
Cantabro Abrasion Loss ( Unaged ) Cantabro Abrasion Loss ( Aged )
VCA (DRC) VCA (MIX)

110
Table 4.6 : Test results of trial mixes for determination of Optimum Binder Content (OBC) for OGFC mix design
with WMA-E binder
S.NO.
Binder
content
%
Air Voids
Cantabro Abrasion Loss
( Un-Aged )
Cantabro Abrasion Loss
( Aged )
Draindown
%
Min 18 % Max. 20% Max 30% Max 0.3%
1 5.0 30.13 32.19 48.63 0.151
2 5.5 28.71 23.53 32.54 0.175
3 6.0 26.18 14.32 22.61 0.216
4 6.5 22.12 12.65 21.03 0.359
5 7.0 18.14 10.30 24.04 0.595
6 7.5 16.56 18.30 28.94 0.609

111
Fig 4.4: Determination of Optimum Binder Content using WMA-E binder for
OGFC Mix
As shown in Table 4.6 and Fig. 4.4, WMA-E also improved the mix properties even
at lower binder content. Optimum binder content on the basis of above mentioned
specifications for OGFC mix and test results, with WMA-E as a binder is taken 6.0
%.
0.151 0.175 0.216 0.359 0.595 0.609
30.13
28.71 26.18
22.12
18.14 16.56
32.19
23.53
13.32 12.65
10.3
18.3
48.63
32.54
22.61
21.03
24.04
28.94
43.6 43.6 43.6 43.6 43.6 43.6
37.6 37.9 38.5 38.9 39.1 39.8
0
10
20
30
40
50
60
5 5.5 6 6.5 7 7.5
Per
centa
ge
Val
ue
Percentage of WAM-E binder with 0.4 % Cellulose Fiber
Draindown Air Voids
Cantabro Abrasion Loss ( Unaged ) Cantabro Abrasion Loss ( Aged )
VCA (DRC) VCA (MIX)

112
Table 4.7 : Test results of trial mixes for determination of Optimum Binder Content (OBC) for OGFC mix design
with WMA-Z binder
S.NO.
Binder
content
%
Air
Voids
Cantabro
Abrasion
Loss
( Unaged )
Cantabro
Abrasion
Loss
( Aged )
Draindown %
Min 18
% Max. 20% Max 30% Max 0.3%
1 5.0 30.21 33.19 42.65 0.182
2 5.5 28.09 24.37 35.30 0.200
3 6.0 24.46 12.32 24.11 0.219
4 6.5 23.06 8.36 20.03 0.319
5 7.0 18.41 15.69 28.32 0.521
6 7.5 15.6 25.36 34.31 0.664
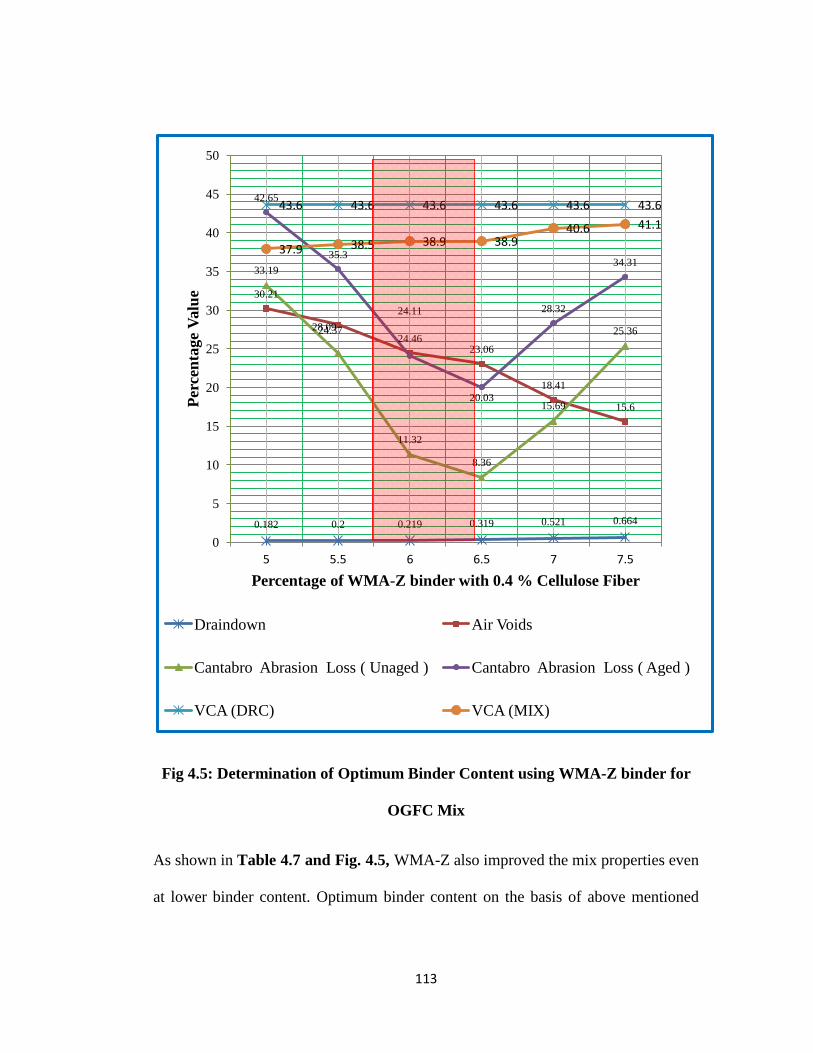
113
Fig 4.5: Determination of Optimum Binder Content using WMA-Z binder for
OGFC Mix
As shown in Table 4.7 and Fig. 4.5, WMA-Z also improved the mix properties even
at lower binder content. Optimum binder content on the basis of above mentioned
0.182 0.2 0.219 0.319 0.521 0.664
30.21
28.09 24.46
23.06
18.41
15.6
33.19
24.37
11.32
8.36
15.69
25.36
42.65
35.3
24.11
20.03
28.32
34.31
43.6 43.6 43.6 43.6 43.6 43.6
37.9 38.5 38.9 38.9 40.6 41.1
0
5
10
15
20
25
30
35
40
45
50
5 5.5 6 6.5 7 7.5
Per
cen
tage
Valu
e
Percentage of WMA-Z binder with 0.4 % Cellulose Fiber
Draindown Air Voids
Cantabro Abrasion Loss ( Unaged ) Cantabro Abrasion Loss ( Aged )
VCA (DRC) VCA (MIX)

114
specifications for OGFC mix and test results, with WMA-E as a binder is found to be
6.0% of total aggregate weight.
In all above test results, draindown performed as limiting factor for maximum binder
content and abrasion loss value performed as limiting factor for minimum binder
content.
4.2.3 Marshall Stability Of Various Mixes
Fig. 4.6: Marshall Stability of OGFC mixes versus binder content with
various binder
Stability test was performed to determine ability of OGFC mix to withstand traffic
loads without distortion or deflection, especially at higher temperature. The curve of
Stability versus bitumen content for the OGFC mixes with all type of binders are
shown in Fig. 4.6. Results indicate that stability first increases up to a certain
maximum value and then gradually decreases with the increase in bitumen content
600
800
1000
1200
1400
1600
1800
2000
4.5 5 5.5 6 6.5 7 7.5
Mars
hall
Sta
bil
ity, K
g
Binder Content %
VG-30
PMB-40
CRMB-55
WMA-E
WMA-Z
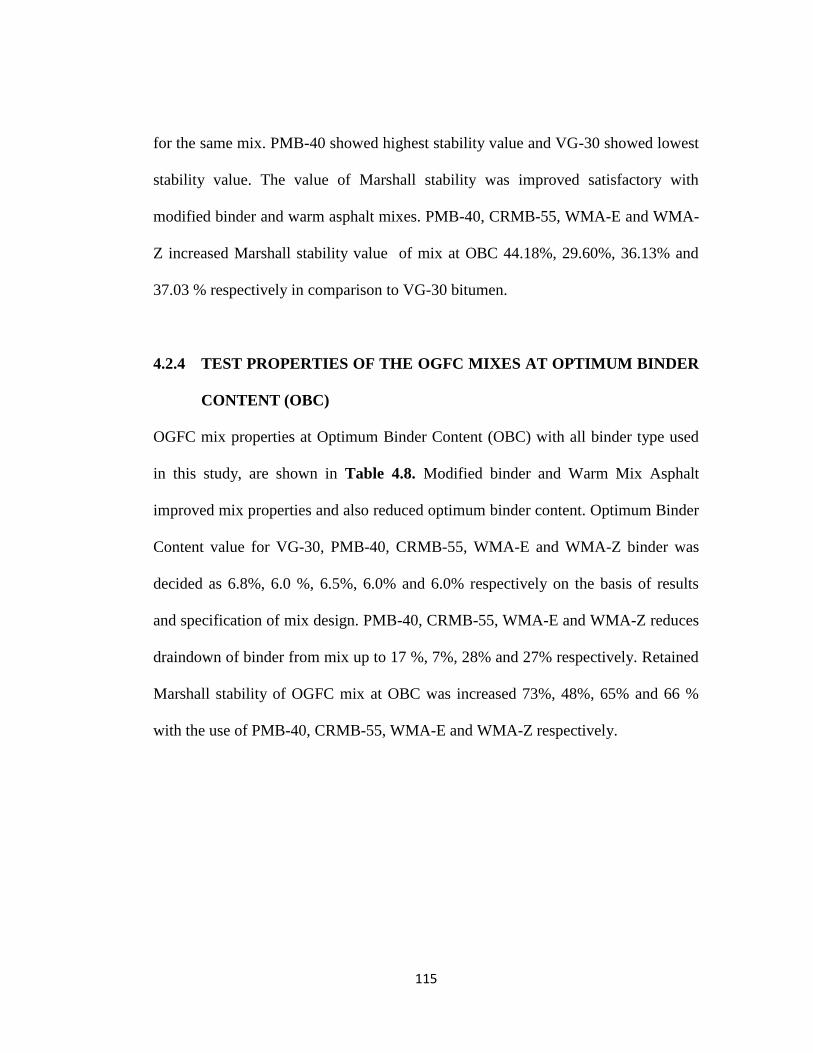
115
for the same mix. PMB-40 showed highest stability value and VG-30 showed lowest
stability value. The value of Marshall stability was improved satisfactory with
modified binder and warm asphalt mixes. PMB-40, CRMB-55, WMA-E and WMA-
Z increased Marshall stability value of mix at OBC 44.18%, 29.60%, 36.13% and
37.03 % respectively in comparison to VG-30 bitumen.
4.2.4 TEST PROPERTIES OF THE OGFC MIXES AT OPTIMUM BINDER
CONTENT (OBC)
OGFC mix properties at Optimum Binder Content (OBC) with all binder type used
in this study, are shown in Table 4.8. Modified binder and Warm Mix Asphalt
improved mix properties and also reduced optimum binder content. Optimum Binder
Content value for VG-30, PMB-40, CRMB-55, WMA-E and WMA-Z binder was
decided as 6.8%, 6.0 %, 6.5%, 6.0% and 6.0% respectively on the basis of results
and specification of mix design. PMB-40, CRMB-55, WMA-E and WMA-Z reduces
draindown of binder from mix up to 17 %, 7%, 28% and 27% respectively. Retained
Marshall stability of OGFC mix at OBC was increased 73%, 48%, 65% and 66 %
with the use of PMB-40, CRMB-55, WMA-E and WMA-Z respectively.

116
Table 4.8: Various test properties of OGFC Mixes at OBC
MIX DESGIN PROPERTY AT
OBC
VG-
30
PMB-
40
CRMB
-55
WMA-
E
WMA-
Z
Binder (% Total Weight of
Aggregate)
6.8 6.0 6.5 6.0 6.0
Vv (Air Void in the mix) % 22.09 24.13 22.48 26.18 24.46
Vb (Air void in the mix) % 8.6 6.1 7.5 3.2 5.7
VMA (Void in Mineral
Aggregate) %
30.7 30.2 30.0 29.4 30.2
VFB (Voids filled with
bitumen) (%)
28.0 20.1 25.1 11.0 19.0
Bulk Density (gm/cm3) 1938.0 1958.0 1945.0 1950.0 1952.0
Draindown (%) 0.298 0.248 0.278 0.216 0.219
Marshall Stability Kg 1118 1612 1449 1522 1532
Marshall Stability of water
conditioned Specimen
827 1434 1231 1369 1378
Retained Stability % 74 89 85 90 90
Flow Value (mm) 3.3 2.4 2.9 2.8 2.7

117
4.3 INVESTIGATING THE PERFORMANCE AND DURABILITY OF
OGFC MIXES
The performance and durability of OGFC mixes were investigated through
laboratory tests. At optimum binder content, additional specimens were prepared and
following investigations were carried out to assess the performance and durability of
bituminous mixes.
1) Indirect Tensile Strength (ITS)
2) Tensile Strength Ratio (TSR)
3) Resilient Modulus (MR)
4) Dynamic Creep Test
5) Rut Depth by Hamburg Wheel Tracking Device (HWTD)
The method and parameters used to perform the above stated tests have
already described in Section 3.5

118
4.3.1 Indirect tensile strength test result
For evaluating stiffness of the OGFC pavement, Indirect tensile test was
performed both in normal and wet condition and test results are shown in Table 4.9.
Table 4.9: ITS test result of OGFC mixes with various binders
OGFC design mix type Dry ITS
(Mpa)
Wet ITS
(Mpa)
VG-30 0.45 0.35
PMB-40 0.84 0.79
CRMB-55 0.55 0.46
WMA-E 0.72 0.63
WMA-Z 0.65 0.58
Due to higher void content, stiffness of porous asphalt mixture is lesser than dense
graded mixtures, approximately one-half to two-thirds of dense-graded mixtures.
Higher the percentage of voidss in OGFC, lower the stiffness of the mixtures.
Fig. 4.7 shows both normal and conditioned ITS value for each mix. PMB-40 shows
highest ITS value both in dry and wet condition. Warm Mix Asphalt technology
improve results even at lower compaction temperature i.e. reduce the chance of
moisture damage due to lower temperature during compaction. CRMB-55 also
improved results satisfactorily.

119
Fig.4.7 : Test results of Indirect Tensile Strength Test of OGFC mixes
The increase in normal condition ITS values with PMB, CRMB, WMA-E and
WMA-Z mix was found to be 1.87, 1.22, 1.56 and 1.42 times respectively to that of
the conventional asphalt mix. Improvement in conditioned ITS value with PMB,
CRMB, WMA-E and WMA-Z mix was found to be 2.24, 1.39, 1.90 and 1.75 times
respectively to that of conventional asphalt mix.
Increase ITS value with the addition of modified and warm asphalt in OGFC mixes
might be due to improve adhesion or better interlocking action. As mentioned earlier
Warm Mix Asphalts reduces binder absorption by aggregate thus provide higher
effective binder content in matrix. In case of modified binders, this improvement
may be due to improve tensile properties of the mixture with the use of polymer
modified and crumb rubber modified binder. The mixes having higher value of ITS
can withstand higher level of tensile strain prior to cracking.
0.00
0.20
0.40
0.60
0.80
1.00
VG-30 PMB-40 CRMB-55 WMA-E WMA-Z
Indir
ect
Ten
sile
Str
ength
in M
pa
Dry ITS
Wet ITS

120
4.3.2 Tensile Strength Ratio (TSR) Test Results
Moisture Susceptibility/ Moisture Sensitivity of the OGFC mixes was determined by
tensile strength ratio test. The test results of OGFC mixes are shown in Table 4.10.
the VG-30 mix showed the highest water damage, while the WMA-Z mix had the
lowest water damage.
Table 4.10: TSR value of OGFC mixes with various binders
OGFC design mix type TSR %
VG-30 73.33
PMB-40 88.10
CRMB-55 83.64
WMA-E 90.00
WMA-Z 90.63
Moisture Susceptibility/ Moisture Sensitivity As shown in Fig.4.8, VG-30 have 0.73
TSR value, which is less than acceptable value (0.80). Hence use of modified binder
and warm mix asphalt are expected to improve the moisture susceptibility
characteristics of OGFC mix.

121
Fig.4.8 : Test results of Tensile Strength Ratio of various OGFC mixes
Percentage increase in tensile strength for mixtures with PMB-40, CRMB-55,
WMA-E and WMA-Z was found to be approx 20.13%, 14.0 %, 22.73% and 23.58%
respectively to that of conventional mix with VG-30 and It was felt that the results
showed decreased pronounced tensile strength since the material was an open-graded
mixture.
70.00
80.00
90.00
100.00
VG-30 PMB-40 CRMB-55 WMA-E WMA-Z
Ten
sile
Str
ength
Rat
io (
%)
TSR

122
4.3.3 Resilient Modulus (Mr) Test
Resilient modulus tests were performed to measure elastic property of OGFC mixes
with VG-30 in comparison to modified and warm mix asphalt, at three different
temperatures. The test temperatures were selected, so as to simulate field temperature
condition. Test was performed at Minimum, Medium and Maximum value of most
prevailing field temperature i.e. 25°C, 35°C and 45°C on all OGFC mixes and results
are shown in Table 4.11.
Table 4.11: Resilient Modulus value of OGFC mixes with different binder types.
OGFC design mix type Resilient Modulus (MPa)
25°C 35°C 45°C
VG-30 3154 1493 814
PMB-40 4534 2925 1016
CRMB-55 3943 2612 811
WMA-E 7127 3957 1331
WMA-Z 6594 3871 1602
As shown in Fig. 4.9, WMA technology improved more resilient modulus qualities
than modified binders. WMA-Z mix shows lowest drop in resilient modulus or
elastic property at higher temperature. WMA-E mix showed highest resilient
modulus at 25°C and 35°C. At 45°C, WMA-Z show highest MR values. At low

123
temperatures Modified binders showed no significant differences. PMB-40 improves
mix quality at all the three temperatures. CRMB-55 mix were having higher MR
values at 25°C and 35°C, However lower MR were observed at 45°C. The typical
resilient modulus test results are shown in Fig. 4.9
Fig. 4.9 : Resilient modulus Test Results of OGFC mixes with various binder
type
Fig. 4.10 Typical results of Resilient Modulus test in UTM
(Sample-SMA mix design with VG-30 binder @35°C)
0
2000
4000
6000
8000
VG-30 PMB-40 CRMB-55 WMA-E WMA-Z
Mr
in M
pa
25°C 35°C 45°C

124
4.3.4 Dynamic Creep Test Results
The resistance of the OGFC mixes against permanent deformation is measured by
dynamic creep test. Dynamic creep test results on OGFC mixes in terms of
percentage cumulative strain are presented in Table 4.12. In design of OGFC
pavement, permanent deformation is a important factor. Decrease in the value of
cumulative strain reflects improvement in resistance against permanent deformation
and vice-versa.
Table 4.12: Cumulative Strain of OGFC mixes with all binder types
Type of binder mix Cumulative Strain %
VG-30 51.3
PMB-40 18.2
CRMB-55 36.7
WMA-E 25.6
WMA-Z 44.3
Rate of increase of rut depth (permanent deformation) decreased with increased
number of passes (cycles), the increase in deformation is essentially due to reduction
in air voids. The rate of air voids reduction is higher (steeper slope) in the

125
conventional mix when compared to rate of air voids reduction in modified and
warm mix. The performance of the conventional mix is lower than the warm asphalt
and modified asphalt mix. This might be possibly due to difference in internal
structure evolution with number of passes for the mix with modified and WMA in
comparison to plain bitumen. Fig.4.11 shows the permanent deformation plotted
against the number of passes for all type of binders ..
Fig.4.11: Cumulative Strain Vs No. of load Cycle Curve of creep test for
various OGFC mixes.
0
0.1
0.2
0.3
0.4
0.5
0.6
1
9
10
1
20
1
30
1
40
1
50
1
60
1
70
1
80
1
90
1
10
01
12
01
13
01
14
01
15
01
16
01
17
01
18
01
19
01
20
01
21
01
22
01
23
01
24
01
25
01
26
01
27
01
28
01
29
01
30
01
31
01
32
01
33
01
34
01
35
01
36
00
Tota
l per
man
ent
stra
in (
%)
No. of Load cycle
VG-30 PMB-40 CRMB-55 WMA-E WMA-Z
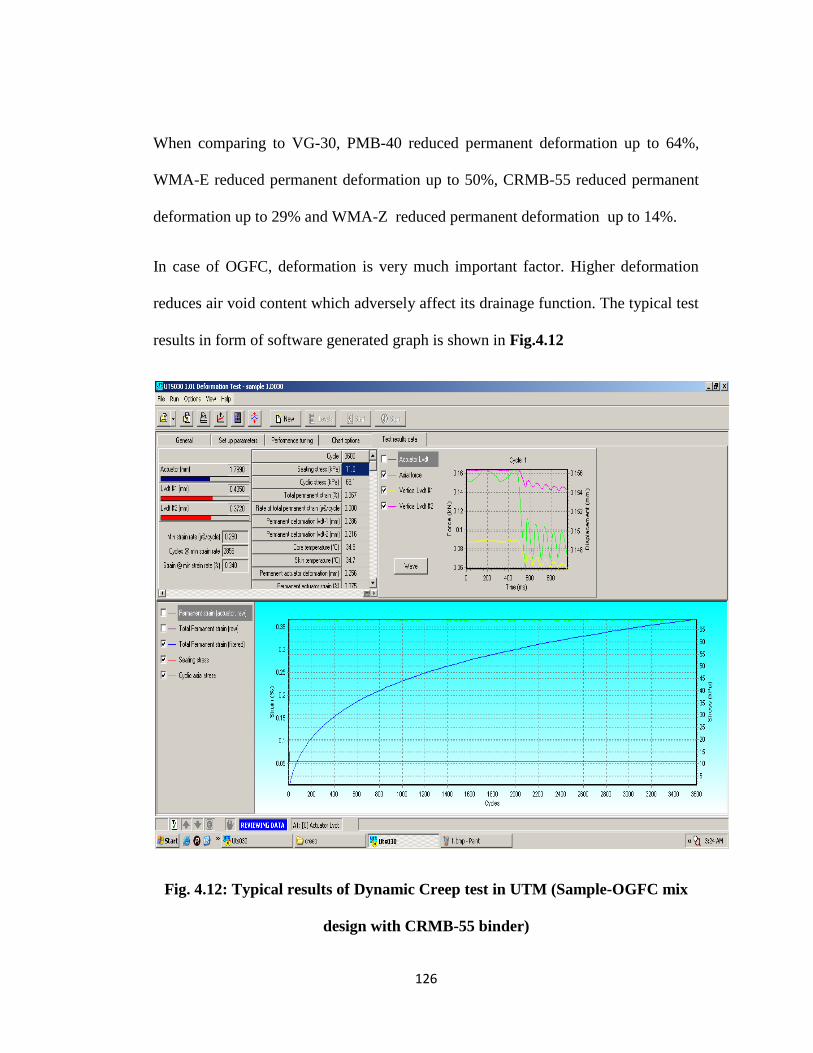
126
When comparing to VG-30, PMB-40 reduced permanent deformation up to 64%,
WMA-E reduced permanent deformation up to 50%, CRMB-55 reduced permanent
deformation up to 29% and WMA-Z reduced permanent deformation up to 14%.
In case of OGFC, deformation is very much important factor. Higher deformation
reduces air void content which adversely affect its drainage function. The typical test
results in form of software generated graph is shown in Fig.4.12
Fig. 4.12: Typical results of Dynamic Creep test in UTM (Sample-OGFC mix
design with CRMB-55 binder)

127
4.3.5 Wheel Tracking Test
A wheel-tracking test was performed to evaluate the rutting characteristics of OGFC
mixes. Final rut depth after 20,000 passes of wheel are shown in Table 4.13
Fig. 4.13: Rut depth of OGFC mixes by wheel tracking device
Rut depth test results indicated that due to lower compaction temperature of WMA,
the mixtures with WMA-Z showed lowest rutting. PMB-40 reduces rut depth up to
28.92% ,CRMB-55 reduced rutting up to 22.89%, WMA-E reduced rutting up to
31.32% and WMA-Z reduced rutting up to 34.94% as compared to conventional
VG-30. Typical test result of Hamburg Wheel Tracking Device (HWTD) Hamburg
Wheel Tracking Device (HWTD) is shown in Fig. 4.13.
-8.3
-5.9 -6.4
-5.7 -5.4
-10
-9
-8
-7
-6
-5
-4
-3
-2
-1
0
VG-30 PMB-40 CRMB-55 WMA-E WMA-Z
Fin
al
Ru
t D
epth
(m
m)

128
From above results, it is also concluded that rutting test value of OGFC mixes is
more correlated with MR test result value than Dynamic creep test result value. In
Wheel rut depth test and Resilient Modulus test, WMA perform better than modifier
binders while in Dynamic creep test Polymer modifier binder perform better than
Warm Mix Asphalt and CRMB-55, perform better than WMA-Z.
Fig. 4.14 Typical results of rutting test in HWTD (Sample-SMA mix design
with CRMB-55 binder)

129
4.4 TEST RESULT OF SMA MIX DESIGN
SMA design were initially performed with each binder type using compaction effort
of 50-blow of Marshall rammer on each face. SMA mixtures were prepared
according to Marshall method of mix design specified by Asphalt Institute Manual
Series (MS-2). Loose SMA mixture with cellulose fiber were prepared for bitumen
contents 5.0, 5.5, 6.0, 6.5, 7.0 and 7.5 by weight of aggregate for each binder type.
The volumetric properties from trial blends were evaluated as shown in Fig. 4.15
against the volumetric properties.
4.4.1 Volumetric and Marshall Properties of SMA design mixes
The theoretical maximum specific gravity (GMM) of un-compacted loose mixture
(aggregate, filler and fiber) was determined as per procedure of ASTM D 2041.
SMA Marshall specimens were prepared as per specifications of Asphalt Institute
Manual Series (MS-2). After compacting samples, their dimension and weight
measurement were noted to determine the bulk specific gravity (GMB), air void
(Vv),Void in Mineral Aggregate (VMA), Void Filled with Bitumen (VFB), VCA
Ratio (VCAMIX / VCADRC) etc. Results are shown in Table 4.13 to 4.17 for each
binders.
4.4.2 DETERMINATION OF OPTIMUM BINDER CONTENT
The Optimum asphalt content for each binder was determined on the basis of
specifications described in detail in previous chapter and trial mix design results.

130
SMA is a premium mix, require higher quality mix properties in comparison to
conventional BC or DBM mixes, as describe in detail in previous chapter.
As, shown in Table4.13, results of trial mixes of SMA with VG-30 binder. From 5.0
to 6.0 % binder range, SMA mixes were not having sufficient abrasion resistance
both in aged and unaged condition. Also at 5.0 and 5.5 % binder, mix does not have
sufficient Void in Mineral Aggregate (VMA) and also not fulfill the minimum binder
requirement. Marshall stability of the mix also less than minimum specified value i.e.
6.0 KN.
At higher binder content i.e. 7.0 - 7.5 %, SMA mixes have shown higher flow value
and draindown. These results present the need of increasing percentage of some
modifier like cellulose fiber.
At 6.5 % VG-30 binder, SMA mixes shows better results, However the results are on
borderline and flow value of mix is slightly higher (4.2mm) than acceptable flow
value i.e. maximum 4.0 mm.
These results, rises the need of modification of mixes to meet the design standards of
premium quality Stone matrix Asphalt (SMA).
From above results, the Optimum Binder Content (OBC) for SMA mix with VG-30
binder is determined as 6.5 % of total aggregate mass. Results with modified binders
and Warm Mix Asphalt binders are shown in subsequently section.

131
As shown results of trial mixes of SMA with PMB-40 binder in Table 4.14, at 6.0
% binder, SMA mix shown better result and also achieved all defied specification.
Hence 6.0 % PMB-40 of total aggregate weight is taken as Optimum Binder Content
(OBC).
PMB-40, improved mix quality. Marshall stability of mix was increased 29.52 %,
and drain down also decreased approx 25 %. Abrasion resistance of SMA mix also
increases 20.8 % and 13.3% in normal and aged condition respectively.( in
comparison to VG-30)
The results of SMA trial mixes with CRMB-55 are shown in Table 4.15., at 6.5 %
CRMB-55, shown better results and also satisfied all standards of SMA mix design
described earlier. At 6.0 %, CRMB-55 binder have lower higher air void than
specified limit and also shown less stability and VMA value than 6.5 % CRMB-55.
Abrasion resistance of SMA mix also improved with increasing CRMB-55 binder
percent from 6.0 to 6.5.
CRMB-55 improved Marshall Stability approx 7.0% and reduced draindown up to
9.5 % and further increases resistance to abrasion 19.5 % and 10.7% of normal and
conditioned specimen in comparison to VG-30.
As shown in Table 4.16, results of SMA mixes with trial percentage of WMA-E
binder, at 6.0 % WMA-E of total aggregate weight, SMA mixes achieved better
results with all required specifications.

132
WMA-E improved Marshall stability by 16%, improve binder retention in mix by 17
% and also reduces abrasion loss of unaged and aged specimen by 41 % and 32 %
respectively.
Results of SMA mixes with WMA-Z trial percentage, have shown in Table 4.17. At
6.0% WMA-Z binder, mix have better result and within specified standards of SMA
mix.
WMA-Z binder increased Marshall stability by 44%, reduce draindown of binder
up to 21% and decreases abrasion loss up to 31 %and 19 % for normal and
conditioned sample respectively.
As per above results, at Optimum Binder Content (OBC), WMA-Z have shown
highest Marshall stability i.e. 15.2 KN, PMB-40 shown lowest draindown i.e. 0.221
% and WMA-E shown highest abrasion resistance of SMA mix both in unaged and
aged condition in among all five binder type used for this study.

133
Table 4.13: Determination of Optimum Binder Content (OBC) for SMA mix with VG-30 binder
Binder
content
Air
void
VMA
VCAMIX
(%)
VCADRC
(%)
VCA
Ratio
VFB
Marshall
Stability
Flow
value
Drain-
down
Abrasion
loss on
unaged
specimens
Abrasion
loss on
aged
specimens
>
6.0 %
2-4
%
>
17 %
VCAMIX≤VCADRC ≤ 1
70-90
%
> 6.0 KN
3-4
mm
<
0.3 %
< 20 % < 30 %
5.0 4.93 15.40 40.50 43.10 0.94 67.99 5.1 3.1 0.196 35.14 45.2
5.5 4.54 16.80 40.90 43.10 0.95 72.98 5.9 3.5 0.208 30.01 35.01
6.0 3.65 17.40 41.60 43.10 0.97 79.02 8.8 3.8 0.216 23.50 30.25
6.5 3.17 17.60 41.70 43.10 0.97 81.99 10.5 4.2 0.296 18.01 26.08
7.0 2.02 18.40 41.90 43.10 0.97 89.02 7.7 5.8 0.521 15.65 26.31
7.5 1.38 17.30 43.00 43.10 1.00 92.02 4.9 6.2 0.863 25.30 34.54

134
Table 4.14: Determination of Optimum Binder Content (OBC) for SMA mix with PMB-40 binder
Binder
content
Air
void
VMA
VCAMIX
(%)
VCADRC
(%)
VCA
Ratio
VFB
Marshall
Stability
Flow
value
Drain-
down
Abrasion
loss on
unaged
specimens
Abrasion
loss on
aged
specimens
>
6.0 %
2-4
%
>
17 %
VCAMIX≤VCADRC ≤ 1
70-90
%
> 6.0 KN
3-4
mm
<
0.3 %
< 20 % < 30 %
5.0 5.10 15.23 40.19 43.10 0.93 65.86 6.4 2.9 0.172 33.54 41.21
5.5 4.20 16.70 40.49 43.10 0.94 71.50 7.3 3.2 0.198 26.63 34.16
6.0 3.50 19.50 41.19 43.10 0.96 77.27 13.6 3.8 0.221 14.25 22.60
6.5 3.44 20.41 41.24 43.10 0.96 80.23 10.5 4.1 0.278 15.52 25.30
7.0 2.35 17.45 41.44 43.10 0.96 87.26 8.5 4.9 0.432 21.65 29.32
7.5 1.69 15.35 42.54 43.10 0.99 90.26 5.2 5.5 0.513 23.30 36.89

135
Table 4.15: Determination of Optimum Binder Content (OBC) for SMA mix with CRMB-55 binder
Binder
content
Air
void
VMA
VCAMIX
(%)
VCADRC
(%)
VCA
Ratio
VFB
Marshall
Stability
Flow
value
Drain-
down
Abrasion
loss on
unaged
specimens
Abrasion
loss on
aged
specimens
>
6.0 %
2-4
%
>
17 %
VCAMIX≤VCADRC ≤ 1
70-90
%
> 6.0 KN
3-4
mm
<
0.3 %
< 20 % < 30 %
5 5.51 15.30 39.98 43.10 0.93 64.0 5.8 2.5 0.119 30.14 39.21
5.5 5.01 16.70 40.08 43.10 0.93 70.0 6.9 2.9 0.189 24.01 32.10
6 4.31 17.20 40.78 43.10 0.95 75.5 9.6 3.2 0.203 19.05 27.60
6.5 3.74 20.40 40.78 43.10 0.95 78.5 11.2 3.5 0.268 14.50 23.30
7 2.64 18.20 40.98 43.10 0.95 85.5 8.6 4.2 0.412 15.65 19.62
7.5 1.97 17.10 42.08 43.10 0.98 88.5 5.3 5.1 0.523 16.30 20.54

136
Table 4.16: Determination of Optimum Binder Content (OBC) for SMA mix with WMA-E binder
Binder
content
Air
void
VMA
VCAMIX
(%)
VCADRC
(%)
VCA
Ratio
VFB
Marshall
Stability
Flow
value
Drain-
down
Abrasion
loss on
unaged
specimens
Abrasion
loss on
aged
specimens
>
6.0 %
2-4
%
>
17 %
VCAMIX≤VCADRC ≤ 1
70-90
%
> 6.0 KN
3-4
mm
<
0.3 %
< 20 % < 30 %
5.0 5.11 15.25 40.29 43.10 0.93 66.5 8.1 3.4 0.106 25.40 34.20
5.5 4.09 16.70 40.63 43.10 0.94 71.9 10.3 3.6 0.178 19.21 28.00
6.0 3.52 17.20 41.33 43.10 0.96 77.8 12.5 4.0 0.246 10.56 19.21
6.5 3.00 17.40 41.39 43.10 0.96 80.7 10.5 4.5 0.278 10.89 21.03
7.0 2.24 18.37 41.59 43.10 0.97 87.8 8.7 5.8 0.421 13.65 22.31
7.5 1.59 17.27 42.69 43.10 0.99 90.8 7.0 5.6 0.469 28.30 35.54
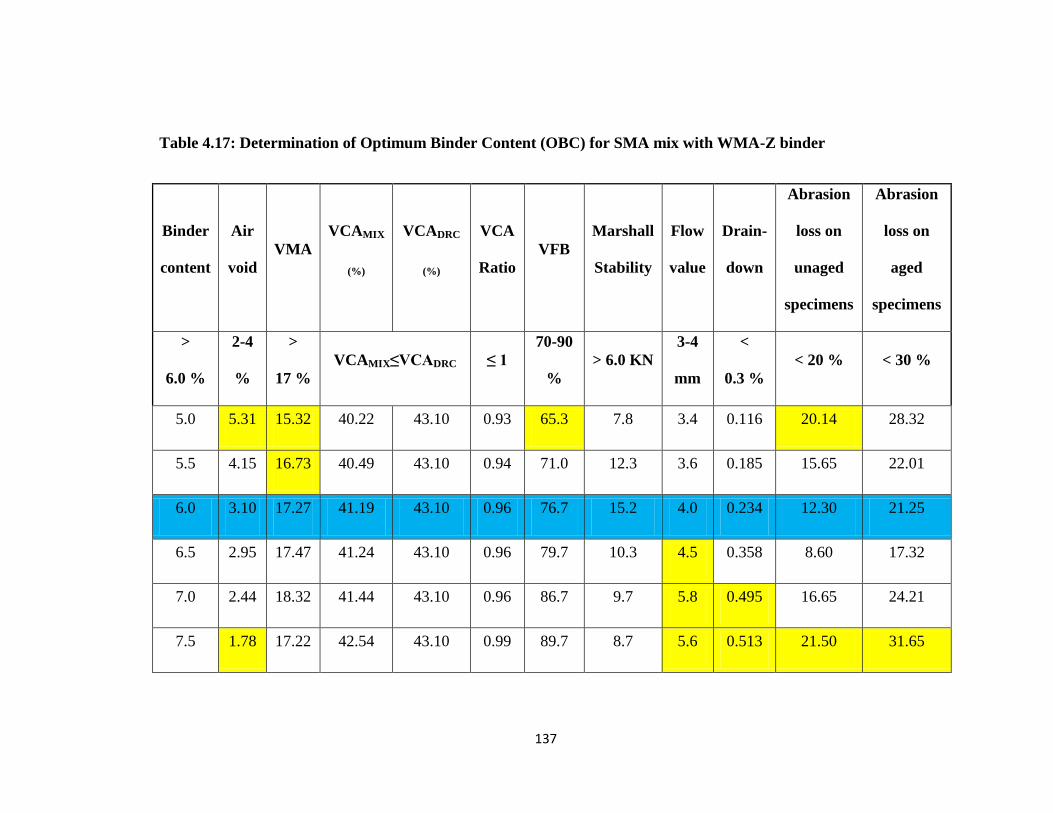
137
Table 4.17: Determination of Optimum Binder Content (OBC) for SMA mix with WMA-Z binder
Binder
content
Air
void
VMA
VCAMIX
(%)
VCADRC
(%)
VCA
Ratio
VFB
Marshall
Stability
Flow
value
Drain-
down
Abrasion
loss on
unaged
specimens
Abrasion
loss on
aged
specimens
>
6.0 %
2-4
%
>
17 %
VCAMIX≤VCADRC ≤ 1
70-90
%
> 6.0 KN
3-4
mm
<
0.3 %
< 20 % < 30 %
5.0 5.31 15.32 40.22 43.10 0.93 65.3 7.8 3.4 0.116 20.14 28.32
5.5 4.15 16.73 40.49 43.10 0.94 71.0 12.3 3.6 0.185 15.65 22.01
6.0 3.10 17.27 41.19 43.10 0.96 76.7 15.2 4.0 0.234 12.30 21.25
6.5 2.95 17.47 41.24 43.10 0.96 79.7 10.3 4.5 0.358 8.60 17.32
7.0 2.44 18.32 41.44 43.10 0.96 86.7 9.7 5.8 0.495 16.65 24.21
7.5 1.78 17.22 42.54 43.10 0.99 89.7 8.7 5.6 0.513 21.50 31.65

138
4.4.3 TEST PROPERTIES OF THE MIXES AT OPTIMUM BINDER CONTENT
(OBC)
SMA mix properties at Optimum Binder Content (OBC) with all binder type used in
this study, are shown in Table 4.18. Modified binder and Warm Mix Asphalt improved
mix properties and also reduced optimum binder content. Optimum Binder Content
value for PMB-40, CRMB-55, WMA-E and WMA-Z binder was decided as 6.5 %, 6.0
%, 6.5%, 6.0% and 6.0% respectively on the basis of results and specification of mix
design. PMB-40, CRMB-55, WMA-E and WMA-Z reduces draindown of binder from
mix up to 25 %, 10%, 17% and 21% respectively in comparison to VG-30. Marshall
stability of SMA mix at OBC was increased 29%, 7%, 17% and 45 % with the use of
PMB-40, CRMB-55, WMA-E and WMA-Z respectively in comparison to VG-30.
Retained stability of SMA mixes was increased 13.6%, 7.4%, 13.6% and 14.8 %
respectively in comparison to VG-30.
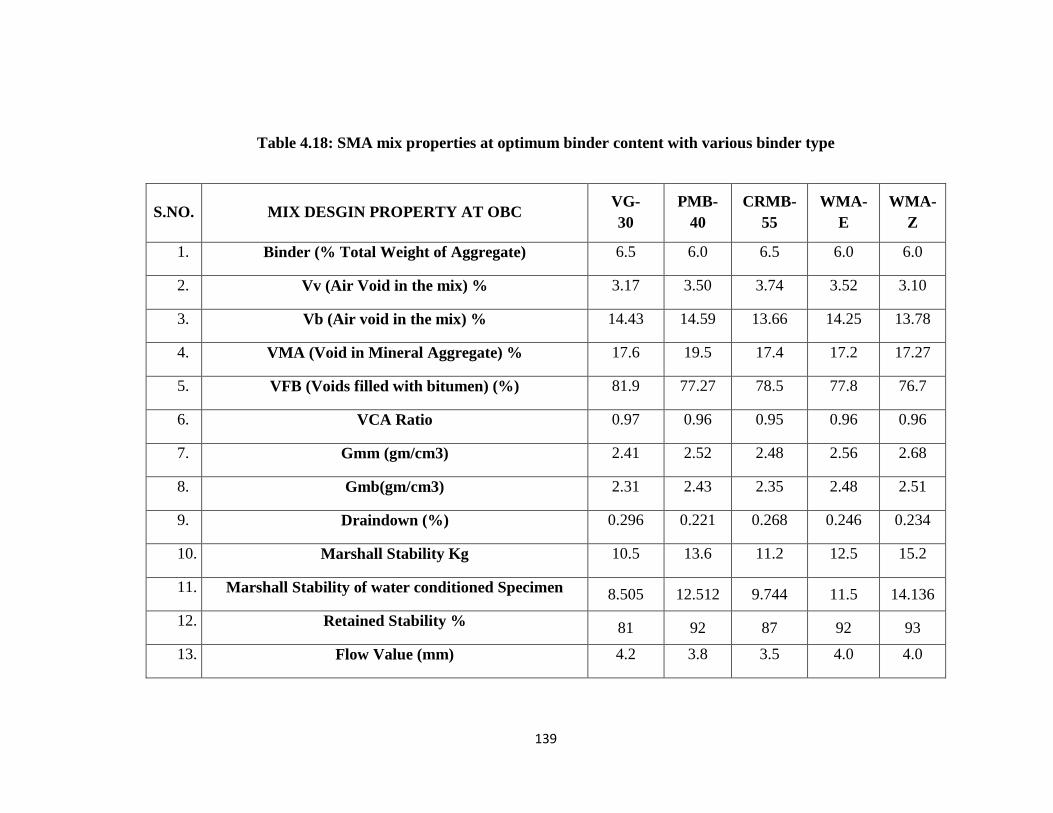
139
Table 4.18: SMA mix properties at optimum binder content with various binder type
S.NO. MIX DESGIN PROPERTY AT OBC VG-
30
PMB-
40
CRMB-
55
WMA-
E
WMA-
Z
1. Binder (% Total Weight of Aggregate) 6.5 6.0 6.5 6.0 6.0
2. Vv (Air Void in the mix) % 3.17 3.50 3.74 3.52 3.10
3. Vb (Air void in the mix) % 14.43 14.59 13.66 14.25 13.78
4. VMA (Void in Mineral Aggregate) % 17.6 19.5 17.4 17.2 17.27
5. VFB (Voids filled with bitumen) (%) 81.9 77.27 78.5 77.8 76.7
6. VCA Ratio 0.97 0.96 0.95 0.96 0.96
7. Gmm (gm/cm3) 2.41 2.52 2.48 2.56 2.68
8. Gmb(gm/cm3) 2.31 2.43 2.35 2.48 2.51
9. Draindown (%) 0.296 0.221 0.268 0.246 0.234
10. Marshall Stability Kg 10.5 13.6 11.2 12.5 15.2
11. Marshall Stability of water conditioned Specimen 8.505 12.512 9.744 11.5 14.136
12. Retained Stability % 81 92 87 92 93
13. Flow Value (mm) 4.2 3.8 3.5 4.0 4.0

140
4.5 INVESTIGATING THE PERFORMANCE AND DURABILITY OF SMA
MIXES
The performance and durability of SMA mixes were investigated through
laboratory tests. At optimum binder content, additional specimens were prepared and
following investigations were carried out to assess the performance and durability of
bituminous mixes.
1) Indirect Tensile Strength (ITS)
2) Tensile Strength Ratio (TSR)
3) Resilient Modulus (MR)
4) Dynamic Creep Test
5) Rut Depth by HWTD Wheel Tracking Device
The method and parameters used to perform the above stated tests has been
already described in Section 3.6

141
4.5.1 Indirect tensile strength test result
For evaluating stiffness of the SMA pavement, Indirect tensile test was performed
both in normal and wet condition and test results are shown in Table 4.19.
Table 4.19: ITS test results of SMA mixes with various binders
SMA design mix type Dry ITS
(Mpa)
Wet ITS
(Mpa)
VG-30 0.73 0.64
PMB-40 1.13 1.06
CRMB-55 0.95 0.84
WMA-E 1.23 1.12
WMA-Z 1.29 1.19
Fig. 4.15 shows both normal and conditioned ITS values for each SMA mix. WMA-Z
shows highest ITS values both for conditioned and unconditioned specimen. Warm
Mix Asphalt technology improved results even at lower compaction temperatures and
so reduces the chance of moisture damage due to lower temperature during
compaction. With WMA-Z and WMA-E binders, SMA mixes shown better stiffness
than dense graded mixes.

142
Fig.4.15 : Test results of Indirect Tensile Strength Test of SMA mixes
The increase in normal ITS values with PMB, CRMB, WMA-E and WMA-Z
mix were found to be 1.54, 1.30, 1.68 and 1.76 times respectively to that of the
conventional asphalt mix. Improvement in conditioned ITS values with PMB, CRMB,
WMA-E and WMA-Z mixes was found to be 1.65, 1.31, 1.75 and 1.85 times
respectively to that of conventional asphalt mix.
Modified binder and Warm Mix Asphalt improve the tensile strength property of
SMA mixes. This may be due to improved adhesion quality of the mixtures with these
binders.
Tensile failure of conditioned SMA specimen during ITS test is shown in Fig 4.17
0
0.2
0.4
0.6
0.8
1
1.2
1.4
VG-30 PMB-40 CRMB-55 WMA-E WMA-Z
Indir
ect
Ten
sile
Str
ength
in M
pa
DRY ITS
WET ITS

143
4.5.2 Tensile Strength Ratio (TSR) Test Results
The test results of Tensile Strength Ratio (TSR) Test performed on SMA mixes are
shown in Table 4.20. the VG-30 mix showed the highest water damage, while the
PMB-40 mix had the lowest water damage.
Table 4.20: TSR values of SMA mixes with various binders
SMA design mix type TSR %
VG-30 87.67
PMB-40 93.81
CRMB-55 88.42
WMA-E 91.06
WMA-Z 92.25
As shown in Fig.4.16, the VG-30 mix showed the lowest TSR value, while the
PMB-40 mix had the lowest water damage. Percentage increase in tensile strength for
mixtures with PMB-40, CRMB-55, WMA-E and WMA-Z were found to be
approximately 7.0% , 0.85 %, 3.86 % and 5.22 % respectively to that of conventional
asphalt mix.

144
Fig.4.16 : Test results of Tensile Strength Ratio of various SMA mixes
SMA mixes with all binders used in this study, have shown Tensile Strength Ratio
more than 85%, as specified minimum value by MORTH, 2013.
Fig. 4.17: Tensile Failure of Conditioned Specimen during ITS test
70.00
80.00
90.00
100.00
VG-30 PMB-40 CRMB-55 WMA-E WMA-Z
Ten
sile
Str
ength
Rat
io (
%)
TSR

145
4.5.3 Resilient Modulus (Mr)
Table 4.21 shows Mr value for various SMA mixes respectively at most prevailing
temperatures i.e. 25°C, 35°C and 45°C temperature.
Table 4.21: Resilient Modulus values of SMA mixes with different binder types.
SMA design mix type
Resilient Modulus (MPa)
25°C 35°C 45°C
VG-30 5167 1923 1008
PMB-40 7034 4738 1103
CRMB-55 5943 2859 1087
WMA-E 7232 4957 1998
WMA-Z 9834 4361 1738
As shown in Fig. 4.18, WMA technology and modified binder improved resilient
modulus qualities of the mix. WMA-E mix shows lowest drop in resilient modulus
and highest Mr values at higher temperature (35°C and 45°C) . WMA-Z mix showed
highest resilient modulus at 25°C . PMB-40 and CRMB-55, improves mix quality at
25°C and 35°C. However at higher temperature (45°C), modified binders mix shows
no significant improvement.

146
Fig. 4.18 : Resilient modulus Test Results of SMA mixes with various binder type
0
2000
4000
6000
8000
10000
VG-30 PMB-40 CRMB-55 WMA-E WMA-Z
Mr
in M
pa
25°C 35°C 45°C

147
4.5.4 Dynamic Creep Test Results
Dynamic creep test results on SMA mixes in terms of percentage cumulative strain are
presented in Table 4.22
Table 4.22: Cumulative Strain of SMA mixes with all binder types
Type of binder mix Cumulative Strain %
VG-30 44.2
PMB-40 22.6
CRMB-55 34.0
WMA-E 11.2
WMA-Z 24.1
Fig.4.19 shows the permanent deformation plotted against the number of passes for
all types of binders.
Decrease in the value of cumulative strain reflects improvement in resistance against
permanent deformation and vice-versa. Reduction in air void content of the mix with
no. of load cycles, causes permanent deformation in the SMA mixes.

148
Fig.4.19: Cumulative Strain Vs No. of load Cycle Curve of creep test for various
SMA mixes.
As shown in above figure, that VG-30 have steepest slope in all the SMA mixes.
Although, CRMB-55 lowered cumulative strain in the mix as compared to VG-30,
however shown steeper slope initially. This may be due to higher air void in SMA mix
with CRMB-55. And adhesion improvement quality of CRMB-55 binder may also be
lesser as compare to polymer modified and WMA binders.
0
0.1
0.2
0.3
0.4
0.5
1
101
301
501
701
901
1201
1401
1601
1801
2001
2201
2401
2601
2801
3001
3201
3401
3600
Tota
l per
man
ent
stra
in (
%)
No. of Load cycle
VG-30 PMB-40 CRMB-55 WMA-E WMA-Z

149
In SMA mixes, WMA-E reduces permanent deformation up to 73%, PMB-40 reduces
permanent deformation up to 48%, WMA-Z reduces permanent deformation by 45%
and CRMB-55 reduces permanent deformation up to 23% respectively.
4.5.5 Wheel Tracking Test
A wheel-tracking test was performed to evaluate the rutting characteristics of SMA
mixes. Final rut depth after 20,000 passes at 40°C of wheel are shown in Fig. 4.20
Fig. 4.20: Rut depth of SMA mixes by wheel tracking device
In SMA mixtures, Rut depth test results indicated that due to the stiffening effect of
the modified binder the mixtures with PMB-40 showed lowest rutting. PMB-40
reduces rut depth up to 41.27% ,CRMB-55 reduced rutting up to 22.22%, WMA-E
-6.3
-3.7
-4.9
-4 -3.9
-10
-9
-8
-7
-6
-5
-4
-3
-2
-1
0
VG-30 PMB-40 CRMB-55 WMA-E WMA-Z
Fin
al R
ut
Dep
th (
mm
)
150
reduced rutting up to 36.50% and WMA-Z reduced rutting up to 38.09% as compared
to conventional VG-30.
Mogawer and Stuart (1995) suggested maximum allowable rut depths by Hamburg
wheel tracking device of 4 mm at 10,000 passes and 10 mm at 20,000 passes for
design of SMA mixture with desire rutting resistance and durability potential. Rut
depth after HWTD rutting test was within limit for all the SMA binder nixes.
4.6 Comparison of OGFC and SMA test performance
OGFC mix is designed for a open gradation type pavement serving main purpose of
immediate removal of water from pavement surface, for better skid resistance property
and improve visibility, consequently which serve the purpose of reduce rain water
evaporation and runoff, also make possible infiltration of rain water through pavement
surface or storage of rain water in the temporary reservoir, under the pavement
surface.
Porous pavement also controls splash and spray and hydroplaning problems, thus
reduces accident causes. In a properly designed and constructed porous pavement,
there is almost no stagnant water. Which also controls the Moisture susceptibility,
potholes and stripping problems very effectively.
Whereas, a SMA mix is design for a more durable and rut resistance pavement,
providing smother pavement service. SMA mix is gap graded structure provided
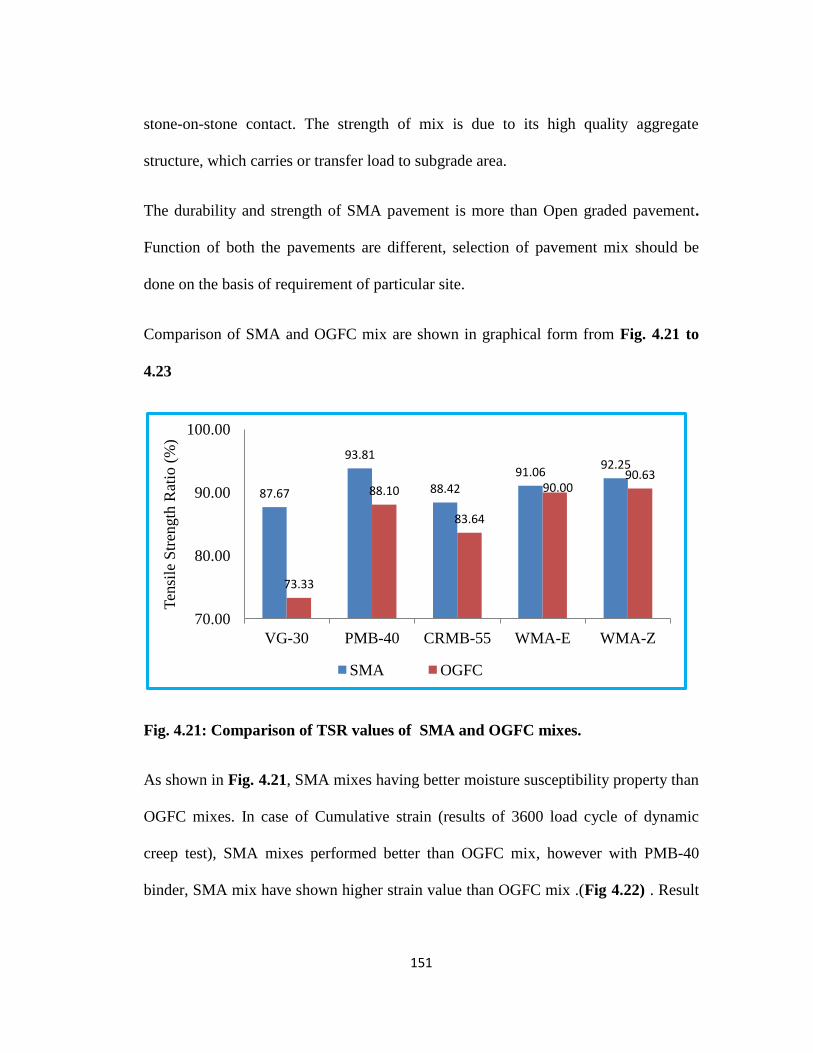
151
stone-on-stone contact. The strength of mix is due to its high quality aggregate
structure, which carries or transfer load to subgrade area.
The durability and strength of SMA pavement is more than Open graded pavement.
Function of both the pavements are different, selection of pavement mix should be
done on the basis of requirement of particular site.
Comparison of SMA and OGFC mix are shown in graphical form from Fig. 4.21 to
4.23
Fig. 4.21: Comparison of TSR values of SMA and OGFC mixes.
As shown in Fig. 4.21, SMA mixes having better moisture susceptibility property than
OGFC mixes. In case of Cumulative strain (results of 3600 load cycle of dynamic
creep test), SMA mixes performed better than OGFC mix, however with PMB-40
binder, SMA mix have shown higher strain value than OGFC mix .(Fig 4.22) . Result
87.67
93.81
88.42
91.06 92.25
73.33
88.10
83.64
90.00 90.63
70.00
80.00
90.00
100.00
VG-30 PMB-40 CRMB-55 WMA-E WMA-Z
Ten
sile
Str
ength
Rat
io (
%)
SMA OGFC

152
of HWTD rut depth test results for SMA and OGFC mixes are shown in Fig. 4.23.
SMA mixes with VG-30, PMB-40, CRMB-55, WMA-E, WMA-Z binder shows 32 %,
60 %, 31%, 42% and 39 % less rut depth respectively in comparison to OGFC mixes
with respective binders.
Fig. 4.22: Comparison of cumulative strain in SMA and OGFC mixes.
Fig. 4.23: Comparison of Rut Depth test results of SMA and OGFC mixes.
44.2
22.6
34
11.2
24.1
51.3
18.2
36.7
25.6
44.3
0
10
20
30
40
50
60
VG-30 PMB-40 CRMB-55 WMA-E WMA-Z
Cum
ula
tive
Str
ain
%
SMA mix OGFC mix
-6.3
-3.7
-4.9
-4 -3.9
-8.3
-5.9 -6.4
-5.7 -5.4
-9
-8
-7
-6
-5
-4
-3
-2
-1
0
VG-30 PMB-40 CRMB-55 WMA-E WMA-Z
Fin
al R
ut
Dep
th (
mm
)
SMA mix OGFC mix

153
CHAPTER 5
CONCLUSIONS AND RECOMMENDATIONS
============================================================
5.1 CONCLUSIONS
This study evaluated the laboratory results of using modified binder and warm mix
asphalt in OGFC and SMA mixes in comparison to plain bitumen. The following
conclusions were drawn -
1. As per ITS test results, the performance of the mixes and strength of the
pavement surface to distribute traffic pressure improved with modified binder
and warm mix asphalt as compare to conventional asphalt (VG-30).
2. As per TSR test result, moisture susceptibility property of the OGFC and SMA
mixtures improved with warm mix asphalt and modified binder due to
chemical modification of the plain bitumen as adhesion promoter with lower
binder absorption capacity.
3. Elastic property of OGFC and SMA mixes decreased with increase in test
temperatures for all types of mixtures. WMA had shown increased Resilient
Modulus of the mixes, at all the three temperature parameters than modified
and plain bitumen.

154
4. As per dynamic creep test result, modified binder and WMA reduces the rate
of plastic deformation, this might be possibly due to difference in internal
structure evolution with number of load cycle (passes).
5. Modified binder and WMA showed better resistance to permanent deformation
than conventional asphalt binder.
6. In case of PMB-40 and CRMB-55, reason behind reduced rut depth is the
characteristic of the stiffening effect of the binder owing to the addition of
specially blended polymer and crumb rubber fiber, making the binder
homogenous and storage stable.
7. In case of WMA increased rutting resistance is due to reduced mixing and
compaction temperatures which decreases aging of binder and so increased
resistance of the mixes.
8. In SMA mixtures, PMB-40 and WMA-Z shown better result than WMA-E
and CRMB-55. In case of OGFC mixture PMB-40 and WMA-E shown better
result than WMA-Z and CRMB-55. VG-30 produce lowest quality of OGFC
and SMA mixture in comparison to modified and WMA binder. CRMB-55
shown less improves results than PMB-40 and WMA binder in both the mixes.
9. Modified binder and Warm mix Asphalt also improved Marshall property
(Stability and Retain Stability) of both SMA and OGFC mixes in comparison
to VG-30.

155
10. As per Draindown test result of SMA and OGFC mixes at OBC, modified
binder and warm mix asphalt technology, reduces draindown of binder in
comparison to conventional asphalt.
11. In all above mentioned performance test, SMA mixtures shown better result
than OGFC mixture.
156
RECOMMENDATIONS
Laboratory test results conducted in this study have proved that modified binders and
Warm Mix Asphalt have potential to be used in SMA and OGFC mixes for Indian
pavement condition. It is recommended that the findings of this research may be
evaluated using further advance testing on the bituminous mixtures such as dynamic
modulus test and fatigue test to develop a more detailed understanding about
performance and durability of OGFC and SMA pavement. Specification should be
finalized for OGFC mixes by Indian Road Congress.
The study should be extended for different gradation and binder range for
OGFC and SMA mixes.
OGFC pavement should also further consider for potential for stripping of the
surface and underlying pavement (they do not seal the underlying pavement
against moisture intrusion) and permeability test
A trial stretch of OGFC pavement should be laid and various field test should
be performed specially in rainy and winter season, and correlation between
field and test result should be developed.
157
REFERENCES
1. AASHTO (2002). Resistance of compacted asphalt Mixture to Moisture
Induced damage. T 283, American Association of Highway and Transportation
Officials.
2. Alvarez A. E., Martin A. E., Estakhri, C. K. Button, J. W. Kraus, Z.
Prapaitrakul N. and Glover C. J. (2008). Evaluation and Recommended
Improvements for Mix Design of Permeable Friction Courses. Texas
Department of Transportation. FHWA/TX-08/0-5262-3.
3. Alvarez A. E., Martin A. E., Estakhri C. K. Button, J. W. Kraus, Glover C. J.,
and Jung S. H. (2006). Synthesis of Current Practice on the Design,
Construction, and Maintenance of Porous Friction Courses. Texas Department
of Transportation. FHWA/TX-06/0-5262-1.
4. Amirkhanian B. J. (2006). Crumb Rubber Modification of Binders: Interaction
and Particle Effects. South Carolina: Clemson University. Road Materials and
Pavement Design. Vol. X .
5. ASTM C131 Method (2014). Standard Test Method for Resistance to
Degradation of Small-Size Coarse Aggregate by Abrasion and Impact in the
Los Angeles Machine.

158
6. ASTM C535 Method (2016). Standard Test Method for Resistance to
Degradation of Large-Size Coarse Aggregate by Abrasion and Impact in the
Los Angeles Machine.
7. ASTM D 1559 (1989). Test Method for Resistance of Plastic Flow of
Bituminous Mixtures Using Marshall Apparatus.
8. ASTM D 4123- 82 (1995). Standard Test Method for Indirect Tension Test for
Resilient Modulus of Bituminous Mixtures.
9. ASTM D 6931 (2007). Indirect Tensile (IDT) Strength for Bituminous
Mixtures.
10. ASTM D 7064 (2011). Standard Practice for Open-Graded Friction Course
(OGFC) Mix Design.
11. Australian Asphalt Pavement Association (2004). National Asphalt
Specification, Australia, Transportation Research Circular Number E-C005,
TRB,22.
12. Bose S., Kamaraj C. and Nanda P.K. (2006). Stone Mastic Asphalt (SMA) - A
Long Life Pavement Surface. International Seminar on Innovations in
Construction and Maintenance of Flexible Pavements, Agra, Technical Papers,
Vol. 1, pp 169-17.
13. Brown E.R. (1992). Evaluation of SMA Used In Michigan NCAT Publication,
Auburn University, AL.
159
14. Brown E.R. and Hemant M. (1993). Evaluation of laboratory properties of
SMA mixture, National Center for Asphalt Technology, Auburn University.
NCATR Report. 93-5.
15. Brown E. R. and Cooley L.A. (1999). Designing Stone Matrix Asphalt
Mixtures for Rut-Resistant Pavement. NCHRP Report 425.
16. Brown E.R. and Mallick R.B. (1994). Stone Matrix Asphalt Properties Related
to Mixture Design National Center for Asphalt Technology, Auburn
University. Report No. 94-2, AL 36849-5354.
17. Brown E. R. and Mallick R. B. (1995). Evaluation of Stone-on-Stone Contact
in Stone-Matrix Asphalt. Transportation Research Record 1492, TRB, National
Research Council, Washington, D.C. pp. 208-219
18. Brown E.R., Mallick R.B., John E, Haddock and Bukowski John (1997a)
Performance of Stone Matrix Asphalt (SMA) Mixtures in the United States.
Proceedings of the Association of Asphalt Paving Technologists. NCAT
Report 97-01. Volume 66.
19. Brown E.R., Mallick R.B., John E., Haddock and Todd A. Lynn (1997b),
Development of A Mixture Design Procedure For Stone Matrix Asphalt
(SMA). NCAT Report 97-01
20. Brown E.R., John E. and Haddock. (1995). A Method To Ensure Stone-On-
Stone Contact in Stone Matrix Asphalt Paving Mixtures. NCAT Report 97-02.

160
21. Bujang B.K. Huat. (2006). Laboratory Diameteral Fatigue Performance of
Stone Matrix Asphalt with Cellulose Oil Palm Fiber Ratnasamy Muniandy.
American Journal of Applied Sciences .
22. Bukowski J. (1991). Stone Mastic Asphalt Test and Evaluation Project No. 18.
Office of Technology Applications, FHWA.
23. B V Kiran Kumar, Manjunatha S, Shiva Prasad N. (2014). Porous Asphalt
Pavement -A Tentative Mix Design Guidelines. New Generation Open Graded
Friction Course Approach, International Journal of Engineering Science
Invention Research & Development. Vol. I Issue III, ISSN: 2349-6185.
24. B.W. Tsai, J. T. Harvey, and C. L. Monismith. ( 2012). Evaluation of Open-
Graded Friction Course (OGFC) Mix Design: Summary Version, UCPRC-SR-
2013-02, University of California Pavement Research Center.
25. Cervarich M.B. (2003). Cooling Down the Mix: NAPA Explores New "Warm
Mix Asphalt" Technologies Developed in Europe.
http://www.warmmixasphalt.com/
26. Chui-Te Chiu and Li-Cheng Lu (2007). A Laboratory study on Stone Matrix
Asphalt using Ground Tire Rubber. Construction and Building Materials,
Volume 21, Issue 5, pp 1027-1033.
27. Clifford R, Dillon S, Walsh G and Jamieson I. (1996). Design and performance
of porous asphalt mixes in Ireland. Euroasphalt and Eurobitume Congress,
Strasbourg .

161
28. Cooley Jr., L.A., E. R. Brown and D. E. Watson. (2000). Evaluation of OGFC
mixtures containing cellulose fibers. NCAT Report NO.05.
29. CooleyJr., L.A. and E.R. Brown (April 1999). Evaluation of OGFC Pavements
Containing Cellulose Fibers. National Center for Asphalt Technology.
30. Colwill D.M., Bowskill G.J., Nicholls J.D. and Daines M.E.. et al. (1993).
Porous Asphalt Trials in the United Kingdom. Transportation Research Board,
National Research Council, Washington, D.C. TRR 1427.pp13-21
31. C. Kamaraj, P. K. Jain, B.M. Sharma and S. Gangopadhyay (2013). Design,
Construction And Performance Of Stone Matrix Asphalt (SMA) - Field Test
Section. Highway Research Journal. Volume 6 No. 1, pp 12-25.
32. C. Kamaraj, P.K.Jain, V.K.Sood and P.K.Sikdar. (2006). Design of Stone
Matrix Asphalt Using Different Stabilizing Additives. Journal of Indian Roads
Congress, Vol-67(1).
33. C.S Bindu and Beena K.S (2010). Waste Plastic as a Stabilizing additive in
SMA. International Journal of Engineering and Technology. Vol.2, Issue 6. pp
379-387.
34. CT 368 (2003). California Test. Standard Method for Determining Optimum
Bitumen Content (OBC) for Open Graded Asphalt Concrete
35. Davis, Richard L (1988). Large Stone Mixes: A Historical Insight, National
Asphalt Pavement Association Report . IS 103/88.
36. Davidson J.K. and Kennepohl. G.J. (1992). Introduction of Stone Mastic
Asphalt in Ontario. Report for AAPT Meeting in Charleston, SC.
162
37. Decoene 1990. Contribution of Cellulose Fibers to the performance of porous
asphalts. Transportation Research Record. TRB 1265. National Council,
Washington D. C. pp 82-83.
38. Doh, Young S., Kim, Jin C., Ryu, Min Y., Kim and Kwang. W. (2010).
Evaluation of Selected Warm-Mix Additives for Asphalt Recycling.
Transportation Research Board 89th Annual Meeting (No. 10-1063).
39. Federal Highway Administration (1974). Design of Open Graded Asphalt
Friction Courses. FHWA-RD-74-2.
40. Federal Highway Administration.(1990). Technical Advisory T 5040.30 Open
Graded Asphalt Friction Courses.
41. Federal Highway Administration (2016). Warm Mix Asphalt Technologies and
Research. http://www.fhwa.dot.gov/pavement/asphalt/wma.cfm
42. Freddy L. Roberts, P. K. (1989). Investigation and Evaluation of Ground Tire
Rubber in Hot Mix Asphalt. Auburn, AL: National Center for Asphalt
Technology.
43. Florida Department of Transportation. (1999). Florida Method of Test for
Measurement of Water Permeability of Compacted Asphalt Paving Mixtures.
FM 5-565.
44. Hagos E. T, Molenaar, A, Ven, MFC van de & Voskuilen, JLM (2007).
Durability Related Investigation into Porous Asphalt. Advanced
Characterisation of Pavement and Soil Engineering Materials, Loizos, Scarpas
& Al-Qadi (eds), Taylor & Francis Group, London. pp. 713-727.

163
45. Heitzman M. (1992). Design and Construction of Asphalt Paving Materials
with Crumb Rubber Modifier. TRR 1339. Washington, DC: Federal Highway
Administration.
46. Hossam F. Hassan, Salim Al-Oraimi, and Ramzi Taha. (2005). Evaluation of
Open-Graded Friction Course Mixtures Containing Cellulose Fibers and
Styrene Butadiene Rubber Polymer. Journal of Materials in Civil Engineering.
American Society of Civil Engineers. pp416-422.
47. Huddleston IJ., H. Thou, and R.G. Hicks (1993). Evaluation of Open-Graded
Asphalt Concrete Mixtures Used in Oregon. TRR 1427, Transportation
Research Board.
48. Hurley G.C. (2006). Evaluation of New Technologies for Use in Warm Mix
Asphalt. Master’s Thesis, Auburn University, Auburn, AL.
49. Hurley G.C. and Prowell B.D. (2005a). Evaluation of Aspha-Min zeolite for
use in warm mix asphalt”, NCAT Report 05-04.
50. Hurley G.C. and Prowell B.D (2005b). Evaluation of Sasobit for use in warm
mix asphalt. NCAT Report 05-06.
51. Hurley G.C. and Prowell B.D (2006). Evaluation of Potential Processes for
Use in Warm Asphalt Mixes,” Journal of the Association of Asphalt Paving
Technologists, Vol. 75, 41-85, .
52. Hurley G.C. and Prowell B.D (2006). Field performance of warm mix
asphalt”, Transportation Research Board (TRB), 87th Annual Meeting
Compendium of Papers DVD, Washington, D.C.

164
53. Ibrahim M. Asi (2005). Laboratory Comparison Study for the Use of Stone
Matrix Asphalt in Hot Weather Climates. Construction and Building Materials,
Volume 20, Issue 10, pp 982-989.
54. IRC: SP: 53. (2002). Guidelines on Use of Polymer and Rubber Modified
Bitumen in Road Construction. Indian Roads Congress .
55. IRC: SP: 079 (2008). Tentative Specification for Stone Matrix Asphalt. Indian
Roads Congress .
56. IS: 1203 (1978). Methods for Testing Tar and Bituminous Materials:
Determination of Penetration. Bureau of Indian Standards, New Delhi.
57. IS: 1205 (1978). Methods for Testing Tar and Bituminous Materials:
Determination of Softening Point. Bureau ofIndian Standards, New Delhi.
58. IS: 2386 (1963). Methods of Test for Aggregates for Concrete (P-I) : Particle
Size and Shape. Bureau of Indian Standards, New Delhi.
59. IS: 2386 (1963). Methods of Test for Aggregates for Concrete (P-III): Specific
Gravity,Density, Voids, Absorption, Bulking”, Bureau of Indian Standards,
New Delhi.
60. IS: 2386 (1963). Methods of Test for Aggregates for Concrete (P-IV):
Mechanical Properties. Bureau of Indian Standards, New Delhi .
61. IS: 15462 (2004). Bureau of Indian Standards, Indian Standard. Polymer and
Rubber Modified Bitumen, Specifications.
62. J. Richard Willis, Clayton Plemons and Tyler Mitch ( 2013). Effect of Ground
Tire Rubber Particles on Open-Graded Mixture Performance. NCAT Report.

165
63. Jenkins K.J., J.L.A. de Groot, M.F.C. van de Ven and A. Molenaar (1999).
Half-warm foamed bitumen treatment, a new process. 7th Conference on
Asphalt Pavements for South Africa, CAPSA 99. Victoria Falls.
64. Jimenez F.E.P and. Perez M.A.C (1990). Analysis and Evolution of the
Performance of Porous Asphalt: The Spanish Experience Surface
Characteristic of Roadways, International Research and Technology, ASTM
STP 1031, W.E. Meyer and J. Reichert, Eds., Philadelphia, PP: 512-527
65. Kamraj C., Kumar G., Sharma G., Jain P.K. and Venkanna Babu P. (2004).
Laboratory Studies on the Behavior of Stone Matrix Asphalt vis-a-vis Dense
Graded Bituminous Mixes using Natural Rubber Powder (Wet Process).
Highway Research Bulletin, No 71, IRC, New Delhi, pp39-60.
66. Kandhal P.S.(1985). Marshall Mix Design Methods: Current Practices,
Proceedings. Association of Asphalt Paving Technologists. Vol. 54.
67. Kandhal P.S (1989). Testing And Evaluation of Large Stone Mixes Using
Marshall Mix Design Procedure. NCAT Report 89-04.
68. Kandhal P.S. (2004). Large Stone Asphalt Mixes Design And Construction.
NCAT Report 90-04.
69. Kandhal P.S. and Mallick R.B. (1998). Open-Graded Friction Course: State of
the Practice. Transportation Research Circular Number E-C005, TRB.
70. Kandhal P.S and Mallick R.B. (1999). Design of New-Generation Open -
Graded Friction Course, NCAT Report 99-03.

166
71. Kandhal P.S, Stephen A. Cross and E. Ray Brown. (1990). Evaluation Of
Bituminous Pavements for High Pressure Truck Tires, National Center for
Asphalt Technology. FHWA Report NO. FHWA-PA-90-O08 +87-01
72. Kheiry Pezhouhan Tavassoti, Mansour Solaimanian, and Tong Qiu (2014).
Nondestructive Evaluation of Warm Mix Asphalt through Resonant Column
Testing. US Department of Transportation Research & Innovative Technology.
73. Krutz N. C. and Stroup - Gardiner M. (1992). Permanent Deformation
Characteristics of Recycled Tire Rubber-Modified and Unmodified Asphalt
Concrete Mixtures. Transportation Research Record No. 1339
74. Kristjansdottir O., Muench S.T., Michael L and Burke G. (2007). Assessing
the potential for Warm Mix Technology Adoption. Transportation Research
Record: Journal of the Transportation Research Board, No. 2040, Washington
DC.
75. Kumar Pawan, Chandra Satish and Bose Sunil (2007). Laboratory
Investigations on SMA mixes with Different Additives. International Journal
of Pavement Engineering. Vol. 8, Issue1. pp 11-18.
76. Mahrez A. (2008). Properties and performance of stone mastic asphalt
reinforced with glass fibre. Kuala Lumpur, Malaysia: Faculty of Engineering,
University of Malaya.
77. Mahrez A, Karim MR, Katman HY (2005). Fatigue and deformation properties
of glass fiber reinforced bituminous mixes. Eastern Asia, Soc. Trans. Stud. pp
997-1007.

167
78. Mahsaan N.S., Mohamed R.K., Mahrej A.A., Ibrahim M.R., Katma H.Y. and
S. Koting. (2014). Evaluation of Fatigue Life of CRM-Reinforced SMA and its
Relationship to Dyanamic Stiffness. The Scientific World Journal.
79. Mansour and Talat Naji, (2011). Investigation of The Effect of Aggregate
Gradation on Open Graded Friction Course Mixtures.
80. Mallick R. B., Kandall P. S, L. A. Cooley Jr. and D. E. Watson. (2000) Design,
Construction, And Performance of New-generation Open-Graded Friction
Courses. NCAT Report NO.2000-01.
81. Marek Iwanski, Anna Chomicz-Kowalska and Justyna Mrugała. (2014).
Application of the synthetic wax to improve the foamed bitumen parameters
used in half-warm bituminous mixtures. International Conference on
Environmental Engineering.
82. Marvin Myhre and Duncan A. (2002). Rubber Recycling Rubber Chemistry
and Technology. Canadian Rubber Testing & development. Vol 75, pp 429-
474.
83. Mashaan NS, Ali AH, Koting S and Karim MR. (2013). Performance
evaluation of crumb rubber modified stone mastic asphalt pavement in
Malaysia. Advances in Materials Science and Engineering.
84. Mathew Lipman and Fazil T. Najafi (2014). Review of Permeable Pavement
Systems and Designs. ASEE Southeast Section Conference.
85. Mogawer W.S. and Stuart K.D. (1995). Effect of Coarse Aggregate Content on
Stone Matrix Asphalt Rutting and Draindown. Transportation Research Record

168
1492, Hot-Mix Asphalt Design, Testing, Evaluation, and Performance,
Transportation Research Board, Washington, D.C. pp 1-11.
86. Mogawer W.S. and Stuart K.D. (1996). Effect of Mineral Fillers on Properties
of Stone Matrix Asphalt Mixtures. TRR 1530, National Research Council,
TRB, USA, pp 86 -94.
87. Mohamad Yusri Aman, Zulkurnain Shahadan and Nor Raihan Mohd Tamin.
(2014). A Comparative Study on Properties of Malaysian Porous Asphalt
Mixes with Different Bitumen Contents. Research Journal of Applied
Sciences, Engineering and Technology . pp 797-806.
88. MORTH. (2001). Ministry of Road Transport and Highways, Specifications
for Road and Bridge Works. Indian Roads Congress, New Delhi. Fourth
Revision.
89. MORTH. (2013). Ministry of Road Transport and Highways, Specifications
for Road and Bridge Works. Indian Roads Congress, New Delhi. Fifth
Revision.
90. NAPA. (1994). Guidelines for Materials, Production, and Placement of Stone
Matrix Asphalt (SMA). IS 118. National Asphalt Pavement Association.
91. NAPA. (2003). Porous Asphalt Pavement, Lanham Maryland. National
Asphalt Pavement Association.
92. NAPA. (2008). Porous Asphalt Pavements for Stormwater Management. IS-
131. National Asphalt Pavement Association.

169
93. N. A. Qureshi, S. H. Farooq, Bilal Khurshid. (2015). Laboratory evaluation of
durability of open-graded friction course Mixtures. International Journal of
Engineering and Technology (IJET). ISSN: 0975-4024, Vol. 7 No. 3, PP 956-
964.
94. National Centre for Asphalt Technology (2000). Design, Construction and
Performance of New-Generation Open- Graded Friction Course Mixes, NCAT
Report 00-01, Auburn University.
95. NCAT Publication (1991). Asphalt Technology News, Auburn University,
Alabama, Vol. 3, No. 2.
96. Nicholls J.C., Nunn M, Brown A. and Weston D. (1997). Design of Long Life
flexible pavement foe heavy traffic. Report No. 250, Transportation Research
Laboratory, Berkshire, United kingdom.
97. Nobel Industry, Sweden. (1991). An Introduction to Stone Mastic Asphalt
(SMA), Introductory Handout, Scanroad.
98. Patrick G. Lavin. (2003). A Practical guide to design, production, and
maintenance for engineers and architects, Book on Asphalt Pavements, Spon
Press, Tylor & Francis group.
99. Perez M.A.C. , Jimenez F.E.P and Gordillo, J. (1990). Optimization of Porous
Mixes through the Use of Special Binders. Journal of the Transportation
Research Board, No. 1265. National Research Council, National Academy
Press. Washington, D. C. pp. 59-68.

170
100. Prowell B.D. (2007). Warm Mix Asphalt: The international technology
scanning program summary report. U.S. Department of Transportation, Federal
Highway Administration American Association of State Highway and
Transportation Officials, National Cooperative Highway Research Program.
101. Prowell B.D. (2008). Warm-Mix Asphalt: Best Practices. Presentation at 53rd.
NAPA Annual Meeting.
102. Prowell B.D., Cooley L.A. and Schreck, R.J. (2002).Virginia's Experience
With 9.5mm Nominal Maximum Aggregate Size Stone Matrix Asphalt.
Transportation Research Record: Journal of the Transportation Research
Board, 1813, 133-141
103. Prowell B.D., Hurley G.C. and Kvasnak A.N. (2009). Ohio Field Trial of
Warm Mix Asphalt Technologies: Construction Summary. National Center for
Asphalt Technology. NCAT Report No. 09-04.
104. Prowell B.D., Hurley G.C. and Frank, B. (2011). Warm-Mix Asphalt: Best
Practices. National Asphalt Pavement Associatoin (NAPA), Quality
Improvement Publication 125. 2nd
Edition. Lanham, MD.
105. Prowell B.D., Hurley G.C. and Frank B. (2012). Warm Mix Asphalt: Best
Practices. National Asphalt Pavement Association (NAPA). Quality
Improvement Publication 125, 3rd Edition. Lanham, MD.
106. Punith VS and Veeraragavan A. (2007). Behavior of reclaimed polyethylene
modified asphalt cement for paving purposes. Journal of Materials in Civil
Engineering 23 (6). pp 833-845.

171
107. Punith VS and Veeraragavan A. (2007). Behavior of asphalt concrete mixtures
with reclaimed polyethylene as additive Journal of materials in civil
engineering 19 (6). pp 500-507.
108. Punith VS, Suresha SN, Veeraragavan A, Raju S and Bose S. (2004).
Characterization of polymer and fiber-modified porous asphalt mixtures.
Proceedings of the 83rd Annual Meeting of Transportation Research Board
109. Putman B.J. and Amirkhanian S.N. (2004). Utilization of waste fibers in stone
matrix asphalt mixtures. Resources, Conservation and Recycling Journal.
Publisher Elsevier. Vol.42. Issue 3. pp.265-274.
110. Punith, VS and Veeraragavan A (2010). Characterization of OGFC mixtures
containing reclaimed polyethylene fibers”. Journal of Material in Civil
Engineering . vol.23 issue(3), pp 335-341.
111. Raghuram K.B. and Chowdary Venkaiah (2013). Performance Evaluation Of
Stone Matrix Asphalt (SMA) Using Low Cost Fibers. Journal Of The Indian
Road Congress. Vol. 74-2. pp 159-174.
112. Ratnasamy Muniandy and Bujang B.K. Huat. Laboratory Diameteral. (2006).
Fatigue Performance of Stone Matrix Asphalt with Cellulose Oil Palm Fiber.
American Journal of Applied Sciences. ISSN 1546-9239.
113. Reddy K.S., Palit S.K. and Pandey B.B. (2004). Laboratory Evaluation of
Crumb Rubber Modified Asphalt Mixes. Journal of Materials in Civil
Engineering, ASCE. pp 45-53
172
114. Robinson, William Jeremy (2005). Design and Performance of Open Graded
Friction Course Hot Mix Asphalt, Mississippi State University.
115. Rohith and Ranjitha (2013). A Study on Marshall Stability Properties of Warm
Mix Asphalt Using Zycotherm- A Chemical .Additive. International Journal of
Engineering Research & Technology (IJERT) Vol. 2 Issue 7.
116. Ruiz A., Alberola R., Perez F. and Sanchez B. (1990). Porous Asphalt
Mixtures in Spain. In Transportation Research Record: Journal of the
Transportation Research Board, No.1265. National Research Council, National
Academy Press, Washington, D. C. pp. 87- 94.
117. Salam Ridha, Oleiwi Al-Etba, Dr. P. Sravana and S .Amrend Kumar (2013).
Studying Properties of Stone matrix Asphalt mixtures by Altering Aggregate
Gradation and Filler Types. International Journal of Scientific Engineering and
Technology Research. ISSN 2319-8889, Vol. 02, Issue.09, PP 942-947
118. Santha and Lanka. (1997). Comparison of Standard Open-Graded Friction
Courses with Modified Open-Graded Friction Courses. Georgia Department of
Transportation. Research Project No. 9110.
119. Saiton A. (1990). Advantages of asphalt rubber binder for porous asphalt
concrete. Transportation Research Record 1265, Transportation Research
Board, Washington, DC, 69 –81.
120. Scherocman J.A. (1991). Hot-Mix Asphalt Paving Handbook, Transportation
Research Board.

173
121. Scherocman J.A. (1992). Construction of SMA Test Sites in the U.S. AAPT
meeting.
122. Shuler S. and Hanson D. I. (1990). Improving Durability of Open-Graded
Friction Courses. Transportation Research Record, Chip Seals, Friction
Courses, and Asphalt Pavement Rutting .1990, Transportation Research Board
of the National Academies, Vol. 1259, Washington, D.C., pp 35-41
123. Sharma V. and Goyal S. (2006). Comparative study of performance of natural
fibers and crumb rubber modified stone matrix asphalt mixtures. Can. J. Civil
Eng., 33. pp 134-139.
124. Smith H.A. (1992). Performance Characteristics of Open-Graded Friction
Courses. NCHRP Synthesis of Highway Practice 180, TRB.
125. Smith R. W., J. M. Rice and S. R. Spellman. (1974). Design of open-graded
asphalt friction courses. Federal Highway Administration. Report. FHWA-RD-
74-2.
126. Stuart K. D. (1992). Stone Mastic Asphalt (SMA) Mixture Design. Report No.
FHWA-RD-92- 006, FHWA.
127. Suchismita Arpita (2009). A Study of Effect of Binder Quality and Natural
Fiber on Stone matrix Asphalt. Department of Civil Engineering. M.tech
Thesis. National Institute of Technology, Rourkela.
128. Suchismita Arpita, Panda M., Chattaraj U and Gaspar L (2011). Fatigue
Characteristics of Stone Matrix Asphalt Mixes in Warm Climate. Acta
Technica Jaurinensis . Vol. 4.No. 3.

174
129. Suresha S.N., Varghese George and Shankar Ravi A.U. (2009).
Characterization of porous friction course mixes for different Marshall
compaction efforts. Construction and Building Materials, Volume 23, Issue 8,
pp 2887–2893.
130. Tayfur S, Ozen H and Aksoy A (2007). Investigation of rutting performance of
asphalt mixtures containing polymer modifiers. J. Constr. Build. Mater. pp
328-337.
131. Thelen E. A. (1978). Porous Pavement. The Franklin Institute Research
Laboratories.
132. UCPRC-RR-2012. (2012). Evaluation of Open-Graded Friction Course
(OGFC) Mix Design, Research report.
133. Vaitkus A., Cygas D., Laurinavicius A., and Perveneckas Z. (2009). Analysis
and Evaluation of Possibilities for the Use of Warm Mix Asphalt in Lithuania.
Baltic Journal of Road and Bridge Engineering. pp. 80-86
134. Vivek B. R and Sowmya N. J. (2015). Utilization of Fiber as a Strength
Modifier in Stone Matrix Asphalt. International Journal for Research in
Applied Science & Engineering Technology (IJRASET). Volume 3, Special
Issue-I1, ISSN: 2321-9653.
135. Watson D. E., L. A. Cooley, Jr. K. Ann Moore and K. Williams. (2004).
Laboratory Performance Testing of Open-Graded Friction Course Mixtures.
Journal of the Transportation Research Board. Washington D.C. pp 40-47

175
136. West R. (1998). Effect of Tire Rubber Grinding Method on Asphalt-Rubber
Binder Characteristics. Transpiration Research Board.
137. Willis, J.R., C. Plemons, P. Turner, C. Rodezno, and T. Mitchell. (2012).
Effect of Ground Tire Rubber Particle Size and Grinding Method on Asphalt
Binder Properties. NCAT Report 12-09. National Center for Asphalt
Technology.
138. WSDOT (2000). STONE MATRIX ASPHALT SR-524. Washington State
Department of Transportation Report. www.wsdot.wa.gov
139. Wurst James (2011). Evalution of Warm Mix Open Graded Friction Course
Mixtures. Clemson University. [email protected].
140. http://www.badroadsinindia.com/
141. http://engineering-and-technology.blogspot.in/2013/12/stone-mastic-asphalt-
details.html.
142. https://engineering.purdue.edu/NCSC/services/2010%20Presentations/Effect%
20of%20Low%20Air%20Voids.pdf.
143. http://www.engineeringcivil.com/stone-mastic-asphalt.html. B. E. Gite,
Mr.Momin and Soyal Abjal. Stone Matrix Asphalt. Civil Engineering Portal.
176
LIST OF PUBLICATIONS
International conferences
1. EVALUATION OF MOISTURE SUSCEPTIBILITY OF OPEN GRADED
FRICTION COURSE. Published in International Conference on Civil and
Environmental Engineering Chennai, India. Organized by IRF, Research forum in
association with Institute of Research and Journal. Proceedings of 42nd
IRF
International Conference, 15 th
May, 2016, Chennai, India. ISBN: 978-93-86083-17-
3. pp 7-10.
2. EVALUATION OF RESILIENT CHARACTERISTICS OF STONE
MATRIX ASPHALT (SMA). Published in International Conference on Civil and
Environmental Engineering Chennai, India. Organized by IRF, Research forum in
association with Institute of Research and Journal. Proceedings of 42nd
IRF
International Conference, 15 th
May, 2016, Chennai, India. ISBN: 978-93-86083-17-
3. pp 11-14.
International Journal
1. EVALUATION OF MOISTURE SUSCEPTIBILITY OF OPEN GRADED
FRICTION COURSE. Published on International Journal of Advances in Sciences,
Engineering and Technology (IJASEAT) Organized by Institute of Technology and
Research in association with IRJ Journals. Volume-4, Issue-3, Aug.2016

177
2. EVALUATION OF RESILIENT CHARACTERISTICS OF STONE
MATRIX ASPHALT (SMA). Published on International Journal of Advances in
Sciences, Engineering and Technology (IJASEAT) Organized by Institute of
Technology and Research in association with IRJ Journals. Volume-4, Issue-3,
Aug.2016
\
178
VITAE OF THE AUTHOR
Name Neha Sharma
Date of Birth 31et
March, 1989
Academic
Qualification
B.E. (Civil Engineering) from SBCET, Jaipur in
2009
M.Tech (Transportation Engineering) from MNIT
Jaipur in 2011
Professional
Experience
Presently working as Lecturer (Civil Engineering)
in Government Polytechnic College, Jhalawar
from March 2014 to till date.
Worked as Assistant manager (Highways) in
Consulting Engineers Group, Jaipur from
Sept.,2010 to April, 2012
Awards Achieved Gold Medal for Securing First position
in M.Tech. (CGPA: 9.52 out of 10)
Received Gargi Award by the Balika Siksha
Foundation Rajasthan, Jaipur for excellence in
academics in Secondary.