performance evaluation of the commercial bank of ethiopia.pdf
TRANSCRIPT

PERFORMANCE EVALUATION OF THE COMMERCIAL BANK OF ETHIOPIA:- PRE AND POST LIBERALIZATION
A Research Project submitted to Department of Accounting & Finance, College of Business and Economics, Mekelle University, for the partial Fulfillment of the Degree of Master of Science in Finance & Investment
By
YESUF LEGAS ABDU
Reg. No-- CBE/PRO-034/01
Advisor
Dr. FISSEHA GIRMAY, Ph.D. Assistant professor of accounting & finance Department of Accounting and Finance
College of Business & Economics Mekelle University Tigray – Ethiopia.
June, 2010 Mekelle, Ethiopia

i
Study On
Performance Evaluation of the Commercial Bank of Ethiopia: Pre and Post Liberalization
By
Yesuf Legas Abdu
Reg. No-- CBE/PRO-034/01

ii
DECLARATION
I, Yesuf Legas, hereby declare that the project work entitled “Performance
Evaluation of the Commercial Bank of Ethiopia: Pre and Post
Liberalization” submitted by me for the award of the degree of Masters of Finance
and Investment of Mekelle University at Me
kelle, is my original work and it has not been presented for the award of any other
Degree, Diploma, Fellowship or other similar titles of any other University or
institution.
Place: Mekelle Signature: ----------------
Date: May, 2010 Name: Yesuf Lega

iii
CERTIFICATION
This is to certify that this Project work titled “performance Evaluation of the
Commercial Bank of Ethiopia: pre and post Liberalization” is the bonafide
work of Mr Yesuf Legas who carried out the research under my guidance. Certified
further, that to the best of my knowledge the work reported here in doesn’t form part of
any other project report or dissertation on the bases of which a degree or award was
conferred on an earlier occasion on this or any other candidate.
Place: Mekelle Signature: ---------------------------------
Date: May, 2010 Advisor: Dr. Fisseha Girmay, Ph.D. Asst. Professor of Accounting & Finance Department of Accounting & Finance College of Business & Economics Mekelle University

iv
ACKNOWLEDGMENTS
At the very beginning I thank my lord for his safeguarded and brightened direction of
my personal and academic journey. Deserving special and heartfelt thanks is also my
treasured advisor, Dr. Fisseha Girmay, for his unreserved guidance, invaluable
assistance, constructive comments and relentless effort exerted in advising and teaching
me throughout the job in writing this paper.
I also would like to thank the seven operations of CBE and NBE documentation center
employees’ and management member, who were very cooperative in providing the
necessary data and sacrificing their valuable time in filling the questionnaire to carry out
this project.
My appreciation also goes to Tewodros Abuhay, Kibrom Mehari and Ruith Gedion for
wholehearted support in providing computer and motivating me in the entire period of
this project work.
Special gratitude goes to my best friends, Samueal Melkie (NBE), Yohannes Negash and
Antigen Birhan for editing the paper, motivating and supporting me to carry out this
project work.
Finally, my special thanks and unreserved love goes to my fiancé Eyerusalem
Hargewien, for her strong backing and overall assistance without her my entire study of
the postgraduate program would have not been successful.
Yesuf Legas

v
ABSTRACT
Financial sector reform is so important to ensure well-organized and stable financial system to
increase the contribution of the banking system towards economic development. An exemplary
reform measures undertaken by the Ethiopian government start the year 1992 was “liberalizing”
the financial sector. Thus, this study was conducted under the title “performance Evaluation of
Commercial Bank of Ethiopia: pre and post Liberalization”. The rational of this study is let the
CBE and NBE know the performance of the bank in the pre and post liberalization and hence, to
comment and recommend them on what they have to do, for the banks’ prosperity. The main
objective of the study is to evaluate the financial performance of the Commercial Bank of Ethiopia
in the pre and post liberalization. The researcher employed before and after study design using
case study approach to evaluate how the bank has been financially performing in the pre and post
liberalization. Both primary and secondary data were used in the study. Primary data gathered
through structurally designed questionnaire from the selected employees’ and management who
are working in seven different operations of the bank and secondary data from the annual reports
for CBE for the period covering the year 1976 to 2009 were used in the study. The researcher
employed financial statement analysis and test the hypothesis using t-test statistical tools. The
major findings of the study indicate that performance of the bank after the liberalization is better
than before liberalization. However, further reform measures in the deposit market, in
establishing strong legal ground for providing technology banking services, let the bank to do
business with financial institutions of their own choice, improving the capacity and independence
of the regulatory/supervisory organ and full liberalization of the foreign market needs to be areas
that need further liberalization or reform measures. Finally, the study suggested that the bank
should use its maximum effort to further improve its performance and reform measures should be
initiated on lifting the minimum interest rate for deposit to be determined on market basis,
modify the commercial code to incorporate new article to enhance IT, fully liberalizing the foreign
market, and encouraging the bank to do business with a financial institutions of their own choice.
Key words: Liberalization, credit quality, Liquidity, Profitability

vi
TABLE OF CONTENTS
CONTENTS
Pages
Title page i
Declaration ii
Certification iii
Acknowledgment iv
Abstract v
Table of contents vi
Index of table ix
Acronyms x
CHAPTER I INTRODUCTION
1.1 Background of the Study 1
1.2 Statement of the Problem 4
1.3 Research Questions 5
1.4 Research Hypothesis 6
1.5 Justification of the Study 6
1.6 Objectives of the Study 7
1.7 Methodology of the Study 7
1.7.1 Research Design 7
1.7.2 Sapling Design 8
1.7.3 Method of Data Collection 9
1.7.4 Method of Data Analysis and Interpretation 9
1.8 Significance of the Study 10
1.9 Scope of the Study 11
1.10 Limitation of the Study 11

vii
1.11 Organization of the Study 12
CHAPTER II LITRATURE REVIEW
2.1 Theoretical Framework 14
2.1.1 Financial Liberalization and Repression 14
2.1.2 Measure of Financial Performance 18
2.1.2.1 Financial Statement Analysis 19
2.1.2.1.1 Types of Financial Statement Analysis 20
2.1.2.1.2 Role of Financial Statement Analysis 21
2.1.2.1.3 Limitations of ratio analysis 22
2.1.3 Financial Analysis in Banking Industry 24
2.1.4 Types of Financial Ratios Analysis 24
2.1.4.1 Credit Quality 24
2.1.4.2 Liquidity Performance 25
2.1.4.3 Profitability Performance 27
2.1.4.4 Growth in Capital, Deposit and Loans 28
2.2 Empirical Evidence 28
CHAPTER III ORGANIZATIONAL PROFILE
3.1 History of Banking in Ethiopia 34
3.2 Financial Sector Reform 39
3.3 Commercial Bank of Ethiopia 40
CHAPTER IV DATA ANALYSIS AND INTERPRETATION
4.1 Data From Secondary Sources 42
4.1.1 Credit Quality 43
4.1.2 Liquidity Performance 47
4.1.3 Profitability Performance 51
4.1.4 Growth in Net Profit, Capital, Deposit and Loan 55
4.1.5 Hypothesis Testing Using T-Test 56
4.1.5.1 Test of Credit Quality Performance 58

viii
4.1.5.2 Test of Liquidity Performance 61
4.1.5.3 Test of Profitability Performance 63
4.2 Data From Primary Sources 66
4.2.1 Respondents Background 67
4.2.2 Performance of CBE in the Pre and Post period 70
4.2.3 Involvement of Government 72
4.2.4 profitability Performance 73
4.2.5 Regulation of the Bank 74
4.2.6 Further Liberalization or Reform Measures 74
CHAPTER V CONCLUSIONS AND RECOMMENDATIONS
5.1 Conclusion 76
5.2 Recommendation 79
BIBLOGRAPHY 80
ANNEXES Annex A: Balance Sheets 85
Annex B: Income Statements 91
Annex C: Questionnaire 97

ix
INDEX OF TABLES
Table No. Description Page
Table 4.1 Equity to Total Asset Ratio 44
Table 4.2 Equity to loan Ratio 45
Table 4.3 Non Performing Loans to Total Loan Ratio 46
Table 4.4 Total Loans to Total Asset Ratio 47
Table 4.5 Liquid Asset to Deposit Ratio 48
Table 4.6 Total loan to Total Deposit Ratio 50
Table 4.7 Return on Asset 51
Table 4.8 Return on Equity 52
Table 4.9 Net Interest Margin 54
Table 4.10 Net Profit, Capital, Deposit and Loan 55
Table 4.11 Mean Score of Credit Quality pre and post Reform 58
Table 4.12 Paired Sampled T-Test for Credit Quality of the Bank 59
Table 4.13 Mean Score of Liquidity performance pre and post 61
Table 4.14 Paired Sampled T-Test for Liquidity of the Bank 62
Table 4.15 Mean Score of Profitability Performance Pre and Post 64
Table 4.16 Paired Sampled T-Test for Profitability of the bank 65
Table 4.17 Gender of the Respondents 67
Table 4.18 Age of the Respondents 68
Table 4.19 Educational Status of the Respondents 68
Table 4.20 Experience of the Respondents 69
Table 4.21 Positions of the Respondents 70
Table 4.22 Performance of the Bank in the pre and post 71
Table 4.23 Government Involvement 72
Table 4.24 Profitability Performance 73
Table 4.25 Regulation of the Bank 74

x
ACRONYMS
A After the Reform Period
AIDB Agricultural and Industrial Development Bank (
B Before the Reform Period
CBE Commercial Bank of Ethiopia
DEA Data Envelopment Analysis
EQL Equity to Loan Ratio
EQTA Equity to Total Asset Ratio
EVA Economic Valued Added
FP Financial Performance
ISHOPA Imperial Savings and Home Ownership public Association
LATD Liquid Asset to Total Deposit Ratio
NBE National Bank Of Ethiopia
NIM Net Interest Margin
NPTL Nonperforming Loans to Total Loan Ratio
ROA Return On Asset
ROE Return on Equity
TLTA Total Loan to Total Asset Ratio
TLTD Total Loans to Total Deposit Ratio

1
CHAPTER I
INTRODUCTION
This chapter presents the background of the study, statement of problem, justification of
the study, objectives of the study, research questions, research hypothesis, and
methodology of the study, significance of the study, scope of the study, limitation of the
study, and organization of the study.
1.1 Background of the Study
The importance of restructuring and privatizing the financial sector has received
renewed attention in the ongoing effort of revitalizing developing economies.1 A
growing research literature has underscored the importance of banking and the
financial sector to economic growth. Several studies found positive relationship between
financial sector development and levels of income and growth.2
various studies has shown that financial liberalization is expected to enhance the growth
of the financial sector, narrowing of the intermediation margin, efficient allocation of
savings and ultimately lead to economic growth and on the other hand, a financial
market characterized by heavy regulations and restrictions is expected to exercise
financial repression.3
The contribution of the financial system to economic growth and development can only
be maximize if the total financial system is subjected to adequate financial regulations
and reforms.4 Therefore, satisfactory reform measures and regulations are so important
to ensure well-organized and stable financial system, which is vital for the successful
implementation of the monetary and economic policies of a country. To achieve this
objective it is essential to place financial reform measures that improve the contribution
of the banking system towards economic development.

2
Over the past three decades, leading industrial nations and many developing countries
have liberalized their financial markets by removing foreign exchange controls,
deregulating interest rates paid on bank deposits, expanding the powers of domestic
financial institutions, and creating greater opportunities for entry by foreign banks.5
Unquestionably, the deregulation of domestic and global financial markets has
produced major benefits, including more efficient intermediation of financial resources,
more rapid economic development, and faster growth in trade.
In many developing countries, financial sector reforms have been generally pursued as
part of broader structural adjustment programs, bringing about significant economic
benefits through a more effective mobilization of domestic savings and a more
allocation of resources.6
Most African countries, particularly those in Sub-Saharan Africa, have recently
undergone extensive financial sector reforms and the reform package includes
restructuring and privatization of state owned banks, the introduction of private
banking systems, along with bank supervisory and regulatory schemes, the introduction
of a variety of measures to promote the development of financial markets; including
money and stock markets.7
Ethiopia one of the oldest civilizations in Africa and the economy has been state
controlled through a series of industrial development plans since the Imperial
Government of Haile Selassie. It was managed as a Soviet-style centrally planned
economy under a socialist government from 1976-1991 and the post-1991 government
led a transition to a more market-based system, and subsequent governments have
introduced further reforms.8 One of this reform measures undertaken by the Ethiopian
government start the year 1992 was “liberalizing” the financial sector.
In Ethiopian, before 1992 (during the Derg period) the financial sector was highly
repressed; differentiated by restricted entry, constrained banks’ role on interest rates,
credit limits and others.

3
Moreover, the then existing government owned banks were under pressure by
regulation from the central government as the country was governed by command
economy. This institutional framework led to a situation of virtually no competition in
the banking market, with total concentration of banking activities in government owned
banks. In fact, the government position was to minimize the extent of competition
between the commercial banks and existing specialized banks.
However, after the change of the government different reforms including in the
financial sector were undertaken which enabled the banks to set lending interest rate by
their own and allows the countryman to participate in the banking sector.
In undertaking this task the Ethiopian government adopted a strategy of (a) gradualism:
gradual opening up of private banks and insurance companies alongside public ones,
gradual liberalization of the foreign exchange market, and so on, and (b) strengthening
domestic competitive capacity before full liberalization (that is, restricting the sector to
domestic investors, strengthening the regulatory and supervision capacity of the NBE,
giving the banks autonomy, and opening up the interbank money market).9 In line with
this strategy various proclamations and regulations have been passed since 1992.
Currently, thirteen commercial banks and two publicly owned specialized banks are
operating in Ethiopia as compared to one government owned commercial bank and two
specialized banks before the reform measures took place. Of the, thirteen commercial
banks, one is publicly owned and twelve (12) are privately owned banks.10 It clear that,
the commercial bank of Ethiopia is one of the dominant commercial bank operating in
the country before and after the reform period. Therefore, the aim of this study is to
evaluate financial performance of the commercial bank of Ethiopia in the pre and post
financial liberalization.

4
1.2 Statement of the problem
The Ethiopian economy has been state controlled through a series of industrial
development plans since the Imperial Government of Haile Selassie. Under state
socialism (1974-91), popularly referred to in Ethiopia as the ‘Derg regime’, financial
institutions were basically executing the economic plans outlined by the natural
planning organ. In that period regulation and supervision were not critical because the
national plan regulated and directed the activities of financial institutions.
Moreover, financial institutions were directed to finance some public projects that may
not have passed proper financial appraisal but were simply based on either ideological
rounds or ‘merit wants’ arguments.
Following the demise of the Derg regime in 1991, post-1991 economic policy witnessed
marked departure from the previous Socialist system. The main difference lay in openly
adopting a market-oriented economic policy. In fact many of the policies adopted by the
new government in Addis in 1991 had already been proposed by the defunct Derg
regime as it approached the end of its reign. This new change in policy brought about a
significant change in the functioning of the banking sector. Not only as the financial
sector going to serve the private sector, but new private financial were institutions also
emerging. At the same time the role of the Ethiopia’s central bank, the National Bank of
Ethiopia (NBE), was also reformulated. Thus, financial sector reconstruction was at the
top of the government’s agenda.
In order to perform these activities the Ethiopian government adopted a strategy of
gradualism and strengthening domestic competitive capacity before full liberalization
and in line with this strategy various proclamations and regulations have been passed
since 1992. But Ethiopia’s financial sector remains closed and is much less developed
than its neighbors and has no capital market with very limited informal investing in
shares of private companies.

5
The fact that, the commercial bank of Ethiopia is one of the dominant commercial bank
operating in the country in the pre and post liberalization or reform period. However,
the commercial bank of Ethiopia have been re-organized to operate based on the
market-oriented policy framework in the post reform period, the performance of the
bank in terms of deposits, loans, capital, and profitability that was expected from
liberalization has not yet been achieved. In addition, despite many reforms and
financial liberalization measures on the banking industry, critical evaluation of the
financial performance of the commercial bank of Ethiopia before and after the
liberalization has not been investigated.
Generally, there is no study conducted pinpointing of the financial performance of the
commercial bank of Ethiopian before and after the liberalization so as to suggest
improvements in the future. Thus, this study attempted to fill this gap by performing
the study in the way in which by evaluating the financial performance of the
commercial bank of Ethiopian before and after the financial liberalization.
1.3 Research Questions
The following questions were answered by the researcher in the study:
1. How is the financial performance of CBE in the pre and post liberalization?
2. Is there a significance difference between the financial performance of the
commercial bank of Ethiopia in the pre and post reform period based on three
financial performance indicators: credit quality, liquidity and profitability?
3. What are the areas that need further liberalization or reform measures?
4. What are the relevant recommendations and future research directions that can
be drawn from this study?

6
1.4 Research Hypothesis:
The following hypothesis were developed and tested in this study:
Ho1: There is no significant gap in the credit quality performance of CBE in the pre and
post financial liberalization.
Ho2: There is no significant gap in the liquidity performance of CBE in the pre and post
financial liberalization.
Ho3: There is no significant gap in profitability performance of CBE in the pre and post
financial liberalization.
1.5. Justification of the Study
The motivation of the study is providing some light as a contribution to address the
problem. Moreover, the findings of this research disseminated to the CBE and NBE
officials to know the performance of the bank in the pre and post reform period and
hence, to comment and recommend them on what they have to do, for the banks’
prosperity.
In lucid terms the rationales for the study are:
1. Results from this research work was expected to compare the financial
performance of Commercial Bank of Ethiopia in the pre and post and showing
the direction for the bank as a lighting house for further improvement of the
performance of the bank.
2. The results from this finding helped to create better link the Commercial Bank of
Ethiopia with the National Bank of Ethiopia (NBE).
3. The findings from this research work helped to identify the area that needs
further liberalization or reform measures of the banking industry so as to
improve the bank performance.
7
1.6. Objective of the Study
The overall objective of this study is to evaluate the financial performance of commercial
bank of Ethiopia in the pre and post financial liberalization.
The specific objectives of the study are:
1. To examine the credit quality performance of the commercial bank of Ethiopia in
the pre and post liberalization.
2. To analyze the liquidity performance of the commercial bank of Ethiopia in the
pre and post liberalization.
3. To measure the profitability performance of the commercial bank of Ethiopia in
the pre and post the reform periods.
4. To identify the gap between the financial performance of the commercial bank of
Ethiopia in the pre and post the reform periods under the three financial
performance indicators: credit quality, liquidity and profitability.
5. To identify areas that needs further liberalization or reform measures
6. To provide relevant recommendations based on the findings of the study.
1.7 Methodology of the Study
1.7.1 Research Design
In any research undertaking, the methodology/research design to be followed is
determined by the nature of the problem statement or more specifically by the research
objectives. Here in this study, before and after study design using case study approach
was used by the researcher because this design of research is the most appropriate for
measuring the impact or effectiveness of a program (liberalization). The change has
measured by comparing the differences in the phenomenon before and after the
liberalization. As it fits to the purpose of the study, this research design was used to

8
evaluate the performance of the CBE in the pre and post financial liberalization by using
the annual reports of the bank and by asking the management and employees about
their attitude toward the financial performance of the bank and areas that need further
liberalization or reform measures to improve the performance of the bank. Therefore,
both qualitative and quantitative data was used under the study.
1.7.2 Sampling Design
The purpose of the present study is to evaluate the performance of the commercial bank
of Ethiopia in the pre and post liberalization. Thus, Commercial Bank of Ethiopia is one
of the dominant commercial bank operating in the country in the period of the two
regimes i.e. in the pre and post liberalization period. Therefore, for the sake of
uniformity and fair comparison the researcher selected CBE for evaluating the financial
performance in the pre and post liberalization.
For the purpose of primary data sources the selection of respondents performed in a
way to represent both the management and employees working in different seven
operations of the bank which are credit, domestic banking, foreign banking, marketing
and business development, human resource management, branch operation, and risk
management. For the purpose of the study a non-probability sampling design –
purposive sampling method- was adopted and considered to gather the primary data.
The researcher used such sampling method because in his opinion he believed that
management and employees’ of the bank are the only that could provide sufficient and
accurate information for the study.
Therefore, from each operation five respondents were selected for the study using
purposive sampling method. Accordingly, a total number of 35 respondents were
selected from commercial bank of Ethiopia head office who is working in seven different
operations of the bank.

9
1.7.3 Method of Data Collection
Both primary and secondary data sources were used. Primary data were collected based
on a structurally designed questionnaire from the selected employees’ and management
members who are working in seven different operations of the bank. The questionnaire
was including both open ended and cloth ended questions.
The researcher also collected data from secondary sources. To this end, annual reports
for Commercial Bank of Ethiopia for the period covering the year 1976 to 2009,
Proclamation, websites, Journals, different literatures and publications on financial
liberalization have been consulted to undertake both quantitative and qualitative
evaluation of the performance of the Commercial Bank of Ethiopia in the pre and post
reform period.
1.7.4 Method of Data Analysis and Interpretation
Both the qualitative and the quantitative data were analyzed using descriptive statistical
tools.
The researcher used financial statement analysis in evaluating the financial performance
of the bank by applying different financial ratios such as credit quality, profitability and
liquidity and change in growth in net profit after tax, capital, deposits and loans. After
that, it was presented in the table and analyzed using descriptive method in the form of
mean and percentage.
Concerning the data on identifying the gap in financial performance of the CBE in the
pre and post liberalization under the three financial performance indicators: credit
quality, liquidity and profitability, which is the fourth objective of the study, the
researcher has applied a comparative evaluation of the CBE financial ratios in the pre
and post liberalization. To analyze the data, statistical package for social science (SPSS)
software version 16 was employed. One sample T-Test was used to test the overall

10
financial performance of the bank in terms of the three financial performance indicators;
Credit quality, Liquidity and Profitability and paired sample T-Test analysis was used to
test the hypothesis for the significant difference between the financial performance
indicator ratios in the pre and post financial liberalization. The interpretation of the
results was done at 95 percent level of confidence.
Additional evaluation of the financial performance of the CBE and the areas that need
further liberalization or reform measures so as to improve the bank performance, which
is the fifth objective, the researcher has applied descriptive statistics based on the data
obtained from the primary sources. Then, the collected data was presented in the tables
and analyzed using descriptive statistical tools in the form of percentage, frequencies,
and average. Finally, based on the information obtained from the analysis part,
conclusions and recommendations were made.
1.8 Significance of the Study
As this research’s main purpose is of education, the major significance relies on
equipping the researcher with the necessary skills and technique to undertake research.
More specifically, the study:
1. Evaluate the financial performance of the commercial bank CBE in the pre and
post liberalization and let the CBE and NBE know the performance of the bank in
the pre and post period and hence, to comment and recommend them on what
they have to do, for the banks’ prosperity
2. Forward some suggestions for further liberalizing or taking reform measures in
the banking sector in order to improve the performance of the CBE.
3. Give imminent to researchers and students about the problem and stimulate
further investigation of the issue.

11
1.9 Scope of the Study
The study highly paying attention on evaluating any changes that observed and
reflected in the financial performance of the commercial bank of Ethiopia before and
after the financial liberalization. In addition the study attempted to identify areas, which
needs further liberalization or reform measures so as to improve the bank performance.
Since the commercial bank of Ethiopia is the only bank operating in the country before
and after the reform period, the researcher selected CBE for the study. Furthermore,
only those data which can be publicly announced by the commercial bank of Ethiopia or
annual reports for the commercial bank of Ethiopia for the period covering the year 1976
to 2009 was referenced under the study. In addition, the researcher used primary data
collected from the management and employees working in different seven operations of
the bank which are credit, domestic banking, foreign banking, marketing and business
development, human resource management, branch operation, and risk management.
To evaluate the bank performance, the researcher employed financial statement analysis
and test the hypothesis using t-test statistical tools. Furthermore, the researcher used
unadjusted financial statement of the CBE for inflation in computing the financial ratios.
1.10 Limitations of the Study
The study evaluated the financial performance of the commercial bank of Ethiopia in
the pre and post reform period. Some problems were encountered during the research
period. Shortage of time, finance, research document on commercial bank of Ethiopia to
use as a bench mark especially using financial ratio; absence of both market index to use
different financial performance measures indicators and recorded price index for
adjusting the financial statement of the bank posed a hurdle on the successful
completion of the study.

12
1.11 Organization of the Study
The study is organized into five chapters. The first chapter deals with introduction part
of the study providing details related to the background of the study, statement of
problem, justification of the study, objectives of the study, research questions, research
hypothesis, and methodology of the study, significance of the study, scope of the study,
limitation of the study, and organization of the study. Chapter two deals with the
literature review, chapter three deals with the organization profile, chapter four is about
data analysis and interpretation and finally, chapter five contains conclusions and
recommendations.

13
Reference
1See Scholtens, B. 2000. Financial Regulations and Financial System Architecture in Central
Europe. Journal of Banking and Finance, 24 (4): 525-553.
2See Khan, M. & Senhadji, A. 2000 Threshold effects in the relationship between inflation and
growth. IMF Staff papers. Washington. 48(1):1 -21
3See Chirwa (2001), Market Structure, Liberalization and Performance in the Malawian Banking
Industry, AERC, RP 108
4See Tesfaye Boru (2007). The Impact of Financial Liberalization on the Ownership, Market
Structure and Performance of the Ethiopian banking Industry. Retrieved on April 2, 2010 from
http://etd.aau.edu.et/dspace/handle/.
5See Wilmarth (2003), Dose Financial Liberalization Increase the Likelihood of a Systematic
Banking Crisis? Evidence from the Past Three Decades and the Great Depression.
6See Lee (2002), Financial Liberalization and Foreign Bank Entry in MENA, World Bank, May
7See Senbet and Otchere (2005), Financial Sector Reforms in Africa Perspectives on Issues and
Policies, prepared for annual World Bank Conference on Development Economics, Dakar
Senegal, and January 2005.
8See Kiyota K., Peitsch B., and Stern R.M. (2007), the Case for Financial Sector Liberalization in
Ethiopia, Michigan: Research Seminar in International Economics, August.
9See Alemayhu Geda (2006), The Structure and Performance of Ethiopia’s Financial Sector in the
Pre and Post Reform Period: With Special Focus on Banking. Retrieved on April 7, 2010 from
http:/www./social science research network.com
10See National Bank of Ethiopia: www.nbe.gov.et/financial/banks.htm), retrieved February 2010.

14
CHAPTER II
REVIEW LITERATURE
Review of the theoretical foundation of the paper is composed of review of various
literatures and studies that evaluate the performance of commercial bank in relation to
financial liberalization. Therefore, the chapter is organized based on three main
subsections. The first part reviews literatures on financial liberalization and repression.
The second part is reviews literature on bank performance and finally, the last part of
the chapter is present the empirical evidence that evaluate performance of the
commercial bank.
2.1 Theoretical Framework
2.1.1 Financial Liberalization and Repression
Financial liberalization is the process of breaking away from a state of financial
repression. As financial repression has been most commonly associated with
government fixing of interest rates and its adverse consequences on the financial sector
as well as on the economy, financial liberalization, in turn, has come to be most
commonly associated with freeing of interest rates. It clear that financial liberalization as
a process involving a much broader set of measures geared toward the elimination of
various restrictions on the financial sector, such as the removal of portfolio restrictions
on the banking sector, the reform of the external sector, as well as changes in the
institutional framework of monetary policy.1
Financial repression, by-now a classic phrase, originated in the works of Ronald I.
McKinnon and Edward S. Shaw in the early 1970s, to describe a developing country
environment whereby “the financial system…is repressed (kept small) by a series of

15
government interventions that have the effect of keeping very low (and often at negative
levels) interest rates that domestic banks can offer to savers”1; the most common forms
that these interventions would take were interest rate regulations, directed credit
schemes, and high reserve ratios.
Financial repression is a problem because, as McKinnon-Shaw hypothesized, repressing
the monetary system fragments the domestic capital market with highly adverse
consequences for the quality and quantity of real capital accumulation.2 This would
happen primarily through four channels: (a) The flow of loan able funds through the
organized banking system is reduced, forcing potential investors to rely more on self-
finance; (b) Interest rates on the truncated flow of bank lending vary from one class of
favored or disfavored borrower to another; (c) the process of self finance is itself
impaired; if the real yield on deposit is negative, firms cannot easily accumulate liquid
assets in preparation for making discrete investments and socially costly inflation
hedges look more attractive as a means of internal finance; and (d) Significant financial
deepening outside of the repressed banking system becomes impossible when firms are
dangerously illiquid and/or inflation is high and unstable; robust open markets in
stocks and bonds, or intermediation by trust or insurance companies, require monetary
stability.
The fix pretty much follows from the diagnosis detailed above: free interest rates
rapidly, reduce reserve requirements, and eliminate directed credit schemes, while
stabilizing the price level, say in the context of a strong disinflation program. This
would help countries grow faster, because, following financial liberalization, investment
and growth would pick up. Given the important role played by interest rates in all this,
removal of controls over interest rates has become the centerpiece of the liberalization
process.
What we understand from financial liberalization today is different. Other than interest
rate liberalization and elimination of directed credits and high reserve requirements, it

16
involves a wide set of additional measures including the easing of portfolio restrictions
on banks, changes in the ownership of banks, enhanced competition among banks,
integration of domestic entities to international markets, as well as changes in the
monetary policy environment. Of these, external sector reforms go hand in hand with
financial sector reforms because removing restrictions on exchange and payments
system and establishing a freely functioning foreign exchange market are central to
removing distortions that limit portfolio behavior. Broadly, reforms involve two phases:
removal of all restrictions on current payments and transfers, and capital account
liberalization; the latter, by enhancing country’s integration with the rest of the world,
imposes perhaps the strictest limits on financial repression.
The reform of the institutional context of monetary policy implementation primarily
involves increased independence for the central bank and a switch from direct
instruments of monetary control (e.g., interest rate controls, bank-by-bank credit
ceilings, statutory liquidity ratios, directed credits,) to indirect instruments (e.g. reserve
requirements, public sector deposits, credit auctions, primary and secondary market
sales of bills, and foreign exchange swaps). The main idea here is for central banks to
stimulate the growth of money markets and instruments with a view to enhancing
market-oriented of its policy environment.
According to the exponents of financial repression3, financial liberalization can foster
economic growth. They argue that the financial sector of the economy matters in
economic development as it assists in the breakaway from repetition of repressed
economic performance to accelerated growth of the economy.4 The McKinnon–Shaw
hypothesis postulates that government interventions in various forms in less developed
countries lead to financial repression. The economies in these countries have been
characterized by control of interest rates, imposition of credit ceilings, use of credit
rationing, high levels of inflation and high public sector deficits. These policies have
meant that finance in these countries has been shallow compared with national income
or financial wealth. The interest rates on deposits have been low and negative and

17
savings have been confined to a narrow range of financial instruments. Government
control of interest rates on loans and deposits tends to raise the demand for and curtail
the supply of funds.
In addition 5concluded that African countries stand to gain from financial liberalization
because real deposit rates were found to have a positive impact on financial savings, this
in turn affects the level of investment positively. However, the design of financial sector
reforms is also important.
Furthermore, for financial liberalization to be successful there should be macroeconomic
stability and adequate prudential supervision and regulation of banks. Besides6 note
that, the difficulties faced by many countries in liberalizing their financial markets go
beyond simply problems of macroeconomic stability.
In addition 7 argue that liberalization can lead to instability and questions the ability of
financial markets to allocate credit efficiently. Further 6 note that the experience with
financial instability in many developing countries suggests that liberalization promotes
instability and also argue that the concept of financial repression used in the literature
appears too broad, encompassing both positive and negative aspects of government
interventions in the financial markets that may mask the need for institutional
development.
In any case, financial liberalization is expected to generate several benefits that build the
impetus for economic growth and development in developing countries. First, financial
sector reforms are expected to lead to financial deepening; hence the stock of financial
assets relative to income is expected to increase with liberalization. Second, the
intermediation margins of the banking sector are expected to diminish with
liberalization. Furthermore 6 note that competitive pressure that results from conditions
of free entry and competitive pricing will raise the functional efficiency of
intermediation by decreasing the spread between deposit and lending rate. In addition 5
assert that financial liberalization may not help reduce interest spreads in African

18
countries if the reduction in reserve requirements and deregulation of the banking
sector are not coupled with the increase in competition in the sector. Third, liberalization
opens the way to superior allocation of savings by widening and diversifying the
financial markets on which investment opportunities compete for savings flow. The
market for savings is extended in terms of scale, maturity and risk, and information for
comparisons of alternative facilities becomes available more cheaply.4 Fourth, local
capital markets can be integrated into a common market, and new opportunities for
pooling savings and specialization in investment are created in the economy. But 8 note
that in this context, financial liberalization is expected to lead to the diminishing role of
the informal financial sector.
Studies in Africa have shown that liberalization of the financial sector has proceeded
with limited success. Finally 5 concluded that financial repression in African countries is
likely to persist because governments have the incentive to perpetuate it given the
incidence of high inflation, large budget deficits and limited access to foreign capital.
Thus, African countries are likely to face problems in getting their economies out of the
financial repression web because of high inflation rates that justify banks’ high
intermediation margins, implicit tax that the government extracts from the banking
system through enforcement of below market rates, and high liquidity reserve
requirements to help them finance often large deficits.
2.1.2 Measures of Financial Performance
In various studies different methods are applied to evaluate banks’ performance.
Commonly these methods can be classified in three ways: the traditional method of
financial indices based on balance sheet and income statement analysis, parametric
methods based on production function and non-parametric methods with out
production function.9
However, if the financial market were efficient, market price for banks' stock price
would be one of the most appropriate tools for measuring banks' performances. But, the

19
alternative to the market approach is the accounting-based financial ratio approach,
which has commonly been used for measuring the financial performance of firms.10
Furthermore, Economic Valued Added (EVA) is another modern financial measurement
tool that determines if a business is earning more than its true cost of capital. The EVA
application in banks is relatively new and it was invented by Stern Stewart & Co. which
launched EVA in 1989 (it started to be implemented in U.S. in 1994) and is not as well
known as other measures of bank performance. It measures the difference between a
firm’s cost of capital and return on capital.11
These methods can be independently applied by various researchers in evaluating the
financial performance of the bank. But, no one of them is perfect to evaluate the financial
performance. Researchers can only choose a method to evaluate performance that has
the least amount of drawbacks for the study’s particular situation. Since the stock price
data and cost of capital for Ethiopia’s commercial banks are not easily available, the
accounting based financial ratios are used as a measure of financial performance in this
study.
2.1.2.1 Financial Statement Analysis
Financial statement analysis is the process of examining relationships among financial
statement elements and making comparisons with relevant information. It is a valuable
tool used by investors and creditors, financial analysts, and others in their decision-
making processes related to stocks, bonds, and other financial instruments.11
Financial statement analysis begins with establishing the objective(s) of the analysis. For
example, is the analysis undertaken to provide a basis for granting credit or making an
investment? After the objective of the analysis is established, the data is accumulated
from the financial statements and from other sources. The results of the analysis are
summarized and interpreted. Conclusions are reached and a report is made to the
person(s) for whom the analysis was undertaken.

20
The purpose of financial statement analysis is to examine past and current financial data
so that a company's performance and financial position can be evaluated and future
risks and potential can be estimated. Financial statement analysis can yield valuable
information about trends and relationships, the quality of a company's earnings, and the
strengths and weaknesses of its financial position.11 Therefore, companies are highly
required to publish their general annual audited financial statements
2.1.2.1.1 Types of financial statement analysis
Financial analysts can obtain useful information by comparing a company's audited
financial statements of one company with other. There are three primary types of
financial statement analysis. These are commonly known as horizontal analysis, vertical
analysis, and ratio analysis.12
I. Horizontal Analysis
When two or more years for a single company are compared, the process is known as
horizontal analysis. In this analysis, an analyst computes percentage changes from year
to year for all balances. When comparing financial statements for a number of years,
then variation of horizontal analysis called trend analysis may be preferred. Trend
analysis involves calculating each year's financial statement balances as percentages of
the first year, also known as the base year. When expressed as percentages, the base year
figures are always 100 percent, and percentage changes from the base year can be
determined.
II. Vertical Analysis
When using vertical analysis, the analyst calculates each item on a single financial
statement as a percentage of a total. The term vertical analysis applies because each
year's figures are listed vertically on a financial statement.

21
When using vertical analysis, an analyst reports each amount on income statement as a
percentage of total revenues, and similarly each amount of balance sheet as a percentage
of total assets. After the restated values, the balance sheet is known as common sized
balance sheet, it allows comparing it with another company’s statements or with
industry averages.
III. Ratio Analysis
Ratio analysis enables the analyst to compare items on a single financial statement or to
examine the relationships between items on two financial statements. After calculating
ratios, an analyst can examine the trends for the company with its past performance or
compare it with the industry benchmark.
2.1.2.1.2 Role of Financial Statement Analysis
Financial analysis today is performed by various users of financial statements. Investors
and Management perform the financial analysis to understand how profitably or
productively the assets of the company are used. Lenders and Suppliers of goods look
for the ability of the firm to repay the dues on time. For instance, as a deposit holder of a
Bank, you would be interested in liquidity of the Bank and would expect the Bank to
pay you the amount when you need. Customers would like to know the long-term
solvency of the Bank to get continued support. In addition, employees would be
interested in the profitability as well as liquidity of the bank.12
Financial statement analysis involves careful selection of data from financial statements
for the primary purpose of forecasting the financial health of the company. This is
accomplished by examining trends in key financial data, comparing financial data
across companies, and analyzing key financial ratios. The financial statements are
historical documents that tell what has happened during a particular period of time.
However most users of financial statements are concerned about what will happen in
the future. Despite the fact that financial statements are historical documents, they can

22
still provide valuable and economical information bearing on all of this concerns.12
Therefore, in this study the researcher applied ratio analysis to evaluate the financial
performance of the bank.
2.1.2.1.3 Limitation of Ratio Analysis
Ratio analysis is useful, but analysts should be aware of these problems and make
adjustments as necessary. Ratios analysis conducted in a mechanical, unthinking
manner is dangerous, but if used intelligently and with good judgment, it can provide
useful insights into the firm’s operations and the following are some of the limitations of
ratio analysis.12
A. Creative Accounting
The businesses apply creative accounting in trying to show the better financial
performance or position which can be misleading to the users of financial accounting.
B. Ratios are not Definitive Measures
Ratios need to be interpreted carefully. They can provide clues to the company’s
performance or financial situation. But on their own, they cannot show whether
performance is good or bad. Ratios require some quantitative information for an
informed analysis to be made.
C. Financial Statement contain Summarized Information
Ratios are based on financial statements which are summaries of the accounting records.
Through the summarization some important information may be left out which could
have been of relevance to the users of accounts. The ratios are based on the summarized
year end information which may not be a true reflection of the overall year’s results.
23
D. Interpretation of Ratios
It is difficult to generalize about whether a particular ratio is ‘good’ or ‘bad’. For
example a high current ratio may indicate a strong liquidity position, which is good or
excessive cash which is bad. Similarly non-current assets turnover ratio may denote
either a firm that uses its assets efficiently or one that is undercapitalized and cannot
afford to buy enough assets.
E. Price changes
Inflation renders comparisons of results over time misleading as financial figures will
not be within the same levels of purchasing power. Changes in results over time may
show as if the enterprise has improved its performance and position when in fact after
adjusting for inflationary changes it will show the different picture.
F. Window Dressing
These are techniques applied by an entity in order to show a strong financial position.
This can improve the current and quick ratios and make the balance sheet look good.
However the improvement was strictly window dressing as a week later the balance
sheet is at its old position. In general, an inexperienced analyst may assume that ratios
are sufficient in themselves as a basis for judgment about the future. Conclusions based
on ratio analysis must be regarded as tentative. Ratios should not be viewed as an end, but
rather they should be viewed as a starting point, as indicators of what to pursue in greater
depth. In addition to ratios, other sources of data should be analyzed in order to make
judgments about the future of an organization. Few figures appearing on financial
statements have much significance standing by themselves. It is the relationship of one
figure to another and the amount and direction of change over time that are important
in financial statement analysis.

24
2.1.3 Financial Analysis in Banking Industry
Unlike manufacturing industry, banks are trading on capital or funds. Hence some of
the ratios developed for manufacturing industry are not relevant to banks. While some
of the ratios are not relevant, there are ratios which require some modification. For
example, Interest expenses are minor for a manufacturing industry whereas for banking
industry, it is a major expense item.12
In addition, there are some items, which are difficult to measure. For instance, if you
want to measure liquidity, normally we compute current ratio, which requires current
assets and current liabilities. But this data is not apparently available in the financial
statements and one has to collect from the internal sources. To give an example, we need
to know the term structure of Term Deposit and similarly loans and advances to classify
whether they are current or not. Considering the special nature of banking industry, the
study uses the following financial ratios for measuring credit or loan, liquidity,
profitability, and growth of the Commercial Bank of Ethiopia.12
2.1.4 Types of Financial Ratios Analysis
2.1.4.1 Credit Quality/Loan Performance
One of the most important sources of income for commercial bank is issuing of loans.
However, when a commercial bank makes loans, it is exposed to risks, because banks
operate in asymmetric information. The principal risk it faces is the risk of defaulting
interest payment or the principal or both interest and loans. Thus, loan performance
measures bank's risk associated with loans created by bank. In other words, it measures
the quality of loans. Some loans default some do not. The greater is the amount of loan
and interest in default, the higher is a risk for a bank, and the bank is rated poor. There
are several financial measures for assessing the quality of loans (or credit risk) for
commercial banks. However, in this study the researcher uses the following three
indexes:

25
A. Equity to Asset Ratio (EQTA)
It measures equity capital as a percentage of total assets. EQTA provides percentage
protection afforded by banks to its investment in asset. It measures the overall shock
absorbing capacity of a bank for potential loan asset losses. The higher the ratio of
EQTA, the greater is the capacity for a bank to sustain the assets losses.
This figure is determined as follows: EQTA = Common Equity/Assets
B. Equity to Loan Ratio (EQL)
It measures equity capital as a percentage of total loans. EQL provides equity as a
cushion (protection) available to absorb loan losses. The higher the ratio of EQL, the
higher is the capacity for a bank in absorbing loan losses.
This figure is determined as follows: EQL = Total Equity/Total Loans
C. Non- performing Loans to Total Loan Ratio (NPTL)
It is one of the most important criteria to assess the quality of loans or asset of a
commercial bank. It measures the percentage of gross loans which are doubtful in
banks’ portfolio. The lower the ratio of NPTL, the better is the asset/credit/
performance of the commercial banks.
This figure is determined as follows: NPTL = Non-performing Loans/Total Loans
2.1.4.2 Liquidity Performance
Liquidity ratios attempt to measure a company's ability to pay off its short-term debt
obligations. This is done by comparing a company's most liquid assets to short-term
liabilities. The higher liquidity ratios mean bank has larger margin of safety and ability
to cover its short-term obligations

26
So, commercial banks must hold sufficient liquidity. Liquidity means cash, or how quickly a
bank can convert its assets into cash at face value to meet the cash demand of the depositors
and borrowers. There are various financial ratios for measuring liquidity performance.
Thus, the researcher selects the following three financial ratios:
A. Total loans to Total Asset Ratio (TLTA)
The loan to assets ratio measures the total loans outstanding as a percentage of total
assets. The higher this ratio indicates a bank is loaned up and its liquidity is low. The
higher the ratio, the more risky a bank may be to higher defaults.
This figure is determined as follows: TLTA = Total Loans/Total Assets
B. Liquid Assets to Total Deposit Ratio (LATD)
It is a deposit run off ratio. It indicates the percentage of deposit and short term funds
that are available to meet the sudden withdrawals. The higher the LATD, the more
liquid is a commercial bank and less vulnerable it is to run the bank.
This figure is determined as follows: LATD = Liquid Asset/Customer Deposit
C. Total Loans to Deposit Ratio (TLTD)
This refers to the amount of a bank's loans divided by the amount of its deposits at any
given time. The higher the ratio, the more the bank is relying on borrowed funds, which
are generally more costly than most types of deposits. Bank with low LDR is considered
to have excessive liquidity, potentially lower profits, and hence less risk as compared to
the bank with high LDR.
It is calculated as: TLTD = Total Loans/Total Deposit
It indicates the percentage of the total deposit locked into non-liquid asset. The higher
the TLTD, the higher is the liquidity risk.

27
2.1.4.3 Profitability Performance
One of the most frequently used tools of financial ratio analysis is profitability ratios
which are used to determine the company's bottom line. Profitability ratios show a
company's overall efficiency and performance. We can divide profitability ratios into
two types: margins and returns. Ratios that show margins represent the firm's ability to
translate sales dollars into profits at various stages of measurement. Ratios that show
returns represent the firm's ability to measure the overall efficiency of the firm in
generating returns for its shareholders. In general, profitability performance is also
known as managerial performance. It indicates how the top management of a bank
maximizes shareholders' profits by utilizing existing resources at their disposal. There
are several indexes for measuring profitability performance of a firm. However, in this
study the researcher uses the three most commonly used measures. They are:
A. Return on Assets (ROA)
The Return on Assets ratio is an important profitability ratio because it measures the
efficiency with which the company is managing its investment in assets and using them
to generate profit. It measures the amount of profit earned relative to the firm's level of
investment in total assets. Net profit is taken from the income statement and total assets
are taken from the balance sheet. The higher the percentage, the better it will be, because
that means the company is doing a good job using its assets to generate sales.
The calculation for the return on assets ratio is: ROA = Net Profit/Total Assets
B. Return on Equity (ROE)
The Return on Equity ratio is perhaps the most important of all the financial ratios to
investors in the company. It measures the return on the money the investors have put
into the company. This is the ratio potential investors look at when deciding whether or
not to invest in the company. Net income comes from the income statement and

28
stockholder's equity comes from the balance sheet. In general, the higher the percentage,
the better it will be, with some exceptions, as it shows that the company is doing a good
job using the investors' money. In general, it shows a rate of return on base capital, i.e.
equity capital. The higher the ROE, the more efficient is the performance.
The calculation for the return on equity ratio is: ROE = Net Profits/Equity
C. Net Interest Margin (NIM)
Net interest income is the difference between interest income and interest expense. It is
the gross margin on a bank’s lending and investment activities. Analysts focus on Net
Interest Margin (NIM) ratio because small changes in a bank’s lending margin can
translate into large bottom line changes. The higher the ratio the cheaper the funding or
the higher the margin the bank is obtaining. A bank’s net interest margin is a key
performance measure that drives ROA. Net interest income is the difference between
interest income and interest expense. It is the gross margin on a bank’s lending and
investment activities.
It is calculated as: NIM=interest income – interest expense
2.1.4.4 Growth in Net Profit, Capital, Deposit and loans
It measures the change in net profit, capital, deposit and loans in consecutive years of
commercial banks.
2.2 Empirical Evidence
There are a number of studies that evaluate the performance of commercial bank and
financial liberalization. Therefore, reviews of these various studies were presented as
follows.
The performance of 515 banks in 16 transition economies for the period 1994–1999 was
conducted to know the effect of reform environment in the bank performance. Their

29
results indicate that banks’ performance differs significantly depending on the reform
environment, as well as the competitive conditions in which they operate. Their research
also reveals that interest margins are declining over time but are substantially higher in
low- reform environments. The results indicate that an appropriate policy and
regulatory framework are the necessary conditions for achieving any significant
progress.13
The estimation of Fourier-flexible frontier cost function using bank balance sheet data
were conducted for the period covering the year of 1994-2000. Specification tests
indicated that the stochastic frontier model with a Fourier-flexible form with a truncated
normal distribution of the inefficiency term allowing for time varying technical
efficiency was preferred. Privatization also didn’t seem to have an immediate effect on
improved efficiency. Finally, foreign banks had substantially better efficiency scores
than all categories of domestic banks.14
Other study has made on a review of the performance of banking sector in India during
post reform period. A comparative appraisal of banks have been undertaken on the
basis of seven indicators of performance namely, Net profit , Credit to deposit ratio
(C/D) , Market Share, Business per Employee, Return on Assets, Capital Adequacy
Ratio and Non performing Asset to Net Advances. The paper reveals that public sector
banks have improved considerably and their performance was comparable with other
banks.15
The performance of Bahrain’s commercial banks with respect to credit (loan), liquidity
and profitability during the period 1994-2001 was conducted in Bahrain’s. Nine financial
ratios (Return on Asset, Return on Equity, Cost to Revenue, Net Loans to Total Asset,
Net Loans to Deposit, Liquid Asset to Deposit, Equity to Asset, Equity to Loan and
Nonperforming loans to Gross Loan) were selected for measuring credit, liquidity and
profitability performances. Finally the study found that Commercial banks are relatively

30
less profitable and less liquid and, are exposed to risk as compared to banking
industry.10
In recent research efforts the profitability determinants in six European banking sectors
(Denmark, France, Germany, Italy, Spain and the UK) were conducted for the period
1992–1998. Their results suggest that despite intensifying competition it was possible to
detect significant persistence of abnormal bank profits from year to year. Apart from
that they discovered a positive relationship between the ROA and profitability and at
same time ROE and profitability. Therefore, both the ROA and ROE are used for vital
indicator for profitability performance of banking industry.16
A study on commercial banks of Oman was conducted to know the performance of the
bank. The objective of this study was to classify the commercial banks in Oman in
cohesive categories on the basis of their financial characteristics revealed by the financial
ratios (Return on Asset, Return on Equity and Return on Deposit). A total of five Omani
commercial banks with more than 260 branches were financially analyzed, and simple
regression was used to estimate the impact of asset management, operational efficiency,
and bank size on the financial performance of these banks. The study found that the
bank with higher total capital, deposits, credits, or total assets does not always mean
that it has better profitability performance.17
There is a substantial body of literature discussing different research methods applied to
financial performance evaluation. These methods include: Multivariate Statistical
Analysis18, Data Envelopment Analysis19, Balanced Scorecard20, and Financial Statement
Analysis21. These methods can be independently applied by various researchers in
evaluating the financial performance of the bank. But, no one of them is perfect to
evaluate the financial performance. Researchers can only choose a method to evaluate
performance that has the least amount of drawbacks for the study’s particular situation.
Therefore, a viable method for effective evaluation of financial performance is aimed at
providing solutions for issues with multiple variables and targets.

31
An analysis on performance of Poland banks was conducted to observe the efficiency of
the bank under DEA. The main aim of his article was to present the results of efficiency
analysis, computed by means of two methods, that is the classical index of balance sheet
characteristics (financial analysis) and the non-parametric, the Data Envelopment
Analysis (DEA) method. The analysis was carried out in the biggest banks operating in
Poland in 2000–2007. The empirical results showed that the efficiency measures give a
similar although not identical picture of Polish commercial banks’ performance. These
results (yielded by both methods) were complementary to each other and suggested that
the non-parametric DEA method is really valuable and worth applying in bank
practice.22
Most of the above empirical studies were conducted to measure financial performance
of various countries’ banks using financial ratios. Regarding to studies in the Ethiopian
banking sector, no formal studies evaluate the performance of commercial bank of
Ethiopian before and after the financial liberalization. But, there is one study conducted
in analyzing the Ethiopia’s financial sector and its regulation and stated that the
financial reform measures undertaken in Ethiopia have been gradual but nevertheless
determined despite disagreement with the IMF over restrictions on the entry of foreign
banks and the role of the largest state bank. Finally the study concludes that the creation
of a sound financial system is crucial to reconstruction and transition to market based
economy, and to raising the living standards of Ethiopia’s people.23
The researcher also observed in the review of literature that there are no studies
conducted mainly to identify the problems related to profitability, liquidity, credit
quality and change in growth of Commercial Bank of Ethiopia in the pre and post
reform period. Thus , the researcher felt it appropriate to take up the present study
entitled “Performance Evaluation of the Commercial Bank of Ethiopia – Pre and Post
Liberalization” to assess the efficiency of the performance of financial management
thereby to identify problems and thereby to recommend possible courses of actions to
the identified problems.

32
Reference
1See Agenor, P. and P. Montiel, Development Macroeconomics, Chapters 5 and 14, Princeton
University Press, 1996.
2McKinnon, R. The Order of Economic Liberalization: Financial Control in the Transition to a
Market Economy, 2nd edition, The Johns Hopkins Studies in Economic Development, 1993.
3Mckinnon, R.I. Money and Capital in Economic Development, Washington, D.C., the
Brookings Institution, 1973.
4Shaw, E. Financial Deepening in Economic Development, New York: Oxford University Press,
1973.
5See Seck, D., and Y. H. El Nil (1993) Financial Liberalization in Africa, World
Development, Vol. 21, No. 11, pp. 1867–81.
6Gibson, H. D. and E. Tsakalotos. (1994) “The Scope and Limits of Financial Liberalization in
Developing Countries: A Critical Survey,” Journal of Development Studies, Vol. 30, No. 3, pp.
578–628.
7Diaz-Alejandro, C. “Goodbye Financial Repression, Hello Financial Crash.” Journal of
Development Economics, 19, 1985:1–24
8Aryeetey, E., H. Hettige, M. Nissanke and W. Steel. 1997. “Financial market fragmentation and
reforms in Ghana, Malawi, Nigeria and Tanzania”. The World Bank Economic Review, 11 (2):
195-218
9Wozniewska, G. (2008), Methods of measuring the efficiency of commercial banks: an example of
polish banks. Retrieved on April 3, 20010 form http://www. Leidykla.eu/fileadmin/Ekonomika.
10see Abdus, S. (2004). Bahrain’s Commercial Bank Performances during 1994-2001. Credit and
financial Management Review. Retrieved on April 9, 2010 from www.encyclopedia.
Com/doc/1p3-810427301.html.
11See Popa, G. & Mihailescu, L. (2009). EVA-Advanced Method of Performance Evaluation in
Banks. Retrieve on November 02, 2009 from http://www.management.ase.ro /revconomia/
12Vance, D.I. (2003), Financial Analysis and Decision Making: Tools and Techniques to Solve
Financial Problems and Make Effective Business Decisions. S.l: MacGraw-Hill.

33
13Levine, R. 2000. A study of the performance of 515 banks in 16 transition economies for the
period 1994–1999. Financial econometric, 54,138.
14See Kraft, E. Hofler, R. & Payne, J. (2002). Privatization, Foreign Bank Entry and Bank
Efficiency in Croatia: A Fourier-Flexible Function Stochastic Cost Frontier Analysis. Retrieved
from http://www.informaworld.com
15Bateswar, S. & Ajay, D. (2007). Banking sector reforms and performance of Indian Banking: A
comparative analysis of public, private and foreign banks. Journal of Management practices, 1(1).
16Goddard J., Molyneux P. and Wilson J. O. S. (2004) “The Profitability of European Banks: A
Cross-Sectional and Dynamic Panel Analysis”, the Manchester School, Vol. 72, No. 3. pp. 363-
381
17See Tarawneh, M. (2006). A Comparison of Financial Performance in the Banking Sector:
Some Evidence from Omani Commercial Banks. International Research Journal of Finance and
Economics, ISSN. Retrieved on April 4, 2010 from http://www.eurojournals.com/finance.htm
18See Huang, M.C. (1986). A Study of Domestic Bank’s Performance. Basic Finance Publication.
Retrieved from http://www.emeraldinsight.com/Insight.
19Lin, C. (1998). A study of efficiency evaluation in Taiwan’s securities dealers. Securities
Finance, 58, 124
20Maisel, L.S. (1992). Performance measurement: the balanced scorecard approach. Journal of
Cost Management, 2(2), 47-52.
21Collins, R.A. (1980). An empirical comparison of bankruptcy prediction model, Journal of
Financial Management, 9(2), 5-7.
22See Wozniewska, G. (2008), Methods of measuring the efficiency of commercial banks: an
example of polish banks. Retrieved on April 3, 20010 form http://www.
Leidykla.eu/fileadmin/Ekonomika.
23Tony Addison and Alemayehu Geda, (2001). Ethiopia are New Financial Sector and Its
Regulation, Discussion Paper No. 2001/55. Retrieved on April 9, 2010 from http://www.social
science research network.com

34
CHAPTERT III ORGANIZATIONAL PROFILE
This chapter presents the history of banking in Ethiopia, financial sector reform and
profile of the commercial bank of Ethiopia.
3.1 History of Banking in Ethiopia
The history of the use of modern money in Ethiopia can be traced back more than 2000
years. It flourished in what is called the Axumite era which ran from 1000 BC to around
AD 975. Leaving that long history aside, modern banking in Ethiopia started in 1905
with the establishment of Abyssinian Bank which was based on a fifty year agreement
with the Anglo-Egyptian National Bank The agreement that was reached in 1905
between Emperor Minilik II and Mr.Ma Gillivray, representative of the British owned
National Bank of Egypt marked the introduction of modern banking in Ethiopia.
Following the agreement, the first bank called Bank of Abyssinia was inaugurated in
Feb.16, 1906 by the Emperor. The Bank was totally managed by the Egyptian National
Bank and the following rights and concessions were agreed upon the establishment of
Bank of Abyssinia.
Within the first fifteen years of its operation, Bank of Abyssinia opened branches in
different areas of the country. In 1906 a branch in Harar (Eastern Ethiopia) was opened
at the same time of the inauguration of Bank of Abysinia in Addis Ababa. Another at
Dire Dawa was opened two years later and at Gore in 1912 and at Dessie and Djibouti in
1920. Mac Gillivray, the then representative and negotiator of Bank of Egypt, was
appointed to be the governor of the new bank and he was suceeded by H Goldie, Miles
Backhouse, and CS Collier were in change from 1919 until the Bank’s liquidation in
1931.
35
The society at that time being new for the banking service, Bank of Abysinia had faced
difficulty of familiarizing the public with it. It had also need to meet considerable cost of
installation and the costly journeys by its administrative personnel. As a result, despite
its monopolistic position, the Bank earned no profit until 1914. Profits were recorded in
1919, 1920 and from 1924 onwards.
Generally, in its short period of existence, Bank of Abyssinia had been carrying out
limited business such as keeping government accounts, some export financing and
undertaking various tasks for the government. Moreover, the Bank faced enormous
pressure for being inefficient and purely profit motivated and reached an agreement to
abandon its operation and be liquidated in order to disengage banking from foreign
control and to make the institution responsible to Ethiopia’s credit needs. Thus by 1931
Bank of Abyssinia was legally replaced by Bank of Ethiopia shortly after Emperor Haile
Selassie came to power.
The new Bank, Bank of Ethiopia, was a purely Ethiopian institution and was the first
indigenous bank in Africa and established by an official decree on August 29, 1931 with
capital of £750,000. Bank of Egypt was willing to abandon its on cessionary rights in
return for a payment of Pound Sterling 40,000 and the transfer of ownership took place
very smoothly and the offices and personnel of the Bank Of Abyssinia including its
manager, Mr. Collier, being retained by the new Bank. Ethiopian government owned 60
percent of the total shares of the Bank and all transactions were subject to scrutiny by its
Minister of Finance.
Bank of Ethiopia took over the commercial activities of the Bank of Abysinia and was
authorized to issue notes and coins. The Bank with branches in Dire Dawa, Gore, Dessie,
Debre Tabor, Harar, agency in Gambella and a transit office in Djibouti continued
successfully until the Italian invasion in 1935. During the invasion, the Italians
established branches of their main Banks namely Banca d’Italia, Banco di Roma, Banco
di Napoli and Banca Nazionale del lavoro and started operation in the main towns of

36
Ethiopia. However, they all ceased operation soon after liberation except Banco di Roma
and Banco di Napoli which remained in Asmara. In 1941 another foreign bank, Barclays
Bank, came to Ethiopia with the British troops and organized banking services in Addis
Ababa, until its withdrawal in 1943. Then on 15th April 1943, the State Bank of Ethiopia
commenced full operation after 8 months of preparatory activities. It acted as the central
Bank of Ethiopia and had a power to issue bank notes and coins as the agent of the
Ministry of Finance. In 1945 and 1949 the Bank was granted the sole right of issuing
currency and deal in foreign currency. The Bank also functioned as the principal
commercial bank in the country and engaged in all commercial banking activities.
The State Bank of Ethiopia had established 21 branches including a branch in Khartoum,
Sudan and a transit office on Djibouti until it eased to exist by bank proclamation issued
on December, 1963. Then the Ethiopian Monetary and Banking law that came into force
in 1963 separated the function of commercial and central banking creating National
Bank of Ethiopia and commercial Bank of Ethiopia. Moreover it allowed foreign banks
to operate in Ethiopia limiting their maximum ownership to be 49 percent while the
remaining balance should be owned by Ethiopians.
The National Bank of Ethiopia with more power and duties started its operation in
January 1964. Following the incorporation as a share company on December 16, 1963 as
per proclamation No.207/1955 of October 1963, Commercial Bank of Ethiopia took over
the commercial banking activities of the former State Bank of Ethiopia. It started
operation on January 1, 964 with a capital of Eth. Birr 20 million. In the new Commercial
Bank of Ethiopia, in contrast with the former State Bank of Ethiopia, all employees were
Ethiopians.
There were two other banks in operation namely Banco di Roma S. and Bank o di
Napoli S.C. that later reapplied for license according to the new proclamation each
having a paid up capital of Eth. Birr 2 million.

37
The first privately owned bank, Addis Ababa Bank Share Company, was established on
Ethiopians initiative and started operation in 1964 with a capital of 2 million in
association with National and Grindlay Bank, London which had 40 percent of the total
share. In 1968, the original capital of the Bank rose to 5.0 million and until it ceased
operation, it had 300 staff at 26 branches.
There were other financial institutions operating in the country like the Imperial Savings
and Home Ownership public Association (ISHOPA) which specialized in providing
loans for the construction of residential houses and to individuals under the guarantee
of their savings. There was also the Saving and Mortgage Corporation of Ethiopia
whose aims and duties were to accept savings and trust deposits account and provide
loans for the construction, repair and improvement of residential houses, commercial
and industrial buildings and carry out all activities related to mortgage operations. On
the other hand, there was a bank called Agricultural Bank that provides loan for the
agricultural and other relevant projects established in 1945. But in 1951 the Investment
Bank of Ethiopia replaced it. In 1965, the name of the bank once again hanged to
Ethiopian Investment Corporation Share Company and the capital rose to Eth. Birr 20
million, which was fully paid up. However, proclamation No.55 of 1970 established the
Agricultural and Industrial Development Bank Share Company by taking over the asset
and liability of the former Development Bank and Investment Corporation of Ethiopia.
Following the declaration of socialism in 1974 the government extended its control over
the whole economy and nationalized all large corporations. Organizational setups were
taken in order to create stronger institutions by merging those that perform similar
functions. Accordingly, the three private owned banks, Addis Ababa Bank, Banco di
Roma and Banco di Napoli Merged in 1976 to form the second largest Bank in Ethiopia
called Addis Bank with a capital of Eth. birr 20 million and had a staff of 480 and 34
branches. Before the merger, the foreign participation of these banks was first
nationalized in early 1975. Then Addis Bank and Commercial Bank of Ethiopia S.C.
were merged by proclamation No.184 of August 2, 1980 to form the sole commercial

38
bank in the country till the establishment of private commercial banks in 1994. The
Commercial Bank of Ethiopia commenced its operation with a capital of Birr 65 million,
128 branches and 3,633 employees. The Savings and Mortgage Corporation S. and
Imperial Saving and Home Ownership Public Association were also merged to form the
Housing and Saving Bank with working capital of Birr 6.0 million and all rights,
privileges, assets and liabilities were transferred by proclamation No.60, 1975 to the new
bank.
Proclamation No.99 of 1976 brought into existence the Agricultural and Industrial Bank,
which was formed in 1970 as a 100 percent state ownership, was brought under the
umbrella of the National Bank of Ethiopia. Then it was reestablished by proclamation
No. 158 of 1979 as a public finance agency possessing judicial personality and named
Agricultural and Industrial Development Bank (AIDB). It was entrusted with the
financing of the economic development of the agricultural, industrial and other sectors
of the national economy extending credits of medium and long-term nature as well as
short-term agricultural production loans. The financial sector in the socialist oriented
government left behind constituted only three banks and each enjoying monopoly in its
respective market. The NBE, CBE and Agricultural and Industrial development Bank
was the structure of the sector at the end of the era.
Following the demise of the Dergue regime in 1991 that ruled the country for 17 years
under the rule of command economy, the EPRDF declared a liberal economy system. In
line with this, Monetary and Banking proclamation of 1994 established the national
bank of Ethiopia as a judicial entity, separated from the government and outlined its
main function. Monetary and Banking proclamation No.83/1994 and the Licensing and
Supervision of Banking Business No.84/1994 laid down the legal basis for investment in
the banking sector.
Since economic reform of 1992 under the new government, the existing government
banks have been re-organized so as to operate based on market-oriented policy

39
framework but with 100% ownership of the government. Moreover, new Ethiopian
private-owned financial institutions are allowed to participate in the country’s financial
sector. However, from the time of nationalization onwards (or since 1974), no foreign
bank has been allowed to operate in Ethiopia and participation of the private sector to
the ownership of government banks has been prohibited. Shortly afterwards, privately
owned banks such as Awash International Bank (1994), Dashen Bank (1995), Bank of
Abyssinia (1995), Wegagen Bank (1997), United Bank (1998), Nib International Bank
(1999), cooperative Bank of Oromia (2004), Lion International Bank (2007), Oromia
International Bank (2008), Buna International Bank (2008), Birehan International Bank
(2009), and Zement Bank (2009) were established and operating in the country. During
the year 2009/10, six additional private banks, Enat Bank, Debub Global Bank, Zemzem
Bank, Addis Cooperative Bank, Hawassa Bank and Abay Bank, have got its license.
Therefore, with the establishment of the above six banks the number of the private bank
in the country has reached eighteen.
3.2. Financial Sector Reform
Economic liberalization began just before the fall of the Derg regime. However, with the
initiation of the economic reform program of the current government, two
proclamations were issued in 1994, Monetary and Banking Proclamation (No. 83/1994),
and the Licensing and Supervision of Banking Business (No. 84/1994) and one
proclamation were issued in 2008, a proclamation to amend the national bank of
Ethiopia establishment (No. 591/2008). The first proclamation in addition to increasing
the role of the National Bank of Ethiopia made illegal any NBE lending other than the
government while the second proclamation empowered the Central Bank to supervise
the financial institutions. Besides, the third proclamation adds additional power to the
NBE for controlling the financial institution and the sole agent for the government with
regard to the foreign exchange reserve. Moreover, two further proclamations, 200/1994
and 203/1994 restructured and renamed the Agricultural and Industrial Bank, and
Housing and Saving Bank into Development Bank of Ethiopia and Construction and

40
Saving Bank of Ethiopia, respectively. It was also noted in the proclamations that the
two banks were recapitalized as public enterprises and hence, the financial sector reform
did not invite private sector participation in the current government owned banks else
entry of foreign banks in full share as well as with restricted share as partners with
Ethiopian citizens.
After the 1994 financial liberalization measures, the authorities concentrated their efforts
on building capacity in the financial sector as well as on other priority areas of economic
transition, in particular further liberalization of the foreign exchange system and trade
liberalization measures. In addition with such institutional arrangement of the financial
sector, sequence of policy measures, which include interest rate and exchange rate
reforms among others were undertaken. But financial liberalization accelerated again
when the lending rate was decontrolled and left to be determined by the banks
themselves as late as January 1998 as compared to October 1992 when the bias between
public and private charging of deposit rate was abolished. In all the reform period a
positive lending interest rate was recorded except in 2002/03, which was markedly
known as sever draught year. However, the floor for saving deposit rate was set at 3.0
percent commencing the year 2002; this resulted in a negative real deposit interest rate
to be recorded triggered by the increasing inflationary pressure. The financial sector
liberalization was also strengthened by reform on financial instruments which includes
devaluation of exchange rate, introduction of Treasury bills, inter-bank foreign exchange
market and others. In addition, a framework for an interbank money market, in which
banks and non-bank financial institutions can borrow and lend at market determined
rates, has been laid down.
3.3. Commercial Bank of Ethiopia (CBE)
The state bank of Ethiopia was founded in 1942 with twin objectives; performing the
duties of both commercial and central banking. In 1963, the commercial bank of Ethiopia
was legally established as Share Company to take over the commercial banking

41
activities of the state bank of Ethiopia. In the 1974 revolution, commercial bank of
Ethiopia got its strength by merging with privately owned Addis Ababa bank. Since
then, it has been playing significant role in the development endeavor of the country.
The commercial Bank of Ethiopia which is striving to embark into a world class bank is
rendering state of the art and reliable services to its millions of customers both locally
and abroad. The business strategies of the bank focus on the stakeholder it serves. The
state owned commercial bank of Ethiopia, still dominant’s the market in terms of assets,
deposits, and capital and customer base and branch network, despite the growing
completion from private banks over the last 15 years. This makes it one of the most
reliable and strong commercial bank, both in the country and region.
Its strong capital base, above 68 years of rich experience in the market and having 211
branch networks throughout the country enabled the bank to accommodate large
demands for banking services, both from private and public companies, and to increase
its overall revenue on a sustainable basis. In addition the bank had two branches in
Djibouti and in Juba, Southern Sudan which ceased operation recently.
The first Commercial Bank of Ethiopia head office
42
CHAPTER IV
DATA ANALYSIS & INTERPRITATION
Unsurprisingly, the significance of evaluating the financial performance of the
commercial bank has become a prominent issue for banks in today’s competitive
business arena. Many researchers have applied different financial performance
measures to evaluate the performance of the commercial banks. By using this financial
performance measures, the performance of the commercial banks can be computed and
so that the financial performance of the bank can be determined and compared.
In this study, a different financial ratio was used by the researcher to evaluate the
financial performance of the bank. In addition, the researcher applied structured
designed questionnaire in the study together with the secondary data.
This study evaluates the performance of the commercial bank of Ethiopia in the pre and
post liberalization. Hence, the chapter is organized based on two main subsections. The
first part of the chapter is devoted to analyze and interpret data obtained from
secondary sources while the second part of the chapter analyzed the data gathered
through questionnaire.
4.1 Data from Secondary Sources
A bank’s balance sheet and income statement are valuable information sources for
identifying risk taking and assessing risk management effectiveness. Although the
amounts found on these statements provide valuable insights into the performance and
condition of a bank, financial analysts, bankers and bank supervisors typically use data
from them to develop financial ratios to evaluate bank performance. This is done to
provide perspective and facilitate making comparisons. There are literally hundreds of
useful financial ratios can be applied to evaluate bank’s performance. However, in most

43
instances, researchers only need a few basic ratios to identify fundamental performance
issues and help them formulate questions regarding any underlying problems and
asking management’s plans for correcting them.
Thus, this section discussed some selected ratios from various perspectives study using
tables. It gives an explanation on the major findings. Each financial performance
indicator (financial ratio) and is presented independently in a table. The researcher
computes and compares the average of the financial ratios of the bank in the pre and
post liberalization within the study. Besides in this chapter the hypothesis test were
performed to know the significance gap between the financial performance of the bank
in the pre and post liberalization.
4.1.1 Credit quality Performance
It is clear that the major sources of income for commercial banks is issuing of loans. But,
when the banks make loans, it is exposed to risks, because banks operate in asymmetric
information. The prominent risk that the bank faces is the risk of defaulting interest
payment or the principal or both interest and loans. Thus, loan performance measures
bank's risk associated with loans created by bank. In other words, it measures the
quality of loans. The greater is the amount of loan and interest in default, the higher is
the risk for a bank, and the bank is going to be rated as poor. The following three
financial measures are used in the study for measuring the credit quality performance of
the CBE.

44
A. Equity to Total Asset Ratio (EQTA)
Table 4.1 Equity to Total Asset Ratio (%)
EQTA of CBE before the reform period(1976 to 1992)
Average
Year
1976
1977
1978
1979
1980
1981
1982
1983
1984
1985
1886
1987
1988
1989
1990
1991
1992
EQTA
5.10
4.91
4.24
3.74
3.56
3.63
3.56
3.53
3.29
3.01
2.49
2.37
2.20
2.12
2.02
1.94
1.71
3.12
5317
EQTA of CBE after the reform period(1993 to 2009)
Average
year
1993
1994
1995
1996
1997
1998
1999
2000
2001
2002
2003
2004
2005
2006
2007
2008
2009
EQTA
1.15
2.07
2.56
3.99
5.69
5.89
5.96
6.11
5.56
3.72
5.54
5.18
4.31
4.21
9.71
9.04
8.48
5.24
53
Source: researcher own computation from the financial statement
Table 4.1 shows the EQTA ratio of the CBE in the pre and post reform period. EQTA
measures equity capital as a percentage of total assets. It provides percentage protection
afforded by banks to their investment in asset. It measures the overall shock absorbing
capacity of a bank for potential loan asset losses. The higher the ratio of EQTA, the
greater is the capacity for a bank to sustain the assets losses. Besides (Abdus, 2004 and
Bateswar and Ajay, 2007) have used this ratio for measuring the credit quality
performance of a bank in their study.
As it can be seen from the above table the trends of EQTA have decreased from (5.10
percent) to 1.71 percent in the pre reform period and increased from (1.15 percent) to
8.48 percent in the post reform period. The reason for trends of the ratio increased
during the post reform period is the effect of liberalization. In addition, the table shows
that the average of EQTA ratio (5.2453) after the reform period exceeded the average of
EQTA ratio (3.125317) before the reform period. This further shows that the
liberalization has brought a significant change in the bank with regard to credit quality

45
performance. Thus, the bank has the greater capacity to sustain the assets losses in the
post reform period than before.
B. Equity to Loan Ratio (EQL)
Table 4.2 Equity to Loan Ratio (%)
EQL of CBE before the reform period(1976 to 1992)
Average
Year
1976
1977
1978
1979
1980
1981
1982
1983
1984
1985
1886
1987
1988
1989
1990
1991
1992
EQL
16.25
12.68
9.98
7.27
9.76
9.22
9.76
11.49
12.56
13.71
13.88
12.44
9.66
10.20
11.22
12.37
10.63
11.357
6
EQL of CBE after the reform period(1993 to 2009)
Average
year
1993
1994
1995
1996
1997
1998
1999
2000
2001
2002
2003
2004
2005
2006
2007
2008
2009
EQL
4.73
8.14
8.19
9.89
13.17
13.49
13.36
14.48
15.17
11.20
22.39
22.96
18.48
19.68
50.42
28.02
24.89
17.568
2
Source: researcher own computation from the financial statement
Table 4.2 illustrates EQL ratio of the bank in the pre and post reform period. EQL
measures equity capital as a percentage of total loans. It provides equity as a cushion
(protection) available to absorb loan losses. The higher the ratio of EQL, the higher is the
capacity for a bank in absorbing loan losses. Besides (Abdus, 2004 and Bateswar and
Ajay, 2007) have used this ratio for measuring credit quality performance of a bank in
their study.
The above table portrayed that, the trends of EQL ratio of the bank decreased from
(16.25 percent) to 10.63 percent and increased from (4.73 percent) to 24.89 percent in the
post reform period. In addition the average of EQL ratio (17.5682) after the reform
period exceeded the average of EQL ratio (11.3576) before the reform period. This
clearly shows that the liberalization and reform measures improved the credit quality
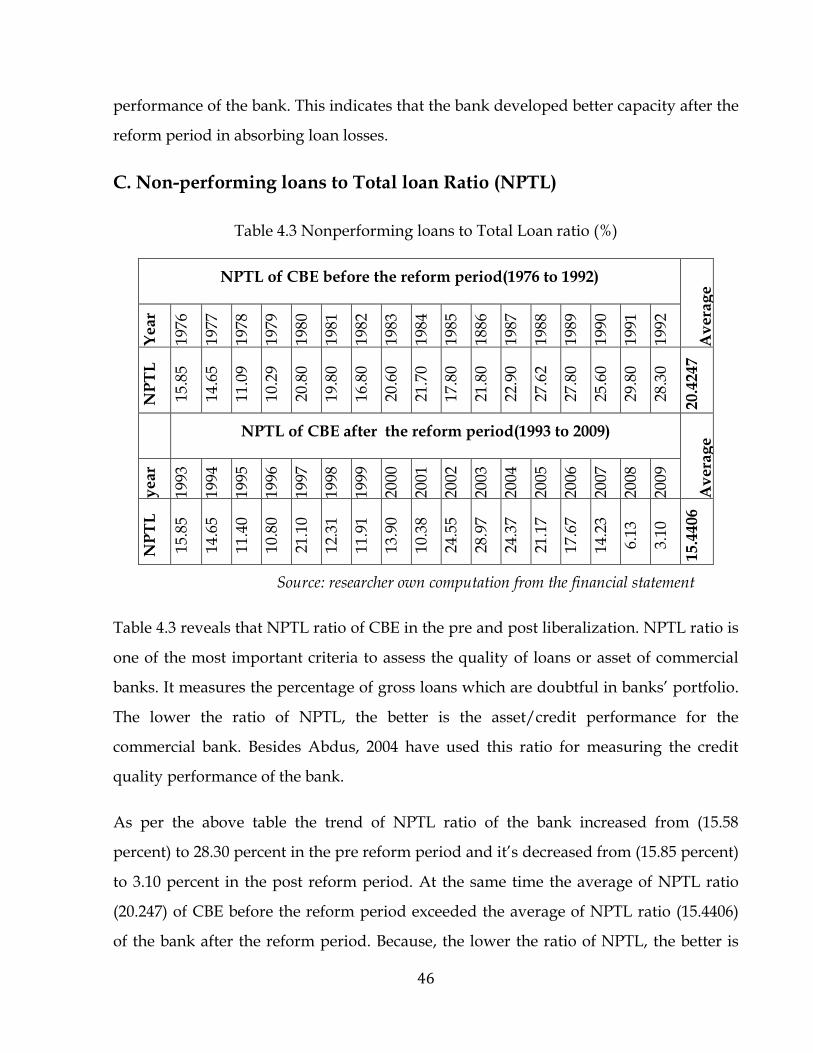
46
performance of the bank. This indicates that the bank developed better capacity after the
reform period in absorbing loan losses.
C. Non-performing loans to Total loan Ratio (NPTL)
Table 4.3 Nonperforming loans to Total Loan ratio (%)
NPTL of CBE before the reform period(1976 to 1992)
Average
Year
1976
1977
1978
1979
1980
1981
1982
1983
1984
1985
1886
1987
1988
1989
1990
1991
1992
NPTL
15.85
14.65
11.09
10.29
20.80
19.80
16.80
20.60
21.70
17.80
21.80
22.90
27.62
27.80
25.60
29.80
28.30
20.4247
NPTL of CBE after the reform period(1993 to 2009)
Average
year
1993
1994
1995
1996
1997
1998
1999
2000
2001
2002
2003
2004
2005
2006
2007
2008
2009
NPTL
15.85
14.65
11.40
10.80
21.10
12.31
11.91
13.90
10.38
24.55
28.97
24.37
21.17
17.67
14.23
6.13
3.10
15.4406
Source: researcher own computation from the financial statement
Table 4.3 reveals that NPTL ratio of CBE in the pre and post liberalization. NPTL ratio is
one of the most important criteria to assess the quality of loans or asset of commercial
banks. It measures the percentage of gross loans which are doubtful in banks’ portfolio.
The lower the ratio of NPTL, the better is the asset/credit performance for the
commercial bank. Besides Abdus, 2004 have used this ratio for measuring the credit
quality performance of the bank.
As per the above table the trend of NPTL ratio of the bank increased from (15.58
percent) to 28.30 percent in the pre reform period and it’s decreased from (15.85 percent)
to 3.10 percent in the post reform period. At the same time the average of NPTL ratio
(20.247) of CBE before the reform period exceeded the average of NPTL ratio (15.4406)
of the bank after the reform period. Because, the lower the ratio of NPTL, the better is

47
the asset/credit performance. This signifies the liberalization help the bank in building
a better asset/credit quality performance after the reform period.
4.1.2 Liquidity Performance
Liquidity means cash, or how quickly a bank can convert its assets into cash at face
value to meet the cash demand of the depositors and borrowers. Liquidity is the life for
a commercial bank. As a depository institution commercial bank must meet its depositor
claims on demand. Failing to meet this demand, commercial banks are exposed to
liquidity risk. So, commercial banks must hold sufficient liquidity. The following
financial ratios are used for measuring the liquidity performance of the CBE in the
study.
A. Total Loans to Total Asset Ratio (TLTA)
Table 4.4 Total Loans to Total Asset Ratio (%)
TLTA of CBE before the reform period(1976 to 1992)
average
Year
1976
1977
1978
1979
1980
1981
1982
1983
1984
1985
1886
1987
1988
1989
1990
1991
1992
TLTA
31.39
38.74
42.53
40.60
21.60
39.32
26.80
30.75
26.17
21.95
17.93
19.45
22.80
22.43
17.97
15.68
16.08
26.5971
TLTA of CBE the reform period(1993 to 2009) average
year
1993
1994
1995
1996
1997
1998
1999
2000
2001
2002
2003
2004
2005
2006
2007
2008
2009
TLTA
24.27
25.46
31.30
40.32
43.17
43.65
44.62
42.22
40.48
47.60
40.60
22.51
36.80
21.35
19.26
32.28
34.10
34.7053
Source: researcher own computation from the financial statement
Table 4.4 clearly shows the TLTA ratio of the CBE before and after the reform period.
The TLTA ratio measures the total loans outstanding as a percentage of total assets. The

48
higher this ratio indicates a bank is loaned up and its liquidity is low. In other word, the
more risky a bank may be to higher defaults or the higher the ratio, the less liquid the
bank will be. Besides (Abdus, 2004 and Bateswar and Ajay, 2007) have used this ratio for
measuring liquidity of a bank in their study.
According to the above table the trend of TLTA ratio of the bank is decreased from
(31.39 percent) to 16.08 percent in the pre reform period and increased from (24.27
percent) to 34.10 percent in the post reform period. In addition the average TLTA ratio
of the CBE after the reform period (34.7053) exceeded the average ratio before the
reform period (26.5971). This clearly indicates the liberalization and reform measures
brought a significant change in maintaining sufficient liquidity position in the bank.
B. Liquid asset to Deposit ratio (LATD)
Table 4.5 Liquid Asset to Deposit Ratio (%)
LATD of CBE before the reform period(1976 to 1992)
Averag
e
Year
1976
1977
1978
1979
1980
1981
1982
1983
1984
1985
1886
1987
1988
1989
1990
1991
1992
LATD
74.13
45.05
59.31
51.43
58.61
62.72
67.43
56.60
63.99
70.60
61.15
65.61
61.20
63.87
58.60
51.80
39.73
59.834
1
LATD of CBE after the reform period(1993 to 2009)
Averag
e
year
1993
1994
1995
1996
1997
1998
1999
2000
2001
2002
2003
2004
2005
2006
2007
2008
2009
LATD
46.78
36.80
34.80
39.94
27.82
37.57
54.00
49.60
38.60
43.00
71.00
73.80
68.87
74.97
78.00
47.40
35.91
50.524
7
Source: researcher own computation from the financial statement
The above table depicts the commercial bank of Ethiopia LATD ratio in the pre and post
liberalization. The liquid assets of commercial banks consist of cash on hand, cash at
bank, statutory reserves (with National Bank of Ethiopia), balance with other banks, and

49
treasury bills. This composition of liquid assets is known as structural allocation of
liquid assets. The LATD ratio used in this study is measured by taking the structural
allocation of liquid assets. Abdus (2004) have used this ratio for measuring liquidity of a
bank. It indicates the percentage of deposit and short term funds that are available to
meet the sudden withdrawals. The higher the LATD, the more liquid is a commercial
bank and less vulnerable it is to run the bank.
As it can be seen from the table 4.5 the trends of the LATD ratio decreased from (74.13
percent) to 39.73 percent and from (46.78 percent) to 35.92 percent in the pre and post
reform period respectively. In both periods the trend of LATD ratio is decreased and
indicates the less liquidity in the bank in both period but the average LATD ratio
(59.8341) of the bank before the reform period is greater than the average LATD ratio
(50.5247) of the bank after the reform period. But literally the higher the LATD, the more
liquid is a commercial bank and less vulnerable it is to run the bank. From the analysis
it can be concluded that, the liberalization enhance the bank to maintain sufficient
liquidity position in the post reform period.

50
C. Total loans to Total Deposit ratio (TLTD)
Table 4.6 Total Loans to Deposit Ratio (%)
TLTD of CBE before the reform period(1976 to 1992)
averag
e
Yea
r
1976
1977
1978
1979
1980
1981
1982
1983
1984
1985
1886
1987
1988
1989
1990
1991
1992
TLTD
47.00
58.36
70.04
45.05
51.80
64.48
56.40
48.50
39.19
30.96
26.62
29.64
31.47
34.13
22.31
19.23
19.72
40.876
5
TLTD of CBE after the reform period(1993 to 2009)
averag
e
yea
r
1993
1994
1995
1996
1997
1998
1999
2000
2001
2002
2003
2004
2005
2006
2007
2008
2009
TLTD
36.92
48.31
46.51
57.16
56.43
56.48
61.60
59.74
59.80
49.50
41.00
35.10
38.40
45.60
38.46
43.20
46.58
48.281
8
Source: researcher own computation from the financial statement
Table 4.6 shows that the TLTD ratios of the CBE in the pre and post reform period. Loan
to deposit (TLTD) ratio is the most commonly used liquidity ratio of a bank. (Abdus,
2004 and Bateswar and Ajay, 2007) have used this ratio for measuring liquidity of a
bank. A low ratio of TLTD indicates excess liquidity, and potentially low profits, when
we compared before and after the liberalization. At the same time when we compared
the TLTD ratio of the bank in the pre and post liberalization, a high TLTD ratio presents
the risk that some loans may have to be sold at a loss to meet depositors’ claims. The
TLTD ratio of commercial bank of Ethiopia in the pre and post liberalization is given
below:
The table clearly shows the trend of the TLTD ratio of the bank Decreased from (47
percent) to 19.72 percent in the pre reform period and increased from (36.92 percent) to
46.58 percent in the post reform period. Besides the average of TLTD ratio of CBE
(45.5024) after the reform period exceeded the average ratio (44.3835) of the bank after

51
the reform period. Thus, liberalization supports the bank in achieving better
performance in terms of risk (the risk that some loans may have to be sold at a loss to
meet depositors’ claims.) and greater profits in the post reform period.
4.1.3 Profitability Performance
Profitability ratios show a company's overall efficiency and performance. It indicates
how the top management of a bank maximizes shareholders' profits by utilizing existing
resources at their disposal. Performance of a bank in terms of profitability reflects its
ability to support present and future operations. More specifically, this determines the
capacity to absorb losses by building an adequate capital base, finance its expansion and
pay adequate dividends to its share holders. The following financial ratios are used for
measuring profitability performance of commercial bank of Ethiopia.
A. Return on Asset (ROA)
Table 4.7 Return on Asset (%)
ROA of CBE the reform period(1976 to 1992)
average
Yea
r
1976
1977
1978
1979
1980
1981
1982
1983
1984
1985
1886
1987
1988
1989
1990
1991
1992
ROA
1.43
0.95
1.65
2.71
2.61
1.69
0.98
1.27
0.92
1.39
1.07
1.11
1.09
0.96
0.72
0.25
0.59
1.2582
ROA of CBE after the reform period(1993 to 2009)
average
yea
r
1993
1994
1995
1996
1997
1998
1999
2000
2001
2002
2003
2004
2005
2006
2007
2008
2009
ROA
1.40
2.40
2.37
2.59
2.56
1.73
2.68
2.33
3.10
-2.30
2.85
2.99
2.38
2.32
2.18
2.90
3.50
2.2341
Source: researcher own computation from the financial statement
Table 4.7 above depicts ROA of the CBE in the pre and post liberalization. ROA is the
ratio of profit after tax to total asset. It reflects the efficiency with which banks deploy

52
their assets. Numerous researchers have used Return on Assets (ROA) ratio for
measuring the profitability of a bank. (Bateswar and Ajay, 2007, Abdus, 2004, Tarawneh,
2006 and Goddard et al. 2004), and many more have extensively used ROA ratio. The
greater the ROA ratio, the better for the bank or the higher the ROA, the most profitable
is the bank. ROA ratios of commercial bank of Ethiopia are shown below.
According to above table, the trend of ratio of ROA decreased from (1.43 percent) to 0.59
percent in the pre reform period and increased from (1.40 percent) to 3.50 percent in the
post reform period and also the average ROA of the bank after the reform period
(2.2341) is exceeded the average ROA ratio of the bank pre reform period (1.2582). This
clearly shows that even if the bank has been in loss in 2002/3 liberalization or reform
measures enabled the bank to deploy their assets in a great efficiency after the reform
period. Further indicates that, the liberalization or reform measures enhance the bank’s
profitability performance after the reform period.
B. Return on Equity (ROE)
Table 4.8 Return on Equity (%)
ROE of CBE before the reform period(1976 to 1992)
average
Year
1976
1977
1978
1979
1980
1981
1982
1983
1984
1985
1886
1987
1988
1989
1990
1991
1992
ROE
28.00
19.39
18.60
36.00
20.60
46.46
27.55
36.10
19.60
21.10
32.78
22.60
39.80
35.80
35.80
12.82
34.44
28.6729
ROE of CBE after the reform period(1993 to 2009)
average
year
1993
1994
1995
1996
1997
1998
1999
2000
2001
2002
2003
2004
2005
2006
2007
2008
2009
ROE
49.58
72.08
67.63
66.42
45.11
29.44
44.92
48.60
50.71
-47.30
51.24
57.66
55.20
54.65
30.18
31.00
40.01
43.9488
Source: researcher own computation from the financial statement

53
ROE represents a ratio of financial results to a bank’s own fund. It shows a rate of return
on base capital, that is, equity capital. Numerous researchers have used Return on
Equity (ROE) ratio for measuring the profitability of a bank. (Tarawneh, 2006, Abdus,
2004 and Goddard et al. 2004), and many more have extensively used ROE ratio. The
greater the ROE ratio, the more efficient is the performance. Therefore, the ROE ratio of
commercial bank of Ethiopia in the pre and post liberalization is shown below:
It is clear from table 4.8 the trend of the ROE ratio were increased from (28 percent) to
34.44 percent in the pre reform period and decreased from (49.585) to 40.01 in the post
reform period. In the post reform periods the ROE ratio is negative in 2003/2004
because of the bank that has been in loss in 2002/3, which was markedly known as sever
draught year but the average ROE ratio (43.9488) of the bank in post reform period
exceeded the average ROE ratio (28.6729) of the bank in the pre reform period. It shows
that even if the bank has been in loss in 2002/3 the liberalization or reform measures
enabled the bank to record better profitability performance and greater efficiency after
the reform period.

54
C.Net Interest Margin (NIM)
Table 4.9 Net Interest Margin (%)
NIM of CBE before the reform period(1976 to 1992)
average
Year
1976
1977
1978
1979
1980
1981
1982
1983
1984
1985
1886
1987
1988
1989
1990
1991
1992
NIM
2.52
1.64
2.47
4.35
3.52
3.02
2.67
2.62
2.21
2.10
1.76
1.55
1.69
1.58
1.27
1.14
0.99
2.1824
NIM of CBE after the reform period(1993 to 2009)
average
Year
1993
1994
1995
1996
1997
1998
1999
2000
2001
2002
2003
2004
2005
2006
2007
2008
2009
NIM
2.10
3.20
3.40
3.80
4.10
3.40
4.00
4.60
3.30
1.10
2.30
1.76
1.73
1.88
2.08
2.55
3.66
2.8800
Source: researcher own computation from the financial statement
Net interest income is the difference between interest income and interest expense. It is
the gross margin on a bank’s lending and investment activities. Analysts focus on Net
Interest Margin (NIM) ratio because small changes in a bank’s lending margin can
translate into large bottom line changes. The higher the ratio the cheaper the funding or
the higher the margin the bank is obtaining. A bank’s net interest margin is a key
performance measure that drives ROA. (Bateswar and Ajay, 2007, Abdus, 2004 and
Goddard et al. 2004), and many more have used this ratio. The following data shows
NIM of the commercial bank of Ethiopia in the pre and post liberalization.
Table 4.9 reveals the NIM ratios of the commercial bank of Ethiopia in the pre and post
reform period. The table clearly shows that the trend of NIM ratio were decreased from
(2.52 percent) to 0.99 percent in the pre reform period and increased from (2.10 percent)
to 3.66 percent in the post reform period and also the average NIM ratios (2.8800) of the
bank in the post reform period exceeded the average NIM ratios (2.1824) of the bank
before the reform period. This clearly indicates that, the liberalization or reform
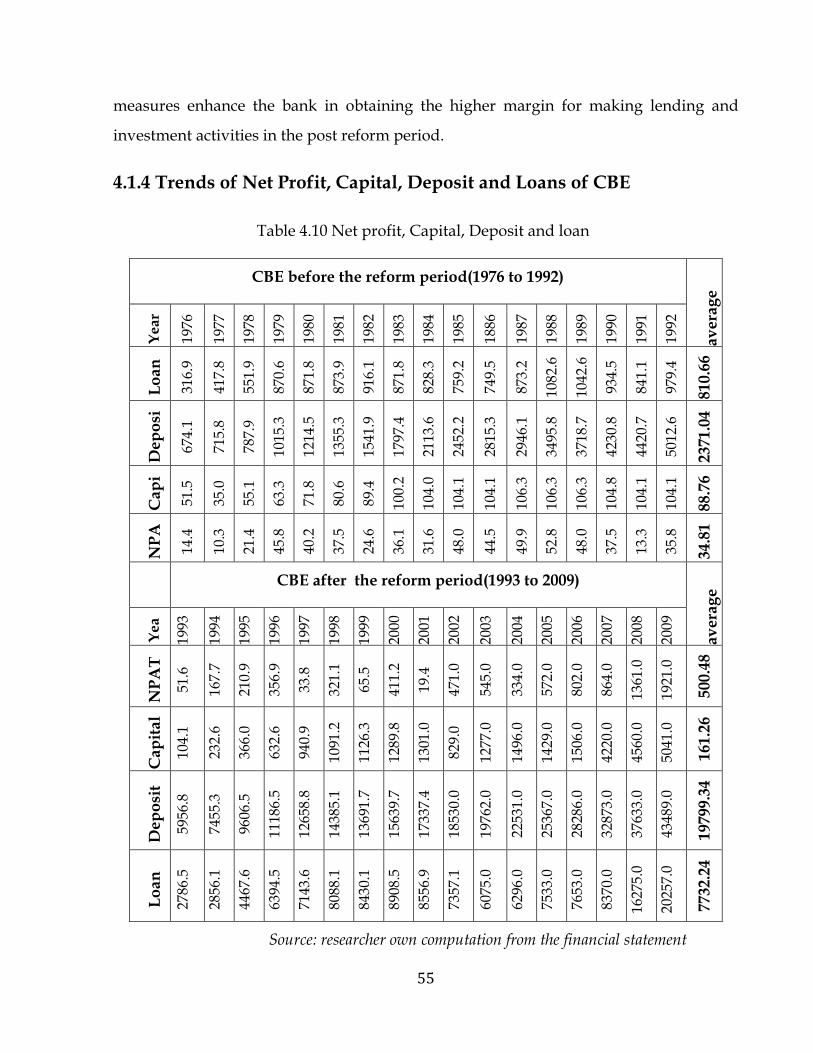
55
measures enhance the bank in obtaining the higher margin for making lending and
investment activities in the post reform period.
4.1.4 Trends of Net Profit, Capital, Deposit and Loans of CBE
Table 4.10 Net profit, Capital, Deposit and loan
CBE before the reform period(1976 to 1992)
average
Year
1976
1977
1978
1979
1980
1981
1982
1983
1984
1985
1886
1987
1988
1989
1990
1991
1992
Loan
316.9
417.8
551.9
870.6
871.8
873.9
916.1
871.8
828.3
759.2
749.5
873.2
1082
.6
1042
.6
934.5
841.1
979.4
810.66
Deposi
674.1
715.8
787.9
1015
.3
1214
.5
1355
.3
1541
.9
1797
.4
2113
.6
2452
.2
2815
.3
2946
.1
3495
.8
3718
.7
4230
.8
4420
.7
5012
.6
2371.04
Capi
51.5
35.0
55.1
63.3
71.8
80.6
89.4
100.2
104.0
104.1
104.1
106.3
106.3
106.3
104.8
104.1
104.1
88.76
NPA
14.4
10.3
21.4
45.8
40.2
37.5
24.6
36.1
31.6
48.0
44.5
49.9
52.8
48.0
37.5
13.3
35.8
34.81
CBE after the reform period(1993 to 2009)
average
Yea
1993
1994
1995
1996
1997
1998
1999
2000
2001
2002
2003
2004
2005
2006
2007
2008
2009
NPAT
51.6
167.7
210.9
356.9
33.8
321.1
65.5
411.2
19.4
471.0
545.0
334.0
572.0
802.0
864.0
1361
.0
1921
.0
500.48
Capital
104.1
232.6
366.0
632.6
940.9
1091
.2
1126
.3
1289
.8
1301
.0
829.0
1277
.0
1496
.0
1429
.0
1506
.0
4220
.0
4560
.0
5041
.0
161.26
Deposit
5956
.8
7455
.3
9606
.5
1118
6.5
1265
8.8
1438
5.1
1369
1.7
1563
9.7
1733
7.4
1853
0.0
1976
2.0
2253
1.0
2536
7.0
2828
6.0
3287
3.0
3763
3.0
4348
9.0
19799.34
Loan
2786
.5
2856
.1
4467
.6
6394
.5
7143
.6
8088
.1
8430
.1
8908
.5
8556
.9
7357
.1
6075
.0
6296
.0
7533
.0
7653
.0
8370
.0
1627
5.0
2025
7.0
7732.24
Source: researcher own computation from the financial statement

56
Table 4.10 clearly shows that the growth of the net profit after tax, capital, deposits and
loan of the CBE in the pre and post liberalization. This clearly indicating that, the
profitability, capital, deposit and loan of the commercial bank of Ethiopia have shown a
tremendous improvement after the reform measures has been taken.
The above table clearly shows the trends of profit, capital, deposit and loan of the bank
increased from Birr (14.4), (51.5), (674.1), (316.9) million to Birr 35.8, 104.1, 5012.6 979.4
Million and from Birr (51.6), (104.1), (5956.8), (2786.5) million to Birr 1921.0, 5041.0,
43489.0, 20257.0 million in the pre and post reform period respectively.
In addition the profit, capital, deposit and loan of the bank on average for the post
reform period has reached to Birr 500.48, 1,614.26, 19,799.34, and 7,732 million as
compared to Birr 34.81, 88.76, 2,371.04 and 810.66 million during the post reform period
respectively.
Even the bank that has been in loss in 2002/3, which was markedly known as sever
draught year and Loans and advances of the commercial bank of Ethiopia in the most
recent post reform period is reduced because of the National Bank of Ethiopia set a
maximum outstanding loan limit to all banks in the country to control inflation, in the
post reform period, the bank recorded better performance after the reform measure has
been taken.
This signified the bank has continued, of recent, posting a remarkable improvement in
its net profit, capital, deposit, and loan which used to be stagnant at low level for more
than two decades in the pre reform period.
4.1.5 Hypothesis Testing using T - Test
To substantiate the result obtained by using ratio analysis, hypothesis was tested using
T test. The three hypotheses that were developed and tested under this study are:

57
Ho1: There is no significant gap in the credit quality performance of CBE in the pre and
post financial liberalization.
H11: There is significant gap in the credit quality performance of CBE in the pre and
post financial liberalization.
Ho2: There is no significant gap in the liquidity performance of CBE in the pre and post
financial liberalization.
H12: There is significant gap in the liquidity performance of CBE in the pre and post
financial liberalization
Ho3: There is no significant gap in profitability performance of CBE in the pre and post
financial liberalization.
H13: There is significant gap in profitability performance of CBE in the pre and post
financial liberalization.
CBE financial performance was determined by using different financial ratios by
comparing its results before and after the reform period. It is useful to have
understanding on both before and after the financial performance of the bank to monitor
the financial items and adjust the financial performance accordingly. Consequently, the
objective of this study was to measure the gap in the financial performances of the bank
based on three financial performance measures indicators: credit quality, liquidity and
profitability. The gap between the financial performances of the bank was computed for
each of the financial performance measures indicators.
Based on data obtained as aforementioned, mean difference between after and before
liberalization (FP=A-B) were computed for each of the financial performance indicator
ratios. A positive difference of EQTA, EQLA, TLTA, TLTD, ROA, ROE, and NIM and
negative difference of LATD & NPTL indicates that on average the performance of the
bank in the post reform period exceeded the pre reform period; implying for better
financial performance of the bank. On the contra, a negative difference of EQTA, EQLA,
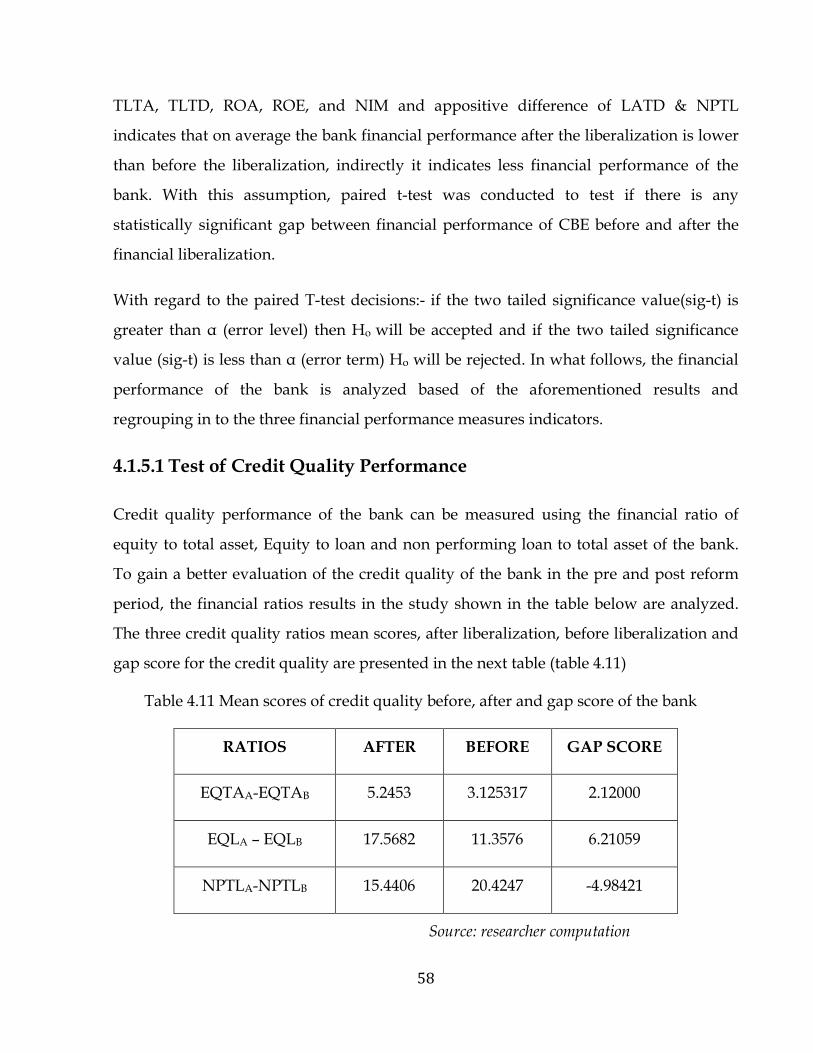
58
TLTA, TLTD, ROA, ROE, and NIM and appositive difference of LATD & NPTL
indicates that on average the bank financial performance after the liberalization is lower
than before the liberalization, indirectly it indicates less financial performance of the
bank. With this assumption, paired t-test was conducted to test if there is any
statistically significant gap between financial performance of CBE before and after the
financial liberalization.
With regard to the paired T-test decisions:- if the two tailed significance value(sig-t) is
greater than α (error level) then Ho will be accepted and if the two tailed significance
value (sig-t) is less than α (error term) Ho will be rejected. In what follows, the financial
performance of the bank is analyzed based of the aforementioned results and
regrouping in to the three financial performance measures indicators.
4.1.5.1 Test of Credit Quality Performance
Credit quality performance of the bank can be measured using the financial ratio of
equity to total asset, Equity to loan and non performing loan to total asset of the bank.
To gain a better evaluation of the credit quality of the bank in the pre and post reform
period, the financial ratios results in the study shown in the table below are analyzed.
The three credit quality ratios mean scores, after liberalization, before liberalization and
gap score for the credit quality are presented in the next table (table 4.11)
Table 4.11 Mean scores of credit quality before, after and gap score of the bank
RATIOS AFTER BEFORE GAP SCORE
EQTAA-EQTAB 5.2453 3.125317 2.12000
EQLA – EQLB 17.5682 11.3576 6.21059
NPTLA-NPTLB 15.4406 20.4247 -4.98421
Source: researcher computation

59
Looking at Table 4.11 the credit quality financial ratios elements’ mean differences, the
gap scores for the two ratios (EQTA & EQLA) and NPTL ratios are positive and negative
respectively, indicating that on average the credit quality performance of the bank after
the reform period exceeded the credit quality performance of before the reform period.
Following this, it can be said that the financial performance with regard to credit quality
of the bank after the reform period is better than before the reform period.
Table 4.12 Paired Samples T-test for Credit Quality of the Bank
Paired Differences
T df
Sig. (2-
tailed) Mean
Std.
Deviatio
n
95% Confidence
Interval of the
Difference
Lower Upper
EQTAA-EQTAB
EQLA – EQLB
NPTLA-NPTLB
2.12000
6.21059
-4.98412
3.16884
10.92078
9.01072
.49073
.59564
-9.61700
3.74927
11.82553
-.35123
2.758
2.345
-2.281
16
16
16
.014
.032
.037
α=0.05 Source: researcher computation
Table 4.12 shows the mean difference between credit quality performance before and
after the financial liberalization and further sets out the results of the paired t-test for
each of the credit quality financial ratios.
In EQTA the mean gap score of positive (2.12000) suggests that the overall shock
absorbing capacity of a bank for potential loan asset losses of the bank after the reform
period exceeded before the reform period. Therefore, the bank has the capacity to

60
sustain the assets losses after the reform period than before. But, to evaluate the extent
of the difference of the EQTA of the bank pre and post, it’s necessary to look at the
significance values. As the two tailed sig-t (.014) is lower than α (0.05), it shows
statistically there is significant gap between the EQTA of the bank in the pre and post
reform period. That is, the EQTA of the bank after the reform period is better than
before the reform period.
In QLA the mean gap score of positive (6.21059) shows that a safety capacity to absorb
loan losses of the bank after the reform period exceeded before the reform period. Thus,
the bank has better safety capacity to absorbing loan losses after the reform period than
before. In addition, to evaluate the extent of the difference of the QLA of the bank in the
pre and post liberalization, the two tailed sig-t (.032) is lower than α (0.05), it shows
statistically there is significant gap between the QLA of the bank in the pre and post
liberalization. Therefore, the capacity of the bank to absorb loan losses after the reform
period is better than before the reform period.
In NPTL the mean gap score of negative (-4.98412) suggests that the overall credit
performance of a bank after the reform period exceeded before the reform period.
Because, the lower the ratio of NPTL, the better is the asset/credit performance.
Therefore, the bank has the better asset/credit performance after the reform period than
before the reform period. But, to evaluate the extent of the difference of the NPTL of the
bank pre and post, as the two tailed sig-t (.037) is lower than α (0.05), it shows
statistically there is significant gap between the NPTL of the bank in the pre and post
reform period. That is, the NPTL of the bank after the reform period is better than before
the reform period.
In all three of the credit quality performance measures (EQTA, QLA, and NPTL) after
liberalization the two tailed sig-t is lower than α. In this regarded Ho is rejected.
Therefore, there is significant gap in the credit quality performance of CBE in the pre
and post financial liberalization. The higher mean values of after the reform period

61
further suggest that the bank has exerted much effort on creating higher level of credit
quality services to its customers which help it to develop better performance in credit/
loan management. This could be one reason for the significant mean differences
between credit quality performance of the bank in the pre and post liberalization.
4.1.5.2 Test of Liquidity Performance
Here the test is the overall liquidity performance of the bank in the pre and post
liberalization. To gain a better evaluation of the liquidity performance of the bank in the
pre and post reform period, the TLTA, LATD and TLTD ratios results in the study
shown in the table below are analyzed. The three liquidity ratios mean scores of after
liberalization and before liberalization and gap score for the credit quality are presented
in the next table (table 4.13)
Table 4.13 Mean scores of liquidity performance before, after and gap score of the bank
RATIOS AFTER BEFORE GAP SCORE
TLTAA-TLTAB 34.7053 26.5971 8.10824
LATDA-LATDB 50.5247 59.8341 -9.30941
TLTDA-TLTDB 48.2818 40.8765 7.40529
Source: researcher computation
Table 4.13 illustrates the overall average difference between liquidity performance of the
bank in the pre and post and gap score for each of the liquidity performance measures
financial ratios.
For TLTA and TLTD ratios the mean gap scores were positive and for LATD the gap
scores are negative indicating that, liquidity performance of the bank after the reform

62
period exceeded the liquidity performance of the bank before the reform period. Thus,
the bank has better liquidity performance in the post reform period than before.
Table 4.14 Paired Samples T-test for liquidity performance of the bank
Paired Differences
t df
Sig. (2-
tailed) Mean
Std.
Deviatio
n
95% Confidence
Interval of the
Difference
Lower Upper
TLTAA - TLTAB
LATDA – LATDB
TLTDA - TLTDB
8.10824
-9.30941
7.40529
2.12935
16.13921
13.58081
1.87190
-17.60738
.42269
14.34457
-1.01144
14.38790
2.756
-2.378
2.248
16
16
16
.014
.030
.039
α=0.05 Source: researcher computation
Table 4.14 depicts the mean differences between liquidity performance of the bank in
the pre and post liberalization and further shows the results of the paired t-test for each
of the liquidity performance measures financial ratios.
The mean difference for TLTA ratio was positive (8.10824) indicating that the bank
liquidity is performance after the reform period is better than before the reform period.
As the two tailed sig-t (.014) is lower than α (0.05), it shows statistically there is
significant gap between the TLTA of the bank in the pre and post reform period. That is,
the TLTA of the bank after the reform period is better than before the reform period.

63
In LATD the mean gap score of negative (-9.30941) suggests that the liquidity
performance of a bank after the reform period exceeded before the reform period.
Because the higher the LATD, the more liquid is a commercial bank and less vulnerable
it is to run the bank. However, in the post reform period the ratio is lower than before.
Besides, to evaluate the extent of the difference of the LATD of the bank pre and post, as
the two tailed sig-t (.030) is lower than α (0.05), it shows statistically there is significant
gap between the LATD of the bank in the pre and post reform period. That is, the LATD
ratio of the bank after the reform period is better than before.
In TLTD the mean gap score of positive (7.40529) shows that the bank has sufficient
liquidity and better profitability in the post reform period than in the pre reform period.
In addition, to evaluate the extent of the difference of the TLTD of the bank in the pre
and post liberalization, the two tailed sig-t (.039) is lower than α (0.05), it shows
statistically there is significant gap between the TLTD of the bank in the pre and post
liberalization. Therefore, the TLTD of the bank after the reform period is better than
before the reform period.
In all three of the liquidity performance measures (TLTA, LATD, and TLTD) after
liberalization the two tailed sig-t is lower than α. In this regarded Ho is rejected.
Therefore, there is significant gap in the liquidity performance of CBE in the pre and
post financial liberalization. The higher mean values of after the reform period further
suggest that the bank has good performance to convert its assets into cash to meet the
cash demand of the depositors and borrowers in the post reform period. This could be
one reason for the significant mean differences between liquidity performance of the
bank in the pre and post liberalization.
4.1.5.3 Test of Profitability Performance
Profitability performance of the bank is measured by using the financial ratios of return
on asset, return on equity, and net interest margin. To gain a better evaluation of the

64
profitability performance of the bank in the pre and post reform period, the financial
ratios results in the study shown in the table below are analyzed. The three profitability
financial ratios mean scores, after liberalization, before liberalization and gap score for
the credit quality are presented in the next table (table 15)
Table 4.15 Mean scores of profitability before, after and gap score of the bank
RATIOS AFTER BEFORE GAP SCORE
ROAA - ROAB 2.2341 1.2582 .97588
ROEA – ROEB 43.9488 28.6729 15.2759
NIMA – NIMB 2.8800 2.1824 .69765
Source: researcher computation
Table 4.15 illustrates the average difference between the profitability performance of the
bank mean differences, the gap scores for the three financial ratios is positive, indicating
that on the average the profitability performance of the bank after the reform period
exceeded the profitability performance of before the reform period.

65
Table 4.16 Paired Samples T-test for profitability performance of the bank
Paired Differences
t df
Sig. (2-
tailed) Mean
Std.
Deviation
95% Confidence
Interval of the
Difference
Lower Upper
ROAA - RoAB
ROEA - ROEB
NIMA - NIMB
.97588
15.2759
.69765
1.51392
27.56199
.93748
.19750
1.10481
.21564
1.75427
29.44695
1.17965
2.658
2.285
3.068
16
16
16
.017
.036
.007
α=0.05 Source: researcher computation
Table 4.16 shows the mean difference between profitability performance of the bank
before and after the financial liberalization and further sets out the results of the paired
t-test for each of the profitability performance financial ratios.
In ROA the mean gap score of positive (.97588) suggests that the efficiency of the bank
in managing its investment in assets and using them to generate profit in the post
reform period is better than before. But, to evaluate the extent of the difference of the
ROA of the bank pre and post, it’s necessary to look at the significance values. As the
two tailed sig-t (.017) is lower than α (0.05), it shows statistically there is significant gap
between the ROA of the bank in the pre and post reform period. That is, the ROA of the
bank after the reform period is better than before the reform period.
In ROE the mean gap score of positive (15.2759) shows that the profitability
performance of the bank after the reform period exceeded before the reform period. In

66
addition, to evaluate the extent of the difference of the ROE of the bank in the pre and
post liberalization, the two tailed sig-t (.036) is lower than α (0.05), it shows statistically
there is significant gap between the ROE of the bank in the pre and post liberalization.
In NIM the mean gap score of positive (.69765) shows that the bank has better
performance in lending and investment activities in the post reform period than in the
pre reform period. In addition, to evaluate the extent of the difference of the NIM of the
bank in the pre and post liberalization, the two tailed sig-t (.007) is lower than α (0.05), it
shows statistically there is significant gap between the NIM of the bank in the pre and
post liberalization. Therefore, the NIM of the bank after the reform period is better than
before the reform period.
In all three of the profitability performance measures (ROA, ROE, and NIM) after
liberalization the two tailed sig-t is lower than α. In this regarded Ho is rejected.
Therefore, there is significant gap in profitability performance of CBE in the pre and
post financial liberalization. The higher mean values of after the reform period further
suggest that the bank has creating higher level of efficiency and profitability
performance. This could be one reason for the significant mean differences between
profitability performance of the bank in the pre and post liberalization.
4.2. Data from Primary Sources
In addition to data gathered from secondary sources, a structured questionnaire was
developed to know the attitude of respondents towards the financial performance of the
commercial bank of Ethiopia in the pre and post liberalization. In this section, the data
collected through questionnaires presented and analyzed using statistical tables. The
findings from the respondents on different aspects of the financial performance of the
commercial bank of Ethiopia and possible reasons for any forthcoming problems are
also presented.

67
Furthermore, in each part attempt has been also made to seek information on the areas
that need further liberalization or reform measures. The questionnaire has been
distributed to 35 selected employees and management members of the commercial bank
of Ethiopia.
The selection of respondents was made in a way to represent both the management and
employees working in different seven operation of the bank. All 35 questionnaires have
been fully filled and returned for use in the study. The responses have been analyzed in
the following pages:
4.2.1. Respondents Background
All respondents who participated in this study were management and employees’ from
seven different operation of the commercial bank of Ethiopia, head office. Presented
here is general background information about the respondents. Respondents were
studied for their gender, age, highest level of education, experience and position in the
bank. The tables that follow present the results for each of these variables.
A. Gender Respondents
Table 4.17 Gender of the respondents
Gender Frequency Percent Cumulative Percent
Male 24 68.6 68.6
Female 11 31.4 100.0
Total 35 100.0
Source: survey 2010
The above table 4.17 shows the respondents’ gender in this study. It suggests that more
than half of bank respondents were male.

68
B. Age of the Respondents
Table 4.18 Ages of the Respondents
Age range Frequency Percent Cumulative Percent
Less than 25 3 8.6 8.6
26 to 35 8 22.9 31.5
36 to 55 20 57.1 88.6
56 an above 4 11.4 100.0
Total 35 100.0
Source: survey 2010
As table 4.18 indicates, the majority of the respondents (57.1%) were aged between “36-
55” of age, (8.6%) of respondents were less than 25 years old, (22.9%) of the respondents
were within the age range of “26-35”, and only (11.4%) of respondents were above 56
years old.
C. Educational Status of the Respondents
Table 4.19 Educational status of the Respondents
Educational status
Frequency Percent
Cumulative
Percent
College diploma 5 14.3 14.3
First degree 19 54.3 68.6
Second degree and above 11 31.4 100.0
Total 35 100.0
Source: survey 2010

69
Regarding to the educational background, table 4.19 shows that the highest frequency,
(54.3%) of respondents possessed first degree, ( 14.3%) of the respondents were college
diploma holders, and (31.4%) of the respondents’ having educational qualification of
second degree and above. This implies that, the researcher has got an input for well
educated respondents in the study.
D. Experience of the Respondents
Table 4.20 Experiences of the Respondents
Experience Frequency Percent Cumulative Percent
1 to 5 year 7 20.0 20.0
6 to 10 year 17 48.6 68.6
Above 10 years 11 31.4 100.0
Total 35 100.0
Source: survey 2010
In terms of experience, table 4.20 shows that the major portion (48.6%) has served in the
bank between 6 to 10 years, and the rest 20% and 31.1% have served in the bank
between 1 to 5 years and above 10 years respectively. This implies that the researcher
reliance on well experienced respondents in the study.

70
E. Positions of the Respondents
Table 4.21 positions of the Respondents
Position Frequency Percent Cumulative Percent
Employee 5 14.3 14.3
Middle level manager 7 20.0 34.3
Officer 14 40.0 74.3
Senior manager 9 25.7 100.0
Total 35 100.0
Source: survey 2010
Table 4.21 shows that the majority of the respondents (40%) serving the bank as officer,
(25.7%) of respondents serving the bank as senior manager and the remaining 20% and
14.3% of the respondents working in the bank as middle level manager and employee
respectively. This indicates the respondents in the study have good knowledge and
information about the effect of financial liberalization on bank performance.
4.2.2 Performance of CBE in the Pre and Post reform Period
One question has been asked so as to find out the attitude of management and
employees toward the change and take their ideas for further improvement of the
performance of the bank. Summary of the responses are summarized in the table below:
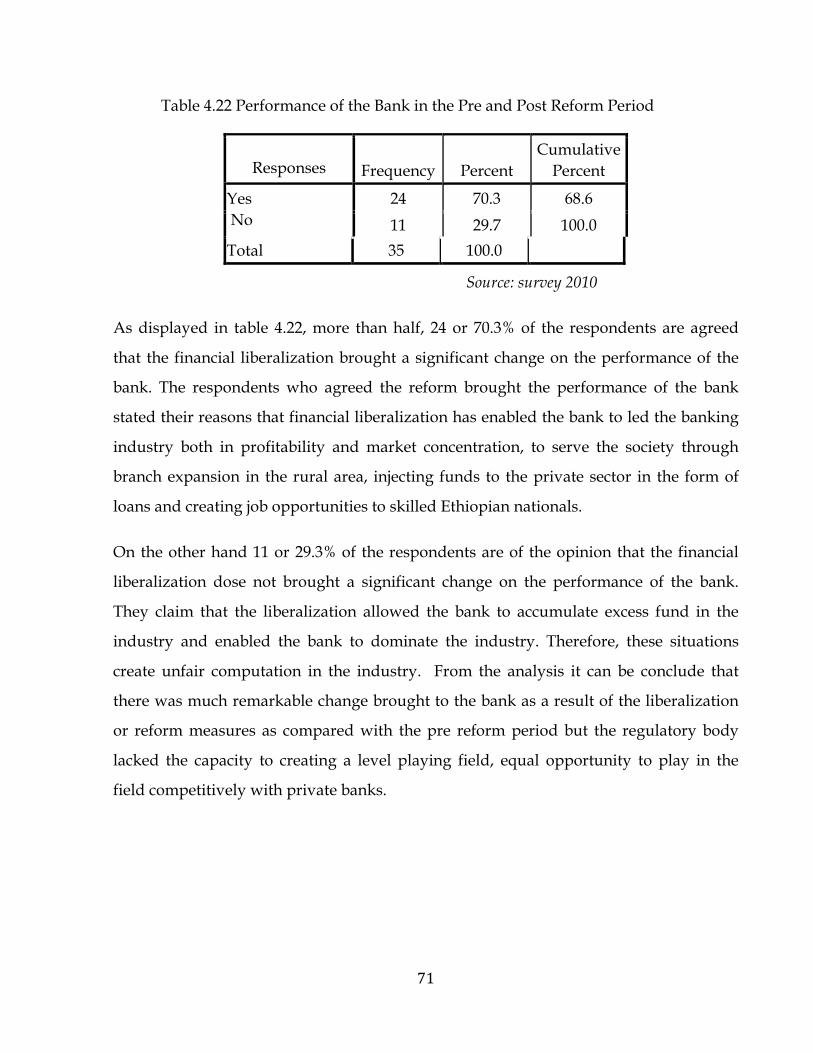
71
Table 4.22 Performance of the Bank in the Pre and Post Reform Period
Responses Frequency Percent
Cumulative
Percent
Yes
No
24 70.3 68.6
11 29.7 100.0
Total 35 100.0
Source: survey 2010
As displayed in table 4.22, more than half, 24 or 70.3% of the respondents are agreed
that the financial liberalization brought a significant change on the performance of the
bank. The respondents who agreed the reform brought the performance of the bank
stated their reasons that financial liberalization has enabled the bank to led the banking
industry both in profitability and market concentration, to serve the society through
branch expansion in the rural area, injecting funds to the private sector in the form of
loans and creating job opportunities to skilled Ethiopian nationals.
On the other hand 11 or 29.3% of the respondents are of the opinion that the financial
liberalization dose not brought a significant change on the performance of the bank.
They claim that the liberalization allowed the bank to accumulate excess fund in the
industry and enabled the bank to dominate the industry. Therefore, these situations
create unfair computation in the industry. From the analysis it can be conclude that
there was much remarkable change brought to the bank as a result of the liberalization
or reform measures as compared with the pre reform period but the regulatory body
lacked the capacity to creating a level playing field, equal opportunity to play in the
field competitively with private banks.

72
4.2.3 Involvement of Government
Table 4.23 Government Involvement
Response Frequenc
y Percent
Valid
Percent
Cumulative
Percent
Yes
no
Total
14 40 40.0 40.0
21 60 60.0 100.0
35 100.0
Source: survey 2010
Respondents’ views towards the current involvement of the government in the banking
industry (table 4.23) displayed that most (60%) of the respondent agreed that the
government involvement in the industry does not makes the bank beneficial. They
explain their reason that the current involvement of the government in the banking
industry limited the bank infrastructure development.
On the other side of the continuum, (table 4.23) 14 or 40% of the respondents agreed that
the current involvement of the government makes the bank beneficial. They explain
their reason that the current involvement of the government in the industry enabled the
bank became financially stable, helped the bank to build a good banking culture in the
industry and make it to delivered better socially responsible banking services to the
society. The above opinion indicates that there is a need to work for minimizing the
current existing involvement of the government in the banking industry so as to
improve the performance of the bank.

73
4.2.4. Profitability Performance
Table 4.24 Profitability Performance
Responses Frequency Percent Cumulative Percent
Yes
no
Total
27 77.14 77.1
8 22.86 100.0
37 100.0
Source: survey 2010
Relaying on the trend of the bank profitability in both period both open ended and
choice questions were designed and forwarded to the respondents. The responses to the
questions are presented in table 4.24 as follows:
(Table 4.24) the majority (77.14) of the respondents believe that the financial
liberalization brought a significant change on the profitability performance of the bank.
Further, respondents also believe that the reform measures positively impacted the
profitability of the bank by creating intense competition in the sector. Then, the bank
enjoys the competition and led the industry in terms of branch expansion and
profitability. On the other side, 8 or 22.86% of the respondents believe that the financial
liberalization dose not brought a significant change on the profitability performance of
the bank.

74
4.2.5 Regulation of the Bank
Table 4.25 Regulation of the Bank
Responses Frequency Percent Cumulative Percent
Yes
no
don’t know
20 57.14 57.14
8 22.86 80.0
7 20.0 100.0
Total 37 100.0
Source: survey 2010
Respondents’ views towards the regulation or the supervision of the bank (table 4.25)
displayed that most (57.14%) of the respondent agreed that the financial liberalization
strengthened the regulation or supervision of the bank. On the other side, 8 or 22.86% of
the respondents responded that the financial liberalization dose not strengthened the
regulation of the bank. However, 7 or 20% of the respondents responded that they do
not have any information about the effect of liberalization on the bank regulation. Form
this it can be concluded that financial liberalization strengthening the regulation or
supervision of the bank.
4.2.6 Further Liberalization or Reform Measures
Open ended question were forwarded to the management and employees who are
working in seven different operation of the CBE to find out the area that need further
liberalization or reform measures so as to enhance the overall performance of the bank.
Based on this a large number of respondents indicates that liberalization in the deposit
market through lifting the minimum deposit rate sanctioned by the supervisory organ,

75
let the bank to do business with financial institutions of their own choice, eliminating
entry barriers on foreign bank, and full liberalization of the foreign market are identified
as area which needs further liberalization in the banking industry. In addition most of
the respondents claim that the capacity as well as the independence of the regulatory
body (NBE) has to be improved so as to improve the contribution of the bank in the
growth of the banking industry and there is no a good legal ground and/or the
commercial code to include any article regarding to the technology supported banking
activities like e- banking are identified as area which needs further reform measures in
the industry.

76
CHAPTER V
CONCLUSIONS AND RECOMMENDATIONS
This chapter presents the conclusions and recommendations that were drown from the
previous chapter of this study.
5.1 Conclusion
This study aims to evaluate the financial performance of the commercial bank of
Ethiopia in the pre and post financial liberalization. The comparison of the pre and post
liberalization of the bank financial performance was made using financial ratios (credit
quality, profitability and liquidity) and change in growth (net profit after tax, capital,
deposits and loans). Those ratios and changes in net profit after tax, capital, deposit and
loans are extracted from the audited financial statements of the bank and the mean
value is computed for both before and after the reform period. In addition the computed
mean of the ratios, gap scores of ratios significance level and formulated hypothesis of
the financial performance of the bank before and after the reform period was tested
using t-test statistical tools.
The researcher has also tried to collect opinions from the banks’ community regarding
to the financial performance of the bank and to identify area that need further
liberalization. In addition, various theoretical aspects and related studies made on the
performance evaluation of banks in various countries were also reviewed. Thus, based
on such analysis on the primary and secondary data, the following conclusions are
drawn:
With regard to asset quality or credit quality performance, this paper found that EQTA
ratio, NPTL ratio and EQL ratio indicating that the bank were performing better in the
post reform period than before. In addition, in all three of the credit quality performance

77
measures (EQTA, QLA, and NPTL) after liberalization the two tailed sig-t is lower than
α. Therefore, there is significant gap in the credit quality performance of CBE in the pre
and post financial liberalization. From this it can be concluded that the financial
liberalization or reform measures brought a significant change in the bank to exert much
effort on creating higher level of credit quality services to its customers which help it to
develop better performance in credit/ loan management.
The study also found that the liquidity performance indicator in the study i.e. TLTA
ratio, LATD ratio, and TLTD ratio shows that the CBE has better liquidity performance
in the post reform period than before. Furthermore, in all three of the liquidity
performance measures (TLTA, LATD, and TLTD) after liberalization the two tailed sig-t
is lower than α. Therefore, there is significant gap in the liquidity performance of CBE in
the pre and post financial liberalization. From this it can be concluded that the
liberalization or reform measures make the banks’ to maintain sufficient liquidity
position after the reform period.
With regard to profitability performance, the study found that ROA ratio, ROE ratio,
and NIM ratio revels that CBE has better profitability performance in the post reform
period than before the reform period. Besides, in all three of the profitability
performance measures (ROA, ROE, and NIM) after liberalization the two tailed sig-t is
lower than α. Therefore, there is significant gap in the profitability performance of CBE
in the pre and post financial liberalization. From this it can be concluded that
liberalization or reform measures enabled the bank to record better profitability
performance, greater efficiency in deploy their assets and enhance the bank in obtaining
the higher margin for making lending and investment activities in the post reform
period.
The study further found that the change in growth of net profit after tax, capital, deposit
and loan of the CBE have shown a tremendous improvement after the reform measures
has been taken. The profit, capital, deposit and loan of the bank on average the post

78
reform period is recorded better performance than before. From this one can possibly
concluded that bank has continued, of recent, posting a remarkable improvement in its
net income, capital, deposit, and loan which used to be stagnant at low level for more
than two decades in the pre reform period.
With regard to the general performance of the bank, financial liberalization has brought
a significant change to the bank by enabled the bank to led the industry in terms of
profitability and market concentration, to serve the society through branch expansion in
rural area, injecting funds to the private sector in the form of loans and creating job
opportunities to skilled Ethiopian nationals. However, liberalization allowed the bank to
accumulate excess fund in the industry and enabled the bank to dominate the industry.
Therefore, these situations create unfair computation in the industry. In addition, the
current involvement of the government in the banking industry limited the bank
infrastructure development. From this it can be concluded that there was much
remarkable change brought to the bank as a result of the liberalization or reform
measures as compared with the pre reform period but the regulatory body lacked the
capacity to creating a level playing field, equal opportunity to play in the field
competitively with private banks and a need to work for minimizing the current existing
involvement of the government in the banking industry so as to improve the
performance of the bank.
Finally, the area that need further liberalization or reform measures to further
strengthen the performance of the bank, the study found that further liberalization in
the deposit market through lifting the minimum deposit rate sanctioned by the
supervisory organ, let the bank to do business with financial institutions of their own
choice, and full liberalization of the foreign market are identified as area which needs
further liberalization in the banking industry and improving the capacity and
independence of the regulatory/supervisory organ and establishing strong legal ground
for providing technological supported banking services like e- banking are identified as
area which needs further reform measures in the industry.

79
5.2 Recommendation
This study attempted to evaluate the financial performance of the commercial bank of
Ethiopia in the pre and post liberalization by using financial ratios. On the basis of the
findings and conclusions reached, the following recommendations were forwarded in
order to improve the performance of the CBE.
� Even though the CBE is doing well in the post reform period, the bank should
use its maximum effort to further improve the deposits, loans, capital, and
profitability performance in the future.
� Further reform measures should be taken to improve the capacity of the
regulatory body so as to increase the contribution of the CBE in the growth of the
banking industry, provide legal framework or modify the commercial code to
incorporate new article regarding to the technology supported banking activities
like e- banking and the government should undertake the regulatory role rather
than fighting to maintain its dominance in the banking sector.
� Further liberalization should be initiated on lifting the minimum interest rate
for deposit to be determined on market basis, fully liberalizing the foreign
market, and encouraging bank to do business with financial institutions of their
own choice rather than the current implicit sanction not to do business with
private banks.
� Finally, the financial performance indicators, i.e. financial ratios, independently
are not enough to measure the performance of commercial banks and also the
researcher has not adjusted the financial statement of the Commercial bank of
Ethiopia in the study. Thus, alternative financial measures such as Data
Envelopment Analysis (DEA) and adjustment of the financial statement of the
bank shall be considered by further researchers.

80
BIBLOGRAPHY
1. Abdus, S. (2004). Bahrain's Commercial Bank Performances during 1994-2001. Credit &
Financial Management Review. Retrieved on April 9, 2010 from
www.encyclopedia.com/doc/1P3-810427301.html.
2. Agenor, P. and P. Montiel, Development Macroeconomics, Chapters 5 and 14,
Princeton University Press, 1996.
3. Alemayhu Geda (2006). The Structure and Performance of Ethiopia’s Financial Sector in the
Pre and Post Reform Period: With Special Focus on Banking. Retrieved on April 2, 2010
from http//www. Social science research network.com
4. Aryeetey, E., H. Hettige, M. Nissanke and W. Steel. 1997. “Financial market
fragmentation and reforms in Ghana, Malawi, Nigeria and Tanzania”. The World Bank
Economic Review, 11 (2): 195-218
5. Bateswar, S. & Ajay, D. (2007). Banking sector reforms and performance of Indian Banking:
A comparative analysis of public, private and foreign banks. Journal of Management
practices, 1(1).
6. Chirwa (2001), Market Structure, Liberalization and Performance in the Malawian Banking
Industry, AERC, RP 108.
7. Collins, R.A. (1980). An empirical comparison of bankruptcy prediction model, Journal of
Financial Management, 9(2), 5-7.
8. Commercial Bank of Ethiopia, Annual Reports, Various Publications.
9. Diaz-Alejandro, C. “Goodbye Financial Repression, Hello Financial Crash.” Journal of
Development Economics, 19, 1985:1–24
10. Gibson, H. D., and E. Tsakalotos. (1994) “The Scope and Limits of Financial
Liberalization in Developing Countries: A Critical Survey,” Journal of Development
Studies, Vol. 30, No. 3, pp. 578–628.

81
11. Goddard J., Molyneux P. and Wilson J. O. S. (2004) “The Profitability of European
Banks: A Cross-Sectional and Dynamic Panel Analysis”, the Manchester School, Vol. 72,
No. 3. pp. 363-381
12. Huang, M.C. (1986). A Study of Domestic Bank’s Performance. Basic Finance
Publication. Retrieved from http://www.emeraldinsight.com/Insight.
13. Khan, M. & Senhadji, A. (2000). Threshold effects in the relationship between inflation and
growth. IMF Staff papers. Washington. 48(1):1 -21
14. Kiyota K., Peitsch B., and Stern R.M. (2007) “The Case for Financial Sector Liberalization
in Ethiopia” Michigan: Research Seminar in International Economics, August.
15. Kraft, E. Hofler, R. & Payne, J. (2002). Privatization, Foreign Bank Entry and Bank
Efficiency in Croatia: A Fourier-Flexible Function Stochastic Cost Frontier Analysis.
Retrieved from http://www.informaworld.com
16. Lee (2002), Financial Liberalization and Foreign Bank Entry in MENA, World Bank, May
17. Levine, R. 2000. A study of the performance of 515 banks in 16 transition economies for the
period 1994–1999. Financial econometric, 54,138.
18. Lin, C. (1998). A study of efficiency evaluation in Taiwan’s securities dealers. Securities
Finance, 58, 124
19. Maisel, L.S. (1992). Performance measurement: the balanced scorecard approach. Journal of
Cost Management, 2(2), 47-52.
20. Mckinnon, R.I. Money and Capital in Economic Development, Washington, D.C., the
Brookings Institution, 1973
21. McKinnon, R. The Order of Economic Liberalization: Financial Control in the Transition to
a Market Economy, 2nd edition, The Johns Hopkins Studies in Economic
Development, 1993.
22. National Bank Of Ethiopia: www.nbe.gov.et/financial/banks.htm), retrieved
February 2010.
23. Negarit Gazeta Proclamation 83/1994.1994, Monetary and Banking Proclamation, BSPP,
Addis Abeba.

82
24. Negarit Gazeta Proclamation 84/1994.1994, Licensing and Supervision of Banking
Businesses, BSPP, Addis Abeba.
25. Popa, G. & Mihailescu, L. (2009). EVA-Advanced Method of Performance Evaluation in
Banks. Retrieve on November 02, 2009 from http://www.management.ase.ro
/revconomia/
26. Scholtens, B. 2000. Financial Regulations and Financial System Architecture in Central
Europe. Journal of Banking and Finance, 24 (4): 525-553.
27. Seck, D., and Y. H. El Nil (1993) Financial Liberalization in Africa, World
Development, Vol. 21, No. 11, pp. 1867–81.
28. Senbet and Otchere (2005), Financial Sector Reforms in Africa Perspectives on Issues and
Policies, prepared for annual World Bank Conference on Development Economics,
Dakar Senegal, and January 2005.
29. Shaw, E. Financial Deepening in Economic Development, New York: Oxford University
Press, 1973.
30. Tarawneh, M. (2006). A Comparison of Financial Performance in the Banking Sector some
Evidence from Omani Commercial Banks. International Research Journal of finance and
Economics, ISSN. Retrieved on April 4, 2010 from http://www. Euro journals.
Com/finance.htm.
31. Tesfaye Boru (2007). The Impact of Financial Liberalization on the Ownership, Market
Structure and Performance of the Ethiopian banking Industry. Retrieved on April 2, 2010
from http://etd.aau.edu.et/dspace/handle/.
32. Tony Addison and Alemayehu Geda, (2001). Ethiopia are New Financial Sector and Its
Regulation, Discussion Paper No. 2001/55. Retrieved on April 9, 2010 from
http://www.social science research network.com
33. Vance, D.I. (2003), Financial Analysis and Decision Making: Tools and Techniques to Solve
Financial Problems and Make Effective Business Decisions. S.l: MacGraw-Hill.
34. Wilmarth (2003), Dose Financial Liberalization Increase The Likelihood of a Systematic
Banking Crisis? Evidence from the Past Three Decades and the Great Depression

83
35. Wozniewska, G. (2008), Methods of measuring the efficiency of commercial banks: an
example of polish banks. Retrieved on April 3, 2010 form http://www.
Leidykla.eu/fileadmin/Ekonomika.

84
ANNEXES

85
Annex A: Balance sheet
Commercial bank of Ethiopia
Balance sheet
At Year ending June (in million of Birr)
Assets 1976 1977 1978 1979 1980 1981
cash on hand 62 61 77 100 79 82
cash at bank 0 0 0 0 0 0
reserve account with NBE 369 183 131 70 923 340
Deposit with foreign banks 45 65 60 139 284 165
Treasury Bills 23 132 199 212 435 262
other investment/bonds 19 49 28 49 1,016 92
trust funds 0 0 0 0 0 0
Sundury Debtors & other debit balances 17 22 20 13 67 30
Net loan & Advance 317 418 552 871 749 874
customers' liability for L/C 112 111 198 203 282 350
Net fixed assets 40 38 32 35 43 26
Total 1,009 1,078 1,298 1,693 4,180 2,223
Liabilities
demand deposits 311 331 405 589 1,660 793
saving deposits 240 240 267 328 938 473
fixed deposits 123 145 116 98 217 89
foreign bank their A/C 87 12 31 122 231 169
Trust funds 0 0 0 0 0 0
short term loans 0 0 0 0 0 0
other credit balance 0 0 121 142 256 138
Margin held on L/C 29 43 64 82 108 61
Long term loans 0 0 20 17 50 17
provision for taxation 109 121 14 32 8 31
state dividend payable 0 0 0 0 0 0
other provisions 25 23 6 6 24 19
bank's liability to L/C 112 111 198 203 583 350
capital &reserves 51 53 55 63 104 81
authorized & paid 35 35 35 35 65 65
legal reserves 0 0 0 0 0 0
general reserves 16 18 20 21 39 16
retimed earning 0 0 0 0 0 0
profit & loss A/C 0.5 0.064 0.347 7 0 0
Total 1,009 1,078 1,298 1,693 4,180 2,223

86
Commercial bank of Ethiopia
Balance sheet
At Year ending June (in million of Birr)
Assets 1982 1983 1984 1985 1986 1987
cash on hand 68 71 84 89 79 87
cash at bank 0 0 0 0 0 0
reserve account with NBE 479 344 596 494 923 1,119
Deposit with foreign banks 168 16 281 230 284 261
Treasury Bills 330 361 391 435 435 464
other investment/bonds 102 603 525 1,029 1,016 1,005
trust funds 0 0 0 0 0 0
Sundury Debtors & other debit balances 29 59 52 70 67 72
Net loan & Advance 916 872 828 759 749 855
customers' liability for L/C 387 332 375 311 282 538
Net fixed assets 29 31 32 44 43 85
Total 2,509 2,835 3,164 3,458 4,180 4,489
Liabilities
demand deposits 879 1,043 1,220 1,424 1,660 1,789
saving deposits 530 608 716 810 938 1,054
fixed deposits 136 147 178 217 217 102
foreign bank their A/C 177 232 207 225 231 316
Trust funds 0 0 0 0 0 0
short term loans 0 0 0 0 0 0
other credit balance 164 215 203 220 256 324
Margin held on L/C 75 82 79 60 108 117
Long term loans 24 30 33 53 50 111
provision for taxation 31 31 35 9 8 11
state dividend payable 0 0 0 0 0 0
other provisions 21 16 14 22 24 19
bank's liability to L/C 387 332 375 311 583 538
capital &reserves 89 100 104 104 104 106
authorized & paid 65 65 65 65 65 65
legal reserves 0 0 0 0 0 0
general reserves 24 35 39 39 39 41
retimed earning 0 0 0 0 0 0
profit & loss A/C 0 0 0 0 0 0
Total 2509 2,833 3,164 3,458 4,180 4,489

87
Commercial bank of Ethiopia
Balance sheet
At Year ending June (in million of Birr)
Assets 1988 1989 1990 1991 1992
cash on hand 99 86 77 76 168
cash at bank 0 0 0 0 0
reserve account with NBE 1,093 966 1,118 921 1,268
Deposit with foreign banks 294 345 266 368 479
Treasury Bills 540 540 540 540 540
other investment/bonds 957 1,328 1,699 2 2
trust funds 0 0 0 0 0
Sundury Debtors & other debit balances 73 76 66 81 73
Net loan & Advance 1,100 1,043 935 841 976
customers' liability for L/C 582 496 360 307 353
Net fixed assets 86 141 137 139 139
Total 4,826 5,020 5,200 5,364 6,090
Liabilities
demand deposits 2,168 2,188 2,470 2,547 2,802
saving deposits 1,210 1,369 1,577 1,679 2,002
fixed deposits 118 162 141 148 164
foreign bank their A/C 61 45 43 47 45
Trust funds 0 0 0 0 0
short term loans 0 0 0 21 10
other credit balance 288 342 266 259 272
Margin held on L/C 155 139 81 104 170
Long term loans 113 158 145 120 144
provision for taxation 13 11 0.192 2 0.252
state dividend payable 0 0 0 0 0
other provisions 12 4 11 24 25
bank's liability to L/C 582 496 360 307 353
capital &reserves 106 106 104 104 104
authorized & paid 65 65 65 65 65
legal reserves 0 0 0 0 0
general reserves 41 41 40 39 39
retimed earning 0 0 0 0 0
profit & loss A/C 0 0 0 0 0
Total 4,826 5,020 5200 5,564 6,090

88
Commercial bank of Ethiopia
Balance sheet
At Year ending June (in million of Birr)
Asset 1993 1994 1995 1996 1997
cash on hand 174 199 288 324 369
cash at bank 0 0 0 0 0
reserve account with NBE 1,613 1,909 1,501 1,920 1,236
Deposit with foreign banks 999 2,085 3,444 2,223 1,850
Treasury Bills 528 527 484 757 0
other investment/bonds 2,090 2,090 2,093 2,093 2,092
trust funds 0 0 0 53 67
Sundury Debtors & other debit balances 126 187 279 353 2,642
Net loan & Advance 2,199 2,856 4,468 6,395 7,144
customers' liability for L/C 1,163 1,191 1,563 1,569 895
Net fixed assets 659 161 180 222 254
Total 9,061 11,217 14,273 15,858 16,549
Liabilities
demand deposits 3,133 3,811 4,832 5,107 5,578
saving deposits 2,255 2,856 3,660 4,596 5,106
fixed deposits 344 425 469 593 562
foreign bank their A/C 225 362 646 840 1,361
Trust funds 0 0 0 49 51
short term loans 0 0 0 0 0
other credit balance 1,093 1,447 1,712 1,515 1,282
Margin held on L/C 500 599 741 533 462
Long term loans 174 155 59 77 47
provision for taxation 5 72 145 167 183
state dividend payable 0 0 43 115 18
other provisions 65 65 63 62 62
bank's liability to L/C 1,163 1,191 1,536 1,569 895
capital &reserves 104 182 366 633 940
authorized & paid 65 0 182 217 620
legal reserves 0 0 41 140 198
general reserves 39 50 65 65 65
retained earning 0 0 35 35 0
profit & loss A/C 0 0 43 175 58
Total 9,061 11,217 14,273 15,858 16,549

89
Commercial bank of Ethiopia
Balance sheet
At Year ending June (in million of Birr)
Asset 1999 2000 2001 2002 2003
cash on hand 391 316 440 430 409
cash at bank 0 0 0 0 0
reserve account with NBE 2,193 4,080 2,142 2,262 3,196
Deposit with foreign banks 2,170 1,873 1,719 2,157 2,291
Treasury Bills 240 586 1,800 3,081 7,558
other investment/bonds 2,093 2,099 5,121 5,125 2,481
trust funds 24 41 0 0 0
Sundury Debtors & other debit balances 1,665 1,683 1,335 1,507 1,782
Net loan & Advance 8,430 8,909 8,699 7,357 6,075
customers' liability for L/C 1,461 0 0
Net fixed assets 226 241 233 227 208
Total 18,893 19,828 21,489 22,146 24,200
Liabilities
demand deposits 6,896 7,867 8,954 9,223 10,907
saving deposits 5,994 6,672 7,494 8,138 7,845
fixed deposits 436 449 504 492 383
foreign bank their A/C 339 686 519 677 627
Trust funds 26 41 0 0 0
short term loans 0 0 0
other credit balance 1,457 1,505 2,511 2,757 2,990
Margin held on L/C 784 813 0 0 0
Long term loans 81 3 0 0 0
provision for taxation 167 204 194 30 171
state dividend payable 43 237 12 0 0
other provisions 62 62 0 0 0
bank's liability to L/C 1,461 0 0 0
capital &reserves 1,127 1,289 1,301 929 1,277
authorized & paid 620 620 620 620 520
legal reserves 299 402 407 407 227
general reserves 65 65 65 64 0
retained earning 0 202 209 262 0
profit & loss A/C 143 0 0 0
Total 18,893 19,828 21,489 22,146 24,200

90
Commercial bank of Ethiopia
Balance sheet
At Year ending June (in million of Birr)
Asset 2004 2005 2006 2007 2008 2009
cash on hand 406 669 573 665 991 1,011
cash at bank 0 50 0 580 226 0
reserve account with NBE 3,934 11,304 6,656 9,204 8,872 7,748
Deposit with foreign banks 2,090 837 1,392 1,056 1,236 1,450
Treasury Bills 10,189 4,610 12,586 14,155 6,512 5,410
other investment/bonds 2,828 5,488 4,566 7,979 14,403 19,830
trust funds 22 19
Sundury Debtors & other debit balances 2,004 2,428 2,194 1,206 1,577 3,315
Net loan & Advance 6,296 7,533 7,653 8,370 16,275 20,257
customers' liability for L/C
Net fixed assets 228 228 229 241 299 391
Total 27,975 33,169 35,849 43,456 50,416 59,411
Liabilities
demand deposits 12,707 13,896 14,908 19,654 22,167 25,207
saving deposits 9,326 10,631 11,814 12,840 15,139 17,761
fixed deposits 373 407 1,405 301 328 521
foreign bank their A/C 125 433 159 72
Trust funds
short term loans
other credit balance 2,408 3,692 3,996 4,670 6,564 5,513
Margin held on L/C 1,387 2,465 1,743 1,323 1,610 2,618
Long term loans
provision for taxation 153 216 318 306 48 785
state dividend payable 1,966
other provisions 64
bank's liability to L/C
capital &reserves 1,496 1,429 1,506 4,220 4,560 5,041
authorized & paid 620 620 620 4,000 4,000 4,000
legal reserves 624 677 886 220 556 1,036
general reserves 55 65
retained earning 187 67 4 4
profit & loss A/C
Total 27,975 33,169 35,849 43,456 50,416 59,411

91
Annex B: Income Statement
Commercial Bank of Ethiopia
Income statement
Year-ending June (millions of Birr)
description 1976 1977 1978 1979 1980 1981
interest income 47 37 53 108 140 102
interest Expense 22 20 21 34 67 35
Net interest income 25 18 32 74 72 671
Service charge % commission income 20 16 20 44 17 17
other income 6 5 49 9 41 30
Total Non interest income 25 21 25 53 58 47
Net interest income & non interest
income 51 39 57 126 130 114
employees salary & benefits 18 13 14 23 27 22
provision for doubtful loans 3 2 2 4 27 2
general expenses 9 5 6 14 24 22
total noninterest expenses 31 21 22 40 78 47
prior year adjustment 0 0 0 0 0 0
operating income before tax 20 18 35 87 53 67
Tax 5 7 14 41 8 30
net income after taxes & provision 14 10 21 46 45 37

92
Commercial Bank of Ethiopia
Income statement
Year-ending June (millions of Birr)
1982 1983 1984 1985 1986 1987
description
interest income 105 117 132 131 140 127
interest Expense 38 43 58 59 67 57
Net interest income 671 74 74 72 72 70
Service charge % commission income 19 17 17 18 17 22
other income 29 32 32 33 41 44
Total Non interest income 49 50 49 51 58 66
Net interest income & non interest
income 116 124 123 123 130 136
employees salary & benefits 23 24 25 26 27 27
provision for doubtful loans 2 9 16 17 27 27
general expenses 21 24 22 22 24 18
total non interest expenses 46 57 63 65 78 72
prior year adjustment 0 0 0 0 0 0
operating income before tax 70 67 67 57 53 61
Tax 31 31 35 9 8 11
net income after taxes & provision 39 36 31 48 45 50
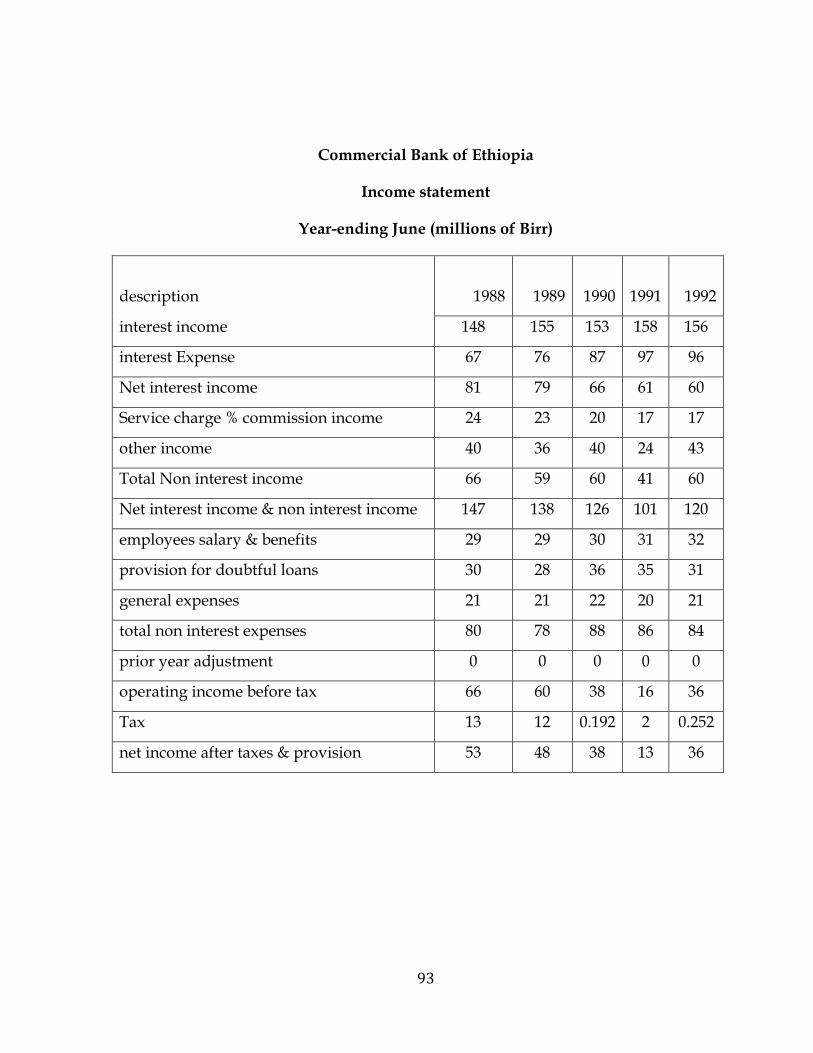
93
Commercial Bank of Ethiopia
Income statement
Year-ending June (millions of Birr)
description 1988 1989 1990 1991 1992
interest income 148 155 153 158 156
interest Expense 67 76 87 97 96
Net interest income 81 79 66 61 60
Service charge % commission income 24 23 20 17 17
other income 40 36 40 24 43
Total Non interest income 66 59 60 41 60
Net interest income & non interest income 147 138 126 101 120
employees salary & benefits 29 29 30 31 32
provision for doubtful loans 30 28 36 35 31
general expenses 21 21 22 20 21
total non interest expenses 80 78 88 86 84
prior year adjustment 0 0 0 0 0
operating income before tax 66 60 38 16 36
Tax 13 12 0.192 2 0.252
net income after taxes & provision 53 48 38 13 36

94
Commercial Bank of Ethiopia
Income statement
Year-ending June (millions of Birr)
1993 1994 1995 1996 1997 1998
description
interest income 274 475 682 924 836 813
interest Expense 172 267 336 440 379 380
Net interest income 102 208 346 484 457 433
Service charge % commission income 38 56 70 93 74 77
other income 59 100 157 127 202 109
Total Non interest income 97 156 227 220 276 186
Net interest income & non interest
income 199 364 573 704 733 619
employees salary & benefits 38 47 54 61 65 75
provision for doubtful loans 72 42 128 54 392 0
general expenses 31 78 36 63 57 90
total non interest expenses 141 167 218 178 514 165
prior year adjustment 0 0 0 0 0 0
operating income before tax 57 243 356 525 219 454
Tax 5 75 145 168 185 133
net income after taxes & provision 52 168 211 357 34 321

95
Commercial Bank of Ethiopia
Income statement
Year-ending June (millions of Birr)
description 1999 2000 2001 2002 2003 2004
interest income 876 1,000 987 586 670 680
interest Expense 358 382 428 395 251 268
Net interest income 518 618 559 191 419 412
Service charge % commission income 78 76 95 216 97 126
other income 276 244 259 202 531 462
Total Non interest income 354 320 354 418 628 588
Net interest income & non interest
income 872 938 913 609 1,047 1,000
employees salary & benefits 90 95 113 129 133 162
provision for doubtful loans 370 106 488 627 80 212
general expenses 80 117 99 360 118 139
total non interest expenses 540 318 700 1,116 331 513
prior year adjustment 70
operating income before tax 263 620 213 507 716 487
Tax 197 208 194 36 171 153
net income after taxes & provision 66 412 19 471 545 334

96
Commercial Bank of Ethiopia
Income statement
Year-ending June (millions of Birr)
description 2005 2006 2007 2008 2009
interest income 646 853 1,036 1,541 2,353
interest Expense 291 330 351 534 614
Net interest income 355 523 685 1,007 1,744
Service charge % commission income 397 181 200 279 974
other income 343 790 1,017 1,152 516
Total Non-interest income 740 971 1,217 1,431 1,490
Net interest income & non interest
income 1,095 1,494 1,902 2,438 3,234
employees salary & benefits 175 187 218 285 325
provision for doubtful loans
general expenses 131 187 514 285 193
total non-interest expenses 306 374 732 570 518
prior year adjustment
operating income before tax 789 1,120 1,170 1,868 2,716
Tax 217 318 306 502 795
net income after taxes & provision 572 802 864 1,361 1,921

97
Annex C: Questionnaire
Mekelle University College of Business and Economics
Department of Accounting and Finance Master of Finance and Investment
Questionnaire on “Financial Performance evaluation of the commercial bank of Ethiopia
in the pre and post liberalization”.
Dear Sir/Madam
This survey is conducted as partial fulfillment for the completion of Master of Finance
and Investment at Mekelle University .The general purpose of this study is to evaluate
the performance of commercial bank of Ethiopia in the pre and post financial
liberalization. I would like to invite your participation in this survey by filling up this
questionnaire. All information will be treated with the strict confidentiality. In other
word, individuals who respond to this questionnaire will not be identified.
General Guideline:
Please put a tick “√” mark for those questions that you think right.
Give your short and precise answers for those followed by blank spaces.
Your frank response is vital for the success of the study.
This research is designed to collect information only for academic purpose.
Part I – GENERAL INFORMATION
1. Gender 1. Male □ 2.Female □
2. In which age group is you belong?
1. Less than 25 □ 2. 25 to 35 □ 3. 36 to 55 □ 4. 55 and above

98
3. What is your highest and recent educational status?
1. 12 grades complete □ 3. First degree □
2. College diploma □ 4. Second degree and above □
5. What is your experience in the work?
1. Below one year □ 2. 1- 5 year □ 3. 6-10 years □ 4. Above 10 years □
6. Your position in the bank
1. Employee □ 3. Middle level Manager □ 2. Officer □ 4. Senior manager □
PART II: BANK PERFORMANCE QUESTIONNAIRE
This section of the questionnaire deals with your opinions on the performance of the
commercial bank of Ethiopia regarding to the liberalization. The interest here is to
evaluate the performance of the commercial bank of Ethiopia in the pre and post
liberalization and to take your ideas for further improvement of the performance of
commercial bank of Ethiopia. Please give your response based on questions presented
below.
1. Do you believe the liberalization reform measures undertaken by the government
brought a significant change in the performance of bank? 1. Yes □ 2. No □
2. Your response in question one is “No” could you suggest the reasons for this
----------------------------------------------------------------------------------------------------------------
3. Your response in question one is “Yes” could you suggest the reasons for this
---------------------------------------------------------------------------------------------------------------
4. Do you believe the current involvement of the government in the banking industry
makes the bank beneficial? 1. Yes □ 2. No □
5. Your response in question seven is “Yes” could you suggest your reasons
------------------------------------------------------------------------------------------------------------------

99
6. Your response in question seven is “No” could you suggest your reasons
--------------------------------------------------------------------------------------------------------------
7. Do you believe financial liberalization brought significant change on the profitability
performance of the bank? 1. Yes □ 2. No □
8. If your answer is “Yes” for question three what type of change is observed in the
industry -----------------------------------------------------------------------------------------------------
9. If your answer is “No” for question three please state your reasons
---------------------------------------------------------------------------------------------------------------
10. Dose the financial liberalization strengthened the regulation or the supervision of
the bank? 1. Yes □ 2. No □ 3. Don’t know □
11. In your opinion could you suggest the areas that need further liberalization or
reform measures in the banking industry?
---------------------------------------------------------------------------------------------------------------
You’re Suggestion
__________________________________________________________________________
______________________________________________________________________________
Thank You!!!