performance evaluation of the trmm precipitation estimation using ground-based radars from the gpm...
TRANSCRIPT
Journal of Atmospheric and Solar-Terrestrial Physics 77 (2012) 194–208
Contents lists available at SciVerse ScienceDirect
Journal of Atmospheric and Solar-Terrestrial Physics
1364-68
doi:10.1
n Corr
E-m
journal homepage: www.elsevier.com/locate/jastp
Performance evaluation of the TRMM precipitation estimation usingground-based radars from the GPM validation network
Tanvir Islam n, Miguel A. Rico-Ramirez, Dawei Han, Prashant K. Srivastava, Asnor M. Ishak
Department of Civil Engineering, University of Bristol, Bristol, UK
a r t i c l e i n f o
Article history:
Received 11 April 2011
Received in revised form
23 December 2011
Accepted 2 January 2012Available online 10 January 2012
Keywords:
Microwave remote sensing
Reflectivity
Global rainfall
Satellite mission
Ground validation
Retrieval algorithms
Active and passive
NEXRAD (WSR-88D)
Stratiform and convective
Rainfall variability
26/$ - see front matter & 2012 Elsevier Ltd. A
016/j.jastp.2012.01.001
esponding author. Tel.: þ44 1173315724; fa
ail address: [email protected] (T. Isla
a b s t r a c t
The Global Precipitation Measurement (GPM) mission is scheduled to fly in the year of 2013 to measure
the earth’s precipitation structure. Since the precipitation measurement by the GPM platform will be
very similar to its predecessor, the Tropical Rainfall Measuring Mission (TRMM), hence, the develop-
ment of GPM algorithms to improve precipitation retrievals can be addressed through the lessons
learnt from the former TRMM mission in terms of precipitation retrievals and its associated
uncertainty. To support the future GPM mission, this paper assesses the performance of the TRMM
precipitation estimation using ground-based radars from the GPM validation network. A total of 22
significant overpass instantaneous events from 22 different radar sites has been evaluated in view of
different surface and rain type flags. The overall results show that attenuation corrected reflectivity
from the TRMM precipitation radar agrees well to the measured reflectivity from ground based radars
with correlation coefficients r¼0.91 (without frequency adjustment) and r¼0.92 (with frequency
adjustment). However, the correlation decreases by 10–30%, once the reflectivity are transformed to
rainfall rates. The lower correlations on the basis of precipitation estimation by the TRMM are exhibited
over the coast than those of ocean and land surface terrain. Taking into account the rain type flags, the
analysis shows a poor correlation during convective precipitations, in particular, those retrieved from
the TRMM precipitation radar. In contrast, the combined algorithm, which utilizes both radar and
microwave imager instrument on-board TRMM, outperforms throughout the analysis, yet, there is a
scope to improve the precipitation retrievals.
& 2012 Elsevier Ltd. All rights reserved.
1. Introduction
Precipitation is one of the fundamental variables of earth’shydrological cycle. From profound understanding of the globalwater and energy cycle to improving weather, climate andhydrological forecasting, accurate measurements of precipitationare very imperative. Despite the correct knowledge of intensityand distribution of precipitation, the problems associated withweather, climate and hydro-meteorological aspects cannot beunraveled. At the same time, it is one of the most difficult physicalquantities to measure accurately due to its random character intemporal and spatial scales. Conventionally, rain gauges are beingused for decades to estimate precipitation over a particularregion. However, the performance of precipitation estimationwith the rain gauges depends upon the density of the gaugesdistributed in the given area. Establishment of a good gaugedensity network in the remote area has always been a challenge.Furthermore, in developing countries, the gauges are sparsely
ll rights reserved.
x: þ44 1173315719.
m).
distributed, and over the ocean, the gauges are almost non-existent. Besides, ground based radars have shown a greatpromise since its invention during the second world war byproviding the spatial extent of precipitation (Hunter, 1954).Conversely, again, the problem is that maintaining a good cover-age of the radar network is difficult, and normally radars are alsoavailable in those areas where rain gauges are well covered.Transformation of the radar reflectivity factors into precipitationrates at certain altitude is another problematic issue. Indeed,weather radars are subjected to several errors and uncertaintieslike ground clutter, anomalous propagation, attenuation, beamblockage, bright band contamination, etc. (Bringi et al., 2011;Rico-Ramirez and Cluckie, 2007, 2008; Rico-Ramirez et al., 2007).
Satellite-based precipitation estimates are an alternativeoption by studying the emission and scattering properties ofclouds and precipitation in the atmosphere. For more accuratethree dimensional precipitation retrievals, the first ever spaceborn active microwave sensor, the precipitation radar (PR) wasdeployed along with the TRMM microwave imager (TMI) aboardTRMM in 1997 (Kidd and Levizzani, 2011; Kozu et al., 2001). Theterm TRMM represents here as Tropical Rainfall MeasuringMission, designed to monitor and study tropical rainfall. It has a

Fig. 1. TRMM data processing overview
T. Islam et al. / Journal of Atmospheric and Solar-Terrestrial Physics 77 (2012) 194–208 195
limited earth view covering only the diurnal cycle within the tropicalregion ranging from 351S to 351N. To improve the coverage, the nextgeneration Global Precipitation Measurement (GPM) mission isplanned to launch in 2013 to study precipitation (rain, snow, ice) ina global scale. In fact, this mission is the successor of the TRMM,which is at the end of its life limit. In comparison with the TRMM, theGPM will measure precipitation to higher latitudes of up to 651 withmore frequent sampling and higher sensitivity to precipitation, thusquantifying rain and snow. The core GPM satellite will carry both thedual-frequency precipitation radar (DPR) and the GPM microwaveimager (GMI). The GMI instrument is a conical-scanning, microwaveradiometer carrying channels similar to those of the TMI withaddition of four high frequency millimeter-wave channels of166 GHz and 183 GHz. Relative to the single frequency of Ku-bandin the TRMM, the DPR consists of Ku and Ka band dual frequencyradars. The key specifications and scanning science of the GMI andDPR in the GPM can be found in Furukawa et al. (2007), Masunagaand Kummerow (2005), Seto and Iguchi (2011), among others.
Success of the GPM mission depends upon the algorithm devel-opment for both GMI and DPR. Since the structure and concept ofthe GPM core component are very similar to the TRMM, theunderstanding and scope of future GPM precipitation estimationcan be explored through the lessons learnt from the TRMM. In thisstudy, the relative performance of the TRMM precipitation estima-tion is assessed using ground based radars from the GPM validationnetwork (VN) supporting the GPM mission in terms of under-standing satellite-based rainfall retrieval uncertainty and algorithmdevelopment. We refer to the past TRMM ground validation studies,which are conducted primarily in four validation sites—the Kwaja-lein Atoll, Republic of the Marshall Islands; Melbourne, Florida;Houston, Texas; and Darwin, Australia (Wang and Wolff, 2010;Wolff et al., 2005). Nevertheless, we have adopted the similarapproach herein using a new validation network radar dataset,established for the GPM validation studies. The remainder of thispaper is structured as follows. Section 2 summarizes the dataset andmethodology used in the study, Section 3 describes the performanceof the TRMM precipitation estimation with respect to ground basedradars from the GPM VN and Section 4 provides the conclusions.
Source: NASA.
2. Data sources and analysis methodology
2.1. TRMM dataset
The TRMM has been in operation since its launch in 1997 tomeasure rainfall, in particular, in the tropical area (Kummerowet al., 2000; Simpson et al., 1996). The platform carries a dualcomplement of passive and active sensors, the TMI as passive, andPR as active sensor to collect rain information. The TMI measuresthe intensity of emission at five channel frequencies: 10.7, 19.4,21.3, 37, 85.5 GHz. The PR is an electronically scanning radar,operating at a frequency of 13.8 GHz that measures the 3-Drainfall distribution over both land and ocean, and defines thelayer depth of the precipitation. A detailed description of theTRMM sensors is discussed in Kummerow et al. (1998).
This study mainly evaluates the TRMM version 6 data, thereflectivity data from 1C21 and 2A25 products, and the rain ratedata from 2A25 and 2B31 products. For the sake of brevity, anoverview of data processing for these products are illustrated inFig. 1, obtained from NASA. Summarizing, the PR first level dataproduct 1B21 originates radar return power, which is related tothe reflectivity (Zm). From the 1B21 product, the reflectivities arethen included in the 1C21 product. At ranges near earth’s surface,Zm(r) is dominated by surface return, and surface clutter echoesmay be present in the 1C21 data product. In addition, the radarechoes at high frequency of 13.8 GHz suffer from significant
attenuation and the raw radar reflectivity factors in the 1C21product need to be corrected for attenuation. The 2A21 productprovides information of path attenuation, whereas the 2A23product provides rain type, bright band height and freezing heightinformation. The 2A25 product is the TRMM standard algorithmthat provides the vertical profiles of attenuation corrected reflec-tivity factor (Ze) and rain rate (R), taking into account inputs fromthe products 1C21, 2A21 and 2A23. The attenuation correction isbased on a combination of the surface reference method (Iguchiand Meneghini, 1994) and Hitschfield–Bordan method (Hitschfeldand Bordan, 1954), and the standard algorithm uses a globallyaveraged drop size distribution (DSD) to obtain the Ze–R relation-ship. The rain profiling algorithm and the path integratedattenuation (PIA) correction scheme for the TRMM PR areexplained in Iguchi et al. (2000) and Meneghini et al. (2000). Onthe other hand, the 2B31 product, which uses the TRMM PR/TMIcombined algorithm, generates rain rate by combining the infor-mation collected from both the PR and the TMI. The algorithmuses the mean rain rates and a confidence interval from bothsensors, and ultimately uses a Bayesian approach for the bestrainfall estimation (Kummerow et al., 2000).
2.2. Ground-based radar dataset
As part of the GPM ground validation system (GVS), a validationnetwork (VN) is set up to perform a direct match-up of space-based
T. Islam et al. / Journal of Atmospheric and Solar-Terrestrial Physics 77 (2012) 194–208196
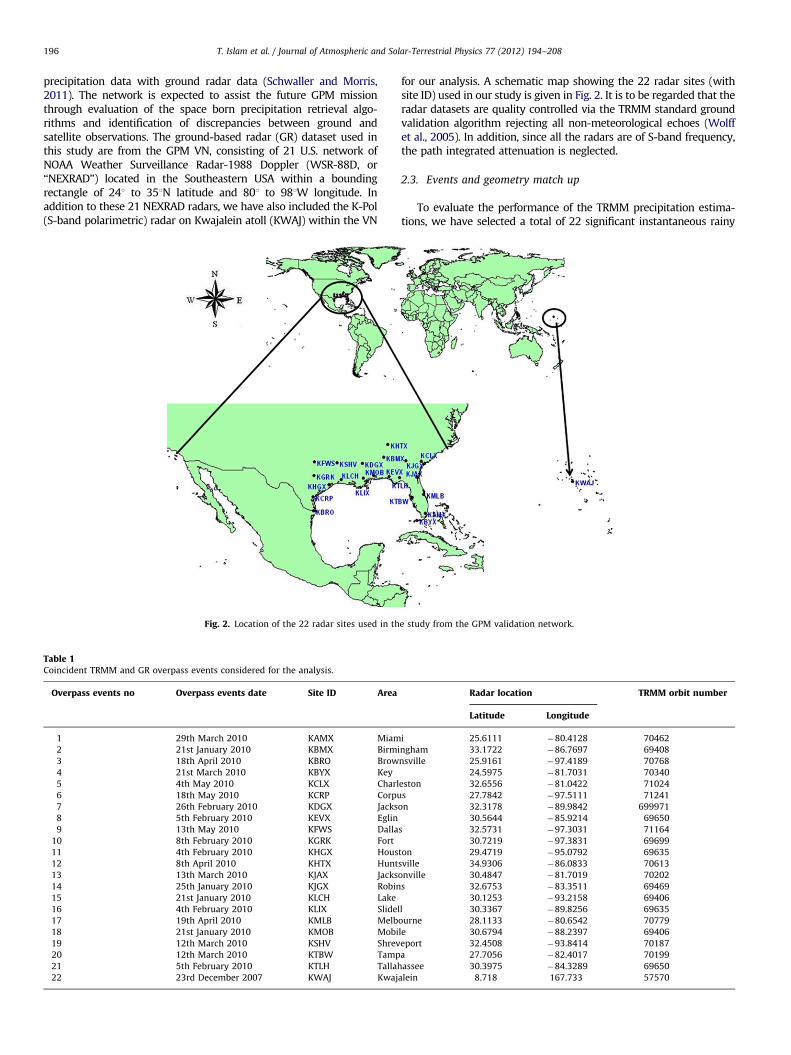
precipitation data with ground radar data (Schwaller and Morris,2011). The network is expected to assist the future GPM missionthrough evaluation of the space born precipitation retrieval algo-rithms and identification of discrepancies between ground andsatellite observations. The ground-based radar (GR) dataset used inthis study are from the GPM VN, consisting of 21 U.S. network ofNOAA Weather Surveillance Radar-1988 Doppler (WSR-88D, or‘‘NEXRAD’’) located in the Southeastern USA within a boundingrectangle of 241 to 351N latitude and 801 to 981W longitude. Inaddition to these 21 NEXRAD radars, we have also included the K-Pol(S-band polarimetric) radar on Kwajalein atoll (KWAJ) within the VN
Fig. 2. Location of the 22 radar sites used in th
Table 1Coincident TRMM and GR overpass events considered for the analysis.
Overpass events no Overpass events date Site ID Area
1 29th March 2010 KAMX Miam
2 21st January 2010 KBMX Birmi
3 18th April 2010 KBRO Brow
4 21st March 2010 KBYX Key
5 4th May 2010 KCLX Charl
6 18th May 2010 KCRP Corpu
7 26th February 2010 KDGX Jacks
8 5th February 2010 KEVX Eglin
9 13th May 2010 KFWS Dalla
10 8th February 2010 KGRK Fort
11 4th February 2010 KHGX Hous
12 8th April 2010 KHTX Hunt
13 13th March 2010 KJAX Jacks
14 25th January 2010 KJGX Robin
15 21st January 2010 KLCH Lake
16 4th February 2010 KLIX Slidel
17 19th April 2010 KMLB Melb
18 21st January 2010 KMOB Mobi
19 12th March 2010 KSHV Shrev
20 12th March 2010 KTBW Tamp
21 5th February 2010 KTLH Tallah
22 23rd December 2007 KWAJ Kwaj
for our analysis. A schematic map showing the 22 radar sites (withsite ID) used in our study is given in Fig. 2. It is to be regarded that theradar datasets are quality controlled via the TRMM standard groundvalidation algorithm rejecting all non-meteorological echoes (Wolffet al., 2005). In addition, since all the radars are of S-band frequency,the path integrated attenuation is neglected.
2.3. Events and geometry match up
To evaluate the performance of the TRMM precipitation estima-tions, we have selected a total of 22 significant instantaneous rainy
e study from the GPM validation network.
Radar location TRMM orbit number
Latitude Longitude
i 25.6111 �80.4128 70462
ngham 33.1722 �86.7697 69408
nsville 25.9161 �97.4189 70768
24.5975 �81.7031 70340
eston 32.6556 �81.0422 71024
s 27.7842 �97.5111 71241
on 32.3178 �89.9842 699971
30.5644 �85.9214 69650
s 32.5731 �97.3031 71164
30.7219 �97.3831 69699
ton 29.4719 �95.0792 69635
sville 34.9306 �86.0833 70613
onville 30.4847 �81.7019 70202
s 32.6753 �83.3511 69469
30.1253 �93.2158 69406
l 30.3367 �89.8256 69635
ourne 28.1133 �80.6542 70779
le 30.6794 �88.2397 69406
eport 32.4508 �93.8414 70187
a 27.7056 �82.4017 70199
assee 30.3975 �84.3289 69650
alein 8.718 167.733 57570

Table 2Summary of the datasets used in the study.
Data description Source Remarks
GR reflectivity (ZGR) VN ground radars Horizontally averaged
GR rain rate (RGR) Z–R relation Z¼300R1.4
Raw TRMM PR reflectivity (ZPRR) TRMM 1C21 product Vertically averaged
Attenuation corrected TRMM PR reflectivity (ZPRC) TRMM 2A25 product Vertically averaged
TRMM PR Rain rate (RPR (VA)) TRMM 2A25 product Vertically averaged
TRMM PR near-surface rain rate (RPR (DE)) TRMM 2A25 product Directly extracted
TRMM PR/TMI near-surface rain rate (RPR/TMI (DE)) TRMM 2B31 product Directly extracted
Surface flag (land/ocean/coastal) TRMM 2A25 product Directly extracted
Rain type flag TRMM 2A25 product Directly extracted
T. Islam et al. / Journal of Atmospheric and Solar-Terrestrial Physics 77 (2012) 194–208 197
events at the location of the ground-based radar sites. The events areselected in such a way that the TRMM passes the ground-basedradars within 100 km of range. The coincident overpass eventsanalyzed in this study are listed in Table 1, considering that theTRMM overpasses at or just prior to the GR scan moment. Thesignificant precipitation event is termed as the event in which at least100 grid points within 100 km of the radar indicate rain certain in theTRMM PR 2A25 product. However, cross validation and inter-com-parison studies between ground-based radar and space-born radar ona point by point basis can be a challenging task since errors areinduced by the mismatch of propagation paths, resolution volumesize and time synchronization. To minimize these possible errors, it isessential to match both space and ground-based remote sensors inspace and time. The PR and GR data used in this study aregeometrically matched up based on the method described by Bolenand Chandrasekar (2003). This method makes use of the variableresolution volume matching between the ground and space system tominimize the potential geometric distortion weight. A summary ofthe dataset considered in this study are given in Table 2. In fact, theGR data fields are horizontally averaged over an approximatelycircular area centered on each intersecting PR ray’s parallax adjustedprofile. The data fields: raw reflectivity from TRMM 1C21 (ZPRR),attenuation corrected reflectivity from TRMM 2A25 (ZPRC) and rainrate from TRMM 2A25 (RPR(VA)) are vertically averaged between thetop and bottom height of the GR elevation sweep that it intersects.The data fields: near surface rain rate from TRMM 2A25 (RPR(DE)), nearsurface combined PR/TMI rain rate from TRMM 2B31 (RPR/TMI(DE)),surface flag (land/ocean/coastal) from TRMM 2A25 and rain type flag(convective/stratiform) from TRMM 2A25 are directly extracted. Thenear-surface rain rate is termed as the lowest point in the clutter-freerange profile. For detailed description of the VN algorithm and dataprocessing, the readers are suggested to see the recent article ofSchwaller and Morris (2011). In all 22 events, we have used theground nearest elevation angle for our analysis, which is 0.4681 forNEXRAD radars and 0.4061 for KWAJ radar. In the analysis, for eachoverpass, we have analyzed those data points only if either the TRMMPR or VN GR detects any rain at that particular element. Furthermore,the data points are discarded of those showing ground clutters in theGR dataset.
3. Performance evaluation
This section depicts the performance of the TRMM precipita-tion estimation as compared to the ground based radars from theGPM VN. The assessment is carried out by combining all thematching data points collected from the selected 22 overpassevents.
3.1. Evaluation of reflectivity factors
Evaluating the TRMM PR reflectivity by means of those fromthe GR data as a reference is quite cumbersome since the
operating frequencies between the two products are different.The former is operated at Ku-band while the GR is operated atS-band frequencies. The backscattering characteristics of hydro-meteors observed among these two radar frequencies are quitedifferent thus may lead to the inconsistency in reflectivity factors’measurements. Intrusively, radar reflectivity factor is equivalentto the sixth moment of the drop size distribution assumingRayleigh scattering, in which the precipitation particle sizes aremuch smaller than the radar wavelength. At longer wavelength,for example at S-band (about 10-cm wavelength), this assump-tion is valid. Nevertheless, at shorter wavelength of Ku-band(about 2 cm), the Rayleigh approximation may not be true sincethere is a possibility of yielding bigger particles into non-Rayleighscattering region. Normally, Rayleigh scattering model breaksdown when the rainfall particle size is greater than 10% of theradar wavelength (i.e., 2 mm for Ku band and 10 mm for S band)and large storms may have rain drop sizes of up to 5 mm. Hence,to correctly infer the reflectivity data between these two fre-quencies, it is useful to apply some frequency scale factorsadjusting the non-Rayleigh scattering effects. Currently, theGPM VN statistical tool uses a quadratic regression equationsuggested by Liao and Meneghini (2009) to adjust the S-bandreflectivity factors to the Ku-band in the rain region:
ZGRðKu�bandÞ ¼ �1:50393þ1:07274ZGRðS�bandÞ þ0:000165393Z2GRðS�bandÞ
ð1Þ
where ZGR(Ku-band) is the adjusted radar reflectivity factor at Ku-band and ZGR(S-band) is the measured radar reflectivity factor atS-band in dBZ. The equation is based on the assumption of anexponential Marshall–Palmer rain drop size distribution(Marshall and Palmer, 1948), and follows the Beard and Chuang(1987) raindrop shape model assuming raindrops as oblatespheroids without canting.
The reflectivity statistics from the selected 22 overpass eventswith and without employing the frequency scaling correctionfactors to the GR data in comparison with the TRMM PR attenua-tion corrected 2A25 product is summarized in Table 3. Thestatistics are also incorporated in view of different TRMM surfaceand rain type flags of ‘‘Ocean’’, ‘‘Land’’, ‘‘Coast’’, ‘‘Stratiform’’ and‘‘Convective’’. One can note that the minimum reflectivitiesobserved by the PR are relatively larger than those observed bythe GRs, either at Ku-band adjusted or S-band measured observa-tions. The minimum ZPRC values ranged from 12.01 dBZ (land andstratiform) to 15.33 dBZ (convective) in comparison with0.58 dBZ (coast and stratiform) to 3.63 dBZ (convective) forZGR(Ku-band) and 1.94 dBZ (coast and stratiform) to 4.78 dBZ (con-vective) for ZGR(S-band). This discrepancy is due to the fact ofsensitivity variation among the two radars. The TRMM PR has asensitivity of 18 dBZ while the GR can sense the reflectivity up to�15 dBZ precisely. Taking into account the excellent sensitivityof the GR, no conditional threshold has been applied to calculatethe mean values in the table. As such, this will allow us to

Table 3Reflectivity (dBZ) statistics from the selected 22 overpass events.
ZPRC ZGR(Ku-band) ZGR(S-band) PR-ZGR(Ku-band) PR-ZGR(S-band)
Minimum Maximum Mean Minimum Maximum Mean Minimum Maximum Mean Mean bias Mean bias
All 12.01 54.71 29.97 0.58 58.53 30.71 1.94 55.49 29.88 �0.74 0.09
Ocean 13.91 51.61 28.87 3.48 58.36 29.93 4.65 55.33 29.17 �1.06 �0.30
Land 12.01 54.71 30.42 1.72 58.53 31.06 3.01 55.49 30.21 �0.64 0.22
Coast 13.27 52.36 29.42 0.58 58.26 30.15 1.94 55.24 29.37 �0.73 0.06
Stratiform 12.01 52.26 28.77 0.58 55.38 29.33 1.94 52.60 28.61 �0.56 0.16
Convective 15.53 54.71 37.51 3.63 58.53 39.42 4.78 55.49 37.92 �1.91 �0.41
0 20 40 60 800
2
4
6
PD
F (%
)
All
0 20 40 60 800
2
4
6
PD
F (%
)
Ocean
0 20 40 60 800
2
4
6
PD
F (%
)
Reflectivity (dBZ)Land
0 20 40 60 800
2
4
6
PD
F (%
)
Reflectivity (dBZ)Coast
0 20 40 60 800
2
4
6
Reflectivity (dBZ)
PD
F (%
)
Reflectivity (dBZ)Stratiform
0 20 40 60 800
2
4
6
Reflectivity (dBZ)
PD
F (%
)
Reflectivity (dBZ)Convective
VN GR (S−band)VN GR (Ku−band)TRMM PR (Corrected)TRMM PR (Raw)
Fig. 3. PDFs of reflectivity from the VN GR (S-band), the VN GR (Ku-band), the TRMM PR (Corrected) and the TRMM PR (Raw) for different flags: all, ocean, land, coast,
stratiform and convective.
T. Islam et al. / Journal of Atmospheric and Solar-Terrestrial Physics 77 (2012) 194–208198
investigate the TRMM PR and GR bias in a robust way. It will bestimulating to discover how the TRMM PR performs overall inrain spectrum with the compromise of the instrumental sensitiv-ity limitations. The calculated mean values of ZPRC agree well withthe ZGR(Ku-band) and the ZGR(S-band). With the exception of theconvective cases, the mean biases are within about 1 dB usingKu-band adjusted or S-band measured as a reference, which is thePR’s precision. Nonetheless, the PR exhibits lesser bias relative tothe S-band GR measurements than that of the Ku-band adjustedvalues. A similar finding has been reported in the previous studyof Schwaller and Morris (2011). They also experienced a degrada-tion of PR–GR bias once the scaling correction factors wereapplied below the bright band region (i.e. the melting region).
To better understand the TRMM PR performance, the prob-ability distributions functions (PDF) of the VN GR (S-band), VN GR(Ku-band), the TRMM PR (Corrected) and the TRMM PR (Raw)reflectivity estimations are constructed in Fig. 3 for different flags.The results show that the ZPRR significantly overestimates thequantities in all the cases, taking ZGR as a reference. Although theZPRR embraces rain attenuation effects thus weakening the signalsdue to absorption and scattering in the precipitation media, it isto be noted that the TRMM 1C21 product includes reflectivitydata at all observed range bins including surface noise and clutterechoes. As this work uses the GR–PR match-up at the lowestelevation angles, clutter and noisy echoes are reflected from thesurface, resulting in very high values in ZPRR. In contrast, the 2A25

T. Islam et al. / Journal of Atmospheric and Solar-Terrestrial Physics 77 (2012) 194–208 199
outputs (ZPRC) exclude the range bins containing noisy and clutterechoes. As such, the ZPRC follows relatively more similar distribu-tions to those shown by the ZGR (S and Ku bands). Apparently,there are no noticeable differences of ZGR distribution betweenthe S-band measured and Ku-band adjusted cases, apart from aslight shift off ZGR (Ku-band) from the ZGR (S-band). The figure alsoshows that a significant fraction of samples lay near 30 dBZ(except for ‘‘convective’’ flag). Using VN GR as a reference, if welook for ‘‘All’’ flag, the corrected TRMM PR reflectivity ZPRC showsbetter distribution agreement over 30 dBZ. However, below thisvalue and over 18 dBZ, the ZPRC underestimates the reflectivityfactor, while just below 18 dBZ, the quantities are overestimated,differing to a maximum of 5 dBZ approximately. The patterns areconsistent over the ocean, land, and coast, and during stratiformprecipitation, reaching unimodal peaks at near 30 dBZ. However,for convective precipitation, the ZPRC matches fairly well to ZGR
with a slight underestimation of 1–2 dB reaching a unimodal peakat near 40 dBZ. Nonetheless, it is to be noted that comparisonsthrough PDFs might not provide the full picture of the TRMM PRperformance as inherent noise and inadequate sampling sizecontributes to the errors.
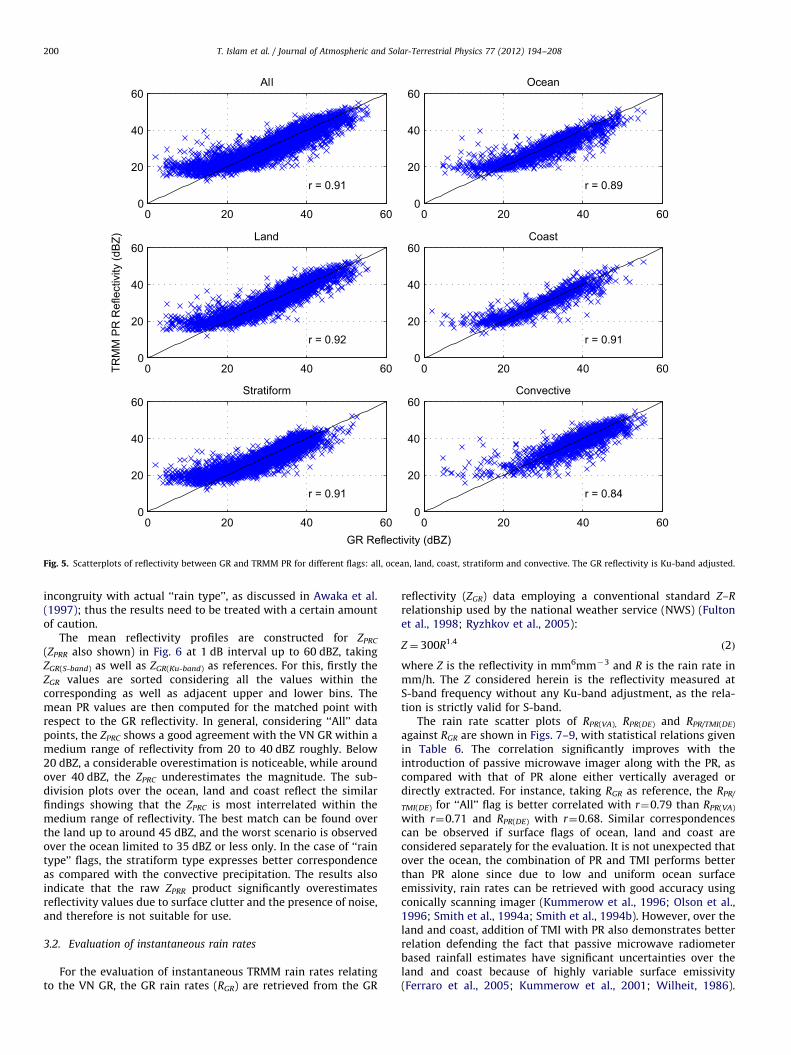
Detailed judgment of the TRMM precipitation estimation skillwith respect to the VN ground-based radars can be obtained viascatter plots. The scatter plots between the GR reflectivity versusthe TRMM PR corrected reflectivity are shown in Fig. 4 (for S-bandGR) and Fig. 5 (for Ku-band GR). In both circumstances, the ZGR–
ZPRC indicates that the two quantities are nearly alike in the range
0 20 40 600
20
40
60
GR Re
TRM
M P
R R
efle
ctiv
ity (d
BZ)
All
r = 0.91
0 20 40 600
20
40
60Land
r = 0.92
0 20 40 600
20
40
60Stratiform
r = 0.91
Fig. 4. Scatterplots of reflectivity between GR and TRMM PR for different flags: all, oce
over 18 dBZ, though the PR overestimates the reflectivity factorbelow this threshold. As mentioned, the PR has a low sensitivityof 18 dBZ, yet, the PR values over 18 dBZ, within its sensitivityand for low reflectivity spectrums, is actually the overestimationto that observed in the VN GR. This issue has been investigated inpast studies. This region, where the PR returns higher reflectivitybut GR measures the reflectivity below the PR sensitivity value of18 dBZ, can also be treated as ‘‘PR missing echo area’’, as stated inSchumacher and Houze (2000). For more comprehensive evalua-tion, the scatter plots of ZGR–ZPRC, for different flags such as ocean,land, coast, stratiform and convective, are also shown in therespective figures. The statistical relations of the scatter plots aregiven in Tables 4 and 5 correspondingly using the VN GR asreference. Similar to the probability distributions, the statisticsillustrate very alike metrices for S-band measured and Ku-bandadjusted GR reflectivities. If we take the Pearson coefficient ofcorrelation (r) as a performance indicator, the ZPRC agrees wellwith the ZGR with correlation coefficients r¼0.91 (S-band) andr¼0.92 (Ku-band) taking into account all the data points from the22 overpass events (‘‘All’’ flag). Among three surface terrain flags,the best correlation is observed over land with r¼0.92 for S-bandand r¼0.93 for Ku-band, which is not too different from the ocean(r¼0.89) and the coast (r¼0.91). If we consider ‘‘rain type’’classification, ‘‘stratiform’’ precipitation (r¼0.91) is more highlycorrelated than that of ‘‘convective’’ precipitation (r¼0.84). It isworth noting that since the ‘‘rain type’’ classification is taken fromthe TRMM product, the classification type itself might show the
flectivity (dBZ)
0 20 40 600
20
40
60Ocean
r = 0.89
0 20 40 600
20
40
60Coast
r = 0.91
0 20 40 600
20
40
60Convectiv e
r = 0.84
an, land, coast, stratiform and convective. The GR reflectivity is S-band measured.
0 20 40 600
20
40
60
GR Reflectivity (dBZ)
TRM
M P
R R
efle
ctiv
ity (d
BZ)
All
r = 0.91
0 20 40 600
20
40
60Ocean
r = 0.89
0 20 40 600
20
40
60Land
r = 0.92
0 20 40 600
20
40
60Coast
r = 0.91
0 20 40 600
20
40
60Stratiform
r = 0.91
0 20 40 600
20
40
60Convective
r = 0.84
Fig. 5. Scatterplots of reflectivity between GR and TRMM PR for different flags: all, ocean, land, coast, stratiform and convective. The GR reflectivity is Ku-band adjusted.
T. Islam et al. / Journal of Atmospheric and Solar-Terrestrial Physics 77 (2012) 194–208200
incongruity with actual ‘‘rain type’’, as discussed in Awaka et al.(1997); thus the results need to be treated with a certain amountof caution.
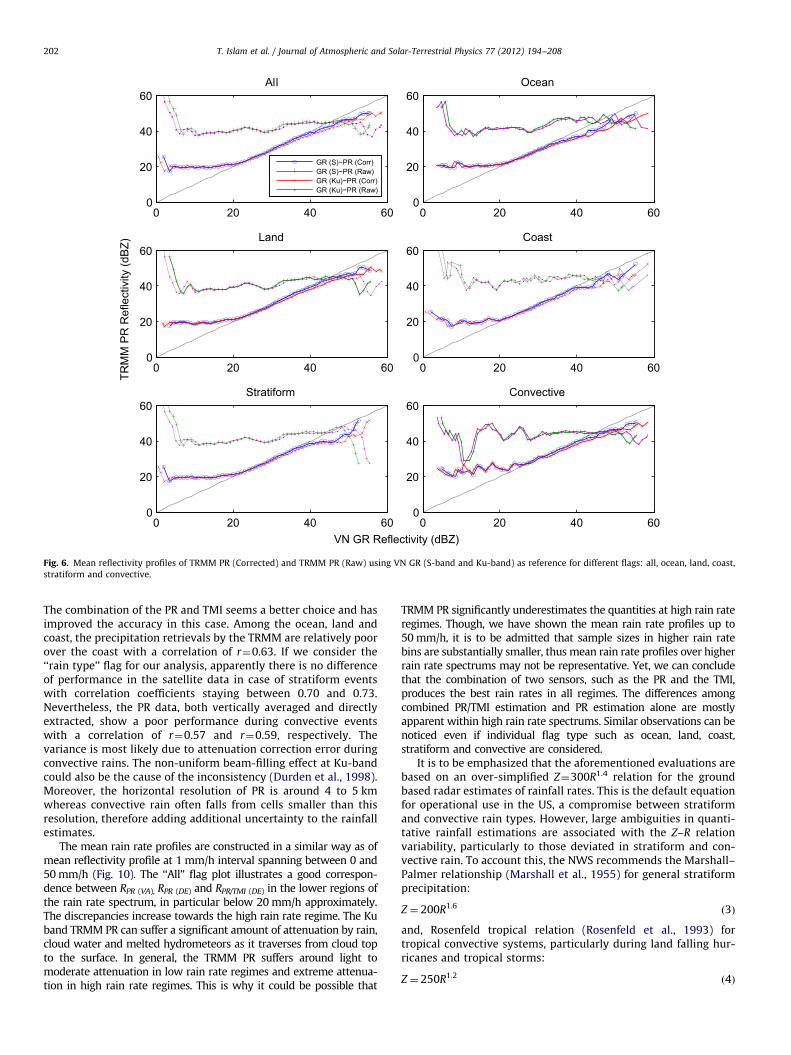
The mean reflectivity profiles are constructed for ZPRC
(ZPRR also shown) in Fig. 6 at 1 dB interval up to 60 dBZ, takingZGR(S-band) as well as ZGR(Ku-band) as references. For this, firstly theZGR values are sorted considering all the values within thecorresponding as well as adjacent upper and lower bins. Themean PR values are then computed for the matched point withrespect to the GR reflectivity. In general, considering ‘‘All’’ datapoints, the ZPRC shows a good agreement with the VN GR within amedium range of reflectivity from 20 to 40 dBZ roughly. Below20 dBZ, a considerable overestimation is noticeable, while aroundover 40 dBZ, the ZPRC underestimates the magnitude. The sub-division plots over the ocean, land and coast reflect the similarfindings showing that the ZPRC is most interrelated within themedium range of reflectivity. The best match can be found overthe land up to around 45 dBZ, and the worst scenario is observedover the ocean limited to 35 dBZ or less only. In the case of ‘‘raintype’’ flags, the stratiform type expresses better correspondenceas compared with the convective precipitation. The results alsoindicate that the raw ZPRR product significantly overestimatesreflectivity values due to surface clutter and the presence of noise,and therefore is not suitable for use.
3.2. Evaluation of instantaneous rain rates
For the evaluation of instantaneous TRMM rain rates relatingto the VN GR, the GR rain rates (RGR) are retrieved from the GR
reflectivity (ZGR) data employing a conventional standard Z–R
relationship used by the national weather service (NWS) (Fultonet al., 1998; Ryzhkov et al., 2005):
Z ¼ 300R1:4ð2Þ
where Z is the reflectivity in mm6mm�3 and R is the rain rate inmm/h. The Z considered herein is the reflectivity measured atS-band frequency without any Ku-band adjustment, as the rela-tion is strictly valid for S-band.
The rain rate scatter plots of RPR(VA), RPR(DE) and RPR/TMI(DE)
against RGR are shown in Figs. 7–9, with statistical relations givenin Table 6. The correlation significantly improves with theintroduction of passive microwave imager along with the PR, ascompared with that of PR alone either vertically averaged ordirectly extracted. For instance, taking RGR as reference, the RPR/
TMI(DE) for ‘‘All’’ flag is better correlated with r¼0.79 than RPR(VA)
with r¼0.71 and RPR(DE) with r¼0.68. Similar correspondencescan be observed if surface flags of ocean, land and coast areconsidered separately for the evaluation. It is not unexpected thatover the ocean, the combination of PR and TMI performs betterthan PR alone since due to low and uniform ocean surfaceemissivity, rain rates can be retrieved with good accuracy usingconically scanning imager (Kummerow et al., 1996; Olson et al.,1996; Smith et al., 1994a; Smith et al., 1994b). However, over theland and coast, addition of TMI with PR also demonstrates betterrelation defending the fact that passive microwave radiometerbased rainfall estimates have significant uncertainties over theland and coast because of highly variable surface emissivity(Ferraro et al., 2005; Kummerow et al., 2001; Wilheit, 1986).

Table 4Statistical relations of reflectivity from the satellite data using GR (S-band) as reference.
Satellitedata
Flag Meansquarederror, MSE(dBZ)
Normalized meansquared error,NMSE (dBZ)
Root meansquared error,RMSE (dBZ)
Normalized rootmean square error,NRMSE (dBZ)
Meanabsoluteerror, MAE(dBZ)
Mean absoluterelative error,MARE (dBZ)
Pearsoncoefficient ofcorrelation, r
Coefficient ofdetermination,d
Coefficientofefficiency,e
Maximumabsolute error,MXAE (dBZ)
Maximumabsolute relativeerror, MXARE(dBZ)
TRMM PR
(Corrected)
All 10.06 0.16 3.17 0.40 2.15 0.09 0.91 0.84 0.84 26.07 12.07
Ocean 13.54 0.21 3.68 0.46 2.45 0.11 0.89 0.79 0.79 26.07 3.58
Land 8.76 0.15 2.96 0.38 2.04 0.09 0.92 0.86 0.85 24.62 5.33
Coast 11.05 0.18 3.32 0.42 2.19 0.11 0.91 0.82 0.82 23.47 12.07
Stratiform 8.64 0.18 2.94 0.42 1.99 0.09 0.91 0.83 0.82 23.47 12.07
Convective 18.86 0.30 4.34 0.54 3.14 0.11 0.84 0.71 0.70 26.07 5.15
Table 5Statistical relations of reflectivity from the satellite data using GR (Ku-band adjusted) as reference.
Satellitedata
Flag Meansquarederror, MSE(dBZ)
Normalized meansquared error,NMSE (dBZ)
Root meansquared error,RMSE (dBZ)
Normalized rootmean square error,NRMSE (dBZ)
Meanabsoluteerror, MAE(dBZ)
Mean absoluterelative error,MARE (dBZ)
Pearsoncoefficient ofcorrelation, r
Coefficient ofdetermination,d
Coefficientofefficiency,e
Maximumabsolute error,MXAE (dBZ)
Maximumabsolute relativeerror, MXARE(dBZ)
TRMM PR
(Corrected)
All 12.87 0.18 3.59 0.42 2.50 0.11 0.92 0.84 0.82 26.86 42.69
Ocean 17.78 0.24 4.22 0.49 2.87 0.12 0.89 0.79 0.76 26.86 5.10
Land 11.07 0.16 3.33 0.40 2.36 0.10 0.93 0.86 0.84 25.77 10.04
Coast 14.13 0.19 3.76 0.44 2.59 0.14 0.91 0.82 0.81 24.83 42.69
Stratiform 10.84 0.19 3.29 0.43 2.30 0.11 0.91 0.83 0.81 24.83 42.69
Convective 25.51 0.34 5.05 0.58 3.74 0.12 0.84 0.71 0.66 26.86 7.10
T.
Islam
eta
l./
Jou
rna
lo
fA
tmo
sph
erica
nd
Sola
r-Terrestria
lP
hy
sics7
7(2
01
2)
19
4–
20
82
01
0 20 40 600
20
40
60
VN GR Reflectivity (dBZ)
TRM
M P
R R
efle
ctiv
ity (d
BZ)
All
0 20 40 600
20
40
60Ocean
0 20 40 600
20
40
60Land
0 20 40 600
20
40
60Coast
0 20 40 600
20
40
60Stratiform
0 20 40 600
20
40
60Convective
GR (S)−PR (Corr)GR (S)−PR (Raw)GR (Ku)−PR (Corr)GR (Ku)−PR (Raw)
Fig. 6. Mean reflectivity profiles of TRMM PR (Corrected) and TRMM PR (Raw) using VN GR (S-band and Ku-band) as reference for different flags: all, ocean, land, coast,
stratiform and convective.
T. Islam et al. / Journal of Atmospheric and Solar-Terrestrial Physics 77 (2012) 194–208202
The combination of the PR and TMI seems a better choice and hasimproved the accuracy in this case. Among the ocean, land andcoast, the precipitation retrievals by the TRMM are relatively poorover the coast with a correlation of r¼0.63. If we consider the‘‘rain type’’ flag for our analysis, apparently there is no differenceof performance in the satellite data in case of stratiform eventswith correlation coefficients staying between 0.70 and 0.73.Nevertheless, the PR data, both vertically averaged and directlyextracted, show a poor performance during convective eventswith a correlation of r¼0.57 and r¼0.59, respectively. Thevariance is most likely due to attenuation correction error duringconvective rains. The non-uniform beam-filling effect at Ku-bandcould also be the cause of the inconsistency (Durden et al., 1998).Moreover, the horizontal resolution of PR is around 4 to 5 kmwhereas convective rain often falls from cells smaller than thisresolution, therefore adding additional uncertainty to the rainfallestimates.
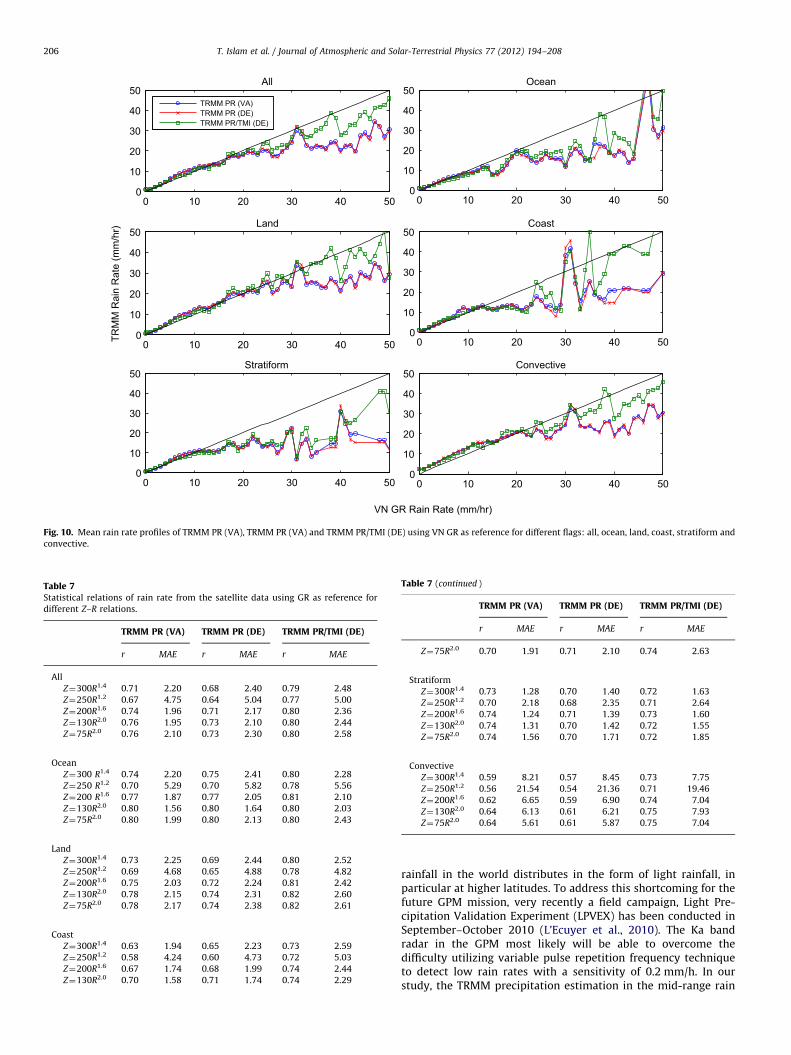
The mean rain rate profiles are constructed in a similar way as ofmean reflectivity profile at 1 mm/h interval spanning between 0 and50 mm/h (Fig. 10). The ‘‘All’’ flag plot illustrates a good correspon-dence between RPR (VA), RPR (DE) and RPR/TMI (DE) in the lower regions ofthe rain rate spectrum, in particular below 20 mm/h approximately.The discrepancies increase towards the high rain rate regime. The Kuband TRMM PR can suffer a significant amount of attenuation by rain,cloud water and melted hydrometeors as it traverses from cloud topto the surface. In general, the TRMM PR suffers around light tomoderate attenuation in low rain rate regimes and extreme attenua-tion in high rain rate regimes. This is why it could be possible that
TRMM PR significantly underestimates the quantities at high rain rateregimes. Though, we have shown the mean rain rate profiles up to50 mm/h, it is to be admitted that sample sizes in higher rain ratebins are substantially smaller, thus mean rain rate profiles over higherrain rate spectrums may not be representative. Yet, we can concludethat the combination of two sensors, such as the PR and the TMI,produces the best rain rates in all regimes. The differences amongcombined PR/TMI estimation and PR estimation alone are mostlyapparent within high rain rate spectrums. Similar observations can benoticed even if individual flag type such as ocean, land, coast,stratiform and convective are considered.
It is to be emphasized that the aforementioned evaluations arebased on an over-simplified Z¼300R1.4 relation for the groundbased radar estimates of rainfall rates. This is the default equationfor operational use in the US, a compromise between stratiformand convective rain types. However, large ambiguities in quanti-tative rainfall estimations are associated with the Z–R relationvariability, particularly to those deviated in stratiform and con-vective rain. To account this, the NWS recommends the Marshall–Palmer relationship (Marshall et al., 1955) for general stratiformprecipitation:
Z ¼ 200R1:6ð3Þ
and, Rosenfeld tropical relation (Rosenfeld et al., 1993) fortropical convective systems, particularly during land falling hur-ricanes and tropical storms:
Z ¼ 250R1:2ð4Þ

0.01 0. 1 1 10 100 1,0000.01
0. 1
1
10
100
1,000
GR Rain Rate (mm/hr)
TRM
M P
R R
ain
Rat
e (m
m/h
r) [V
A]
All
0.01 0. 1 1 10 100 1,0000.01
0. 1
1
10
100
1,000Ocean
0.01 0. 1 1 10 100 1,0000.01
0. 1
1
10
100
1,000Land
0.01 0. 1 1 10 100 1,0000.01
0. 1
1
10
100
1,000Coast
0.01 0. 1 1 10 100 1,0000.01
0. 1
1
10
100
1,000Stratiform
0.01 0. 1 1 10 100 1,0000.01
0. 1
1
10
100
1,000Convective
r = 0.71 r = 0.74
r = 0.73
r = 0.73 r = 0.59
r = 0.63
Fig. 7. Scatterplots of rain rate between GR and TRMM PR (VA) for different flags: all, ocean, land, coast, stratiform, and convective.
Fig. 8. Scatterplots of rain rate between GR and TRMM PR (DE) for different flagships: all, ocean, land, coast, stratiform and convective.
T. Islam et al. / Journal of Atmospheric and Solar-Terrestrial Physics 77 (2012) 194–208 203
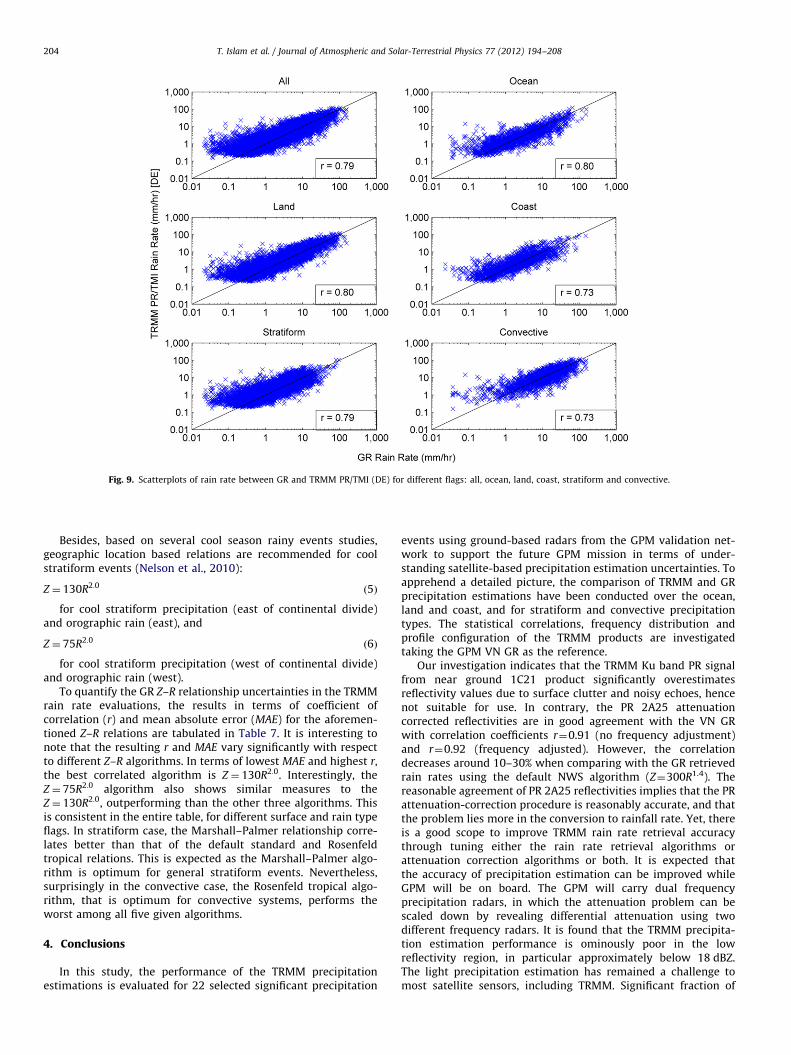
Fig. 9. Scatterplots of rain rate between GR and TRMM PR/TMI (DE) for different flags: all, ocean, land, coast, stratiform and convective.
T. Islam et al. / Journal of Atmospheric and Solar-Terrestrial Physics 77 (2012) 194–208204
Besides, based on several cool season rainy events studies,geographic location based relations are recommended for coolstratiform events (Nelson et al., 2010):
Z ¼ 130R2:0ð5Þ
for cool stratiform precipitation (east of continental divide)and orographic rain (east), and
Z ¼ 75R2:0ð6Þ
for cool stratiform precipitation (west of continental divide)and orographic rain (west).
To quantify the GR Z–R relationship uncertainties in the TRMMrain rate evaluations, the results in terms of coefficient ofcorrelation (r) and mean absolute error (MAE) for the aforemen-tioned Z–R relations are tabulated in Table 7. It is interesting tonote that the resulting r and MAE vary significantly with respectto different Z–R algorithms. In terms of lowest MAE and highest r,the best correlated algorithm is Z ¼ 130R2:0. Interestingly, theZ ¼ 75R2:0 algorithm also shows similar measures to theZ ¼ 130R2:0, outperforming than the other three algorithms. Thisis consistent in the entire table, for different surface and rain typeflags. In stratiform case, the Marshall–Palmer relationship corre-lates better than that of the default standard and Rosenfeldtropical relations. This is expected as the Marshall–Palmer algo-rithm is optimum for general stratiform events. Nevertheless,surprisingly in the convective case, the Rosenfeld tropical algo-rithm, that is optimum for convective systems, performs theworst among all five given algorithms.
4. Conclusions
In this study, the performance of the TRMM precipitationestimations is evaluated for 22 selected significant precipitation
events using ground-based radars from the GPM validation net-work to support the future GPM mission in terms of under-standing satellite-based precipitation estimation uncertainties. Toapprehend a detailed picture, the comparison of TRMM and GRprecipitation estimations have been conducted over the ocean,land and coast, and for stratiform and convective precipitationtypes. The statistical correlations, frequency distribution andprofile configuration of the TRMM products are investigatedtaking the GPM VN GR as the reference.
Our investigation indicates that the TRMM Ku band PR signalfrom near ground 1C21 product significantly overestimatesreflectivity values due to surface clutter and noisy echoes, hencenot suitable for use. In contrary, the PR 2A25 attenuationcorrected reflectivities are in good agreement with the VN GRwith correlation coefficients r¼0.91 (no frequency adjustment)and r¼0.92 (frequency adjusted). However, the correlationdecreases around 10–30% when comparing with the GR retrievedrain rates using the default NWS algorithm (Z¼300R1.4). Thereasonable agreement of PR 2A25 reflectivities implies that the PRattenuation-correction procedure is reasonably accurate, and thatthe problem lies more in the conversion to rainfall rate. Yet, thereis a good scope to improve TRMM rain rate retrieval accuracythrough tuning either the rain rate retrieval algorithms orattenuation correction algorithms or both. It is expected thatthe accuracy of precipitation estimation can be improved whileGPM will be on board. The GPM will carry dual frequencyprecipitation radars, in which the attenuation problem can bescaled down by revealing differential attenuation using twodifferent frequency radars. It is found that the TRMM precipita-tion estimation performance is ominously poor in the lowreflectivity region, in particular approximately below 18 dBZ.The light precipitation estimation has remained a challenge tomost satellite sensors, including TRMM. Significant fraction of
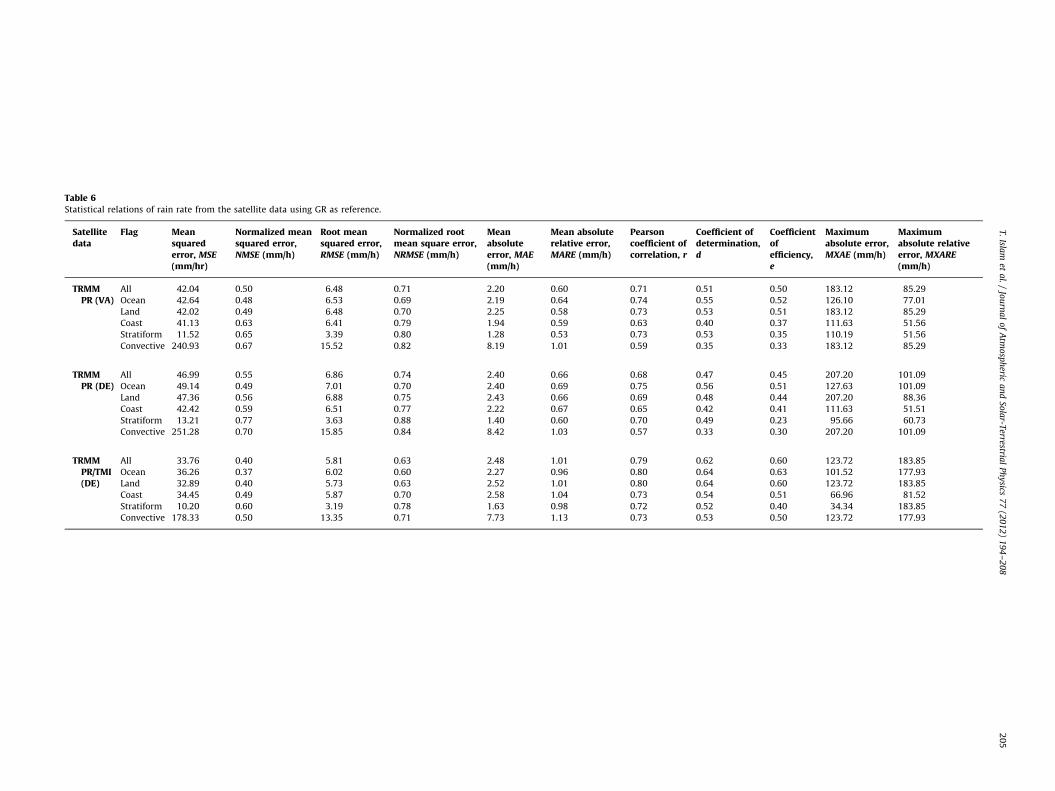
Table 6Statistical relations of rain rate from the satellite data using GR as reference.
Satellitedata
Flag Meansquarederror, MSE(mm/hr)
Normalized meansquared error,NMSE (mm/h)
Root meansquared error,RMSE (mm/h)
Normalized rootmean square error,NRMSE (mm/h)
Meanabsoluteerror, MAE(mm/h)
Mean absoluterelative error,MARE (mm/h)
Pearsoncoefficient ofcorrelation, r
Coefficient ofdetermination,d
Coefficientofefficiency,e
Maximumabsolute error,MXAE (mm/h)
Maximumabsolute relativeerror, MXARE(mm/h)
TRMMPR (VA)
All 42.04 0.50 6.48 0.71 2.20 0.60 0.71 0.51 0.50 183.12 85.29
Ocean 42.64 0.48 6.53 0.69 2.19 0.64 0.74 0.55 0.52 126.10 77.01
Land 42.02 0.49 6.48 0.70 2.25 0.58 0.73 0.53 0.51 183.12 85.29
Coast 41.13 0.63 6.41 0.79 1.94 0.59 0.63 0.40 0.37 111.63 51.56
Stratiform 11.52 0.65 3.39 0.80 1.28 0.53 0.73 0.53 0.35 110.19 51.56
Convective 240.93 0.67 15.52 0.82 8.19 1.01 0.59 0.35 0.33 183.12 85.29
TRMMPR (DE)
All 46.99 0.55 6.86 0.74 2.40 0.66 0.68 0.47 0.45 207.20 101.09
Ocean 49.14 0.49 7.01 0.70 2.40 0.69 0.75 0.56 0.51 127.63 101.09
Land 47.36 0.56 6.88 0.75 2.43 0.66 0.69 0.48 0.44 207.20 88.36
Coast 42.42 0.59 6.51 0.77 2.22 0.67 0.65 0.42 0.41 111.63 51.51
Stratiform 13.21 0.77 3.63 0.88 1.40 0.60 0.70 0.49 0.23 95.66 60.73
Convective 251.28 0.70 15.85 0.84 8.42 1.03 0.57 0.33 0.30 207.20 101.09
TRMMPR/TMI(DE)
All 33.76 0.40 5.81 0.63 2.48 1.01 0.79 0.62 0.60 123.72 183.85
Ocean 36.26 0.37 6.02 0.60 2.27 0.96 0.80 0.64 0.63 101.52 177.93
Land 32.89 0.40 5.73 0.63 2.52 1.01 0.80 0.64 0.60 123.72 183.85
Coast 34.45 0.49 5.87 0.70 2.58 1.04 0.73 0.54 0.51 66.96 81.52
Stratiform 10.20 0.60 3.19 0.78 1.63 0.98 0.72 0.52 0.40 34.34 183.85
Convective 178.33 0.50 13.35 0.71 7.73 1.13 0.73 0.53 0.50 123.72 177.93
T.
Islam
eta
l./
Jou
rna
lo
fA
tmo
sph
erica
nd
Sola
r-Terrestria
lP
hy
sics7
7(2
01
2)
19
4–
20
82
05
0 10 20 30 40 500
10
20
30
40
50All
0 10 20 30 40 500
10
20
30
40
50Ocean
0 10 20 30 40 500
10
20
30
40
50
TRM
M R
ain
Rat
e (m
m/h
r) Land
0 10 20 30 40 500
10
20
30
40
50Coast
0 10 20 30 40 500
10
20
30
40
50Stratiform
0 10 20 30 40 500
10
20
30
40
50
VN GR Rain Rate (mm/hr)
Convective
TRMM PR (VA)TRMM PR (DE)TRMM PR/TMI (DE)
Fig. 10. Mean rain rate profiles of TRMM PR (VA), TRMM PR (VA) and TRMM PR/TMI (DE) using VN GR as reference for different flags: all, ocean, land, coast, stratiform and
convective.
Table 7Statistical relations of rain rate from the satellite data using GR as reference for
different Z–R relations.
TRMM PR (VA) TRMM PR (DE) TRMM PR/TMI (DE)
r MAE r MAE r MAE
All
Z¼300R1.4 0.71 2.20 0.68 2.40 0.79 2.48
Z¼250R1.2 0.67 4.75 0.64 5.04 0.77 5.00
Z¼200R1.6 0.74 1.96 0.71 2.17 0.80 2.36
Z¼130R2.0 0.76 1.95 0.73 2.10 0.80 2.44
Z¼75R2.0 0.76 2.10 0.73 2.30 0.80 2.58
Ocean
Z¼300 R1.4 0.74 2.20 0.75 2.41 0.80 2.28
Z¼250 R1.2 0.70 5.29 0.70 5.82 0.78 5.56
Z¼200 R1.6 0.77 1.87 0.77 2.05 0.81 2.10
Z¼130R2.0 0.80 1.56 0.80 1.64 0.80 2.03
Z¼75R2.0 0.80 1.99 0.80 2.13 0.80 2.43
Land
Z¼300R1.4 0.73 2.25 0.69 2.44 0.80 2.52
Z¼250R1.2 0.69 4.68 0.65 4.88 0.78 4.82
Z¼200R1.6 0.75 2.03 0.72 2.24 0.81 2.42
Z¼130R2.0 0.78 2.15 0.74 2.31 0.82 2.60
Z¼75R2.0 0.78 2.17 0.74 2.38 0.82 2.61
Coast
Z¼300R1.4 0.63 1.94 0.65 2.23 0.73 2.59
Z¼250R1.2 0.58 4.24 0.60 4.73 0.72 5.03
Z¼200R1.6 0.67 1.74 0.68 1.99 0.74 2.44
Z¼130R2.0 0.70 1.58 0.71 1.74 0.74 2.29
Table 7 (continued )
TRMM PR (VA) TRMM PR (DE) TRMM PR/TMI (DE)
r MAE r MAE r MAE
Z¼75R2.0 0.70 1.91 0.71 2.10 0.74 2.63
Stratiform
Z¼300R1.4 0.73 1.28 0.70 1.40 0.72 1.63
Z¼250R1.2 0.70 2.18 0.68 2.35 0.71 2.64
Z¼200R1.6 0.74 1.24 0.71 1.39 0.73 1.60
Z¼130R2.0 0.74 1.31 0.70 1.42 0.72 1.55
Z¼75R2.0 0.74 1.56 0.70 1.71 0.72 1.85
Convective
Z¼300R1.4 0.59 8.21 0.57 8.45 0.73 7.75
Z¼250R1.2 0.56 21.54 0.54 21.36 0.71 19.46
Z¼200R1.6 0.62 6.65 0.59 6.90 0.74 7.04
Z¼130R2.0 0.64 6.13 0.61 6.21 0.75 7.93
Z¼75R2.0 0.64 5.61 0.61 5.87 0.75 7.04
T. Islam et al. / Journal of Atmospheric and Solar-Terrestrial Physics 77 (2012) 194–208206
rainfall in the world distributes in the form of light rainfall, inparticular at higher latitudes. To address this shortcoming for thefuture GPM mission, very recently a field campaign, Light Pre-cipitation Validation Experiment (LPVEX) has been conducted inSeptember–October 2010 (L’Ecuyer et al., 2010). The Ka bandradar in the GPM most likely will be able to overcome thedifficulty utilizing variable pulse repetition frequency techniqueto detect low rain rates with a sensitivity of 0.2 mm/h. In ourstudy, the TRMM precipitation estimation in the mid-range rain
T. Islam et al. / Journal of Atmospheric and Solar-Terrestrial Physics 77 (2012) 194–208 207
spectrum agrees well with the VN GR. However, some notablevariances are found for higher rain regimes. For convective raintype, there is a lower correlation of r¼0.57 for the active sensor.Furthermore, the variances have been observed dependent upongeographical terrain. For instance, the precipitation retrievals arefound worst over the coast, more specifically by the active sensorshowing a low value of correlation (r¼0.63).
When comparing the TRMM PR estimates with the GR data, errorsarising from time synchronization, matched up geometric angles,non-uniform beam filling (NUBF), and calibration errors need to betaken into account. Additionally, numerous researchers have raisedthe errors and inconsistencies associated with the PR V6 algorithm(Iguchi et al., 2009). Improving the rainfall estimates, the algorithmversion has been recently updated to version 7 (V7) in July 2011.Notable changes include, improved path integrated attenuationcorrection, new rain type classification scheme, the use of raindropshape model, inclusion of a new Ze–R relation, and introduction ofNUBF correction. Henceforth, comparing to our results, it would beinteresting to see how the suggested changes may improve theestimates of rainfall with respect to the ground-based radars.
Moreover, it needs to be admitted that the ground-based radarsare also subjected to uncertainties. In addition, the algorithmZ¼300R1.4 used to compute rain rates from reflectivity might alsocontribute errors in rainfall quantities. The performance variationshave also been noticed in using different NWS recommended Z–R
relations. Nevertheless, one thing is clear, that is, the best TRMM rainrate estimation can be obtained through the combination of bothactive and passive sensors. Based on our analysis, the combinedPR/TMI-based precipitation estimations are consistently in goodagreement to the ground-based radar observation as compared tothe PR alone. It can also be concluded that future DPR/GMI combinedalgorithm will play a key role by providing precipitation data on aglobal scale during the GPM era, and yet there is still a lot of work tobe done to improve the TRMM precipitation estimation.
Acknowledgments
The authors would like to acknowledge National Aeronauticsand Space Administration (NASA) for providing the GPM Valida-tion Network and TRMM dataset. The authors extend theirappreciation to Mathew Schwaller (GPM Ground ValidationSystem Manager, NASA/GSFC), Kenneth R Morris (GPM Project,NASA/GSFC), Toshio Iguchi (NICT) and Toshiaki Kozu (ShimaneUniversity) for their guidance and discussions regarding theTRMM and GPM VN science.
References
Awaka, J., Iguchi, T., Kumagai, H., Okamoto, K., 1997. Rain type classificationalgorithm for TRMM precipitation radar, geoscience and remote sensing, 1997.IGARSS ‘97. In: Remote Sensing—A Scientific Vision for Sustainable Develop-ment, 1997 IEEE International, pp. 1633–1635.
Beard, K.V., Chuang, C., 1987. A new model for the equilibrium shape of raindrops.Journal of the Atmospheric Sciences 44, 1509–1524.
Bolen, S.M., Chandrasekar, V., 2003. Methodology for aligning and comparingspaceborne radar and ground-based radar observations. Journal of Atmo-spheric and Oceanic Technology 20, 647–659.
Bringi, V.N., Rico-Ramirez, M.A., Thurai, M., 2011. Rainfall estimation with anOperational Polarimetric C-Band Radar in the United Kingdom: comparisonwith a gauge network and error analysis. Journal of Hydrometeorology 12,935–954.
Durden, S.L., Haddad, Z.S., Kitiyakara, A., Li, F.K., 1998. Effects of nonuniform beamfilling on rainfall retrieval for the TRMM precipitation radar. Journal ofAtmospheric and Oceanic Technology 15, 635–646.
Ferraro, R.R., Weng, F.Z., Grody, N.C., Zhao, L.M., Meng, H., Kongoli, C., Pellegrino, P.,Qiu, S., Dean, C., 2005. NOAA operational hydrological products derived fromthe advanced microwave sounding unit. IEEE Transactions on Geoscience andRemote Sensing 43, 1036–1049.
Fulton, R.A., Breidenbach, J.P., Seo, D.J., Miller, D.A., O’Bannon, T., 1998. The WSR-88D rainfall algorithm. Weather and Forecasting 13, 377–395.
Furukawa, K., Hanado, H., Hyakusoku, Y., Ishii, Y., Kojima, M., Takahashi, N., Iguchi,T., Okumura, M., Ieee, 2007. Preliminary design of the spaceborne dual-frequency precipitation radar for the global precipitation measurement,Igarss: 2007. In: Proceedings of the IEEE International Geoscience and RemoteSensing Symposium, Vols 1–12—Sensing and Understanding Our Planet. IEEE,New York, pp. 3551–3554.
Hitschfeld, W., Bordan, J., 1954. Errors inherent in the radar measurement ofrainfall at attenuating wavelengths. Journal of Meteorology 11, 58–67.
Hunter, I.M., 1954. Polarization of radar echoes from meteorological precipitation.Nature 173, 165–166.
Iguchi, T., Kozu, T., Kwiatkowski, J., Meneghini, R., Awaka, J., Okamoto, K., 2009.Uncertainties in the rain profiling algorithm for the TRMM precipitation radar.Journal of the Meteorological Society of Japan 87, 1–30.
Iguchi, T., Kozu, T., Meneghini, R., Awaka, J., Okamoto, K., 2000. Rain-profilingalgorithm for the TRMM precipitation radar. Journal of Applied Meteorology39, 2038–2052.
Iguchi, T., Meneghini, R., 1994. Intercomparison of single-frequency methods forretrieving a vertical rain profile from airborne or spaceborne radar data.Journal of Atmospheric and Oceanic Technology 11, 1507–1516.
Kidd, C., Levizzani, V., 2011. Status of satellite precipitation retrievals. Hydrologyand Earth System Sciences 15, 1109–1116.
Kozu, T., Kawanishi, T., Kuroiwa, H., Kojima, M., Oikawa, K., Kumagai, H., Okamoto, K.,Okumua, M., Nakatsuka, H., Nishikawa, K., 2001. Development of precipitationradar onboard the Tropical Rainfall Measuring Mission (TRMM) satellite. IEEETransactions on Geosciences and Remote Sensing 39, 102–116.
Kummerow, C., Barnes, W., Kozu, T., Shiue, J., Simpson, J., 1998. The TropicalRainfall Measuring Mission (TRMM) sensor package. Journal of Atmosphericand Oceanic Technology 15, 809–817.
Kummerow, C., Hong, Y., Olson, W.S., Yang, S., Adler, R.F., McCollum, J., Ferraro, R.,Petty, G., Shin, D.B., Wilheit, T.T., 2001. The evolution of the Goddard profilingalgorithm (GPROF) for rainfall estimation from passive microwave sensors.Journal of Applied Meteorology 40, 1801–1820.
Kummerow, C., Olson, W.S., Giglio, L., 1996. A simplified scheme for obtainingprecipitation and vertical hydrometeor profiles from passive microwavesensors. IEEE Transactions on Geoscience and Remote Sensing 34, 1213–1232.
Kummerow, C., Simpson, J., Thiele, O., Barnes, W., Chang, A.T.C., Stocker, E., Adler, R.F.,Hou, A., Kakar, R., Wentz, F., Ashcroft, P., Kozu, T., Hong, Y., Okamoto, K., Iguchi, T.,Kuroiwa, H., Im, E., Haddad, Z., Huffman, G., Ferrier, B., Olson, W.S., Zipser, E.,Smith, E.A., Wilheit, T.T., North, G., Krishnamurti, T., Nakamura, K., 2000. Thestatus of the Tropical Rainfall Measuring Mission (TRMM) after two years in orbit.Journal of Applied Meteorology 39, 1965–1982.
L’Ecuyer, T., Petersen, W., Moisseev, D., 2010. The light precipitation validationexperiment (LPVEx). Overview and Early Results, 02.
Liao, L., Meneghini, R., 2009. Changes in the TRMM version-5 and version-6precipitation radar products due to orbit boost. Journal of the MeteorologicalSociety of Japan 87, 93–107.
Marshall, J., Hitschfeld, W., Gunn, K., 1955. Advances in radar weather. Advances inGeophysics 2, 1–56.
Marshall, J.S., Palmer, W.M., 1948. The distribution of raindrops with size. Journalof Meteorology 5, 165–166.
Masunaga, H., Kummerow, C.D., 2005. Combined radar and radiometer analysis ofprecipitation profiles for a parametric retrieval algorithm. Journal of Atmo-spheric and Oceanic Technology 22, 909–929.
Meneghini, R., Iguchi, T., Kozu, T., Liao, L., Okamoto, K., Jones, J.A., Kwiatkowski, J.,2000. Use of the surface reference technique for path attenuation estimatesfrom the TRMM precipitation radar. Journal of Applied Meteorology 39,2053–2070.
Nelson, B.R., Seo, D.J., Kim, D., 2010. Multisensor precipitation reanalysis. Journalof Hydrometeorology 11, 666–682.
Olson, W.S., Kummerow, C.D., Heymsfield, G.M., Giglio, L., 1996. A method forcombined passive-active microwave retrievals of cloud and precipitationprofiles. Journal of Applied Meteorology 35, 1763–1789.
Rico-Ramirez, M.A., Cluckie, I.D., 2007. Bright-band detection from radar verticalreflectivity profiles. International Journal of Remote Sensing 28, 4013–4025.
Rico-Ramirez, M.A., Cluckie, I.D., 2008. Classification of ground clutter andanomalous propagation using dual-polarization weather radar. IEEE Transac-tions on Geoscience and Remote Sensing 46, 1892–1904.
Rico-Ramirez, M.A., Cluckie, I.D., Shepherd, G., Pallot, A., 2007. A high-resolutionradar experiment on the island of Jersey. Meteorologica Applications 14,117–129.
Rosenfeld, D., Wolff, D.B., Atlas, D., 1993. General probability-matched relationsbetween radar reflectivity and rain rate. Journal of Applied Meteorology 32,50–72.
Ryzhkov, A.V., Schuur, T.J., Burgess, D.W., Heinselman, P.L., Giangrande, S.E., Zrnic, D.S.,2005. The jont polarization experiment—polarimetric rainfall measurements andhydrometeor classification. Bulletin of the American Meteorological Society 86,809–824.
Schumacher, C., Houze, R.A., 2000. Comparison of radar data from the TRMMsatellite and Kwajalein oceanic validation site. Journal of Applied Meteorology39, 2151–2164.
Schwaller, M.R., Morris, K.R., 2011. A ground validation network for the globalprecipitation measurement mission. Journal of Atmospheric and OceanicTechnology 28, 301–319.
Seto, S., Iguchi, T., 2011. Applicability of the iterative backward retrieval methodfor the GPM dual-frequency precipitation radar. IEEE Transactions onGeoscience and Remote Sensing 49, 1827–1838.

T. Islam et al. / Journal of Atmospheric and Solar-Terrestrial Physics 77 (2012) 194–208208
Simpson, J., Kummerow, C., Tao, W.K., Adler, R.F., 1996. On the Tropical RainfallMeasuring Mission (TRMM). Meteorology and Atmospheric Physics 60, 19–36.
Smith, E.A., Xiang, X., Mugnai, A., Hood, R.E., Spencer, R.W., 1994a. Behavior of aninversion-based precipitation retrieval algorithm with high-resolution amprmeasurements including a low-frequency 10.7-ghz channel. Journal of Atmo-spheric and Oceanic Technology 11, 858–873.
Smith, E.A., Xiang, X., Mugnai, A., Tripoli, G.J., 1994b. Design of an inversion-basedprecipitation profile retrieval algorithm using an explicit cloud model forinitial guess microphysics. Meteorology and Atmospheric Physics 54, 53–78.
Wang, J.X., Wolff, D.B., 2010. Evaluation of TRMM ground-validation radar-rainerrors using rain gauge measurements. Journal of Applied Meteorology andClimatology 49, 310–324.
Wilheit, T.T., 1986. Some comments on passive microwave measurement of rain.Bulletin of the American Meteorological Society 67, 1226–1232.
Wolff, D.B., Marks, D.A., Amitai, E., Silberstein, D.S., Fisher, B.L., Tokay, A., Wang, J.,Pippitt, J.L., 2005. Ground validation for the Tropical Rainfall Measuring Mission
(TRMM). Journal of Atmospheric and Oceanic Technology 22, 365–380.