performance evaluation with java modelling...
TRANSCRIPT

Performance Evaluation with Java Modelling Tools
Giuliano CasaleDepartment of Computing
Imperial College London, UK
Joint work with: Giuseppe Serazzi (Politecnico di Milano, Italy)
Lulai Zhu (Imperial College London, UK)

IntroductionActivity 1: getting startedActivity 2: load balancingActivity 3: parameter sweepingActivity 4: capacity constraintsActivity 5: workflows & fork-join
Please download the latest JMT (v1.0.2) here:http://jmt.sf.net/Download.html
Outline
2

Introduction

Java Modelling Tools
4
Simulation and analysis of queueing networks.Project started in 2002 at Politecnico di Milano, since 2010 co-developed at Imperial. JMT is open source: GPL v2,
Medium-size project: ~1,000 classesJAR, source code and maven build files (pom.xml) http://jmt.sourceforge.net/Download.html
Good diffusion (59k downloads, mostly from the US)Community interaction mainly through
Bug reports Feature requestsTemplates

Queueing SystemsQueueing Networks (QN)
Product-formExtended (fork/join, blocking, priorities, …)
Petri Nets (PN)Stochastic Petri Nets (SPN)Generalized Stochastic Petri Nets (GSPN)Coloured Petri Nets (CPN)
Queueing Petri Nets (QPNs)
Supported models
5

Who uses JMT?
6
• JMT is for PE practice, teaching, and research• Several university courses worldwide (tell us!)• Supporting materials available on website

JMT Start Screen
7
Simulator

JSIMgraph: QN & PN simulation
8

Templates
9
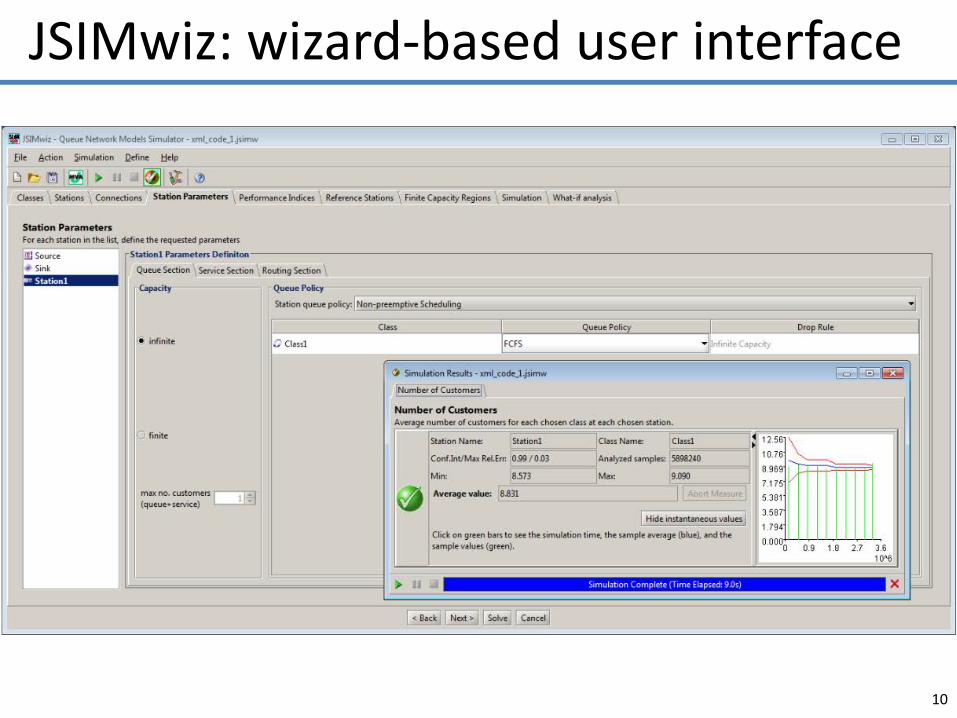
JSIMwiz: wizard-based user interface
10

JSIMengine: discrete-event simulator
11
Simulation components defined by 3 sections
Discrete-event simulation of section messaging
admit
serve
complete
route
external arrivals (open class)
queueing stationcomponent sections

JSIMengine: JMT architecture
12
XML
JSIMengine
JABA, JMVA, JWAT JSIMwiz JSIMgraph
XMLXSLT
XSLT
Status Update
JMT framework
CLI / XML GUI
(also stores results)

Analysis of product-form queueing networksSeveral exact and approximate algorithms
Exact MVA• Reiser & Lavenberg O(NR)• Load-dependent O(N2R)
Approximate MVA O(1)• Chow• Bard-Schweitzer• AQL• Linearizer• De Souza-Muntz
JMVA: analytical solver
13
Normalizing constant• RECAL O(NM)• CoMoM O(NlogN)
N: jobsM: stationsR: classes

JMVA: model parameterization
14

JMVA: solutions
15
Choice of solution algorithm

JABA: bottleneck identification
16
bottlenecks
Fraction of class 2 jobs that saturate two resources concurrently
Common saturation sector

3-class model
JABA: bottleneck identification
17Service demands of class 1
Service demands of class 2
bottlenecks

JMCH: Markov chain animation
18

19G.Casale – G.Serazzi
Specify Format
Column-Oriented Log File
Load Data
Data FormatTemplates
JWAT: workload characterization
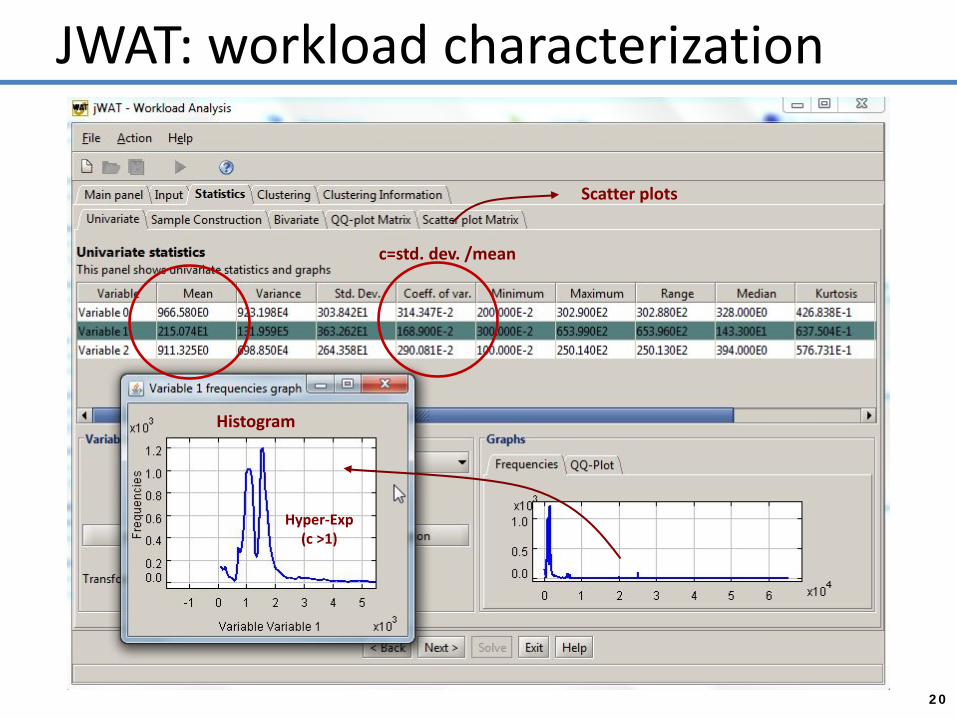
20
JWAT: workload characterization
Scatter plots
Histogram
c=std. dev. /mean
Hyper-Exp(c >1)

Activity 1:getting started

Arrival rate: λ=0.5 job/s (Exponential)Service rate: µ=1.00 job/s (Exponential)Goal: verify M=>M property
Hands-on activity: M/M/1
22

Open, closed, and mixed workloadsPriorities and reference stations
Class definition
23
Reference station for closed class
Reference station for open class
Reference stationsused for system metricsVisits at node = TPUTnode/TPUTrefref is the reference station

Arrival distribution
24
Time-Varying Peaks of User Activity
HighPerformance
Will the systemsustain the load?
Sun Mon Tue Wed Thu

Non-preemptive scheduling: FCFS, LCFS, RAND, SJF, LJF, SEPT, LEPT, HOL (FCFS priority)Preemptive scheduling: PS, GPS, DPS
Queue section
25
Buffer size

26
Service section
exponential rate = 0.5
number of servers

Service time distribution
27Service time
External trace

19 types of performance indicesUtilization, residence time, response timeThroughput, firing rates, drop rates, …
Granularity: system, station, class, mode, sink
Perf. Indices
28

29
Sim. Results
confidence interval
transient duration
the number of samples needed is greater than the
max allowed
performance indices
default valuesof parameters
actual sim. parameters

Statistical analysis
30
Automated (overridable) simulation stop
30
confidence level
maximumrelative error
traditional controlparameters

Intelligent filtering of simulation dataR5 heuristics, spectral analysis, MSER-5 rule, ...
31
[Heidelberger&Welch, CACM, 1981][Pawlikowski, CSUR, 1990]
[Spratt, M.S. Thesis, 1998]
Transient
(Steady State)
Transient filtering

Response time percentiles, buffer overflow probability, departure process moments, …
Detailed statistical results
32

Simulation events can be traced in CSV files
Loggers
33
logger
logger
global.csvjob id (same throughout
simulation)
job class

Activity 2:Load balancing

Probabilistic routingState-dependent routing: JSQ, SRT, LU, FSLoad-dependent probabilistic routing
Routing section or ….
35

Router node also allows to specify routingApplies policy across multiple input queuesSame policies as routing section
… router node
36

We add two queues to the M/M/1 model.Goal: compare round-robin and probabilisticload-balancing
Hands-on activity: load balancing
37

38
Blocking after service
max number of requests in the station
station with finite capacity
selection of the BAS policy
BAS policy:requests are blocked in the
sender station when the maxcapacity of the receiver
is reached

Activity 3:Parameter sweeping

Analysis of bottleneck switchMeasure: Number of CustomersDemands: Queue 1: 10 , 5; Queue 2: 5 , 9
Hands-on activity: bottleneck switch
40

Perform repeated executions automatically
What-If analysis
41
10 JSIM invocations

JMVA: What-If
42
class 1class 2
system
CommonSaturation
Sectorclass 1
class 2
system
CommonSaturation
Sector
Throughput Response times
equiload
0.0181 job/ms
0.48
5.5 ms

Activity 4:Capacity constraints

44
FCR definition
step 1 – select the components
of the FCR
step 2 – set the FCR
region with constrainednumber of customers
drop
queue
• Thread limits via finite capacity regions (FCRs)

• Capacity constraints: total, per-class, per-group• Memory constraints: jobs have sizes and must fit
45
FCR parameters
Global job capacity
max number of requests per class in the FCR
drop the requests when the regioncapacity is saturated
Job SizeMemory Capacity
Global memory capacity

• Group-specific constraints (i.e., for subset of classes)
• Dedicated performance indices
FCR groups and indices

Places and transitions
Queueing Petri nets
Support for PN elements
47

JMT design paradigm extends to PN elementsMode: a rule to activate and fire a transition
PN sections & modes
48

Arrival rate: λ=0.99 job/sService rate: µ=1.00 job/sGoal: restrict max 1 job inside queue
Hand-on activity: FCRs vs QPNs
49

Activity 5:Workflows & fork-join

A job can change its class during the simulationWorkflows, re-entrant lines, track path-wise perf., …
Class-switching
51
Example: re-entrant line

Jobs split into tasks carrying id of the parent jobSupport for:
nested fork-joinsmultiple join points
Fork-Join elements
52
JMT can compute Response time at Sink 2 only
finite capacity between fork-joinadvanced policies (e.g., quorum)

Branch prob.: randomize no. tasks and output linksRandom subset: choose n-out-of-k output linksClass Switch: assign new class to forked tasks
Advanced fork
53

Quorum: wait a subset of tasks (of the same job)Guard: like quorum but requires given class mixScaler: join then fork again
Advanced join
54

Block first N tasks forked from the same jobUpon arrival of the Nth, unblock and let the other pass
Semaphore
55

YARN ― Yet Another Resource Negotiator
Case Study: YARN Capacity Scheduler
56

Case Study: YARN Capacity Scheduler
57
Detailed model using QPNNested FCRs (JobQueue, MapQueue, RedQueue)14.13% error in trace-driven simulation [D. Ardagnaet al., ICA3PP’16]

Simplified model using QNClass switching between Map tasks and Reduce tasks
Case Study: YARN Capacity Scheduler
58

Conclusion

Customer impatienceAbility to parallelize JMT on multiple cores
Collect samples or run what-ifs in parallelInternal simulation remains single-threaded
New load-balancing policiesPower of k choicesSITA…
TreeMVAin JMVA for sparse networks
Coming Soon (>= version 1.0.3)
60Tutorial supported by the European Union’s Horizon 2020 research and innovation programme under grant agreement No. 644869.