performance funding at msis - lumina foundation
TRANSCRIPT

TIFFANY JONES, PHDJUNE, 2014
Performance Funding at MSIs:Considerations and Possible Measures for Public Minority-Serving Institutions
ii SOUTHERNEDUCATION.ORG
Southern Education Foundation (SEF) Founded in 1867 as the George Peabody Education Fund, the Southern Education Foundation’s mission is to advance equity and excellence in education for all students in the South, particularly low income students and students of color. SEF uses collaboration, advocacy, and research to improve outcomes from early childhood to adulthood. Our core belief is that education is the vehicle by which all students get fair chances to develop their talents and contribute to the common good. SEF’s higher education efforts are designed to address a range of post-secondary issues that influence student success and degree attainment among low-income and minority students. With a focus on the post-secondary institutions most likely to serve these students, SEF takes up critical issues known to influence their participation and comple-tion in higher education.
Suggested Citation for This Report Jones, T. (2014). Performance Funding at MSIs: Considerations and Possible Measures for Public Minority-Serving Institutions. Atlanta, GA: Southern Education Foundation.
About The AuthorDr. Tiffany Jones is a Postdoctoral Research and Policy Analyst at the Southern Education Foundation. At SEF, Dr. Jones works to advance higher education research, policy analysis, and programming intended to improve access to college and degree completion among low-income and minority students. Prior to joining SEF, Dr. Jones was a dean’s fellow at the Center for Urban Education (CUE) at the University of Southern California. She has published articles, book chapters, and policy reports that have focused on how state and federal policies and institutional practices, facilitate outcomes for students of color. Most recently, her work examines state performance funding policies, data use, and data-based decision making at Minority-Serving Institutions.
PERFORMANCE FUNDING AT MSIs 1
FOREWORD
SEF’s higher education efforts are designed to address a range of post-secondary issues that influence student success and degree attainment among low-income and minority students. With a focus on the post-secondary institutions most likely to serve these students, Minority-Serving Institutions (MSIs), we take up critical issues known to influ-ence their participation and completion in higher education. Today, the fastest growing groups of young people are among the least likely to graduate from high school and enter college. And, too many colleges and universities struggle to graduate students who do find their way to campus. Improving college completion rates means getting better at a number of things: finding ways to make college more affordable, improving campus climate, enhancing teaching and improving assessment practices, to name a few. There are also policy challenges we must confront if we are to close persistent enrollment and attainment gaps. Financial aid and public finance are both ripe for attention.
Bottom line: improving student success represents a critical challenge for this country’s higher education system at a time when, according to the Integrated Postsecondary Education Data System, more than half of all students of color enrolled in public institutions of higher education are attending public MSIs, it is critical to the college access and success of low income students and students of color that public MSIs are both supported and effective.
Often, many of the decisions directly affecting these students and these student populations and the institutions they are most likely to attend are made in offices far removed from the campuses where students learn and develop, and unfortunately, can have unintended consequences that can inhibit MSI effectiveness and ultimately student success. The good news is, with the appropriate tactics and knowledge, policy makers can become better equipped to design legislation that can help cultivate MSI organizational and student success.
This report, Performance Funding at MSIs: Considerations and Possible Measures for Public Minority-Serving Institutions addresses the ways in which state-level decisions on funding policies can differentially impact MSIs. We offer five key considerations for devel-oping performance funding policies at MSIs. We are confident this report will provide MSI leaders and advocates with a better understanding of the implications of performance funding for these institutions and student. The report will also help policy makers gain an increased awareness of the significance of their public MSIs and provide them with strategies for designing performance funding policies that support the success of not only the professionals at these vital institutions, but also, the students who populate them.
Kent McGuirePresident and CEOSouthern Education Foundation

2 SOUTHERNEDUCATION.ORG
Executive Summary 3
An Overview of Performance Funding 5
Performance Funding Metrics 6
Performance Funding Impact and Critique 7
Minority-Serving Institutions 9
Public Minority-Serving Institutions 9
Table 1.1 Public Minority-Serving Institution Enrollment by State 11
Figure 1.1 Public MSI Enrollment/Performance Funding Activity 10
Minority-Serving Institutions and Performance Funding 12
Considerations for the Development of MSI Performance Funding Metrics 14
Appendices 22
Appendix A: Typology of Performance Funding Metrics 22
Appendix B: Complete List of Public Minority-Serving Institutions by State 28
Appendix C: Student of Color Enrollment at Public Minority-Serving Institutions 43
Contents

PERFORMANCE FUNDING AT MSIs 3
States are increasingly funding higher education institutions based on their performance or outcomes instead of relying solely on student enrollment to determine funding formulas. Performance Funding (also called Performance-Based and Outcomes-Based Funding) policies provide state support to public colleges and universities based on outcome measures using input metrics like incoming student composition, progress metrics like retention rates, and output metrics such as graduation rates. There are public Minority-Serving Institutions (MSIs) in 28 of the 30 states that have adopted or are transitioning to Performance Funding models. MSIs include Historically Black Colleges and Universities (HBCU), Hispanic Serving Institutions (HSI), Tribal Colleges and Universities (TCU), Alaska Native and Native Hawaiian-Serving Institutions (ANNH), Native American-Serving Nontribal Institu-tions (NASNTI), Predominately Black Institutions (PBI), and Asian American and Native American Pacific Islander-Serving Institutions (AANAPISI). As states increasingly allocate higher education funds based on measures of institutional performance, there must be a critical consideration of the implications of such funding models for campuses with unique missions and/or student populations, like (MSIs).
The aim of this policy report is to discuss the considerations for MSIs in state Performance Funding policy development. The report provides policy makers with a typology of metrics including those that have been used in previous and existing state Performance Funding policies to address issues of equity and diversity and specific institutional types like MSIs, Community Colleges, and Research Universities. The report provides a framework for policy makers developing Performance Funding formulas. Performance Funding policies are challenged by limitations of available data, difficulty identifying appropriate metrics for such a diverse set of organizations, and the challenges with defining and measuring educational value and success. Therefore, many state policy makers should move cautiously in adopting these funding models and carefully consider the nation’s most vulnerable institutions that are often serving the most neglected student populations, public MSIs.
Executive Summary
4 SOUTHERNEDUCATION.ORG
1. Include Minority-Serving Institution (MSI) Leaders/Experts in Policy Development.
Consider the perspective of those working closely with MSIs when developing Performance Funding policies. Solicit input from MSI leaders/experts on Performance Funding policies during policy development and implementation and also to assess policy impact. Strategies for soliciting policy input and feedback include distributing surveys and holding town hall style meetings where all institutional members have an opportunity to offer feedback.
2. Reconsider the Utility of Commonly Used Metrics.
Commonly used metrics, like graduation and job placement rates, can pose challenges to accurately capturing the performance of MSIs, and in their current conceptualization are problematic overall. Specifically, the inability of higher education data systems to track students that attend/transfer to multiple institutions makes it difficult to determine how to fairly credit institutions for students’ completion. States are also encouraged to think beyond graduation rates to consider non-traditional ways of defining college “success,” for example, the development of engaged citizens.
3. Metrics should be Responsive to Input Factors.
Institutions that have diverse “inputs” or student populations should not be subjected to uniform evaluations of outcomes or performance. If an institution has an open-admissions policy that encourages the acceptance of academically underprepared students, then applicable output indicators should focus on how effective the institution is in educating that particular population of students. Time that it takes to progress from developmental education course to credit-bearing course completion and an eight-year graduation rate are examples of metrics that can report the effectiveness of open access institutions more accurately.
4. Address Data Capacity before Implementing Policy.
Higher education institutions operate with varying levels of resources and capacity that, in addition to the population of students they serve, drive outcomes. The effectiveness of Performance Funding policies depends on campuses’ ability to accurately report data to state higher education governing bodies, thus states should assess their campuses’ capacity to collect and report data before states begin using Performance Funding metrics. States can conduct surveys and site visits to assess campus data capacity and needs prior to policy implementation, thus taking steps to ensure that all campuses in the state have equitable opportunities to obtain Performance Funding.
Key Considerations for Developing Performance Funding Policies for MSIs

PERFORMANCE FUNDING AT MSIs 5
5. Use Performance Funding Policies to Address Racial and Ethnic Equity.
First, in addition to populations like low-income and adult students, racial and ethnic groups should be included in Performance Funding equity metrics that reward campuses for the enrollment and success of underserved groups. An equity focused Performance Funding policy would not only expose campuses that have poor outcomes, like large equity gaps between the graduation rates of various racial and ethnic or income groups, but provide some understanding of why, through quality and student experience oriented indicators. Campuses can measure the experiences of racial and ethnic groups by tracking the number of increases in reported racial incidents on campus, racial equity gaps in student representation in certain academic programs, and surveys of campus racial climate. Secondly, in many states students of color have yet to reach critical mass at public Predominately White Institutions and are underrepresented at institutions of higher education (especially four-year colleges and universities) in comparison to their propor-tion of the state population. Therefore it may not be strategic for states to decrease the proportion of students of color at MSIs. Although it may seem logical to simply invert racial and ethnic diversity metrics for MSIs, states should reconsider simply defining diversity as “non-Black” at HBCUs or “non-students of color” at MSIs. Instead of solely relying on race to address issues of equity and diversity at MSIs, alternative metrics could include economic diversity (e.g. proportion of students who are Pell Grant eligible), ethnic diversity, or first generation college student status.
6 SOUTHERNEDUCATION.ORG
The most pressing issue across every sector of higher education in the United States is how to improve college completion for all students. Increasing college completion rates have been at the center of the national dialogue on higher education as evidenced by the emphasis on college completion in the federal College Affordability Plan and the goals and initiatives of almost every influential higher education philanthropic organization. State higher education leaders are also focused on increasing college comple-tion and graduation rates, thus the most recent strategic plans for higher education in states like Arkansas, Louisiana, and Massachu-setts have identified “increased educational attainment” and “de-gree production” as their most important priorities. The Arizona Board of Regents’ (2013) first mission for the state university sys-tem is to “increase the educational attainment of Arizona citizens” and to produce “enough high-quality university degrees for the state to be nationally competitive by the year 2020” (p.7).
The achievement of state and national goals to increase the number of postsecondary degrees awarded will require equitable college completion rates across racial and ethnic demographic groups like Black and Latino students whose college enrollment is predicted to increase by 25% and 42% respectively between 2010 and 2021 (Hussar and Bailey, 2013). Minority-Serving Institu-tions (MSIs) including Historically Black Colleges and Universities (HBCUs), Tribal Colleges and Universities (TCUs), and Hispanic Serving Institutions (HSIs), enroll 20% of all undergraduates and two of every five Black, Latino, and Native American undergrad-uates (Cunningham, Park, & Engle, 2014). Any efforts to improve college completion should also be considered in terms of how these approaches could support or hinder MSI effectiveness.
The most recent wave of state efforts to improve college com-pletion and effectiveness is the adoption of Performance Funding (Also called Performance-Based and Outcomes-Based Funding) policies. So far, over half of the nation (30 states) has adopted or is transitioning to a Performance Funding model to provide state support to public colleges and universities (Friedel et. al., 2013). Four states have adopted Performance Funding policies for their two-year institutions, another five for their four-year institutions, and 16 states have adopted policies for their two- and four-year institutions. Through Performance Funding policies, states provide economic incentives to public colleges and universities to improve their performance on desired student and institutional outcome measures. Institutions are evaluated on their ability to meet state
goals using metrics like student retention and graduation rates. Prior to Performance Funding policies, state support for higher education was based on student enrollment. Performance Funding policies were introduced to encourage colleges and universities to expand their focus from access to other issues that governments and voters felt were important, such as outputs and efficien-cy (Dougherty et al., 2011). As the costs of higher education increased in the 1980s and 1990s, so did the demand for greater proof that colleges provided a high quality education as evi-denced by highly skilled graduates who completed college within a reasonable period. As of 1994, over one-third of all states had Performance Funding policies that provided incentives in the form of financial bonuses for measures like access for undergraduate students, quality in undergraduate education, national competitive-ness in graduate studies and research, meeting critical state needs, and managerial efficiency and effectiveness (Ruppert, 1994).
The economic crisis of the new millennium resulted in the reduction of the policies, as states had to first fund the items that were considered most important and then did not have additional funding to provide enough incentive to impact institu-tional behaviors through Performance Funding policies (Shulock, 2011). More recently, the popularity of Performance Funding policies has reemerged as a result of limited state resources for higher education and increased demand for accountability for all public spending (McLendon, Hearn, & Deaton, 2006). Although there is not a systematic formula to predict Performance Funding adoption, the shift towards performance accountability in higher education has been linked to issues like 1) financial pressure that requires campuses to maximize productivity and efficiency; 2) shifts in public-sector governance to consider new factors such as markets, competitiveness, and measurement of performance 3) the K-12 accountability movement; 4) the election of politicians more in line with an accountability agenda; and 5) the failures of voluntary assessment movements (McLendon, Hearn, & Deaton, 2006). Currently, 25 states have Performance Funding policies in place, another five states are transitioning to Performance Funding policies, and an additional 12 states are having formal legislative hearings about how to design Performance Funding policies for their states (Ferguson, 2014; Friedel et. al., 2013; National Confer-ence for State Legislatures).
An Overview of Performance Funding

PERFORMANCE FUNDING AT MSIs 7
Performance Funding Metrics
Appendix A features a chart that provides a typology of Perfor-mance Funding metrics organized by input, progress, and output metrics. Metrics designed to meet equity goals and metrics for research institutions, community colleges, and MSIs are also identified. Performance Funding metrics constantly fluctuate, and the typology provides a snapshot of states that have used similar metrics in a previous or current iteration of their Performance Funding policies.
States use input metrics to track and reward campuses who enroll and hire students and faculty from desired populations. For exam-ple, the state of Virginia measures increases in the enrollment of in-state undergraduate students from underrepresented popula-tions including low-income, first-generation, racial and ethnicity mi-nority college students. Progress metrics include variables like credit accumulation and retention that demonstrate colleges’ progress towards degree completion and other outputs. The progress metrics are paired with process metrics that capture institutional efforts to increase their capacity in ways that could increase their institutional effectiveness. In Arkansas, progress is measured at four-year institutions based on the percentage of students who earn 18 or more credit hours through two academic years. The output metrics represent states’ goals for public higher education in their state, which most often means degree completion overall and for targeted student populations. For example, the state of Nevada rewards campuses based on the number of bachelor’s degrees conferred during an academic year.
The typology also includes Performance Funding metrics that were designed to meet state equity and diversity goals. Hence, more often than creating MSI specific metrics, states have addressed issues of equity in higher education by utilizing Performance Funding metrics that reward campuses for the enrollment and success of students that are characterized as academically “at risk” or underprepared, adult, low-income, underrepresented racial minority, transfer, and first-generation college students. For ex-ample, in Oklahoma, among other factors, Performance Funding is awarded based on the retention of Pell Grant recipients. In Illinois, Performance Funding provides incentives to two-year institutions for graduating students who are academically or financially at risk, first-generation college students, low-income students, and students who are traditionally underrepresented in higher educa-tion. In order to directly address racial equity, states have assigned
performance metrics based on the enrollment and success of students of color at Predominately White Institutions and for non-Black students at HBCUs. Equity oriented metrics also demon-strate states’ efforts to ensure that their Performance Funding policy does not impede college access and success by rewarding institutions that effectively admit and support the underrepresented student populations.
The creation of mission specific metrics is not outside the frame-work of state Performance Funding policies, and in fact many states have already implemented metrics that address the unique institutional missions found at community colleges and research universities. Early Performance Funding policies were criticized for the lack of attention to diverse institutional missions, consequently, states have acknowledged the importance of creating distinct metrics for the diverse institutional missions found at their public community colleges. Texas and Tennessee are examples of states that have attached funding to Community College’s enrollment of low-income and non-traditional students, developmental educa-tion success, and transfer rates.
Similar to the case of Community Colleges, states like Illinois and Arizona have tailored Performance Funding policies to the re-search mission of some of their public research universities. States have enacted policies that attach funding to research universities’ ability to attract research grants and earn patents for their innova-tions. In the state of Arkansas, research universities are rewarded for the number of new companies started during the year that were dependent on licensing an institution’s technology for their formation. The Community College and Research University met-rics demonstrate states’ willingness to consider the importance of diverse missions in the design and development of Performance Funding metrics.
Performance Funding Impact and Critique
Although many include equity, community college, and research specific metrics, states’ most recent adoption of Performance Funding policies has not been without critique. The policies have been characterized in the media and by scholars as creating unfair comparisons between institutions that are distinct in terms of size, mission, and student demographics. There is additional concern that graduation rates are only part of the student success narra-tive and other types of benefits are not easily quantifiable. Lastly, Performance Funding critics have cautioned that the most direct

8 SOUTHERNEDUCATION.ORG
path to increased graduation rates is for campuses to become more selective.
The research examining Performance Funding impact suggests that the policies have had minimal and even negative impacts on outcomes like retention and graduation. For example, Tandberg and Hillman (2013) found that even when accounting for influ-ences like politics and the economy, Performance Funding policies had no impact on the total number of associates and bachelor’s degrees earned and had a negative effect on two-year comple-tions. However, much of the Performance Funding impact research either incorporates or focuses exclusively on early iterations of Performance Funding: i.e., Performance Funding 1.0, a financial bonus for campuses, which differs from more recent iterations of Performance Funding policies, i.e., Performance Funding 2.0, which are typically larger proportions of a campus’ base funding received from the state.
Further, Performance Funding policies could have greater im-pact on outcomes in states that allocate a larger proportion (over 10%) of state funding to colleges and universities based on performance, thus the rapid spread of Performance Funding 2.0 policies that base larger proportions of state funding on perfor-mance has greater potential to impact campus priorities, practices, and outcomes (Dougherty & Reddy, 2013). Although scholars and policy makers have offered insightful suggestions on metrics for institutions with unique missions and/or student populations like Community Colleges, MSIs specifically have been absent from this conversation. Additionally, since the assessments of Performance Funding impact have not reported their findings disaggregated by institutional type, this makes it is difficult to assess the direct impact on and continues speculation that Performance Funding policies could impact access focused MSIs negatively.

PERFORMANCE FUNDING AT MSIs 9
The challenge of designing a Performance Funding policy that sufficiently addresses diverse institutions is especially salient at the nation’s MSIs. MSIs include two- and four-year colleges and universities that are eligible for the federal designation as result of meeting the criteria outlined in Titles III, IV, and V of the Higher Education Act. The specific institutional types include Historically Black Colleges and Universities (HBCU), Hispanic Serving Institu-tions (HSI), Tribal Colleges and Universities (TCU), Alaska Native and Native Hawaiian-Serving Institutions (ANNH), Native Ameri-can-Serving Nontribal Institutions (NASNTI), Predominately Black Institutions (PBI), and Asian American and Native American Pacific Islander-Serving Institutions (AANAPISI). Nationally, MSIs make up about a third of all undergraduate institutions and enroll over half of all minority students 1 (see table 1.1 below) (Li & Carroll, 2007).
MSIs play an important role in creating access to higher education for students least represented at moderate to highly selective institutions. When considering how to assess MSIs in Performance Funding policies, it is important to note that many MSIs aim to provide access to college for the populations of students least likely to enroll in higher education. As a result, MSIs enroll large proportions of low-income and academically underprepared students as identified by standardized test scores. For example, nearly 70% of students at MSIs require at least one developmen-tal education course, and one-third of students at AANAPISIs, nearly half of HSI students, over half of TCU students, and nearly three-fourths of HBCU students are Pell Grant recipients (Gas-man & Conrad, 2013; Li & Carroll, 2007). MSIs are also responsible for graduating a significant number and proportion of certificates and degrees to students of color. In the 2011-2012 academic year, MSIs awarded certificates and degrees to nearly 250,000 Black and Latino undergraduates, representing 40% and 21% of the total credentials awarded to Latino and Black students respectively (Cunningham, Park, & Engle, 2014).
In addition to awarding a significant proportion of the degrees awarded to students of color, research also suggests that some students at MSIs have a higher quality of experience and long term outcomes than non-MSI students of color. For example, students at HBCUs report more frequent and favorable rela-tionships with their professors, earn higher college grades, have an increased likelihood of completing STEM degrees, and report
1 For the purposes of their study, Li and Carroll (2007) define minority students as Black, Hispanic, Asian, and American Indian.
greater gains in critical and analytical thinking, and are more likely to earn a graduate or professional degree than their Black peers at PWIs (Allen, 1992; Fries-Britt & Turner, 2002; Kim & Conrad, 2006; Nelson Laird et al., 2007; Perna et al., 2009; Redd, 2000; Simkins & Allen, 2001; Solorzano, 1995; U.S. Commission on Civil Rights, 2010; Wenglinsky, 1996). MSI success with the student pop-ulations least likely to graduate at non-MSIs suggests that in order for states to meet their completion goals, they must design Perfor-mance Funding policies that cultivate, not inhibit, MSI effectiveness.
Public Minority-Serving Institutions
There are over 500 public MSIs in 23 of the 25 states that have adopted Performance Funding policies, all of the states that are currently transitioning to Performance Funding policies, and 9 of the 12 states that are having formal discussions about Perfor-mance Funding. An important first step for policy makers design-ing Performance Funding policies is to identify the public MSIs in their state, thus a full list of public MSIs by state is provided in Ap-pendix B. The proportion of minority students who are enrolled in public institutions of higher education, who are also enrolled at public MSIs by state is provided in table 1.1 and the map below2 (also see Appendix C). Students of color3 seem to be especially concentrated at MSIs in Southern states, but in most cases the majority of the students of color who are enrolled in public higher education are enrolled in their states’ public MSIs. For example, in Connecticut and Massachusetts, public MSIs are only 12% of all public institutions in the state, yet they enroll 35% of all the stu-dents of color who attend public colleges and universities in the state. In states like Nevada, Alabama, New York, and Maryland over half of all students of color enrolled at public institutions of higher education in the state were enrolled in the states’ MSIs, demon-strating the significant role that MSIs play in ensuring higher edu-cation access and success for minority students enrolled in public higher education. The concentration of students of color at public MSIs suggests that policy makers have to be especially careful that Performance Funding policies based on outcomes, like graduation rates, do not result in increased selectivity, thus further restricting
2 Fall 2012 enrollment data reported from National Center for Education Statistics (2013). All public colleges and universities including public technical colleges are included. Public technical colleges are often included in state Performance Funding policies targeting public community colleges.
3 For the purposes of this analysis students of color includes students who identify as American Indian or Alaskan Native, Asian, Black or African American, Hispanic, Hawaiian or Other Pacific Islander, or Two or More Races.
Minority - Serving Institutions

10 SOUTHERNEDUCATION.ORG
access at the states’ non-MSIs and exacerbating existing stratifica-tion. In states like California, where nearly 90% of the students of color enrolled in public higher education are enrolled at the states’ public MSIs, it is important that these institutions perform well on institutional outcome measures and that the policies are designed in a way that supports institutional effectiveness and success.
Performance Funding in Place (25 States)
Transitioning to Performance Funding (5 States)
Formal Discussions of Performance Funding (12 States)
No Formal Activity Found (8 States)
Data on state Performance Funding Policy Adoption status retrieved from “Performance-Based Funding: The National Landscape” (Friedel, Thornton, D’Amico, & Katsinas, 2013; National Conference for State Legislatures, 2014)
GA63%
AL59%
MS77%
LA66%
TX70%
AK97%
HI100%
NM100%
AZ43%
CA89%
OR8% ID
0%
MT25%
ND13% MN
24%WI0%
IL61%
IN37%
OH16%
KY9%
WV6%
PA15%
NY61%
ME0%
MI24%IA
0%
SD30%
NE1%
WY0%
WA29%
NV75% UT
0% CO23% KS
22%MO44%
AR53%
TN 46%OK23%
FL50%
SC64%
NC 56%
VA 53%
VT 0%
NJ 44%
DE 37%
RI 0%
CT 35%
NH 0%MA 35%
MD 74%
PERCENTAGE OF STUDENTS OF COLOR ENROLLED IN PUBLIC HIGHER EDUCATION WHO ARE IN ENORLLED IN MSI'S
FIGURE 1.1 PUBLIC MSI ENROLLMENT/PERFORMANCE FUNDING ACTIVITY
PERCENTAGE OF STUDENTS OF COLOR ENROLLED IN PUBLIC HIGHER EDUCATION WHO ARE ENROLLED IN MSIs
“Nationally there are over 500 public MSIs within
states that include 23 of the 25 that have adopted
Performance Funding policies, all of the five states that
are currently transitioning to Performance Funding
policies, and nine of the 12 states that are having
formal discussions about Performance Funding.”

STATE % OF STUDENTS OF COLOR IN PUBLIC HIGHER EDUCATION ENROLLED IN PUBLIC MSIs
# OF STUDENTS OF COLOR IN PUBLIC HIGHER EDUCATION ENROLLED IN PUBLIC MSIs
# OF PUBLIC MSIs IN THE STATE (2- AND 4-YEAR INSTITUTIONS)
ALABAMA 59.41% 46,499 19ALASKA 96.77% 9,054 5
ARIZONA 43.04% 60,056 12ARKANSAS 53.29% 23,340 13
CALIFORNIA 88.95% 1,174,861 129COLORADO 23.02% 16,929 8
CONNECTICUT 34.69% 14,104 4DELAWARE 37.04% 4,686 2
FLORIDA 50.47% 190,459 9GEORGIA 63.34% 115,286 38
HAWAII 100.00% 47,275 10IDAHO N/A N/A 0
ILLINOIS 61.43% 129,156 22INDIANA 36.74% 22,277 1
IOWA N/A N/A 0KANSAS 21.83% 8,156 6
KENTUCKY 8.57% 2,763 2LOUISIANA 65.85% 54,726 20
MAINE N/A N/A 0MARYLAND 73.96% 104,182 13
MASSACHUSETTS 34.52% 21,747 5MICHIGAN 24.02% 28,940 6
MINNESOTA 24.25% 13,492 5MISSISSIPPI 77.26% 51,449 18MISSOURI 43.68% 21,132 4
MONTANA 24.70% 1,660 5NEBRASKA 1% 144 1
NEVADA 74.91% 33,529 3NEW HAMPSHIRE N/A N/A 0
NEW JERSEY 43.83% 64,976 11NEW MEXICO 99.69% 84,068 27
NEW YORK 61.23% 187,928 21NORTH CAROLINA 55.50% 87,278 34
NORTH DAKOTA 12.71% 683 3OHIO 15.91% 16,253 3
OKLAHOMA 22.62% 15,495 11OREGON 7.55% 3,440 1
PENNSYLVANIA 14.86% 13,667 3RHODE ISLAND N/A N/A 0
SOUTH CAROLINA 63.46% 42,690 20SOUTH DAKOTA 30.36% 1,667 2
TENNESSEE 45.51% 28,701 4TEXAS 70.03% 507,372 61UTAH N/A N/A 0
VERMONT N/A N/A 0VIRGINIA 52.83% 74,707 11
WASHINGTON 29.32% 25,293 8WEST VIRGINIA 5.51% 578 2
WISCONSIN N/A N/A 0WYOMING N/A N/A 0
TOTAL 60.37% 3,350,698 582 Sour
ce: IP
EDS
Fall 2
011
enro
llmen
t dat
a •
Dat
a inc
ludes
insti
tutio
ns re
port
ing to
IPED
S w
ith M
SI sta
tus a
s of J
anua
ry, 2
014.
TABLE 1.1 PUBLIC MINORITY-SERVING INSTITUTION ENROLLMENT BY STATE

12 SOUTHERNEDUCATION.ORG
States like Pennsylvania and Arkansas have addressed the diverse missions of their public MSIs by allowing campuses to choose the measures that they wish to be evaluated on from a pre-selected group. States have also designed MSI spe-cific measures that reward campuses for increasing access and success for non-stu-dents of color. Specific examples of MSI metrics are limited to those designed for public HBCUs; states have yet to design metrics for the other types of MSIs that includes HSIs, TCUs, AANAPISIs, ANNHs, NASNTIs, and PBIs. States like Tennessee and South Carolina have included measures in their Perfor-mance Funding 1.0 policies that were specifically designed with their MSIs in mind when inverting diversity enrollment metrics for the state’s public HBCUs by attaching funding to the increased enrollment of non-Black students and faculty. Pennsylvania’s Performance Funding 2.0 policy attaches funding to the performance of non-Black students. Distinctive from the previous Tennessee and South Carolina policies, Pennsylvania has a focus on reducing “gaps” in enrollment and success between Black students and students they define as “Other Than Black or Unknown” (OTBU). Pennsylvania created a comparison group of public master’s level HBCUs to develop benchmarking goals for the public HBCU in their state system of higher education.
Using this public HBCU comparison group, Pennsylvania pro-
duced mandatory and optional HBCU metrics that require the
state’s public HBCUs to:
1) reduce the “gap” in their OTBU student enrollment
and the enrollment of OTBU students at public
master’s level HBCUs,
2) reduce the “gap” in the six-year graduation rate
between OTBU students and Black students,
3) increase the percentage of OTBU faculty at the
HBCU to the average percentage of OTBU faculty at
public master’s level HBCUs,
4) reduce the “gap” between the percentage of OTBU
transfer students enrolled at the HBCU and the
percentage of OTBU transfer students enrolled at
public master’s level HBCUs, and
5) close the six-year graduation rate “gap” for OTBU
transfer students and Black transfer students.
Minority-Serving Institutions & Performance Funding MINORITY-SERVING INSTITUTIONS & PERFORMANCE FUNDING
MSI METRICS States that have
used metric
INPUT METRICSEnrollment for Racial and Ethnic Minority Students (Minority Students defined as Non-Black)
PA, SC, TN
Enrollment for Transfer Students (Including Low-income and Non-Black Transfer Students)
PA
Faculty Diversity (increasing Non-Black) PA, TNOUTPUT METRICSClosing Achievement Gaps in Degree/Certificates Earned for Racial and Ethnic Minority Students (including Other than Black or Unknown Students)
PA
Closing the Achievement Gaps in Degree/Certificates Earned for Transfer Students (Including and Other than Black or Unknown Transfer Students)
PA

PERFORMANCE FUNDING AT MSIs 13
In 2010 the public HBCU in Pennsylvania’s state system of higher education enrolled 2% OTBU students and the average OTBU enrollment at public master’s level HBCUs was 16%, thus there was a 14 percentage point gap. Pennsylvania will base a portion of their funding on the campus’ ability to reduce the 14 percentage point gap by 50% within five years. Consequently, if there is no gap between outcomes for Black students and OTBU students, Pennsylvania will allocate funding based on the public HBCU’s ability to maintain a zero gap.
HBCU leaders have reported that Performance Funding policies challenge the institutions’ historical missions to serve Black stu-dents but support their efforts to create a more salient conver-sation about collecting and using data (Jones & Witham, 2012). HBCU leaders have also shared that the policies seemed to help shift the conversation from access to outcomes at their institu-
tions. To understand the implications of such shifts, it is important to first consider what outcomes and measures of success are important at HBCUs. The participants that included students, insti-tutional leaders, and staff members at the public HBCU that was the focus of Jones’ (2013) study shared that although their state Performance Funding policy helped them to focus on student data and outcomes, they also felt that a focus on non-Black students represented a narrow view of diversity and challenged their historical mission to create opportunities for Black students. Thus it is important to consider their unique missions when designing HBCU and other MSI specific metrics that effectively capture what these institutions are, and should be, doing. The following are a few considerations for state policy makers to help guide the development of metrics for their diverse set of public institutions that includes MSIs.

14 SOUTHERNEDUCATION.ORG
Considerations for the Development of MSI Performance Funding Metrics
1. Include Minority-Serving Institution (MSI) Leaders/Experts in Policy Development.
First, include MSI leaders/experts on any assembled committee or team that will make Performance Funding policy recommendations. Secondly, solicit input from campuses on optional measures so that it can truly serve the purpose of being responsive to institutional mission and context. Solicit advice from those in executive leadership positions, faculty, those responsible for collecting and reporting institutional data like the institutional research and/or assessment offices, and even students. Strategies for soliciting policy input and feedback include distributing surveys and holding town hall style meetings where all institutional members have an opportunity to discuss the design of the policy before it is developed and enacted. Being inclusive of institutional leaders early in the process is also important to creating buy-in or support of the policy and can increase campus awareness and improve the implementation process. It is important to guard against creating unintended perverse effects from policies that fail to take into account contextual differences. After the policy is implemented, states should also solicit the support of institutions, especially MSIs in their process to assess policy impact and potential unintended consequences. Performance Funding policies should be flexible. It is important that states continually refine performance metrics based on what they are learning about the intended and unintended consequences of the policy. Although it is critical to track changes in institutional performance along each of the outcome measures included in the policy, it is also important to track unintended outcomes. One way to get an idea of the potential unintended outcomes is to create a committee made up of representatives from each of the campuses impacted by the policy to discuss policy understanding, reception, and impact on campus. Further, states should conduct quantitative analyses of potential economic and racial stratification and shifts in student populations at their campuses. Policymakers can use input from the committee and subsequent institutional data analyses to examine issues like mission drift and reduced access or increased selectivity that may have emerged after the enactment of their Performance Funding policies.
2. Reconsider the Utility of Commonly Used Metrics.
Commonly used metrics like graduation and job placement rates can pose challenges for accurately capturing the performance of MSIs, and in their current conceptualization are problematic overall. Although graduation rates can be useful for getting a general sense of how well students are faring at a particular institution, there should be a much higher level of scrutiny when institutional funding is at stake. Graduation rates have been scrutinized because it is not currently possible to track college students that transfer be-tween institutions. If a college student attends two or more campuses before graduating, which campus should get “credit” for that student’s completion and success? One third of all college students transfer at least once before earning a degree (Hossler et al., 2012). Additionally, over 25% of these transfers are across state lines and 22% of transfers happen as late as the fourth and fifth years of college, further complicating the process of properly awarding “credit” for completion. Until the issues of current postsecondary data systems’ inability to track students between institutions and decisions about how to award “credit” for completion are resolved, graduation rates as a performance metric
PERFORMANCE FUNDING AT MSIs 15
are limited in their ability to truly capture institutional effectiveness. Similarly some states have utilized job placement rates that do not include students’ placement in jobs outside of the state where they attended college, thus limiting the accuracy of the metric. Hence, the limitations of these metrics must be considered, especially for states that have or are planning to transition to higher education funding models that are 100% dependent on performance metrics.
In their quest for optimal metrics states are also encouraged to consider non-traditional ways of defining college “success.” Discussing how “success” should be defined ought to happen before identifying metrics. Rather than simply adopting the measures used by neighboring states it is important for states to first consider the needs of their state and the people that reside in it. Do not simply adopt STEM related metrics because that is the national discussion and what other states are doing, instead, consider the following suggestions: what are the particular industries that have employment shortages in the state? Are there ways to create incentives to support the growing industries in the state? Once there is some consensus on the goals for higher education and subsequent definitions of success, then those definitions should drive the adoption of appropriate metrics. For example, the Massachusetts Department of Higher Education has articulated a goal to “produce the best-educated citizenry and workforce in the nation” (Massachu-setts Department of Higher Education, 2013). Thus, the department has created a study group to develop strategies for measuring engaged citizenship, demonstrating a unique departure from standard Performance Funding policies.
3. Metrics should be Responsive to Input Factors.
Evidence from the influence of the U.S. News and World Report rankings suggests that increasing selectivity is likely for institutions attempting to increase outputs like graduation rates. The challenge is that many institutions, like community colleges and MSIs, aim to provide access to college for students who are least likely to enroll at highly selective institutions. One strategy for developing a Performance Funding policy that could avoid this common pitfall is ensuring that output indicators are responsive to input indicators. If an institution has an open-admissions policy that should allow the admission of academ-ically underprepared students, then applicable output indicators would focus on how effective the institution was in educating that particular population of students. Potential output indicators for open-admission and less-selective campuses include time from developmental education course to credit-bearing course completion and an eight-year graduation rate.
Policy makers can look to campus missions to gain understanding of who the target “inputs” are and how to assess how effective the institution is at educating them. Using metrics responsive to input factors means that there could be measures that are tailored to the specific missions of MSIs. For example, if an MSI has a specific goal of educating a “diverse student population” or “developing minority leaders,” Performance Funding policies should include measures that directly attempt to assess whether or not these institutions are meeting their goals. MSIs’ contribution to the education of diverse college graduates in the state could be rewarded. State and institutional leaders could work
16 SOUTHERNEDUCATION.ORG
together to conceptualize how concepts like “leadership” and “civic engagement” that often appear in MSI missions could be evaluated. Some examples include participation in national leadership and service organizations like the Peace Corps, or the proportion of registered voters on a campus. There could also be a consideration of metrics that capture some of the “special” or “unique” benefits or characteristics of MSIs. If there are advantages for students of color attending MSIs beyond enrollment and student demo-graphics, those concepts are worth exploring for their potential to be translated into measures or evidence of MSI success. For example, a few states have included output measures related to job placement, readiness, and success as measured by employment rates and earnings. McMickens’ (2012) concept of “racism readiness” is HBCU specific and could be included as a sub measure of job readiness. McMickens’ (2012) study proposed that HBCUs had prepared students for encountering racism in the post-grad-uate environment, providing some possible explanation for the post-graduate success rates of HBCU graduates. 4 Racism readiness is an example of something that HBCUs can provide to their students that can lead to desired outcomes such as earnings and postbaccalaureate degree attainment. Hence racism readiness could be an ideal measure of institutional performance that is particular to the HBCU context, but is also linked to desired student outcomes.
When developing output measures that correspond to MSI goals and inputs it is also important to identify appropriate comparison groups. First, institutions with similar missions should be compared to one another as opposed to comparing institutions with drastically different missions. Similarly, because of their varying missions, comparing a research university to a community college would be problematic because their varying missions would drive different definitions of “success” at these institutions. For example, most policy makers have measured “success” at research universities as the awarding of research grants and measured “success” at community colleges as the awarding of associates degrees or successful transfer to four-year colleges and universities. Similarly, comparing HBCUs to non-HBCUs who may define “success” as providing opportunity or serving Black students can pose challenges. I caution against developing a prescriptive list of MSI indicators and measures, but instead policymakers should consider what is unique about each MSI in their state system of higher education. While it was a step in the right direction, states like Pennsylvania used averages from a group of HBCUs to develop metrics for their own public HBCU, one should use caution when treating MSIs, even those with the same Carnegie classification, as if they were an undifferentiated group, (e.g., using more selective and larger MSIs as a point of comparative reference for smaller or less selective campuses).The measures used for large, selective, or doctoral granting MSIs should be different from those used for small, less-selective MSIs.
4 An average of HBCU students across institutions had lower grades and standardized test scores than their Black peers at PWIs, yet they are more likely to graduate and to earn a graduate or professional degree (Wenglinsky, 1996). The average individual earnings of HBCU graduates also exceed those of Black non HBCU college graduates (Price, Spriggs, & Swinton, 2011; U.S. Commission on Civil Rights, 2010).
PERFORMANCE FUNDING AT MSIs 17
4. Address Data Capacity before Implementing the Policy. Higher education accountability advocates have used illustrations that compare institutions like Syracuse University and Hofstra University to suggest that institutions with similar demographics should be able to produce similar results (i.e., with similar demographics Syracuse has higher graduation rates than Hofstra). However, without a conversation about institutional context, a market based accountability system seems like the ideal solution to drive competitors to adopt the most “effective” practices and strategies. Higher education institutions operate with varying levels of capacity that in addition to demographic inputs, drive outcomes. The following are a few capacity related factors that should be considered in the development of any Performance Funding system. First, financial resources is one of the most obvious factors that directly influences an institutions’ capacity to serve students. It should not be a surprise that Syracuse, an institution with an over $1 billion endowment, (which is nearly four times the endowment of Hofstra,) might have higher graduation rates. Any plan aimed at improving institutional effectiveness should include indicators of institutional capacity and resources, so that outcomes can be more accurately understood.
Secondly, the effectiveness of Performance Funding policies depends on campuses’ ability to accurately report data back to state higher education governing bodies; hence data capacity is critical to campus and policy effectiveness and success. The public HBCU experiencing a Performance Funding policy that was the focus of Jones’ (2013) study, reported difficulty and subsequent delays in generating the data needed to assess their current standing and to set goals for improvement on the policy metrics. Further, one may look at the per student expenditure of some public MSIs and argue that they receive more funding than the other campuses. However, because of issues like small enrollment, endowment, and historical financial neglect, items like a cutting edge data system, fully staffed institutional research and assessment offices, and even a wireless internet system are difficult to finance. Even if a public MSI receives more per student funding than their neighboring Predominately White Institution (PWI), if the neighboring campus has more than five times the student enrollment, they are better equipped to create technology-heavy infrastructures that are expensive to support. It is important that states with a concentration of MSIs have incentives to support data and techno-logical infrastructure development because data capacity will be a critical component of performance policy success. This is not meant to broadly imply that MSIs do not collect and report data efficiently, but rather to suggest that states conduct a survey to assess campus data capacity and needs prior to policy implementation in order to ensure that all campuses in the state have equitable opportunities to obtain Performance Funding.
5. Strategies for Addressing Racial and Ethnic Equity:
First, in addition to populations like low-income and adult students, racial and ethnic groups should be included in Performance Funding equity metrics that reward campuses for the enrollment and success of underserved groups. States can include race as a subgroup in their measures of institutional enrollment, course completion, and graduation rates. An equity focused Performance Funding policy would not only expose campuses
18 SOUTHERNEDUCATION.ORG
that have poor outcomes like large equity gaps between the graduation rates of various racial and ethnic or income groups, but also provide some understanding of why, through quality and student experience oriented indicators. College student development research suggests that a negative campus racial climate can impact minority students ability to adjust, develop a sense of belonging, and ultimately persist at institutions of higher education (Cabrera et al., 1999; Hurtado and Carter, 1997). Measures of campus climate can indicate the quality of experience that different groups of students are having. Considering the recent series of highly publicized racial incidents and the reporting of racially differentiated experiences through public outlets like the #BBUM (Being Black at University of Michigan) twitter hashtag, reiterates the importance of assessing campus climate for states interested in improving educational equity. Campus climate can be measured by surveying students about their sense of belonging and tracking the rate of reported discriminatory incidents on campus. Measures of campus racial climate could be incorporated into campus evaluation systems using data like the number or increases in reported racial incidents, racial equity gaps in student outcomes, and surveys of campus racial climate.
Another factor that is important to the success of students of color is the idea of critical mass. If there is a certain threshold of students and faculty of color at institutions of higher education students of color are more likely to report positive experiences and have successful outcomes (Hagedorn et al., 2007). Considering that in many states students of color have yet to reach critical mass at the public PWIs and are underrepre-sented at institutions of higher education (especially four-year colleges and universities) in comparison to their proportion of the state population, it may not be strategic for states to decrease the student of color representation at MSIs. Although it may seem logical to simply invert racial and ethnic diversity metrics for MSIs, states should reconsider simply defining diversity as “non-Black” at HBCUs or “non-students of color” at MSIs. Further understanding of how such incentives to support non-Black, and non-students of color will shift institutional priorities or even result in the successful awarding of additional funding should be carefully and critically considered and monitored. Despite court orders, federal policies, and economic incentives to diversify their student bodies, HBCUs have nevertheless remained predominately Black (National Center for Education Statistics, 2010). Hence, the history of racial integration at HBCUs suggests that an MSI that is being held accountable for the improved enrollment and outcomes of non-students of color could a) ignore the need to improve the enrollment and outcomes of non-students of color and forfeit Performance Funding or b) adjust the mission or culture of the institution by shifting their focus to non-students of color and possibly still have trouble enrolling these students. Instead of relying on race to address issues of equity and diversity at MSIs, alternative metrics could include economic diversity (proportion of students who are Pell Grant eligible), ethnic diversity, or first generation status.

PERFORMANCE FUNDING AT MSIs 19
Conclusions
The majority of the United States is rapidly adopting Performance Funding models, with the discussion even at the international level as countries like Canada look to models like those found in Tennessee to develop similar Performance Funding systems (The Varsity, 2014). Similar to the arguments many educators have re-cently made warning the federal government about the potential problems of a national college rating system, Performance Funding policies are challenged by limitations of available data, difficulty identifying appropriate metrics for such a diverse set of organiza-tions, and the challenges with defining and measuring educational value and success. Therefore many state policy makers should move cautiously as they consider the adoption of these funding models to carefully consider the nation’s most vulnerable institu-tions that are often serving the most neglected student popula-tions, the nations’ public MSIs. Further, what is more powerful than the perceptions of colleges that could emerge from a campus ratings system, is the threat of a reduction in the state funding needed to improve institutional effectiveness that could result from the enactment of a state Performance Funding formula.
Additionally there have been virtually no analyses on the impact of Performance Funding policies on student outcomes disaggregated by MSI status, only a few dissertations on policy implementation and perceptions at HBCUs (i.e., Griffin, 2013; Jones, 2013). As institutions with limited resources, Performance Funding can have a significant impact on the institutional priorities, behavior, and outcomes at public MSIs, therefore it is important to carefully craft measures that will enhance MSI effectiveness. For example, does it make sense to incentivize the increased enrollment and success of White students at the states’ MSIs when the majority of students of color are enrolled at public MSIs, and yet are still underrepre-sented at the state’s campuses overall? To avoid metrics that could impede MSI success, it is essential that policy makers consult MSI institutional leaders and scholars when developing Performance Funding policies.
The term “performance” is different from “outcome” in that “outcome” is defined as a final product or end result. However “performance” is defined as the execution or accomplishment of work, yet some Performance Funding systems are being developed based on existing models and are rarely inclusive of measures that take into consideration the context in which the work was accomplished and the factors that make the final results valuable. An enhanced Performance Funding 2.0 policy would include measures that are truly responsive to diverse institutional
missions and student populations, ensure appropriate capacity for data collection and reporting, and include institutional leaders in policy development and revision. Finally, one must consider the educational values that cannot be easily captured through a nu-merical evaluation system. For example, it may not be possible to fully capture the “added-value” of attending an MSI for a student of color or attending a local university for a low-income, working student. Therefore it is critical to continue questioning how distinct institutional contexts are taken into consideration in the develop-ment of accountability and performance policies that are predicat-ed on principles of fairness, standardization, and equity.

20 SOUTHERNEDUCATION.ORG
Allen, W. R. (1992). The color of success: African-American college student outcomes at predominantly White and historically Black public colleges and universities. Harvard Educa-
tional Review, 62(1), 26-44.
Arizona Board of Regents (2013). The Arizona higher education enterprise: The Arizona
university system five-year strategic plan 2014-
2018. Retrieved from: http://azregents.asu.edu/ABOR%20Reports/Arizona-University-Sys-tem-5-year-strategic-plan-2013-2017.pdf.
Cabrera, A.F., Nora, A., Terenzini, P.T., Pascarella, E.T., & Hagedorn, L.S. (1999). Campus racial climate and the adjustment of student to college: A comparison between White students and African-American students. The Journal of
Higher Education, 70(2), 134–160.
Center for Minority-Serving Institutions (2013). MSI directory. Retrieved from http://www2.gse.upenn.edu/cmsi/tools/directory.
Cunningham, A., Park, E., & Engle, J. (2014). Minority-Serving Institutions: Doing more with less.
Washington, D.C.: Institute for Higher Education Policy.
Dougherty, K. J., Natow, R. S., Hare, R. J., Jones, S. M., & Vega, B. E. (2011). The politics of perfor-
mance funding in eight states: Origins, demise,
and change. New York: Community College Research Center, Teachers College, Columbia University.
Dougherty, K. J., & Reddy, V. (Eds.). (2013). Per-formance Funding for higher education: What are
the mechanisms what are the impacts: ASHE, 39, (2). San Francisco, CA: John Wiley & Sons.
Ferguson, D. (2014). Iowa Board of Regents considers performance-based funding. Iowa
State Daily. Retrieved from http://www.iowasta-tedaily.com/news/article_1aacf0fe-7f12-11e3-887b-0019bb2963f4.html. Friedel, J.N., Thornton, Z.M., D’Amico, M.M., & Katsinas, S.G. (2013). Performance-Based Fund-
ing: The national landscape. Tuscaloosa, AL: The University of Alabama, Education Policy Center.
Fries-Britt, S., & Turner, B. (2002). Uneven sto-ries: Successful Black collegians at a Black and a White campus. The Review of Higher Education,
25(3), 315-330.
Gasman, M., & Conrad, C.F. (2013). Minori-
ty-Serving Institutions: Education all students. Center for Minority-Serving Institutions. Philadelphia, PA: University of Pennsylvania Graduate School of Education.
Griffin, C. L. (2013). The impact of performance
based funding on the mission of a small histor-
ically black university (Unpublished doctoral dissertation). Mercer University, Macon GA.
Hagedorn, L. S., Chi, W. Y., Cepeda, R. M., & McLain, M. (2007). An investigation of critical mass: The role of Latino representation in the success of urban community college students. Research in Higher Education, 48(1), 73-91.
Hispanic Association of Colleges and Uni-versities (2012). HACU list of Hispanic Serving
Institutions 2010-2011. Retrieved from http://www.hacu.net/images/hacu/OPAI/2010%20Fed%20HSI%20list.pdf.
Hossler, D., Shapiro, D., Dundar, A., Ziskin, M., Chen, J., Zerquera, D., & Torres, V. (2012). Trans-
fer and mobility: A national view of pre-degree
student movement in postsecondary institutions.
Retrieved from http://pas.indiana.edu/pdf/Transfer & Mobility.pdf. Hurtado, S., & Carter, D.F. (1997). Effects of college transition and perceptions of the cam-pus racial climate on Latino college students’ sense of belonging. Sociology of Education, 70(4), 324–345.
Hussar, W.J., & Bailey, T.M. (2013). Projections of
education statistics to 2021: Fortieth edition. Na-tional Center for Education Statistics. Washing-ton, D.C.: U.S. Department of Education.
Jones, T. (2013). A historical mission in the ac-countability era: HBCU perspectives on a state Performance-Based Funding policy. Paper pre-sented at the annual Meeting of the Association
for the Study of Higher Education, St. Louis, MO.
Jones, T., & Witham, K. (2012). What is account-ability for equity at public Historically Black Colleges and Universities? Paper presented at the Annual Meeting of the Association for the
Study of Higher Education, Las Vegas, NV.
Kim, M.M., & Conrad, C. F. (2006). The impact of Historically Black Colleges and Universities on the academic success of African American students. Research in Higher Education, 47 (4), 399-427.
Li, X., & Carroll, C.D. (2007). Characteristics
of Minority-Serving Institutions and minority
undergraduates enrolled in these institutions:
Postsecondary education descriptive analysis
report. Washington, D.C.: U.S. Department of Education.
References
PERFORMANCE FUNDING AT MSIs 21
Massachusetts Department of Higher Edu-cation (2013). Within our sights: Inside campus
efforts to achieve national leadership in public
higher education. Retrieved from http://www.mass.edu/visionproject/documents/WithinOur-SightsLo-Res.pdf.
McLendon, M. K., Hearn, J. C., & Deaton, R. (2006). Called to account: Analyzing the origins and spread of state performance-accountability policies for higher education. Educational Evalu-
ation and Policy Analysis, 28(1), 1-24.
McMickens, T. L. (2012). Running the race when race is a factor. Phi Delta Kappan, 93(8), 39-43.
National Center for Education Statistics Data (2010). 1990 through 2009 Integrated Postsec-
ondary Education Data System, “Fall Enrollment
Survey.” Washington, D.C.: U.S. Department of Education.
National Center for Education Statistics (2013). Institutional Profile. Integrated Postsecondary Education Data System (IPEDS). Washington, D.C.: U.S. Department of Education.
National Conference for State Legislatures (2014). Performance-based funding for higher
education. Retrieved from http://www.ncsl.org/research/education/performance-funding.aspx. Nelson Laird, T.F., Bridges, B. K., Holmes, M. S., Morelon, C. L., & Williams, J. M. (2007). African American and Hispanic student engagement at minority serving and predominantly White institutions. Journal of College Student Develop-
ment, 48(1), 39-56.
Perna, L. W., Lundy-Wagner, V., Drezner, N. D., Gasman, M., Yoon, S., Bose, E., & Gary, S (2009). The contribution of HBCUs to the preparation of African American women for STEM careers: A case study. Research in Higher Education,
50(1), 1 – 23.
Price, G.N, Spriggs, W., & Swinton, O.H. (2011). The relative returns to graduating from a Historically Black College /University: Propensi-ty score matching estimates from the national survey of Black Americans. The Review of Black
Political Economy, 38, 103- 130.Redd, K.E. (2000). HBCU graduates: Employment,
earnings and success after college. Indianapolis: USA Group Foundation.
Ruppert, S. (ed.) (1994). Charting Higher Edu-
cation Accountability: A Sourcebook of State-Level
Performance Indicators. Denver, CO: Education Commission of the States.
Shulock, N. (2011). Concerns about perfor-
mance-based funding and ways that states
are addressing the concerns. Sacramento, CA: California State University, Sacramento, Institute for Higher Education Leadership & Policy.
Simkins, S., & Allen, S. (2001). Are learning out-comes in economics different at predominately Black and White universities? Lessons from principles of macroeconomics courses at two school. The Review of Black Political Economy,
28(3), 23-39.
Solorzano, D.G. (1995). The doctorate produc-tion and baccalaureate origins of African Amer-icans in the sciences and engineering. Journal of
Negro Education, 64(1), 15-32.
Tandberg, D.A., & Hillman, N.W. (2013). State Performance Funding for Higher Educa-
tion: silver bullet or Red herring? [WISCAPE POLICY BRIEF]. Madison, WI: University of Wisconsin-Madison, Wisconsin Center for the Advancement of Postsecondary Education [WISCAPE].
The Varsity (2014). Ontario funding formula hurts students: Providence should consider outcome-based funding. The Varsity,134 (16). Retrieved from http://thevarsity.ca/2014/01/27/ontario-funding-formula-hurts-students/.
22 SOUTHERNEDUCATION.ORG
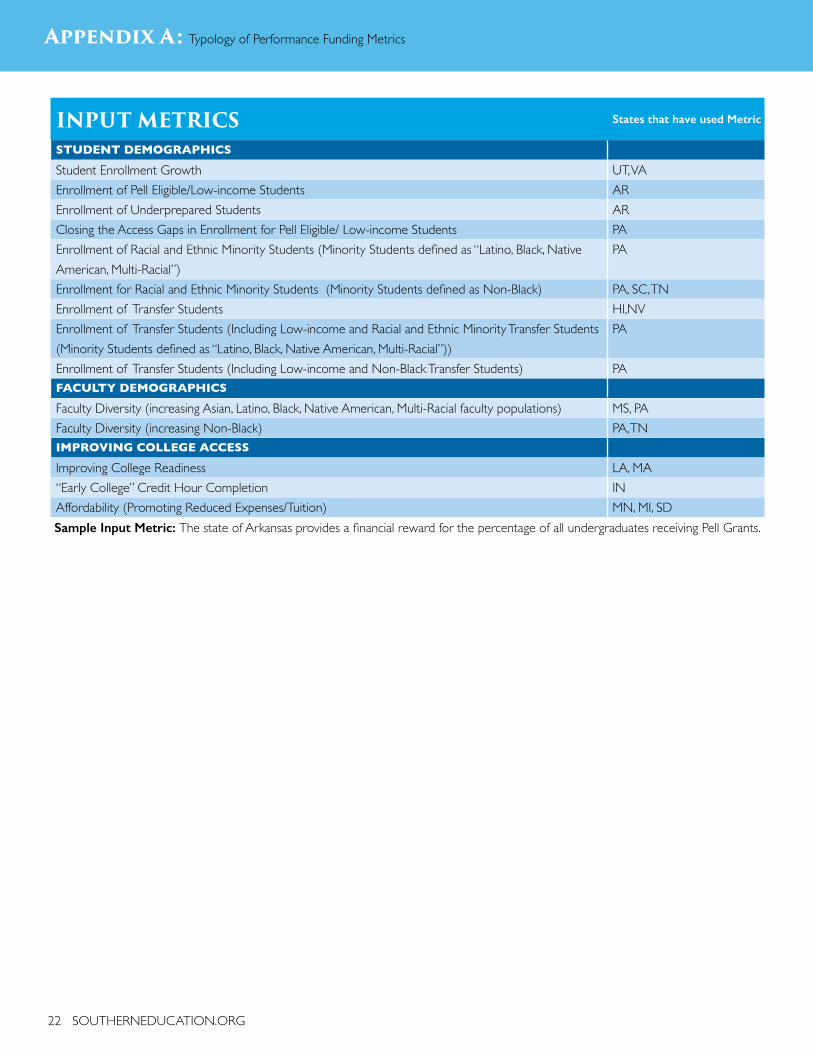
INPUT METRICS States that have used Metric
STUDENT DEMOGRAPHICS
Student Enrollment Growth UT, VAEnrollment of Pell Eligible/Low-income Students AREnrollment of Underprepared Students ARClosing the Access Gaps in Enrollment for Pell Eligible/ Low-income Students PAEnrollment of Racial and Ethnic Minority Students (Minority Students defined as “Latino, Black, Native American, Multi-Racial”)
PA
Enrollment for Racial and Ethnic Minority Students (Minority Students defined as Non-Black) PA, SC, TNEnrollment of Transfer Students HI,NVEnrollment of Transfer Students (Including Low-income and Racial and Ethnic Minority Transfer Students (Minority Students defined as “Latino, Black, Native American, Multi-Racial”))
PA
Enrollment of Transfer Students (Including Low-income and Non-Black Transfer Students) PAFACULTY DEMOGRAPHICS
Faculty Diversity (increasing Asian, Latino, Black, Native American, Multi-Racial faculty populations) MS, PAFaculty Diversity (increasing Non-Black) PA, TNIMPROVING COLLEGE ACCESS
Improving College Readiness LA, MA“Early College” Credit Hour Completion INAffordability (Promoting Reduced Expenses/Tuition) MN, MI, SD
Appendix A: Typology of Performance Funding Metrics
Sample Input Metric: The state of Arkansas provides a financial reward for the percentage of all undergraduates receiving Pell Grants.

PERFORMANCE FUNDING AT MSIs 23
PROGRESS/PROCESS METRICS States that have used Metric
COURSE COMPLETION
Credit Accumulation: Number of Students Completing a Designated Number of Credits (i.e., 12,18, 24, 48, 72)
AZ, AR, IL, MS, MO, NM, OH, OK, SD, TN, TX, WA
Non-Developmental Education Course (or Credit-bearing Course) Completion Rates AR, MO, NV, TX, WADevelopmental Course Completion (Including “Progression from Developmental Education to Cred-it-bearing Courses”)
AR, IL, IN,MS, MO, OH,TX, WA
Dual Enrollment Credit Completion INCOURSE LEARNING OUTCOMES
Student Learning KS, MA[1], MOPreparation for Civic Engagement MARETENTION/PERSISTENCE
Year-to-Year Retention/Persistence Rate KS, LA, MN, MS, MO, OK, PA, SD, VA,
Year-to-Year Retention/Persistence Rate for Pell Grant Eligible/Low-income Students OKINCREASING INSTITUTIONAL CAPACITY
Research or Grant Funding Awarded AZ, IL, IN, MI, MS, MO, PA, TN, VA
Patents (Number of U.S. patents issued) ARNumber of New Company Start-Ups ARIncreased Financial Efficiency (cost per-credit hour, cost per-completion, expenditures, strategic use of technology)
IL, IN, MS, MO, NV, PA,VA
Program Accreditation OKParticipation in a Transfer Network MI
OUTPUT METRICS States that have used Metric
TRANSFER
Transfer of Community College Students to a Four-Year Institution AR, IL, KS, NV, OH, TN, TX
DEGREE COMPLETION
Graduation Rates (Including two-year, four-year, six-year, and eight-year[2]) IL, IN, KS, LA,MI, MN, MS, MO, OK, TN, VA
Number of Degrees/Certificates Awarded/Completed AZ, AR, HI, IL, IN, KS, MA, MN, MS, MO, NV, NM, OH, OK, PA, SD, TN, TX, UT, VA, WA,
STEM Credential/Degree Production AZ, AR, IL, KS, MI, MS, NV, NM, OH, PA
“On-Time” Degree/Certificate Completion IN, SD
Sample Process Metric: The state of Florida rewards campuses for their “academic progress rate” which is measured by the 2nd year retention rate for students with a Grade Point Average of 2.0 or higher.

24 SOUTHERNEDUCATION.ORG
DEGREE COMPLETION BY DEMOGRAPHIC GROUP
Degree/Certificate Completion for Students Enrolled in at Least one Developmental Education Course ARNumber of Degree/Certificates Earned in State Designated High Demand Fields AR, IN, MS, NV, NM, NDNumber of Degrees/Certificates Earned by Racial and Ethnic Minority Students (including Asian, Latino, Black, Native American, Multi-Racial)
AR, IL, MO, OH, SD,
Number of Degrees/Certificates Earned by Non-Traditionally Aged Students AR, IL, MS, SD, TNNumber of Degrees/Certificates Earned by Pell Grant Eligible/Low-income Students IL, IN, MS, MO, NM, OH, SD,
TNNumber of Degrees/Certificates Earned by Students who Transferred from another Institution in the state
AR,
Degree/Certificate Completion for “Academically Underprepared” Students IL, MS, OH, SDClosing Achievement[3] Gaps in Degree/Certificates Earned for Racial and Ethnic Minority Students (Minority Students defined as “Latino, Black, Native American, Multi-Racial”)
MA, PA
Closing Achievement Gaps in Degree/Certificates Earned for Racial and Ethnic Minority Students (in-cluding Other than Black or Unknown Students)
PA
Closing Achievement Gaps in Degree/Certificates Earned for Low-income/Pell Eligible Students MA, PAClosing Achievement Gaps in Degree/Certificates Earned for Transfer Students (Including Low-income and Racial and Ethnic Minority Transfer Students) (Minority Students defined as “Latino, Black, Native American, Multi-Racial”)
PA
Closing the Achievement Gaps in Degree/Certificates Earned for Transfer Students (Including Low-in-come and Other than Black or Unknown Transfer Students)
PA
POST GRADUATE SUCCESS
Job Placement Rates KS, MN, MO, SDStudent Success on Licensing Exams KS, LA, MO, SDJob Placement in High-Need Fields HINumber of Credential Completers that Obtain Employment AR, HIAlignment of Certificate/Degree Offerings with State Employer Needs MANumber of Workforce Training Hours Reported ARGraduate Wages/Earnings KSSample Output Metric: The state of Nevada’s four-year institutions are rewarded for the total number of bachelor’s degrees conferred during an academic year. Students earning multiple degrees in an academic year will have each earned degree count as a separate outcome. An additional weight of .4 per bachelor’s degree awarded to a minority or Pell eligible student is applied.
[1] Massachusetts is organizing a multi-state effort to design ways to measure student leaning without using standardized exams. Facul-ty are building new assessment models using samples of real student work.[2] Illinois is the only state with an eight-year graduation rate.[3] Achievement in this group of indicators is defined as the percentage of students who obtained a bachelor’s degree within six-years.
PERFORMANCE FUNDING AT MSIs 25
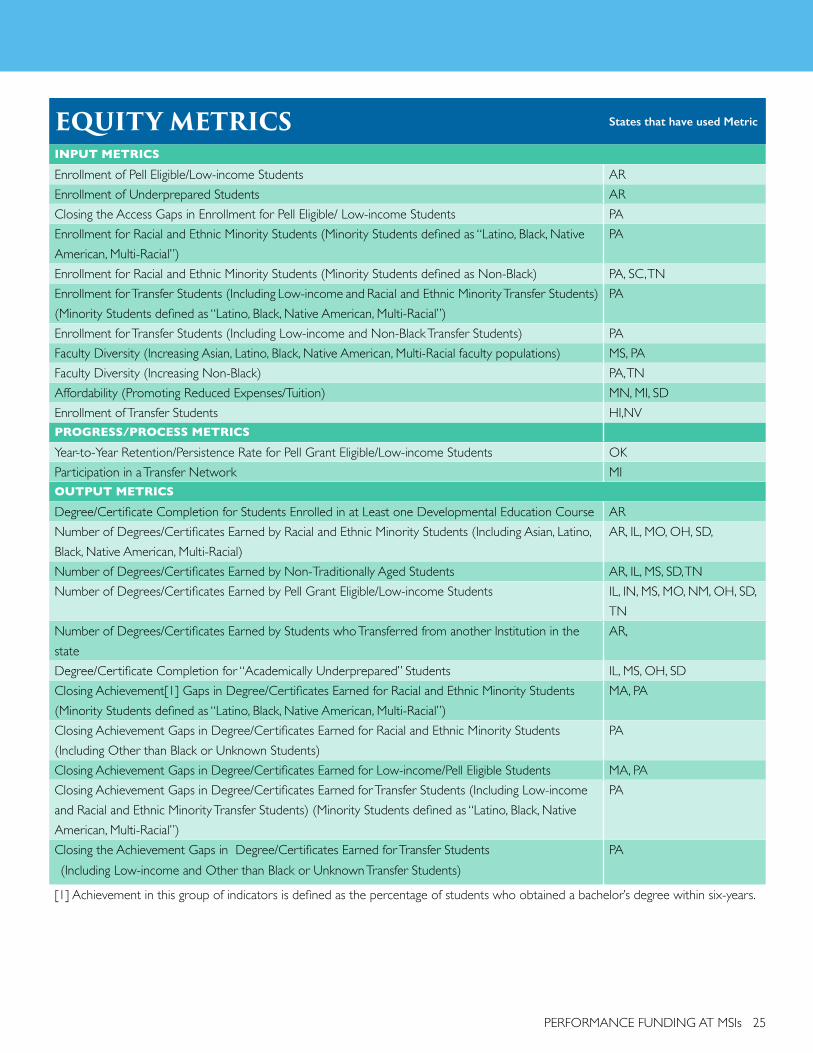
EQUITY METRICS States that have used Metric
INPUT METRICS
Enrollment of Pell Eligible/Low-income Students AREnrollment of Underprepared Students ARClosing the Access Gaps in Enrollment for Pell Eligible/ Low-income Students PAEnrollment for Racial and Ethnic Minority Students (Minority Students defined as “Latino, Black, Native American, Multi-Racial”)
PA
Enrollment for Racial and Ethnic Minority Students (Minority Students defined as Non-Black) PA, SC, TNEnrollment for Transfer Students (Including Low-income and Racial and Ethnic Minority Transfer Students) (Minority Students defined as “Latino, Black, Native American, Multi-Racial”)
PA
Enrollment for Transfer Students (Including Low-income and Non-Black Transfer Students) PAFaculty Diversity (Increasing Asian, Latino, Black, Native American, Multi-Racial faculty populations) MS, PAFaculty Diversity (Increasing Non-Black) PA, TNAffordability (Promoting Reduced Expenses/Tuition) MN, MI, SDEnrollment of Transfer Students HI,NVPROGRESS/PROCESS METRICS
Year-to-Year Retention/Persistence Rate for Pell Grant Eligible/Low-income Students OKParticipation in a Transfer Network MIOUTPUT METRICS
Degree/Certificate Completion for Students Enrolled in at Least one Developmental Education Course ARNumber of Degrees/Certificates Earned by Racial and Ethnic Minority Students (Including Asian, Latino, Black, Native American, Multi-Racial)
AR, IL, MO, OH, SD,
Number of Degrees/Certificates Earned by Non-Traditionally Aged Students AR, IL, MS, SD, TNNumber of Degrees/Certificates Earned by Pell Grant Eligible/Low-income Students IL, IN, MS, MO, NM, OH, SD,
TNNumber of Degrees/Certificates Earned by Students who Transferred from another Institution in the state
AR,
Degree/Certificate Completion for “Academically Underprepared” Students IL, MS, OH, SDClosing Achievement[1] Gaps in Degree/Certificates Earned for Racial and Ethnic Minority Students (Minority Students defined as “Latino, Black, Native American, Multi-Racial”)
MA, PA
Closing Achievement Gaps in Degree/Certificates Earned for Racial and Ethnic Minority Students (Including Other than Black or Unknown Students)
PA
Closing Achievement Gaps in Degree/Certificates Earned for Low-income/Pell Eligible Students MA, PAClosing Achievement Gaps in Degree/Certificates Earned for Transfer Students (Including Low-income and Racial and Ethnic Minority Transfer Students) (Minority Students defined as “Latino, Black, Native American, Multi-Racial”)
PA
Closing the Achievement Gaps in Degree/Certificates Earned for Transfer Students (Including Low-income and Other than Black or Unknown Transfer Students)
PA
[1] Achievement in this group of indicators is defined as the percentage of students who obtained a bachelor’s degree within six-years.
26 SOUTHERNEDUCATION.ORG
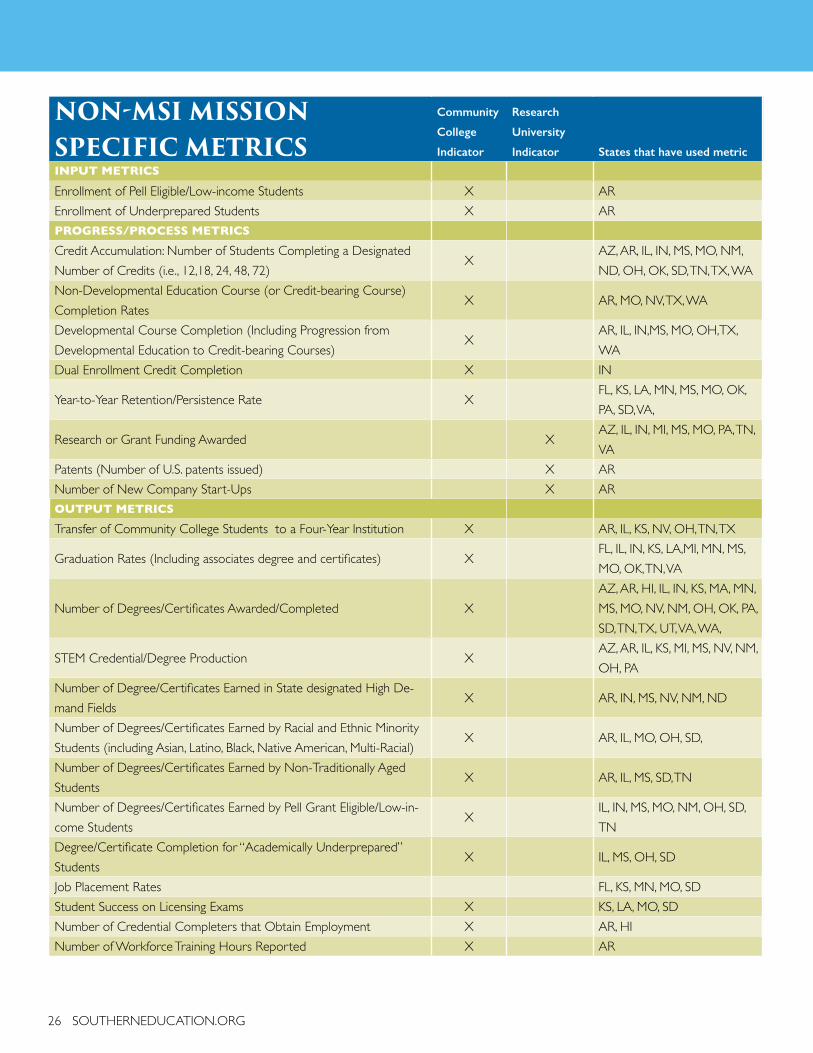
NON-MSI MISSION SPECIFIC METRICS
Community
College
Indicator
Research
University
Indicator States that have used metric
INPUT METRICS
Enrollment of Pell Eligible/Low-income Students X AREnrollment of Underprepared Students X ARPROGRESS/PROCESS METRICSCredit Accumulation: Number of Students Completing a Designated Number of Credits (i.e., 12,18, 24, 48, 72)
XAZ, AR, IL, IN, MS, MO, NM, ND, OH, OK, SD, TN, TX, WA
Non-Developmental Education Course (or Credit-bearing Course) Completion Rates
X AR, MO, NV, TX, WA
Developmental Course Completion (Including Progression from Developmental Education to Credit-bearing Courses)
XAR, IL, IN,MS, MO, OH,TX, WA
Dual Enrollment Credit Completion X IN
Year-to-Year Retention/Persistence Rate XFL, KS, LA, MN, MS, MO, OK, PA, SD, VA,
Research or Grant Funding Awarded XAZ, IL, IN, MI, MS, MO, PA, TN, VA
Patents (Number of U.S. patents issued) X ARNumber of New Company Start-Ups X AROUTPUT METRICSTransfer of Community College Students to a Four-Year Institution X AR, IL, KS, NV, OH, TN, TX
Graduation Rates (Including associates degree and certificates) XFL, IL, IN, KS, LA,MI, MN, MS, MO, OK, TN, VA
Number of Degrees/Certificates Awarded/Completed XAZ, AR, HI, IL, IN, KS, MA, MN, MS, MO, NV, NM, OH, OK, PA, SD, TN, TX, UT, VA, WA,
STEM Credential/Degree Production XAZ, AR, IL, KS, MI, MS, NV, NM, OH, PA
Number of Degree/Certificates Earned in State designated High De-mand Fields
X AR, IN, MS, NV, NM, ND
Number of Degrees/Certificates Earned by Racial and Ethnic Minority Students (including Asian, Latino, Black, Native American, Multi-Racial)
X AR, IL, MO, OH, SD,
Number of Degrees/Certificates Earned by Non-Traditionally Aged Students
X AR, IL, MS, SD, TN
Number of Degrees/Certificates Earned by Pell Grant Eligible/Low-in-come Students
XIL, IN, MS, MO, NM, OH, SD, TN
Degree/Certificate Completion for “Academically Underprepared” Students
X IL, MS, OH, SD
Job Placement Rates FL, KS, MN, MO, SDStudent Success on Licensing Exams X KS, LA, MO, SDNumber of Credential Completers that Obtain Employment X AR, HINumber of Workforce Training Hours Reported X AR

PERFORMANCE FUNDING AT MSIs 27
MSI METRICS States that have used metric
INPUT METRICSEnrollment for Racial and Ethnic Minority Students (Minority Students defined as Non-Black)
PA, SC, TN
Enrollment for Transfer Students (Including Low-income and Non-Black Transfer Students)
PA
Faculty Diversity (increasing Non-Black) PA, TNOUTPUT METRICSClosing Achievement Gaps in Degree/Certificates Earned for Racial and Ethnic Minority Students (Including Other than Black or Unknown Students)
PA
Closing the Achievement Gaps in Degree/Certificates Earned for Transfer Students (Including Low-income and Other than Black or Unknown Transfer Students)
PA

INSTITUTION NAME AANAPISI HSI HBCU TCU NASNTI ANNH PBI 2YR 4YRALABAMA
Alabama A&M University X XAlabama State University X XBishop State Community College X XGadsden State Community College X XTrenholm State Technical College X XJ F Drake State Technical College X XLawson State Community College X XShelton State Community College-Fredd Campus X XAlabama Southern Community College X XAuburn University at Montgomery X XCentral Alabama Community College X XChattahoochee Valley Community College X XGeorge C. Wallace Community College-Dothan X XGeorge C. Wallace State Community College-Selma X XJefferson Davis Community College X XReid State Technical College X XTroy University X XTroy University-Montgomery X XUniversity of Alabama at Birmingham X XUniversity of West Alabama X XALASKA
Ilisagvik College X X X XPrince William Sound Community College X XUniversity of Alaska, Fairbanks X XUniversity of Alaska, Southeast X XUniversity of Alaska, Anchorage X XKodiak College, University of Alaska Anchorage X XARIZONA
Arizona Western College X XCentral Arizona College X XCochise College X XEstrella Mountain Community College X XGateWay Community College X XGlendale Community College X XPhoenix College X XPima Community College X XSouth Mountain Community College X XNorthland Pioneer College X XDine College X XTohono O’odham Community College X XARKANSAS
University of Arkansas Pine Bluff X XArkansas Northeastern College X X
Appendix B: Complete List of Public Minority-Serving Institutions by State1
1 List of public MSIs was compiled based on listings found at the following sources (National Center for Education Statistics, 2014; Center for Minority-Serving Institutions, 2013; Hispanic Association of Colleges and Universities, 2012; Li & Carroll, 2007)

PERFORMANCE FUNDING AT MSIs 29
INSTITUTION NAME AANAPISI HSI HBCU TCU NASNTI ANNH PBI 2YR 4YREast Arkansas Community College X XMid-South Community College X XPhilips Community College of the University of Arkansas
X X
Pulaski Technical College X XSouth Arkansas Community College X XSoutheast Arkansas College X XSouthern Arkansas University Main Campus X XSouthern Arkansas University Tech X XUniversity of Arkansas at Little Rock X XUniversity of Arkansas at Monticello X XUniversity of Arkansas Community College-Hope X XCALIFORNIA
American River College X XBerkeley City College X XCalifornia State University-East Bay X XCalifornia State University-Sacramento X XCity College of San Francisco X XCoastline Community College X XCollege of Alameda X XCollege of San Mateo X XCosumnes River College X XCypress College X XDe Anza College X XFoothill College X XGolden West College X XIrvine Valley College X XLaney College X XSan Jose State University X XSolano Community College X XUniversity of California-Berkeley X XUniversity of California-Davis X XUniversity of California-Irvine X XUniversity of California-Los Angeles X XUniversity of California-San Diego X XUniversity of California-San Francisco X XWest Valley College X XMission College X XOhlone College X XOrange Coast College X XSan Diego Mirmar College X XSan Francisco State University X XCalifornia State Polytechnic University-Pomona X X XCalifornia State University Dominguez Hills X X X

30 SOUTHERNEDUCATION.ORG
INSTITUTION NAME AANAPISI HSI HBCU TCU NASNTI ANNH PBI 2YR 4YRCalifornia State University-Fresno X X XCalifornia State University-Fullerton X X XCalifornia State University-Long Beach X X XCalifornia State University-Los Angeles X X XCalifornia State University-Northridge X X XCalifornia State University-San Marcos X X XCalifornia State University-Stanislaus X X XCanada College X X XCerritos College X X XChabot College X X XContra Costa College X X XEast Los Angeles College X X XEvergreen Valley College X X XFresno City College X X XGlendale Community College X X XSan Jose City College X X XSanta Monica College X X XSkyline College X X XSouthwestern College X X XUniversity of California-Merced X X XUniversity of California-Riverside X X XYuba College X X XLong Beach City College X X XLos Angeles City College X X XLos Angeles County College of Nursing and Allied Health
X X X
Los Angeles Harbor College X X XLos Angeles Pierce College X X XLos Medanos College X X XMerced College X X XMonterey Peninsula College X X XMt. San Antonio College X X XNapa Valley College X X XPasadena City College X X XSacramento City College X X XSan Diego City College X X XSan Diego Mesa College X X XSan Joaquin Delta College X X XEl Camino College X X X XMerritt College X X XAllan Hancock College X XAntelope Valley College X XBakersfield College X XBarstow College X X

PERFORMANCE FUNDING AT MSIs 31
INSTITUTION NAME AANAPISI HSI HBCU TCU NASNTI ANNH PBI 2YR 4YRCabrillo College X XCalifornia State University-Bakersfield X XCalifornia State University-Channel Islands X XCalifornia State University-Monterey Bay X XCalifornia State University-San Bernardino X XCerro Coso Community College X XChaffey College X XCitrus College X XCollege of the Canyons X XCollege of the Desert X XCollege of the Sequoias X XCrafton Hills College X XCuesta College X XCuyamaca College X XCypress College X XEast San Gabriel Valley Regional Occupational Program
X X
Fullerton College X XGavilan College X XGrossmont College X XHartnell College X XImperial Valley College X XLas Positas College X XLos Angeles Mission College X XLos Angeles Trade Technical College X XLos Angeles Valley College X XMendocino College X XMiraCosta College X XModesto Junior College X XMoorpark College X XMoreno Valley College X XMt. San Jacinto Community College District X XNorco College X XOxnard College X XPalo Verde College X XPalomar College X XPorterville College X XReedley College X XRio Hondo College X XRiverside City College X XSan Bernardino Valley College X XSan Diego State University X XSan Diego State University-Imperial Valley Campus X XSanta Ana College X X
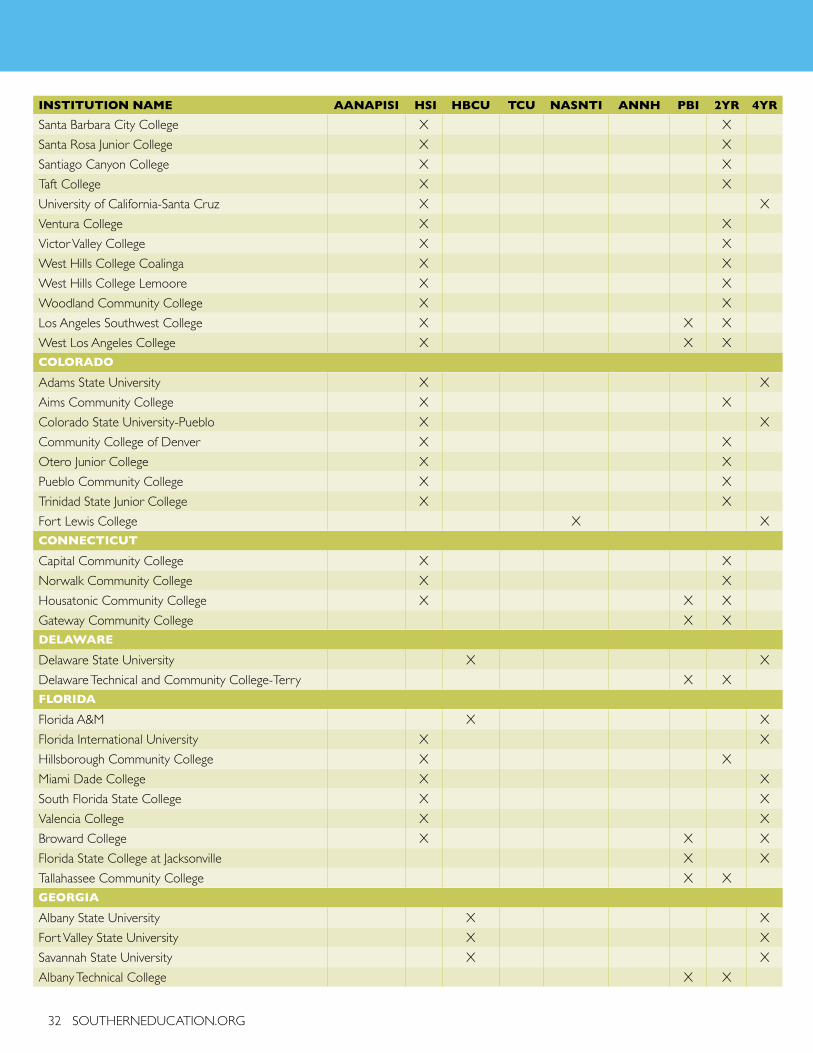
32 SOUTHERNEDUCATION.ORG
INSTITUTION NAME AANAPISI HSI HBCU TCU NASNTI ANNH PBI 2YR 4YRSanta Barbara City College X XSanta Rosa Junior College X XSantiago Canyon College X XTaft College X XUniversity of California-Santa Cruz X XVentura College X XVictor Valley College X XWest Hills College Coalinga X XWest Hills College Lemoore X XWoodland Community College X XLos Angeles Southwest College X X XWest Los Angeles College X X XCOLORADO
Adams State University X XAims Community College X XColorado State University-Pueblo X XCommunity College of Denver X XOtero Junior College X XPueblo Community College X XTrinidad State Junior College X XFort Lewis College X XCONNECTICUT
Capital Community College X XNorwalk Community College X XHousatonic Community College X X XGateway Community College X XDELAWARE
Delaware State University X XDelaware Technical and Community College-Terry X XFLORIDA
Florida A&M X XFlorida International University X XHillsborough Community College X XMiami Dade College X XSouth Florida State College X XValencia College X XBroward College X X XFlorida State College at Jacksonville X XTallahassee Community College X XGEORGIA
Albany State University X XFort Valley State University X XSavannah State University X XAlbany Technical College X X
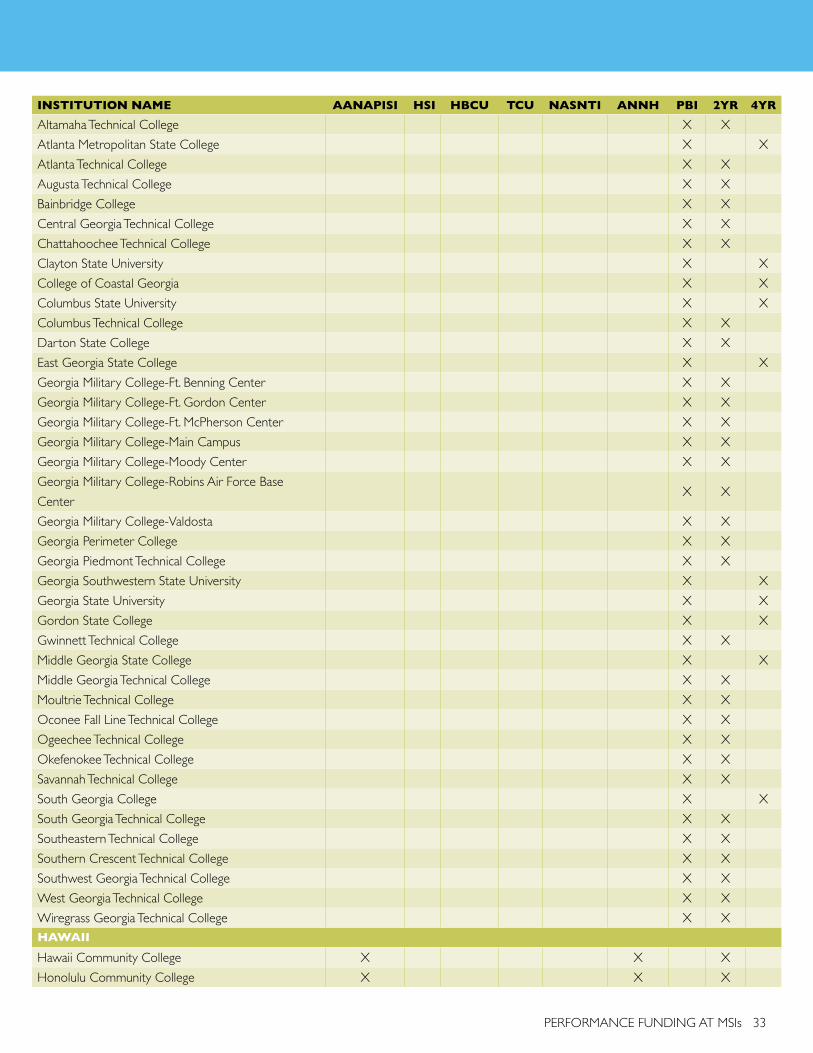
PERFORMANCE FUNDING AT MSIs 33
INSTITUTION NAME AANAPISI HSI HBCU TCU NASNTI ANNH PBI 2YR 4YRAltamaha Technical College X XAtlanta Metropolitan State College X XAtlanta Technical College X XAugusta Technical College X XBainbridge College X XCentral Georgia Technical College X XChattahoochee Technical College X XClayton State University X XCollege of Coastal Georgia X XColumbus State University X XColumbus Technical College X XDarton State College X XEast Georgia State College X XGeorgia Military College-Ft. Benning Center X XGeorgia Military College-Ft. Gordon Center X XGeorgia Military College-Ft. McPherson Center X XGeorgia Military College-Main Campus X XGeorgia Military College-Moody Center X XGeorgia Military College-Robins Air Force Base Center
X X
Georgia Military College-Valdosta X XGeorgia Perimeter College X XGeorgia Piedmont Technical College X XGeorgia Southwestern State University X XGeorgia State University X XGordon State College X XGwinnett Technical College X XMiddle Georgia State College X XMiddle Georgia Technical College X XMoultrie Technical College X XOconee Fall Line Technical College X XOgeechee Technical College X XOkefenokee Technical College X XSavannah Technical College X XSouth Georgia College X XSouth Georgia Technical College X XSoutheastern Technical College X XSouthern Crescent Technical College X XSouthwest Georgia Technical College X XWest Georgia Technical College X XWiregrass Georgia Technical College X XHAWAII
Hawaii Community College X X XHonolulu Community College X X X
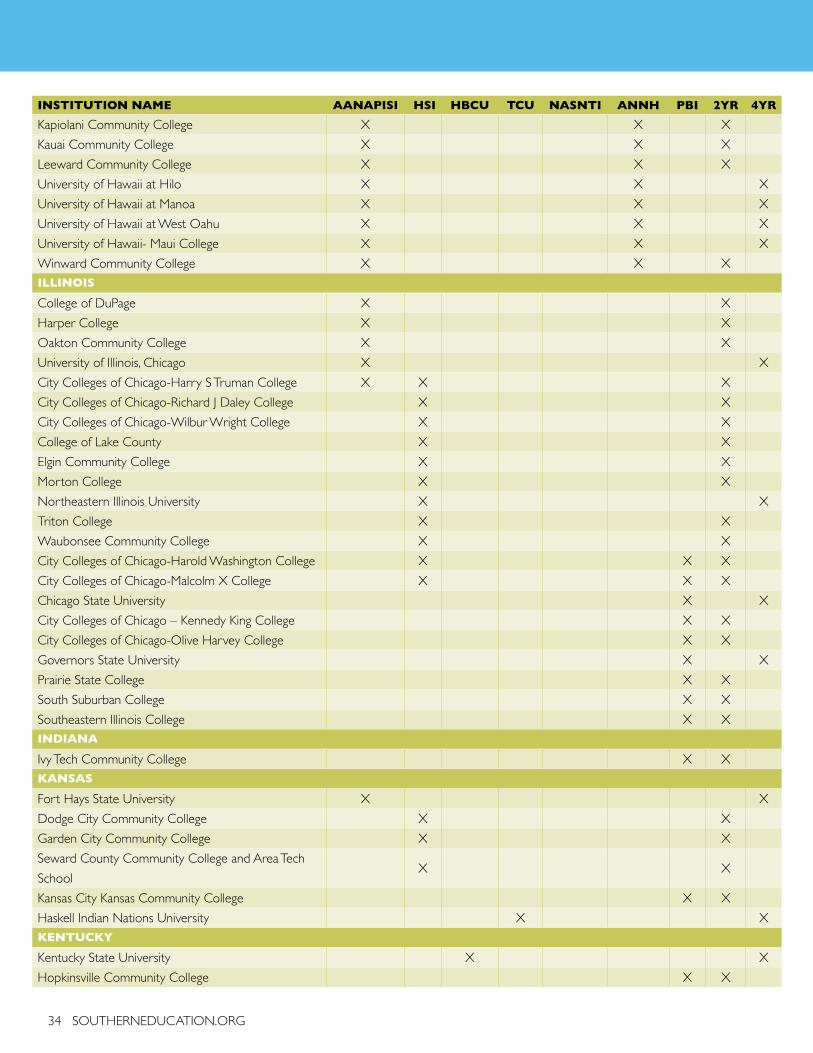
34 SOUTHERNEDUCATION.ORG
INSTITUTION NAME AANAPISI HSI HBCU TCU NASNTI ANNH PBI 2YR 4YRKapiolani Community College X X XKauai Community College X X XLeeward Community College X X XUniversity of Hawaii at Hilo X X XUniversity of Hawaii at Manoa X X XUniversity of Hawaii at West Oahu X X XUniversity of Hawaii- Maui College X X XWinward Community College X X XILLINOIS
College of DuPage X XHarper College X XOakton Community College X XUniversity of Illinois, Chicago X XCity Colleges of Chicago-Harry S Truman College X X XCity Colleges of Chicago-Richard J Daley College X XCity Colleges of Chicago-Wilbur Wright College X XCollege of Lake County X XElgin Community College X XMorton College X XNortheastern Illinois University X XTriton College X XWaubonsee Community College X XCity Colleges of Chicago-Harold Washington College X X XCity Colleges of Chicago-Malcolm X College X X XChicago State University X XCity Colleges of Chicago – Kennedy King College X XCity Colleges of Chicago-Olive Harvey College X XGovernors State University X XPrairie State College X XSouth Suburban College X XSoutheastern Illinois College X XINDIANA
Ivy Tech Community College X XKANSAS
Fort Hays State University X XDodge City Community College X XGarden City Community College X XSeward County Community College and Area Tech School
X X
Kansas City Kansas Community College X XHaskell Indian Nations University X XKENTUCKY
Kentucky State University X XHopkinsville Community College X X
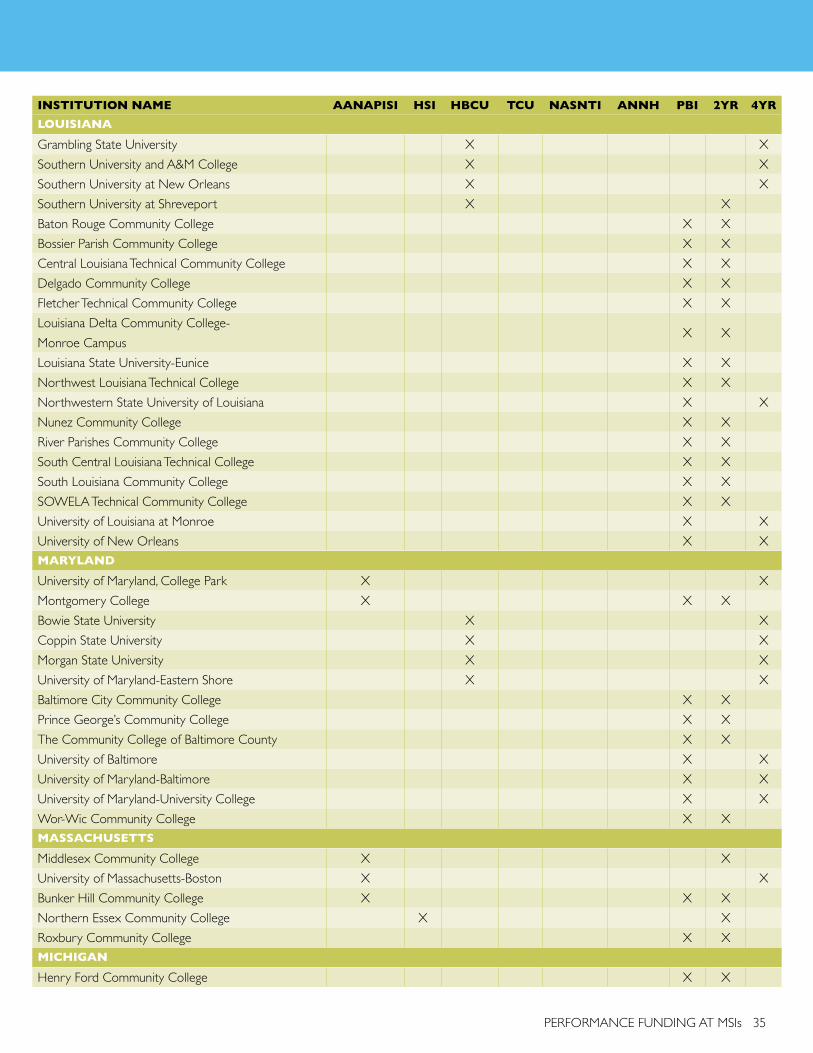
PERFORMANCE FUNDING AT MSIs 35
INSTITUTION NAME AANAPISI HSI HBCU TCU NASNTI ANNH PBI 2YR 4YRLOUISIANA
Grambling State University X XSouthern University and A&M College X XSouthern University at New Orleans X XSouthern University at Shreveport X XBaton Rouge Community College X XBossier Parish Community College X XCentral Louisiana Technical Community College X XDelgado Community College X XFletcher Technical Community College X XLouisiana Delta Community College- Monroe Campus
X X
Louisiana State University-Eunice X XNorthwest Louisiana Technical College X XNorthwestern State University of Louisiana X XNunez Community College X XRiver Parishes Community College X XSouth Central Louisiana Technical College X XSouth Louisiana Community College X XSOWELA Technical Community College X XUniversity of Louisiana at Monroe X XUniversity of New Orleans X XMARYLAND
University of Maryland, College Park X XMontgomery College X X XBowie State University X XCoppin State University X XMorgan State University X XUniversity of Maryland-Eastern Shore X XBaltimore City Community College X XPrince George’s Community College X XThe Community College of Baltimore County X XUniversity of Baltimore X XUniversity of Maryland-Baltimore X XUniversity of Maryland-University College X XWor-Wic Community College X XMASSACHUSETTS
Middlesex Community College X XUniversity of Massachusetts-Boston X XBunker Hill Community College X X XNorthern Essex Community College X XRoxbury Community College X XMICHIGAN
Henry Ford Community College X X

36 SOUTHERNEDUCATION.ORG
INSTITUTION NAME AANAPISI HSI HBCU TCU NASNTI ANNH PBI 2YR 4YRWayne County Community College District X XWayne State University X XBay Mills Community College X XKeweenaw Bay Ojibwa Community College X XSaginaw Chippewa Tribal College X XMINNESOTA
Century College X XNorth Hennepin Community College X XMinneapolis Community and Technical College X XFond du Lac Tribal & Community College X XLeech Lake Tribal College X XMISSISSIPPI
Alcorn State University X XCoahoma Community College X XHinds Community College-Utica X XJackson State University X XMississippi Valley State University X XCopiah-Lincoln Community College X XDelta State University X XEast Central Community College X XEast Mississippi Community College X XHinds Community College X XHolmes Community College X XItawamba Community College X XJones County Junior College X XMeridian Community College X XMississippi Delta Community College X XMississippi University for Women X XNorthwest Mississippi Community College X XSouthwest Mississippi Community College X XMISSOURI
Harris-Stowe State University X XLincoln University X XMetropolitan Community College-Penn Valley X XSt. Louis Community College-Florissant Valley X XSt. Louis Community College-Forest Park X XMONTANA
Aaniiih nokoda College (formerly Fort Belknap) X XChief Dull Knife College X XFort Peck Community College X XLittle Big Horn College X XStone Child College X XNEBRASKA
Nebraska Indian Community College X X

PERFORMANCE FUNDING AT MSIs 37
INSTITUTION NAME AANAPISI HSI HBCU TCU NASNTI ANNH PBI 2YR 4YRNEVADA
Nevada State College X XUniversity of Nevada- Las Vegas X XCollege of Southern Nevada X X XNEW JERSEY
Middlesex County College X XNew Jersey Institute of Technology X XRutgers University-Newark X XBergen Community College X XCumberland County College X XHudson County Community College X XNew Jersey City University X XPassaic County Community College X XUnion County College X XEssex County College X X XMercer County Community College X XNEW MEXICO
Central New Mexico Community College X XClovis Community College X XEastern New Mexico University-Main Campus X XEastern New Mexico University-Roswell X XEastern New Mexico University-Ruidoso X XLuna Community College X XMesalands Community College X XNew Mexico Highlands University X XNew Mexico Institute of Mining and Technology X XNew Mexico Junior College X XNew Mexico State University-Alamogordo X XNew Mexico State University-Carlsbad X XNew Mexico State University-Dona Ana X XNew Mexico State University-Main Campus X XNorthern New Mexico College X XSanta Fe Community College X XUniversity of New Mexico- Main Campus X XUniversity of New Mexico-Los Alamos X XUniversity of New Mexico-Taos Branch X XUniversity of New Mexico-Valencia County Branch X XWestern New Mexico University X XSan Juan College X XUniversity of New Mexico-Gallup X XNew Mexico State University-Grants X X XInstitute of American Indian Arts X XNavajo Technical College X XSouthwestern Indian Polytechnic Institute X X
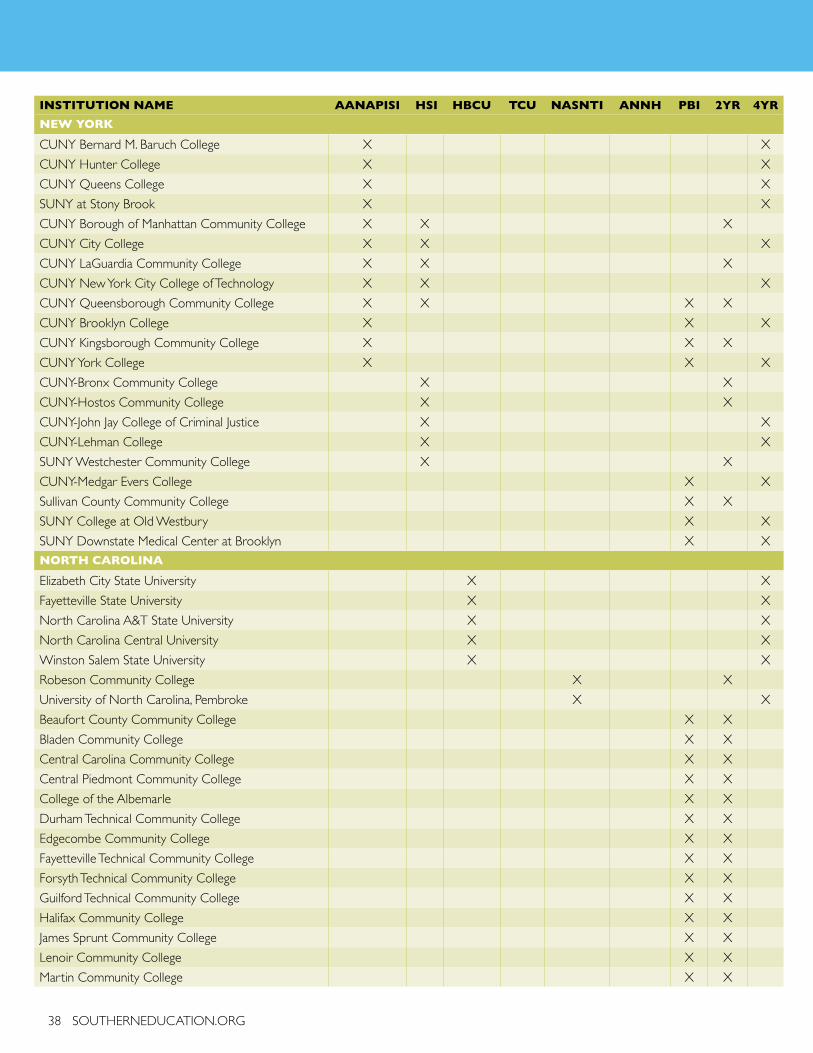
38 SOUTHERNEDUCATION.ORG
INSTITUTION NAME AANAPISI HSI HBCU TCU NASNTI ANNH PBI 2YR 4YRNEW YORK
CUNY Bernard M. Baruch College X XCUNY Hunter College X XCUNY Queens College X XSUNY at Stony Brook X XCUNY Borough of Manhattan Community College X X XCUNY City College X X XCUNY LaGuardia Community College X X XCUNY New York City College of Technology X X XCUNY Queensborough Community College X X X XCUNY Brooklyn College X X XCUNY Kingsborough Community College X X XCUNY York College X X XCUNY-Bronx Community College X XCUNY-Hostos Community College X XCUNY-John Jay College of Criminal Justice X XCUNY-Lehman College X XSUNY Westchester Community College X XCUNY-Medgar Evers College X XSullivan County Community College X XSUNY College at Old Westbury X XSUNY Downstate Medical Center at Brooklyn X XNORTH CAROLINA
Elizabeth City State University X XFayetteville State University X XNorth Carolina A&T State University X XNorth Carolina Central University X XWinston Salem State University X XRobeson Community College X XUniversity of North Carolina, Pembroke X XBeaufort County Community College X XBladen Community College X XCentral Carolina Community College X XCentral Piedmont Community College X XCollege of the Albemarle X XDurham Technical Community College X XEdgecombe Community College X XFayetteville Technical Community College X XForsyth Technical Community College X XGuilford Technical Community College X XHalifax Community College X XJames Sprunt Community College X XLenoir Community College X XMartin Community College X X

PERFORMANCE FUNDING AT MSIs 39
INSTITUTION NAME AANAPISI HSI HBCU TCU NASNTI ANNH PBI 2YR 4YRNash Community College X XPamlico Community College X XPiedmont Community College X XPitt Community College X XRichmond Community College X XRoanoke-Chowan Community College X XSampson Community College X XSandhills Community College X XSouth Piedmont Community College X XSoutheastern Community College X XVance-Granville Community College X XWayne Community College X XWilson Community College X XCankdeska Cikana Community College X XFort Berthold Community College X XSitting Bull College X XOHIO
Central State University X XCincinnati State Technical and Community College X XCuyahoga Community College District X XOKLAHOMA
Langston University X XCarl Albert State College X XEast Central University X XEastern Oklahoma State College X XMurray State College X XNortheastern Oklahoma A&M College X XNortheastern State University X XRedlands Community College X XRogers State University X XSeminole State College X XSoutheastern Oklahoma State University X XCollege of the Muscogee Nation X XComanche Nation College X XOREGON
Chemeketa Community College X XPENNSYLVANIA
Cheyney University of Pennsylvania X XLincoln University X XCommunity College of Philadelphia X XSOUTH CAROLINA
Aiken Technical College X XCentral Carolina Technical College X XFlorence-Darlington Technical College X X
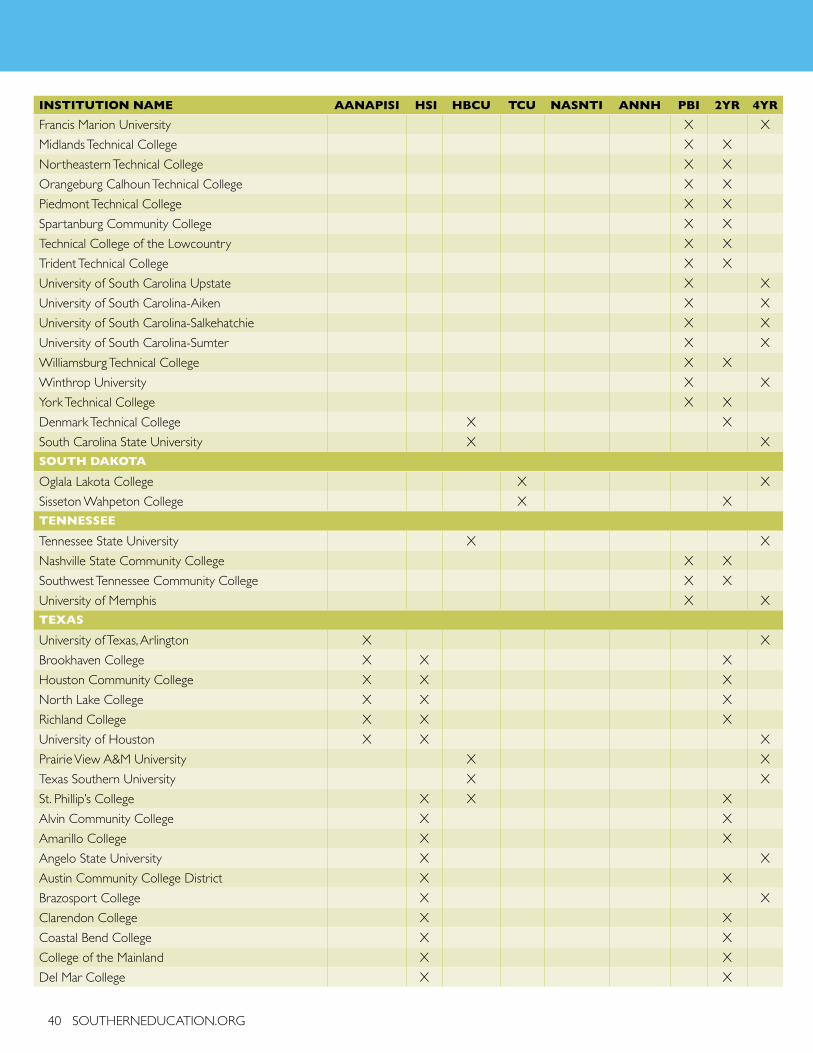
40 SOUTHERNEDUCATION.ORG
INSTITUTION NAME AANAPISI HSI HBCU TCU NASNTI ANNH PBI 2YR 4YRFrancis Marion University X XMidlands Technical College X XNortheastern Technical College X XOrangeburg Calhoun Technical College X XPiedmont Technical College X XSpartanburg Community College X XTechnical College of the Lowcountry X XTrident Technical College X XUniversity of South Carolina Upstate X XUniversity of South Carolina-Aiken X XUniversity of South Carolina-Salkehatchie X XUniversity of South Carolina-Sumter X XWilliamsburg Technical College X XWinthrop University X XYork Technical College X XDenmark Technical College X XSouth Carolina State University X XSOUTH DAKOTA
Oglala Lakota College X XSisseton Wahpeton College X XTENNESSEE
Tennessee State University X XNashville State Community College X XSouthwest Tennessee Community College X XUniversity of Memphis X XTEXAS
University of Texas, Arlington X XBrookhaven College X X XHouston Community College X X XNorth Lake College X X XRichland College X X XUniversity of Houston X X XPrairie View A&M University X XTexas Southern University X XSt. Phillip’s College X X XAlvin Community College X XAmarillo College X XAngelo State University X XAustin Community College District X XBrazosport College X XClarendon College X XCoastal Bend College X XCollege of the Mainland X XDel Mar College X X
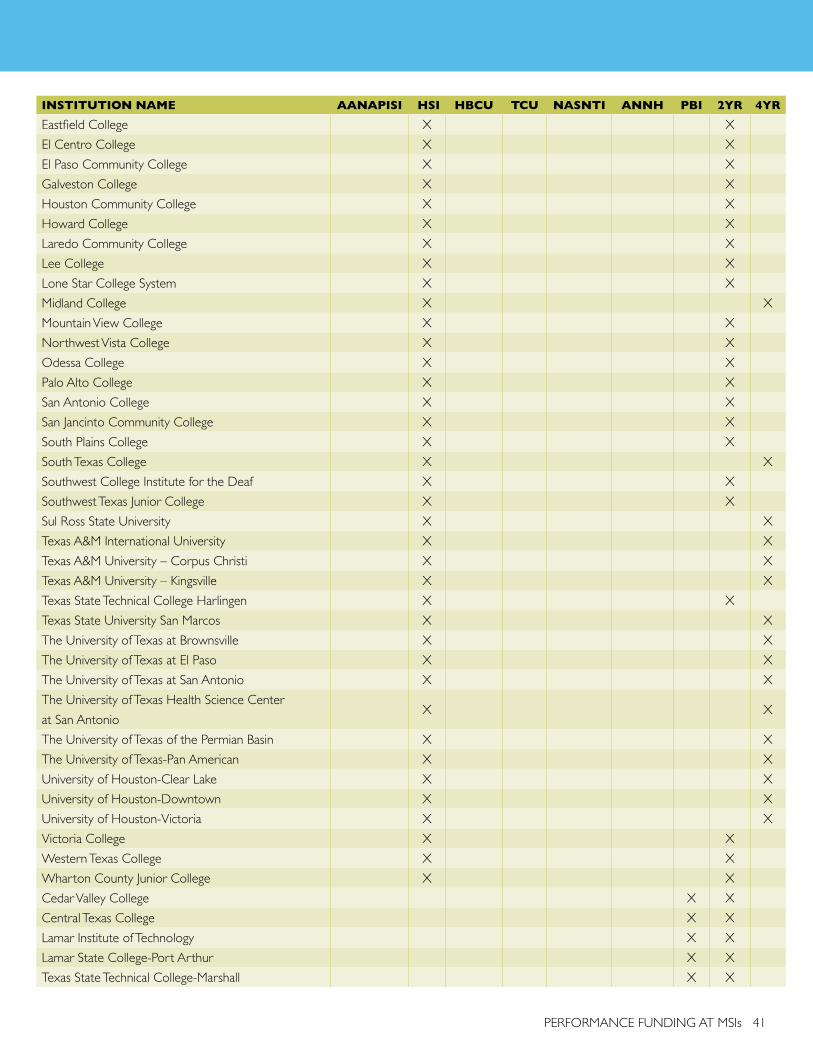
PERFORMANCE FUNDING AT MSIs 41
INSTITUTION NAME AANAPISI HSI HBCU TCU NASNTI ANNH PBI 2YR 4YREastfield College X XEl Centro College X XEl Paso Community College X XGalveston College X XHouston Community College X XHoward College X XLaredo Community College X XLee College X XLone Star College System X XMidland College X XMountain View College X XNorthwest Vista College X XOdessa College X XPalo Alto College X XSan Antonio College X XSan Jancinto Community College X XSouth Plains College X XSouth Texas College X XSouthwest College Institute for the Deaf X XSouthwest Texas Junior College X XSul Ross State University X XTexas A&M International University X XTexas A&M University – Corpus Christi X XTexas A&M University – Kingsville X XTexas State Technical College Harlingen X XTexas State University San Marcos X XThe University of Texas at Brownsville X XThe University of Texas at El Paso X XThe University of Texas at San Antonio X XThe University of Texas Health Science Center at San Antonio
X X
The University of Texas of the Permian Basin X XThe University of Texas-Pan American X XUniversity of Houston-Clear Lake X XUniversity of Houston-Downtown X XUniversity of Houston-Victoria X XVictoria College X XWestern Texas College X XWharton County Junior College X XCedar Valley College X XCentral Texas College X XLamar Institute of Technology X XLamar State College-Port Arthur X XTexas State Technical College-Marshall X X
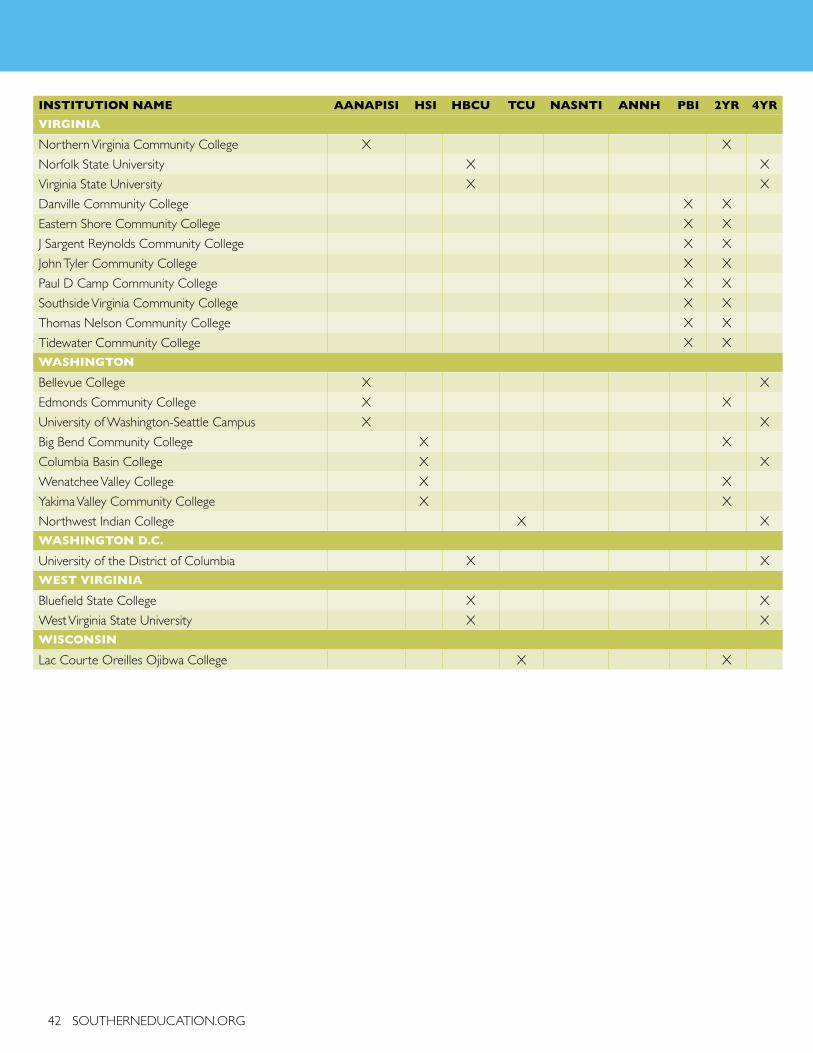
42 SOUTHERNEDUCATION.ORG
INSTITUTION NAME AANAPISI HSI HBCU TCU NASNTI ANNH PBI 2YR 4YRVIRGINIA
Northern Virginia Community College X XNorfolk State University X XVirginia State University X XDanville Community College X XEastern Shore Community College X XJ Sargent Reynolds Community College X XJohn Tyler Community College X XPaul D Camp Community College X XSouthside Virginia Community College X XThomas Nelson Community College X XTidewater Community College X XWASHINGTON
Bellevue College X XEdmonds Community College X XUniversity of Washington-Seattle Campus X XBig Bend Community College X XColumbia Basin College X XWenatchee Valley College X XYakima Valley Community College X XNorthwest Indian College X XWASHINGTON D.C.
University of the District of Columbia X XWEST VIRGINIA
Bluefield State College X XWest Virginia State University X XWISCONSIN
Lac Courte Oreilles Ojibwa College X X

PERFORMANCE FUNDING AT MSIs 43
Alabama
Alaska
Arizona
Arkansas
California
Colorado
Connecticut
Delaware
Florida
Georgia
Hawaii
Illinois
Indiana
Kansas
Kentuky
Lousiana
Maryland
Massachusetts
Michigan
Minnesota
Mississippi
Missouri
Montana
Nebraska
Nevada
New Jersey
New Mexico
New York
North Carolina
North Dakota
Ohio
Oklahoma
Oregon
Pennsylvania
South Carolina
South Dakota
Tennessee
Texas
Virginia
Washington
West Virginia
0 10 20 30 40 50 60 70 80 90 100
% of Public Colleges and Universities that are Public MSIs
% of Students of Color in Public Higher Education Enrolled in Public MSIs
744
2213
56
1429
2353
5370
8 46
1730
5964
3 15
1523
58
316
45 56
18 61
97100
26 44
3025
71
43 75
1235
13 24
7577
12 24
537
1822
89
5766
4374
100100
6163
3361
2 50
4859
8397
4443
37 5372 89
2523
4037
1235
TABLE 1.2 STUDENTS OF COLOR ENROLLMENT AT PUBLIC MSIs
Appendix C: Student of Color Enrollment at Public Minority-Serving Institutions

PERFORMANCE FUNDING AT MSIs 45
Founded in 1867 as the George Peabody Education Fund, the Southern Education Foundation’s mission is to advance equity and excellence in education for all students in the South, particularly low income students and students of color. SEF uses collaboration, advocacy, and research to improve outcomes from early childhood to adulthood. Our
core belief is that education is the vehicle by which all students get fair chances to develop their talents and contribute to the common good.
Southern Education Foundation
135 Auburn Avenue, N.E., Second Floor
Atlanta, Georgia 30303
WWW.SOUTHERNEDUCATION.ORG
