performance improvement of a household refrigerator · pdf fileperformance improvement of a...
TRANSCRIPT

International Journal of Scientific & Engineering Research, Volume 7, Issue 3, March-2016 58 ISSN 2229-5518
IJSER © 2016 http://www.ijser.org
Performance Improvement of a Household Refrigerator by Use of a Phase Change Material
Arun Kappen, Titto John George,Vinay VN
Department of Mechanical Engineering, Muthoot Institute of Technology and Science, Kerala
Abstract- This work aims to improve the performance of a household refrigerator by increasing its compressor cutoff time and thereby minimizing the electrical energy used. A PCM is introduced inside the evaporator of the refrigerator inorder to attain this aimThe PCM used in this experimental study is water and different quantities of water are tried along with different encapsulations inorder to findout the maximum performance characteristics.
Index Terms- Phase change materials, efficiency improvement, refrigerator performance
——————————————————
1.INTRODUCTION
One of the most revolutionary and influential invention in the history of science was that of “electricity”. This single invention is the base for the vast and unimaginable growth in scientific and technological field that we see today. At the same time when this became an inseparable part of our lives, world now is facing an acute “energy crisis”. So, an alternate source of energy must be invented. Another way is to use the available amount of energy in a better way, wisely. Increasing the efficiency of equipment’s is the solution. One of the most common types of machines that is used in a household is a refrigerator. Studies show that about 1/4th of the energy consumption in a house come from the refrigerator. It also accounts to about 1/6th of the greenhouse gas emissions. Hence improving the efficiency of a refrigerator should be given prime consideration. The efficiency of a refrigerator can be improved by improving efficiency of compressors, heat exchangers and cabinet & door insulation.
Using a latent heat cold storage or a Phase Change Material (PCM), as will be discussed in this paper belongs
to the third category. Latent heat storage using phase change materials (PCMs) is one of the most efficientmethods to store thermal energy.
*Arun Kappen, Titto John George,Vinay VN Department of Mechanical Engineering,
Muthoot Institute of Technology and Science, Kerala
Also, its initial cost is less compared to the other two alternatives. Therefore, PCMs have been applied to increase thermal energy storage capacity of different systems. The use of PCM provides higher heat storage capacity and more isothermal behavior during charging (melting) and discharging(freezing) compared to sensible heat storage. In the application of PCM, the solid–liquid phase change is used to store large quantity of energy. The substances used can be organic such as paraffin and fatty acids, or inorganic such as aqueous salts solution. There are different applications of PCM such as domestic hot water tanks, space heating and cooling of buildings, peak load shifting, solar energy applications and seasonal storage etc. Nowadays, even textiles (smart textiles) contain PCMs inorder to maintain the body temperature within the required limits and thereby providing more comfort. This paper presents the possibilities of increasing the efficiency of a household refrigerator by the use of a Phase Change Material without modifying the design of existing refrigerator. There are a lot of studies conducted to enhance refrigerator performance with modifying the design, but none without modifying the refrigerator. Even though PCMs have been used in the performance improvement most of these studies were carried out by modifying the design of the evaporator. Our aim is to achieve the same results, without much modification. 1.1 Phase Change Materials
IJSER

International Journal of Scientific & Engineering Research, Volume 7, Issue 3, March-2016 59 ISSN 2229-5518
IJSER © 2016 http://www.ijser.org
A phase-change material (PCM) is a substance with a high heat of fusion which, melting and solidifying at a certain temperature, is capable of storing and releasing large amounts of energy. Heat is absorbed or released when the material changes from solid to liquid and vice versa; thus, PCMs are classified as latent heat storage (LHS) units Phase Change Materials (PCMs) are ideal products for thermal management solutions. This is because they store and release thermal energy during the process of melting & freezing (changing from one phase to another). When such a material freezes, it releases large amounts of energy in the form of latent heat of fusion, or energy of crystallization. Conversely, when the material is melted, an equal amount of energy is absorbed from the immediate environment as it changes from solid to liquid.
This property of PCMs can be used in a number of ways, such as thermal energy storage whereby heat or coolness can be stored from one process or period in time, and used at a later date or different location. PCMs are also very useful in providing thermal barriers or insulation, for example in temperature controlled transport. 1.2 How Energy is Saved by Using PCM? PCM will solidify taking cooling load from the refrigerant, thereby cold energy of the refrigerant is given to PCM. Now the PCM will slowly liquify, giving away its latent heat energy to the load inside the refrigerator. Thus the liquefaction process of PCM will take place slowly and solidification process rapidly. Here heat energy is not conserved but electrical energy is, due to the increased compressor cut off time, which in turn is due to the isothermal behaviour of PCM.
2. PREVIOUS STUDIES Use of Phase change material (PCM) for the latent
heat storage in household refrigerators is one of the upcoming technologies in the field of refrigeration.
A phase-change material (PCM) is a substance with a high heat of fusion which, melting and solidifying at a certain temperature, is capable of storing and releasing large amounts of energy. Heat is absorbed or released when the material changes from solid to liquid and vice versa; thus, PCMs are classified as latent heat storage (LHS) units.
The survey of literatures regarding the use of Phase change materials in household refrigerators are listed below.
K.Azzouz, D.Leducq, D.Gobin (2007)presented a dynamic model of vapour compression refrigeration system using Phase change material as latent heat storage medium. This
paper studies the effect of adding a phase change material (PCM) slab on the outsideface of a refrigerator evaporator. A dynamic model of the vapour compression cycle includingthe presence of the phase change material and its experimental validation was presented. The simulation results of the system with PCM show that the addition of thermal inertiaglobally enhances heat transfer from the evaporator and allows a higher evaporatingtemperature, which increases the energy efficiency of the system. The energy stored in the PCM is yielded to the refrigerator cell during the off cycle and allows for several hoursof continuous operation without power supply. K.Azzouz, D.Leducq, D.Gobin (2010)presented a paper that shows the results of experimental tests carried out to investigate the performance of a house hold refrigerator using a Phase change material(PCM).ThePCM is located on the back side of the evaporator in order to improve its efficiency and to provide a storage capacity allowing several hours of refrigeration without power supply. The system has been tested with water and eutectic mixture (freezing point -30c) and for various operating conditions (PCM thickness, ambient temperature, and thermal loads). A 10-30% increase in COP depending on the thermal load is observed, and 5-8 hrs of continuous operation without power supply.
3.EXPERIMENTAL PROCEDURE Experimental set-up: The original experimental device is a single-door double compartment refrigerator with the following characteristics: Refrigerator Used: 190L Kelvinator Refrigerator with R134a having mass of 140g. Compressor power was 1/8HP, Aircooled condenser of length 11m and capillary tube of 0.036inch as expansion device. Measuring Devices: As the measurement of variables affect the test results, care is taken to choose the best instrument at our premises. Thermocouple: The temperature at various points of the system is measured using thermocouples. The thermocouples used are Chromel-Alumel (known as K type thermocouples). The thermocouple tip is attached on various points of the copper refrigerant lines to note down the respective temperature. Pressure Gauge: The pressure gauges used in this rig are of Bourdon tube type pressure gauges. Using copper tubes, tapings are taken from various points and the gauges are fixed on the panel board. For the high-pressure side, gauge with maximum pressure of 55Kg/cm2is used and at low-pressure side, gauge with maximum pressure of 17.5Kg/ cm2 is used.
IJSER

International Journal of Scientific & Engineering Research, Volume 7, Issue 3, March-2016 60 ISSN 2229-5518
IJSER © 2016 http://www.ijser.org
Digital Energy meter: In the experimental setup single phase digital energy meter is used for measuring the power input to the compressor. 3.1 Experimental Procedure: The performance of the refrigerator under no load and without PCM is noted first. Then the performance characteristics of the refrigerator without PCM and at a load of 40 W is tested then. Temperature limits are set between -15 0C and 3 0C of the freezer(evaporator). This is the usual temperature limit as this ensures the preservation of perishables inside freezer. After completing these tests, keeping those readings as the basis the refrigerator is tested with PCM at different conditions (varying loads, varying quantity of PCM etc.) Since our prime aim was not to modify the existing refrigerator, PCM was inserted inside the evaporator chamber. Here, we are assuming that the conduction losses through evaporator walls is negligible. Figure 1 shows the kind of PCM material arrangement done in the literature surveys by making contact with the outer surface of the evaporator. But this means rearranging the design and modification of the refrigerator and this needed more time and tedious work. So, as already said we go for the simple method of introducing the PCM material inside the evaporator in a carriage bag separately.
Fig.1 Schematic diagram of the experimental set up shown in literature
4. RESULTS AND DISCUSSION The experiments were conducted on the above mentioned refrigerator in the following order.
At No Load condition without PCM At Load condition (40 W) without PCM
Temperatures at different points and the corresponding pressures were noted for each case. Thus, we will be able to calculate COP’s at different points. Required graphs were plotted for comparison purposes. Now, keeping the
values obtained in the above conditions as reference or base, we will be continuing the tests with,
Different quantities of PCM at no load Different enclosures for PCM at no load Different quantities of PCM at load (40 W) Different enclosures for PCM at load (40 W)
(a) (b)
(c) Fig. 2 Experimental Set up having PCM kept inside (a) plastic cover bag, (b) plastic bottles and (c) hot water bag
First of all, we selected water as the PCM and conducted tests at no-load with different quantities of PCM. Then, the optimum quantity of PCM is noted by comparing their percentage compressor on time (compressor on time / total time for one cycle). Then, rest of the calculations were done on readings taken when this optimum value of PCM was used. At the end of the section, the best option available for using as PCM in refrigerator considering the enclosures and the type of PCM materials used were found out, from among the available options. 4.1 Results on Experiments at NO Load Without Using PCM Tests were conducted on the refrigerator without any load and without using the PCM. The readings were noted down at different points for temperatures and pressures. The results obtained for testing the refrigerator with no PCM and with No-Load is shown graphically as follows Variation in Evaporator Temperature Variation in evaporator temperature as time progresses is shown graphically, as this is the value that we are controlling for compressor cut off and on.
IJSER
International Journal of Scientific & Engineering Research, Volume 7, Issue 3, March-2016 61 ISSN 2229-5518
IJSER © 2016 http://www.ijser.org
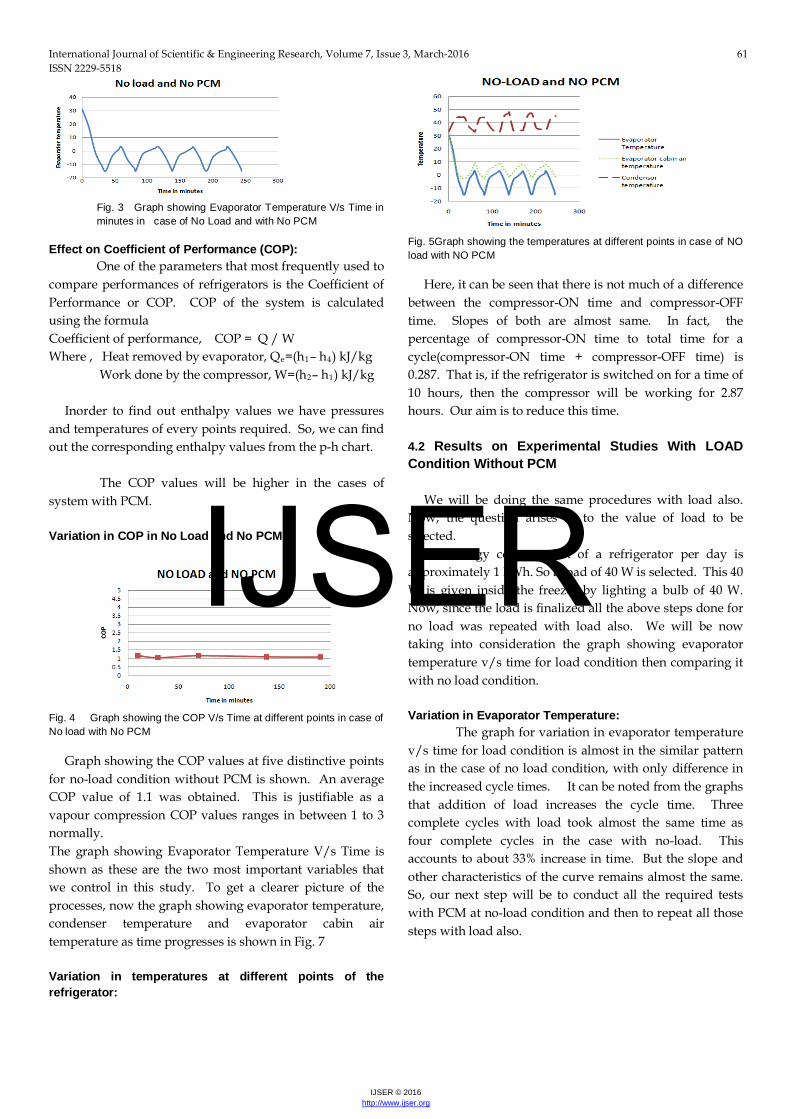
Fig. 3 Graph showing Evaporator Temperature V/s Time in minutes in case of No Load and with No PCM
Effect on Coefficient of Performance (COP): One of the parameters that most frequently used to
compare performances of refrigerators is the Coefficient of Performance or COP. COP of the system is calculated using the formula Coefficient of performance, COP = Q / W Where , Heat removed by evaporator, Qe=(h1– h4) kJ/kg Work done by the compressor, W=(h2– h1) kJ/kg Inorder to find out enthalpy values we have pressures and temperatures of every points required. So, we can find out the corresponding enthalpy values from the p-h chart.
The COP values will be higher in the cases of system with PCM.
Variation in COP in No Load and No PCM
Fig. 4 Graph showing the COP V/s Time at different points in case of No load with No PCM
Graph showing the COP values at five distinctive points for no-load condition without PCM is shown. An average COP value of 1.1 was obtained. This is justifiable as a vapour compression COP values ranges in between 1 to 3 normally. The graph showing Evaporator Temperature V/s Time is shown as these are the two most important variables that we control in this study. To get a clearer picture of the processes, now the graph showing evaporator temperature, condenser temperature and evaporator cabin air temperature as time progresses is shown in Fig. 7 Variation in temperatures at different points of the refrigerator:
Fig. 5Graph showing the temperatures at different points in case of NO load with NO PCM
Here, it can be seen that there is not much of a difference between the compressor-ON time and compressor-OFF time. Slopes of both are almost same. In fact, the percentage of compressor-ON time to total time for a cycle(compressor-ON time + compressor-OFF time) is 0.287. That is, if the refrigerator is switched on for a time of 10 hours, then the compressor will be working for 2.87 hours. Our aim is to reduce this time. 4.2 Results on Experimental Studies With LOAD Condition Without PCM We will be doing the same procedures with load also. Now, the question arises as to the value of load to be selected. Usual energy consumption of a refrigerator per day is approximately 1 kWh. So a load of 40 W is selected. This 40 W is given inside the freezer by lighting a bulb of 40 W. Now, since the load is finalized all the above steps done for no load was repeated with load also. We will be now taking into consideration the graph showing evaporator temperature v/s time for load condition then comparing it with no load condition. Variation in Evaporator Temperature: The graph for variation in evaporator temperature v/s time for load condition is almost in the similar pattern as in the case of no load condition, with only difference in the increased cycle times. It can be noted from the graphs that addition of load increases the cycle time. Three complete cycles with load took almost the same time as four complete cycles in the case with no-load. This accounts to about 33% increase in time. But the slope and other characteristics of the curve remains almost the same. So, our next step will be to conduct all the required tests with PCM at no-load condition and then to repeat all those steps with load also.
IJSER

International Journal of Scientific & Engineering Research, Volume 7, Issue 3, March-2016 62 ISSN 2229-5518
IJSER © 2016 http://www.ijser.org
Fig. 6 Graph showing the Evaporator temperature v/s Time in case of 40 W load and with NO PCM
Comparison of No load condition and With load condition without PCM:
Fig. 7 Graph showing the comparison of difference in cycle times for no load and with load case
Variation in COP with Load and Without PCM
Fig. 8 Graph showing COP v/s time in case of using 40 W load and without PCM
Here an average COP value of 1.2 was obtained. This was to be expected since the refrigerator is designed to work more efficiently with load. 4.3 Results on Experimental Studies When Using Water as PCM: As seen from many references, one of the most easily available and comparatively good-performance giving PCM is water. So, now we use water as PCM and that too in different enclosures. First of all, we will be trying a sealed plastic cover which is of size 34 cm × 25 cm. This is tried because, size of the base area of the evaporator is almost same as that of the cover and the heat transfer properties of the plastic cover is comparatively good. Different quantities of water (0.5, 1.0, 1.5, 2.0 litres) is filled inside this cover, then sealed and kept inside the freezer.
Following is the test results in brief for water as PCM when used in a sealed plastic bag for no-load. Comparison of Performance On Using different amounts of PCM:
Fig. 9 Graph showing the comparison of refrigerator performance on using different quantities of PCM
In the above figure, compressor-ON time and compressor-OFF time for three full cycles of operation is noted down (one full cycle being the time taken by the evaporator wall to show two consecutive -15 0C or 30C, in this case). The time taken for the evaporator wall to attain -15 0C in the first cycle (i.e, when operating from ambient temperature conditions) is not taken into consideration as this may give slight errors in our results. So, time taken for three cycles after this is taken and shown here in the Figure. Selection of Optimum Quantity of PCM: The optimum amount of Phase Change material to be used can be found out as follows. We have the compressor-ON time and compressor-OFF time for each cases. Find out the ratio of compressor-ON time to the total time taken for a cycle(compressor-ON time + compressor-OFF time). Let us now denote this ratio by ‘R’ from now onwards for ease. Now, the optimum amount of PCM would be that one corresponding to the lowest value of this R. A graph with quantity of PCM along the X-axis and the ratio of compressor-ON time percentage (R×100%) along Y-axis is plotted as shown. Optimum value of PCM material is the one with the least value of Y co-ordinate. Here, clearly its 1 litre of water. So, 1 litre of water is found to have the optimum effect. Now, we will be taking the readings corresponding to 1 litre of water as PCM for comparison with no PCM condition as 1 litre was found to be the optimum quantity. All other quantities of PCMs will also show similar characteristics.
IJSER

International Journal of Scientific & Engineering Research, Volume 7, Issue 3, March-2016 63 ISSN 2229-5518
IJSER © 2016 http://www.ijser.org
Fig. 10 Graph showing the selection of optimum quantity of PCM based on Percentage compressor ON time at no load
One can possibly think why two litres of water is not showing an enhanced performance compared with one litre of water as PCM? The reason will be the partial freezing of water. That is, in case of two litres of water as PCM whole amount of water is not turned to ice. Even before the complete freezing of water, evaporator temperature reaches its lower limit and compressor will be cut-OFF. This partial freezing of water is unacceptable as it will hinder the effective heat transfer properties. Variation in Evaporator Temperature when using 1 litre of water as PCM: As done in the case of no PCM condition at no load, a graph will be plotted with evaporator temperature and time in this case also.
Fig. 11 Graph showing the evaporator temperature v/s time when using 1 litre of water as PCM at No Load
Here, if we take a close look it can clearly be seen that the compressor-OFF time is having a very very small slope compared to the compressor-ON time. Or, in other words we have a relatively larger compressor cut-OFF time period for the same compressor-ON time. This was our aim to achieve and we successfully did it. Now, we can take a look at the percentage of gain by using PCM. Gain percentage = (R without PCM – R with PCM) / R without
PCM× 100% = (0.287 – 0.163) / 0.287 × 100% = 43.2% That means we are almost saving half of the compressor ON time period compared with the case where there is no PCM. We can now have a comparison of the cases with no
PCM and with the optimum amount of PCM ( i.e, with one litre of water). Comparison of temperatures at different points:
Fig. 12 Graph showing temperatures at different points in case of No Load and with No PCM
Fig. 13 Graph showing the temperatures at different points in case of using 1 litre of water as PCM at No Load
In the second figure, the evaporator cabin temperature(the middle line) is more uniform. This is because of the effect of PCM. Or, in other words, we can say that the larger length of the compressor cut-OFF line (or the more consistent temperature inside cabin) is mainly due to the uniformity of the evaporator temperature. And that can be considered as the main difference between two cases. In the first figure if we look, the evaporator temperature line is also like the cabin air temperature. Small cycles consisting almost similar compressor-ON and OFF curves. Whereas, in the second case for a small increase in compressor-ON time a large increase in compressor cut-OFF time is available. It would have been ideal, if we were able to combine the different temperature curves in one graph. But, it wouldn’t give a clear picture for comparison, as the times included are very different. Variation in COP when using 1 litre of water as PCM:
IJSER

International Journal of Scientific & Engineering Research, Volume 7, Issue 3, March-2016 64 ISSN 2229-5518
IJSER © 2016 http://www.ijser.org
Fig. 14 Graph showing the comparison of COP v/s time in case of No Load and 1 Litre of water as PCM
Here, when we used the optimum quantity of PCM (1 litre of water) for no-load condition, the COP ranges from 1.2 to 1.45 giving an average of about 1.3. This means that COP is also increased from 10 to 30% by the use of optimum amount of the PCM. Evaporator Cabin Air Temperature Distribution:
Fig. 15 Graph showing the comparison of evaporator cabin air temperature when using different quantities of PCM
As can be clearly noted, the evaporator cabin air temperature is reduced by introduction of phase change material. This is because the PCM liquefies during compressor cut-OFF time taking heat from the surroundings. Not only that, the evaporator cabin temperature will be more uniform also, as already discussed in the previous section. Allover, an isothermal behaviour can be noted by the introduction of PCM. Electrical energy consumption: Next step in the study will be to find out the advantages of using PCM in saving electrical energy. As the compressor cut-OFF time is increased considerably, there should be a clear saving in the electrical energy consumption too. Inorder to find this out, we have attached a digital wattmeter in the circuit. Figure shows the electrical energy consumption for both the cases(with 1 litre water as PCM and with no PCM).
Fig. 16 Graph showing the electrical energy consumption rate at NO load and No PCM condition
Fig. 17 Graph showing the electrical energy consumption rate at NO load condition when using 1 litre of water as PCM
The figures clearly show the advantages of using PCM in saving electrical energy. It can be noted that for 1 litre water as PCM, the amount of electrical energy used for compressor-ON time period is slightly higher. This extra energy consumption is due to the fact that additional energy will be required for freezing the whole of PCM. But, this slight increase in energy consumption is understandable because the compressor cut-OFF time period is increased considerably large enough to compensate for the small rise in electrical consumption during the compressor-ON period. Figure gives an idea about the comparison of different quantities of PCM and no PCM condition’s effect on the evaporator temperature.
Fig. 18 Graph showing the comparison of evaporator temperature v/s time when using different quantities of PCM at no load
4.3 Water in Plastic Bottles:
IJSER

International Journal of Scientific & Engineering Research, Volume 7, Issue 3, March-2016 65 ISSN 2229-5518
IJSER © 2016 http://www.ijser.org
Our aim in this study was to make commonly available materials as PCM enclosures. So, we will now be conducting the same procedures by filling water in bottles for no-load with the following results noted. Comparison of Refrigerator performance when different quantities of PCM is used:
Fig. 19 Graph showing the comparison of refrigerator performance when using different quantities of PCM inside bottle
In the above figure, compressor-ON time and compressor-OFF time for three full cycles of operation is noted down (one full cycle being the time taken by the evaporator wall to show two consecutive -15 0C or 30C, in this case). The time taken for the evaporator wall to attain -15 0C in the first cycle ( i.e, when operating from ambient temperature conditions) is not taken into consideration as this may give slight errors in our results. So, time taken for three cycles after this is taken and shown here in the Figure. Drawing a graph with quantity of PCM on the X-axis and the ratio of compressor-ON time percentage on Y-axis the following graph is obtained for both the cases. Comparison of the two envelopes used for keeping PCM
Fig. 20 Graph showing the comparison of performances of plastic cover and bottle as PCM enclosures for different cases
The orange curve represents the values for PCM in bottles and as can be clearly seen its way above the blue curve which represents the PCM kept inside sealed plastic bags. Hence, keeping water inside bottles is not much effective compared to plastic bags. But still, the
compressor-ON time percentage is reduced to a small amount. So, even if the effect is less, using water as PCM kept inside plastic bottles will increase the refrigerator performance. However, since this effect is found to be less, we will be now not considering the option of bottles for the rest of our experiments. Now, we will be doing all the above done steps in the case of a load of 40 W too. WITH LOAD AND WITH WATER AS PCM We have already took a look at the with load condition when not using the PCM. Now we will be considering the case of using PCM inside a refrigerator when there is load. As already mentioned we will be using a load of 40 W and we will be using water inside a sealed plastic cover like we did experiments in the case of no-load and noting down the results. Comparison of refrigerator performance when a different quantity of PCM is used with load:
Fig. 21 Graph showing the comparison of refrigerator performance when using different quantities of PCM at Load
In this case also, 1 litre of water used as PCM was found to be optimum. This can be clearly understood from figure 28. Here again, we will take a close look at the evaporator temperature characteristics over time and then compare it with the cases of no-load. Comparison of variation in evaporator Temperature: Comparison of the above two graphs reveals that for load condition the compressor-ON curve is less steep(meaning more compressor-ON time) and compressor cut-OFF time is reduced. Overall, the percentage compressor-ON time is increased which means refrigerator efficiency is less compared to no-load condition. But, this has to be expected as there is load and the only thing we need to consider from our point of study is whether the addition of PCM has caused any enhancement in refrigerator performance compared to the case with no PCM. The answer can be clearly understood from the next figure.
IJSER

International Journal of Scientific & Engineering Research, Volume 7, Issue 3, March-2016 66 ISSN 2229-5518
IJSER © 2016 http://www.ijser.org
Fig. 22 Graph showing evaporator temperature v/s time in case of 40 W load and with 1 litre water as PCM
Fig. 23 Graph showing the evaporator temperature v/s time in case of No Load and 1 litre water as PCM
Variation in COP:
Fig. 24 Graph showing the variation of COP in case of using 1 litre water as PCM at load condition
When 1 litre of water is used as PCM for load condition, the COP is in the range of 1.3 to 1.6 which averages to 1.47. This means an increase of COP in the range of 10 to 35%. This COP increment has to be expected due to characteristics of the PCM material. Performance comparison of refrigerator on using different amounts of PCM: So, clearly there is an increase in refrigerator performance by using PCM. The percentage of gain in compressor working time is about 24% [( 33.5-25.6)/33.5] by adding optimum amount of PCM where as this was around 43% in the case of no-load condition.
Fig. 25 Graph showing the comparison of refrigerator performance based on the percentage compressor ON time
TABLE 1 PERCENTAGE COMPRESSOR ON TIMES AT DIFFERENT QUANTITIES OF PCM AT LOAD AND AT NO-LOAD CONDITION:
Quantity of PCM in litres
Percentage Compressor On time at No-Load
Percentage compressor On time At load
No PCM 28.7 33.5
0.5 16.72 26.2
1 16.32 25.6
1.5 17.33 27.3
5. CONCLUSION Tests were conducted inorder to inspect the efficiency improvement in refrigerators due to introduction of PCM materials. Tests were done with varying quantities of water as the Phase Change Material. It was observed that 1 litre of water gave the best results.
• A notable improvement in the efficiency of the refrigerator was found out upon the addition of PCM material.
• Different kinds of PCM storage devices were also tried, out of which sealed plastic bags were found to be the most effective ones.
• Using Phase Change Materials not only increased compressor cut-OFF time, in doing so it reduced the electrical consumption of a refrigerator, made the space characteristics inside a refrigerator more isothermal and thereby providing a very good impact on the food preservation also.
Performance results and cold storage capacity measurements have been obtained and compared with the original system without storage. The results indicate that the response of the refrigerator to the addition of PCM and its efficiency are strongly dependent on the thermal load. A
IJSER
International Journal of Scientific & Engineering Research, Volume 7, Issue 3, March-2016 67 ISSN 2229-5518
IJSER © 2016 http://www.ijser.org
significant decrease in the number of starts and stops of the compressor and consequently of the temperature fluctuations inside the refrigerated cell was observed due to the use of PCM. Also an increase in COP of the system in the range of 10-30% was observed. Future research options are available in the form of testing the system with different phase change materials, refrigerants and developing computational fluid dynamics models to simulate the airflow and temperatures within the refrigerator cavity, with a PCM incorporated, and investigate the most effective position to place the PCM/evaporator assembly. REFERENCES
1. K. Azzouza, D. Leducq, D. Gobin, 2007.
Performance enhancement of a household refrigerator byaddition of latent heat storage.
2. K. Azzouza, D. Leducq, D. Gobin, 2009. Enhancing the performance of household refrigerators withlatent heat storage: An experimental investigation 3. E. Oro, A. de Gracia, A. Castell, M.M. Farid, L.F. Cabeza, 2011. Review on phase change materials (PCMs) for cold thermal energystorage applications. 4. Mohammed M. Farid, Amar M. Khudhair, Siddique Ali K. Razack, Said Al-Hallaj, 2003. A review on phase change energy storage: materialsand applications. 5. Cerri, G., 2003. Identification of domestic refrigerator models including cool storage 6. C. Marques, G. Davies, G. Maidment, J. A.Evansand I. Wood, 2010. Application Of Phase Change Materials to Domestic Refrigerators. 7. Chetan Tulapurkar, Pradip Radhakrishnan Subramaniam, G. Thagamani, Ramasamy Thiyagarajan., 2010. Phase Change Materials For Domestic Refrigerators to Improve Food Quality and Prolong Compressor off Time. 8. Sharma, S.D:,Sagara, K. (2005). Latent Heat Storage
Materials and Systems: A Review. International Journal of Green Energy 2:1, 1-56.
9. Wang, F., Maidment, G., Missenden, J.,Tozer, R. (2007). The Novel Use of Phase ChangeMaterials in Refrigeration Plant.
10. Zalba, B., Marin J.M., Cabeza L.F., Mehling H. (2003). Review on Thermal Energy Storagewith Phase Change: Materials, Heat Transfer Analysis and Applications. Applied Thermal Engineering 23, 251–2
11. Laguerre, O., Derens, E., Palagos, B., 2002. Study of domestic refrigerator temperature and analysis of
factors affecting temperature: a French survey. International Journal ofRefrigeration 25, 653–659
12. Mehling, H. and Cabeza, L.F. 2008. Heat and Cold Storage with PCM, Springer Verlag, ISBN-13: 9783540685562, 308 pages.
13. Thermal Energy Storage for More Efficient Domestic Appliances: Halime PAKSOY, Selma YILMAZ, Ozgul GOK, Metin O. YILMAZ, 2Muhsin MAZMA, Hunay EVLIYA
14. Design and Performance of a household Refrigerator using Phase Change Materials – Based on Thermal Energy Storage by Pankaj Mittal ,K.T.Yang , Department of Aerospace and Mechancial Engineering, Indiana published in ASME/JSME Thermal Engineering Conference : Volume 4 in ASME 1995
15. Analysis of Refrigerator / Freezer Appliances having Dual Refrigeration Cycles by Andre Igan ,Sandfor A Klein , Douglas T Reindl for ASHRAE Transactions for 2000 edition Volume 106 , Part 2
16. Jähnig, D.I., Reindl, D.T. and Klein, S.A. (2000). A semi-empirical method for representing domestic refrigerator/freezer compressor calorimeter test data, ASHRAE Transactions, 106
17. Verma, P., Varum and Singal, S.K. (2008). Review of mathematical modeling on latent heat thermal energy storage systems using phase-change material, Renewable and Sustainable Energy Reviews, 12: 999-1031.
18. M. Lacroix, Study of heat transfer behavior of a latent heat thermal energy unit with a finned tube, Int. J. Heat Mass Transfer 36 (1993) 2083–2092.
19. Y.B. Kang, Y. Zhang, General model for analysing the thermal characteristics of a class of latent heat thermal energy storage systems, J. Sol. Energy Eng., Trans. ASME 121 (4) (1999) 185
20. Temperature reduction due to the application of phase change materials, Conrad Voelker, Oliver Kornadt, Milan Ostry
21. S. Hoffmann, O. Kornadt, D. Chow, G. Levermore, An investigation on phase change materials under climate change conditions
22. Development of a novel refrigeration system for refrigerated trucks incorporating phase change material Ming Liu, WasimSaman, Frank Bruno
23. Horuz I. Vapor absorption refrigeration in road transport vehicles. J Energy Eng1999;125:48–58.
24. Mehling F, Cabeza LF. Heat and cold storage with PCM: an up to date introduction into basics and applications. New York: Springer; 2008.
25. Maltini, E., Cortella, G., Stecchini, M., Deltorre, M., Pittia, P., Spaziani, M., Mansutti, G., 2004. Design
IJSER

International Journal of Scientific & Engineering Research, Volume 7, Issue 3, March-2016 68 ISSN 2229-5518
IJSER © 2016 http://www.ijser.org
and Performances of a Constant Temperature Compartment for Domestic Refrigerator.
International Congress on Engineering and Food, Montpellier
IJSER